13
A Statistical Primer on the Susquehanna Region’s Distribution Workforce Submitted to: Susquehanna Workforce Network Submitted by: Sage Policy Group, Inc. May 17 th , 2017

A Statistical Primer on the Susquehanna Region’s Distribution Workforce
Submitted to: Susquehanna Workforce Network
Submitted by: Sage Policy Group, Inc.
May 17th, 2017
Report Title 1
Is the Susquehanna Region Ready for its E-Commerce Boom?
A Statistical Response
This memo supplies data and analysis regarding the Susquehanna Region’s distribution
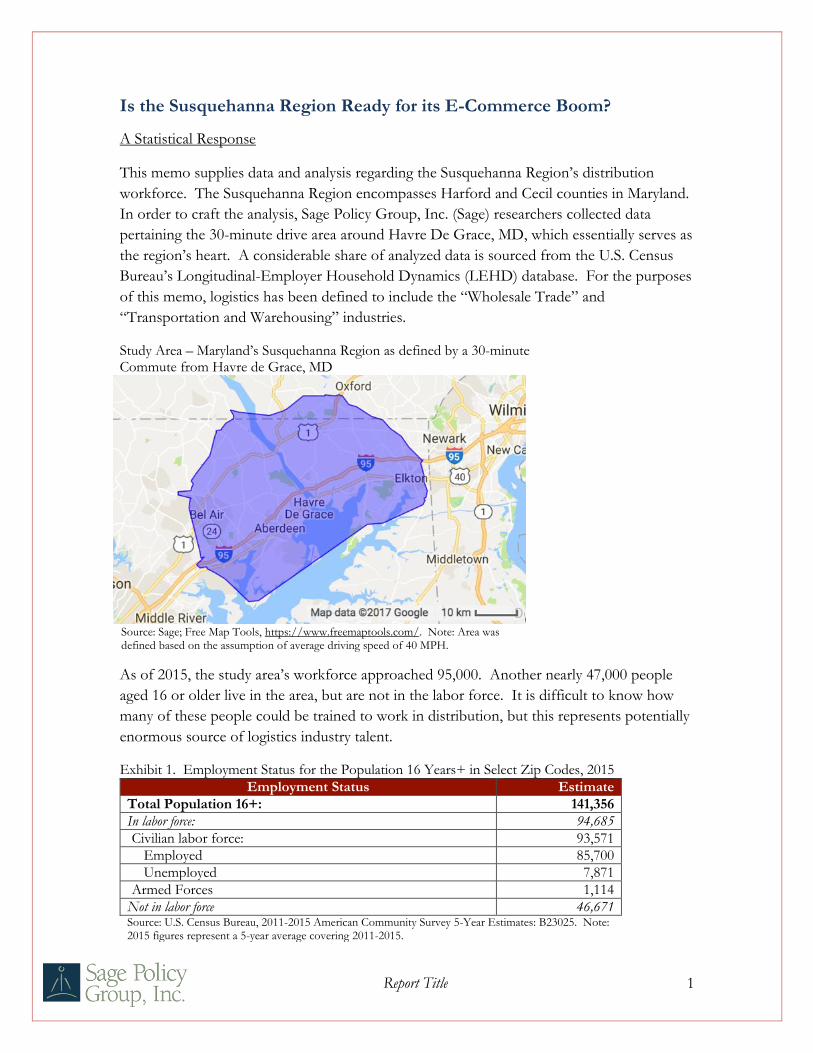
workforce. The Susquehanna Region encompasses Harford and Cecil counties in Maryland.
In order to craft the analysis, Sage Policy Group, Inc. (Sage) researchers collected data
pertaining the 30-minute drive area around Havre De Grace, MD, which essentially serves as
the region’s heart. A considerable share of analyzed data is sourced from the U.S. Census
Bureau’s Longitudinal-Employer Household Dynamics (LEHD) database. For the purposes
of this memo, logistics has been defined to include the “Wholesale Trade” and
“Transportation and Warehousing” industries.
Study Area – Maryland’s Susquehanna Region as defined by a 30-minute Commute from Havre de Grace, MD
Source: Sage; Free Map Tools, https://www.freemaptools.com/. Note: Area was defined based on the assumption of average driving speed of 40 MPH.
As of 2015, the study area’s workforce approached 95,000. Another nearly 47,000 people
aged 16 or older live in the area, but are not in the labor force. It is difficult to know how
many of these people could be trained to work in distribution, but this represents potentially
enormous source of logistics industry talent.
Exhibit 1. Employment Status for the Population 16 Years+ in Select Zip Codes, 2015
Employment Status Estimate
Total Population 16+: 141,356
In labor force: 94,685
Civilian labor force: 93,571
Employed 85,700
Unemployed 7,871
Armed Forces 1,114
Not in labor force 46,671 Source: U.S. Census Bureau, 2011-2015 American Community Survey 5-Year Estimates: B23025. Note: 2015 figures represent a 5-year average covering 2011-2015.

Report Title 2
The notion that there is a large, potential untapped workforce is rendered evident by Exhibit
2. As of 2015, the study area was home to more than 20,500 people who are between the
ages of 25 and 64 who are not in the workforce. More than 8,000 of these people has a
bachelor’s degree, an associate’s degree, or has attended college and may be currently
pursuing a degree. Another 8,000+ have attained the status of high school graduate.
Exhibit 2. Educational Attainment for Population Not in the Labor Force, Aged 25-64 in Select Zip Codes, 2015
Estimate Total Population Aged 25-64 Not in the Labor Force 20,584
Less than high school graduate: 4,188
High school graduate/equivalency: 8,082
Some college or associate’s degree: 5,574
Bachelor’s degree or higher: 2,740 Source: U.S. Census Bureau, 2011-2015 American Community Survey 5-Year Estimates: B23006.
Another group of people is in the labor force, but is presently unemployed. This group
represents another potential source of distribution workers within a 30-minute drive of
Havre de Grace. Available 2015 data indicate that the total unemployed population between
the ages of 25 and 64 exceeds 5,000. Of this group, more than 45 percent have a bachelor’s
degree or have attended college and may have an associate’s degree.
Exhibit 3. Educational Attainment for Unemployed Population Aged 25-64 in Select Zip Codes, 2015
Estimate Total Unemployed Population Aged 25-64 5,120
Less than high school graduate: 832
High school graduate/equivalency: 1,949
Some college or associate’s degree: 1,550
Bachelor’s degree or higher: 789 Source: U.S. Census Bureau, 2011-2015 American Community Survey 5-Year Estimates: B23006.
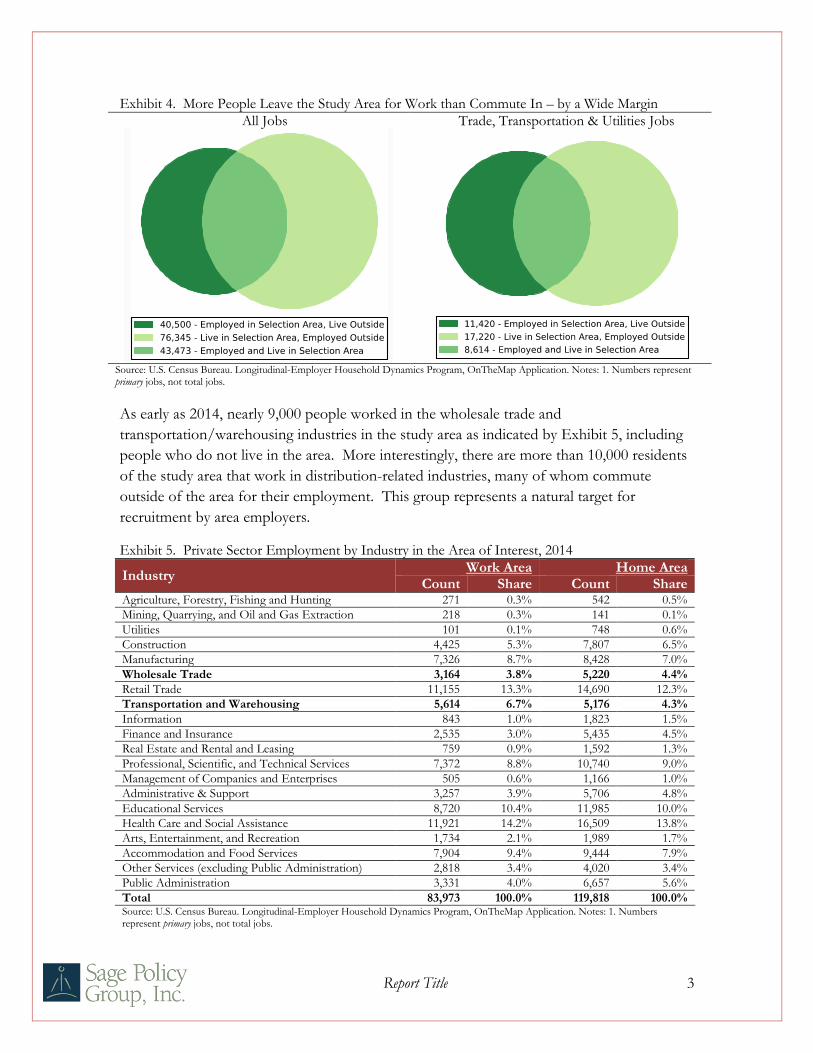
This is hardly where labor force availability ends. As it turns out, the Susquehanna Region is
a massive exporter of talent each day. Exhibit 4 provides evidence of this using Venn
diagrams. The lighter colored and larger green circles represent people who live in the study
area and who have jobs. The darker and smaller green circles represent the number of
people working in the area. The overlap represents people who both live and work in the
area defined by a 30-minute drive from Havre de Grace.
As indicated, there are many more residents in this area with jobs than there are jobs in the
area, implying net out-migration. Remarkably, this is also true in the trade, transportation &
utilities sector, which encompasses a significant share of the logistics industry. The most
recently available data indicate that 17,220 people who live in the study area work outside of
the area in pursuit of employment in the trade, transportation, & utilities category. This
represents another source of workforce for local employers, who among other things would
have an opportunity to offer this group shorter commutes. Moreover, there are another
roughly 59,000 people who live in the study area, but work outside of it in various industries.
Report Title 3
Exhibit 4. More People Leave the Study Area for Work than Commute In – by a Wide Margin
All Jobs Trade, Transportation & Utilities Jobs
Source: U.S. Census Bureau. Longitudinal-Employer Household Dynamics Program, OnTheMap Application. Notes: 1. Numbers represent primary jobs, not total jobs.
As early as 2014, nearly 9,000 people worked in the wholesale trade and
transportation/warehousing industries in the study area as indicated by Exhibit 5, including
people who do not live in the area. More interestingly, there are more than 10,000 residents
of the study area that work in distribution-related industries, many of whom commute
outside of the area for their employment. This group represents a natural target for
recruitment by area employers.
Exhibit 5. Private Sector Employment by Industry in the Area of Interest, 2014
Industry Work Area Home Area
Count Share Count Share Agriculture, Forestry, Fishing and Hunting 271 0.3% 542 0.5%
Mining, Quarrying, and Oil and Gas Extraction 218 0.3% 141 0.1%
Utilities 101 0.1% 748 0.6%
Construction 4,425 5.3% 7,807 6.5%
Manufacturing 7,326 8.7% 8,428 7.0%
Wholesale Trade 3,164 3.8% 5,220 4.4%
Retail Trade 11,155 13.3% 14,690 12.3%
Transportation and Warehousing 5,614 6.7% 5,176 4.3%
Information 843 1.0% 1,823 1.5%
Finance and Insurance 2,535 3.0% 5,435 4.5%
Real Estate and Rental and Leasing 759 0.9% 1,592 1.3%
Professional, Scientific, and Technical Services 7,372 8.8% 10,740 9.0%
Management of Companies and Enterprises 505 0.6% 1,166 1.0%
Administrative & Support 3,257 3.9% 5,706 4.8%
Educational Services 8,720 10.4% 11,985 10.0%
Health Care and Social Assistance 11,921 14.2% 16,509 13.8%
Arts, Entertainment, and Recreation 1,734 2.1% 1,989 1.7%
Accommodation and Food Services 7,904 9.4% 9,444 7.9%
Other Services (excluding Public Administration) 2,818 3.4% 4,020 3.4%
Public Administration 3,331 4.0% 6,657 5.6%
Total 83,973 100.0% 119,818 100.0% Source: U.S. Census Bureau. Longitudinal-Employer Household Dynamics Program, OnTheMap Application. Notes: 1. Numbers represent primary jobs, not total jobs.
4/19/2017 OnTheMap
https://onthemap.ces.census.gov/ 1/1
LEHD Home Help and Documentat ion Reload Text ‑ OnlyOnTheMap
4/19/2017 OnTheMap
https://onthemap.ces.census.gov/ 1/1
LEHD Home Help and Documentat ion Reload Text ‑ OnlyOnTheMap

Report Title 4
Since the turn of the 21st century, Cecil and Harford counties have experienced remarkable
expansion of their respective distribution and logistics sectors. This is enabled by the
presence of I-95, the backbone of the Northeastern megalopolis stretching from Richmond,
Virginia to Boston, Massachusetts. The Susquehanna Region is hardly unique in its
connections to that interstate highway. But unlike many other communities, including its
immediate neighbors to the north and south, the region has substantial quantities of raw land
that is primed for development, a skilled workforce, and a relatively modest cost of living.1
Access to I-95 means access to the Northeast and other interstate highways connecting the
region to a substantial share of U.S. population. For example, a 200-mile radius from the
region encompasses virtually the entire New York metro area, extends almost as far west as
Pittsburgh, and reaches as far south as Norfolk, VA.2 More than 49 million people live
within this radius.3
Given these resources, it is hardly surprising that employment in the sector has grown
substantially. Importantly, the local workforce has supported that growth to date. Focusing
on Cecil County data is instructive in demonstrating this growth. According to the U.S.
Census Bureau’s County Business Patterns Program, between 2005 and 2015, the number of
employees in Cecil County’s transportation and warehousing sectors increased from around
1,000 to more than 1,700. Exhibit 6 also includes these data for all sectors in Cecil County.
As shown, total employment for the county grew relatively modestly, increasing by just over
900 workers during the period. In 2005, transportation and warehouse workers earned
$35,979 per employee, slightly less than the average county worker. By 2015, however,
transportation and warehousing workers earned more than $53,000, well above the $45,321
average earnings of all county workers. This has occurred for a number of reasons,
including the growing use of technology.
Exhibit 6. Cecil County Trends: Transportation & Warehousing Versus All Sectors
Year
Transportation & Warehousing All Sectors
Employees Annual payroll
($ millions) Payroll per employee
Employees Annual payroll
($ millions) Payroll per employee
2005 967 $35 $35,979 23,192 $835 $35,994
2006 1,162 $45 $38,308 23,471 $865 $36,837
2007 1,234 $50 $40,428 24,234 $921 $38,014
2008 1,354 $54 $40,145 24,972 $949 $37,984
2009 1,251 $51 $40,473 24,235 $928 $38,303
2010 1,208 $54 $44,624 23,573 $926 $39,284
2011 1,314 $57 $43,238 24,366 $986 $40,451
2012 1,875 $74 $39,570 25,572 $1,094 $42,765
2013 1,793 $76 $42,540 25,767 $1,136 $44,077
2014 1,671 $83 $49,916 24,487 $1,080 $44,109
2015 1,747 $93 $53,328 24,117 $1,093 $45,321 Source: U.S. Census Bureau, County Business Patterns.
The robust nature of the transportation and warehousing sector in Cecil County, compared
to all sectors in the county, is illustrated by indexing the growth for employees, annual
payrolls, and payroll per employee. Exhibit 7 sets the data shown in Exhibit 6 for the year
Report Title 5
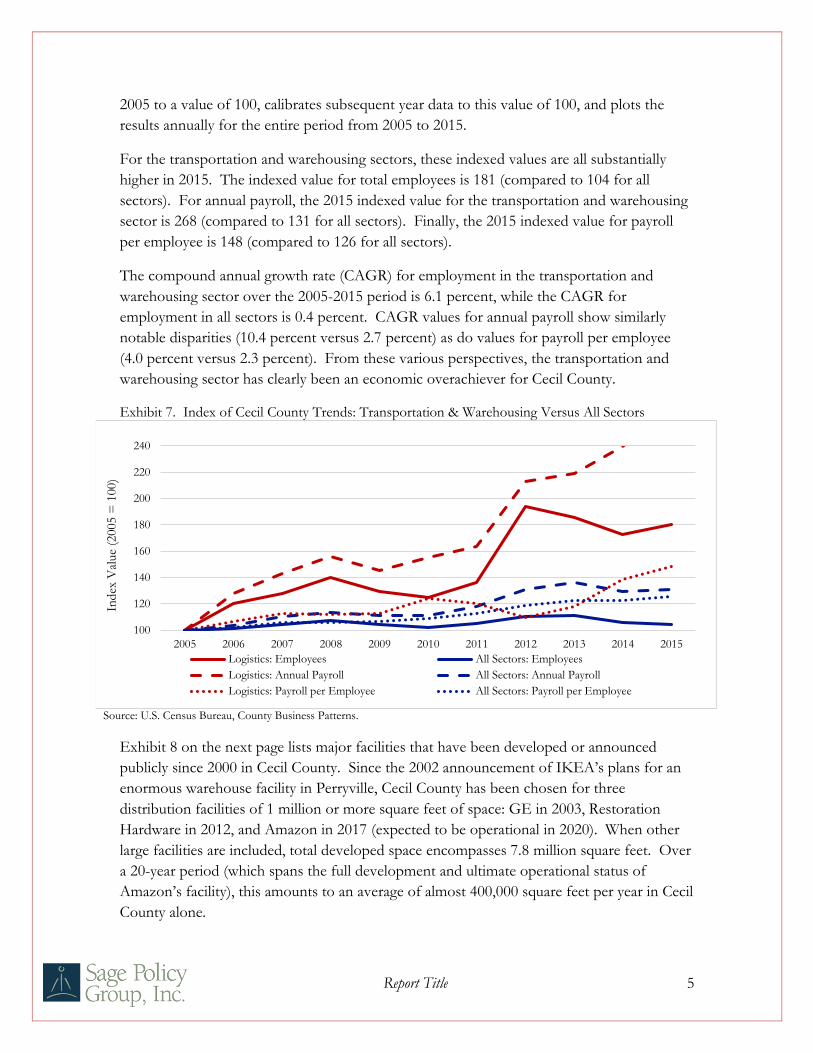
2005 to a value of 100, calibrates subsequent year data to this value of 100, and plots the
results annually for the entire period from 2005 to 2015.
For the transportation and warehousing sectors, these indexed values are all substantially
higher in 2015. The indexed value for total employees is 181 (compared to 104 for all
sectors). For annual payroll, the 2015 indexed value for the transportation and warehousing
sector is 268 (compared to 131 for all sectors). Finally, the 2015 indexed value for payroll
per employee is 148 (compared to 126 for all sectors).
The compound annual growth rate (CAGR) for employment in the transportation and
warehousing sector over the 2005-2015 period is 6.1 percent, while the CAGR for
employment in all sectors is 0.4 percent. CAGR values for annual payroll show similarly
notable disparities (10.4 percent versus 2.7 percent) as do values for payroll per employee
(4.0 percent versus 2.3 percent). From these various perspectives, the transportation and
warehousing sector has clearly been an economic overachiever for Cecil County.
Exhibit 7. Index of Cecil County Trends: Transportation & Warehousing Versus All Sectors
Source: U.S. Census Bureau, County Business Patterns.
Exhibit 8 on the next page lists major facilities that have been developed or announced
publicly since 2000 in Cecil County. Since the 2002 announcement of IKEA’s plans for an
enormous warehouse facility in Perryville, Cecil County has been chosen for three
distribution facilities of 1 million or more square feet of space: GE in 2003, Restoration
Hardware in 2012, and Amazon in 2017 (expected to be operational in 2020). When other
large facilities are included, total developed space encompasses 7.8 million square feet. Over
a 20-year period (which spans the full development and ultimate operational status of
Amazon’s facility), this amounts to an average of almost 400,000 square feet per year in Cecil
County alone.
100
120
140
160
180
200
220
240
2005 2006 2007 2008 2009 2010 2011 2012 2013 2014 2015
Ind
ex V
alue
(2005 =
100)
Logistics: Employees All Sectors: Employees
Logistics: Annual Payroll All Sectors: Annual Payroll
Logistics: Payroll per Employee All Sectors: Payroll per Employee

Report Title 6
Exhibit 8. Cecil County Transportation and Warehousing Facilities: 2000-2020
Year Tenant Square feet (000) Cumulative SF (000) 2000 Performance Food Group 302 302
2002 IKEA 1,724 2,026
2003 GE Appliance 1,004 3,030
2004 Burris Logistics 757 3,787
2007 Perryville Cold Storage 360 4,147
2009 Herr's 346 4,492
2012 Restoration Hardware 1,200 5,692
2017 Truaire 150 5,842
2018 Lidl 800 6,642
2020 Amazon 1,150 7,792 Sources: 1. Colliers International, “Principio Business Park”. 2. Cohn, Meredith, “IKEA plans huge center in Perryville”. 3. Mordock, Jeff, “German grocery chain plans distribution hub in Cecil County”. 4. Sharrow, Ryan. “Exclusive: Amazon plots huge fulfillment center in Cecil County, 700 new jobs expected”.
The growth in Cecil County distribution center space is plotted in Exhibit 9. While
exhibiting spikes in years when major facilities come online, this growth has also been steady
over the entire period. Based on announced employment expectations for the Lidl and
Amazon facilities (100 and 700 jobs, respectively), employment growth in the sector will
likely accelerate relative to the 2000-2014 period, with an expected CAGR for 2014-2020 of
8.1 percent.4,5
Exhibit 9. Growth in Cecil County Transportation and Warehousing Facilities: 2000-2020
Sources: See Exhibit 8.
It should be noted that Harford County has also experienced a number of distribution
facility developments. In October 2016, XPO Logistics announced that it had signed a lease
for a recently completed 571,000-square-foot building in Perryman. The lease will translate
into hundreds of e-commerce positions in the county. It is estimated that initially XPO will
hire approximately 400 people over three shifts.6,7
Several months later, in February 2017, a groundbreaking ceremony was held for the initial
phase of the Eastgate project, which could ultimately emerge as 2.5 million square feet of
additional warehouse and distribution space in Perryman. MRP Industrial of Baltimore is
0.0
1.0
2.0
3.0
4.0
5.0
6.0
7.0
8.0
2000 2002 2004 2006 2008 2010 2012 2014 2016 2018 2020
Mill
ion
s o
f SF
Report Title 7
developing the site. For now, three buildings will be built on the 243-acre site, which is
between the Amtrak rail line and the Aberdeen Proving Ground security fence.8
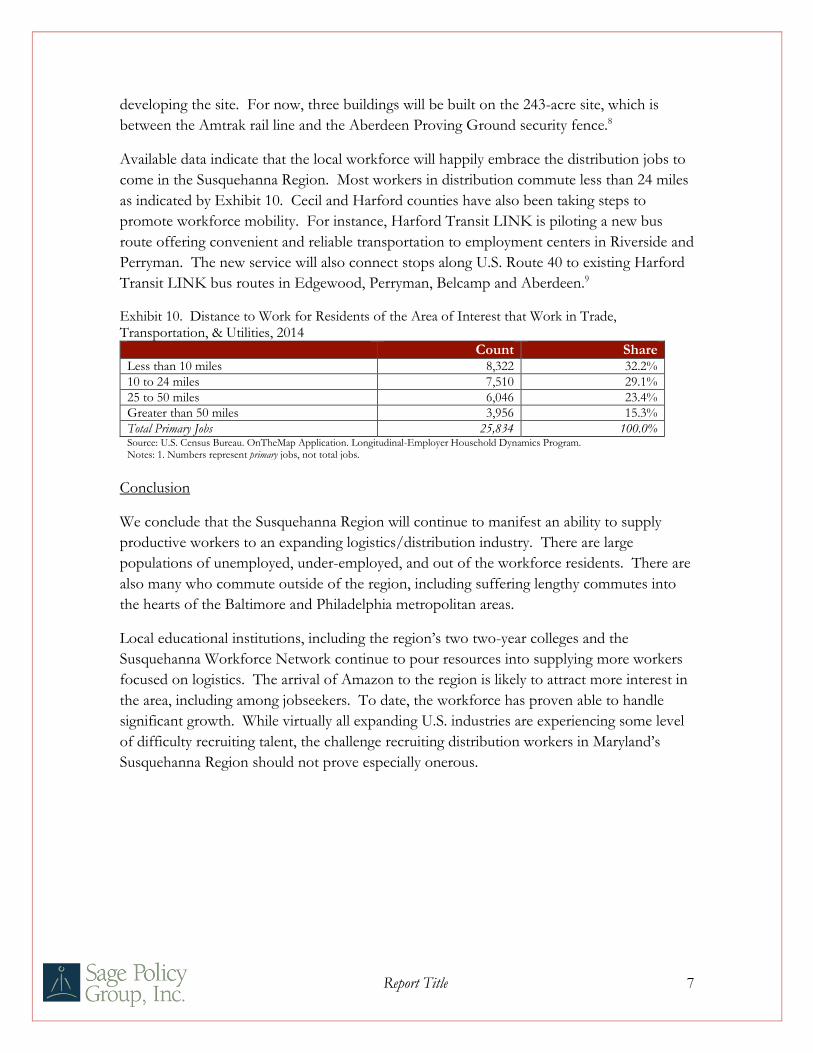
Available data indicate that the local workforce will happily embrace the distribution jobs to
come in the Susquehanna Region. Most workers in distribution commute less than 24 miles
as indicated by Exhibit 10. Cecil and Harford counties have also been taking steps to
promote workforce mobility. For instance, Harford Transit LINK is piloting a new bus
route offering convenient and reliable transportation to employment centers in Riverside and
Perryman. The new service will also connect stops along U.S. Route 40 to existing Harford
Transit LINK bus routes in Edgewood, Perryman, Belcamp and Aberdeen.9
Exhibit 10. Distance to Work for Residents of the Area of Interest that Work in Trade, Transportation, & Utilities, 2014
Count Share Less than 10 miles 8,322 32.2%
10 to 24 miles 7,510 29.1%
25 to 50 miles 6,046 23.4%
Greater than 50 miles 3,956 15.3%
Total Primary Jobs 25,834 100.0% Source: U.S. Census Bureau. OnTheMap Application. Longitudinal-Employer Household Dynamics Program. Notes: 1. Numbers represent primary jobs, not total jobs.
Conclusion
We conclude that the Susquehanna Region will continue to manifest an ability to supply
productive workers to an expanding logistics/distribution industry. There are large
populations of unemployed, under-employed, and out of the workforce residents. There are
also many who commute outside of the region, including suffering lengthy commutes into
the hearts of the Baltimore and Philadelphia metropolitan areas.
Local educational institutions, including the region’s two two-year colleges and the
Susquehanna Workforce Network continue to pour resources into supplying more workers
focused on logistics. The arrival of Amazon to the region is likely to attract more interest in
the area, including among jobseekers. To date, the workforce has proven able to handle
significant growth. While virtually all expanding U.S. industries are experiencing some level
of difficulty recruiting talent, the challenge recruiting distribution workers in Maryland’s
Susquehanna Region should not prove especially onerous.
Report Title 8
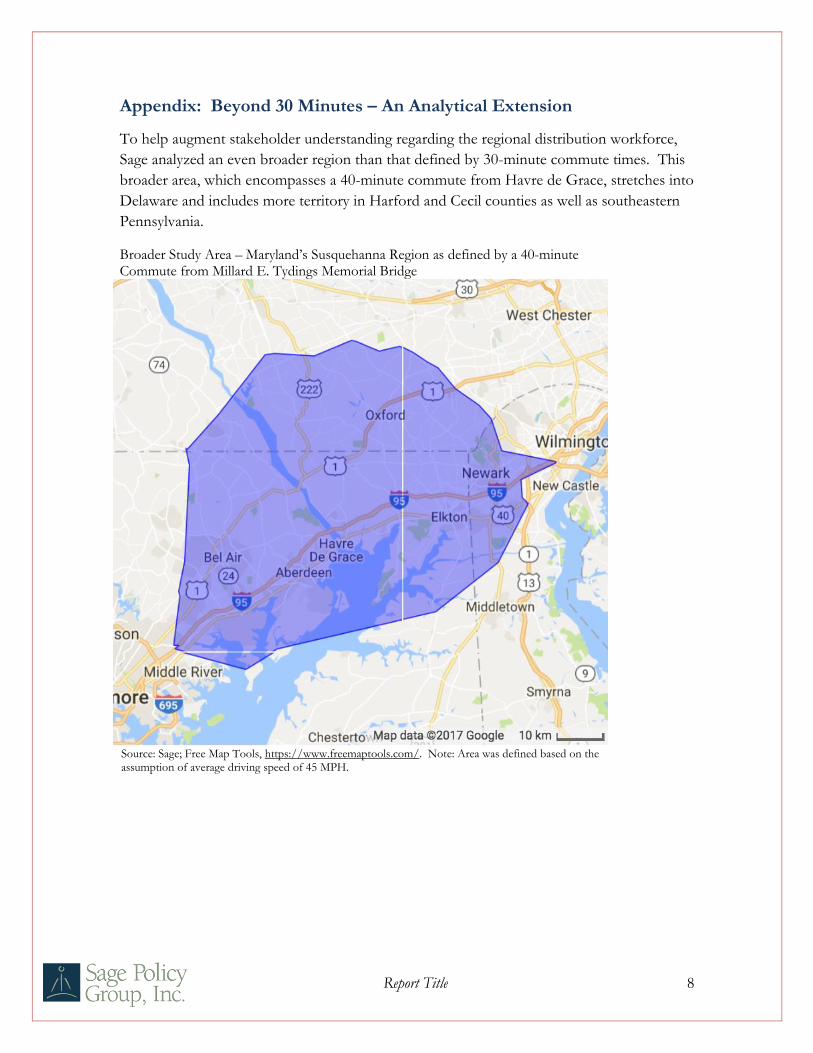
Appendix: Beyond 30 Minutes – An Analytical Extension
To help augment stakeholder understanding regarding the regional distribution workforce,
Sage analyzed an even broader region than that defined by 30-minute commute times. This
broader area, which encompasses a 40-minute commute from Havre de Grace, stretches into
Delaware and includes more territory in Harford and Cecil counties as well as southeastern
Pennsylvania.
Broader Study Area – Maryland’s Susquehanna Region as defined by a 40-minute Commute from Millard E. Tydings Memorial Bridge
Source: Sage; Free Map Tools, https://www.freemaptools.com/. Note: Area was defined based on the assumption of average driving speed of 45 MPH.
Report Title 9
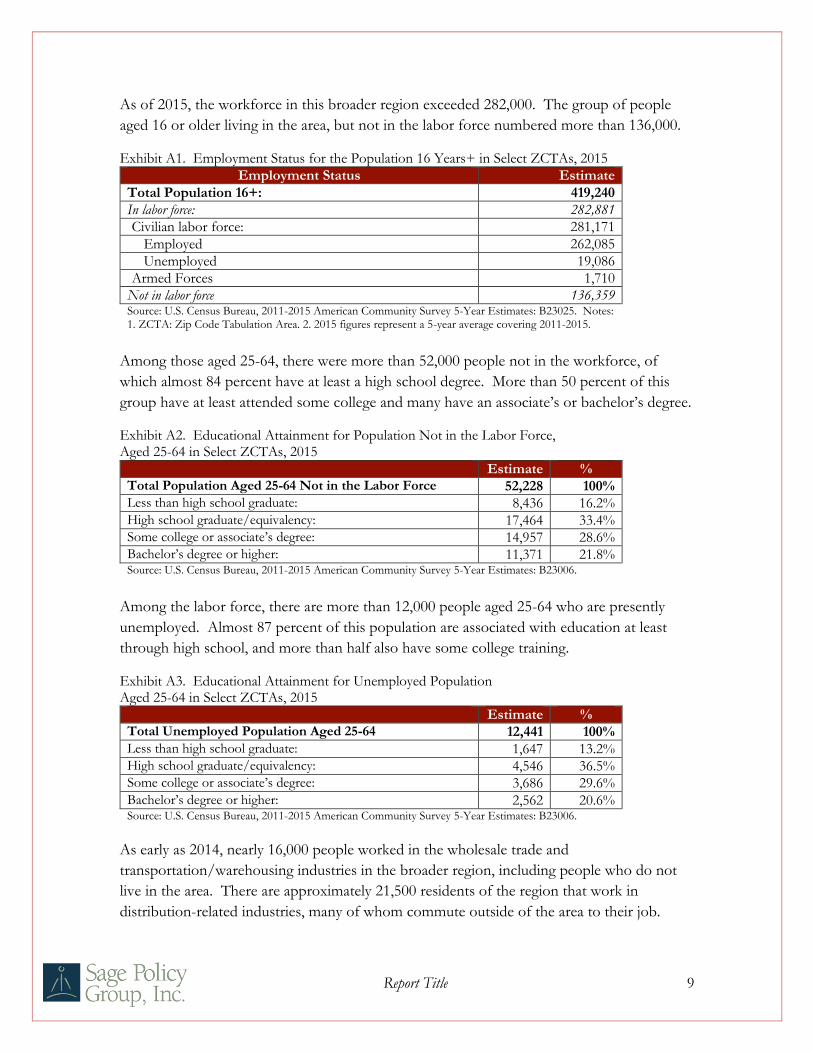
As of 2015, the workforce in this broader region exceeded 282,000. The group of people
aged 16 or older living in the area, but not in the labor force numbered more than 136,000.
Exhibit A1. Employment Status for the Population 16 Years+ in Select ZCTAs, 2015
Employment Status Estimate
Total Population 16+: 419,240
In labor force: 282,881
Civilian labor force: 281,171
Employed 262,085
Unemployed 19,086
Armed Forces 1,710
Not in labor force 136,359 Source: U.S. Census Bureau, 2011-2015 American Community Survey 5-Year Estimates: B23025. Notes: 1. ZCTA: Zip Code Tabulation Area. 2. 2015 figures represent a 5-year average covering 2011-2015.
Among those aged 25-64, there were more than 52,000 people not in the workforce, of
which almost 84 percent have at least a high school degree. More than 50 percent of this
group have at least attended some college and many have an associate’s or bachelor’s degree.
Exhibit A2. Educational Attainment for Population Not in the Labor Force, Aged 25-64 in Select ZCTAs, 2015
Estimate % Total Population Aged 25-64 Not in the Labor Force 52,228 100% Less than high school graduate: 8,436 16.2% High school graduate/equivalency: 17,464 33.4% Some college or associate’s degree: 14,957 28.6% Bachelor’s degree or higher: 11,371 21.8% Source: U.S. Census Bureau, 2011-2015 American Community Survey 5-Year Estimates: B23006.
Among the labor force, there are more than 12,000 people aged 25-64 who are presently
unemployed. Almost 87 percent of this population are associated with education at least
through high school, and more than half also have some college training.
Exhibit A3. Educational Attainment for Unemployed Population Aged 25-64 in Select ZCTAs, 2015
Estimate % Total Unemployed Population Aged 25-64 12,441 100% Less than high school graduate: 1,647 13.2% High school graduate/equivalency: 4,546 36.5% Some college or associate’s degree: 3,686 29.6% Bachelor’s degree or higher: 2,562 20.6% Source: U.S. Census Bureau, 2011-2015 American Community Survey 5-Year Estimates: B23006.
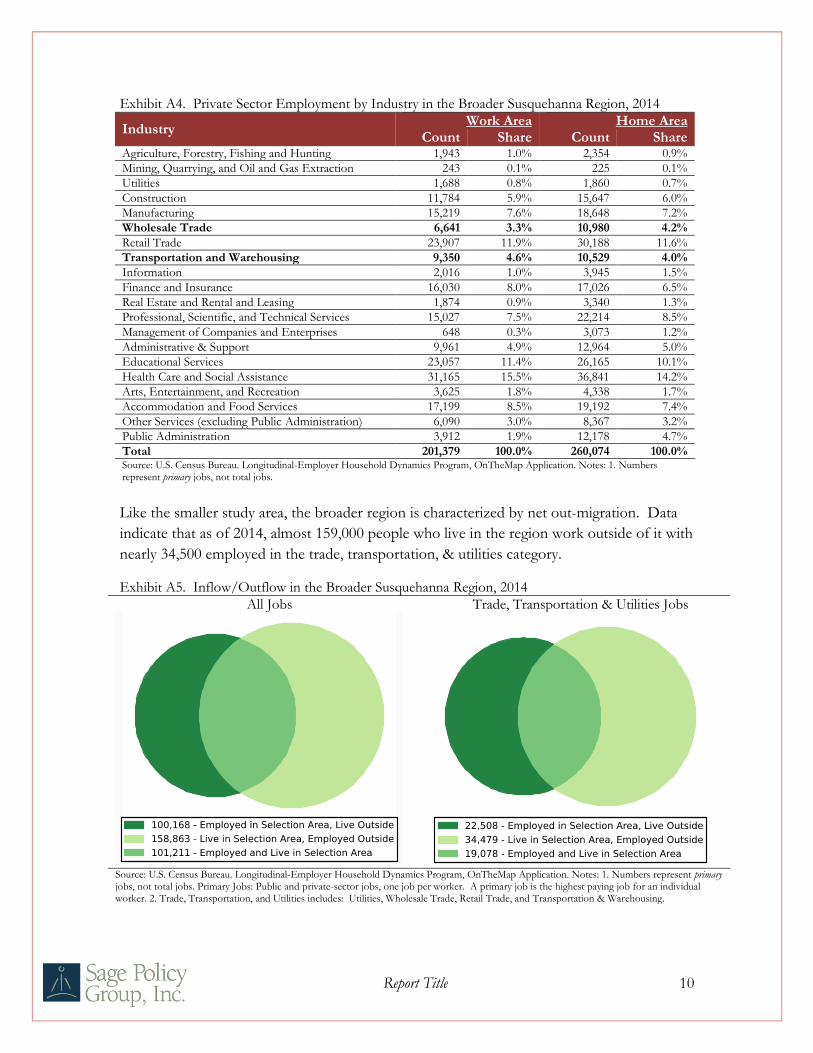
As early as 2014, nearly 16,000 people worked in the wholesale trade and
transportation/warehousing industries in the broader region, including people who do not
live in the area. There are approximately 21,500 residents of the region that work in
distribution-related industries, many of whom commute outside of the area to their job.
Report Title 10
Exhibit A4. Private Sector Employment by Industry in the Broader Susquehanna Region, 2014
Industry Work Area Home Area
Count Share Count Share Agriculture, Forestry, Fishing and Hunting 1,943 1.0% 2,354 0.9%
Mining, Quarrying, and Oil and Gas Extraction 243 0.1% 225 0.1%
Utilities 1,688 0.8% 1,860 0.7%
Construction 11,784 5.9% 15,647 6.0%
Manufacturing 15,219 7.6% 18,648 7.2%
Wholesale Trade 6,641 3.3% 10,980 4.2%
Retail Trade 23,907 11.9% 30,188 11.6%
Transportation and Warehousing 9,350 4.6% 10,529 4.0%
Information 2,016 1.0% 3,945 1.5%
Finance and Insurance 16,030 8.0% 17,026 6.5%
Real Estate and Rental and Leasing 1,874 0.9% 3,340 1.3%
Professional, Scientific, and Technical Services 15,027 7.5% 22,214 8.5%
Management of Companies and Enterprises 648 0.3% 3,073 1.2%
Administrative & Support 9,961 4.9% 12,964 5.0%
Educational Services 23,057 11.4% 26,165 10.1%
Health Care and Social Assistance 31,165 15.5% 36,841 14.2%
Arts, Entertainment, and Recreation 3,625 1.8% 4,338 1.7%
Accommodation and Food Services 17,199 8.5% 19,192 7.4%
Other Services (excluding Public Administration) 6,090 3.0% 8,367 3.2%
Public Administration 3,912 1.9% 12,178 4.7%
Total 201,379 100.0% 260,074 100.0% Source: U.S. Census Bureau. Longitudinal-Employer Household Dynamics Program, OnTheMap Application. Notes: 1. Numbers represent primary jobs, not total jobs.
Like the smaller study area, the broader region is characterized by net out-migration. Data
indicate that as of 2014, almost 159,000 people who live in the region work outside of it with
nearly 34,500 employed in the trade, transportation, & utilities category.
Exhibit A5. Inflow/Outflow in the Broader Susquehanna Region, 2014
All Jobs Trade, Transportation & Utilities Jobs
Source: U.S. Census Bureau. Longitudinal-Employer Household Dynamics Program, OnTheMap Application. Notes: 1. Numbers represent primary jobs, not total jobs. Primary Jobs: Public and private-sector jobs, one job per worker. A primary job is the highest paying job for an individual worker. 2. Trade, Transportation, and Utilities includes: Utilities, Wholesale Trade, Retail Trade, and Transportation & Warehousing.
5/12/2017 OnTheMap
https://onthemap.ces.census.gov/ 1/1
LEHD Home Help and Documentat ion Reload Text ‑ OnlyOnTheMap
5/12/2017 OnTheMap
https://onthemap.ces.census.gov/ 1/1
LEHD Home Help and Documentat ion Reload Text ‑ OnlyOnTheMap

Report Title 11
Exhibit A6. Broader Susquehanna Region: Labor Market Details, 2014
Area Labor Market Size (Primary Jobs) All Workers
Trade, Transp., Utilities Workers
Count Share Count Share
Employed in the area 201,379 100.0% 41,586 100.0% Living in the area 260,074 129.1% 53,557 128.8% Net job inflow -58,695 - -11,971 -
In-Area Labor Force Efficiency Living in the area 260,074 100.0% 53,557 100.0% Living and employed in the area 101,211 38.9% 19,078 35.6% Living in the area but employed outside the area 158,863 61.1% 34,479 64.4%
In-Area Employment Efficiency Employed in the area 201,379 100.0% 41,586 100.0% Employed and living in the area 101,211 50.3% 19,078 45.9% Employed in the area but living outside the area 100,168 49.7% 22,508 54.1% Source: U.S. Census Bureau. OnTheMap Application. Longitudinal-Employer Household Dynamics Program. Notes: 1. Numbers represent primary jobs, not total jobs.
Available data indicate that the majority of regional residents who work in distribution
commute less than 25 miles (67.1%). However there remains a significant number of
residents who commute more than 25 miles who would presumably be open to pursuing
employment closer to home.
Exhibit A7. Distance to Work for Residents of the Broader Susquehanna Region that Work in Trade, Transportation, & Utilities, 2014
Count Share
Less than 10 miles 20,552 38.4%
10 to 24 miles 15,403 28.8%
25 to 50 miles 10,372 19.4%
Greater than 50 miles 7,230 13.5%
Total Primary Jobs 53,557 100.0% Source: U.S. Census Bureau. OnTheMap Application. Longitudinal-Employer Household Dynamics Program. Notes: 1. Numbers represent primary jobs, not total jobs.
Report Title 12
1 Goss, Scott. “Cecil County on verge of a job boom”. The News Journal, February 10, 2017. http://www.delawareonline.com/story/money/business/2017/02/10/cecil-county-verge-job-boom/97331692/. 2 Colliers International. “Principio Business Park”. http://www.ccgov.org/home/showdocument?id=1606. 3 Hoosiers by the Numbers. “Large Area Radius Tool”. http://www.hoosierdata.in.gov/big_radius/radius.asp. 4 Sharrow, Ryan. “Exclusive: Amazon plots huge fulfillment center in Cecil County, 700 new jobs expected”. Baltimore Business Journal, January 13, 2017. http://www.bizjournals.com/baltimore/news/2017/01/13/amazon-fulfillment-center-cecil-county-north-east.html. 5 Mordock, Jeff. “German grocery chain plans distribution hub in Cecil County”. The News Journal, August 10, 2016. http://www.delawareonline.com/story/money/2016/08/10/lidl-create-100-jobs-cecil-county/88513830/. 6 Sherman, Natalie. “Harford County lands major logistics company”. The Baltimore Sun, October 6, 2016. http://www.baltimoresun.com/business/bs-bz-xpo-logistics-harford-county-20161006-story.html. 7 Vought, Allan. “Harford lands big e-commerce logistics firm; more than 400 jobs expected in Perryman”. The Baltimore Sun, October 6, 2016. http://www.baltimoresun.com/news/maryland/harford/aegis/ph-ag-xpo-logistics-1005-20161006-story.html. 8 Vought, Allan. “Construction to begin in Perryman on 2.5 million square feet of warehouse space”. The Baltimore Sun, February 1, 2017. http://www.baltimoresun.com/news/maryland/harford/aegis/ph-ag-eastgate-groundbreaking-0203-20170201-story.html. 9 “Harford Transit LINK sets new route in Perryman and Riverside employment centers”. The Baltimore Sun, April 5, 2017. http://www.baltimoresun.com/news/maryland/harford/aegis/entertainment/ph-ag-link-routes-0407-20170405-story.html.


