Aveda’s Product Distribution System: A Strategic Assessment of Greenhouse Gas Emissions and Energy Consumption Nathan Arbitman, Tony Baptista, Edward Ekkers, Jonathon Forrester, and Heather Kirshman Report No. CSS05-10 April 2005
Transcript
Aveda’s Product Distribution System:A Strategic Assessment of Greenhouse Gas Emissions and Energy Consumption
Nathan Arbitman, Tony Baptista, Edward Ekkers, Jonathon Forrester, and Heather Kirshman
Report No. CSS05-10
April 2005
Aveda’s Product Distribution System:
A Strategic Assessment of Greenhouse Gas Emissions
and Energy Consumption
by
Nathan Arbitman
Tony Baptista
Edward Ekkers
Jonathon Forrester
Heather Kirshman
A project submitted in partial fulfillment of the requirements for the degree of Master of
Science (Natural Resources and Environment) at the University of Michigan
Aveda is truly a leader in corporate sustainability and the authors would like to thank the
company for its support of this project. For the past twelve months, Aveda’s employees have
been generous with their time and have provided the team with critical data, insight, and ideas.
Specifically, Mary T’Kach and the Environmental Sustainability department provided the guidance
and support for the project while ensuring meetings with the various stakeholders. The
Transportation department, in particular David Nordine, provided the critical data for our analysis
and showed patience through repeated discussions and meetings. The Marketing and Sales
departments provided crucial insight into the customer experience as well as data for our analysis
and recommendations. The Operations department, namely Tom Wellen, Mike Kennedy, and
Steve Rader, facilitated our understanding of the business and the implications of our
recommendations.
We would also like to thank our advisors, Associate Professor Gregory Keoleian and Professor
Brian Talbot, for their support throughout this project. They have been champions of the project
and its team members and have provided invaluable advice on analysis, recommendations, client
interaction, and school policy. Additionally, we would like to thank David Spitzley in the Center
for Sustainable Systems at the University of Michigan for his support in data modeling and the
countless iterations of refinement and analysis. Without David’s assistance this report would not
have been possible.
In the spirit of Aveda’s environmental sustainability-driven mission, the teachings at the School of
Natural Resources & Environment, and the personal values of the authors, the carbon emissions
associated with the completion of this project (due to travel) have been offset using carbon
credits. A total of 5 short tons (4.5 metric tons) were purchased from Native Energy for a total
cost of $60.
iii
TABLE OF CONTENTS Section 1 – Abstract........................................................................... 1
Section 2 – Executive Summary ...................................................... 2 Product Delivery System Model and Modeling Results................................................ 2
3.1.1 Efforts to Reduce Packaging......................................................................... 14 3.1.2 Efforts to Increase Recycled Content........................................................... 14
3.2 Background on Energy and GHGs ...................................................................... 15 3.2.1 U.S. Contribution to Global GHG Emissions ................................................ 16 3.2.2 Contribution of Transport of Goods to Energy and GHG Emissions ........... 16
3.2.3 GHG and Energy Accounting Systems ......................................................... 17 3.3 Aveda Background and Business Profile ............................................................ 18 3.4 Aveda Environmental and Social Responsibility ................................................ 18
Section 4 – Product Delivery System ............................................ 22 4.1 Introduction to Aveda’s Supply Chain ................................................................ 22
4.1.1 Broad Overview............................................................................................. 22 4.1.2 Project Scope: Packaging and Transportation ........................................... 22 4.1.3 Definition of the Product Delivery System................................................... 23
4.1.4 Function and Functional Unit........................................................................ 24 4.1.4.1 Packaging................................................................................................ 24 4.1.4.2 Transportation ........................................................................................ 25
4.2 System Model Overview and Boundaries ........................................................... 25 4.2.1 Formulation and Compounding .................................................................... 27 4.2.2 Primary and Secondary Packaging and Suppliers ....................................... 27 4.2.3 Assembly, Filling and Packing ...................................................................... 27 4.2.4 Tertiary Packaging Suppliers (Blaine).......................................................... 27 4.2.5 Tertiary Packaging Suppliers (Roseville) ..................................................... 27 4.2.6 Tertiary Packaging Suppliers (LADC)........................................................... 27 4.2.7 Tertiary Packaging Suppliers (PADC)........................................................... 27 4.2.8 Roseville Warehouse and Distribution Center, LADC, and PADC ............... 27 4.2.9 Distribution 1 ................................................................................................ 28 4.2.10 Distribution 2 .............................................................................................. 28 4.2.11 Distribution 3 .............................................................................................. 28 4.2.12 Distribution 4, 5 and 6 ............................................................................... 28 4.2.13 Distribution 7, 8 and 9 ............................................................................... 29 4.2.14 Distribution 10, 11 and 12 ......................................................................... 29 4.2.15 Distribution 13, 14 and 15 ......................................................................... 29
iv
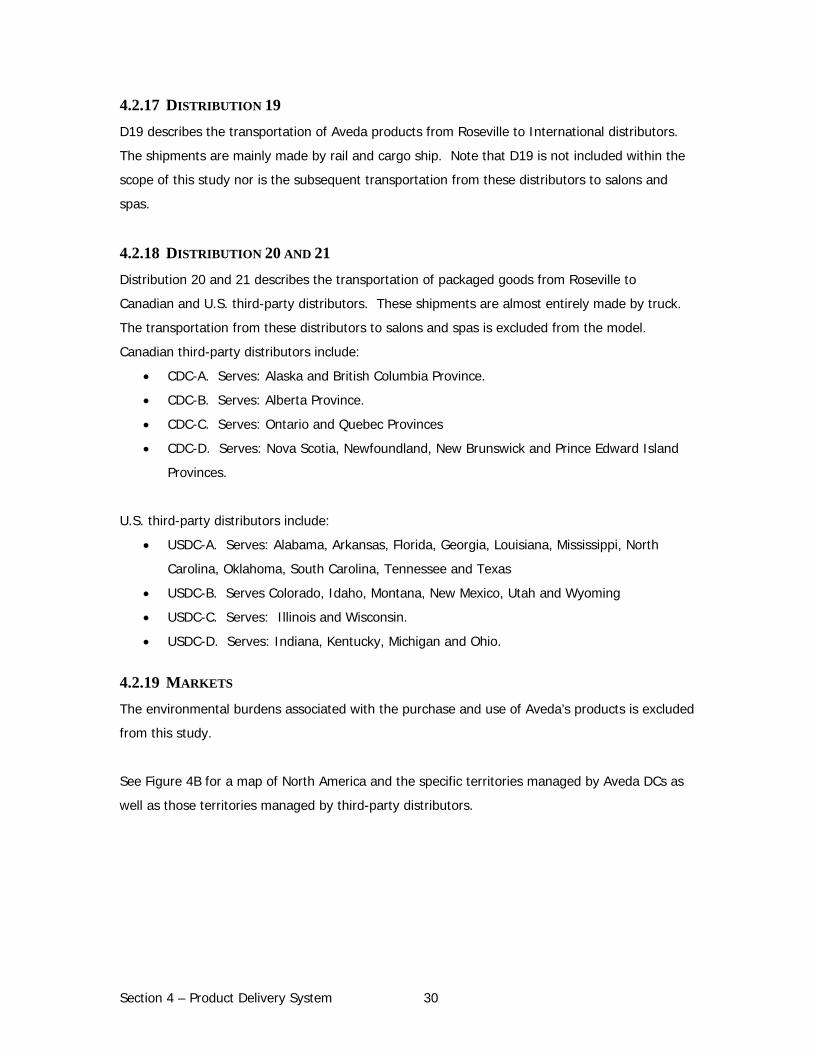
4.2.16 Distribution 16, 17 and 18 ......................................................................... 29 4.2.17 Distribution 19 ............................................................................................ 30 4.2.18 Distribution 20 and 21................................................................................ 30 4.2.19 Markets........................................................................................................ 30
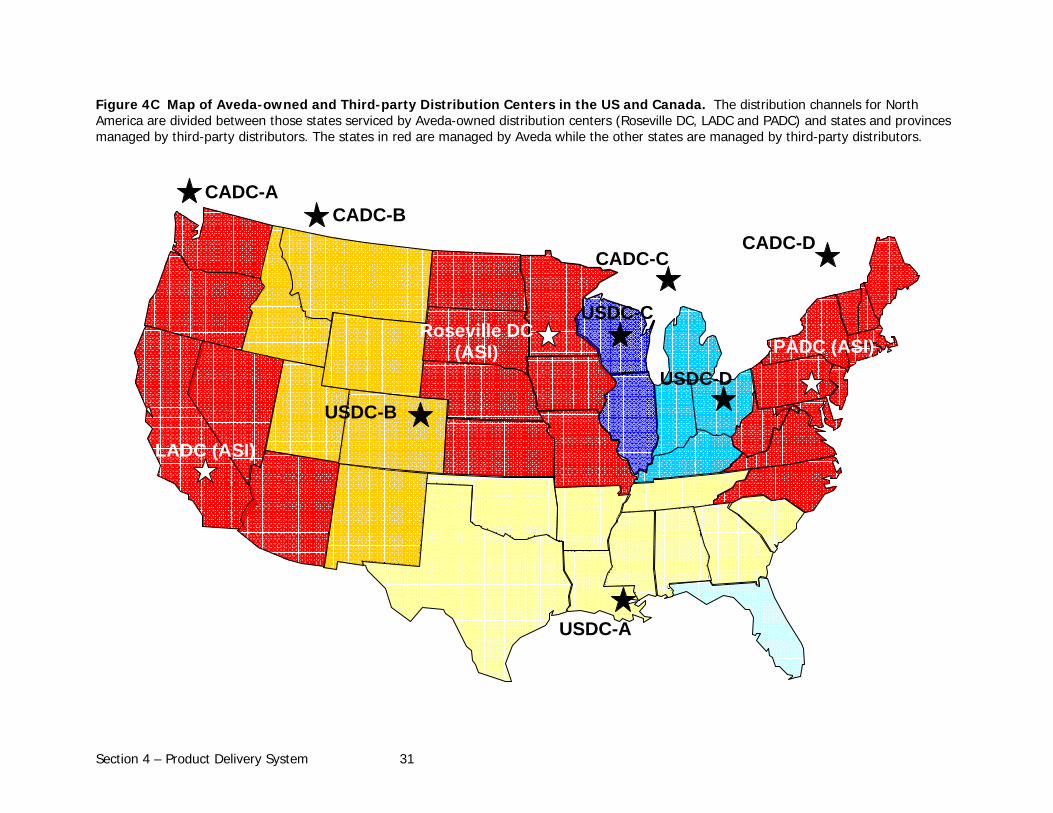
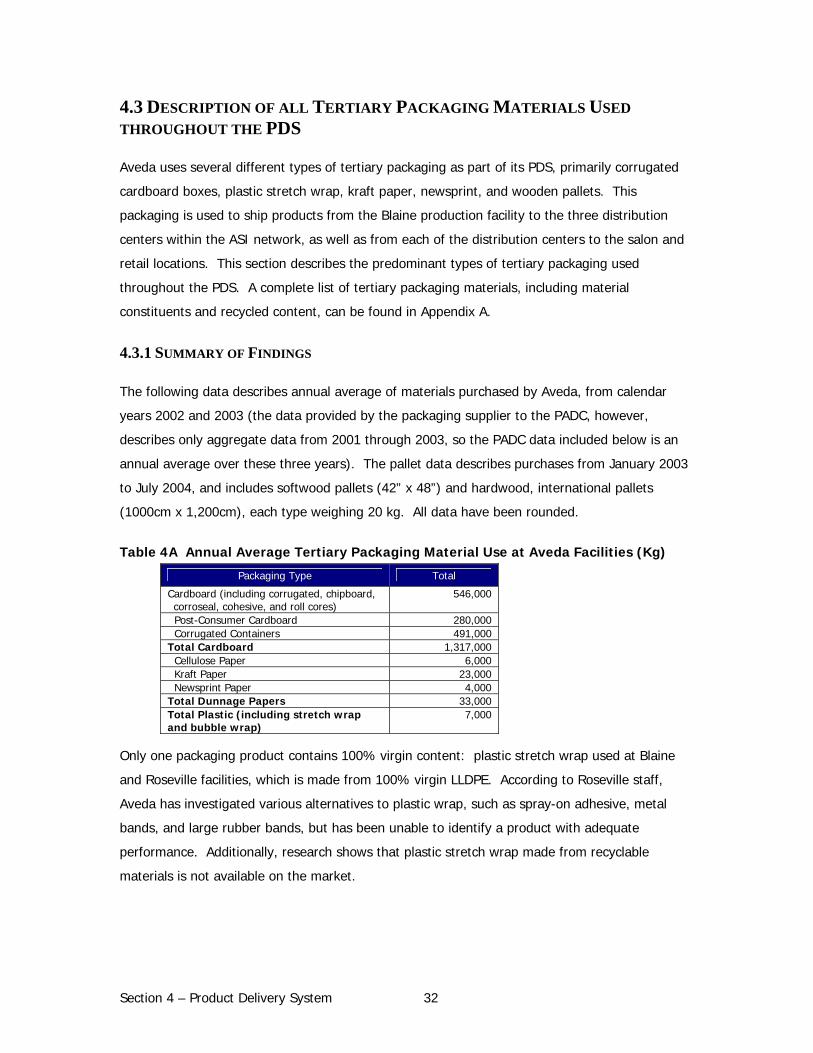
4.3 Description of all Tertiary Packaging Materials Used throughout the PDS ........ 32 4.3.1 Summary of Findings..................................................................................... 32
4.5 Description of Transport Paths ........................................................................... 37 4.5.1 Blaine Facility ................................................................................................ 37 4.5.2 Roseville Facility............................................................................................ 38
4.5.2.1 Distribution Centers ............................................................................... 38 4.5.2.2 Roseville direct to Salons and Retail ..................................................... 39 4.5.2.3 Roseville to Third-party Distribution ..................................................... 39 4.5.2.4 Roseville to International ....................................................................... 39
4.5.3 DC-to-DC (Inventory Disposition) and Out-of-Region Shipments ............. 39
Section 5 – Modeling and Results.................................................. 41 5.1 Introduction .......................................................................................................... 41 5.2 Packaging Model and Results............................................................................... 41
5.4 Summary of Packaging and Transport Impact .................................................. 55
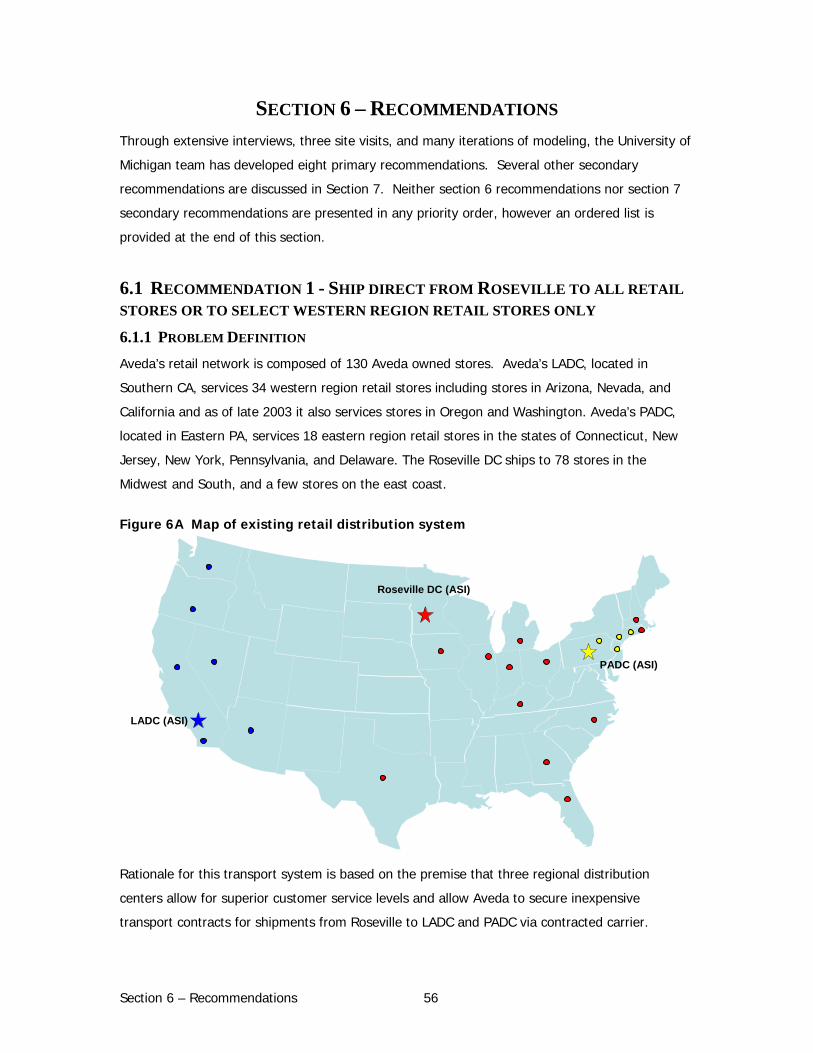
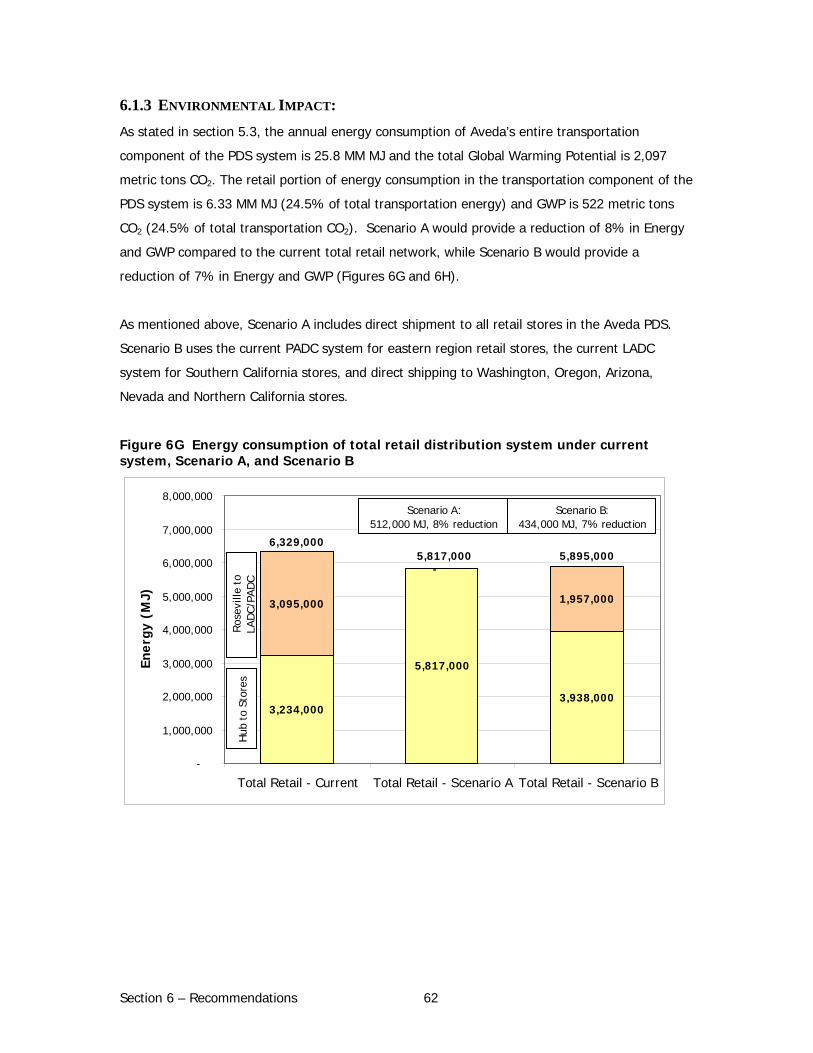
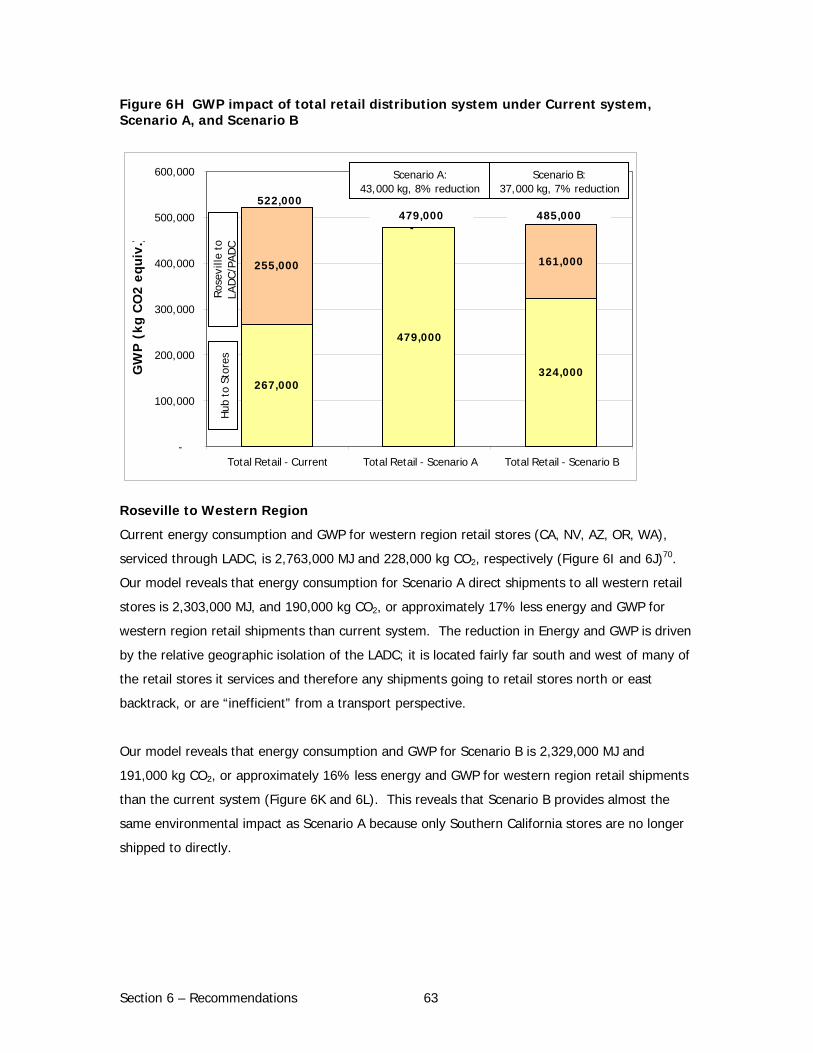
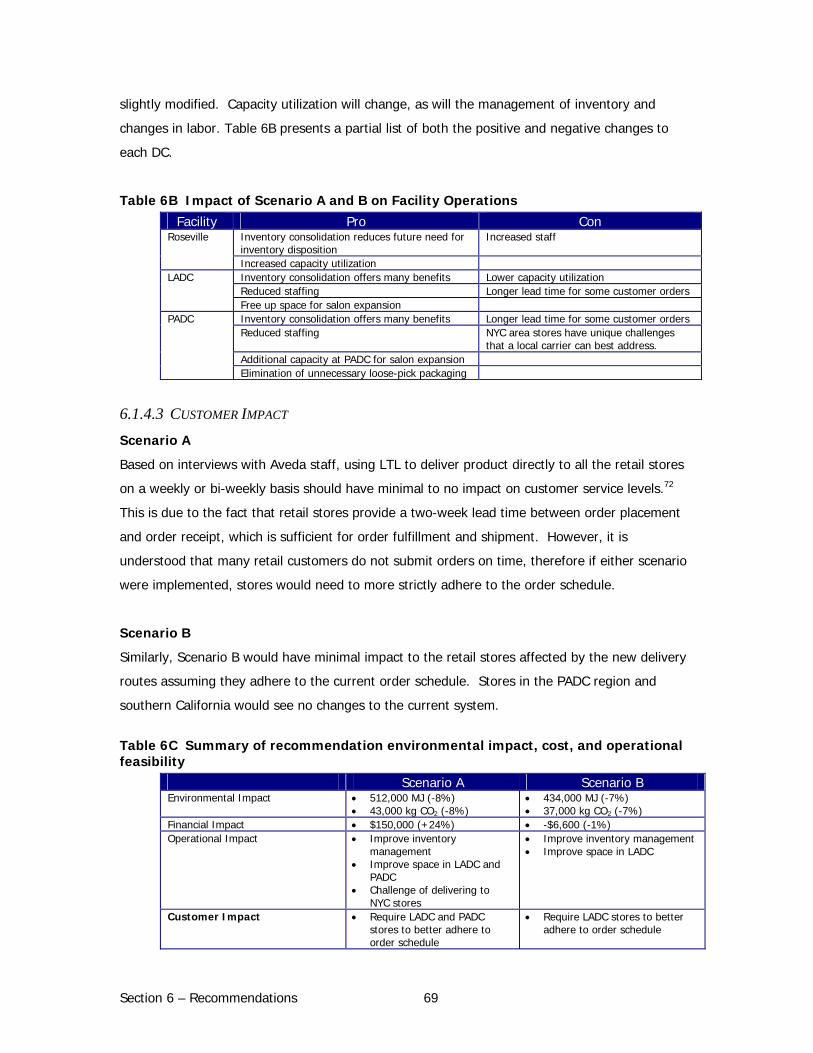
Section 6 – Recommendations ....................................................... 56 6.1 Recommendation 1 - Ship direct from Roseville to all retail stores or to select western region retail stores only................................................................................ 56
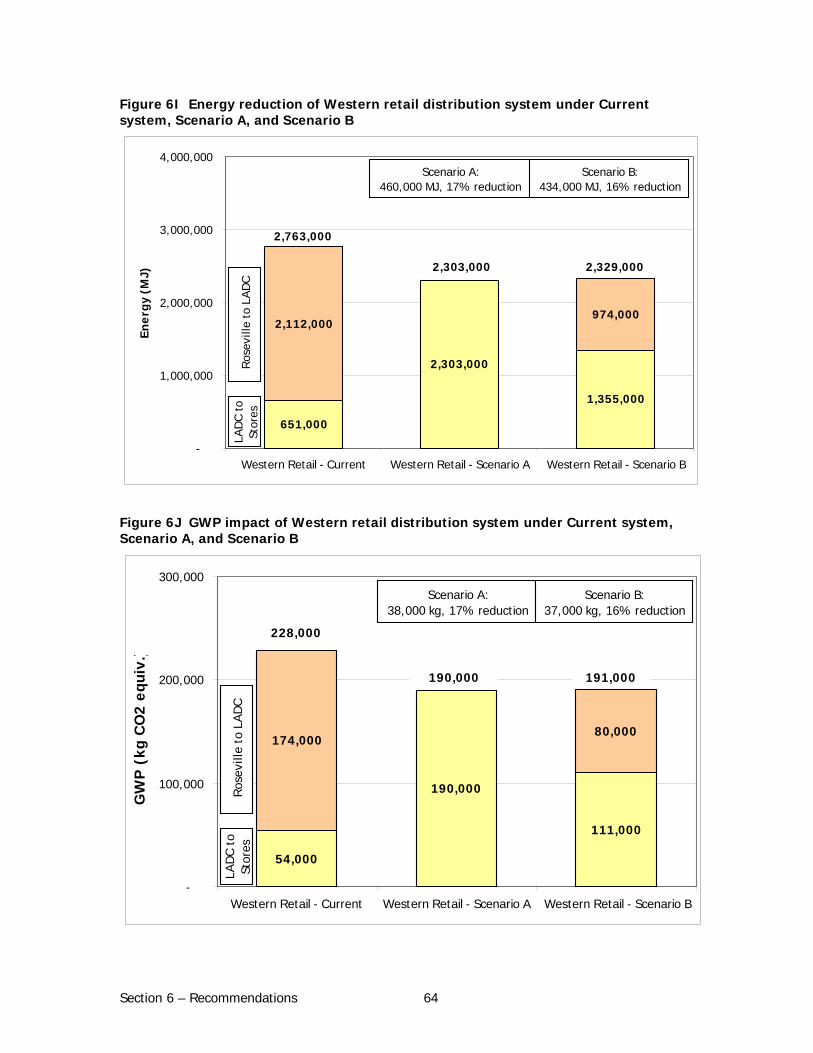
6.1.1 Problem Definition ........................................................................................ 56 6.1.2 Proposed Solution ......................................................................................... 57 6.1.3 Environmental Impact:................................................................................. 62 6.1.4 Business Impact of Solution: ....................................................................... 66
6.8 Recommendation 8 - Alternative Transport Opportunities from Blaine to the New Blaine DC............................................................................................................102
6.8.1 Problem Definition .......................................................................................102 6.8.2 Proposed Solution ........................................................................................102
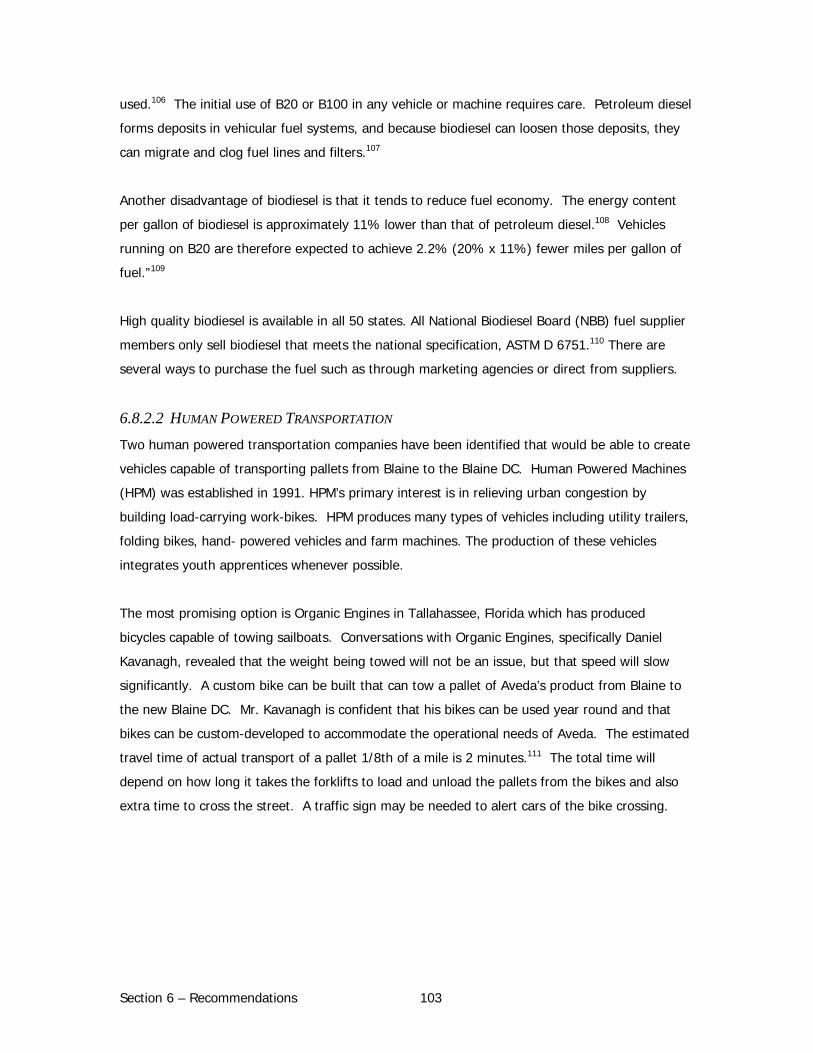
6.8.2.1 Biodiesel.................................................................................................102 6.8.2.2 Human Powered Transportation ...........................................................103
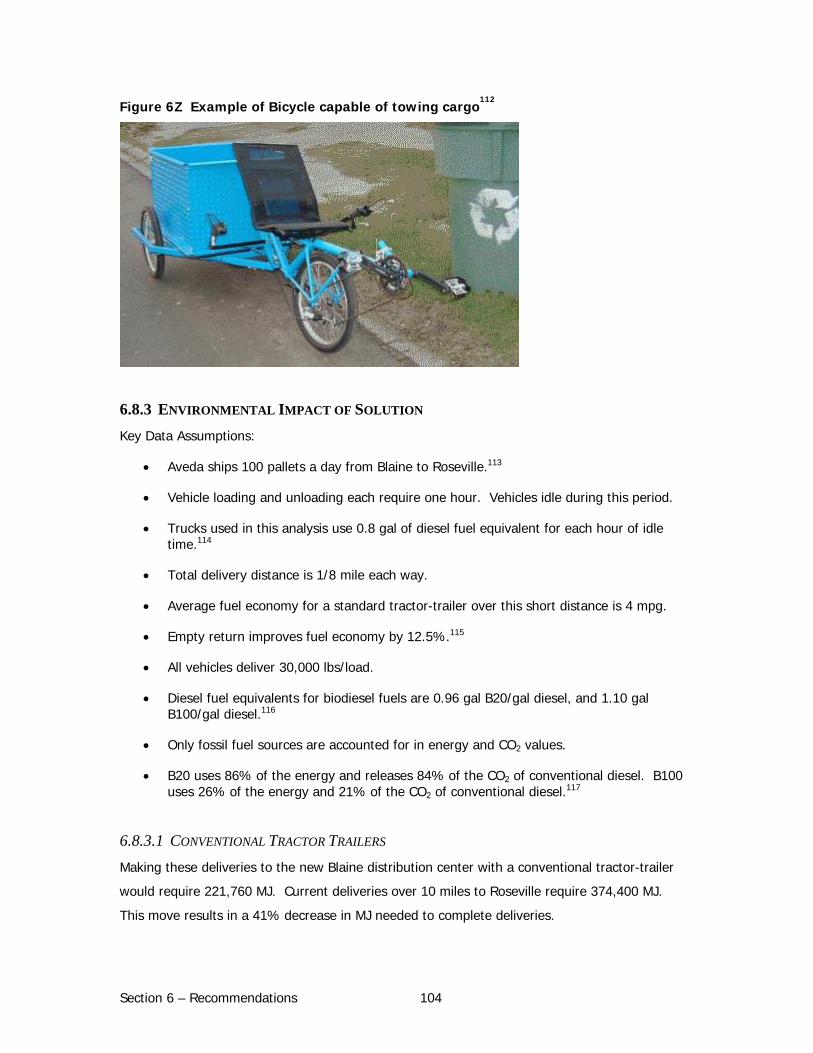
6.8.3 Environmental Impact of Solution ..............................................................104 6.8.3.1 Conventional Tractor Trailers................................................................104 6.8.3.2 Use of Biodiesel for Shipments from Blaine Manufacturing to Blaine Warehouse ...........................................................................................................105 6.8.3.3 Biodiesel, 20% Blend ............................................................................105 6.8.3.4 100% Biodiesel......................................................................................105 6.8.3.5 Use of Bicycle ........................................................................................105 6.8.3.6 Summary of Alternatives ......................................................................105
6.8.4 Business Impact of Solution........................................................................106
Section 7 – Future Investigations ............................................... 108 7.1 Hawaii .................................................................................................................108 7.2 Product Returns..................................................................................................111 7.3 The New LADC ....................................................................................................112 7.4 One SKU per Pallet .............................................................................................112 7.5 The Blaine Mailroom...........................................................................................113 7.6 Moving Product from Manufacturing to the Warehouse ...................................114
Section 9 - Appendices .................................................................. 118 Appendix A - Packaging Modeling Assumptions and Methodology..........................118
A1 Packaging Modeling Assumptions....................................................................118 A2 Impact Assessment Factors.............................................................................120 A3 Model Implementation .....................................................................................121 A4 Results ..............................................................................................................121 A5 Energy Use and Paper Recycling .....................................................................121 A6 Annotated References......................................................................................124
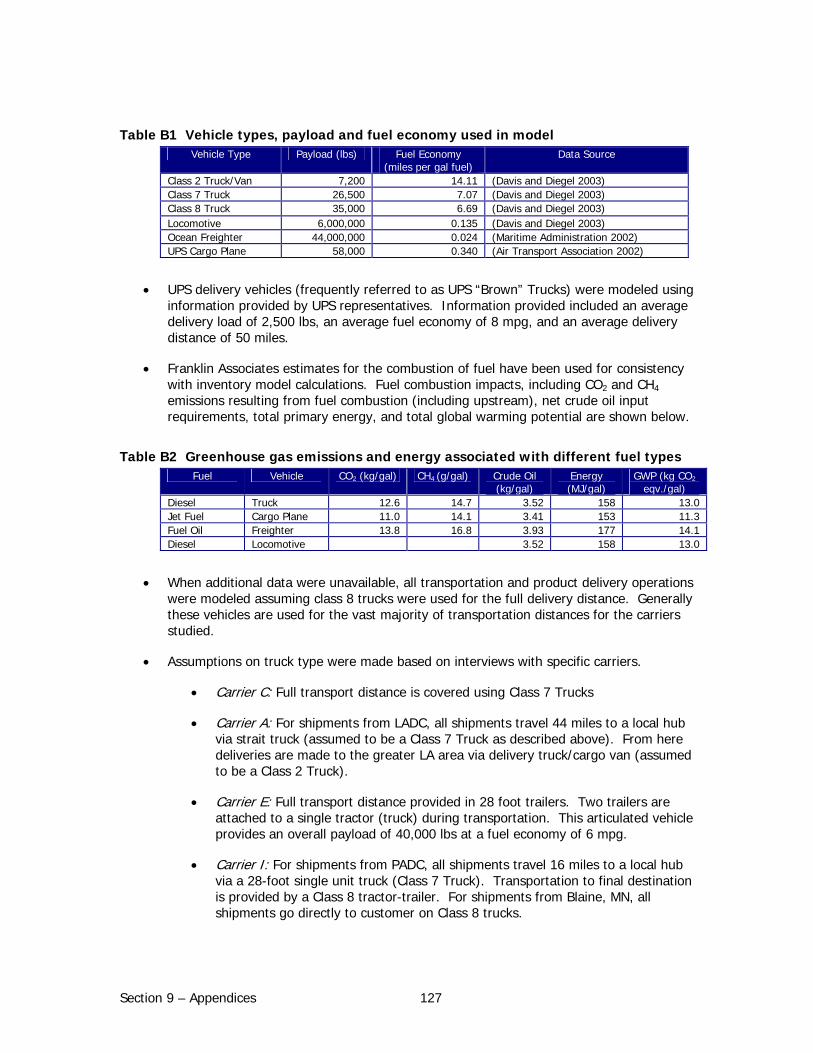
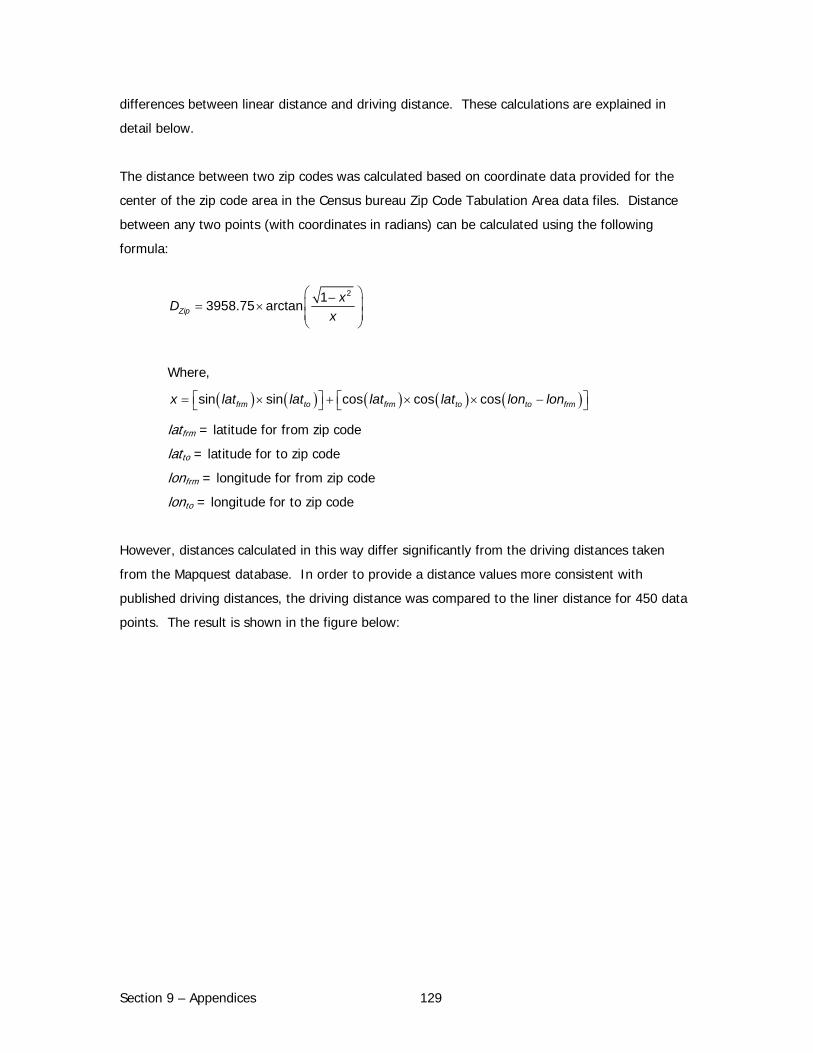
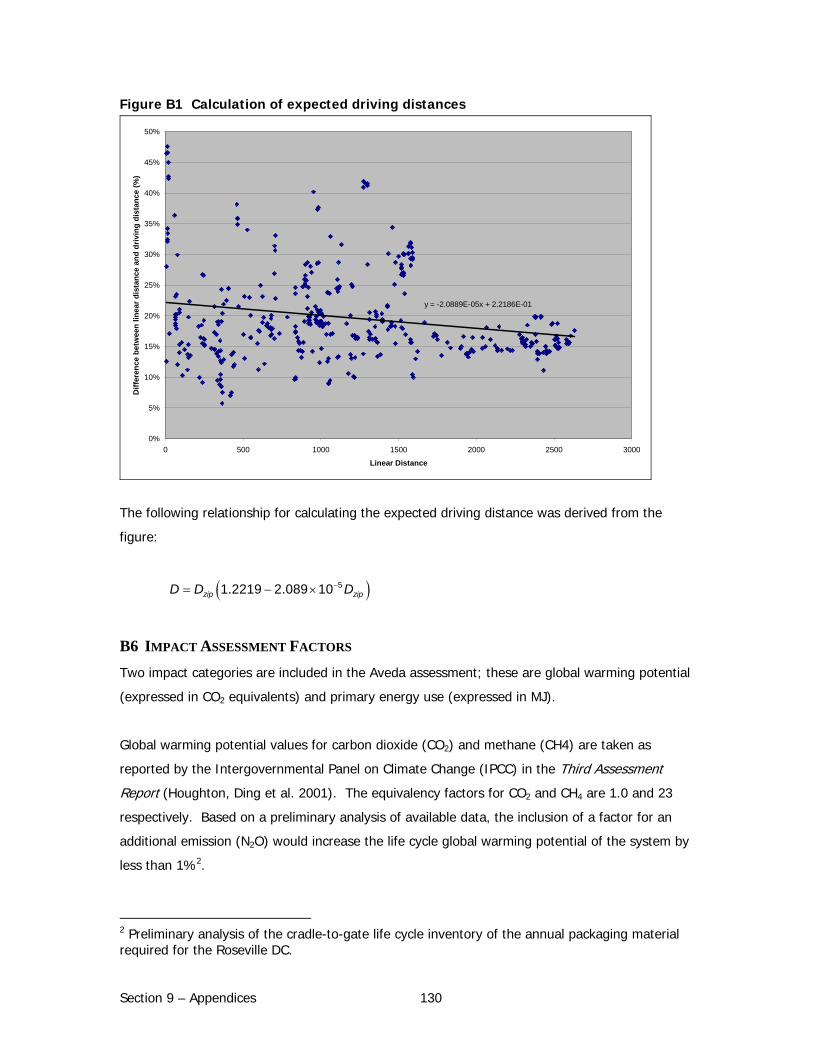
Appendix B - Transportation Modeling Assumptions and Methodology ..................125 B1 Initial Data........................................................................................................125 B2 Other Carriers...................................................................................................126 B3 Modeling Assumptions .....................................................................................126 B4 Shipments from Blaine to Roseville ................................................................128 B5 Calculating Expected Driving Distance............................................................128 B6 Impact Assessment Factors.............................................................................130 B7 Model Implementation .....................................................................................131 B8 UPS “Brown” Truck Data Variance ..................................................................132 B9 UPS Methodology .............................................................................................133
B9.1 Data Compilation .......................................................................................133 B9.2 Data Modeling Assumptions - Type of Shipping ......................................133 B9.3 Data Modeling Assumptions - Truck Capacity..........................................133
B10 FedEx Methodology ........................................................................................133 B10.1 Data Compilation .....................................................................................133 B10.2 Data Modeling Assumptions - Type of Shipping ....................................133 B10. 3 Data Modeling Assumptions - Truck Capacity.......................................134
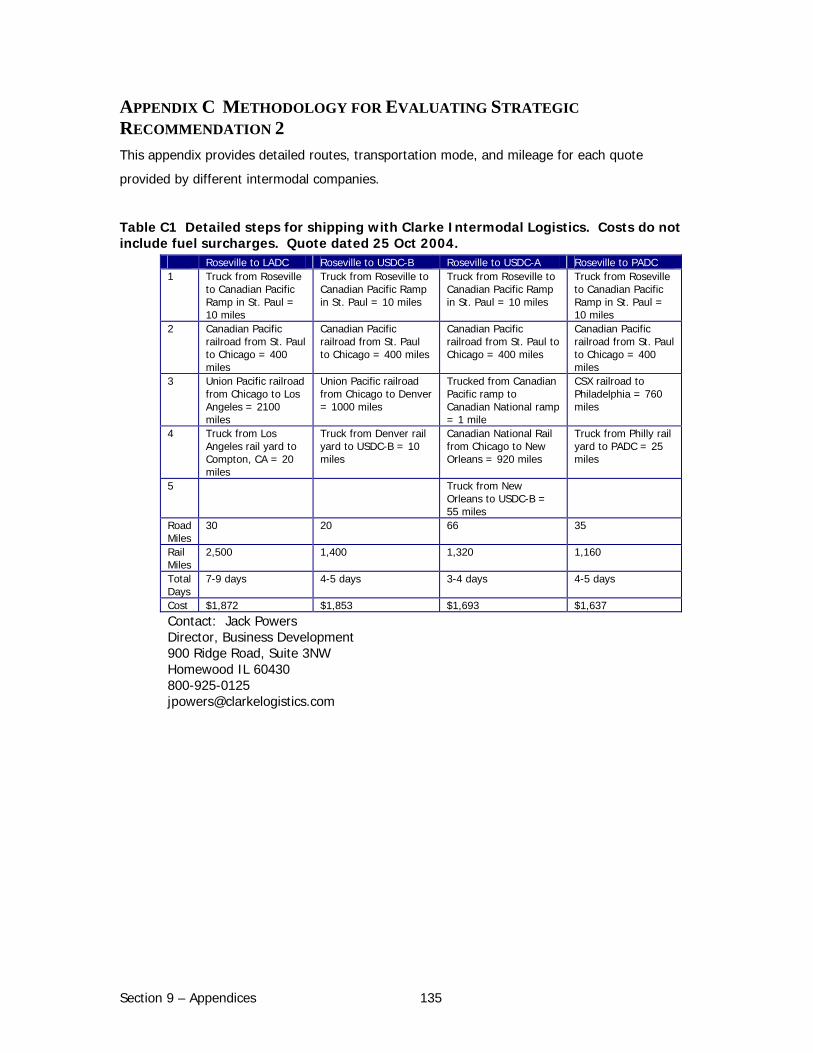
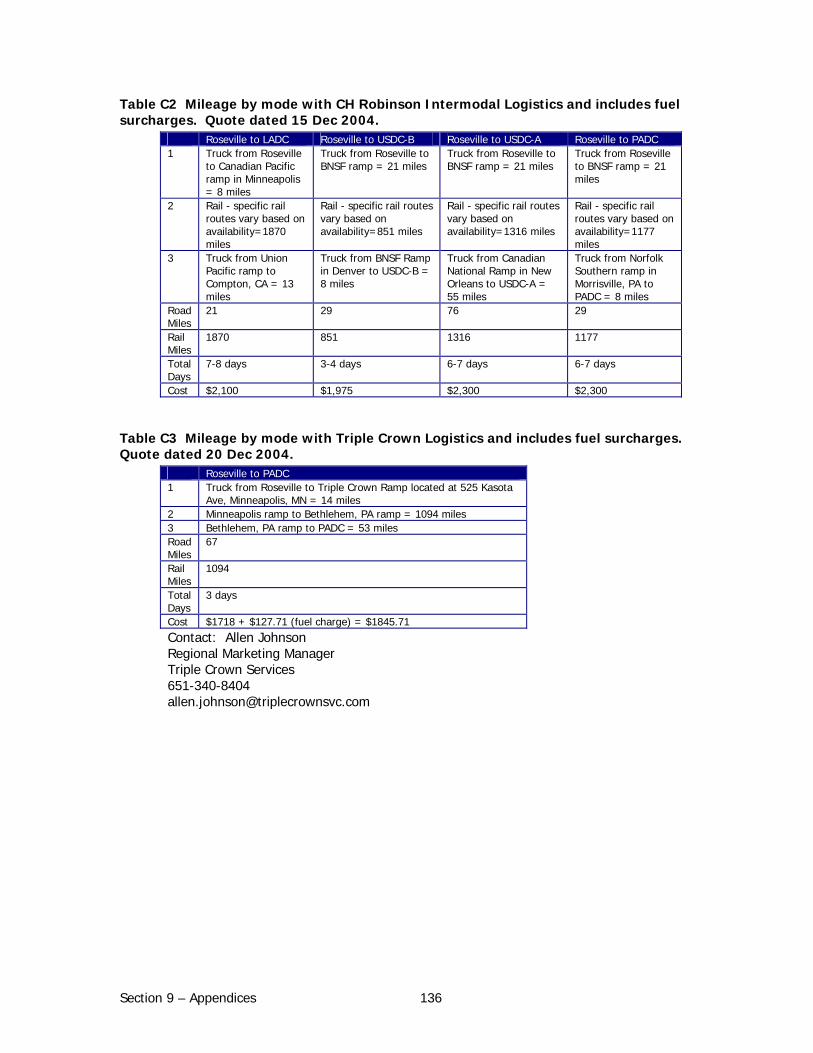
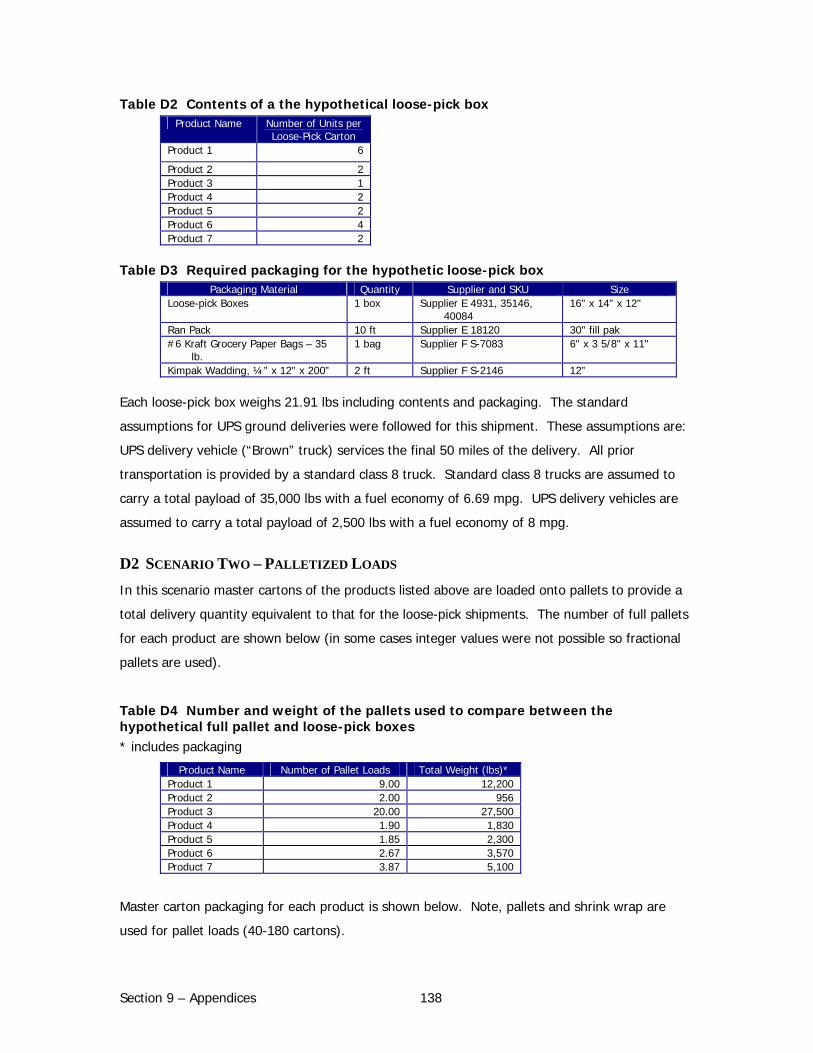
Appendix C Methodology for Evaluating Strategic Recommendation 2 .................135 Appendix D Relative Impact between Parcel versus LTL Shipping.........................137
vii
Appendix E Sample Letter to Carrier For EPA SmartWay Transport ......................142 Appendix F Sample Tertiary Packaging Purchasing Policy......................................144 Appendix G Energy and GWP Conversion................................................................145
Figure ES-2 Overall material flow of Aveda’s personal care products manufactured in Blaine and shipped to market via the company-owned and third-party distribution centers. ........................ 4 Figure ES-3 Primary Energy Use and Global Warming Potential Associated with Packaging use at Aveda-Owned DCs and Blaine Production Facility .................................................................... 5 Figure ES-4 Total Annualized Transportation Energy and GWP For Products Leaving Aveda-Owned DCs ......................................................................................................................... 6 Figure ES-5 Total Annualized Transportation Energy and GWP For Distribution Centers ............. 7 Figure ES-6 Weight-Distance-Based Transportation Energy and GWP per DC............................ 7 Figure ES-7 Comparison of PDS Energy and GWP to Facility Energy and Gas Use...................... 8 Figure ES-8 Differences in Energy and GWP on a per pound of product delivered ..................... 9 Figure 4A Photo of loose-pick order before final packing and shipping ................................... 23 Figure 4B Material flow of Aveda’s products manufactured in Blaine and shipped to market via company-owned and Third-party distribution centers. ........................................................... 26 Figure 4C Map of Aveda-owned and Third-party Distribution Centers in the US and Canada..... 31 Figure 4D Photo of Kraft Paper Dispenser at the Roseville DC. .............................................. 34 Figure 5A Primary Energy Use and Global Warming Potential Associated with Aveda-Owned DCs and Blaine Production Facility.............................................................................................. 44 Figure 5B Total Annualized Transportation Energy and GWP For Products Leaving Aveda-Owned DCs .................................................................................................................................. 48 Figure 5C Total Annualized Transportation Energy and GWP To Retail and Salon For Distribution Centers ............................................................................................................................. 49 Figure 5D Weight-Based Transportation Energy and GWP for each DC................................... 50 Figure 5E Weight-Distance-Based Transportation Energy and GWP per DC............................. 50 Figure 5F Annualized Energy and GWP Impact From Inter-Distributor Shipments.................... 52 Figure 5G Annualized Energy and GWP Impact of Customer Returns ..................................... 53 Figure 5H Energy and GWP Impact of Air Shipments from LADC to Hawaii ............................. 53 Figure 5I Energy and GWP Impact of Air Shipments Excluding Hawaii.................................... 54 Figure 5J Total PDS Energy and GWP Impact ...................................................................... 55 Figure 6A Map of existing retail distribution system.............................................................. 56 Figure 6B Scenario A Map of the direct routes from Roseville to all retail stores ..................... 58 Figure 6C Western region comparison of current system mileage vs. Scenario A (stores 1-13) . 59 Figure 6D Western region comparison of mileage for current system vs. Scenario A (stores 14-34) ................................................................................................................................... 59 Figure 6E PADC Region comparison of mileage for current system vs. Scenario A ................... 60 Figure 6F Scenario B-Direct from Roseville to WA, OR, NV, AZ, and Northern CA stores .......... 61 Figure 6G Energy consumption of total retail distribution system under current system, Scenario A, and Scenario B............................................................................................................... 62 Figure 6H GWP impact of total retail distribution system under Current system, Scenario A, and Scenario B......................................................................................................................... 63 Figure 6I Energy reduction of Western retail distribution system under Current system, Scenario A, and Scenario B............................................................................................................... 64 Figure 6J GWP impact of Western retail distribution system under Current system, Scenario A, and Scenario B................................................................................................................... 64 Figure 6K Energy reduction of Eastern retail distribution system under Current system, Scenario A, and Scenario B............................................................................................................... 65 Figure 6L GWP impact of Eastern retail distribution system under Current system, Scenario A, and Scenario B................................................................................................................... 66
ix
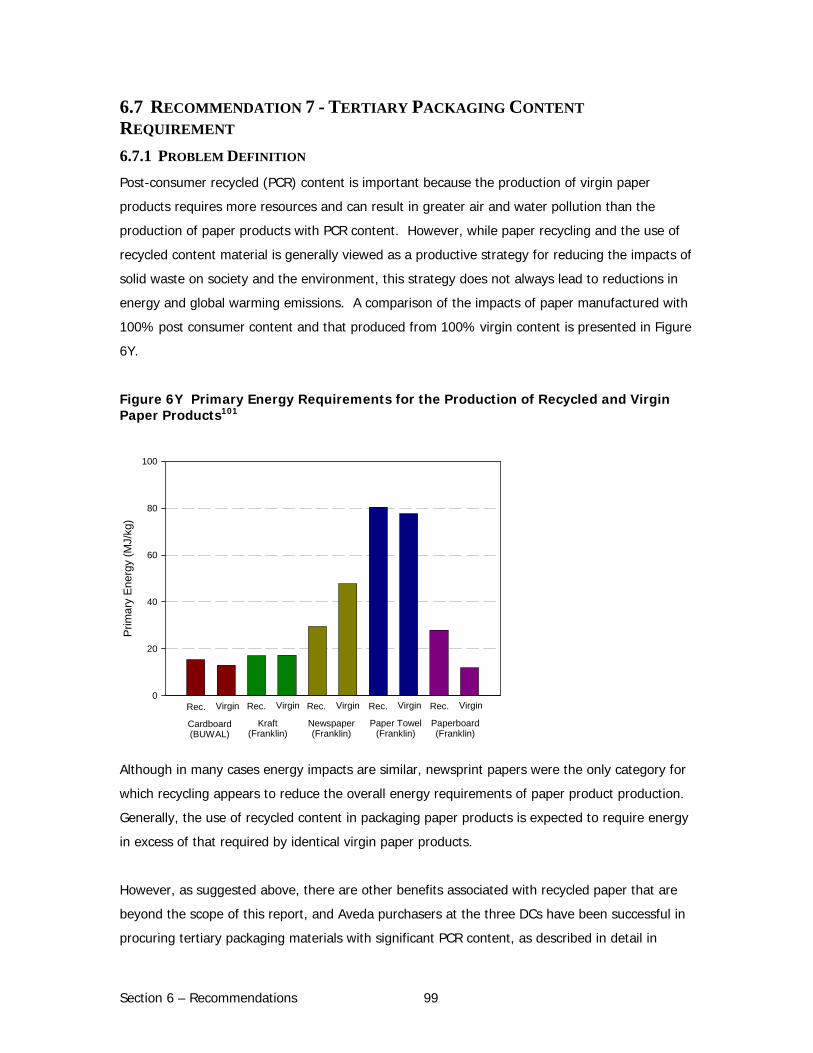
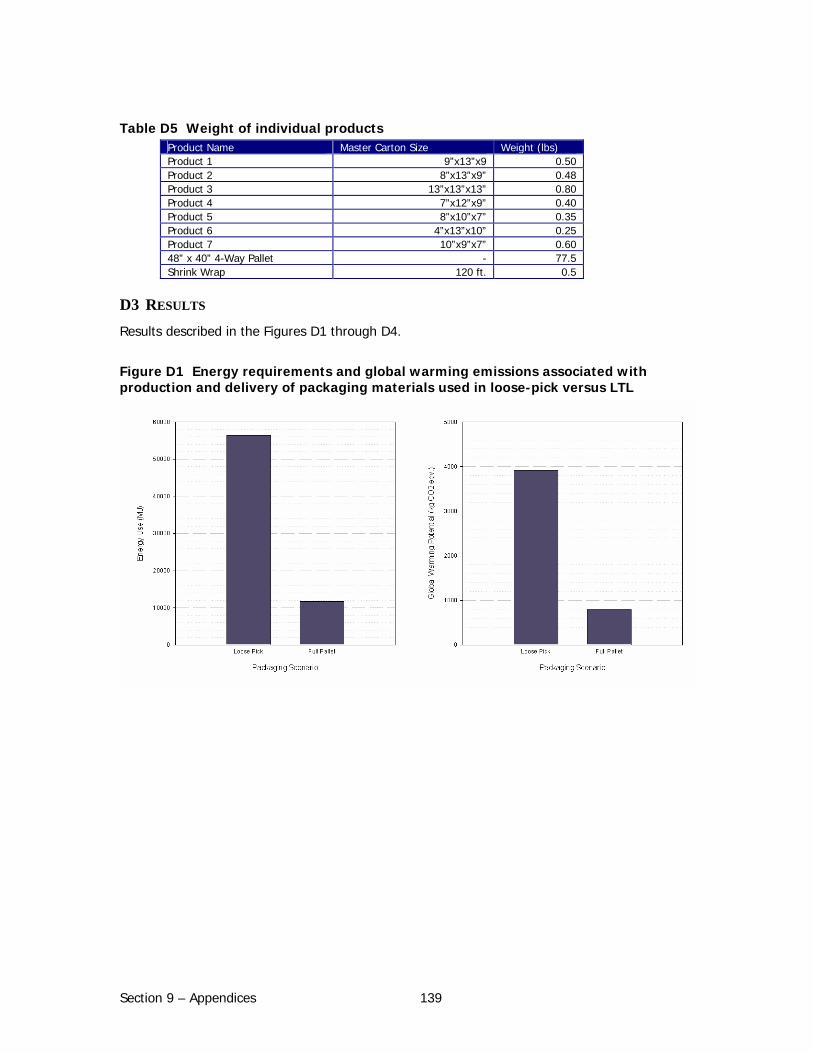
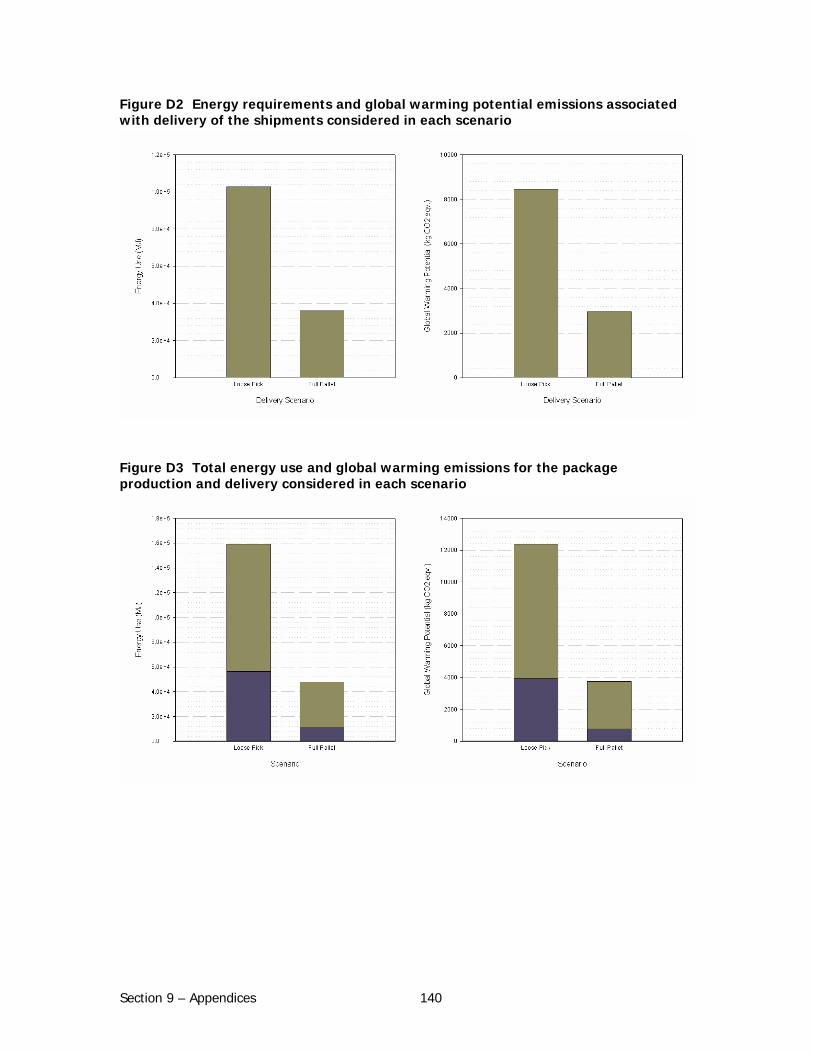
Figure 6M Environmental Impact Reductions from Implementing an Intermodal Distribution Strategy ............................................................................................................................ 72 Figure 6N Inventory Disposition, Weight by route ................................................................ 75 Figure 6O Inventory Disposition, Metric Ton-Miles by route.................................................... 76 Figure 6P Out of Region Shipments, Weight by route ........................................................... 77 Figure 6Q Out of Region Shipments, Metric Ton-Miles by route ............................................. 77 Figure 6R Product Returns, Weight and Metric Ton-Miles by route......................................... 78 Figure 6S Energy Consumption (MJ) of Inventory Disposition................................................ 79 Figure 6T GWP of Inventory Disposition .............................................................................. 79 Figure 6U Energy Consumption (MJ) of Out of Region Shipments .......................................... 80 Figure 6V GHG Impact of Out of Region Shipments.............................................................. 80 Figure 6W Energy Consumption and GHG Impact of Product Returns .................................... 81 Figure 6X Diagram of Proposed Recommendations based on Aveda’s S&H Policy .................... 86 Figure 6Y Primary Energy Requirements for the Production of Recycled and Virgin Paper Products............................................................................................................................ 99 Figure 6AA Environmental Impact of transportation of pallets from Blaine to Roseville and the new Blaine DC ..................................................................................................................106 Figure 7A Energy and GWP impact of Switching Hawaiian shipments via air to ocean.............109 Figure 7B Total Annualized Transportation Energy and GWP For Products Leaving Aveda-Owned DCs .................................................................................................................................109 Figure 7C Total Annualized Transportation Energy and GWP To Retail and Salon For Distribution Centers ............................................................................................................................110 Figure 7D Weight-Based Transportation Energy and GWP for each DC..................................110 Figure 7E Weight-Distance-Based Transportation Energy and GWP per DC............................111 Figure 7F Total PDS Energy and GWP Impact .....................................................................111 Figure A1 Primary Energy Requirements for the Production of Recycled and Virgin Paper Products (source: SimaPro data libraries) ............................................................................122 Figure A2 Process Contributions to Cradle-to-Gate Life Cycle Primary Energy Use ..................123 Figure B1 Calculation of expected driving distances.............................................................130 Figure D1 Energy requirements and global warming emissions associated with production and delivery of packaging materials used in loose-pick versus LTL ...............................................139 Figure D2 Energy requirements and global warming potential emissions associated with delivery of the shipments considered in each scenario ......................................................................140 Figure D3 Total energy use and global warming emissions for the package production and delivery considered in each scenario ...................................................................................140 Figure D4 Differences in Energy and GWP on a per pound of product delivered .....................141
x
LIST OF TABLES Table ES-1 Recommendations to Reduce PDS Impact........................................................... 11 Table 3A Emissions in CO2 equivalents by mode for 70,000 ton-miles .................................... 16 Table 4A Annual Average Tertiary Packaging Material Use at Aveda Facilities (Kg) .................. 32 Table 4B Roseville Distributor Shipments............................................................................. 36 Table 4C Distance from Supplier to Blaine Facility ................................................................ 37 Table 5A Packaging Suppliers Distances from Aveda-Owned DC............................................ 42 Table 5B Fuel Combustion Impacts..................................................................................... 47 Table 6A Cost of LADC region under Scenarios A and B ........................................................ 68 Table 6B Impact of Scenario A and B on Facility Operations.................................................. 69 Table 6C Summary of recommendation environmental impact, cost, and operational feasibility 69 Table 6D Mileage and mode comparison between current shipping strategy and intermodal logistics............................................................................................................................. 71 Table 6E Energy and GWP reductions associated with switching from truck to intermodal logistics for each of the four distribution centers >1000 miles from Roseville. ...................................... 72 Table 6F Comparison of shipping costs and delivery times between Aveda’s current trucking carriers and four intermodal logistics companies ................................................................... 73 Table 6G Summary of Environmental, Financial, Operational, and Customer Impact for three transport inefficiencies........................................................................................................ 83 Table 6H S&H sliding scale to motivate ............................................................................... 85 Table 6I Total Cost to offset the PDS through three different options .................................... 90 Table 6J Comparison of CCX®, Native Energy, and Climate Care............................................ 91 Table 6K Project carbon offset calculations, ........................................................................ 92 Table 6L Top Five Inbound and Outbound Transport Carriers by Ton-Miles (Annualized using data from October 2003 through February 2004) .................................................................. 94 Table 6M Reductions in Energy Use and GWP Resulting from Aveda’s Top Four Carriers’ Participation in SmartWay (Excluding UPS, Which Already Participates in SmartWay) ............... 97 Table A1 Primary Energy Equivalents for Fuel Sources.........................................................121 Table B1 Vehicle types, payload and fuel economy used in model ........................................127 Table B2 Greenhouse gas emissions and energy associated with different fuel types..............127 Table B5 Primary Energy Equivalents for Fuel Sources.........................................................131 Table B6 Assumptions for the mean distance, fuel economy and payload for UPS “Brown” trucks per delivery ......................................................................................................................132 Table C1 Detailed steps for shipping with Clarke Intermodal Logistics. Costs do not include fuel surcharges. Quote dated 25 Oct 2004................................................................................135 Table C2 Mileage by mode with CH Robinson Intermodal Logistics and includes fuel surcharges. Quote dated 15 Dec 2004. .................................................................................................136 Table C3 Mileage by mode with Triple Crown Logistics and includes fuel surcharges. Quote dated 20 Dec 2004............................................................................................................136 Table D1 Products and number of units shipped in the loose-pick versus palletized load scenario........................................................................................................................................137 Table D2 Contents of a the hypothetical loose-pick box .......................................................138 Table D3 Required packaging for the hypothetic loose-pick box ...........................................138 Table D4 Number and weight of the pallets used to compare between the hypothetical full pallet and loose-pick boxes .........................................................................................................138 Table D5 Weight of individual products ..............................................................................139 Table F1 Minimum standards for PCR content in tertiary packaging ......................................144
Section 1 - Abstract 1
SECTION 1 – ABSTRACT Aveda Corporation’s product delivery system (PDS) is evaluated in terms of energy consumption
and global warming potential (GWP). Two components of the PDS are analyzed in this study:
the tertiary packaging (dunnage, plastic wrap, and cardboard boxes) and the transportation
required to distribute products from Aveda’s manufacturing facility in Blaine, Minnesota to
specified salon and retail customers throughout the U.S. Computer models employing life cycle
methodology were developed to quantify the energy consumption and GWP of the PDS, and
recommendations are made to reduce the impact of the PDS. The recommendations are
evaluated in terms of both environmental and business opportunity.
The total annual energy consumption for the PDS is found to be 36.4 million (MM) mega-joules
(MJ) and the total annual GWP is 2,811 metric tons of CO2 equivalents. This impact breaks down
to 10.6 MM MJ of energy, and 714 metric tons CO2 equivalents for tertiary packaging and 25.8
MM MJ of energy and 2,097 metric tons CO2 for transport. The PDS energy consumption and
GHG emissions associated with the tertiary packaging are correlated with the mass of the
materials used, packaging fabrication processes and material composition, and transportation of
the tertiary packaging materials from suppliers to Aveda’s Blaine facility. The impact of the
transportation is driven primarily by mode of transport and weight and distance traveled by
shipments.
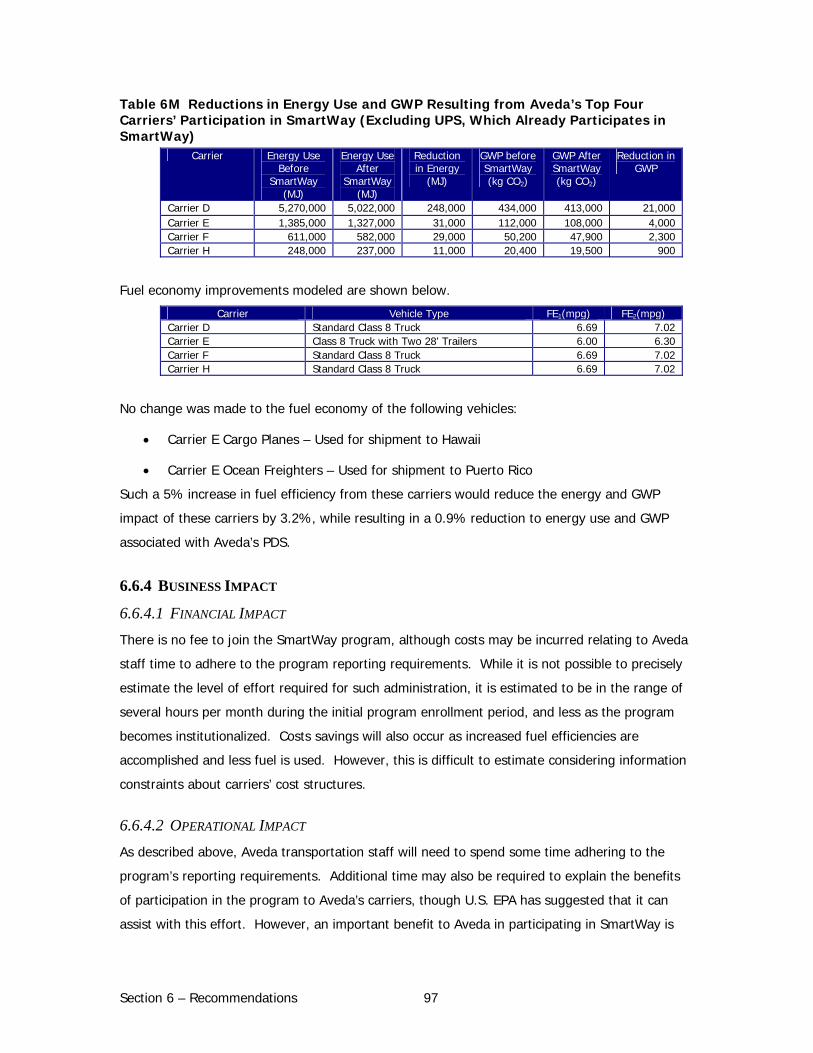
Recommendations evaluated to reduce the PDS impact include: utilize intermodal shipping to
distribution centers (DC), reduce loose-pick shipments, ship direct from the Roseville DC to more
retail stores, reduce transport inefficiencies, offset carbon emissions, use alternative fuel from
Blaine to the new DC, enroll in the EPA SmartWay Transport Partnership Program, and
implement a tertiary packaging PCR content requirement. If implemented, these
recommendations (excluding carbon offsets) would reduce the PDS impact by approximately 9%,
or 3.3 MM MJ and 285 metric tons CO2 annually.
To protect the Aveda Corporation, proprietary data have been omitted and the names of facilities
and distribution channels have been masked.
Section 2 – Executive Summary 2
SECTION 2 – EXECUTIVE SUMMARY There has been significant discussion among managers of leading sustainable enterprises and
academics about the role of business and the environment, and about the feasibility of using
environmental performance as a source of long-term competitive advantage. Aveda’s efforts to
lead the way as an environmental steward and to translate these efforts into brand enhancement
and shareholder and stakeholder value is a working example of how business can do well by
doing good. This project, therefore, is not only born out of Aveda’s ongoing commitment to
protecting natural resources, but also out of its efforts to find business value in environmental
projects.
After commissioning a number of CERES environmental reports, and learning that as much as
60% of its energy consumption is related to transport activities, Aveda’s Environmental
Sustainability department was interested in the details of the impacts of its product delivery. The
student research team worked closely with Aveda’s Executive Director, Environmental
Sustainability as well as with other key senior staff in the company’s Transportation, Operations,
Marketing, and Sales departments to gather data, analyze the product delivery system (PDS),
and make recommendations. The team ranked its recommendations based on a weighting of
environmental and business impact.
To protect the Aveda Corporation, proprietary data have been omitted and the names of facilities
and distribution channels have been masked.
PRODUCT DELIVERY SYSTEM MODEL AND MODELING RESULTS This study applies life cycle methodology to assess the total energy (expressed in mega-joules)
and greenhouse gas (GHG) emissions (expressed in kg of CO2 equivalents) associated with its
PDS. The PDS under consideration in this study consists of the tertiary packaging and
transportation routes required to deliver the packaging and products between the system model
components, as defined in Figure ES-2.
A model was created using SimaPro (v 5.1) and Microsoft Access to evaluate the energy
consumption and GHG emissions of the PDS. The model was populated with transportation data
from a five-month period (October 2003 through February 2004) and with packaging data over a
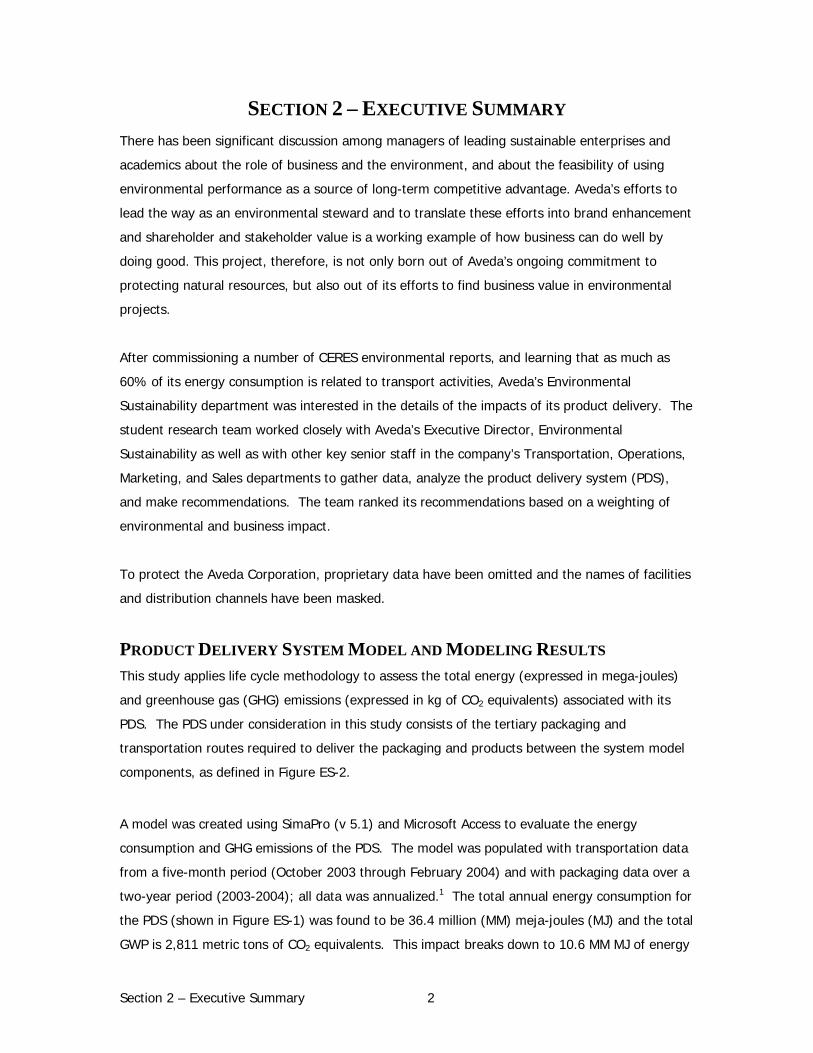
two-year period (2003-2004); all data was annualized.1 The total annual energy consumption for
the PDS (shown in Figure ES-1) was found to be 36.4 million (MM) meja-joules (MJ) and the total
GWP is 2,811 metric tons of CO2 equivalents. This impact breaks down to 10.6 MM MJ of energy
Section 2 – Executive Summary 3
and 714 metric tons CO2 equivalents for packaging, and 25.8 MM MJ of energy and 2,097 metric
tons CO2 for transport. The PDS energy consumption and GHG emissions associated with
transportation were driven primarily by mode of transport and weight and distance shipped,
while the impact of the packaging was correlated to the mass of the materials used,
manufacturing processes used to make the packaging, and the material composition.
The 36.4 MM MJ represents a significant portion of Aveda’s entire energy footprint. By
comparison, according to the 2002 CERES report, Aveda’s Blaine production facility uses
approximately 39.3 MM MJ for utility use over the course of an entire year. Put another way,
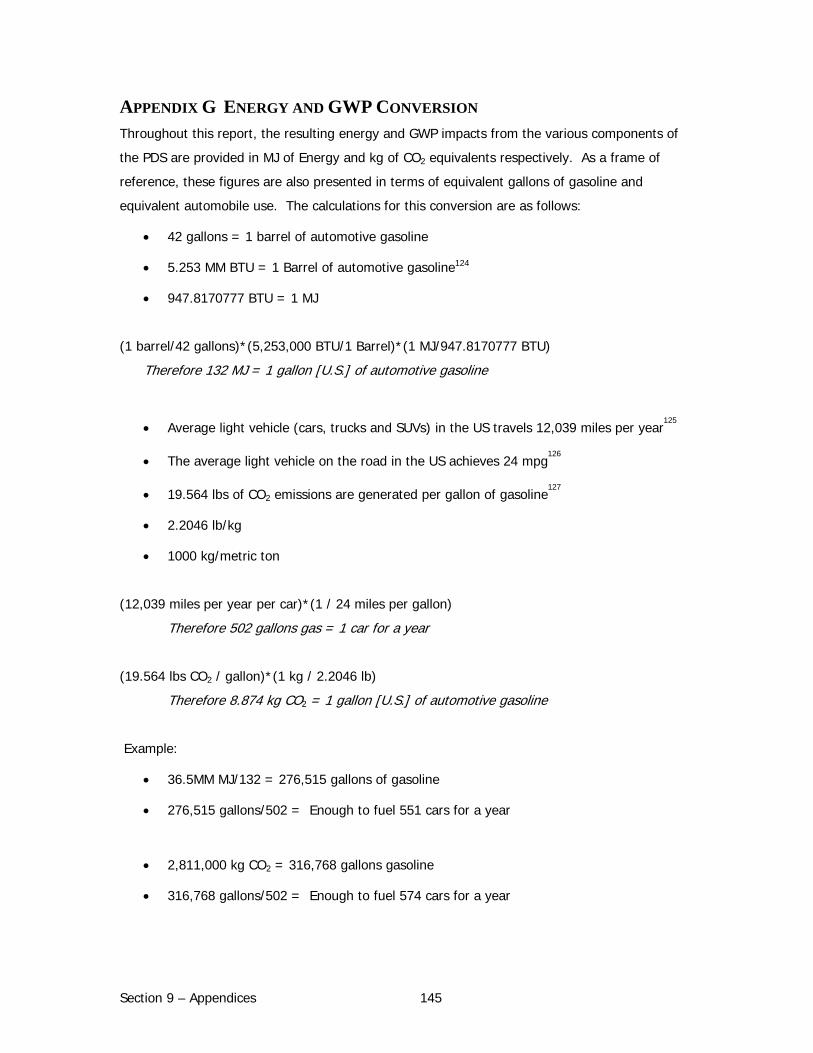
36.4 MM MJ is equal to the energy in approximately 277,000 gallons of gasoline.
Figure ES-1 Total PDS Energy and GWP
25.8
10.6
0
5
10
15
20
25
30
35
40
Energy
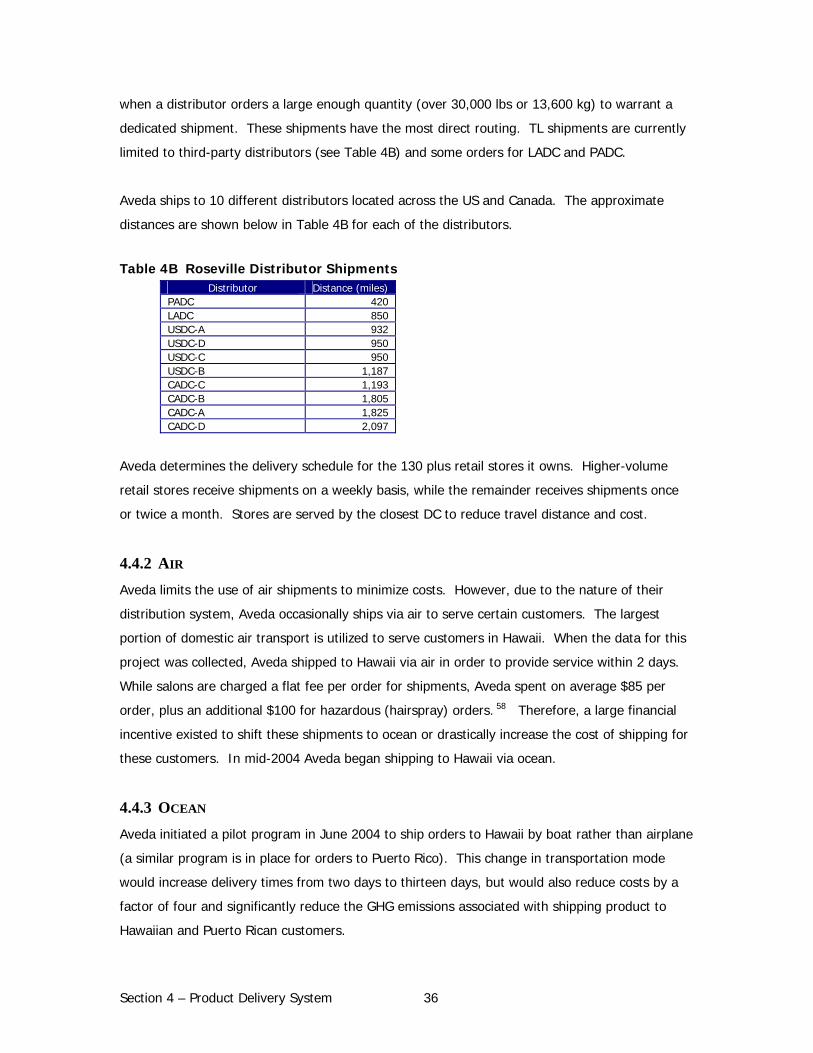
Ene
rgy
(Mill
ion
MJ)
2,097
714
-
500
1,000
1,500
2,000
2,500
3,000
GWP
GW
P (m
etric
ton
of C
O2
equi
vale
nts) 2,81136.4
Packaging
Transportation
Packaging
Transportation
Section 2 – Executive Summary 4
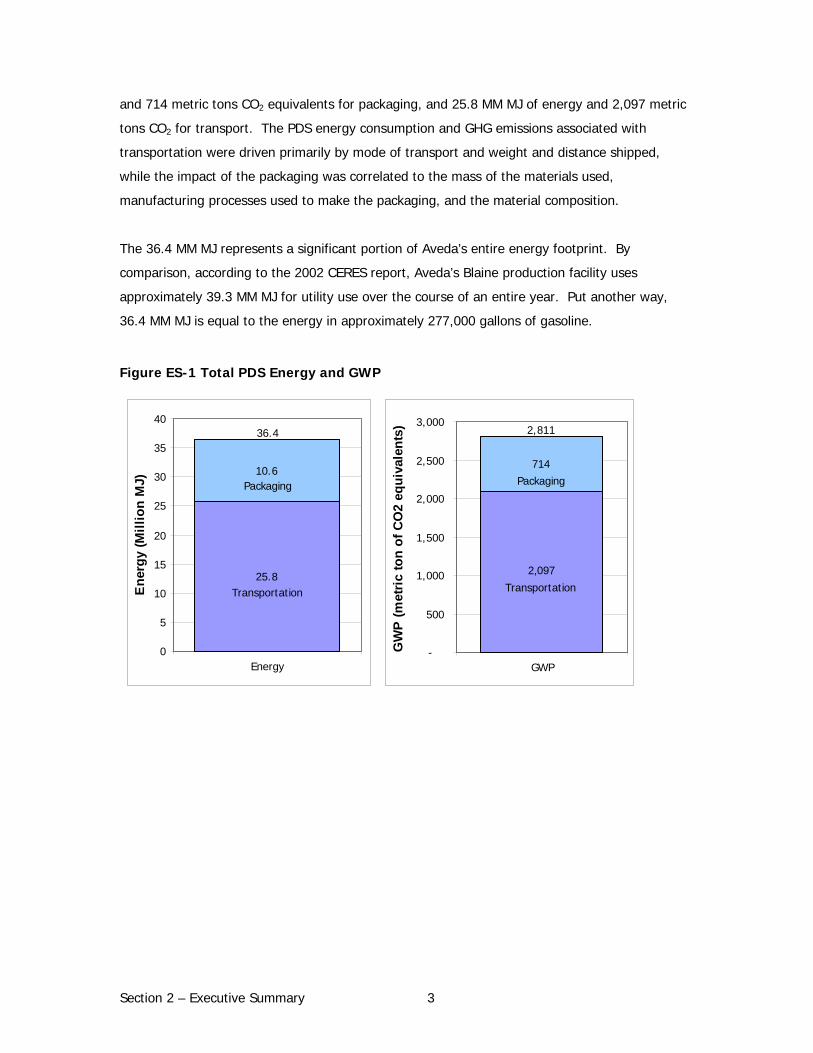
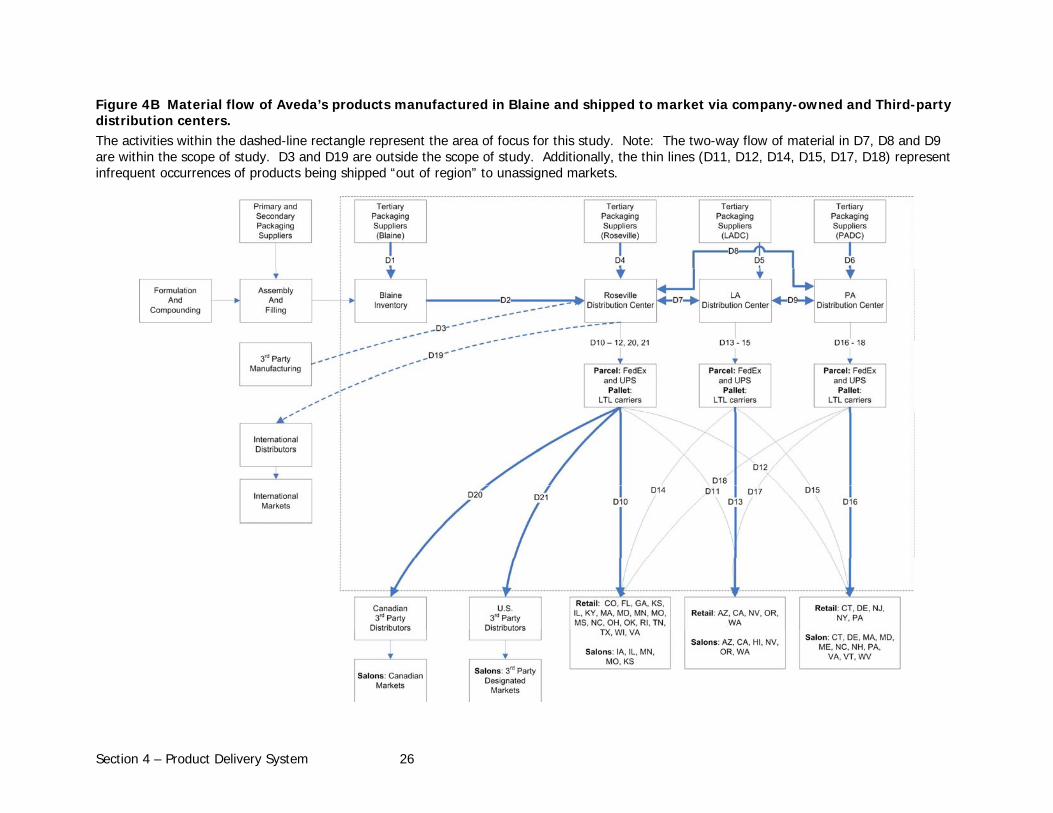
Figure ES-2 Overall material flow of Aveda’s personal care products manufactured in Blaine and shipped to market via the company-owned and third-party distribution centers. The activities within the dashed-line rectangle represent the area of focus for this study. Note: The two-way flow of material in D7, D8 and D9 are within the scope of study. D3 and D19 are outside the scope of study. Additionally, the thin lines (D11, D12, D14, D15, D17, D18) represent infrequent occurrences of products being shipped “out of region” to unassigned markets.
Section 2 – Executive Summary 5
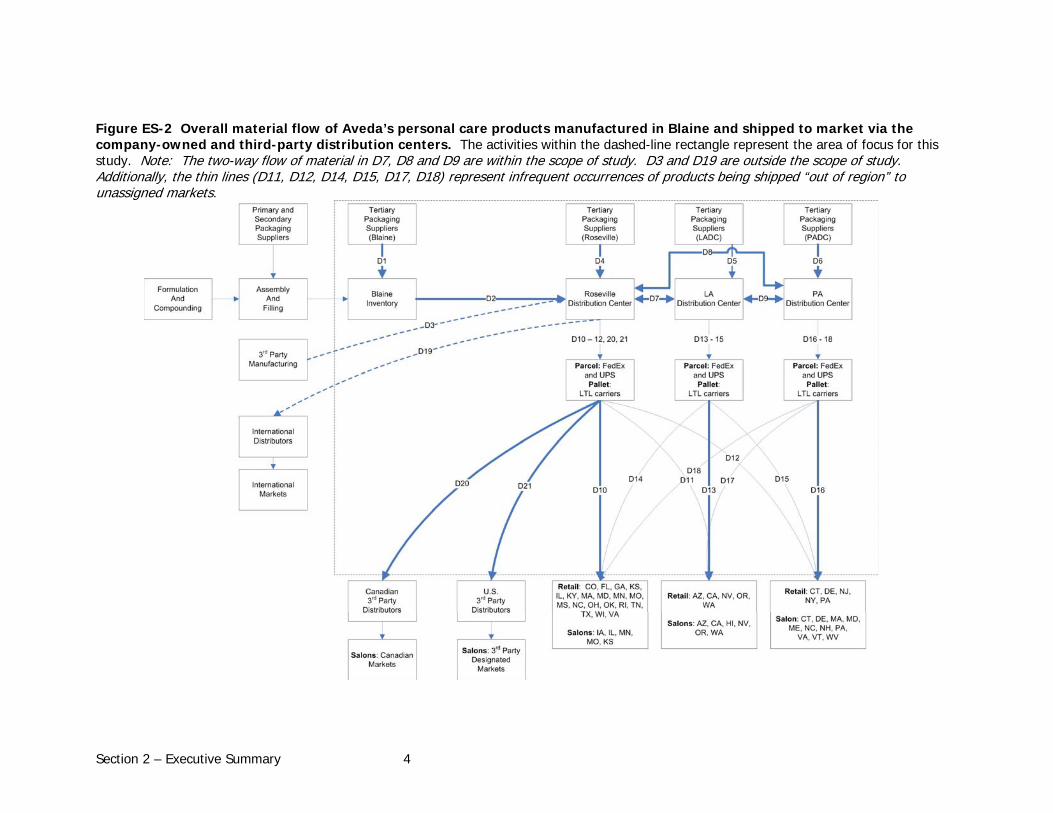
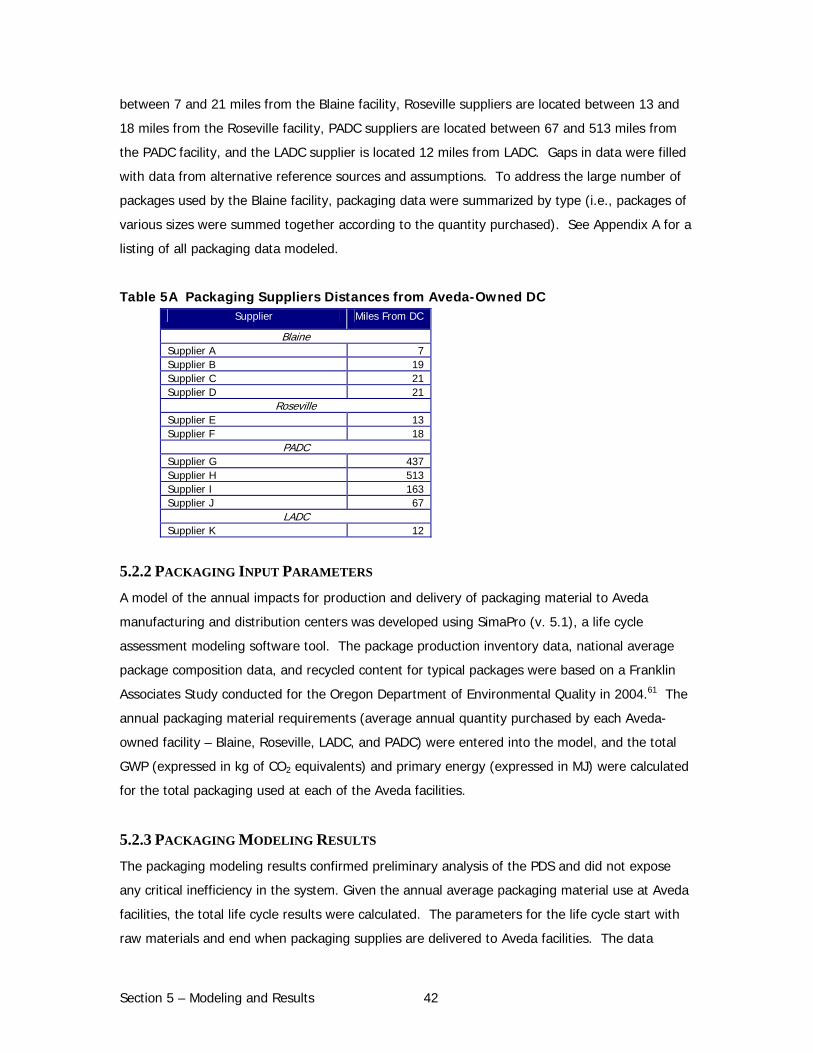
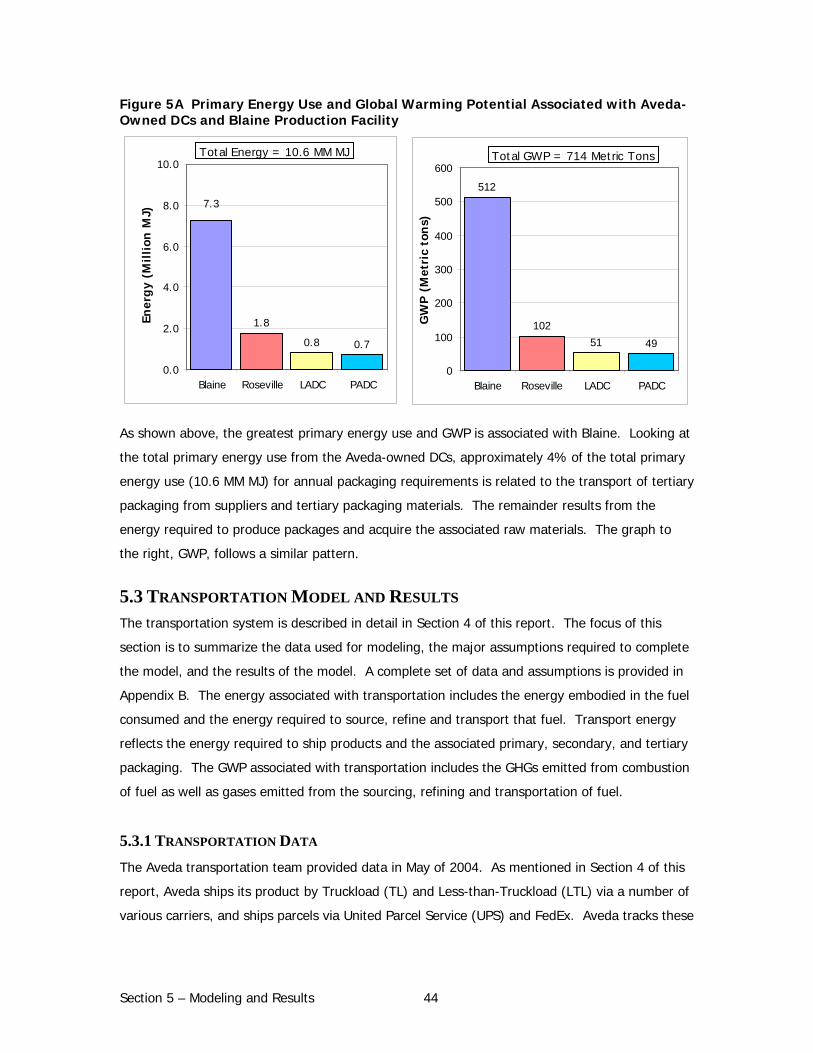
PACKAGING MODELING RESULTS Figure ES-3 shows the primary energy use and GWP associated with packaging use at the four
Aveda-owned distribution centers (DC’s). Notably, cardboard accounts for over 97% of tertiary
packaging by weight. Dunnage accounts for 2.4% while plastic products such as plastic wrap
and bubble wrap account for .05% of packaging by weight. Packaging purchased by the Blaine
production facility accounted for 68.9% of the total energy impact of tertiary packaging, followed
by Roseville (17%), LADC (7.5%), and PADC (6.6%). Of the 10.6 MM MJ total primary energy
for annual packaging requirements, approximately 4% is related to the transport of tertiary
packaging (such as pallets and corrugated cardboard shipping boxes) from suppliers. The
remaining 96% of primary energy emanates from acquisition of raw materials, manufacturing
and embodied energy of the packaging material. As shown in Figure ES-3, global warming
emissions follow a similar pattern.
Figure ES-3 Primary Energy Use and Global Warming Potential Associated with Packaging use at Aveda-Owned DCs and Blaine Production Facility
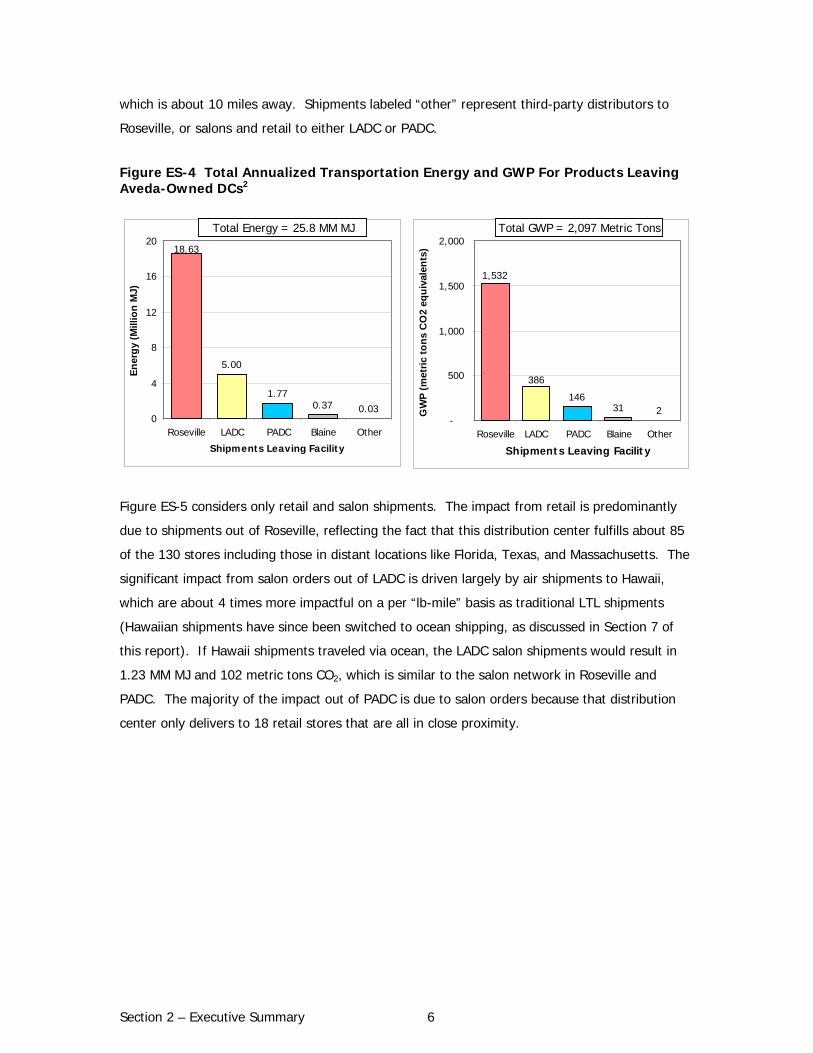
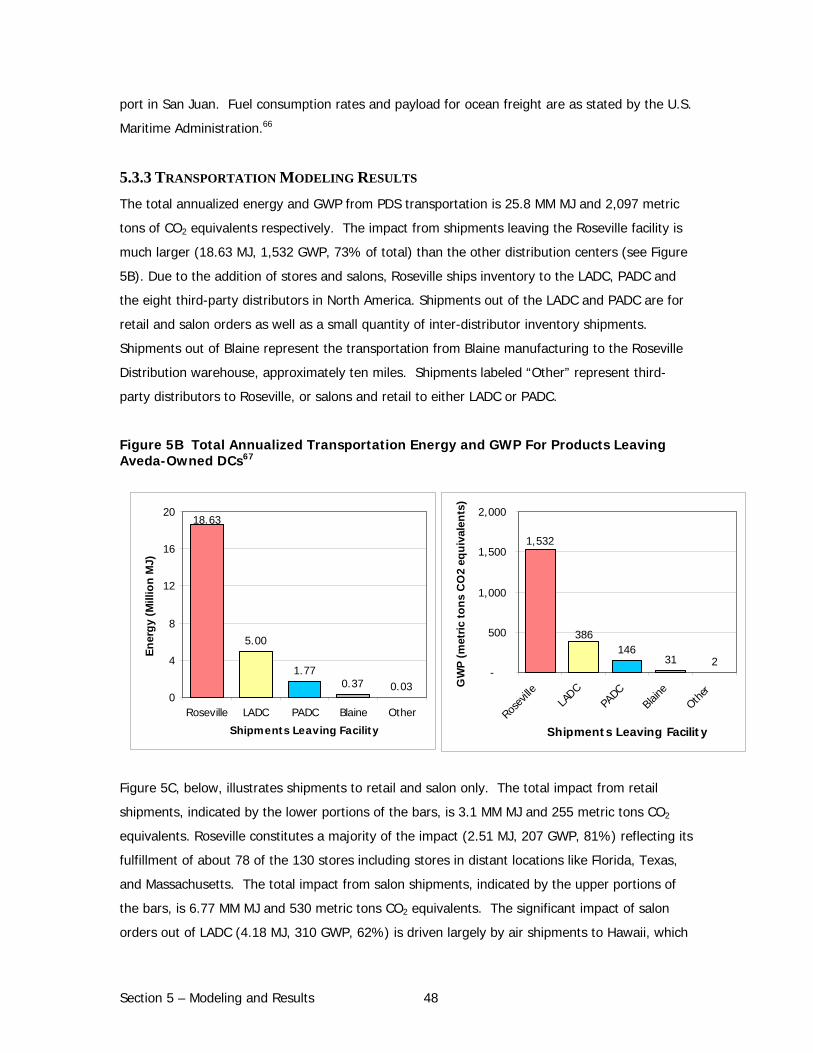
TRANSPORTATION MODELING RESULTS The total annualized energy and GWP from PDS transportation is 25.8 MM MJ and 2,097 metric
tons of CO2 equivalents, respectively. As shown in Figure ES-4, the impact from shipments
leaving the Roseville facility is much larger than the other distribution centers because in addition
to stores and salons, this DC ships products to the LADC, PADC and the eight third-party
distributors in North America. Shipments out of the LADC and PADC are for retail and salon
orders as well as a small quantity of inter-distributor shipments. Shipments out of Blaine
represent the transportation from Blaine manufacturing to the Roseville Distribution warehouse,
1.8
0.8 0.7
7.3
0.0
2.0
4.0
6.0
8.0
10.0
Blaine Roseville LADC PADC
Ener
gy
(Mil
lion
MJ)
512
10251 49
0
100
200
300
400
500
600
Blaine Roseville LADC PADC
GW
P (
Met
ric
ton
s)
Total Energy = 10.6 MM MJ Total GWP = 714 Metric Tons
Section 2 – Executive Summary 6
which is about 10 miles away. Shipments labeled “other” represent third-party distributors to
Roseville, or salons and retail to either LADC or PADC.
Figure ES-4 Total Annualized Transportation Energy and GWP For Products Leaving Aveda-Owned DCs2
Figure ES-5 considers only retail and salon shipments. The impact from retail is predominantly
due to shipments out of Roseville, reflecting the fact that this distribution center fulfills about 85
of the 130 stores including those in distant locations like Florida, Texas, and Massachusetts. The
significant impact from salon orders out of LADC is driven largely by air shipments to Hawaii,
which are about 4 times more impactful on a per “lb-mile” basis as traditional LTL shipments
(Hawaiian shipments have since been switched to ocean shipping, as discussed in Section 7 of
this report). If Hawaii shipments traveled via ocean, the LADC salon shipments would result in
1.23 MM MJ and 102 metric tons CO2, which is similar to the salon network in Roseville and
PADC. The majority of the impact out of PADC is due to salon orders because that distribution
center only delivers to 18 retail stores that are all in close proximity.
5.00
1.770.37 0.03
18.63
0
4
8
12
16
20
Roseville LADC PADC Blaine Other
Shipments Leaving Facility
Ener
gy (M
illio
n M
J)
14631 2
386
1,532
-
500
1,000
1,500
2,000
Roseville LADC PADC Blaine Other
Shipments Leaving Facility
GW
P (m
etric
tons
CO
2 eq
uiva
lent
s)
Total Energy = 25.8 MM MJ Total GWP = 2,097 Metric Tons
Section 2 – Executive Summary 7
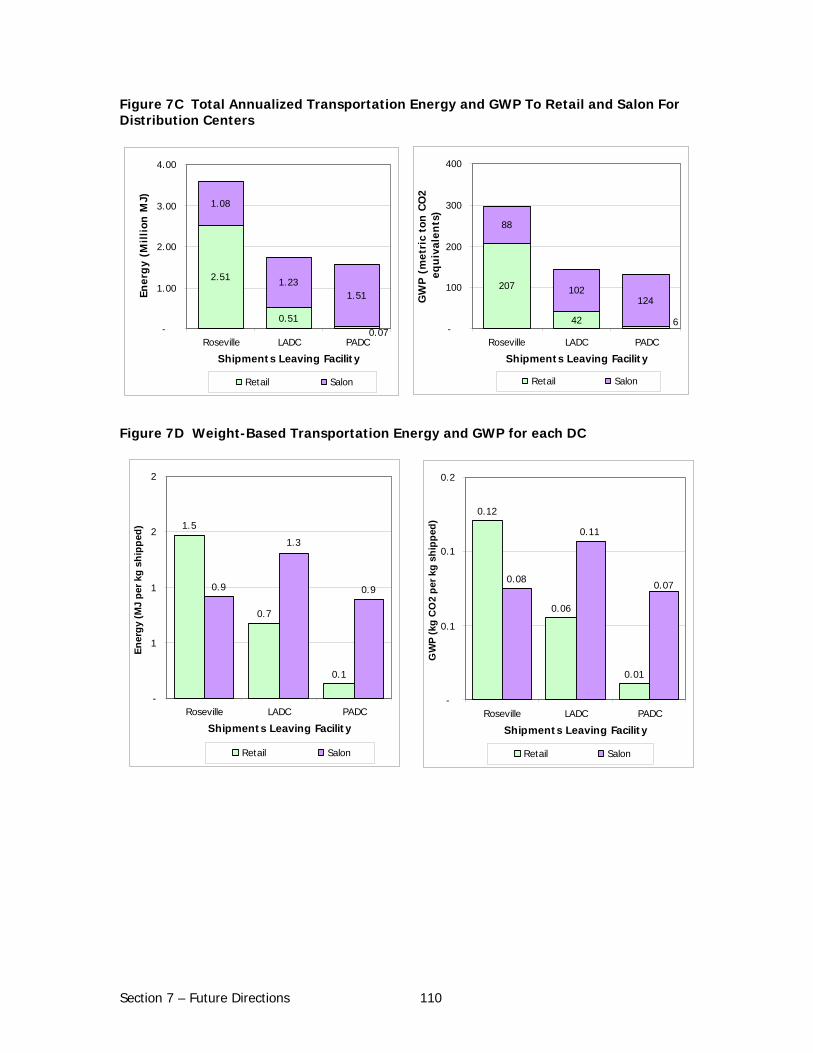
Figure ES-5 Total Annualized Transportation Energy and GWP For Distribution Centers
Figure ES-6 also considers only retail and salon shipments, but normalizes the shipments by
weight and distance. As a result these graphs demonstrate the difference among the various
modes of transport. Less than truckload (LTL) shipments are generally most efficient, as seen by
the relatively low numbers for retail shipments. Parcel is slightly less efficient due to the use of
UPS “brown trucks” which do not have the capacity of a tractor trailer and this is seen by the
higher numbers for salon shipments. The PADC salon shipments are high because packages
spend the majority of the route on the “brown trucks”, while Roseville salon shipments may
travel on UPS tractor trailers for a portion of the trip. Again, Hawaiian shipments out of LADC
drives the average impact up dramatically, but as seen in the alternate line, if these shipments
were transported via ocean, the average impact would be in line with other salon shipments.
Figure ES-6 Weight-Distance-Based Transportation Energy and GWP per DC
0.9 1.1 1.01.5
4.1
2.9
0
1
2
3
4
5
Roseville LADC PADC
Shipments Leaving Facility
Ener
gy (M
J pe
r met
ric-t
on-k
m)
Retail Salon
0.12
0.32
0.24
0.080.09 0.08
-
0.1
0.2
0.3
0.4
Roseville LADC PADC
Shipments Leaving Facility
GW
P (k
g C
O2
per m
etric
ton-
km)
Retail Salon
1.2 0.10
2.51
0.51
1.08
1.51
0.07
4.18
-
1.00
2.00
3.00
4.00
5.00
Roseville LADC PADC
Shipments Leaving Facility
Ener
gy
(Mil
lion
MJ)
Retail Salon
207
42
88
124
6
318
-
100
200
300
400
Roseville LADC PADC
Shipments Leaving Facility
GW
P (
met
ric
ton
CO
2
equ
ival
ents
)
Retail Salon
1.23 102
Section 2 – Executive Summary 8
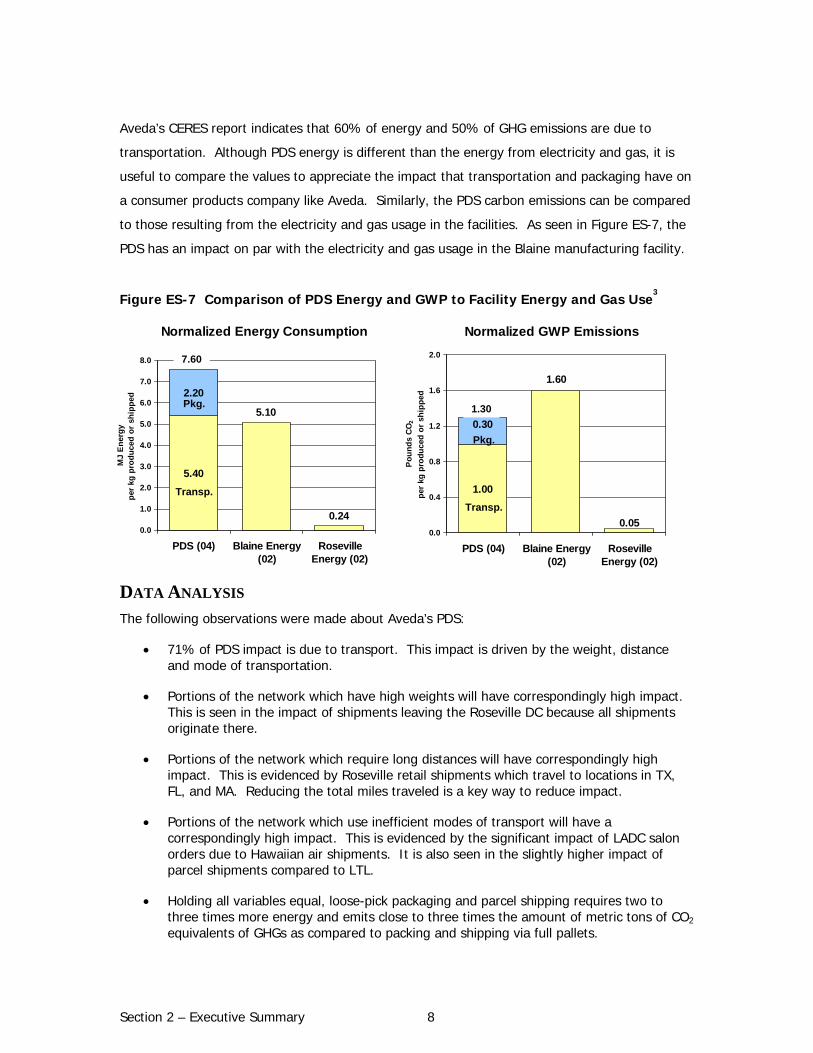
Aveda’s CERES report indicates that 60% of energy and 50% of GHG emissions are due to
transportation. Although PDS energy is different than the energy from electricity and gas, it is
useful to compare the values to appreciate the impact that transportation and packaging have on
a consumer products company like Aveda. Similarly, the PDS carbon emissions can be compared
to those resulting from the electricity and gas usage in the facilities. As seen in Figure ES-7, the
PDS has an impact on par with the electricity and gas usage in the Blaine manufacturing facility.
Figure ES-7 Comparison of PDS Energy and GWP to Facility Energy and Gas Use3
DATA ANALYSIS The following observations were made about Aveda’s PDS:
• 71% of PDS impact is due to transport. This impact is driven by the weight, distance and mode of transportation.
• Portions of the network which have high weights will have correspondingly high impact. This is seen in the impact of shipments leaving the Roseville DC because all shipments originate there.
• Portions of the network which require long distances will have correspondingly high impact. This is evidenced by Roseville retail shipments which travel to locations in TX, FL, and MA. Reducing the total miles traveled is a key way to reduce impact.
• Portions of the network which use inefficient modes of transport will have a correspondingly high impact. This is evidenced by the significant impact of LADC salon orders due to Hawaiian air shipments. It is also seen in the slightly higher impact of parcel shipments compared to LTL.
• Holding all variables equal, loose-pick packaging and parcel shipping requires two to three times more energy and emits close to three times the amount of metric tons of CO2 equivalents of GHGs as compared to packing and shipping via full pallets.
Normalized GWP Emissions
1.00
1.60
0.05
0.30
0.0
0.4
0.8
1.2
1.6
2.0
PDS (04) Blaine Energy(02)
RosevilleEnergy (02)
Pou
nds
CO2
per
kg p
rodu
ced
or s
hipp
ed
Normalized Energy Consumption
5.40
2.20
0.24
5.10
0.0
1.0
2.0
3.0
4.0
5.0
6.0
7.0
8.0
PDS (04) Blaine Energy(02)
RosevilleEnergy (02)
MJ
Ener
gype
r kg
prod
uced
or
ship
ped
7.60
1.30
Transp.
Pkg.
Pkg.
Transp.
Section 2 – Executive Summary 9
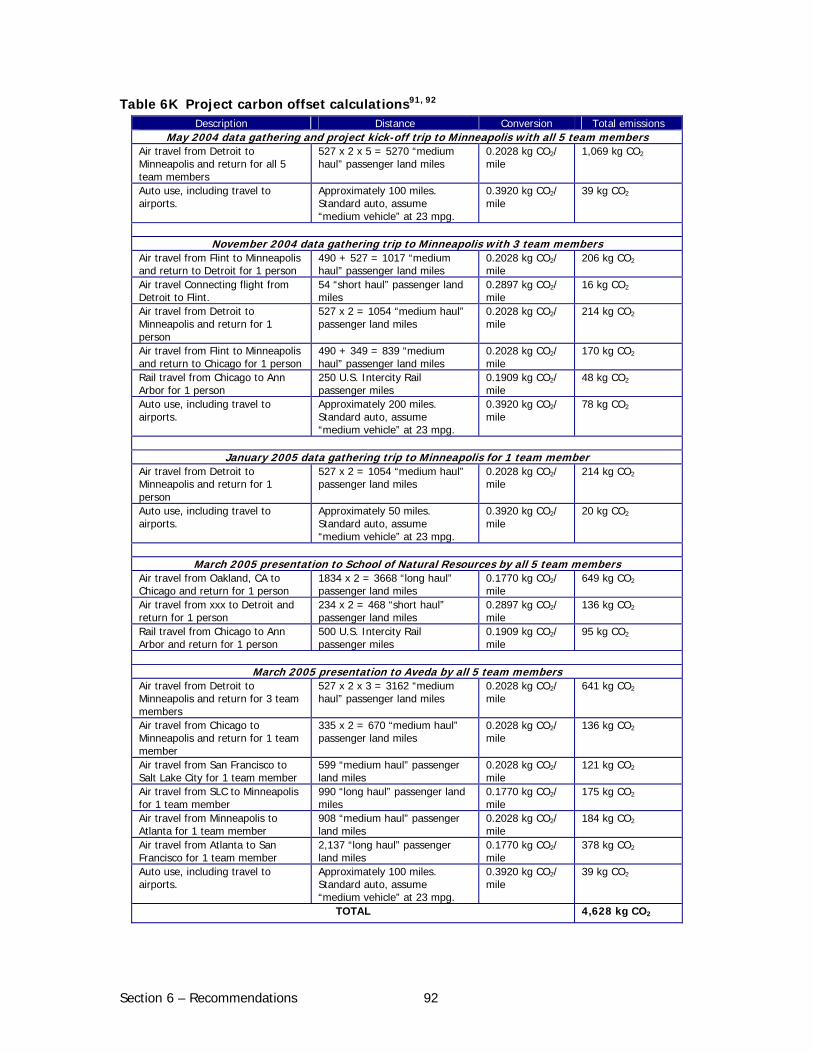
• Salon shipments from LADC to Hawaii via air contribute greatly to the overall impact for the salon portion of the PDS. Air shipments from LADC to Hawaii account for 3% of the weight of all shipments out of LADC, but 64% of the impact (see figure 8).
• Total impact from the PADC is relatively low due to the short distances between the PADC and both salon and retail locations.
• Inventory disposition accounts for 4% of the total transportation impact (1,050,000 MJ and 86,300 kg CO2 equivalents). As a frame of reference, 1,080,000 MJ and 88,000 kg CO2 equivalents were required to transport shipments from Roseville to Central region salons.
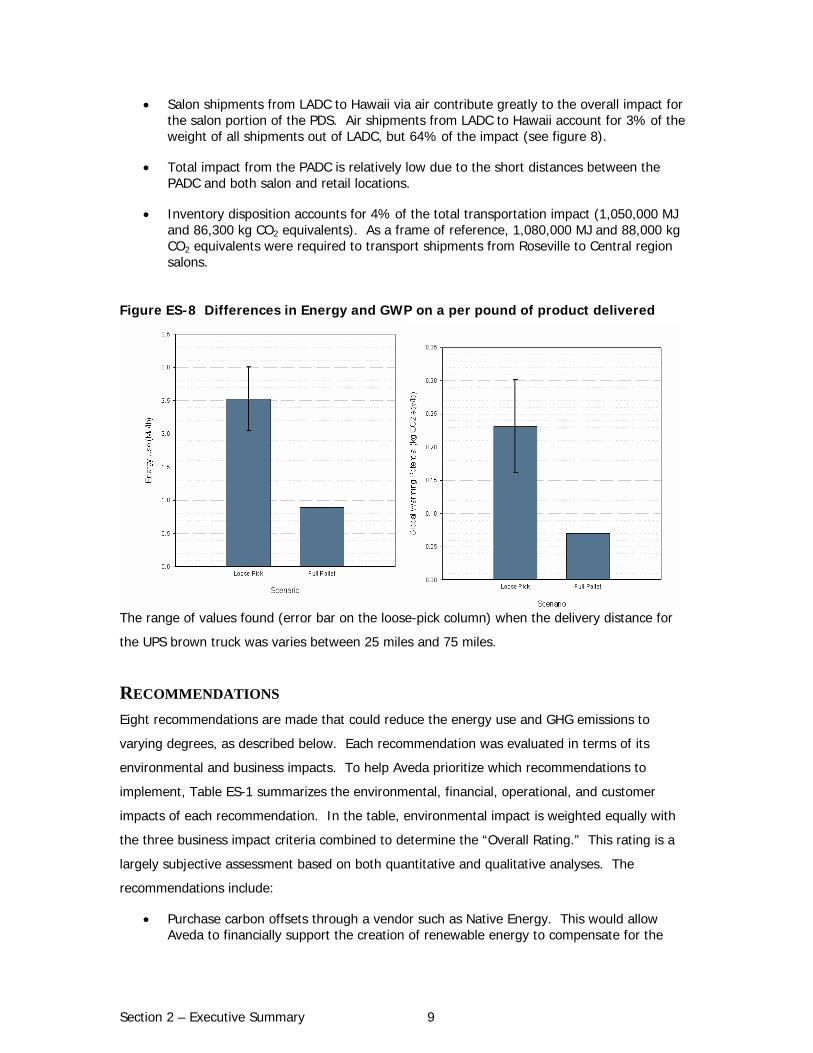
Figure ES-8 Differences in Energy and GWP on a per pound of product delivered
The range of values found (error bar on the loose-pick column) when the delivery distance for
the UPS brown truck was varies between 25 miles and 75 miles.
RECOMMENDATIONS Eight recommendations are made that could reduce the energy use and GHG emissions to
varying degrees, as described below. Each recommendation was evaluated in terms of its
environmental and business impacts. To help Aveda prioritize which recommendations to
implement, Table ES-1 summarizes the environmental, financial, operational, and customer
impacts of each recommendation. In the table, environmental impact is weighted equally with
the three business impact criteria combined to determine the “Overall Rating.” This rating is a
largely subjective assessment based on both quantitative and qualitative analyses. The
recommendations include:
• Purchase carbon offsets through a vendor such as Native Energy. This would allow Aveda to financially support the creation of renewable energy to compensate for the
Section 2 – Executive Summary 10
carbon emissions from its PDS. Offsetting the 2,811 metric tons of CO2 equivalents (100% of PDS) would cost approximately $8,400 annually.
• Because rail transportation is more than three times more efficient than truck transportation, it is recommended that Aveda use intermodal shipping to its large distributors. Intermodal shipping combines truck and rail to eliminate the need to load and unload rail cars. This could potentially save 1.2 MM MJ and 111.6 tons CO2 equivalents annually (3.3% of PDS) at a comparable cost and complexity of current operations.
• Due to the southwestern location of the LADC, shipments to retail stores in the northwest travel up to 54% more than a direct route from Roseville. If a majority of western retail stores were shipped direct, 434,000 MJ and 37,000 kg CO2 equivalents (1.2% of PDS) would be eliminated at a comparable cost to current operations.
• By enrolling in the EPA’s Smartway Transport Partnership Program, Aveda would encourage its current carriers to improve the efficiency of their trucks. If typical program requirements were met, 346,000 MJ and 31,000 kg CO2 equivalents (0.9% of PDS) would be eliminated at no cost to Aveda. Further, the improved efficiency would apply to the carriers’ other customers and thus provide additional environmental savings.
• It was found through this study that loose-pick shipments have a higher energy and GWP impact per kg shipped than LTL shipments. This is due to the additional packaging materials and the less efficient parcel transportation network. If just 1% of shipments were changed from parcel to LTL, this would save an estimated 0.029 MM MJ and 2.3 metric tons of CO2 equivalents (0.1% of PDS) at a comparable cost to current operations. This is equivalent to approximately 1.4 cars.
• Currently, approximately 1% of the PDS impact results from the transport of goods between Blaine and Roseville. While the relocation of the facility will reduce the distance from 10 miles to about 1/8th of a mile, further reductions could be made by using an alternative fuel such as biodiesel for these shipments. While the overall reduction of environmental impact and associated costs would be minimal, using biodiesel would be a way to show leadership in the development of alternative fuels.
• Currently, Aveda purchases packaging material with an average of 80% post-consumer recycled (PCR) content. While this is an impressive level, the company does not have any contractual arrangements with packaging suppliers to ensure this PCR content level is maintained. While it would not offer energy or GHG reductions, it is recommended that Aveda adopt a PCR content requirement to future contracts to ensure that Aveda is getting the desired materials.
• Like many businesses, Aveda has the need to manage its inventory and accept customer returns. This requires shipping product unnecessarily around the country. In theory, if Aveda could eliminate these shipments completely, it could save 1,170,000 MJ and 95,000 kg CO2 equivalents (3.2% of PDS). However a complete reduction would be costly in terms of finances, operation and customer service levels. In light of these costs, Aveda should aim to reduce these shipments each year by a small percentage.
Section 2 – Executive Summary 11
Table ES-1 Recommendations to Reduce PDS Impact
RecommendationEnvironmental
Impact Cost Reduction Operational Feasibility
Customer Impact Overall Rating
Carbon Offsets
Utilize intermodal shipping to DCs
Ship direct to select western region retail stores
EPA SmartWay Program
Reduce loose-pick shipments / increase pallet shipments to salons
Reduce transport inefficiencies (Inventory Disposition, Out of Region Shipments, Product Returns)
Business Impact
The purpose of the recommendations is to provide Aveda with various solutions to reduce its
energy consumption and global warming impact. For business reasons, it would be difficult to
implement every recommendation; however, the recommendations illuminate areas on which
Aveda should focus its efforts. If implemented, these recommendations (excluding carbon
offsets) would reduce the PDS impact by approximately 9%, or 3.3 MM MJ and 285 metric tons
CO2 annually.
Furthermore, because it is not possible to eliminate energy use and GWP entirely using existing
technologies, carbon offsets would be the only way for Aveda to become carbon neutral.4
Purchasing carbon offsets from Native Energy, a company with which Aveda already purchases
carbon offsets, to offset the impact of the PDS under evaluation in this study would cost
approximately $8,400 annually.
FUTURE INVESTIGATIONS Aveda’s business is constantly changing to meet the demands of customers, react to competition
and reduce costs. The recommendations in this report are provided in the context of the state of
the business in early 2004 and are limited to the PDS as defined above. However, since this
project commenced, several business issues have arisen that may affect our analysis and
Section 2 – Executive Summary 12
recommendations or that are outside the scope of this project. These issues should be
considered for future study:
• Although Hawaiian shipments via air transport were modeled, Aveda has begun the transition to ocean for these shipments, which will significantly reduce the energy and GWP impact out of the LADC. As mentioned above, Aveda should complete this transition.
• Product return policy is changing due to various internal company policies. If Aveda begins shipping returned product back to its manufacturing facility, this would create additional energy consumption and GWP emissions. As Aveda continues to grow, it will need to take steps to better understand these returns by measuring the utilization of the company’s return processes and actively limiting the amount of product being transported for disposal. For example, Aveda could consider shipping returns to local product-destruction or waste-disposal sites.
• The location for the LADC could change when the facility lease expires. Aveda should consider moving the facility to a more centralized location, such as in Nevada or Colorado, to reduce cumulative transportation distance to Western region salons.
• Distributors are increasingly asking for one stock keeping unit (SKU) per pallet to facilitate warehouse management. However, this results in use of additional pallets, and potentially decreased utilization of trucks. Aveda should consider this additional impact before agreeing to this customer request.
• While Aveda has a “no-air” policy for shipping, it is believed that overnight packages via air are being shipped by various departments throughout the company. While business demands may require occasional overnight delivery, the company should make further efforts to reduce this practice, considering the fact that air transportation is approximately eight times more impactful than ground transportation.
• Single use cartons are used for loose-pick shipping in Aveda’s distribution centers. Several efforts have been made in the past to reduce this practice, but Aveda should continue exploring options for tote systems between Manufacturing and Distribution, especially in light of the new distribution center being built in 2005.
Section 3 – Introduction 13
SECTION 3 – INTRODUCTION 3.1 CONSUMER PRODUCT PACKAGING PRIMER Regardless of product type, packaging serves five purposes: to contain, inform, protect,
transport and display the product.5 The evolution of product packaging has no doubt increased
the quality of life for consumers around the world, particularly due to the ease of shipping
preserved, sterilized, and clean products. However, because packaging is intimately tied to
products used in so many aspects of life, packaging constitutes as much as one-third of the non-
industrial solid waste stream in most parts of the developed world.6 According to a 2001 report
from the U.S. Environmental Protection Agency, 73.5 MM tons of discarded containers and
packaging entered the municipal solid waste stream. Whether by weight (32.0%) or by volume
(30.0%), containers and packaging products are the dominant materials in the waste stream.7
Further, this packaging both contains a great deal of embedded energy, and requires energy to
transport it to market.
The variety of packaging can be organized into three categories:
• Primary packaging contains the product as received by the consumer (e.g., a shampoo bottle or perfume bottle).
• Secondary packaging organizes multiples of products (e.g., trays for tins of baked beans, carriers for beer bottles, and display packs) or serves as an outer wrapping that stores, informs, displays and/or protects the product (e.g., decorated carton, gift box).
• Tertiary packaging is the transport-packaging unit (e.g., corrugated cardboard cartons, wooden pallets, and plastic shrink wrap).
Personal care products (PCP) often require primary and tertiary packaging, and to some extent,
secondary packaging is used for marketing or product disclosure. Relative to secondary and
tertiary packaging, marketing and advertising groups invest considerably more effort into primary
packaging development, since it reflects the image the company wishes to portray. The contents
of a PCP bottle may only cost a few cents to manufacture, but the more elegant, ornate or
fanciful the container, the higher the manufacturing costs and disproportionately higher price.
On average, the cost of packaging soft drinks, perfumes, and cosmetics makes up 25% of the
products’ total cost, according to the Association of Plastics Manufacturing of Europe.8
Aveda has been a leader in transforming the market on PCP packaging. According to Mary
T’Kach, Executive Director, Environmental Sustainability, Aveda’s, “packaging, from an
environmental perspective, far surpasses anyone in the industry.”9 This statement is backed by
such recognition as packaging awards from the National Recycling Coalition and Cosmetic and
Personal Care Packaging magazine. Bucking the PCP industry trend where expensive,
Section 3 – Introduction 14
unsustainable packaging defines the product, Aveda has focused on providing high-quality PCPs
in elegant, environmentally conscious primary and secondary packaging.
3.1.1 EFFORTS TO REDUCE PACKAGING Through the introduction of legislation, the European Union has led the reduction of packaging
entering the waste stream. In 1992, the European Parliament and the Council of Ministers
adopted the Proposal for a Council Directive on Packaging and Packaging Waste which regulates
the prevention of packaging waste, the re-use of packaging, and the recovery and recycling of
packaging waste.10 These laws have had positive results: the Association for Sustainable Use
and Recovery of Resources in Europe reports the amount of packaging disposed in either landfill
or by incineration decreased by more than a third between 1990 and 1997 in EU member
states.11
Although the U.S. has lagged in addressing the increasing tide of packaging waste sent to
landfills, some companies have led initiatives to reduce the amount of packaging that is used to
ship and display their products. Companies like Patagonia, Nike and Microsoft have reduced both
the material intensity and size of their primary and secondary packaging, thus not only reducing
environmental impacts, but also saving money. 12 Similarly, Aveda has reduced and eliminated
secondary packaging to a great extent. For example, display cartons are used only where
product information exceeds what is available on the primary packaging.
3.1.2 EFFORTS TO INCREASE RECYCLED CONTENT From Patagonia’s fleece jackets to McDonald’s napkins and paper bags, many companies
manufacture or produce goods that contain a significant amount of post-consumer recycled
(PCR) content, thereby closing the loop on various linear material flows. Not only are these
products competitively priced, but they also perform as well as or better than conventional, non-
PCR products. In addition, such buy-recycled campaigns can bolster a company's environmental
image.13
Aveda has reduced the environmental impact of its primary and secondary packaging. In
addition to reducing the material intensity and ensuring that materials are recyclable, the
company has asked its suppliers to increase PCR content in its packaging.14 Some of Aveda’s
primary packaging contains between 80 and 100% PCR content. Aveda is also testing non-
hydrocarbon based materials for bottles and jars despite the challenges that unconventional
packaging solutions pose in terms of shelf life and end use.15
Section 3 – Introduction 15
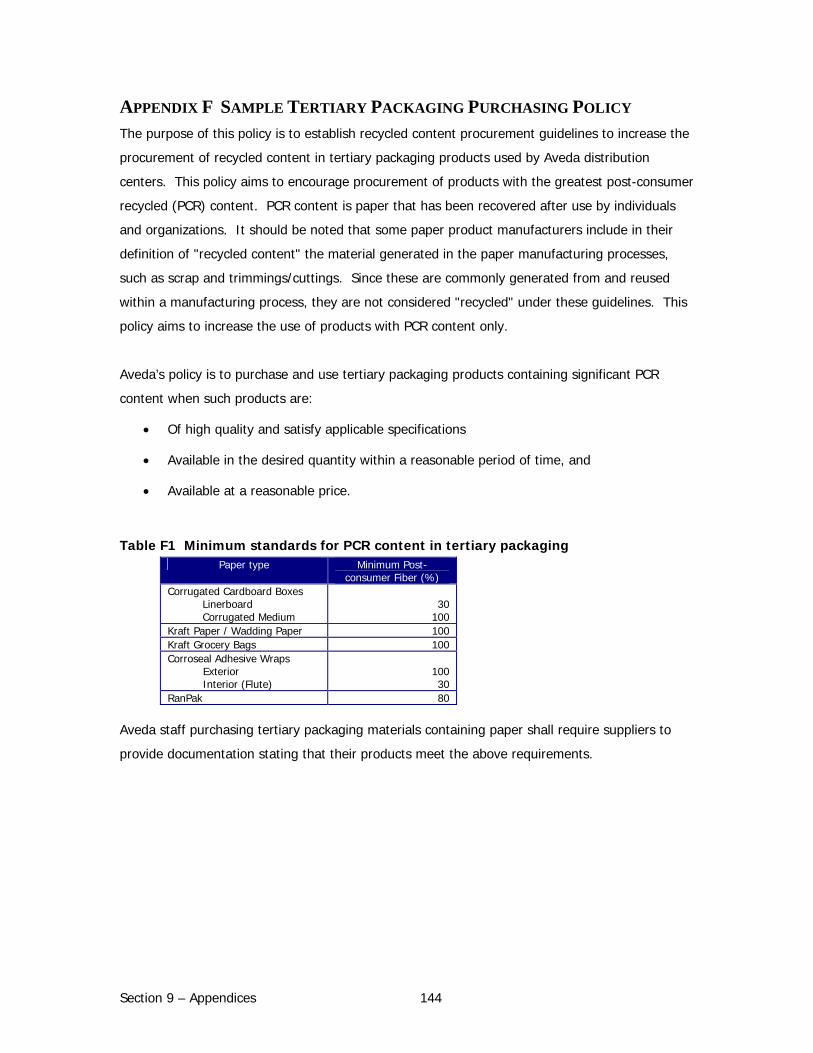
In terms of tertiary packaging, Aveda purchases pallets from Stewart’s Forest Products, a
company that sources its wood from Forest Stewardship Council (FSC) certified lands.16 There
are 10 principles and 57 criteria that address legal aspects, indigenous rights, labor rights,
multiple benefits, and environmental impacts surrounding forest management. These principles
and criteria are designed for a variety of ecological systems around the world, but FSC
encourages national working groups to adapt these principles and criteria to local ecological,
economic and social conditions. In addition to the FSC, American Tree Farm System, CSA
International, and Sustainable Forestry Initiative are three other certification organizations that
provide tools to help conserve, protect and restore the world's forests. These four organizations
vary in scope, governance and technical guidelines but all of them have the goal of continued
improvement in forest management standards and integrate environmental, social and economic
interests.17 Additionally, Aveda purchases corrugated cardboard boxes (tertiary packaging) that
contain PCR content.18
3.2 BACKGROUND ON ENERGY AND GHGS This report focuses on both energy and GHGs because they are considered the most significant
environmental impacts resulting from Aveda’s PDS and two of the most critical environmental
issues facing the world today. GHGs occur both naturally and as a result of human activities.
Natural occurring GHGs include water vapor, carbon dioxide, methane, nitrous oxide, and
ozone.19 Often, GHGs such as carbon dioxide, methane, and nitrous oxide are often elevated due
to human activities.20 The world economy’s dependence on non-renewable sources of energy
(fossil fuels) is of concern because of the inherent volatility in supply as a result of political,
social, and natural shocks as well as the finite and declining supply of such fuels. According to
the International Energy Outlook 2004, the total world consumption of commercially traded
energy will increase by 54% by 2025.21 Meanwhile, the same report from the U.S. Energy
Information Administration acknowledges that production of oil (and thus the fuel used in the
transportation of Aveda’s goods) is widely expected to peak within the next fifty years.22
Furthermore, logistics systems worldwide increasingly value speed and reliability, which favor
truck and airfreight, the most energy intensive modes of transportation.23
While energy consumption generally reflects the limited inputs required for Aveda’s PDS, the
GHGs reflect the damaging outputs resulting in the system. As fossil fuels are combusted, the
carbon stored in them is emitted almost entirely as carbon dioxide (CO2).24 CO2 accounts for
95% of GHGs from transportation.25 The release of GHGs is of concern globally because since
the beginning of the industrial revolution, atmospheric concentrations of carbon dioxide have
Section 3 – Introduction 16
increased nearly 30%, methane concentrations have more than doubled, and nitrous oxide
concentrations have risen by about 15%. These increases strongly correlate with the increases
in average global temperature recorded over that same time period.26
3.2.1 U.S. CONTRIBUTION TO GLOBAL GHG EMISSIONS The U.S. accounts for 24% of the 6,175 MM metric tons carbon equivalent (MMTCE) of total
global carbon emissions based on 1997 estimates with a population that is only 4.6 % of the
world total.27 Overall, total U.S. emissions rose by 13% from 1990 to 2002, while the U.S. gross
domestic product increased by 42% over the same period.28 As the largest source of U.S. GHG
emissions, CO2 from fossil fuel combustion has accounted for a nearly constant 80% of global
warming potential (GWP) weighted emissions since 1990.29 Emissions from this source category
grew by 17% from 1990 to 2002 and were responsible for most of the increase in national
emissions during this period.30
3.2.2 CONTRIBUTION OF TRANSPORT OF GOODS TO ENERGY AND GHG EMISSIONS The U.S. transport system is the largest in the world.31 Transport comprises the second largest
use of energy, accounting for 27% of total U.S. energy use.32 And because 97% of the energy
that powers transportation is derived from petroleum, addressing transportation must be a part
of any strategy to reduce energy consumption and GHG emissions.33 Moving freight accounts for
20% of all energy consumed in the transportation sector. Trucks carry about 66% of all freight
shipped in the US, while rail carries about 16% (water, pipeline, and air transport account for the
rest).34
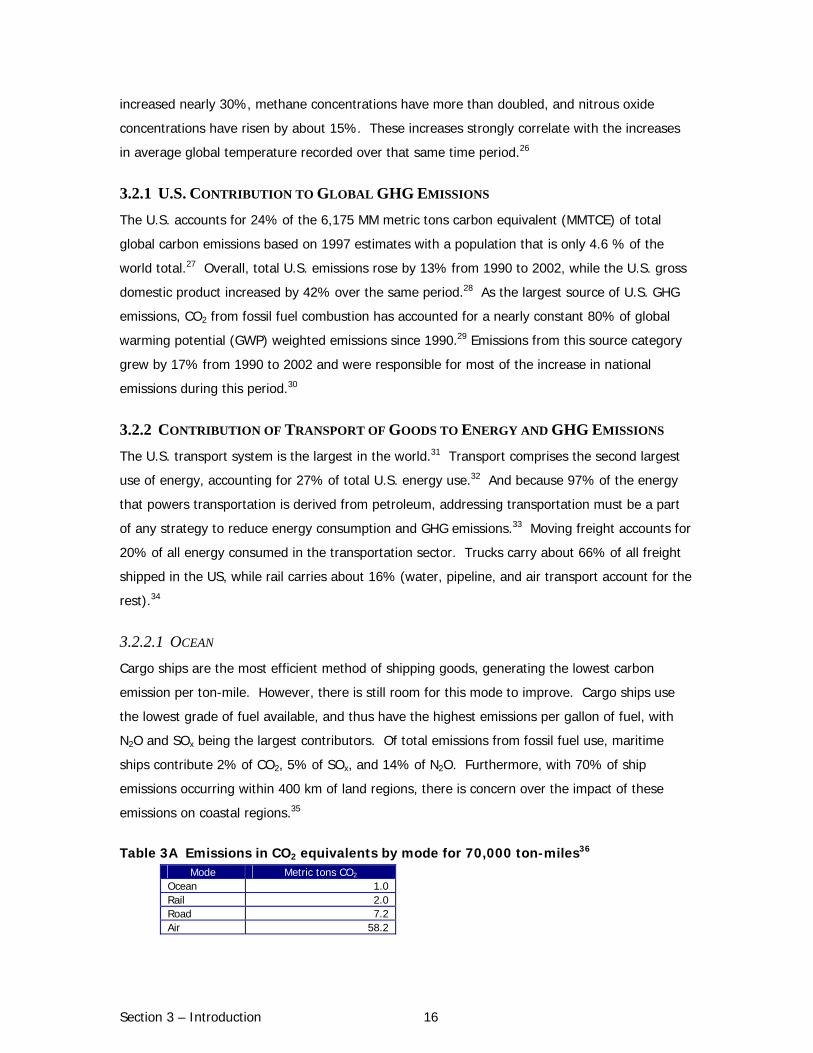
3.2.2.1 OCEAN Cargo ships are the most efficient method of shipping goods, generating the lowest carbon
emission per ton-mile. However, there is still room for this mode to improve. Cargo ships use
the lowest grade of fuel available, and thus have the highest emissions per gallon of fuel, with
N2O and SOx being the largest contributors. Of total emissions from fossil fuel use, maritime
ships contribute 2% of CO2, 5% of SOx, and 14% of N2O. Furthermore, with 70% of ship
emissions occurring within 400 km of land regions, there is concern over the impact of these
emissions on coastal regions.35
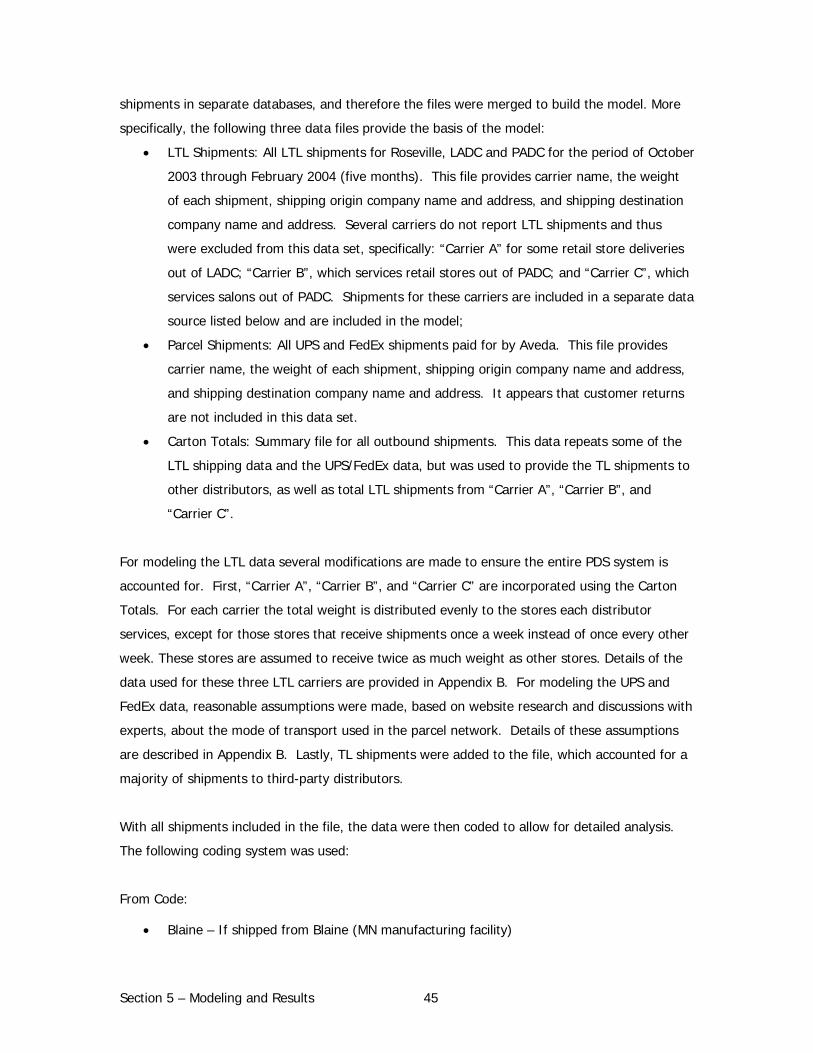
Table 3A Emissions in CO2 equivalents by mode for 70,000 ton-miles36
Mode Metric tons CO2 Ocean 1.0 Rail 2.0 Road 7.2 Air 58.2
Section 3 – Introduction 17
3.2.2.2 RAIL According to the Association of American Railroads, rail makes more efficient use of land, helps
to relieve traffic congestion in urban areas, is three times more fuel-efficient, and generates less
noise as compared to truck. 37 A single freight train can carry the load of 500 trucks. In the U.S.,
40% of freight moves via rail. Table 3A shows the differences in emissions by mode; road
creates more than 3 times the metric tons of CO2 than what is generates by using rail. If 10% of
the freight in the U.S. currently moved by trucks were shifted to rail, the U.S. could save 200 MM
gallons of fuel and 1.77 MM metric tons of CO2 emissions each year, and prevent the release of
2.86 MM tons of GHGs (2600 MM kg). 38 200 MM gallons of fuel is enough to power
approximately 398,700 automobiles in the U.S for one year (see Appendix G for conversion).
3.2.2.3 TRUCK Because truck transportation is the most flexible and very affordable, it dominates shipping in the
U.S. The trucking industry has incorporated many fuel saving technologies such as aerodynamic
cab extenders, governors on engines, and idle reduction, however there is still room for
improvement. Among all modes used to move freight throughout the U.S., trucks use the most
energy by far, at nearly 75% of total freight transportation.39
3.2.2.4 AIR Air is the most inefficient and costly of modes creating eight to ten times more emissions per ton-
mile than trucks.40 While most companies tend to avoid air shipping due to the associated high
costs, increasing pressures on inventory levels and customer service make air an environmentally
costly necessity. The industry has improved dramatically in terms of efficiency, but there is room
to improve. From 1971 to 1998, aircraft achieved a 60% reduction in energy use through both
technological and operational improvements, but it is estimated that aircraft fuel efficiency can be
improved by 20% in the short term, and up to 50% in the long term.41
3.2.3 GHG AND ENERGY ACCOUNTING SYSTEMS The quantification of energy and GHG emissions in this report relies significantly upon data
provided by Franklin Associates, which is a standard source for life cycle emissions and energy
factors.42 The specific assumptions and factors used in modeling are discussed further in the
methodology section of this report.
Energy use, for the purposes of this study, includes the energy embodied in the fuel, as well as
the energy required to mine the natural resources, refine the petroleum, and transport it into the
transportation fuel network. Energy is also embodied in the various packaging materials, and
Section 3 – Introduction 18
includes the energy used to source the materials and manufacture it into packaging as well as
the transportation into the supply chain. The energy embodied in the trucks, planes, roads and
other “downstream” activities are not included in the analysis.
GHGs, for the purposes of this study, are limited to carbon dioxide and methane. These are
generally considered the most prevalent gases resulting from the combustion and use of fossil
fuels. These GHGs are emitted through the mining, refining, and transportation of the fuel and
packaging materials, but their greatest source is from the combustion of the fuel used in
transportation. While GHGs for all of these activities is included in the analysis, it should be
noted that the majority of impact occurs through combustion of fuel.
3.3 AVEDA BACKGROUND AND BUSINESS PROFILE Horst M. Rechelbacher founded Aveda in 1978 in Minneapolis, MN with one shampoo. The
mission he created continues today to, “…care for the world we live in, from the products we
make to the ways in which we give back to society. At Aveda, we strive to set an example for
environmental leadership and responsibility, not just in the world of beauty, but around the
world.”43 A-Veda means “all-knowledge” in Sanskrit, and the company’s name stands for
sustainability and constant innovation.44
Aveda is a unit of The Estée Lauder Companies, Inc. (Estée Lauder), a $10 billion hair and body
care consumer products company. As a global company, this Minnesota-based manufacturer,
wholesaler, and retailer of hair care, skin care, makeup, perfume, and lifestyle accessories is
known for its high quality beauty products and ability to create a sensory and serene experience
at their retail stores and independent salons.
In 1997, Aveda was purchased by Estée Lauder. However, since the acquisition, Aveda’s mission
and core values have remained in tact, because a commitment to the environment is integrated
into the company’s mission and core business operations. Aveda strives to be an environmentally
sustainable company by reducing its environmental footprint through monitoring its impacts on
biodiversity, publishing annual CERES reports, and integrating conservation and sustainability
principles into ingredient sourcing and product distribution practices. Aveda regards protecting
biodiversity as one of its primary goals.
3.4 AVEDA ENVIRONMENTAL AND SOCIAL RESPONSIBILITY Aveda’s mission can be found posted throughout the company’s headquarters in Blaine,
Minnesota. It reads:
Section 3 – Introduction 19
“Our mission at Aveda is to care for the world we live in, from the products we
make to the ways in which we give back to society. At Aveda we strive to set an
example for environmental leadership and responsibility, not just in the world of
beauty, but around the world.”
According to the company, this mission, “positions Aveda as a catalyst for awareness and change
at individual and collective levels.”45 As such, Aveda promotes numerous environmental
initiatives to educate its customers about issues such as global warming, water and air pollution,
habitat protection, toxins in the environment, and waste generation. The company also attempts
to implement, “environmentally preferable business operations.”46 For these reasons, Aveda is
particularly well-situated to implement the recommendations of this project.
Organizationally, Aveda has an Executive Director, Environmental Sustainability (ED) who is
responsible for strategic environmental initiatives and who must evaluate and approve all new
products for their environmental impact. The ED is also a member of Aveda’s Executive Team.
The Environmental Sustainability (ES) group at Aveda consists of four full-time staff. ES
collaborates with other departments and organizations on projects including global GHG reporting
through the Coalition of CERES, wind energy procurement, a “no air” shipping policy, and
recycled content packaging, among many others.
Aveda has made significant progress in reducing the overall environmental impact of its tertiary
packaging. For example, Aveda has developed a relationship with Stewart’s Forest Products to
sustainably source, reuse and recycle wooden pallets. Stewart’s sources its wood from Forest
Stewardship Council (FSC) certified lands, which adhere to 10 principles and 57 criteria that
impacts surrounding forest management.47 These principles and criteria are designed for a
variety of ecological systems around the world; however, FSC encourages national working
groups to adapt these principles and criteria to local ecological, economic and social conditions.
Additionally, Stewart’s refurbishes damaged wooden pallets, thus increasing their useful life up to
ten years.
With regard to energy use and conservation, “Aveda views saving energy as an integral part of
achieving our mission.”48 The company participates in the EPA Energy Star Program, and has
taken measures to achieve energy efficiency such as upgrading roof insulation in the Blaine
facility, upgrading its steam boiler with state-of-the-art burners, and purchasing an electric cart
for grounds maintenance. According to the 2001 – 2002 CERES report, total energy use for all
Section 3 – Introduction 20
Minnesota facilities, including shipping, was 161.1 MM MJ and 168 MM MJ in 2001 and 2002
respectively. It should be noted that the methodology used in the CERES report with regard to
quantifying energy use from transportation was not comparable, nor as comprehensive as the
methodology used in this master’s project.49
In the spirit of Aveda’s mission to set an example for environmental leadership and responsibility,
the company endorses the ten principles of the Coalition for Environmentally Responsible
Economies (CERES): protection of the biosphere, sustainable use of natural resources, reduction
of waste, energy conservation, risk reduction, safe products and services, environmental
restoration, informing the public, management commitment and assessment and reporting.50
Every company that endorses CERES is obliged to produce an annual environmental report that
meets the standard of the CERES Report Form. Aveda has published four reports since 1999, the
most recent for the combined 2003 and 2004 fiscal years.
These reports, as well as interviews with company staff, reveal that Aveda has implemented
many best practices to reduce the environmental impact of its operations, including waste
reduction and increased efficiency. One of the greatest challenges the company faces is in
reducing the amount of energy and GHG emissions associated with product packaging and
transport. For example, according to the Aveda CERES 2001-2002 report, 50% of Aveda’s GHG
emissions result from transportation activities alone.
This report is not intended to replicate or refine the transportation analysis found in the CERES
report. The analysis conducted for that report is intended to provide an estimated total of energy
and GWP for reporting purposes. The purpose of this report is to provide more detailed analysis
in order to provide recommendations for areas to reduce transportation impact. Furthermore,
the methodology used by the two reports to calculate energy and GWP differed.
Energy content and carbon emissions for fuel are based off of generally accepted data published
by the Energy Information Administration. Assumptions are then made to factor for the vehicles
being used, specifically the fuel efficiency, the payload, and the utilization. Vehicle types were
primarily Class 8 tractor trailers, though a couple carriers had unique truck types, notably UPS’s
brown delivery vans. Fuel efficiency of the various trucks was based on published data and
follow-up interviews with Aveda’s carriers. Payload was assumed to be weight-limited at 35,000
lbs, and based on Aveda personnel recommendation trucks were assumed to be utilized 100% of
the time including return trips.
Section 3 – Introduction 21
In contrast, the CERES report assumed the same fuel efficiency for all trucks, estimated the
average modal split (% of shipments that travel by truck versus air or boat), assumed an 80%
utilization of trucks, and assumed an average distance for all shipments. As a result, the ratios of
shipment weight to energy and shipment weight to GWP is different between the two reports.
The CERES methodology is useful to provide an estimated footprint of the entire system, but
cannot provide analysis of the system to find inefficiencies.
This study required a compilation of research studies on packaging, transportation, and fuels.
The majority of data for packaging came from Franklin Associates (2004), and for consistency, a
second Franklin Associates study (1998) was used for primary energy factors for non-renewable
fuels. In addition, the modeling program, SimaPro (v.5.1) was used for various packaging and
transportation assumptions.51
Section 4 – Product Delivery System 22
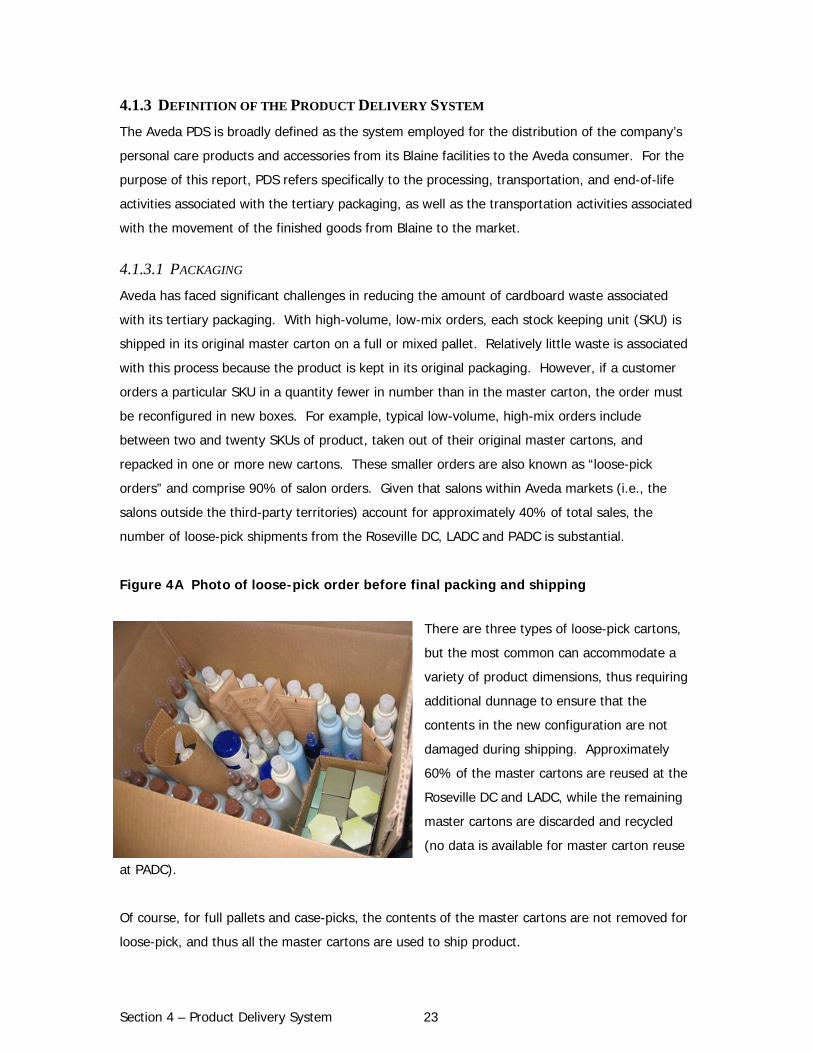
SECTION 4 – PRODUCT DELIVERY SYSTEM 4.1 INTRODUCTION TO AVEDA’S SUPPLY CHAIN 4.1.1 BROAD OVERVIEW The manufacturing operations are supported by a supply chain that is relatively complex due to
Aveda’s proprietary formulations and multi-dimensional criteria for its raw materials. Many of its
raw materials, especially its plant-based ingredients, are sourced from remote areas of the world,
including the Amazon, Southern Asia and South Pacific regions.52 Additionally, Aveda supports
ethical sourcing and organically grown products, thus limiting the number of suppliers available
for the company.
With the exception of hair colorants, hair sprays, Pure-FumeTM aromas, makeup, accessories and
life style products, which together comprise a minority of product sales, all of Aveda’s
manufacturing and filling occurs at the Blaine, Minnesota facility.53 This ISO 14001 certified
facility includes a large raw materials warehouse, compounding tanks ranging in size from 100 to
5,000 gallon tanks, and a variety of filling lines. After the product is compounded, filled, and
packaged, the products are shipped on pallets by short-haul truck to its Roseville, MN warehouse,
located 10 miles south of the Blaine facility.54 At Roseville, products are received and staged for
shipment to customers. High-volume products, such as shampoos and conditioners, are often
shipped as full pallets to Aveda’s highest volume channels, including the Los Angeles Distribution
Center (LADC), Pennsylvania Distribution Center (PADC), and eight U.S. and Canadian third-party
distributors. Smaller orders are common, particularly to the approximately 3,000 salons, spas
and retail stores throughout the U.S.
4.1.2 PROJECT SCOPE: PACKAGING AND TRANSPORTATION This study focuses on 1) the total energy and GHG emissions associated with the manufacturing,
shipping, and use activities of tertiary packaging, and 2) the total energy and GHG emissions
associated with transporting Aveda’s Blaine-manufactured products to market, including the
associated burdens with fuel sourcing, manufacturing, and use. Section 6 of this report provides
strategic recommendations on how the company can reduce its energy use and GHG emissions
associated with its PDS.
Section 4 – Product Delivery System 23
4.1.3 DEFINITION OF THE PRODUCT DELIVERY SYSTEM The Aveda PDS is broadly defined as the system employed for the distribution of the company’s
personal care products and accessories from its Blaine facilities to the Aveda consumer. For the
purpose of this report, PDS refers specifically to the processing, transportation, and end-of-life
activities associated with the tertiary packaging, as well as the transportation activities associated
with the movement of the finished goods from Blaine to the market.
4.1.3.1 PACKAGING Aveda has faced significant challenges in reducing the amount of cardboard waste associated
with its tertiary packaging. With high-volume, low-mix orders, each stock keeping unit (SKU) is
shipped in its original master carton on a full or mixed pallet. Relatively little waste is associated
with this process because the product is kept in its original packaging. However, if a customer
orders a particular SKU in a quantity fewer in number than in the master carton, the order must
be reconfigured in new boxes. For example, typical low-volume, high-mix orders include
between two and twenty SKUs of product, taken out of their original master cartons, and
repacked in one or more new cartons. These smaller orders are also known as “loose-pick
orders” and comprise 90% of salon orders. Given that salons within Aveda markets (i.e., the
salons outside the third-party territories) account for approximately 40% of total sales, the
number of loose-pick shipments from the Roseville DC, LADC and PADC is substantial.
Figure 4A Photo of loose-pick order before final packing and shipping
There are three types of loose-pick cartons,
but the most common can accommodate a
variety of product dimensions, thus requiring
additional dunnage to ensure that the
contents in the new configuration are not
damaged during shipping. Approximately
60% of the master cartons are reused at the
Roseville DC and LADC, while the remaining
master cartons are discarded and recycled
(no data is available for master carton reuse
at PADC).
Of course, for full pallets and case-picks, the contents of the master cartons are not removed for
loose-pick, and thus all the master cartons are used to ship product.
Section 4 – Product Delivery System 24
Loose-pick orders (shown in the picture above) are less efficient and more wasteful than full
pallet shipments. Not only do loose-pick orders require a significant amount of labor, but they
also generate a great deal of packaging waste. Establishing minimum order quantities could
provide solutions along economic and environmental dimensions; however, many of the smaller
salons have tight cash flows and little storage space, thus requiring them to place small quantity
orders. Furthermore, Aveda enters into service level agreements (SLA) that require the company
to provide any quantity of product within 48 hours of ordering. These SLA offer Aveda a
competitive advantage in attracting salons to the Aveda network, but in turn require the
company to maintain higher levels of inventory and use energy intense modes of shipping (i.e.,
air and truck).
4.1.3.2 TRANSPORTATION Aveda’s Transportation Network (ATN), the transportation component of Aveda’s PDS, includes
all transportation activities associated with the movement of raw materials, packaging, and
packaged goods from suppliers, manufacturing, and warehouses to the end consumer. These
activities are carried out by four modes—truck, train, air, and cargo ship. This report focuses on
ATN related to:
• Movement of packaged goods from Blaine to Roseville,
• Movement of packaged goods from Roseville to regional distribution centers, third-party
distributors, retail stores, and salons, and
• Movement of packaged goods from regional distribution centers to retail stores and
salons.
Data availability, implementation feasibility, and modeling constraints were considered in
determining the breadth of the system boundary. All aspects of primary and secondary
packaging were excluded from the life cycle inventory, however as total shipment weight was
considered in the transportation study, this will include primary and secondary packages.
International shipments were excluded from this study; these activities are significant
components of Aveda’s operations and should be assessed in future studies.
4.1.4 FUNCTION AND FUNCTIONAL UNIT
4.1.4.1 PACKAGING The function is defined as the tertiary packaging required to transport Aveda’s personal care
products and accessories to the market, which includes distributors, retailer stores, or
salons/spas. The functional unit for Phase I of this study is the amount of tertiary packaging
required to ship all products and accessories to the market over one year.55
Section 4 – Product Delivery System 25
4.1.4.2 TRANSPORTATION The function is defined as the delivery of Aveda’s personal care products and accessories to the
market, which may be a distributor, retail store, or salon.
4.2 SYSTEM MODEL OVERVIEW AND BOUNDARIES The system model overview (Figure 4A) describes Aveda’s PDS:
Section 4 – Product Delivery System 26
Figure 4B Material flow of Aveda’s products manufactured in Blaine and shipped to market via company-owned and Third-party distribution centers. The activities within the dashed-line rectangle represent the area of focus for this study. Note: The two-way flow of material in D7, D8 and D9 are within the scope of study. D3 and D19 are outside the scope of study. Additionally, the thin lines (D11, D12, D14, D15, D17, D18) represent infrequent occurrences of products being shipped “out of region” to unassigned markets.
Section 4 – Product Delivery System 27
4.2.1 FORMULATION AND COMPOUNDING These activities are outside the scope of this study.
4.2.2 PRIMARY AND SECONDARY PACKAGING AND SUPPLIERS These activities are outside the scope of this study.
4.2.3 ASSEMBLY, FILLING AND PACKING These activities are outside the scope of this study.
4.2.4 TERTIARY PACKAGING SUPPLIERS (BLAINE) Four tertiary packaging suppliers provide cardboard boxes to Blaine. These suppliers are located
within a 10 mile radius. The life cycle energy and GHG emissions associated with manufacturing
these packaging materials are included in the system model.
4.2.5 TERTIARY PACKAGING SUPPLIERS (ROSEVILLE) Two tertiary packaging suppliers provide cardboard boxes, dunnage, and plastic wrap to
Roseville. These suppliers are located in Illinois and Missouri. The life cycle energy and GHG
emissions associated with these packaging materials are included in the system model.
4.2.6 TERTIARY PACKAGING SUPPLIERS (LADC) One tertiary packaging supplier provides cardboard boxes, dunnage, and plastic wrap to LADC.
This supplier is located in California. The life cycle energy and GHG emissions associated with
these packaging materials are included in the system model.
4.2.7 TERTIARY PACKAGING SUPPLIERS (PADC) Four tertiary packaging suppliers provide cardboard boxes, dunnage, and plastic wrap to PADC.
These suppliers are located in New Jersey, Connecticut and Quebec. The life cycle energy and
GHG emissions associated with these packaging materials are included in the system model.
4.2.8 ROSEVILLE WAREHOUSE AND DISTRIBUTION CENTER, LADC, AND PADC The environmental burdens associated with operating the facilities are excluded from the scope
of this study.
Section 4 – Product Delivery System 28
4.2.9 DISTRIBUTION 1 D1 includes the transportation of tertiary packaging materials between the supplier warehouses
and the Blaine, MN manufacturing facility. All of the shipments utilize bulk trucks. A life cycle
analysis for truck manufacturing is excluded from the model.
4.2.10 DISTRIBUTION 2 D2 includes the transportation of packaged finished goods from the Blaine facility to the Roseville
warehouse, located 10 miles south of the plant. Multiple trailer loads are made each day
between Blaine and Roseville.56 The energy and GHG emissions associated with fuel sourcing,
manufacturing, and use are included in the model. A life cycle assessment of the truck sourcing
and manufacturing is excluded from the model.
4.2.11 DISTRIBUTION 3 A minority of Aveda’s products, in terms of value, are manufactured by third-party
manufacturers. D3 represents the transportation of third-party manufactured goods from various
domestic and international locations to the Roseville DC. These activities are outside the scope
of the project.
4.2.12 DISTRIBUTION 4, 5 AND 6 D4 includes the transportation of tertiary packaging materials between the supplier warehouses
and the Roseville, MN warehouse. All of the shipments utilize bulk trucks. These activities are
included in the model. However, a life cycle assessment of the truck sourcing and manufacturing
is excluded from the model.
D5 includes the transportation of tertiary packaging materials between the supplier warehouse
and the LADC warehouse. All of the shipments utilize bulk trucks. These activities are included
in the model. However, a life cycle assessment of the truck sourcing and manufacturing is
excluded from the model.
D6 includes the transportation of tertiary packaging materials between various tertiary packaging
suppliers as described in section 4.2.7 and the PADC. All of the shipments utilize bulk trucks.
These activities are included in the model. However, a life cycle assessment of the truck sourcing
and manufacturing is excluded from the model.
Section 4 – Product Delivery System 29
4.2.13 DISTRIBUTION 7, 8 AND 9 D7, D8 and D9 describe the transportation of packaged finished goods among the Roseville DC,
LADC and PADC. The predominant flow of material begins in Roseville and goes to either the
LADC or the PADC, but a small percentage of finished products are shipped back to Roseville or
between the two coastal DCs. The shipments are made predominantly by truck and infrequently
by air. These activities are included in the model. However, a life cycle assessment of the trucks
and airplanes is excluded from the model.
4.2.14 DISTRIBUTION 10, 11 AND 12 D10, D11 and D12 describe the transportation of packaged finished goods from Roseville DC to
retail stores and salons around the country. D10 represents the dominant flow of product from
Roseville, which includes shipments to retail stores in CO, FL, GA, KS, IL, KY, MA, MD, MN, MO,
MS, NO, OH, OK, RI, TN, TX, WI, VA and salons in the IA, IL, KS, MN, MO.
D11 and D12 represent infrequent shipments to markets normally serviced by the LADC and
PADC. LTL is the most common mode of transportation for all three routes. These activities are
included in the model. However, a life cycle assessment of the trucks and airplanes is excluded
from the model.
4.2.15 DISTRIBUTION 13, 14 AND 15 D13 represents the dominant flow of Aveda products from the LADC to West Coast markets,
including retail stores in AZ, CA, NV, OR and WA and salons in AZ, CA, HI, NV, OR and WA. D14
and D15 represent infrequent shipments to markets normally serviced by the Roseville DC and
PADC. LTL is the most common mode of transportation for all three routes. These activities are
included in the model. However, a life cycle assessment of the trucks and airplanes is excluded
from the model.
4.2.16 DISTRIBUTION 16, 17 AND 18 D16 represents the dominant flow of product from PADC to retail stores in CT, DE, NJ, NY, PA
and salons in the CT, DE, MA, MD, ME, NC, NH, PA, VA, VT, WV. D17 and D18 represent
infrequent shipments to markets normally serviced by the Roseville DC and LADC. LTL is the
most common mode of transportation for all three routes. A life cycle assessment of the trucks
and airplanes is excluded from the model.
Section 4 – Product Delivery System 30
4.2.17 DISTRIBUTION 19 D19 describes the transportation of Aveda products from Roseville to International distributors.
The shipments are mainly made by rail and cargo ship. Note that D19 is not included within the
scope of this study nor is the subsequent transportation from these distributors to salons and
spas.
4.2.18 DISTRIBUTION 20 AND 21 Distribution 20 and 21 describes the transportation of packaged goods from Roseville to
Canadian and U.S. third-party distributors. These shipments are almost entirely made by truck.
The transportation from these distributors to salons and spas is excluded from the model.
Canadian third-party distributors include:
• CDC-A. Serves: Alaska and British Columbia Province.
• CDC-B. Serves: Alberta Province.
• CDC-C. Serves: Ontario and Quebec Provinces
• CDC-D. Serves: Nova Scotia, Newfoundland, New Brunswick and Prince Edward Island
Provinces.
U.S. third-party distributors include:
• USDC-A. Serves: Alabama, Arkansas, Florida, Georgia, Louisiana, Mississippi, North
Carolina, Oklahoma, South Carolina, Tennessee and Texas
• USDC-B. Serves Colorado, Idaho, Montana, New Mexico, Utah and Wyoming
• USDC-C. Serves: Illinois and Wisconsin.
• USDC-D. Serves: Indiana, Kentucky, Michigan and Ohio.
4.2.19 MARKETS The environmental burdens associated with the purchase and use of Aveda’s products is excluded
from this study.
See Figure 4B for a map of North America and the specific territories managed by Aveda DCs as
well as those territories managed by third-party distributors.
Section 4 – Product Delivery System 31
Figure 4C Map of Aveda-owned and Third-party Distribution Centers in the US and Canada. The distribution channels for North America are divided between those states serviced by Aveda-owned distribution centers (Roseville DC, LADC and PADC) and states and provinces managed by third-party distributors. The states in red are managed by Aveda while the other states are managed by third-party distributors.
Roseville DC (ASI) PADC (ASI)
LADC (ASI)
CADC-C CADC-D
USDC-A
CADC-B CADC-A
USDC-B
USDC-C
USDC-D
Section 4 – Product Delivery System 32
4.3 DESCRIPTION OF ALL TERTIARY PACKAGING MATERIALS USED THROUGHOUT THE PDS Aveda uses several different types of tertiary packaging as part of its PDS, primarily corrugated
cardboard boxes, plastic stretch wrap, kraft paper, newsprint, and wooden pallets. This
packaging is used to ship products from the Blaine production facility to the three distribution
centers within the ASI network, as well as from each of the distribution centers to the salon and
retail locations. This section describes the predominant types of tertiary packaging used
throughout the PDS. A complete list of tertiary packaging materials, including material
constituents and recycled content, can be found in Appendix A.
4.3.1 SUMMARY OF FINDINGS The following data describes annual average of materials purchased by Aveda, from calendar
years 2002 and 2003 (the data provided by the packaging supplier to the PADC, however,
describes only aggregate data from 2001 through 2003, so the PADC data included below is an
annual average over these three years). The pallet data describes purchases from January 2003
to July 2004, and includes softwood pallets (42” x 48”) and hardwood, international pallets
(1000cm x 1,200cm), each type weighing 20 kg. All data have been rounded.
Table 4A Annual Average Tertiary Packaging Material Use at Aveda Facilities (Kg)
Packaging Type Total
Cardboard (including corrugated, chipboard, corroseal, cohesive, and roll cores)
546,000
Post-Consumer Cardboard 280,000 Corrugated Containers 491,000 Total Cardboard 1,317,000 Cellulose Paper 6,000 Kraft Paper 23,000 Newsprint Paper 4,000 Total Dunnage Papers 33,000 Total Plastic (including stretch wrap and bubble wrap)
7,000
Only one packaging product contains 100% virgin content: plastic stretch wrap used at Blaine
and Roseville facilities, which is made from 100% virgin LLDPE. According to Roseville staff,
Aveda has investigated various alternatives to plastic wrap, such as spray-on adhesive, metal
bands, and large rubber bands, but has been unable to identify a product with adequate
performance. Additionally, research shows that plastic stretch wrap made from recyclable
materials is not available on the market.
Section 4 – Product Delivery System 33
4.3.1.1 CARDBOARD This category includes cardboard boxes in various sizes, which are used to ship products to
customers. This category also includes self-adhesive, corrugated sheets that are used to protect
glass products.
In 2003, the Blaine facility recycled 229,000 kg of corrugated cardboard and the Roseville DC
recycled 40,600 kg of corrugated cardboard. Recycling data for 2002 was not available;
additionally, both facilities pool their resources for long periods of time thus the data includes
materials purchased in the previous year. The greater than five-fold difference between the two
facilities stems from the fact that Blaine receives larger volumes of incoming packaging supplies,
raw materials, and office supplies/equipment (note: incoming raw material/supplies to Blaine is
outside of scope, except for tertiary packaging). Few of these cardboard boxes can be reused
since they were designed to accommodate the dimensions and weight of the raw materials and
supplies, not the value and mass of Aveda finished products.
4.3.1.2 PLASTIC This category includes plastic wrap dispensed from both machine and manual sources. Material
constituents are low-density polyethylene (LDPE) and linear low-density polyethylene (LLDPE).
The plastic wrap is used to secure boxes onto pallets prior to shipment. These figures do not
include plastic packing tape, which was determined to be negligible. Note also that the LADC
uses approximately 30 kg of bubble wrap per year, which is also negligible and included in this
category.
In 2003, the Blaine facility recycled 5,000 kg of plastic wrap and the Roseville DC recycled 1,200
kg of plastic shrink wrap. As described above, recycling data for 2002 was not available;
additionally, both facilities pool their resources for long periods of time thus the data includes
materials purchased in the previous year. The greater than four-fold difference between the two
facilities stems from the fact that Blaine receives larger volumes of incoming supplies (note:
incoming raw material/supplies to Blaine is outside of scope, except for tertiary packaging).
Additionally, shrink-wrap cannot be reused.
Section 4 – Product Delivery System 34
Figure 4D Photo of Kraft Paper Dispenser at the Roseville DC.
4.3.1.3 KRAFT PAPER This category includes Kraft Paper (see
Figure 4C), RanPak, and KimPak Wadding,
which are used to fill empty space in package
shipments and to cushion products to protect
them from damage. The category also
includes paper bags in which some smaller
products are placed prior to shipment.
4.3.1.4 NEWSPRINT This category includes newsprint that is used to fill empty space and provide cushioning.
Newsprint is used at the LADC and PADC only.
4.3.1.5 PALLETS Between January 2003 and July 2004, the Blaine facility purchased on a monthly basis
approximately 800 40” x 48” softwood pallets and 200 hardwood pallets for use in domestic
shipments (hardwood is used for foreign shipments), totaling 245,000 kg on an annual basis.
This may seem relatively low; however, the company reuses all incoming pallets from suppliers
and refurbishes all pallets to increase useful life.
4.3.2 PACKAGING INTENSITY As described below, this report includes transportation data for a five month period, which has
been annualized. Note that this analysis is based on available data which includes packaging
data that is annualized from a two-year average, while the transportation data is annualized from
a five-month average.
Section 4 – Product Delivery System 35
4.4 DESCRIPTION OF AVEDA’S TRANSPORTATION NETWORK As described above, Aveda’s distribution network is complex and involves four modes of
transportation and countless nodes, including eleven distribution centers across North America.
The data provided for the analysis of the transportation network was provided by Aveda’s
transportation department, which oversees the inbound and outbound transport of products for
the three Aveda owned distributors and the outbound logistics to eight third-party owned
distribution centers in North America and eleven international DCs. The data covers the five
months from October 2003 through February 2004, which was assumed to be a representative
sample because it includes both the busy holiday season as well as the slow winter period.
Quantities have been adjusted to provide annualized estimates.
4.4.1 TRUCK The vast majority of Aveda’s products are shipped to customers via truck, which is the most
common mode of transportation for goods in the U.S.57 The major categories of shipment by
truck are parcel, Less Than Load (LTL) carrier, and Truck Load (TL) carrier.
4.4.1.1 PARCEL Over 99% of parcel shipments are via UPS. Fed-Ex is used for occasional shipments containing
products with volatile or combustible compounds such as hairspray as well as for occasional
shipments requiring overnight service. UPS and FedEx receive shipments and then transport
them to regional zone hubs where they then reorganize freight and send it out to the final
destination in the most efficient way possible while maintaining customer service levels. A more
detailed analysis of this data and the methodology used to calculate it will be provided in Section
5. PADC has the most shipments going via UPS because there is a high concentration of salons
in the Northeast that are relatively small and do not order large enough quantities to justify LTL.
UPS and FedEx shipments originating from and ending at the Blaine facility were excluded from
analysis because they are due to sales, marketing, and research activities and are outside our
project scope.
4.4.1.2 LESS THAN LOAD (LTL) AND TRUCK LOAD (TL) LTL carriers receive shipments at Aveda’s Roseville facility and manage the routing of each truck
to maximize its utilization, often reorganizing pallets of freight at a local hub. LTL carriers are
only able to accept shipments by the pallet-load; therefore Aveda uses LTL predominantly to ship
to LADC, PADC, and retail stores, but only for a minority of salon orders. TL shipments occur
Section 4 – Product Delivery System 36
when a distributor orders a large enough quantity (over 30,000 lbs or 13,600 kg) to warrant a
dedicated shipment. These shipments have the most direct routing. TL shipments are currently
limited to third-party distributors (see Table 4B) and some orders for LADC and PADC.
Aveda ships to 10 different distributors located across the US and Canada. The approximate
distances are shown below in Table 4B for each of the distributors.
Aveda determines the delivery schedule for the 130 plus retail stores it owns. Higher-volume
retail stores receive shipments on a weekly basis, while the remainder receives shipments once
or twice a month. Stores are served by the closest DC to reduce travel distance and cost.
4.4.2 AIR Aveda limits the use of air shipments to minimize costs. However, due to the nature of their
distribution system, Aveda occasionally ships via air to serve certain customers. The largest
portion of domestic air transport is utilized to serve customers in Hawaii. When the data for this
project was collected, Aveda shipped to Hawaii via air in order to provide service within 2 days.
While salons are charged a flat fee per order for shipments, Aveda spent on average $85 per
order, plus an additional $100 for hazardous (hairspray) orders. 58 Therefore, a large financial
incentive existed to shift these shipments to ocean or drastically increase the cost of shipping for
these customers. In mid-2004 Aveda began shipping to Hawaii via ocean.
4.4.3 OCEAN Aveda initiated a pilot program in June 2004 to ship orders to Hawaii by boat rather than airplane
(a similar program is in place for orders to Puerto Rico). This change in transportation mode
would increase delivery times from two days to thirteen days, but would also reduce costs by a
factor of four and significantly reduce the GHG emissions associated with shipping product to
Hawaiian and Puerto Rican customers.
Section 4 – Product Delivery System 37
It should be noted that shipping to Puerto Rico via ocean poses some unique challenges. Certain
shipments have been impounded for a variety of reasons, including paperwork not being
completed correctly and taxes not being properly reported or paid. These problems have led to
significant delays and compromised Aveda customer service levels for Puerto Rican customers.59
4.4.4 TRAIN For large orders to Asia, Aveda ships products from Roseville via rail to a container ship port in
Vancouver, British Columbia, where the cargo is loaded onto a container ship and transported to
Korea, Japan, Taiwan, Hong Kong, Malaysia, and Australia. Large orders destined for Europe are
sent by rail to a container ship port in Montreal and then shipped to Iceland, the United Kingdom,
the Netherlands, Germany or Italy. While a combination of train and ship are relatively more
efficient than truck, these transportation modes are limited to international orders, which are
outside of the scope of this project. Aveda currently does not use rail to ship products to any
destinations within the United States.
4.5 DESCRIPTION OF TRANSPORT PATHS 4.5.1 BLAINE FACILITY Aveda’s Blaine facility receives secondary and tertiary packaging material from three suppliers.
See Table 4C for the distance from each supplier to the Blaine facility. This material is
transported by truck. Blaine receives 2-3 shipments per week from Supplier A, 1 shipment every
7-10 days from Supplier B and 2 shipments per week from Supplier C. Once the product has
been packed in the secondary and tertiary packaging it is palletized and loaded onto a class 8
tractor trailer and shipped to the Roseville facility.
Table 4C Distance from Supplier to Blaine Facility
Supplier Miles to Blaine Supplier A 9 Supplier B 10 Supplier C 10
Aveda contracts the use of a truck and four trailers to ship finished, packaged product from
Blaine to Roseville, located ten miles away. Multiple truckloads are shipped per day and the
trucks return empty. The metric ton-miles per year will be reduced by approximately 98% when
Aveda replaces the Roseville DC with a new DC in Blaine, which will be located approximately 1/8
mile from the current compounding and filling operations.
Section 4 – Product Delivery System 38
All product manufactured in the Blaine facility is shipped to Roseville before it is sent to
customers. However, the Roseville facility also receives a minority of its products, in value terms,
directly from third-party vendors. The transport of these additional products from vendors to
Roseville is outside the scope of this project.
4.5.2 ROSEVILLE FACILITY The Roseville facility ships orders by truck to
two Aveda-owned DCs, to Midwest salons, to a
majority of Aveda retail stores, and to four U.S.
and four Canadian third-party distributors.
Shipments are made on full or mixed pallets
which impacts the number of pallets that can
be shipped on one truck. Mixed pallets are
composed of varying sized boxes (see Figure
4D), which often prevent stacking. For
example, an LTL carrier loaded with all mixed
pallets might only be able to carry 24 pallets;
whereas an LTL truck loaded with full pallets
can carry upwards of 38.
In addition, trucks are limited by weight
capacity laws. The maximum weight varies by
state, but Aveda ships a maximum of 35,000
pounds per truck.
At the time of writing, Aveda is building a new distribution center in Blaine, immediately down
the road from the manufacturing facility. The distance from dock-to-dock is estimated to be
approximately 1/8 of a mile. The Roseville facility will be closed a few months after the new
facility is fully operational.
4.5.2.1 DISTRIBUTION CENTERS Roseville ships processed orders to two DCs: the LADC in Southern California, which is wholly-
managed by Aveda, and the PADC in Eastern Pennsylvania, which is owned and operated by
Estée Lauder. Aveda is only 1 of 15 brands that is distributed out of the Estée Lauder PADC, and
a limited quantity of Aveda’s product is shipped direct from third-party vendors to the PADC.
Figure 4E Photo of Mixed Pallets Loaded
Section 4 – Product Delivery System 39
From the LADC, a majority of salon shipments, most of which are loose-pick, go by UPS to
roughly 800 west coast salons. The other salon shipments, most of which are loose-pick, are
transported to 20 Lifestyle Salons. The LADC also ships to 27 retail stores in California, Nevada,
and Arizona by LTL carriers and has started shipping to the 7 stores in OR and WA; the majority
of these shipments are full case. From the PADC, a majority of salon shipments go by UPS to
roughly 1,000 Northeast salons, most of which are loose-pick. The other salon shipments go to
30 Lifestyle Salons, most of which are loose-pick. PADC also ships to 18 retail stores in
Connecticut, New York, New Jersey, Pennsylvania, and Delaware by various LTL carriers, most of
which are full case.
4.5.2.2 ROSEVILLE DIRECT TO SALONS AND RETAIL Aveda ships from Roseville direct to Midwest salons and 78 retail stores in the Midwest, South,
and East. Roseville formerly shipped to the 7 stores in the Pacific Northwest; however those are
now being fulfilled out of the LADC. From Roseville, a majority of salon shipments, most of which
are loose-pick, go by UPS to roughly 700 Midwest salons. The other salon shipments, most of
which are loose-pick, go to 20 Lifestyle Salons via LTL carriers. Shipments to 78 retail stores
nationwide are by LTL, most of which are full case.
4.5.2.3 ROSEVILLE TO THIRD-PARTY DISTRIBUTION Aveda ships its product by truck, containing either full or mixed pallets, to four U.S. third-party
distributors.
4.5.2.4 ROSEVILLE TO INTERNATIONAL Aveda ships all of its international shipments out of its Roseville facility. A majority of these
shipments go by container ship and the rest go by air. While these shipments are significant, they
are excluded from the analysis in this report because international shipping options are largely
out of Aveda’s control.
4.5.3 DC-TO-DC (INVENTORY DISPOSITION) AND OUT-OF-REGION SHIPMENTS On occasion, shipments occur between DCs in order to maintain adequate levels of inventory.
This is referred to as “inventory disposition,” which is a necessary aspect of the business, given
the challenges of maintaining high customer service levels. There are several business reasons
for inventory disposition. For example, if a product is low in stock at a particular DC, and the
company is not ready to produce an additional batch in Blaine, Aveda will ship the product to that
DC from one of the other two DCs that has it in stock. Further, discontinued products (i.e.,
Section 4 – Product Delivery System 40
products that are no longer being manufactured, but still being sold), are dispersed among the
three DCs according to historic demand levels. Since these particular SKUs are not being
backfilled as they are shipped out, an uneven level of product arises across the DCs. Aveda will
often consolidate these SKUs to the Roseville DC to save space at the LADC and PADC.
Section 5 – Modeling and Results 41
SECTION 5 – MODELING AND RESULTS 5.1 INTRODUCTION Upon completion of data gathering, the PDS was modeled to determine the total energy use and
global warming potential (GWP). The models for packaging and transportation were created
separately because the packaging and transportation data was provided by Aveda in different
formats, and different software was required for each analysis. Therefore, the analysis of the
packaging and transportation data is discussed separately in this section. All data, unless
otherwise noted, is presented on an annualized basis, although the packaging data is an average
of purchases of packaging materials over the two calendar years of 2002 and 2003, while the
transportation data describes transportation from the five month period of October 2003 through
February 2004. Aveda personnel involved in this project have advised that, when annualized, the
data from these periods are representative of annual transportation activities and packaging use.
Two impact categories were modeled: global warming potential (GWP) (expressed in kg of
carbon dioxide equivalents) and primary energy use (expressed in MJ). GWP is a measure of
how much of a given mass of a certain GHG is estimated to contribute to global warming.
Carbon dioxide equivalents for a gas are calculated by multiplying the tons of the gas by the
associated GWP. The gases that affect GWP include carbon dioxide (CO2), methane (CH4), and
nitrous oxide (N2O). The GWP for CH4 is 21 and for N2O 310.60 This means that emissions of
one ton of CH4 and N2O respectively are equivalent to emissions of 21 and 310 tons of carbon
dioxide. For the purposes of this model, only CO2 and CH4 were considered because these gases
are the primary gases emitted in transportation and packaging, and constitute over 99.5% of the
impact to GWP. For further justification of the decision to model only CO2 and CH4 see Appendix
A (“Consideration of Global Warming Emissions”).
5.2 PACKAGING MODEL AND RESULTS Aveda’s packaging system was described in Section 4 of this report. This section (5.2) of the
report specifically covers modeling of Aveda’s packaging use and summarizes the data used in
the model, the major assumptions required to complete the model, and the results of the model.
A complete set of data and assumptions is provided in Appendix A.
5.2.1 PACKAGING DATA The majority of the packaging data was provided by Aveda’s records and through packaging
suppliers (see section 4.2). The distances from suppliers to Aveda facilities vary greatly and
impact the GWP and energy use (see Table 5A) to varying degrees. Blaine suppliers are located
Section 5 – Modeling and Results 42
between 7 and 21 miles from the Blaine facility, Roseville suppliers are located between 13 and
18 miles from the Roseville facility, PADC suppliers are located between 67 and 513 miles from
the PADC facility, and the LADC supplier is located 12 miles from LADC. Gaps in data were filled
with data from alternative reference sources and assumptions. To address the large number of
packages used by the Blaine facility, packaging data were summarized by type (i.e., packages of
various sizes were summed together according to the quantity purchased). See Appendix A for a
listing of all packaging data modeled.
Table 5A Packaging Suppliers Distances from Aveda-Owned DC Supplier Miles From DC
Blaine Supplier A 7 Supplier B 19 Supplier C 21 Supplier D 21
Roseville Supplier E 13 Supplier F 18
PADC Supplier G 437 Supplier H 513 Supplier I 163 Supplier J 67
LADC Supplier K 12
5.2.2 PACKAGING INPUT PARAMETERS A model of the annual impacts for production and delivery of packaging material to Aveda
manufacturing and distribution centers was developed using SimaPro (v. 5.1), a life cycle
assessment modeling software tool. The package production inventory data, national average
package composition data, and recycled content for typical packages were based on a Franklin
Associates Study conducted for the Oregon Department of Environmental Quality in 2004.61 The
annual packaging material requirements (average annual quantity purchased by each Aveda-
owned facility – Blaine, Roseville, LADC, and PADC) were entered into the model, and the total
GWP (expressed in kg of CO2 equivalents) and primary energy (expressed in MJ) were calculated
for the total packaging used at each of the Aveda facilities.
5.2.3 PACKAGING MODELING RESULTS The packaging modeling results confirmed preliminary analysis of the PDS and did not expose
any critical inefficiency in the system. Given the annual average packaging material use at Aveda
facilities, the total life cycle results were calculated. The parameters for the life cycle start with
raw materials and end when packaging supplies are delivered to Aveda facilities. The data
Section 5 – Modeling and Results 43
collected shows that Blaine uses the most cardboard per year with Roseville, PADC, and LADC
following respectively; Blaine’s usage is 75% of the total cardboard used among all Aveda
facilities. These results are somewhat surprising: one would expect the Roseville DC to use
more cardboard since it fills and packages customer orders (i.e., loose-pick, mixed pallets, etc.),
however, the packaging of the master cartons at the manufacturing facility account for more of
the total cardboard usage. Additionally, purchasing data shows that Blaine and PADC do not use
plastic (stretch wrap and bubble wrap), however, observation at the facilities confirms otherwise.
Nonetheless, the quantity of plastic used is minimal, and therefore the GWP effect would be
minor. Lastly, Roseville and Blaine account for 84% of the total annual paper used at Aveda
facilities. The extensive use of paper at Roseville stems from the dunnage associated with the
loosepick orders (by volume, paper accounts for 20 – 30% of a typical loose-pick box).62
The use of wood in this model is treated as the use of a material resource (not as a fuel, thereby
excluding wood from the energy analysis) and wood is considered carbon neutral – carbon
emissions associated with wood combustion are excluded from the global warming gas
assessment. Although the impact of pallets was not fully quantified in the analysis, Section 7.4
qualitatively explores the issues arising from the over-use of pallets in the Aveda PDS.
The Blaine Production Facility accounts for the greatest amount of GWP and primary energy use
because all manufactured products are packaged in Blaine prior to being transferred to Roseville.
Roseville uses additional packaging for the loose-pick operation (see Figure 5A). As mentioned
before, Blaine might be billed for packaging that is actually used at Roseville. Roseville and
Blaine are also supplying product to the PADC and LADCs, thus capturing some of the GWP and
energy use associated with PADC and LADC. The figure below shows the primary energy use
and GWP associated with the four Aveda-owned DCs.
Section 5 – Modeling and Results 44
Figure 5A Primary Energy Use and Global Warming Potential Associated with Aveda-Owned DCs and Blaine Production Facility
As shown above, the greatest primary energy use and GWP is associated with Blaine. Looking at
the total primary energy use from the Aveda-owned DCs, approximately 4% of the total primary
energy use (10.6 MM MJ) for annual packaging requirements is related to the transport of tertiary
packaging from suppliers and tertiary packaging materials. The remainder results from the
energy required to produce packages and acquire the associated raw materials. The graph to
the right, GWP, follows a similar pattern.
5.3 TRANSPORTATION MODEL AND RESULTS The transportation system is described in detail in Section 4 of this report. The focus of this
section is to summarize the data used for modeling, the major assumptions required to complete
the model, and the results of the model. A complete set of data and assumptions is provided in
Appendix B. The energy associated with transportation includes the energy embodied in the fuel
consumed and the energy required to source, refine and transport that fuel. Transport energy
reflects the energy required to ship products and the associated primary, secondary, and tertiary
packaging. The GWP associated with transportation includes the GHGs emitted from combustion
of fuel as well as gases emitted from the sourcing, refining and transportation of fuel.
5.3.1 TRANSPORTATION DATA The Aveda transportation team provided data in May of 2004. As mentioned in Section 4 of this
report, Aveda ships its product by Truckload (TL) and Less-than-Truckload (LTL) via a number of
various carriers, and ships parcels via United Parcel Service (UPS) and FedEx. Aveda tracks these
1.8
0.8 0.7
7.3
0.0
2.0
4.0
6.0
8.0
10.0
Blaine Roseville LADC PADC
Ener
gy
(Mil
lion
MJ)
512
10251 49
0
100
200
300
400
500
600
Blaine Roseville LADC PADC
GW
P (
Met
ric
ton
s)
Total Energy = 10.6 MM MJ Total GWP = 714 Metric Tons
Section 5 – Modeling and Results 45
shipments in separate databases, and therefore the files were merged to build the model. More
specifically, the following three data files provide the basis of the model:
• LTL Shipments: All LTL shipments for Roseville, LADC and PADC for the period of October
2003 through February 2004 (five months). This file provides carrier name, the weight
of each shipment, shipping origin company name and address, and shipping destination
company name and address. Several carriers do not report LTL shipments and thus
were excluded from this data set, specifically: “Carrier A” for some retail store deliveries
out of LADC; “Carrier B”, which services retail stores out of PADC; and “Carrier C”, which
services salons out of PADC. Shipments for these carriers are included in a separate data
source listed below and are included in the model;
• Parcel Shipments: All UPS and FedEx shipments paid for by Aveda. This file provides
carrier name, the weight of each shipment, shipping origin company name and address,
and shipping destination company name and address. It appears that customer returns
are not included in this data set.
• Carton Totals: Summary file for all outbound shipments. This data repeats some of the
LTL shipping data and the UPS/FedEx data, but was used to provide the TL shipments to
other distributors, as well as total LTL shipments from “Carrier A”, “Carrier B”, and
“Carrier C”.
For modeling the LTL data several modifications are made to ensure the entire PDS system is
accounted for. First, “Carrier A”, “Carrier B”, and “Carrier C” are incorporated using the Carton
Totals. For each carrier the total weight is distributed evenly to the stores each distributor
services, except for those stores that receive shipments once a week instead of once every other
week. These stores are assumed to receive twice as much weight as other stores. Details of the
data used for these three LTL carriers are provided in Appendix B. For modeling the UPS and
FedEx data, reasonable assumptions were made, based on website research and discussions with
experts, about the mode of transport used in the parcel network. Details of these assumptions
are described in Appendix B. Lastly, TL shipments were added to the file, which accounted for a
majority of shipments to third-party distributors.
With all shipments included in the file, the data were then coded to allow for detailed analysis.
The following coding system was used:
From Code:
• Blaine – If shipped from Blaine (MN manufacturing facility)
Section 5 – Modeling and Results 46
• Roseville – If shipped from Roseville (MN distribution facility).
• LADC – If shipped from the LADC
• PADC – If shipped from the PADC
• Retail – If shipped from one of the listed retail stores provided by Aveda
• Salon – If shipped from a salon. Salons were identified by a list of Aveda Services Inc. serviced salons and through the online salon directory at Aveda.com.
• Third-party US – If shipped from one of the third-party U.S. distributors
• Third-party CA - If shipped from one of the third-party Canadian distributors
To Code:
• Blaine – If shipped to Blaine (MN manufacturing facility)
• Roseville – If shipped to Roseville (MN distribution facility).
• LADC – If shipped to the LADC
• PADC – If shipped to the PADC
• Retail – If shipped to one of the listed retail stores provided by Aveda
• Salon – If shipped to a salon. Salons were identified by a list of Aveda Services Inc. serviced salons and through the online salon directory at Aveda.com.
• US DC – If shipped to one of the third-party U.S. distributors
• CA DC - If shipped to one of the third-party Canadian distributors
Shipment data for LTL and TL did not include the shipping distance, but instead included the
origin and destination zip codes. Therefore, driving distance was calculated using the online
service Mapquest.com as well as by calculating distance based on the coordinates of each zip
code. The methodology for determining distance is provided in detail in Appendix B.
5.3.2 TRANSPORTATION INPUT PARAMETERS Modeling the energy and GWP impacts of transportation requires the use of many industry
standards, notably for the fuel and vehicle characteristics. A detailed overview of the various
assumptions and parameters used for modeling is included in Appendix B, but the following (also
mentioned in Section 3) provides a summary.
Section 5 – Modeling and Results 47
Energy content and carbon emissions for fuel are based off of generally accepted data published
by the Energy Information Administration. Assumptions are then made to factor for the vehicles
being used, specifically the fuel efficiency, the payload, and the utilization. Vehicle types were
primary Class 8 tractor trailers, though a couple carriers had unique truck types, notably UPS’
brown delivery vans. Fuel efficiency of the various trucks was based on published DOT data and
follow-up interviews with Aveda’s carriers. Payload was assumed to be weight-limited at 35,000
lbs, and trucks were assumed to be utilized 100% of the time including return trips.
Global warming potential values for CO2 and CH4 are taken as reported by the Intergovernmental
Panel on Climate Change’s (IPCC) Third Assessment Report.63 Franklin Associates estimates for
the combustion of fuel have been used for consistency with packaging model calculations.64 Fuel
combustion impacts, including CO2 and CH4 emissions resulting from fuel combustion (including
upstream), crude oil extraction requirements, total primary energy, and total global warming
Four types of trucks are predominant in the PDS and are thus used in this model; tractor trailers,
dual trailers, straight trucks, and parcel delivery trucks. The fuel efficiency of trucks are as
published by Davis and Diegel.65 The majority of LTL and TL carriers use standard tractors with
53-foot trailers, which are classified by the DOT as “class 8” trucks or “tractor trailers”. Some
carriers use standard tractors with dual 28-foot trailers, which are also classified by DOT as “class
8” trucks, but for purposes of this model are assumed to have a larger payload. A couple carriers
use “straight trucks” which are classified as “Class 7” by the DOT. Lastly, the “brown trucks”
used by UPS, are assumed to be “class 2” trucks/vans. When additional data is unavailable, all
transportation and product delivery operations are modeled assuming class 8 trucks are used for
the full delivery distance. Generally these vehicles are used for the vast majority of
transportation distances for the carriers studied. Exceptions are noted in Appendix B.
Shipments to Puerto Rico are assumed to travel by class 8 trucks to Miami then by boat to Puerto
Rico. Puerto Rico salons are responsible for arranging to pick up products from the Puerto Rico
Section 5 – Modeling and Results 48
port in San Juan. Fuel consumption rates and payload for ocean freight are as stated by the U.S.
Maritime Administration.66
5.3.3 TRANSPORTATION MODELING RESULTS The total annualized energy and GWP from PDS transportation is 25.8 MM MJ and 2,097 metric
tons of CO2 equivalents respectively. The impact from shipments leaving the Roseville facility is
much larger (18.63 MJ, 1,532 GWP, 73% of total) than the other distribution centers (see Figure
5B). Due to the addition of stores and salons, Roseville ships inventory to the LADC, PADC and
the eight third-party distributors in North America. Shipments out of the LADC and PADC are for
retail and salon orders as well as a small quantity of inter-distributor inventory shipments.
Shipments out of Blaine represent the transportation from Blaine manufacturing to the Roseville
Distribution warehouse, approximately ten miles. Shipments labeled “Other” represent third-
party distributors to Roseville, or salons and retail to either LADC or PADC.
Figure 5B Total Annualized Transportation Energy and GWP For Products Leaving Aveda-Owned DCs67
Figure 5C, below, illustrates shipments to retail and salon only. The total impact from retail
shipments, indicated by the lower portions of the bars, is 3.1 MM MJ and 255 metric tons CO2
equivalents. Roseville constitutes a majority of the impact (2.51 MJ, 207 GWP, 81%) reflecting its
fulfillment of about 78 of the 130 stores including stores in distant locations like Florida, Texas,
and Massachusetts. The total impact from salon shipments, indicated by the upper portions of
the bars, is 6.77 MM MJ and 530 metric tons CO2 equivalents. The significant impact of salon
orders out of LADC (4.18 MJ, 310 GWP, 62%) is driven largely by air shipments to Hawaii, which
14631 2
386
1,532
-
500
1,000
1,500
2,000
Rose
ville
LADC
PADC
Blaine
Other
Shipments Leaving Facility
GW
P (m
etric
tons
CO
2 eq
uiva
lent
s)
5.00
1.770.37 0.03
18.63
0
4
8
12
16
20
Roseville LADC PADC Blaine Other
Shipments Leaving Facility
Ener
gy (M
illio
n M
J)
Section 5 – Modeling and Results 49
are 10 times greater impact on a per “lb-mile” basis as traditional LTL shipments. As shown by
the alternate line, if Hawaiian orders were shipped via ocean, the salon impact would be in line
with the other distribution centers (1.23 MM MJ and 102 metric tons CO2). The majority of the
impact out of PADC is due to salon orders (1.51 MJ, 124 GWP, 22% of total PADC) because that
distribution center only delivers to 18 retail stores, all of which are in close proximity (New York
City, part of PA, CT and DE), whereas it delivers to over half of the salons in the ASI network.
Figure 5C Total Annualized Transportation Energy and GWP To Retail and Salon For Distribution Centers
Figure 5D, below, illustrates transportation impact for shipments out of the three distribution
centers on a per kg basis. Total impact is driven primarily by mode of transport and distance
shipped. Because LADC services Hawaii, shipments made by air, LADC salon impact is far greater
than any other PDS transport impact (4.4 MM MJ, 0.33 metric tons CO2 equivalents, 17% of total
transport impact). Again, the alternative line shows that the impact out of LADC would be in line
with the other distribution centers if Hawaiian orders were shipped via ocean, though still greater
due to the long distance to Hawaii (1.3 MM MJ and 0.11 metric tons CO2). Additionally, retail
shipments out of Roseville account for more impact than salon orders even though there are only
78 stores compared to about 400 salons serviced out of Roseville. As mentioned earlier, this
results from Roseville servicing retail stores in distant markets such as Florida.
2.51
0.51
1.08
1.51
0.07
4.18
-
1.00
2.00
3.00
4.00
5.00
Roseville LADC PADC
Shipments Leaving Facility
Ener
gy
(Mil
lion
MJ)
Retail Salon
207
42
88
124
6
318
-
100
200
300
400
Roseville LADC PADC
Shipments Leaving Facility
GW
P (
met
ric
ton
CO
2
equ
ival
ents
)
Retail Salon
1.23 102
Section 5 – Modeling and Results 50
Figure 5D Weight-Based Transportation Energy and GWP for each DC
Figure 5E, below, illustrates weight-distance based impact of transportation out of each
distribution center. LADC constitutes both the greatest salon impact (4.1 MM MJ, 0.32 MM metric
tons CO2 equivalents, 8.5% of total salon impact) and the greatest retail impact (1.1 MM MJ,
0.09 MM metric tons CO2 equivalents, 30% of total retail impact).
Figure 5E Weight-Distance-Based Transportation Energy and GWP per DC
From several conversations with Aveda representatives, the routing of LTL and parcel
(UPS/FedEx) trucks is comparatively direct.68
However, the parcel network generally uses more
1.5
0.7
0.1
0.9 0.9
4.4
-
1
2
3
4
5
Roseville LADC PADC
Shipments Leaving Facility
Ener
gy (M
J pe
r kg
ship
ped)
Retail Salon
0.12
0.06
0.01
0.08 0.07
0.33
-
0.1
0.2
0.3
0.4
Roseville LADC PADC
Shipments Leaving Facility
GW
P (k
g C
O2
per k
g sh
ippe
d)Retail Salon
0.111.3
0.9 1.1 1.01.5
4.1
2.9
0
1
2
3
4
5
Roseville LADC PADC
Shipments Leaving Facility
Ener
gy (M
J pe
r met
ric-t
on-k
m)
Retail Salon
0.12
0.32
0.24
0.080.09 0.08
-
0.1
0.2
0.3
0.4
Roseville LADC PADC
Shipments Leaving Facility
GW
P (k
g C
O2
per m
etric
ton-
km)
Retail Salon
1.2 0.10
Section 5 – Modeling and Results 51
hub locations resulting in the average shipments encountering more stops and a slightly longer
route than an LTL shipment. For example, a shipment from Roseville to Ypsilanti, Michigan
would go through a hub in Chicago and then Ann Arbor, while an LTL shipment might only stop
in Chicago. Therefore, there is a slight advantage to using LTL in order to reduce the distance
packages travel. This advantage results from differences in mode and efficiency (e.g. Use of low
volume delivery trucks for parcel or use of air shipment for some parcel orders). Again, the LADC
salon figure is heavily impacted by the higher impact air shipments, but are in line with the
Roseville DC when Hawaiian orders are shipped via ocean. The higher impact of PADC salon
orders is due to the fact that a larger proportion of the trips are spent on inefficient UPS “brown
trucks”.
In addition to shipments to distributors, retail stores and salons, there are also shipments among
distributors that are not standard (see Figure 5F). These shipments result in a total annualized
energy impact of 532,000 MJ and a total GWP impact of 43,600 kg CO2 equivalents. These
shipments have been explained by Aveda personnel as inventory disposition (re-aligning
inventory among distributors), other non-recurring events, and consolidation of low-running
SKUs. While these shipments account for just 2% of total transport energy and GWP, they are
essentially pure waste. For comparison, the total impact of LADC to Retail shipments is 507,000
MJ and 41,700 kg CO2. This inefficiency is actually higher to reflect the un-needed original
shipments to that facility. If these shipments were accounted for, the impact would be 1,050,000
MJ and 86,300 kg CO2 equivalents, or 4% of the PDS similar to the 1,054,000 MJ and 86,120 kg
CO2 equivalents required to transport shipments from Roseville to Central region salons.
Section 5 – Modeling and Results 52
Figure 5F Annualized Energy and GWP Impact From Inter-Distributor Shipments
The data provided by Aveda also appears to show customer returns via LTL carriers. Discussions
with Aveda personnel indicate that there are more significant quantities of returns via UPS, on
the order of several packages per day, however they were not reported in the data provided for
this project. Again, these shipments are pure waste, and when the data are doubled to account
for incorrectly sending the packages to the customer, as shown in Figure 5G, the impact is 6,870
MJ and 566 kg CO2 equivalents.
188,000
23,400 7,800 4,000 1,600 300
522,000
307,000
-
100,000
200,000
300,000
400,000
500,000
600,000
Inve
ntor
ySt
ocki
ng
LAD
C t
oR
osev
ille
PAD
C t
oR
osev
ille
3rd
Part
y U
Sto
Ros
evill
e
LAD
C t
oPA
DC
PAD
C t
oLA
DC
PAD
C t
o 3r
dPa
rty
US
3rd
Part
yC
anad
a to
Ros
evill
e
Ener
gy (
MJ)
15,000
1,900 600 300 100 20
25,200
43,000
-
10,000
20,000
30,000
40,000
50,000
Inve
ntor
ySt
ocki
ng
LAD
C t
oR
osev
ille
PAD
C t
oR
osev
ille
3rd
Part
y U
Sto
Ros
evill
e
LAD
C t
oPA
DC
PAD
C t
oLA
DC
PAD
C t
o 3r
dPa
rty
US
3rd
Part
yC
anad
a to
Ros
evill
e
GW
P (
kg C
O 2)
Section 5 – Modeling and Results 53
Figure 5G Annualized Energy and GWP Impact of Customer Returns
Shipments by air have a large impact on energy and GWP due to the high consumption of fuel.
In the data provided by Aveda, all shipments to Hawaii traveled by air. However, since this
project began, Aveda has switched most of its Hawaiian shipments to ocean which has
dramatically reduced the impact of these shipments. While Hawaiian shipments out of LADC
account for just 3% of weight (59 metric tons), they account for 64% of energy (3 MM MJ) and
61% of GWP (222 metric tons CO2 equivalents). As seen in Figure 5H, the energy impact on a
per kg shipped basis for Hawaiian air shipments is 46-times greater than non-air shipments (and
a 37-times greater GWP impact). As noted in Section 3, air is about eight times more impactful
on a weight-distance basis than truck. Section 7 of this report will further explore the impact of
switching these shipments to ocean.
Figure 5H Energy and GWP Impact of Air Shipments from LADC to Hawaii
6,100
770
-
1,000
2,000
3,000
4,000
5,000
6,000
7,000
Salon to LADC Retail to PADC
Ener
gy
(MJ)
502
64
-
100
200
300
400
500
600
Salon to LADC Retail to PADC
GW
P (
kg C
O2
equ
ival
ents
)
50.8
1.10.0
10.0
20.0
30.0
40.0
50.0
60.0
LADC to HI LADC - Other
Ener
gy
(MJ/
kg s
hip
ped
)
0.1
3.7
0.0
1.0
2.0
3.0
4.0
LADC to HI LADC - Other
GW
P (k
g CO
2/k
g sh
ippe
d)
Section 5 – Modeling and Results 54
Additional shipments via air are shown in Figure 5I. It is unclear why these shipments occurred
considering the company’s “no-air” policy; however Aveda personnel indicated that on seldom
occasions a customer will require overnight service. The impact from these shipments is 72,500
MJ and 5,380 kg CO2 equivalents.
Figure 5I Energy and GWP Impact of Air Shipments Excluding Hawaii
9,250 7,8004,680
1,520 90 7
38,700
10,500
-
10,000
20,000
30,000
40,000
50,000
Roseville toSalon
LADC toSalon (not
HI)
Roseville toRetail
LADC toPADC
Roseville toPADC
Roseville toLADC
Roseville to3rd Party
US
PADC toSalon
Shipping Route
Ene
rgy
(MJ)
574348
113 7 1
2,870
776 686
-
1,000
2,000
3,000
Roseville toSalon
LADC toSalon (not
HI)
Roseville toRetail
LADC toPADC
Roseville toPADC
Roseville toLADC
Roseville to3rd Party
US
PADC toSalon
Shipping Route
GW
P (
kg C
O2 e
quiv
.)
Section 5 – Modeling and Results 55
5.4 SUMMARY OF PACKAGING AND TRANSPORT IMPACT The total combined, annualized energy and GWP for packaging and transportation in the PDS,
illustrated below in Figure 5J, is 36.5 MM MJ and 2,811 metric tons of CO2 equivalents
respectively. The proportion of energy and GWP due to transportation is 70% and 74%
respectively, and for packaging 30% and 26% respectively. This energy use is approximately
equivalent to the same amount of energy in 275,000 gallons of gasoline, and the GWP is
approximately equivalent to the GWP contribution of 500 automobiles over the course of one
year.69
Figure 5J Total PDS Energy and GWP Impact
25.8
10.6
0
5
10
15
20
25
30
35
40
Energy
Ene
rgy
(Mill
ion
MJ)
2,097
714
-
500
1,000
1,500
2,000
2,500
3,000
GWP
GW
P (m
etric
ton
of C
O2
equi
vale
nts) 2,81136.4
Packaging
Transportation
Packaging
Transportation
Section 6 – Recommendations 56
SECTION 6 – RECOMMENDATIONS Through extensive interviews, three site visits, and many iterations of modeling, the University of
Michigan team has developed eight primary recommendations. Several other secondary
recommendations are discussed in Section 7. Neither section 6 recommendations nor section 7
secondary recommendations are presented in any priority order, however an ordered list is
provided at the end of this section.
6.1 RECOMMENDATION 1 - SHIP DIRECT FROM ROSEVILLE TO ALL RETAIL STORES OR TO SELECT WESTERN REGION RETAIL STORES ONLY 6.1.1 PROBLEM DEFINITION Aveda’s retail network is composed of 130 Aveda owned stores. Aveda’s LADC, located in
Southern CA, services 34 western region retail stores including stores in Arizona, Nevada, and
California and as of late 2003 it also services stores in Oregon and Washington. Aveda’s PADC,
located in Eastern PA, services 18 eastern region retail stores in the states of Connecticut, New
Jersey, New York, Pennsylvania, and Delaware. The Roseville DC ships to 78 stores in the
Midwest and South, and a few stores on the east coast.
Figure 6A Map of existing retail distribution system
Rationale for this transport system is based on the premise that three regional distribution
centers allow for superior customer service levels and allow Aveda to secure inexpensive
transport contracts for shipments from Roseville to LADC and PADC via contracted carrier.
Roseville DC (ASI)
PADC (ASI)
LADC (ASI)
Section 6 – Recommendations 57
However, use of these regional distribution centers increases the total shipping distance--because
the routes are indirect--and therefore the environmental impact of getting product to market.
For example, the Aveda retail store located in the Scottsdale, Arizona Fashion Square Mall orders
weekly from the LADC. The product travels from the Roseville DC to LADC (1,825 miles) where it
is held as inventory, and then from LADC to Scottsdale, AZ (391 miles) for a total 2,216 miles. A
direct Roseville to Scottsdale shipment (1,835 miles) would reduce vehicle miles by approximately
17%.
6.1.2 PROPOSED SOLUTION Aveda can reduce mileage associated with indirect shipping by shipping directly from Roseville to
all retail stores (Scenario A), or by shipping direct from Roseville to select retail stores in the
western region (Scenario B). Scenario A provides the greatest environmental benefit but costs
approximately 25% more than the current distribution system. Scenario B provides nearly the
same environmental benefit as Scenario A, is slightly more feasible operationally, and is
comparable to current costs. In both scenarios, Roseville would continue to service its current
retail stores.
Scenario A
Scenario A would entail shipping direct from Roseville to all retail stores in the LADC and PADC
region (Figure 6B). This scenario provides the greatest reduction in Energy and GWP because it
suggests the most direct routes.
Section 6 – Recommendations 58
Figure 6B Scenario A Map of the direct routes from Roseville to all retail stores
The following benefits are associated with Scenario A:
• Most direct routes, fewest vehicle miles, lowest environmental impact
• Reduction of inventory disposition (particularly of low running SKUs) resulting from centralized distribution in Roseville
• Significant reduction or elimination of return shipments of obsolete products to Roseville distribution center
• Fewer damaged products associated with additional loading/unloading at distribution centers
• Shifted capacity utilization to the new Blaine facility where excess capacity will exist
• Low customer impact
Scenario A Mileage Distribution
As figure 6C and 6D illustrate below, current system mileage associated with shipping product to
34 retail stores in the western region is significantly higher for each store than it is under the
direct shipping of Scenario A. However, mileage reduction is concentrated in the 24 WA, OR, AZ,
NV, and Northern CA stores. These 24 stores account for 96% of the mileage reduction (16,374
miles) and the remaining 10 Southern CA stores account for only 4% (672 miles). Top impact
store is River Park Square in Spokane, WA (Store #735) which currently requires shipping
product 56% greater distance than if materials were shipped direct from Roseville. Even the
Stoneridge Mall store in Pleasanton, CA, the 23rd least efficient store, currently requires shipping
Roseville DC (ASI)
PADC (ASI)
LADC (ASI)
Section 6 – Recommendations 59
product 11% greater distance than if there was a direct to retail system. However, for stores in
Southern CA, such as the Century City Los Angeles store (# 737), Scenario A reduces mileage by
only about 1%.
Figure 6C Western region comparison of current system mileage vs. Scenario A (stores 1-13)
-
500
1,000
1,500
2,000
2,500
3,000
3,500
Spok
ane,
WA
(735
)
Bel
levu
e, W
A (70
0)
Seat
tle,
WA (74
3)
Seat
tle,
WA (70
1)
Lynn
woo
d, W
A(7
07)
Port
land
, OR (70
3)
Port
land
, OR (71
0)
Tucs
on, A
Z (7
17)
Las
Veg
as, N
V(7
15)
Tucs
on, A
Z (7
25)
Phoe
nix,
AZ
(709
)
Scot
tsda
le, A
Z(7
23)
Cha
ndle
r, A
Z (7
38)
Tota
l Dis
tanc
e (m
iles)
Current Scenario A
Figure 6D Western region comparison of mileage for current system vs. Scenario A (stores 14-34)
-
500
1,000
1,500
2,000
2,500
3,000
3,500
Ros
evill
e, C
A (
726)
Cor
te M
ader
a, C
A (
742)
Con
cord
, CA
(70
5)
Ber
kele
y, C
A (
741)
San
Fran
cisc
o, C
A (
704)
San
Fran
cisc
o, C
A (
716)
San
Fran
cisc
o, C
A (
733)
Wal
nut
Cre
ek, C
A (
744)
San
Mat
eo, C
A (
736)
Plea
sant
on, C
A (
718)
Sant
a C
lara
, CA
(73
1)
Palm
Des
ert,
CA
(74
0)
San
Die
go, C
A (
720)
Bre
a, C
A (
739)
Mis
sion
Vie
jo, C
A (
734)
Cos
ta M
esa,
CA
(72
4)
Gle
ndal
e, C
A (
721)
Sant
a B
arba
ra, C
A (
722)
Hol
lyw
ood,
CA
(72
8)
Los
Ang
eles
, CA
(70
8)
Los
Ang
eles
, CA
(73
7)
Tota
l Dis
tanc
e (m
iles)
Current Scenario A
Section 6 – Recommendations 60
As figure 6E illustrates below, current system mileage associated with shipping product to 18
retail stores in the eastern region is slightly higher for each store than that of Scenario A.
However, unlike in the LADC region, in the PADC region, impact is more evenly distributed with
all 18 stores contributing similar inefficiencies to the network. Top impact store is Christiana Mall
in Newark, Delaware which currently requires shipping product 7% greater distance than it would
in a direct shipping model, and the most efficient store is Willowgrove, PA which requires
shipping product 3% greater distance than it would in a direct shipping model (Figure 6E).
Figure 6E PADC Region comparison of mileage for current system vs. Scenario A
-
500
1,000
1,500
2,000
2,500
3,000
3,500
Man
ches
ter,
CT
(912
)
Farm
ingt
on, C
T(9
24)
Whi
te P
lain
s, N
Y(9
40)
Gar
den
Cit
y, N
Y(9
42)
Para
mus
, NJ
(941
)
New
Yor
k, N
Y (9
34)
New
Yor
k, N
Y (4
51)
New
Yor
k, N
Y (4
52)
New
Yor
k, N
Y (9
44)
New
Yor
k, N
Y (4
53)
New
Yor
k, N
Y (4
23)
Shor
t H
ills,
NJ
(943
)
New
ark,
DE
(909
)
Edis
on, N
J (9
33)
Phila
delp
hia,
PA
(935
)
Che
rry
Hill
, NJ
(926
)
Exto
n, P
A (
915)
Will
owgr
ove,
PA
(914
)
Tota
l Dis
tanc
e (m
iles)
Current Scenario A
Scenario B
Scenario B entails shipping direct from Roseville to retail stores in WA, OR, NV, AZ, and Northern
CA (Figure 6F). Scenario B is a modified version of Scenario A. Instead of shipping all retail stores
direct, as Scenario A specifies, Scenario B specifies that only stores which are cost effective and
high impact environmentally are shipped direct from Roseville (See section 6.1.3 for
environmental impact, and 6.1.4.1 for cost).
Section 6 – Recommendations 61
Figure 6F Scenario B-Direct from Roseville to WA, OR, NV, AZ, and Northern CA stores
The following benefits are associated with Scenario B:
• Significantly reduced vehicle miles and environmental impact
• Relative ease of implementation. Network can operate in a very similar manner as current network.
• Reduction in inventory disposition (particularly low running SKUs) resulting from centralized distribution in Roseville
• Some reduction of return shipments of obsolete products to Roseville distribution center
• Fewer damaged products associated with additional loading/unloading at distribution centers, resulting in fewer damaged goods
• Shifted capacity utilization to the new Blaine facility where excess capacity exists
• Low customer impact
• Comparable cost
Scenario B Mileage Distribution
Routing for Scenario B is the same as the current state for all stores in the Eastern region and in
Southern CA; direct shipping to these stores is not cost or environmentally effective (See section
6.1.1). As documented in Figure 6C and 6D for Scenario A, shipping to stores in WA, OR, AZ, NV
and Northern CA directly reduces mileage by as much as 57%.
Roseville DC (ASI)
PADC (ASI)
LADC (ASI)
Section 6 – Recommendations 62
6.1.3 ENVIRONMENTAL IMPACT: As stated in section 5.3, the annual energy consumption of Aveda’s entire transportation
component of the PDS system is 25.8 MM MJ and the total Global Warming Potential is 2,097
metric tons CO2. The retail portion of energy consumption in the transportation component of the
PDS system is 6.33 MM MJ (24.5% of total transportation energy) and GWP is 522 metric tons
CO2 (24.5% of total transportation CO2). Scenario A would provide a reduction of 8% in Energy
and GWP compared to the current total retail network, while Scenario B would provide a
reduction of 7% in Energy and GWP (Figures 6G and 6H).
As mentioned above, Scenario A includes direct shipment to all retail stores in the Aveda PDS.
Scenario B uses the current PADC system for eastern region retail stores, the current LADC
system for Southern California stores, and direct shipping to Washington, Oregon, Arizona,
Nevada and Northern California stores.
Figure 6G Energy consumption of total retail distribution system under current system, Scenario A, and Scenario B
3,234,000
5,817,000
3,938,000
3,095,000 1,957,000
-
-
1,000,000
2,000,000
3,000,000
4,000,000
5,000,000
6,000,000
7,000,000
8,000,000
Total Retail - Current Total Retail - Scenario A Total Retail - Scenario B
Ener
gy (
MJ)
Ros
evill
e to
LA
DC
/PA
DC
Hub
to
Stor
es
Scenario A:512,000 MJ, 8% reduction
6,329,0005,895,000
Scenario B:434,000 MJ, 7% reduction
5,817,000
Section 6 – Recommendations 63
Figure 6H GWP impact of total retail distribution system under Current system, Scenario A, and Scenario B
267,000
479,000
324,000
255,000 161,000
-
-
100,000
200,000
300,000
400,000
500,000
600,000
Total Retail - Current Total Retail - Scenario A Total Retail - Scenario B
GW
P (
kg C
O2
equi
v.)
Ros
evill
e to
LA
DC
/PA
DC
Hub
to
Stor
es
522,000479,000
Scenario A:43,000 kg, 8% reduction
Scenario B:37,000 kg, 7% reduction
485,000
Roseville to Western Region
Current energy consumption and GWP for western region retail stores (CA, NV, AZ, OR, WA),
serviced through LADC, is 2,763,000 MJ and 228,000 kg CO2, respectively (Figure 6I and 6J)70.
Our model reveals that energy consumption for Scenario A direct shipments to all western retail
stores is 2,303,000 MJ, and 190,000 kg CO2, or approximately 17% less energy and GWP for
western region retail shipments than current system. The reduction in Energy and GWP is driven
by the relative geographic isolation of the LADC; it is located fairly far south and west of many of
the retail stores it services and therefore any shipments going to retail stores north or east
backtrack, or are “inefficient” from a transport perspective.
Our model reveals that energy consumption and GWP for Scenario B is 2,329,000 MJ and
191,000 kg CO2, or approximately 16% less energy and GWP for western region retail shipments
than the current system (Figure 6K and 6L). This reveals that Scenario B provides almost the
same environmental impact as Scenario A because only Southern California stores are no longer
shipped to directly.
Section 6 – Recommendations 64
Figure 6I Energy reduction of Western retail distribution system under Current system, Scenario A, and Scenario B
651,000
2,303,000
1,355,000
2,112,000974,000
-
1,000,000
2,000,000
3,000,000
4,000,000
Western Retail - Current Western Retail - Scenario A Western Retail - Scenario B
Ene
rgy
(MJ)
Ros
evill
e to
LA
DC
LAD
C t
o St
ores
Scenario A:460,000 MJ, 17% reduction
2,763,000
2,329,000
Scenario B:434,000 MJ, 16% reduction
2,303,000
Figure 6J GWP impact of Western retail distribution system under Current system, Scenario A, and Scenario B
54,000
190,000
111,000
174,00080,000
-
100,000
200,000
300,000
Western Retail - Current Western Retail - Scenario A Western Retail - Scenario B
GW
P (
kg C
O2
equi
v.)
Ros
evill
e to
LA
DC
LAD
C t
o St
ores
228,000
190,000
Scenario A:38,000 kg, 17% reduction
Scenario B:37,000 kg, 16% reduction
191,000
Section 6 – Recommendations 65
Roseville to Eastern Region
Current energy consumption and GWP for retail stores serviced by PADC (CT, DE, NJ, NY, PA) is
1,055,000 MJ and 87,000 kg CO2, respectively (Figures 6K and 6L).71 Our model reveals that
energy consumption for Scenario A direct shipments to all eastern region retail stores is
1,003,000 MJ, and 82,000 kg CO2, or approximately 5% less energy and 6% less GWP than
current eastern region retail shipments. Reductions in the Eastern region are significantly less
than in the western region because routing is more direct, and total vehicle ton miles are much
lower.
Figure 6K Energy reduction of Eastern retail distribution system under Current system, Scenario A, and Scenario B
72,000
1,003,000
72,000
983,000 983,000
-
500,000
1,000,000
1,500,000
Eastern Retail - Current Eastern Retail - Scenario A Eastern Retail - Scenario B
Ene
rgy
(MJ)
Ros
evill
e to
PA
DC
PAD
C t
o St
ores
Scenario A:52,000 MJ, 5% reduction
1,055,000
Scenario B:0 MJ, 0% reduction
1,003,0001,055,000
Section 6 – Recommendations 66
Figure 6L GWP impact of Eastern retail distribution system under Current system, Scenario A, and Scenario B
6,000
82,000
6,000
81,000 81,000
-
25,000
50,000
75,000
100,000
125,000
Eastern Retail - Current Eastern Retail - Scenario A Eastern Retail - Scenario B
GW
P (
kg C
O2
equi
v.)
Ros
evill
e to
PA
DC
PAD
C t
o St
ores
87,00082,000
Scenario A:5,000 kg, 6% reduction
Scenario B:0 kg, 0% reduction
87,000
6.1.4 BUSINESS IMPACT OF SOLUTION:
6.1.4.1 FINANCIAL IMPACT A cost analysis was performed and intended as a preliminary estimate rather than to determine
actual costs. While this analysis has been discussed with the client in detail, only summary data
can be provided here due to the proprietary nature of its service contract. More detailed cost
analysis was not possible due to the many specific requirements that would need to be finalized
through contract negotiations. Furthermore, shipping amounts were rounded to ease
calculations and discussion with suppliers and Aveda personnel. The costs are provided only for
the Eastern and Western portion of the retail network because the remaining stores currently
serviced out of Roseville are expected to remain the same.
Current System
In the current system transport costs are constituted by 3 major drivers.
• The transport cost of shipping inventory from Roseville to LADC and PADC
• Labor costs of unloading inventory at LADC or PADC
• Transport costs of shipping product from the DC to the retail store
Section 6 – Recommendations 67
The price for shipping inventory form among distribution centers is based on the fact that a full
truck is contracted and packed to capacity, which is between 35,000 and 40,000 lbs. This cost
does not include the usual LTL surcharges to guarantee delivery hours.
The labor costs of unloading inventory is difficult to estimate, but it is important to include in the
analysis because by transferring inventory from Roseville to PADC or LADC requires additional
labor to restock in the DC. Aveda personnel provided an estimate for this, however these costs
would not necessarily be realized in full because the facility may not actually reduce staff.
The transport costs from the DC to the retail store via LTL is based on current contract rates,
however this includes a significant surcharge (roughly 100%) to guarantee delivery times (i.e., a
guarantee that a store will receive shipment between 1pm and 4pm on Mondays). Aveda is
reportedly starting to eliminate these surcharges because the LTL carriers are usually able to
meet the service levels without extra effort. However, it is likely that the longer LTL routes
proposed under the scenarios would require the delivery guarantee. For purposes of this
analysis, it was assumed that the current LTL costs will continue in the future. Aveda provided
the estimates for the new LTL routes and are assumed to be close to actual rates with the
surcharge.
The current cost of the LADC region stores is shown in Table 6A. All product shipped from
Roseville to the LADC is handled by labor at the LADC and then shipped to 34 western region
retail stores via LTL carrier. Total cost for the current western retail system is estimated at
$518,400.
All product shipped from Roseville to the PADC is handled by labor at the PADC and then shipped
to 18 eastern region retail stores via LTL carrier. Total cost for the current eastern PADC system
is estimated at $101,000.
Scenario A
Scenario A requires direct shipping to all retail stores. Shipments from Roseville to the LADC as
well as the labor costs to unload the inventory are eliminated. All shipments to the 34 western
region retail stores are via LTL carrier out of Roseville. Total cost for the Scenario A western
retail system is estimated at $605,000.
Section 6 – Recommendations 68
Shipments from Roseville to the PADC as well as the labor costs to unload the inventory are
eliminated. All shipments to the 18 PADC region retail stores are via LTL carrier out of Roseville.
Total cost for the Scenario A PADC retail system is estimated at $165,000.
Scenario B
Scenario B requires direct shipping to many of the LADC region retail stores, but keeps the
current PADC system. Shipments from Roseville to the LADC are reduced, as well as the labor
costs to unload the inventory, to the amount needed to fulfill the 10 southern California retail
stores. Shipments to the remaining 24 western region retail stores are via LTL carrier out of
Roseville. Total cost for the Scenario B western retail system is estimated at $511,400. Scenario
B costs for PADC region stores are the same under the current system and estimated at
$101,000.
Total Costs of the Three Scenarios
Based on the above cost information and the approximate weights, the current transportation
costs for the Western and Eastern retail network is $619,000 (Table 6A). Scenario A, which
eliminates shipments to LADC and PADC as well as the labor required in those facilities and
increases the LTL costs to service the stores, results in a cost of $770,000 (24% increase).
Scenario B, which reduces the shipments to the LADC and the labor required at the LADC, but
maintains the current PADC network, results in a cost of $612,400 (1% decrease). While
Scenario A costs are significantly higher, Scenario B costs are comparable to the current costs.
Again, actual costs may differ when contract details and weights are finalized.
Table 6A Cost of LADC region under Scenarios A and B
Current Estimated Costs LADC $518,400 PADC $101,000 TOTAL $619,000
Scenario A: Direct to All Retail Estimated Costs
LADC $605,000 PADC $165,000 TOTAL $770,000
Scenario B: Direct to Some LADC Retail Estimated Costs
LADC $511,400 PADC $101,000 TOTAL $612,400
6.1.4.2 OPERATIONS IMPACT To implement either recommendation A) Direct to all Retail or B) Direct to WA, OR, AZ, NV,
Northern CA, the operational strategy at each of the three Aveda-owned DCs will need to be
Section 6 – Recommendations 69
slightly modified. Capacity utilization will change, as will the management of inventory and
changes in labor. Table 6B presents a partial list of both the positive and negative changes to
each DC.
Table 6B Impact of Scenario A and B on Facility Operations Facility Pro Con
Inventory consolidation reduces future need for inventory disposition
Increased staff Roseville
Increased capacity utilization Inventory consolidation offers many benefits Lower capacity utilization Reduced staffing Longer lead time for some customer orders
LADC
Free up space for salon expansion Inventory consolidation offers many benefits Longer lead time for some customer orders Reduced staffing NYC area stores have unique challenges
that a local carrier can best address. Additional capacity at PADC for salon expansion
PADC
Elimination of unnecessary loose-pick packaging
6.1.4.3 CUSTOMER IMPACT Scenario A
Based on interviews with Aveda staff, using LTL to deliver product directly to all the retail stores
on a weekly or bi-weekly basis should have minimal to no impact on customer service levels.72
This is due to the fact that retail stores provide a two-week lead time between order placement
and order receipt, which is sufficient for order fulfillment and shipment. However, it is
understood that many retail customers do not submit orders on time, therefore if either scenario
were implemented, stores would need to more strictly adhere to the order schedule.
Scenario B
Similarly, Scenario B would have minimal impact to the retail stores affected by the new delivery
routes assuming they adhere to the current order schedule. Stores in the PADC region and
southern California would see no changes to the current system.
Table 6C Summary of recommendation environmental impact, cost, and operational feasibility
Scenario A Scenario B Environmental Impact • 512,000 MJ (-8%)
• 43,000 kg CO2 (-8%) • 434,000 MJ (-7%) • 37,000 kg CO2 (-7%)
• Improve inventory management • Improve space in LADC
Customer Impact • Require LADC and PADC stores to better adhere to order schedule
• Require LADC stores to better adhere to order schedule
Section 6 – Recommendations 70
6.2 RECOMMENDATION 2 - UTILIZE INTERMODAL SHIPPING TO DISTRIBUTION CENTERS 6.2.1 PROBLEM DEFINITION Aveda currently ships to all of its distribution centers using class 8 trailers. Trailers offer the
most flexible and often the quickest mode of shipping, however GHG and energy models reveal
that, relative to tertiary packaging (10.7 MM MJ and 714 metric tons CO2), transportation (25.8
MM MJ and 2097 metric tons CO2) is the largest contributor (71%) to the environmental impact
associated with Aveda’s PDS. Shipping freight by rail is the most environmentally preferable
method for shipping product from Roseville to points throughout the U.S. and Canada. However,
rail alone is not an attractive option due to the time-sensitive nature of Aveda’s shipments as well
as the labor costs associated with transferring cargo between truck trailers and rail containers.
Intermodal shipping combines the most efficient features of both rail and truck shipping. Freight
trains efficiently carry cargo for long distances over high-volume corridors while trucks provide
the flexibility necessary to move cargo between rail terminal and the cargo’s origin and
destination. Furthermore, the cargo remains within the same trailer throughout the shipment,
minimizing labor cost and shipping delays. According to the U.S. EPA SmartWay program,
intermodal logistics provide greater economic and environmental benefits as the distance of
shipping distances increase. Relative to shipping by truck, intermodal logistics provide a 65%
reduction in GHG emissions for shipments greater than 1,000 miles.73
Intermodal logistics are managed by third-party companies called Intermodal Marketing
Companies (IMC), which contract with truck carriers and railroad companies on the behalf of the
customer. According to the Intermodal Association of North America, the leading industry trade
association representing the combined interests of the intermodal freight industry, over four
hundred companies offer intermodal services in the U.S. Some of these companies focus on
particular routes, while others provide national and international coverage.
Despite the challenges faced by the rail industry, the intermodal industry has grown steadily over
the past years: total intermodal traffic increased in the US by 6.4% from 2002 to 2003, in terms
of domestic and international shipments.74 Trailer traffic and rail shipments also increased
(trailer traffic comprises approximately 20% of total moves and rail provides 80%).75 Recent
technological advancements have made intermodal logistics more competitive, particularly with
increased speeds of transferring trailers and containers between truck and rail.76 Additionally,
Section 6 – Recommendations 71
railroad companies invest a total of $5 billion a year to expand capacity on heavily-used routes to
accommodate the surge in intermodal volumes from intermodal shippers.77
Given that significant environmental and cost benefits of intermodal logistics are achieved with
distances greater than 1,000 miles and a minimum cargo level of a full truckload, the team
focused on evaluating the feasibility of using intermodal logistics to ship from Roseville DC to
each of six domestic distribution centers across the country.78 Table 6D lists the routes from
Roseville to each of its six domestic distribution centers, the distances traveled by truck carriers,
and whether intermodal is available for shipping. The distances from Roseville to USDC-C and to
USDC-D were too short for intermodal to be an effective shipping strategy, thus leaving possible
intermodal options as Roseville to LADC, USDC-A, USDC-B and PADC.
Table 6D Mileage and mode comparison between current shipping strategy and intermodal logistics
Route Approximate Truck TL mileage
Intermodal available?
Roseville to PADC 1,200 miles Yes Roseville to LADC 1,800 miles Yes Roseville to USDC-A 1,200 miles Yes Roseville to USDC-D 700 miles No Roseville to USDC-C 300 miles No Roseville to USDC-B 800 miles Yes
The Truck TL mileage is based on interviews with carriers currently used by Aveda.
6.2.2 PROPOSED SOLUTION Based on environmental and operational impacts described below, we propose that Aveda begin
phasing in intermodal shipping for 25% of shipments from Roseville to LADC, USDC-A and PADC.
We recommend that Aveda start with the route that seems most logistically amenable to a
switch, and then expand to other routes. Increasing the amount of rail in Aveda’s distribution
mix will help Aveda move closer to its environmental mission with minimal impact on business
operations. Contact information for potential intermodal carriers for each of these routes is
provided in Appendix C.
6.2.3 ENVIRONMENTAL IMPACT The team modified the computer model described in Section 5 to determine the environmental
impact of switching from truck to intermodal for the four DCs described in Table 6E. The
assumptions in the model are as follows:
• The distances from both Roseville to PADC and Roseville to USDC-A for both shipping strategies (truck and intermodal) were within 5% of each other.
• The distances from Roseville to USDC-B and LADC were substantially different because westbound rail cargo leaving St. Paul travels south and east to Chicago before turning
Section 6 – Recommendations 72
around and heading west. This extra leg can add up to 800 miles of extra travel. Although intermodal covers more distances than truck alone, the efficiency of the rail system more than compensated for the extra mileage. (Note: Should Aveda pursue this strategy, the team recommends that Aveda find an intermodal company that utilizes the rail lines that connect to the rail terminals west of St. Paul, such as Topeka KS.)
• Since intermodal containers have similar dimensions and weight limitations as typical truck trailers, we assumed that the maximum weight of 35,000 lbs in the conventional trucking system would apply to the intermodal for ease in comparing the two systems. This weight limit is a conservative figure for intermodal, since intermodal weight limits reach 45,000 lbs.
Based on these assumptions, switching from the current truck strategy to intermodal shipping for
LADC, USDC-B, USDC-A and PADC will result, on average, in a 64% reduction in both energy and
GHG emissions (Table 6E and Figure 6M) or 1.2 MM MJ and 111.6 tons CO2 equivalents
annualized savings.
Table 6E Energy and GWP reductions associated with switching from truck to intermodal logistics for each of the four distribution centers >1000 miles from Roseville.
Unit LADC USDC-B USDC-A PADC Current Truck System (annualized)
Energy (MM MJ) 5.928 0.881 3.05 3.98 GWP (tons CO2 eqv.) 537 79.2 276 360
Savings from Switching all shipments to Intermodal (annualized) Energy (MM MJ) 2.31 .408 1.01 1.22 GWP (tons CO2 eqv.) 209 36.0 91.2 110
% Impact Reduction by Switching to Intermodal for all Shipments Energy (MM MJ) 61% 54% 67% 69% GWP (tons CO2 eqv.) 61% 54% 67% 69%
Annualized Savings by Switching 25% of shipments to intermodal Energy (MM MJ) 0.577 0.102 0.253 0.305 GWP (tons CO2 eqv.) 52.2 9.00 22.8 27.6
Figure 6M Environmental Impact Reductions from Implementing an Intermodal Distribution Strategy
-
0.50
1.00
1.50
2.00
2.50
3.00
LADC USDC-B USDC-A PADC
Distribution Center
Ener
gy (
MM
of
MJ)
-
50
100
150
200
250
LADC USDC-B USDC-A PADC
Distribution Center
GH
G (
CO2
eqv
.)
Truck only
Intermodal
Section 6 – Recommendations 73
6.2.4 BUSINESS IMPACT
6.2.4.1 FINANCIAL IMPACT Given the competition in the shipping industry, the cost differences between Aveda’s current
trucking strategy and intermodal logistics are minimal (Table 6F). Intermodal is more cost
effective than truck for shipping to LADC, but slightly more expensive for USDC-B, USDC-A and
PADC. However, Aveda has the opportunity to negotiate lower shipping rates with a variety of
intermodal companies, much like the company has done with UPS for truck shipping,
Table 6F Comparison of shipping costs and delivery times between Aveda’s current trucking carriers and four intermodal logistics companies
Number of full TL
shipments per week
Current trucking
service rates
Intermodal Carrier 1 Quote *
Intermodal Carrier 2 Quote *
Intermodal Carrier 3 Quote**
Intermodal Carrier 4 Quote**
Roseville to LADC
2-3 $2,400 3 days
$1,872 7-9 days
$1,925 9 days
$2,100 7-8 days
n/a
Roseville to USDC-B
1 $1,515 2 days
n/a $1,605 7 days
$1,975 3-4 days
n/a
Roseville to USDC-A
3 $1,551 2 days
$1,693 3-4 days
n/a $2,300 6-7 days
n/a
Roseville to PADC
2-3 $1,700 2 days
$1,637 4-5 days
$1,895 6 days
$2,300 6-7 days
$1845.71 2 days
* does not include fuel surcharge ** includes fuel surcharge of 13%
6.2.4.2 OPERATIONS IMPACT Switching to intermodal for at least 25% of the shipments will have minimal impact on Aveda’s
distribution operations. At Roseville, trailers destined for intermodal will need to be braced to
ensure the product is not damaged during shipping, which reduces the volume capacity of the
trailer by 9%, which amounts to a footprint loss of two to four pallets.79 This loss is only
significant if the pallets cannot be stacked, otherwise, intermodal trailers can be loaded with far
more pallets than a standard truckload because intermodal trailers can carry up to 45,000 lbs,
while truckloads are limited to 35,000 lbs (due to various limits set by different states).
At the destination points, distribution center management will need to adjust staff schedules to
accommodate new dates of arrival. Currently, the management at LADC and USDC-A increase
staff levels to accommodate incoming truckloads of cargo from Roseville.80 At LADC, for
example, one Aveda staff person arrives two hours early in order to unload the truck that arrives
from Roseville. Order due dates and shipping dates can remain the same but the dates of
delivery will shift slightly.
Section 6 – Recommendations 74
6.2.4.3 CUSTOMER IMPACT Since each distribution center holds at least six weeks of inventory for most SKUs, then the slight
shipping delays associated with intermodal logistics will increase risk of stockout minimally.
Section 6 – Recommendations 75
6.3 RECOMMENDATION 3 – REDUCE INVENTORY DISPOSITION, RETURNS AND OUT-OF-REGION SHIPMENTS 6.3.1 PROBLEM DEFINITION Transport waste is defined as transport that does not move goods directly from production to
market. This waste creates unnecessary expense and environmental impact and occurs in three
areas of Aveda’s PDS system: Inventory disposition, out of region shipments, and product
returns.
6.3.1.1 INVENTORY DISPOSITION Inventory disposition is defined as the shipment of inventory between DCs to fill inventory gaps
and to even out the distribution of inventory at the three DCs. It also includes shipments of
obsolete products back to Roseville. Observation at the Roseville site highlighted at least ten full
pallets of returned product, and other anecdotal evidence suggests that there is a significant
amount of product returns in the inventory disposition data. Inventory disposition is typically
transported by pallet via LTL. The most significant inventory disposition from October 2003-
October 2004, in terms of vehicle ton miles, occurred on the route from LADC to Roseville, with
approximately 106,000 kg shipped for a total of 206,000 metric ton miles. The PADC to Roseville
route shipped approximately the same weight, 105,000 kg, but because of the shorter route, has
significantly fewer metric ton miles, 126,000. The third most significant inventory disposition was
between third-party distributors and Roseville with 15,800 ton miles (Figure 6N). Inventory
Stocking is the initial movement of the dispossessed inventory from Roseville to the DC (Figure
6O).
Figure 6N Inventory Disposition, Weight by route
106,000
20,700900 900 200 200
106,000
235,000
-
50,000
100,000
150,000
200,000
250,000
Inve
ntor
ySt
ocki
ng
LAD
C t
oR
osev
ille
PAD
C t
oR
osev
ille
3rd
Part
y U
Sto
Ros
evill
e
PAD
C t
oLA
DC
PAD
C t
o 3r
dPa
rty
US
3rd
Part
yC
anad
a to
Ros
evill
e
LAD
C t
oPA
DC
Wei
ght
(kg)
Section 6 – Recommendations 76
Figure 6O Inventory Disposition, Metric Ton-Miles by route
127,000
15,8002,600 900 200 500
352,000
207,000
-
50,000
100,000
150,000
200,000
250,000
300,000
350,000
400,000
Inve
ntor
ySt
ocki
ng
LAD
C t
oR
osev
ille
PAD
C t
oR
osev
ille
3rd
Part
y U
Sto
Ros
evill
e
PAD
C t
oLA
DC
PAD
C t
o 3r
dPa
rty
US
3rd
Part
yC
anad
a to
Ros
evill
e
LAD
C t
oPA
DC
Met
ric-
ton
mile
s
6.3.1.2 OUT OF REGION SHIPMENTS Out of region shipments are defined as a shipment by a DC to an out of region salon or retail
store, although out of region shipments to salons are much more common. For example, when
LADC services a salon order in New York, the shipment is considered out of region. Out of region
shipments occur as a result of an out of stock product at a primary distribution center, which are
defined by Aveda. Customer service representatives can split orders and ship the out of stock
item from an out of region distributor. As seen in Figure 5N, the three most significant out of
region routes by weight are PADC to third-party Salon (23,100 kg), LADC to Roseville retail stores
(5,330 kg), and LADC to Roseville salon (4,410 kg). Figure 6P shows these same routes in terms
of metric ton-miles, which generally corresponds with environmental impact. Because of the
varying distances traveled, weight will not necessarily correspond to metric ton-miles or
environmental impact (Figure 6Q).
Section 6 – Recommendations 77
Figure 6P Out of Region Shipments, Weight by route
23,100
2,880 4,6502,530 3,080 3,020 350
99040
6801,530
-
5,000
10,000
15,000
20,000
25,000
PAD
C t
o3r
d Pa
rty
US
Salo
n
LAD
C t
oR
osev
ille
Salo
n
LAD
C t
oR
osev
ille
Ret
ail
PAD
C t
oLA
DC
Sal
on
PAD
C t
oR
osev
ille
Salo
n
PAD
C t
oR
osev
ille
Ret
ail
LAD
C t
oPA
DC
Sal
on
LAD
C t
o 3r
dPa
rty
US
Salo
n
Wei
gh
t (k
g)
Parcel LTL
Figure 6Q Out of Region Shipments, Metric Ton-Miles by route
10,600
5,410
9,4706,920
3,7101,870 2,770
570
1,710
1002,900
-
2,000
4,000
6,000
8,000
10,000
12,000
PAD
C t
o3r
d Pa
rty
US
Salo
n
LAD
C t
oR
osev
ille
Salo
n
LAD
C t
oR
osev
ille
Ret
ail
PAD
C t
oLA
DC
Sal
on
PAD
C t
oR
osev
ille
Salo
n
PAD
C t
oR
osev
ille
Ret
ail
LAD
C t
oPA
DC
Sal
on
LAD
C t
o3r
d Pa
rty
US
Salo
n
Met
ric-
ton
mil
es
Parcel LTL
6.3.1.3 PRODUCT RETURNS Product returns are the shipment of damaged goods or incorrect orders. For the purpose of this
report we do not include obsolete products in the product returns. Product returns occur in larger
quantities from DCs and in smaller quantities from salons and retail stores. Data for product
returns is difficult to obtain because there is no coding for this type of shipment and it falls into
other categories of data. Aveda personnel have indicated that the company receives “one or
two” customer returns via UPS daily, however these shipments were not captured in the data set
Section 6 – Recommendations 78
provided for this project. Therefore, it is expected that customer returns are actually higher
than indicated in Figure 6R.
Figure 6R Product Returns, Weight and Metric Ton-Miles by route
6.3.2 PROPOSED SOLUTION Interviews with operations managers reveal that Aveda has reduced the amount of inventory
disposition, out of region shipments, and product returns over the past five years.81 While we
recognize that Aveda’s strategy in the salon market will make it difficult to reduce further
inventory disposition, out of region shipments, and product returns, we recommend that Aveda
could focus on two areas to continue the improvement trends made thus far:
• SKU rationalization—Aveda has hundreds of SKUs, many of which are held as inventory at all three DCs. Because some of these SKUs have limited sales, it is difficult to estimate the quantity required and infrequent manufacturing of these SKUs results in long lead times before inventory is replenished. We recommend that Aveda consolidate it’s low running SKUs at Roseville, and ship those items direct to customers. Since we did not have access to the sales by SKU data, we do not know where the cut-off should be, but given the wide variety of products, we expect that anywhere between 1 and 5% of the SKUs could be candidates for consolidation.
• Tracking, monitoring, and analyzing inventory disposition, out of region shipments, and product returns – Currently, Aveda does not have any system that captures these wasteful movements of freight. We recommend that software be upgraded or modified to track this data closely and have the results reported to management on a regular basis.
7,300
820
-
1,000
2,000
3,000
4,000
5,000
6,000
7,000
8,000
Salon to LADC Retail to PADC
Wei
ght
(kg)
2,050
260
-
500
1,000
1,500
2,000
2,500
Salon to LADC Retail to PADC
Met
ric
Ton
Mile
s
Section 6 – Recommendations 79
6.3.3 ENVIRONMENTAL IMPACT The environmental impact resulting from inventory disposition consists of the transportation of
the various shipments described above as well as the original shipment of the inventory, shown
in Figure 6S and 6T as “Inventory Stocking.” The resulting energy impact is 1,054,000 MJ and
the GWP is 86,120 kg CO2.
Figure 6S Energy Consumption (MJ) of Inventory Disposition
188,000
23,400 7,800 4,000 1,600 300
522,000
307,000
-
100,000
200,000
300,000
400,000
500,000
600,000
Inve
ntor
ySt
ocki
ng
LAD
C t
oR
osev
ille
PAD
C t
oR
osev
ille
3rd
Part
y U
Sto
Ros
evill
e
LAD
C t
oPA
DC
PAD
C t
oLA
DC
PAD
C t
o 3r
dPa
rty
US
3rd
Part
yC
anad
a to
Ros
evill
e
Ener
gy (
MJ)
Figure 6T GWP of Inventory Disposition
15,000
1,900 600 300 100 20
25,200
43,000
-
10,000
20,000
30,000
40,000
50,000
Inve
ntor
ySt
ocki
ng
LAD
C t
oR
osev
ille
PAD
C t
oR
osev
ille
3rd
Part
y U
Sto
Ros
evill
e
LAD
C t
oPA
DC
PAD
C t
oLA
DC
PAD
C t
o 3r
dPa
rty
US
3rd
Part
yC
anad
a to
Ros
evill
e
GW
P (
kg C
O 2)
The environmental impact resulting from out-of-region shipments is based on the additional
transport required in shipping products back across the country. There is potentially additional
impact due to shipping to a different distributor, but it is difficult to quantify this additional
Section 6 – Recommendations 80
impact. The resulting energy impact is 106,990 MJ and the GWP is 8,750 kg CO2 (Figures 6U and
6V).
Figure 6U Energy Consumption (MJ) of Out of Region Shipments
Figure 6V GHG Impact of Out of Region Shipments
The environmental impact resulting from product returns consists of the transportation of the
various shipments described above as well as the original shipment to the customer. This means
the inventory stocking results in a doubling of the environmental impact. The resulting energy
34,200
16,600 17,80012,300
7,9805,200 4,910
2,480
1,120
140
4,260
-
10,000
20,000
30,000
40,000
PAD
C t
o 3r
dPa
rty
US
Salo
n
LAD
C t
oR
osev
ille
Salo
n
LAD
C t
oR
osev
ille
Ret
ail
PAD
C t
oLA
DC
Sal
on
PAD
C t
oR
osev
ille
Salo
n
PAD
C t
oR
osev
ille
Ret
ail
LAD
C t
oPA
DC
Sal
on
LAD
C t
o 3r
dPa
rty
US
Salo
n
Ener
gy (
MJ)
Parcel LTL
20,860 20,280
12,440
2,820
1,310 1,4601,010
660430 400
210
90
10
350
-
500
1,000
1,500
2,000
2,500
3,000
PAD
C t
o 3r
dPa
rty
US
Salo
n
LAD
C t
oR
osev
ille
Salo
n
LAD
C t
oR
osev
ille
Ret
ail
PAD
C t
oLA
DC
Sal
on
PAD
C t
oR
osev
ille
Salo
n
PAD
C t
oR
osev
ille
Ret
ail
LAD
C t
oPA
DC
Sal
on
LAD
C t
o 3r
dPa
rty
US
Salo
n
GW
P (
kg C
O2
)
Parcel LTL
1,020
1,6701,660
Section 6 – Recommendations 81
impact is 6,780 MJ and the GWP is 560 kg CO2 (Figure 6W). However, as noted above, there are
additional UPS returns that are not captured in this data.
Figure 6W Energy Consumption and GHG Impact of Product Returns
As stated in section 5.3, the annual energy consumption of Aveda’s entire transportation
component of the PDS system is 25.8 MM MJ and the total Global Warming Potential is 2,097
metric tons CO2. The environmental impact of Inventory disposition is 1,054,000 MJ and 86,120
kg CO2, Out of Region Shipments is 106,990 MJ and 8,750 kg CO2, and Product returns is 6,780
MJ and 560 kg CO2. Total environmental impact for all three transport inefficiencies is 1,167,770
MJ and 95,430 kg CO2, or approximately 4.5% of the transport component of the PDS.
6.3.4 BUSINESS IMPACT
6.3.4.1 FINANCIAL IMPACT The cost of transport for inventory disposition is estimated at $109,000 to $198,000. The
difference between the low and the high cost is constituted by the rate used. The high LTL rate
includes a surcharge to guarantee delivery day. Because inventory disposition does not
necessarily require guaranteed delivery, we included the low rate. Parcel rates were estimated by
Aveda, and a low rate (20% less) was created arbitrarily, although the parcel shipments affect
the total costs only slightly. The TL rates for third-party is unknown and thus the range between
what Aveda receives for PADC and LADC was used. These figures are intended to be estimates
used to understand the financial impact of the environmental inefficiency, and are not intended
to represent exact costs that would be avoided.
3,400
3,000
380
-
1,000
2,000
3,000
4,000
InventoryStocking
Salon to LADC Retail to PADC
Ener
gy (
MJ)
250
30
280
-
50
100
150
200
250
300
350
InventoryStocking
Salon to LADC Retail to PADCG
WP
(kg
CO
2)
Section 6 – Recommendations 82
The cost of transport for out of region shipments was not able to be calculated. The shipments
would have to have been sent from a different distribution center, and it is difficult to calculate
the extra cost associated with the alternative distribution center, though it is not expected that
the costs would vary significantly.
The cost of transport for return shipments is estimated at $5,000 to $11,000. The difference
between the low and the high cost is constituted by the rate used as mentioned above. If there
are additional returns not captured in this data, such as the daily UPS returns described earlier,
costs could be higher. Again, these figures are intended to be estimates for purposes of
evaluation.
6.3.4.2 OPERATIONAL IMPACT It would be extremely difficult to eliminate inventory disposition, out-of-region shipments, and
product returns, because it is a natural result of operating a product company. However, if
Aveda did commit to reduce this inefficiency it would require more accurate customer demand
forecasting. However, there would also be reduced labor required for restocking inventory.
Additionally, there may be unique situations that arise when Aveda will need to change its
manufacturing schedule. For example, if a product is out of stock in a distribution center, it may
be better for Aveda to move up the production of a new batch so that inventory is replenished
throughout the distribution network. Currently products may be shipped out of region, or
between distribution centers in order to meet the demand. Again, this may require better
demand forecasting.
6.3.4.3 CUSTOMER IMPACT Aveda’s customers demand and are guaranteed exceptional service, which results in Aveda’s
liberal policy on customer returns and shipments from out-of-region. It is not recommended that
Aveda eliminate this policy because it is integral to being a premium brand. However, because
most of Aveda’s customers believe in its environmental mission, the company could better
educate its customers about the impact due to returns and out of region shipping (see Table 6G
for a summary of Recommendation 3).
Section 6 – Recommendations 83
Table 6G Summary of Environmental, Financial, Operational, and Customer Impact for three transport inefficiencies
Inventory Disposition Out of Region Shipments Product Returns Environmental Impact • 1,054,000 MJ
• Reduce no. SKUs held at PADC and LADC • Reduce Labor needed for restocking
Customer Impact • Educate customers of return impacts • May require longer delivery times on low running SKUs
Section 6 – Recommendations 84
6.4 RECOMMENDATION 4 – REDUCE VOLUME OF PRODUCT SHIPPED BY LOOSE-PICK 6.4.1 PROBLEM DEFINITION Holding all variables equal, loose-pick packaging and parcel shipping requires two to three times
more energy and emits close to three times the amount of metric tons of CO2 equivalents of
GHGs as compared to packing and shipping via full pallets (see Appendix D). Given that 6% of
the total pound-miles is shipped via parcel,82 Aveda has an opportunity to make a small
incremental improvement to reducing its environmental impact.
6.4.2 PROPOSED SOLUTION The proposed solution depends on the future of Aveda’s shipping and handling (S&H) policy,
namely whether the current shipping and handling fee will remain as is or whether Aveda will
provide free S&H to customers (see Figure 6Y). The following list of solutions aims to provide
financial incentives for customers to ship via pallets.
6.4.2.1 CUSTOMER SERVICE ALGORITHM Currently, customer service representatives determine the shipping options based on the total
cost of the order. Any order that is greater than $2,500 will be shipped via LTL carrier and any
order costing less than $2,500 is shipped via UPS. This logic is based on the premise that, on
average, $100 of Aveda product roughly weighs about one pound and that it is most economical
to ship any order greater than 250 pounds via LTL and any order fewer than 250 pounds via
loose-pick (e.g., UPS). There are a few caveats to this logic:
• For orders that fall in the $2,000 to $3,000 range, the customer service representatives have been trained to quickly look over the order to determine if the composition is made up of mostly high-weight products, like shampoo and crèmes, or low-weight products like makeup and accessories. In the case of the former, the sales representative may ship via LTL even though it does not meet the $2,500 threshold.
• The Roseville DC also performs a “reality check” on orders that hover around the $2,500 mark. If they recommend changing the carrier, they contact customer service to determine whether the change in carrier is permissible based on stated customer needs (e.g., due dates, ability to receive pallets, etc.).
• Lastly, there are some customers that cannot receive pallets due to obstacles (e.g., narrow doors, stairs, no elevators, etc.).
While this system has worked well for Aveda, there are some opportunities for improvement. We
recommend that Aveda update the current software used by customer representatives to include
a module that calculates the total weight of the order as it is being received. This will allow
Aveda to determine more accurately the shipping costs at the time of the order, as well as
Section 6 – Recommendations 85
provide more information to the representative who is often faced with the challenge of
upselling. Additionally, it is imperative that Aveda develop a system of rewarding customers who
choose to receive pallet-loads, such as a carbon credit reward (further discussed below).
6.4.2.2 SLIDING SCALE If Aveda cannot build a software module as described in section 6.4.2.1, Aveda can use a sliding
scale to charge more for loose-pick orders. For example, Aveda can charge a flat fee per loose-
pick box and full/mixed pallet. A pricing mechanism where the loose-pick flat fee is significantly
greater than a pallet fee, will motivate customers to order in pallet quantities. There are
numerous pricing options; see Table 6H for a description of two.
Table 6H S&H sliding scale to motivate Total Order Cost Number of
Loose-pick Boxes Number of
Pallets S&H Cost
$1 LP, $1 Pallet S&H Cost
$10 LP, $1 Pallet $1 - $100 1 0 $1 $10
$101 -$200 2 0 $2 $20 $201 - $300 3 0 $3 $30
$2,401 - $2,500 24 0 $24 $240
$2,501 - $2,600 0 1 $1 $1
$2,601 - $2,700 1 1 $2 $11
$2701+ . . .
. . . . . . . . .
6.4.2.3 MINIMUM WEIGHT REQUIREMENTS If Aveda decides to provide free S&H, the company should impose a minimum order weight of
250 lbs, which is the threshold for shipping via LTL. This approach may not be suitable for low-
volume salons.
Section 6 – Recommendations 86
Figure 6X Diagram of Proposed Recommendations based on Aveda’s S&H Policy
6.4.3 ENVIRONMENTAL IMPACT Any one of these recommendations will provide a reduction of orders shipped out via loose-pick.
The model used in our analysis reveals that salon orders contribute 3.76 MM MJ energy and 308
metric ton of CO2 equivalents to the PDS (note: air shipments to Hawaii were removed from
these figures). Given that, if just 1% of shipments were changed from parcel to LTL, Aveda
would save an estimated 0.029 MM MJ and 2.3 metric tons CO2 equivalents (0.1% of PDS) at a
comparable cost to current operations. This amounts to taking 1.4 autos off the road each year.
If Aveda were to convert 10% of their orders from parcel to LTL, these efforts would amount to
taking 14 autos off the road per year.
6.4.4 BUSINESS IMPACT OF PROPOSED SOLUTION If any part of this recommendation is implemented, it may increase sales and decrease shipping
costs.
Section 6 – Recommendations 87
6.5 RECOMMENDATION 5 - CARBON OFFSETS 6.5.1 PROBLEM DEFINITION Aveda’s PDS, especially transportation, accounts for a large portion of GWP and energy use.
According to our assessment the PDS’ GWP is 2,811 metric tons CO2. While we have offered
several recommendations to minimize this impact, carbon offsets offer a means to negate the
impact by avoiding or sequestering an equal amount of emissions at another location.
Carbon offsets are increasingly being used throughout the world. Carbon offsets fund projects
that slow, counter or prevent the release of CO2 into the atmosphere. From 1996 to 2000 North
America was the only region of the world participating. However, starting in 2001 many
European countries launched their own carbon offset programs. 83
Further, the ratification of the
Kyoto Protocol is likely to increase demand for offsets.
Over the past several years, Aveda has entertained the idea of using carbon offsets to partially or
fully offset the GHG impact of its operations. In 2004 Aveda purchased carbon offsets for their
Air Control line of hairspray. However, in their 2002 CERES report, Aveda recognized the
potential flaws of permanence and effectiveness with carbon offsets. Given this ambiguity, we
have further researched carbon offsets and evaluated the associated financial and environmental
impacts.
6.5.2 PROPOSED SOLUTION We have identified three different options through which Aveda could offset the GWP from its
PDS: Climate Care, CCX®, and Native Energy. Organizations such as Climate Care (www.co2.org)
enable both groups and individuals to fund international projects that prevent the emission of
carbon dioxide and other GHGs. However, it should be noted that the impact of such projects
can be difficult to quantify, and most of the internationally recognized mechanisms that allow for
companies to count specific offsets are still under development.
6.5.2.1 CLIMATE CARE Climate Care is located in Oxford, England and was formed in 1998 to help individuals and
organizations reduce their own impact on global warming. When a company or individual works
with Climate Care, their carbon dioxide emissions are calculated (measured in tons of CO2), and
then offsets are sold to the company or individual. The money gained from the sale of the
offsets is used to help protect the climate from further damage by investing in renewable energy
projects, investing in energy efficiency projects, and financing projects which remove CO2.84
Section 6 – Recommendations 88
Climate Care's projects are scrutinized by its Environmental Steering Committee. The Committee
members include organizations such as the WWF (Worldwide Fund for Nature) and Forum for the
Future. Climate Care is implementing projects in several developing countries including South
Africa and Bangladesh. In South Africa, 95% of electricity is generated from coal in power
stations. This means that the CO2 emissions per unit of electricity are some of the highest in the
world. Climate Care is installing 25,000 low energy lamps, lightening the load on electricity
demand, people's electricity bills and the climate. In addition, Climate Care is working with a
number of municipalities and housing developers in Cape Town and Johannesburg to install
energy efficient lighting into residential homes.
Climate Care has teamed up with a local NGO in Bangledesh, the Intermediate Technology
Development Group (ITDG), which has been working in the area for over 30 years, to reduce
GHG emissions. ITDG will run a series of training courses over a year to show villagers how to
build energy efficient stoves using local materials. A portion of the program will be to show
people how to set up a micro enterprise to make stoves for others in the community.
6.5.2.2 CCX® Aveda might also consider purchasing carbon credits on the Chicago Climate Exchange (CCX®).85
CCX® serves as a marketplace for trading and reducing GHGs. As of late 2004, carbon was
trading on the exchange at a rate of $1.43 per metric ton. CCX® is a GHG emission reduction
and trading pilot program for emission sources and offset projects in the United States, Canada,
Mexico and Brazil. CCX® is a self-regulatory, rules based exchange designed and governed by
CCX® Members. These members have made a voluntary, legally binding commitment to reduce
their emissions of GHGs by 4% below the average of their 1998-2001 baseline by 2006, the last
year of the pilot program. Emission offsets include landfill and agricultural methane and
sequestration in soils.
The development of the CCX® was initiated through a feasibility study that was funded in May
2000 by a grant from Chicago-based Joyce Foundation. The program specialized in developing
and trading new environmental, financial and commodity markets. It also designed risk
management and hybrid financial instruments that enhance the interrelationships between the
capital, commodity and environmental markets. The study concluded that a North America
private sector pilot GHG trading market is feasible. To participate with CCX®, Aveda would
contact Rafael Marques at [email protected] or (312) 554-3350. Additional
information can also be found at www.chicagoclimateexchange.com.
Section 6 – Recommendations 89
6.5.2.3 NATIVE ENERGY Native Energy is a renewable energy company that specifically works to support the Rosebud
Sioux Tribe in its efforts to build a wind energy farm.86 By purchasing carbon credits, companies
and individuals can fund turbine construction that offsets CO2 emissions with clean energy.
Aveda is already a part of Native Energy’s WindBuilderssm Business Partner Program and used
Native Energy to achieve a climate neutral status for their Air Control hairspray. Other
companies and organizations that contribute to Native Energy include: Ben and Jerry’s, Green
Mountain Coffee Company, Clif Bar, Stoneyfield Farm, Seventh Generation, Timberland, and the
Dave Mathews Band. To participate further in this program, Aveda would call 800.924.6826 or
May 2004 data gathering and project kick-off trip to Minneapolis with all 5 team members Air travel from Detroit to Minneapolis and return for all 5 team members
527 x 2 x 5 = 5270 “medium haul” passenger land miles
0.2028 kg CO2/ mile
1,069 kg CO2
Auto use, including travel to airports.
Approximately 100 miles. Standard auto, assume “medium vehicle” at 23 mpg.
0.3920 kg CO2/ mile
39 kg CO2
November 2004 data gathering trip to Minneapolis with 3 team members
Air travel from Flint to Minneapolis and return to Detroit for 1 person
490 + 527 = 1017 “medium haul” passenger land miles
0.2028 kg CO2/ mile
206 kg CO2
Air travel Connecting flight from Detroit to Flint.
54 “short haul” passenger land miles
0.2897 kg CO2/ mile
16 kg CO2
Air travel from Detroit to Minneapolis and return for 1 person
527 x 2 = 1054 “medium haul” passenger land miles
0.2028 kg CO2/ mile
214 kg CO2
Air travel from Flint to Minneapolis and return to Chicago for 1 person
490 + 349 = 839 “medium haul” passenger land miles
0.2028 kg CO2/ mile
170 kg CO2
Rail travel from Chicago to Ann Arbor for 1 person
250 U.S. Intercity Rail passenger miles
0.1909 kg CO2/ mile
48 kg CO2
Auto use, including travel to airports.
Approximately 200 miles. Standard auto, assume “medium vehicle” at 23 mpg.
0.3920 kg CO2/ mile
78 kg CO2
January 2005 data gathering trip to Minneapolis for 1 team member
Air travel from Detroit to Minneapolis and return for 1 person
527 x 2 = 1054 “medium haul” passenger land miles
0.2028 kg CO2/ mile
214 kg CO2
Auto use, including travel to airports.
Approximately 50 miles. Standard auto, assume “medium vehicle” at 23 mpg.
0.3920 kg CO2/ mile
20 kg CO2
March 2005 presentation to School of Natural Resources by all 5 team members
Air travel from Oakland, CA to Chicago and return for 1 person
1834 x 2 = 3668 “long haul” passenger land miles
0.1770 kg CO2/ mile
649 kg CO2
Air travel from xxx to Detroit and return for 1 person
234 x 2 = 468 “short haul” passenger land miles
0.2897 kg CO2/ mile
136 kg CO2
Rail travel from Chicago to Ann Arbor and return for 1 person
500 U.S. Intercity Rail passenger miles
0.1909 kg CO2/ mile
95 kg CO2
March 2005 presentation to Aveda by all 5 team members
Air travel from Detroit to Minneapolis and return for 3 team members
527 x 2 x 3 = 3162 “medium haul” passenger land miles
0.2028 kg CO2/ mile
641 kg CO2
Air travel from Chicago to Minneapolis and return for 1 team member
335 x 2 = 670 “medium haul” passenger land miles
0.2028 kg CO2/ mile
136 kg CO2
Air travel from San Francisco to Salt Lake City for 1 team member
599 “medium haul” passenger land miles
0.2028 kg CO2/ mile
121 kg CO2
Air travel from SLC to Minneapolis for 1 team member
990 “long haul” passenger land miles
0.1770 kg CO2/ mile
175 kg CO2
Air travel from Minneapolis to Atlanta for 1 team member
908 “medium haul” passenger land miles
0.2028 kg CO2/ mile
184 kg CO2
Air travel from Atlanta to San Francisco for 1 team member
2,137 “long haul” passenger land miles
0.1770 kg CO2/ mile
378 kg CO2
Auto use, including travel to airports.
Approximately 100 miles. Standard auto, assume “medium vehicle” at 23 mpg.
0.3920 kg CO2/ mile
39 kg CO2
TOTAL 4,628 kg CO2
Section 6 – Recommendations 93
6.6 RECOMMENDATION 6 - ENROLL IN EPA SMARTWAY PROGRAM 6.6.1 PROBLEM DEFINITION As an environmental leader, Aveda should demand excellent environmental performance from its
business partners throughout its supply chain. However, many of Aveda’s current transport
carriers are not being as proactive as other carriers with regard to improving their environmental
and energy efficiency performance, to the extent that they are not participating in a voluntary
U.S. EPA program called the SmartWay Transport Partnership (SmartWay).
SmartWay is a collaborative, voluntary program between EPA and the freight industry that aims
to increase energy efficiency.93 The development of SmartWay was largely informed by the
Green Freight Working Group at Business for Social Responsibility (BSR). While Green Freight no
longer exists as such, the group has evolved into the Sustainable Freight working group, which
has two primary objectives: 1) to develop metrics to comparatively assess efficiency of different
modes of transport, and 2) to develop corporate standards for shippers. There are several major
differences between Sustainable Freight and SmartWay. First, SmartWay has an exclusively
domestic focus and does not apply to transport of goods outside of the U.S., whereas Sustainable
Freight is global in scope. Next, Sustainable Freight addresses all modes of transportation,
whereas SmartWay addresses truck carriers only. Lastly, SmartWay currently has specific
program requirements for all participants, whereas Sustainable Freight is in very early stages of
development and has not yet developed any specific standards or program requirements.
SmartWay currently offers more practical tools for shippers and carriers to reduce their
transportation footprint. Sustainable Freight, though, is more comprehensive in scope than
SmartWay and has the potential to have a far-reaching impact. Aveda should stay apprised of
developments at Sustainable Freight program and consider participating if interested, especially
as the company expands further into international markets.
SmartWay currently has over one hundred participating partner firms, including 85 carriers, 18
freight shippers, and six shipper-carriers. Participating carriers include major freight companies
such as UPS, Fed-Ex, and DHL, and participating shippers include companies such as Interface
Inc., IKEA USA, J & J Industries, Nike, The Home Depot, and Dell. One participating shipper,
Quad/Graphics, indicated in a recent publication that “by using SmartWay’s recommended
techniques, we have significantly reduced GHG emissions and improved the fuel efficiency of our
ground freight transportation.”94
Section 6 – Recommendations 94
Of all Aveda’s 31 carriers that were reviewed for the purposes of this study, only DHL (which
shipped only ten pounds of products over the five-month period studied), Fed-Ex, and UPS are
enrolled as SmartWay partners. Out of all of Aveda’s shipments during the period studied,
approximately 5.1% (in terms of ton-miles) were made by carriers that are currently enrolled in
SmartWay; however, UPS shipments alone account for 5% of total shipments, while Fed-Ex and
DHL account for the remaining 0.1%. As described by Table 6L, Aveda’s top five carriers
accounted for approximately 90% of all shipments on a ton-miles basis. (Appendix E includes a
list of all Aveda carriers and their relative impacts).
Table 6L Top Five Inbound and Outbound Transport Carriers by Ton-Miles (Annualized using data from October 2003 through February 2004)
Carrier Portion of Total Shipments
Carrier D 60%
Carrier E 15%
Carrier F 7%
Carrier G 5%
Carrier H 3% 6.6.2 PROPOSED SOLUTION Aveda should join the SmartWay Transport Partnership as a shipper. The major value of Aveda’s
participation in SmartWay is the potential to assist its current carriers in becoming more fuel
efficient. Participation in the SmartWay program entails Aveda’s committing to:
• Determine the percentage of freight shipped by SmartWay Transport Partnership carriers. Currently, we estimate that approximately 5.1% of all outbound shipments are via such carriers (namely UPS and FedEx). Aveda may also need to quantify the amount of inbound freight carried by SmartWay partners, to the extent that Aveda has control over such carriers. Inbound carriers were considered to be outside the scope of the system under investigation for this study.
• Measure the GHG emissions of the shipping operations using EPA's FLEET Performance Model for Shippers.
• Increase the percentage of freight shipped by SmartWay Transport Partnership carriers to at least 50%, within three years. This percentage can be either by weight or by sales volume, as decided upon in discussion with EPA. Since “Carrier D” accounts for 60% of all shipments, it appears that Aveda would need to convince this carrier to enroll in SmartWay in order to meet the program requirements. As noted above, however, this could change if inbound carriers are considered.
• Identify specific goals to reduce GHG emissions from shipping operations. These goals are determined in partnership with EPA. Several of the recommendations in this report might help Aveda meet this requirement, such as increasing pallet shipments to salons, shipping direct from Roseville to select Western Region stores, and implementing biodiesel transport from Blaine to the new DC.
Section 6 – Recommendations 95
• Develop an action plan detailing how each of these goals will be achieved. This action plan is also developed in partnership with EPA.
• Report progress toward achieving each of these goals to EPA annually.
In return, EPA commits to:
• Increase public awareness of company participation in the SmartWay Transport Partnership through national and regional events, articles, and awards.
• Provide technical assistance to help quantify the emissions from your shipping operations.
• Assist in developing and achieving goals and work to address challenges.
• Provide shippers that demonstrate they ship over 50% of their goods with SmartWay Transport Carriers with EPA's SmartWay Transport logo to advertise their status.95
After joining SmartWay, Aveda can leverage its own purchasing power and EPA resources to
encourage the carriers it already uses to become SmartWay partners (as a less desirable
alternative, Aveda could switch to carriers who are existing SmartWay members). EPA will
provide resources, such as literature, workshops, and other technical assistance, to help existing
carriers meet SmartWay requirements. An additional benefit to Aveda of participating in the
program is the ability to evaluate carriers based on fuel efficiency and other environmental
metrics. In addition to helping reduce the GHG and energy impact of Aveda’s PDS, joining
SmartWay is in line with Aveda’s commitment to environmental excellence, may provide a public
relations benefit, and could act as a catalyst for additional, similar action across the Estée Lauder
and possibly the larger personal care products industry.
To participate in SmartWay, carriers must commit to:
• Measure the environmental performance of their existing fleet
• Identify a goal to improve the environmental performance of their fleet
• Develop a plan detailing how the goal will be achieved
• Report their progress annually to EPA96
Benefits to carriers are similar to those that EPA provides to shippers.
Aveda should focus on working with its top carriers to join the SmartWay program and adopt the
program’s fuel efficiency measures. Typically, carriers achieve improved efficiencies through
such measures as idle reduction, improved aerodynamics, automatic tire inflation systems, and
driver training. 97 These investments have proven to have a short payback period while reducing
operating costs, and it is possible that in the long run, SmartWay carriers will be able to provide
Section 6 – Recommendations 96
lower costs to their customers as a result of realizing these savings. Additionally, if Aveda can
convince its carriers to participate in SmartWay, it will be able to evaluate each carrier in terms of
energy efficiency and other metrics.
Clearly, challenges exist in convincing Aveda’s existing carriers to participate in SmartWay.
However, EPA offers significant assistance with such efforts, and the trucking industry strongly
supports SmartWay and was instrumental in its development. In fact, SmartWay was launched
at a press conference with the President of the American Trucking Association and former EPA
Administrator Mike Leavitt. The team recommends that Aveda discuss any concerns about
joining the partnership with the EPA SmartWay program manager.98
6.6.3 ENVIRONMENTAL IMPACT OF SOLUTION Since specific energy efficiency goals are developed to meet the needs of each participating
company, at this point it is not possible to precisely quantify the energy and GHG impact of
Aveda’s participating in the program. Nonetheless, it is safe to assume that a net environmental
benefit would result from participation. Although at this early stage in the SmartWay partnership
insufficient carrier data has been collected to quantify improvements in fuel efficiency,
preliminary data suggests that SmartWay partners have achieved fuel efficiency benefits not
realized among firms not participating in SmartWay.99 It is important to note that if Aveda were
to succeed in persuading any of its carriers to join SmartWay, the environmental benefit
associated with the carrier’s overall improved fuel efficiency would be realized well beyond
Aveda’s PDS.
For the purposes of this report, the potential environmental benefits of Aveda’s participation in
SmartWay are therefore quantified using the assumption that SmartWay carriers are 5% more
fuel efficient than non-SmartWay carriers. While each carrier company participating in SmartWay
develops an individual goal with regard to improved fuel efficiency, it is generally expected that
most will improve on the order of 5%. Some carriers, such as Triple S, have achieved
improvements of 10%.100 If “Carrier D,” “Carrier E,” “Carrier F,” and “Carrier H” each gained a
5% fuel efficiency as a result of joining the SmartWay Partnership, the associated improvements
in environmental impact could be described as follows in Table 6T:
Section 6 – Recommendations 97
Table 6M Reductions in Energy Use and GWP Resulting from Aveda’s Top Four Carriers’ Participation in SmartWay (Excluding UPS, Which Already Participates in SmartWay)
Carrier Energy Use Before
SmartWay (MJ)
Energy Use After
SmartWay (MJ)
Reduction in Energy
(MJ)
GWP before SmartWay (kg CO2)
GWP After SmartWay (kg CO2)
Reduction in GWP
Carrier D 5,270,000 5,022,000 248,000 434,000 413,000 21,000 Carrier E 1,385,000 1,327,000 31,000 112,000 108,000 4,000 Carrier F 611,000 582,000 29,000 50,200 47,900 2,300 Carrier H 248,000 237,000 11,000 20,400 19,500 900
Fuel economy improvements modeled are shown below.
Carrier Vehicle Type FE1(mpg) FE2(mpg) Carrier D Standard Class 8 Truck 6.69 7.02 Carrier E Class 8 Truck with Two 28’ Trailers 6.00 6.30 Carrier F Standard Class 8 Truck 6.69 7.02 Carrier H Standard Class 8 Truck 6.69 7.02
No change was made to the fuel economy of the following vehicles:
• Carrier E Cargo Planes – Used for shipment to Hawaii
• Carrier E Ocean Freighters – Used for shipment to Puerto Rico
Such a 5% increase in fuel efficiency from these carriers would reduce the energy and GWP
impact of these carriers by 3.2%, while resulting in a 0.9% reduction to energy use and GWP
associated with Aveda’s PDS.
6.6.4 BUSINESS IMPACT
6.6.4.1 FINANCIAL IMPACT There is no fee to join the SmartWay program, although costs may be incurred relating to Aveda
staff time to adhere to the program reporting requirements. While it is not possible to precisely
estimate the level of effort required for such administration, it is estimated to be in the range of
several hours per month during the initial program enrollment period, and less as the program
becomes institutionalized. Costs savings will also occur as increased fuel efficiencies are
accomplished and less fuel is used. However, this is difficult to estimate considering information
constraints about carriers’ cost structures.
6.6.4.2 OPERATIONAL IMPACT As described above, Aveda transportation staff will need to spend some time adhering to the
program’s reporting requirements. Additional time may also be required to explain the benefits
of participation in the program to Aveda’s carriers, though U.S. EPA has suggested that it can
assist with this effort. However, an important benefit to Aveda in participating in SmartWay is
Section 6 – Recommendations 98
that the program will enable Aveda to maintain a consistent measure of the transportation impact
of its PDS over time.
6.6.4.3 CUSTOMER IMPACT Implementing this recommendation will not impact Aveda’s customers.
Section 6 – Recommendations 99
6.7 RECOMMENDATION 7 - TERTIARY PACKAGING CONTENT REQUIREMENT 6.7.1 PROBLEM DEFINITION Post-consumer recycled (PCR) content is important because the production of virgin paper
products requires more resources and can result in greater air and water pollution than the
production of paper products with PCR content. However, while paper recycling and the use of
recycled content material is generally viewed as a productive strategy for reducing the impacts of
solid waste on society and the environment, this strategy does not always lead to reductions in
energy and global warming emissions. A comparison of the impacts of paper manufactured with
100% post consumer content and that produced from 100% virgin content is presented in Figure
6Y.
Figure 6Y Primary Energy Requirements for the Production of Recycled and Virgin Paper Products101
Prim
ary
Ene
rgy
(MJ/
kg)
0
20
40
60
80
100
Cardboard(BUWAL)
VirginRec.
Kraft(Franklin)
VirginRec.
Newspaper(Franklin)
VirginRec.
Paper Towel(Franklin)
VirginRec.
Paperboard(Franklin)
VirginRec.
Although in many cases energy impacts are similar, newsprint papers were the only category for
which recycling appears to reduce the overall energy requirements of paper product production.
Generally, the use of recycled content in packaging paper products is expected to require energy
in excess of that required by identical virgin paper products.
However, as suggested above, there are other benefits associated with recycled paper that are
beyond the scope of this report, and Aveda purchasers at the three DCs have been successful in
procuring tertiary packaging materials with significant PCR content, as described in detail in
Section 6 – Recommendations 100
section 4.3.1. Because purchasers at the three DCs are currently procuring such materials,
obtaining packaging materials with additional PCR content would result in marginal improvements
to the company’s PDS footprint at best; as described elsewhere in the report, a focus on reducing
the impact of transportation holds significantly more potential for reducing the overall impact of
the PDS.
Despite this success in procuring tertiary packaging with high PCR content, no official policy is in
place at Aveda requiring specified levels of PCR content in tertiary packaging, and packaging
suppliers are not required to provide documentation describing such content. In fact, several
suppliers were unable to provide exact PCR content information to the Michigan team members
during the data collection phase of this project.
6.7.2 PROPOSED SOLUTION While the team does not believe that further increasing the PCR content of tertiary packaging will
result in significant benefits, it is recommended that Aveda adopt recycled content guidelines for
all tertiary packaging that the company purchases, and require suppliers to provide
documentation that their products meet these standards. This will help ensure that Aveda knows
the contents of the materials it purchases. A sample policy is included as Appendix F to this
report.
6.7.3 ENVIRONMENTAL IMPACT OF SOLUTION If Aveda were to institutionalize such a policy, the impact on its PDS would be negligible both in
absolute terms as well as in comparison to the other recommendations offered in this report.
However, the adoption of such a policy would both provide greater certainty to Aveda that the
company is receiving “as advertised” the packaging products that it purchases, as well as help
support the creation of markets for packaging products with PCR content by clearly
communicating to suppliers that demand exists for tertiary packaging with high PCR content.
6.7.4 BUSINESS IMPACT
6.7.4.1 FINANCIAL IMPACT A slight increase in the cost of high PCR packaging may be incurred. This depends on the
supplier and percentage PCR. No other financial impacts are expected from implementation of
this recommendation.
Section 6 – Recommendations 101
6.7.4.2 OPERATIONAL IMPACT No operational impact is expected from implementation of this recommendation.
6.7.4.3 CUSTOMER SERVICE IMPACT Implementing this recommendation will not impact Aveda’s customers.
Section 6 – Recommendations 102
6.8 RECOMMENDATION 8 - ALTERNATIVE TRANSPORT OPPORTUNITIES FROM BLAINE TO THE NEW BLAINE DC 6.8.1 PROBLEM DEFINITION Aveda is building a new distribution center (Blaine DC), to be located 1/8th of a mile from the
Blaine manufacturing facility (Blaine). This recommendation will assess the level of
environmental impact resulting from moving the facility, and identify additional steps that Aveda
can take to decrease or eliminate GWP from the transport of product between the two facilities.
6.8.2 PROPOSED SOLUTION Two feasible options exist for transporting finished goods from the Blaine manufacturing facility
to the new Blaine DC: using biodiesel fuel or a human powered bike system. Given the short
distance between the two facilities, time to transport would not be an issue.
Hybrid class 8 vehicles were considered, but due to the unavailability and uncertain benefits, this
option is not recommended. As background information, several companies have combined
forces to create class 8 hybrid vehicles, but none exist on the commercial market just yet. For
example, FedEx has contracted Eaton to create their hybrid delivery cars.102
6.8.2.1 BIODIESEL There were more than 400 major fleets using biodiesel in May 2004 including all branches of the
US military, Yellowstone National Park, NASA, several state departments of transportation, major
public utility fleets and more than 50 schools including the University of Michigan.103 Soybean oil
and yellow grease usually derived from recycled cooking oil from restaurants are the most
common sources for biodiesel production.104 Two typical blends exist, B20 and B100; these
represent 20% biodiesel and 100% biodiesel respectively.
Biodiesel blends operate in diesel engines, from light to heavy-duty, just like petroleum diesel.
B20 works in any diesel engine with few or no modifications to the engine or the fuel system,
and provides similar horsepower, torque, and mileage as diesel. However, vehicles running on
biodiesel blends may exhibit more drivability problems at less severe winter temperatures than
do vehicles running on petroleum diesel.105 This is a potential concern during the winter in much
of the United States, including Minnesota. The solvent property of biodiesel can cause other fuel-
system problems. Biodiesel may be incompatible with the seals used in the fuel systems of older
vehicles and machinery, necessitating the replacement of those parts if biodiesel blends are
Section 6 – Recommendations 103
used.106 The initial use of B20 or B100 in any vehicle or machine requires care. Petroleum diesel
forms deposits in vehicular fuel systems, and because biodiesel can loosen those deposits, they
can migrate and clog fuel lines and filters.107
Another disadvantage of biodiesel is that it tends to reduce fuel economy. The energy content
per gallon of biodiesel is approximately 11% lower than that of petroleum diesel.108 Vehicles
running on B20 are therefore expected to achieve 2.2% (20% x 11%) fewer miles per gallon of
fuel.”109
High quality biodiesel is available in all 50 states. All National Biodiesel Board (NBB) fuel supplier
members only sell biodiesel that meets the national specification, ASTM D 6751.110 There are
several ways to purchase the fuel such as through marketing agencies or direct from suppliers.
6.8.2.2 HUMAN POWERED TRANSPORTATION Two human powered transportation companies have been identified that would be able to create
vehicles capable of transporting pallets from Blaine to the Blaine DC. Human Powered Machines
(HPM) was established in 1991. HPM’s primary interest is in relieving urban congestion by
building load-carrying work-bikes. HPM produces many types of vehicles including utility trailers,
folding bikes, hand- powered vehicles and farm machines. The production of these vehicles
integrates youth apprentices whenever possible.
The most promising option is Organic Engines in Tallahassee, Florida which has produced
bicycles capable of towing sailboats. Conversations with Organic Engines, specifically Daniel
Kavanagh, revealed that the weight being towed will not be an issue, but that speed will slow
significantly. A custom bike can be built that can tow a pallet of Aveda’s product from Blaine to
the new Blaine DC. Mr. Kavanagh is confident that his bikes can be used year round and that
bikes can be custom-developed to accommodate the operational needs of Aveda. The estimated
travel time of actual transport of a pallet 1/8th of a mile is 2 minutes.111 The total time will
depend on how long it takes the forklifts to load and unload the pallets from the bikes and also
extra time to cross the street. A traffic sign may be needed to alert cars of the bike crossing.
Section 6 – Recommendations 104
Figure 6Z Example of Bicycle capable of towing cargo112
6.8.3 ENVIRONMENTAL IMPACT OF SOLUTION Key Data Assumptions:
• Aveda ships 100 pallets a day from Blaine to Roseville.113
• Vehicle loading and unloading each require one hour. Vehicles idle during this period.
• Trucks used in this analysis use 0.8 gal of diesel fuel equivalent for each hour of idle time.114
• Total delivery distance is 1/8 mile each way.
• Average fuel economy for a standard tractor-trailer over this short distance is 4 mpg.
• Empty return improves fuel economy by 12.5%.115
• All vehicles deliver 30,000 lbs/load.
• Diesel fuel equivalents for biodiesel fuels are 0.96 gal B20/gal diesel, and 1.10 gal B100/gal diesel.116
• Only fossil fuel sources are accounted for in energy and CO2 values.
• B20 uses 86% of the energy and releases 84% of the CO2 of conventional diesel. B100 uses 26% of the energy and 21% of the CO2 of conventional diesel.117
6.8.3.1 CONVENTIONAL TRACTOR TRAILERS Making these deliveries to the new Blaine distribution center with a conventional tractor-trailer
would require 221,760 MJ. Current deliveries over 10 miles to Roseville require 374,400 MJ.
This move results in a 41% decrease in MJ needed to complete deliveries.
Section 6 – Recommendations 105
6.8.3.2 USE OF BIODIESEL FOR SHIPMENTS FROM BLAINE MANUFACTURING TO BLAINE
WAREHOUSE Biodiesel works in any diesel engine with few or no modifications to the engine or the fuel
system.118 Two types of bio-diesel fuels are considered here. Blends of 20% biodiesel with 80%
petroleum diesel (B20) can generally be used in unmodified diesel engines. Check your
manufacturer’s warranty to be sure it won’t affect coverage. Biodiesel can also be used in its
pure form (B100), but it may require minor engine modifications to avoid maintenance and
performance problems.
6.8.3.3 BIODIESEL, 20% BLEND Using B20 in place of conventional diesel further decreases energy use to approximately 182,160
MJ. This provides an 18% reduction in both energy use and GWP.
6.8.3.4 100% BIODIESEL Using B100 would further reduce primary energy requirements to 62,160 MJ. This represents a
72% decrease from conventional diesel energy use. However, this value assumes that no engine
modifications would be required to operate on 100% biodiesel. This is likely not the case.
Engine modifications may be expected to slightly decrease the benefits of using 100% biodiesel.
Additionally, challenges with cold weather performance may make B100 an unfeasible option for
year-round use in Minnesota.
6.8.3.5 USE OF BICYCLE There are relatively little impacts from using bicycles to transport pallets from Blaine to the new
Blaine DC. Specifically, no GHG or GWP impact would result from the use of the bicycles.
However, negligible impacts might result from their fabrication.
6.8.3.6 SUMMARY OF ALTERNATIVES Figure 6AA shows that by re-locating the Roseville DC to across the street from Blaine without
changing the vehicle decreases energy use and GWP by 41%. The 221,760 MJ required for
conventional tractor-trailer delivery to the new location would be about 1% of the total
distribution system energy use. By switching to B20 trucks, this would further decrease energy
use and GWP by 18%. Using B100 trucks would decrease MJ by 72% of the conventional truck
value. The ultimate reduction would be through the use of human powered bikes to transport
pallets from Blaine to the Blaine DC resulting in zero environmental impact.
Section 6 – Recommendations 106
Figure 6AA Environmental Impact of transportation of pallets from Blaine to Roseville and the new Blaine DC
050
100150200250300350400
CurrentTrucks toRoseville
CurrentTrucks to
New BlaineDC
B20 Trucksto New
Blaine DC
B100 Trucksto New
Blaine DC
Bike to NewDC
MJ
(thou
sand
s)
6.8.4 BUSINESS IMPACT OF SOLUTION The costs associated with the biodiesel option and the bicycle option are described below.
Organic Engines would be able to create a customized bike for $5,000 and each additional bike
for $2,500. The bikes can be designed to accommodate transportation of the pallets from a
forklift onto the bike as well as for specific weight loads. The weight load considered for this
scenario is up to 2,500 pounds per trip (approximately one pallet per trip). Given that there are
roughly 100 pallets transferred per day from Blaine to Roseville and assuming that it would take
five minutes to load, five minutes to unload, three minutes for transport, and two minutes to
return to Blaine, the total time for round trip delivery of a pallet is fifteen minutes. This equates
to four pallets per hour and 32 pallets in an eight hour shift. We estimate that it will take three
bikes transporting pallets for eight hours per day to accommodate Aveda’s PDS. The cost for
three bikes would be about $10,000 not including labor.
There are two options for how biodiesel is supplied to Aveda. One is to use a fueling company
that arrives on site and fills tanks at night. There are 3 main companies in the twin city area:
Farmer’s Union Coop Oil, Cannon Valley, and Lube Tech. The second option is to have a bulk
tank on site. A permit is needed for the tank and can be obtained from the county. There would
be an additional capital cost to either rent a tank or purchase one.
Performance and maintenance of the trucks do not change. However, biodiesel is an excellent
lubricant; if using old trucks, the fuel will flush dirt from the tank through the filter and will clog.
Section 6 – Recommendations 107
Old trucks that switch over to biodiesel will need to change their filter every few days.
Eventually, the fuel tank will be cleaned and filters will not need to be changed. It is not advised
to use greater than B20 in the winter because the fuel will crystallize and clog the filter.
A great resource is the biodiesel help line at the University of Minnesota. Contact Kelly Strrebig
at 615.457.1404. Given the other advantages of biodiesel, though, an emission management
system with biodiesel is a least-cost alternative. A study by Booz-Allen & Hamilton, Inc., found
fleets using a 20% biodiesel blend would experience lower total annual costs than other
alternative fuels.119 The cost of biodiesel depends on the market price for vegetable oil. In
general, biodiesel blended at a 20% level with petroleum diesel costs approximately 20 cents per
gallon more than diesel alone. As a rule of thumb there is a 1¢ increase per 1% increase in
biodiesel (B20 ~ 20¢ increase per gallon). There are no additional increases in costs. Similarly,
results reported by the University of Georgia indicate biodiesel-powered buses are competitive
with other alternatively fueled buses with biodiesel prices as high as $3 per gallon.120
Section 7 – Future Directions 108
SECTION 7 – FUTURE INVESTIGATIONS Aveda’s business is constantly changing to meet the demands of customers, react to competition
and reduce costs. The recommendations in this report are provided in the context of the state of
the business in early 2004 and are limited to the PDS as defined above. However, since this
project commenced, several business issues have arisen that may affect our analysis and
recommendations or that are outside the scope of this project. These issues should be
considered for future study:
7.1 HAWAII For the period studied in this report, shipments to Hawaii traveled via air. However, since the
report was started, Aveda has begun shipping to its Hawaiian stores via ocean in order to reduce
costs to serve this customer base by approximately 75% or almost $200,000. It should be
noted, that the customers were not paying for the high shipping fees, instead Aveda was
spending significant money just to ship product to the region. In addition to the cost savings,
there is a large environmental benefit, which actually was not considered when making the
change.
Had Aveda not already initiated this switch, the primary recommendation of this report would
have been to switch Hawaiian shipments to ocean. However, Aveda has not been able to
completely eliminate air shipments to Hawaii, primarily because there has been criticism and
pushback from customers due to the increased shipping times (13 days vs. 2 days). The
environmental benefit of the switch is provided below, and Aveda should complete the
implementation of ocean shipping and continue to look for environmental savings to highlight
areas that could also provide cost savings. Furthermore, in light of the criticism Aveda has
received from some of its customers in Hawaii, this analysis is intended to provide a better story
to tell Aveda salons and institutes to encourage their cooperation.
Section 7 – Future Directions 109
Figure 7A Energy and GWP impact of Switching Hawaiian shipments via air to ocean
As illustrated in the graph below, shipments from LADC to Hawaii constituted 3,010,000 MJ and
222,000 kg of CO2. By switching from air cargo to ocean freight, the impact is reduced by almost
98% to 66,600 MJ and 5,310 kg CO2. 2,943,400 MJ is equivalent to approximately 22,300
gallons of automobile fuel, enough to fuel approximately 43 vehicles in the U.S. for one year.
Additionally, the reduction in emissions of 216,690 kg CO2 is equivalent to the emissions from
approximately 50 automobiles.
The following charts (Figures 7B through 7F) show how the corresponding charts in section 5
would change if all Hawaiian orders were shipped via ocean.
Figure 7B Total Annualized Transportation Energy and GWP For Products Leaving Aveda-Owned DCs
3,010,000
66,600-
500,000
1,000,000
1,500,000
2,000,000
2,500,000
3,000,000
3,500,000
Haw aii Via Air Haw aii Via Ocean
Ener
gy (M
J)
222,000
5,310-
50,000
100,000
150,000
200,000
250,000
Haw aii Via Air Haw aii Via Ocean
GW
P (k
g C
O2
equi
v.)
2.06 1.770.37 0.03
18.63
0
4
8
12
16
20
Roseville LADC PADC Blaine Other
Shipments Leaving Facility
Ener
gy (M
illio
n M
J)
14631 2
169
1,532
-
500
1,000
1,500
2,000
Roseville LADC PADC Blaine Other
Shipments Leaving Facility
GW
P (m
etric
tons
CO
2 eq
uiva
lent
s)
Total Energy = 22.9 MM MJ Total GWP = 1,880 Metric Tons
Section 7 – Future Directions 110
Figure 7C Total Annualized Transportation Energy and GWP To Retail and Salon For Distribution Centers
Figure 7D Weight-Based Transportation Energy and GWP for each DC
2.51
0.51
1.08
1.231.51
0.07-
1.00
2.00
3.00
4.00
Roseville LADC PADC
Shipments Leaving Facility
Ener
gy
(Mil
lion
MJ)
Retail Salon
207
42
88
102124
6-
100
200
300
400
Roseville LADC PADC
Shipments Leaving Facility
GW
P (
met
ric
ton
CO
2
equ
ival
ents
)
Retail Salon
1.5
0.7
0.1
0.9 0.9
1.3
-
1
1
2
2
Roseville LADC PADC
Shipments Leaving Facility
Ener
gy (M
J pe
r kg
ship
ped)
Retail Salon
0.12
0.06
0.01
0.080.07
0.11
-
0.1
0.1
0.2
Roseville LADC PADC
Shipments Leaving Facility
GW
P (k
g C
O2
per k
g sh
ippe
d)
Retail Salon
Section 7 – Future Directions 111
Figure 7E Weight-Distance-Based Transportation Energy and GWP per DC
Figure 7F Total PDS Energy and GWP Impact
7.2 PRODUCT RETURNS During our research phase, we discovered that the Roseville DC receives between one and three
cartons a day of returned product. Each carton contains between eight and twelve items.
Several reasons for returned product are:
• The product is damaged in transit and customer returns are sent to the distribution center. In some cases, the damage is superficial and the contents can be used on the backbar.
0.91.1 1.0
1.51.2
2.9
0
1
2
3
4
Roseville LADC PADC
Shipments Leaving Facility
Ener
gy (M
J pe
r met
ric-t
on-k
m)
Retail Salon
0.120.10
0.24
0.080.09 0.08
-
0.1
0.2
0.3
Roseville LADC PADC
Shipments Leaving Facility
GW
P (k
g C
O2
per m
etric
ton-
km)
Retail Salon
22.9
10.7
0
5
10
15
20
25
30
35
40
Energy
Ener
gy (M
illio
n M
J)
1,880
714
-
500
1,000
1,500
2,000
2,500
3,000
GWP
GW
P (m
etri
c to
n of
CO
2 eq
uiva
lent
s) 2,59433.6
Packaging
Transportation
Packaging
Transportation
Section 7 – Future Directions 112
• End-use customer returns due to an adverse reaction with the Aveda product. These products are shipped directly to customer service.
• End-use customer does not like the product or exchanges it for something else, the unused portion of the product cannot be reused and must be disposed. In the past, the salon or retail client would locally dispose of the contents of the product and recycle the packaging. However, starting in Oct 2004, Estée Lauder requires that all its retail outlets dispose the contents of its product in specialized buckets containing anhydrous material.
• Customer returns due to salon refusal (e.g., cannot pay the COD).
We did not model the environmental impact of these returns, but believe that its impact is
significant given that the product is packed as a loose-pick, shipped via UPS, and travels over
twice the distance that a product would normally. The weight of these returns will increase
significantly, as Estée Lauder rolls-out the product-disposal bucket, which will add significantly to
the total weight of shipping returns.
7.3 THE NEW LADC Our interviews with Aveda managers revealed that there is a proposal to move the current LADC
to another location. Moving the LADC to another location in the Los Angeles region will not
impact our model significantly, but should Aveda plan to move it outside that area, the life-cycle
analysis model would need to be updated.
As alluded to in Section 6.1, the new LADC location should reflect the future growth of the
company. Currently, the LADC serves retail stores and salons in AZ, CA, NV, OR, WA. The new
location should reflect the company’s strategy in future growth and be situated in location that
most efficiently serves all these locations. Considering current store and salon locations, a facility
in Reno, NV or Denver, CO would be better situated than the current location.
7.4 ONE SKU PER PALLET There is a common practice in the shipment of goods where customers demand that only one
SKU be put on a pallet, rather than having a mixed pallet. Having one SKU per pallet facilitates
the transfer of the goods from the truck to a specific shelf location. In other words, the receivers
are relieved of the need to sort the product as it comes in. This practice may increase worker’s
safety on the floor by reducing the amount of lifting and twisting to move the boxes, but it
increases shipping costs and environmental impact due to increased packaging and lower truck
utilization.
Section 7 – Future Directions 113
Since we modeled transportation and packaging at an aggregate level, we did not measure the
environmental impact that these shipping policies have on Aveda’s TPS. However, as the
background research for Section 6.5 reveals, shipping full or mixed pallets is the most efficient
shipping option available to Aveda. Aveda should further investigate the number of customers
with this shipping policy and collaborate with them to find alternative solutions.
7.5 THE BLAINE MAILROOM Our project scope did not include the shipping from the Aveda mailrooms. However, interviews
with Aveda mailroom staff revealed that violations of the company’s no-air policy stem from the
Blaine mailroom. While payroll checks must be shipped by air to all the retail stores to ensure
timely delivery, there are approximately 20 additional overnight shipments sent out of the Blaine
mailroom per day. There are three major sources for this:
• Aveda staff can ship 1-, 2- or 3-day packages from the front mailroom, however, they must walk over to loading dock in order to ship UPS ground. Aveda staff cannot ship out via ground from the front mailroom because Merrill Corporation, the contractors who run the front-mailroom, only manage 1-, 2-, or 3- day packages. This system does not sufficiently encourage Aveda staff to use UPS ground, because of the additional time and inconvenience to utilize the “back mailroom” located near the loading docks.
• Given the nature of Aveda’s business, there are many salon or retail events throughout the country on the weekends but due to the tight deadlines, most of the promotional materials are shipped out on Thursday or Friday. As a result, heavy promotional materials are shipped by air.
• Currently there is a system to consolidate shipping between the Blaine and New York City offices. The so-called “pouch” leaves Blaine every Tuesday and Thursday. Interviews with management suggest that this pouch could be more fully utilized.
Clearly, a company the size of Aveda cannot fully wean itself of air shipping but small changes to
the Blaine mailroom will greatly ameliorate the abuse of the no-air policy that is currently in
place.
• We recommend that Aveda change the contract with the mailroom staff and allow for packages shipped by ground to be dropped off in the front mailroom.
• Additionally, marketing and promotions should be encourage to have their promotional materials ready by Tuesday or Wednesday is order to take advantage of UPS ground. Aveda should investigate the possibility of tying financial incentives to department accounts to encourage this behavior.
• The pouch system is a great idea, but it is not well understood at the company. A non-scientific survey of staff revealed few people knew that it existed, much less how it works and when the pouch reaches its destination. Aveda should publicize this mail consolidation option through an educational campaign (e.g., posters in the mailroom). Additionally, the mailroom plans to shift the pouch schedule to pickups on Monday and
Section 7 – Future Directions 114
Wednesday with the hopes of reducing the reliance on air-shipping. This should be tracked carefully to ensure the desired behavior is achieved.
7.6 MOVING PRODUCT FROM MANUFACTURING TO THE WAREHOUSE We end this research paper on an issue that inspired Aveda to fund this student project.
Currently, the manufacturing facility packages all their products in master cartons, palletizes
them, and then ships about 100 pallets to Roseville. Approximately 30% of the master cartons
are taken off the pallets and moved to the loose-pick area, where the contents are picked one at
time. When the box is emptied, it is reused approximately 10% of the time, but otherwise, it is
recycled. In terms of packaging, this system is very wasteful, because a sizeable portion of all
master cartons are discarded and sent to a recycling facility or discarded after a single use.
Aveda should explore the option of using reusable totes (e.g., similar to the blue bins used to
deliver product to Minneapolis salons and retail stores) to move finished product between the
manufacturing facility and warehouse. Given that Aveda has data for each SKU that describes
the percentage of product shipped via pallet or loose-pick, one could allocate the percentage of
product per SKU that gets packaged in totes versus master cartons. In other words, at the end
of the fill line, the packer can allocate a portion of the run to master cartons and the remainder
to totes.
The feasibility of this option needs to be fully explored particularly as it raises many pragmatic
issues, such as:
• Many of the high-speed fill-line have automated packers. Unless these can be retooled, this tote system is restricted to those lines with manual packing.
• Each SKU may require more storage space in the warehouse.
• The new totes would have to fit the dimensions of the loose-pick tracks.
• Increased logistical challenges in managing FIFO.
In terms of cost, Wal-Mart and Target have stated that they are able to recoup the investment
after six to eight turns of the re-usable trays that they use in their retail operations.121 We can
expect that the same would be true for Aveda.
Section 8 – Glossary 115
SECTION 8 – GLOSSARY ASI – Aveda Services Inc. is the legal entity that manages retail stores and the independent
salons serviced out of the west coast and east coast distribution centers.
Backbar – Personal care products (typically shampoo) used by salons to wash customers’ hair.
Usually sold in larger containers and not available for retail sale.
Class 8 Truck - A classification by the Department of Transportation to describe the tractors
normally used to haul trailers commonly seen traveling US roadways. They area also referred to
as Tractor Trailers.
Contracted Carrier – A term used to describe companies that provide LTL and TL
transportation.
DOT - Department of Transportation which publishes energy values for fuel as well as truck
classifications.
Dunnage – loose materials used to support and protect products packed in loose-pick boxes
(e.g., padding).
FSC – Forest Stewardship Council is a third-party organization that provides best practices in
sustainable forestry, and certifies the wood products made from those timber stands.
Full pallet – A pallet holding multiple master cartons of one SKU, often stacked no more than
four feet high.
Greenhouse Gas - Greenhouse gases occur both naturally and as a result of human activities.
Natural occurring GHGs include water vapor, carbon dioxide, methane, nitrous oxide, and ozone.
Often, GHGs such as carbon dioxide, methane, and nitrous oxide are often elevated due to
human activities.
GWP – Global Warming Potential. Describes the total greenhouse gas emissions equated in
units kg carbon equivalents. GWP weights each gas by its GWP value which reflects each gas’
cumulative radiative force. CO2 is the reference gas so each unit is counted once, while methane
(CH4) is 23-times more powerful, so each unit of methane is multiplied 23 times.
Section 8 – Glossary 116
Kraft paper - Paper used to fill empty space in package shipments and to cushion products to
protect them from damage.
LADC—Acronym for Los Angeles Distribution Center, located in Compton, CA. This DC is owned
by Aveda and exclusively distributes its products to salons, retail stores and all other customers in
Washington, Oregon, Canada, Nevada, and Arizona. LADC receives approximately 95% of its
incoming product from the Roseville distribution center.
Loose-pick order – A customer order for a specific quantity of product that is fewer in number
than contained in the master carton.
Loose-pick boxes – Multiple SKUs are taken out of their original master cartons and re-packed
in one or more corrugated boxes that have reinforced walls. There are three types of loose-pick
order boxes available. Additionally, these boxes are not designed for any specific product type
and consequently require a significant amount of dunnage to protect the product.
LTL – Less than truckload. Describes typical shipments of pallets in North America. Trucks pick
up pallets from customers in multiple locations, and then often pass through a hub to optimize
truck cargo before continuing on a longer transportation leg.
Master carton – The corrugated box in which one SKU of product is packed. For example, a
typical master carton may hold 24 125 ml shampoo bottles.
Mega-joule – a unit of work or energy equal to the work done by a force of one Newton acting
through a distance of one meter.
Mixed pallet – A pallet containing multiple SKUs.
PADC—Acronym for Pennsylvania Distribution Center, located in Bristol, PA. This DC is owned
by Estée Lauder, and the central distribution center for all Estée Lauder’s fifteen brands. The
PADC distribution area includes New England, New York, New Jersey, Pennsylvania, Delaware,
Maryland, Virginia, West Virginia and North Carolina.
Section 8 – Glossary 117
Parcel shipping – distribution of wrapped bundles or packages from manufacturer to consumer.
In this report, the parcels are either full master cartons or loose-pick boxes and are shipped via
FedEx or UPS.
PCR content – Post-Consumer Recycled content. Describes the portion of the product made
with materials that have completed there intended use by consumers and would otherwise have
been disposed as solid waste. These materials are those commonly recycled by municipalities
and include newspaper, office paper, cardboard and aluminum cans.
PDS – Product Delivery System. This includes tertiary packaging and transportation required to
deliver Aveda’s products to its customers.
Primary packaging - Contains the product as received by the consumer (e.g., a shampoo
bottle or perfume bottle).
Retail store – Stores that are owned and operated by Aveda
Salon – Salons that use and sell Aveda products are independently owned and operated.
Secondary packaging - Organizes multiples of products (e.g., trays for tins of baked beans,
carriers for beer bottles, and display packs) or serves as an outer wrapping that stores,
transports, informs, displays and/or protects the product (e.g., decorated carton, gift box).
SKU – Stock Keeping Unit is a unique alpha-numeric code used to identify a product type.
Tertiary packaging - The transport-packaging unit (e.g., corrugated cardboard cartons,
wooden pallets, and plastic shrink wrap).
TL – Truck load. Describes a method of truck transportation in which an entire truck is
contracted for a direct route. These shipments usually have the highest utilization rates.
Tractor trailers - See Class 8 Truck.
U.S. Maritime Administration – A U.S. federal agency that publishes fuel consumption rates
and payload for ocean freight.
Section 9 – Appendices 118
SECTION 9 - APPENDICES APPENDIX A - PACKAGING MODELING ASSUMPTIONS AND METHODOLOGY A1 PACKAGING MODELING ASSUMPTIONS The use of wood in this model is treated as the use of a material resource (not as a fuel, thereby
excluding wood from the energy analysis) and wood is considered carbon neutral – carbon
emissions associated with wood combustion are excluded from the global warming gas
assessment.
Throughout these notes and in the associated model, the term “recycled content” is taken to
refer to post-consumer recycled content unless otherwise specified. Content not specified as
recycled is assumed to come from a standard mix of post-industrial (24%) and virgin sources
(76%).
No information on pallets is currently incorporated into the model. Where possible, information
on package quantities, sizes, weights, and material composition were taken from Aveda records
and supplier data. When incomplete data were available alternative reference sources and
assumptions were utilized to fill data gaps. Specific examples are noted in the points that follow.
Industry average recycled content for paperboard (including roll cores, etc) was taken as 28%,
while recycled content for fluting medium in corrugated containers was taken as 59% (Oregon
DEQ packaging study). Industry average values were used when specific data were not
available.
Cellulose tissue was treated as “unbleached cellulose sulfate paper” and modeled using data for
Swiss processes. The data used reflect 29% recycled content. Other recycled content levels
were not modeled.
Corrugated cardboard boxes were assumed to have a composition of 65% linerboard, 32.5%
fluting medium, and 2.5% adhesive based on the midpoint of the range of values provided by
Uline (45-85% linerboard, 15-50% medium, 1-3% adhesive) and the industry average statistics
provided in the Oregon DEQ study (68% linerboard, 32% medium).
Cohesive products were assumed to be composed of a kraft liner (50% by weight) and a kraft
fluting (50% by weight) with 100% post-consumer recycled content in liner and 30% post
Section 9 – Appendices 119
consumer content in the fluting. Fill Pak material is assumed to be 100% kraft based on
information from the RanPak Company.
The overall recycled content range for Ernest Paper boxes (50% - 60% as provided by the
manufacturer) was assumed to come from 100% recycled fluting and 28% (industry average)
recycled content liner. Providing and overall package recycled content of 51%.
Ernest Paper chipboard weight calculated assuming each piece is a flat sheet with dimensions of
10 1/8” x 8 3/16” (per N. Arbitman telephone conversation with supplier). This provides a total
area of 82.9 sq. in. for each piece (0.576 sq. ft). Using an average density (from Encyclopedia of
Packaging Technology) of 0.1 lb/sq ft, the total piece weight would be 0.0576 lbs.
Bubble wrap bundles treated as 50% LDPE and 50% LLDPE per Oregon DEQ Study. Bubble
wrap weight calculated based on Oregon DEQ data as 0.03 lbs/sqft.
Marlee Corroseal wrap modeled as 48% kraft fluting and 52% kraft liner based on manufacturer
A3 MODEL IMPLEMENTATION A model of the annual impacts for production and delivery of packaging material to Aveda
manufacturing and distribution centers has been developed using SimaPro (v. 5.1).
A4 RESULTS Figure A2 provides a flow diagram for the system showing major sources of energy use and
indicating relative importance of each process graphically.
A5 ENERGY USE AND PAPER RECYCLING While paper recycling and the use of recycled content material is generally viewed as a
productive strategy for reducing the impacts of solid waste on society and the environment, this
strategy does not always lead to reductions in energy and global warming emissions. As part of
the initial modeling effort, sources comparing paper manufactured with 100% post consumer
content to that produced from 100% virgin content were analyzed. The results are shown in the
graph below.
1 Preliminary analysis of the cradle-to-gate life cycle inventory of the annual packaging material required for the Roseville DC.
Section 9 – Appendices 122
Figure A1 Primary Energy Requirements for the Production of Recycled and Virgin Paper Products (source: SimaPro data libraries)
Prim
ary
Ene
rgy
(MJ/
kg)
0
20
40
60
80
100
Cardboard(BUWAL)
VirginRec.
Kraft(Franklin)
VirginRec.
Newspaper(Franklin)
VirginRec.
Paper Towel(Franklin)
VirginRec.
Paperboard(Franklin)
VirginRec.
Although in many cases energy impacts are similar, newsprint papers were the only category for
which recycling appears to reduce the overall energy requirements of paper product production.
Generally, the use of recycled content in packaging paper products is expected to require energy
in excess of that required by identical virgin paper products.
Section 9 – Appendices 123
Figure A2 Process Contributions to Cradle-to-Gate Life Cycle Primary Energy Use
Section 9 – Appendices 124
A6 ANNOTATED REFERENCES Brody, A. L. and Marsh, K. S. (Eds.) (1997) The Wiley Encyclopedia of Packaging Technology,
Wiley, New York Provided reference data for package material densities and typical
applications.
Franklin Associates (2004) Life Cycle Inventory of Packaging Options for Shipment of Retail Mail-
Order Soft Goods, Oregon Department of Environmental Quality, Salem, OR.
Provided package production inventory data, national average package composition data,
and recycled content for typical packages.
Houghton, J. T., Ding, Y., Griggs, D. J., Noguer, M., Linden, P. J. v. d., Dai, X., Maskell, K. and
Johnson, C. A. (Eds.) (2001) Contributions of Working Group I to the Third Assessment
Report of the Intergovernmental Panel on Climate Change, Cambridge University Press,
New York. Provided impact assessment values for global warming potential evaluation.
SAEFL (1998) Life Cycle Inventories for Packagings, Swiss Agency for the Environment, Forests,
and Landscape (BUWAL), Berne, Switzerland. Provided data on cellulose based paper
materials.
Section 9 – Appendices 125
APPENDIX B - TRANSPORTATION MODELING ASSUMPTIONS AND METHODOLOGY B1 INITIAL DATA Aveda provided the team with 5-months of LTL shipment data from October 2003 to March 2004.
Each row of data included:
• Carrier Name – Any of 39 carriers listed in the data file
• Weight – The actual weight of the shipment
• Ship From Information – Included Company Name, Address, City, State and Zip
• Ship To Information – Included Company Name, Address, City, State and Zip
In order to analyze the data, the origin and destination of each shipment was coded. The codes
were as follows:
FROM
• Retail – If coming from one of the 131 listed retail stores provided by Aveda
• Salon – If coming from a salon. Salons were identified by a list of Aveda Services Inc. serviced salons and through the online salon directory at Aveda.com.
• Third-party USDC – If coming from one of the Third-party U.S. distributors
• Third-party CADC - If coming from one of the Third-party Canadian distributors
• LADC
• PADC
• Roseville
• Blaine
TO
• LADC
• PADC
• Roseville
• Blaine
• Retail – If going to one of the 131 listed retail stores provided by Aveda
• Salon – If going to a salon. Salons were identified by a list of Aveda Services Inc. serviced salons and through the online salon directory at Aveda.com.
Section 9 – Appendices 126
• Third-party USDC – If going to one of the Third-party U.S. distributors
• Third-party CADC - If going to one of the Third-party Canadian distributors
B2 OTHER CARRIERS There are a few carriers that do not provide detailed shipment data to Aveda. Instead they
provide a monthly total for each DC. Therefore, this data needed to be distributed among the
stores each carrier ships to. The assumptions were unique to each carrier.
Carrier B – This carrier provides a “dedicated run” to 18 stores in the NYC region. These
shipments depart out of PADC and contain products for both Aveda and Origins stores. These
stores are both owned by Estee Lauder and are co-located, which makes combined shipments
optimal for these stores. The total shipments were assumed equally distributed to each store,
except for stores that receive shipments every week, instead of every other week.
Carrier A – This carrier ships to 12 retail stores in southern California out of LADC. From LADC
they go once a day by straight truck (24 ft with lift gate) to the carrier’s hub nearby. From the
hub, salons orders are shipped by cargo van (varying size and model) to all of Southern CA (LA
to border).
The total shipments were assumed equally distributed to each store, except for one store that
receives shipments every week, instead of every other week.
B3 MODELING ASSUMPTIONS
• All vehicles are weight-limited. Therefore, the impacts from transportation can be allocated to Aveda based on the mass of product shipped.
• Road vehicles and locomotives are powered with diesel fuel. Ocean freighters are powered by fuel oil turbines (number 5 fuel oil). Cargo planes are fueled with jet fuel (kerosene).
• Unless specific data were available from carriers, vehicles modeled in the study had the following characteristics:
Section 9 – Appendices 127
Table B1 Vehicle types, payload and fuel economy used in model Vehicle Type Payload (lbs) Fuel Economy
(miles per gal fuel) Data Source
Class 2 Truck/Van 7,200 14.11 (Davis and Diegel 2003) Class 7 Truck 26,500 7.07 (Davis and Diegel 2003) Class 8 Truck 35,000 6.69 (Davis and Diegel 2003) Locomotive 6,000,000 0.135 (Davis and Diegel 2003) Ocean Freighter 44,000,000 0.024 (Maritime Administration 2002) UPS Cargo Plane 58,000 0.340 (Air Transport Association 2002)
• UPS delivery vehicles (frequently referred to as UPS “Brown” Trucks) were modeled using information provided by UPS representatives. Information provided included an average delivery load of 2,500 lbs, an average fuel economy of 8 mpg, and an average delivery distance of 50 miles.
• Franklin Associates estimates for the combustion of fuel have been used for consistency with inventory model calculations. Fuel combustion impacts, including CO2 and CH4 emissions resulting from fuel combustion (including upstream), net crude oil input requirements, total primary energy, and total global warming potential are shown below.
Table B2 Greenhouse gas emissions and energy associated with different fuel types
Fuel Vehicle CO2 (kg/gal) CH4 (g/gal) Crude Oil (kg/gal)
• When additional data were unavailable, all transportation and product delivery operations were modeled assuming class 8 trucks were used for the full delivery distance. Generally these vehicles are used for the vast majority of transportation distances for the carriers studied.
• Assumptions on truck type were made based on interviews with specific carriers.
• Carrier C: Full transport distance is covered using Class 7 Trucks
• Carrier A: For shipments from LADC, all shipments travel 44 miles to a local hub via strait truck (assumed to be a Class 7 Truck as described above). From here deliveries are made to the greater LA area via delivery truck/cargo van (assumed to be a Class 2 Truck).
• Carrier E: Full transport distance provided in 28 foot trailers. Two trailers are attached to a single tractor (truck) during transportation. This articulated vehicle provides an overall payload of 40,000 lbs at a fuel economy of 6 mpg.
• Carrier I: For shipments from PADC, all shipments travel 16 miles to a local hub via a 28-foot single unit truck (Class 7 Truck). Transportation to final destination is provided by a Class 8 tractor-trailer. For shipments from Blaine, MN, all shipments go directly to customer on Class 8 trucks.
Section 9 – Appendices 128
• Federal Express (FedEx) ground shipments are considered identical to UPS shipments. The following FedEx shipments include airborne transportation: 2nd Day shipments over 1000 miles, Standard Overnight shipments over 200 miles, and Priority Overnight shipments over 200 miles. Airborne shipments include transport via class 8 truck to the closest commercial airport, use the data provided above for UPS cargo planes, and include 50 miles of delivery truck driving to final customer location.
• Delivery distances for deliveries to Puerto Rico were estimated using two stages. The first stage consisted of road transport from Roseville to Miami, FL (1791 miles). From there, ocean freighter transport to San Juan, PR was estimated using the projected distance from Miami (1032 miles).
• Deliveries to Hawaii were modeled using two transportation stages. First product is transported via Class 8 Truck to a port in the Los Angeles area (18 miles from LADC). From here product is transported via air transport (using the UPS aircraft profile shown above) to Hawaii (2552 miles). Air transport was utilized at the time of the data collection for this model; however, the effects of the recent switch to ocean freighter transport are modeled in a separate scenario.
B4 SHIPMENTS FROM BLAINE TO ROSEVILLE Total weight of shipments from Blaine to Roseville was calculated assuming no net accumulation
of mass in Roseville during the period of analysis. That is, the total weight of shipments leaving
Roseville must equal the total weight of shipments entering Roseville. Shipments from Blaine are
believed to account for the majority of the mass of product entering Roseville. These shipments
are transported via Class 8 Trucks with an average load of 30,000 lbs each.
Trailers return to Blaine empty and the fuel use for the return trip is also allocated to the
delivery. According to the US DOE 21st Century Truck Program, a reduction in load weight of
30,000 lbs would reduce fuel consumption by 12.5%.122 This means that the return trip uses
only 87.5% of the energy used in the delivery trip (this is reflected in the model through the use
of a total route delivery factor of 1.875).
B5 CALCULATING EXPECTED DRIVING DISTANCE When possible, data from the Mapquest driving distance database (mapquest.com) were used as
the distance between the origin and destination zip codes. However, this data is time consuming
to collect and impractical for a large number of deliveries. Therefore an alternative methodology
was used for some distance data.
This method consists of two steps. First the “as the crow flies” distance between two zip codes
was calculated based on the latitude and longitude for the center of the zip code area. Then
these values were then adjusted by a distance-based factor in order to account for expected
Section 9 – Appendices 129
differences between linear distance and driving distance. These calculations are explained in
detail below.
The distance between two zip codes was calculated based on coordinate data provided for the
center of the zip code area in the Census bureau Zip Code Tabulation Area data files. Distance
between any two points (with coordinates in radians) can be calculated using the following
formula:
213958.75 arctanZip
xDx
⎛ ⎞−⎜ ⎟= ×⎜ ⎟⎝ ⎠
Where,
( ) ( ) ( ) ( ) ( )sin sin cos cos cosfrm to frm to to frmx lat lat lat lat lon lon⎡ ⎤ ⎡ ⎤= × + × × −⎣ ⎦ ⎣ ⎦
latfrm = latitude for from zip code
latto = latitude for to zip code
lonfrm = longitude for from zip code
lonto = longitude for to zip code
However, distances calculated in this way differ significantly from the driving distances taken
from the Mapquest database. In order to provide a distance values more consistent with
published driving distances, the driving distance was compared to the liner distance for 450 data
points. The result is shown in the figure below:
Section 9 – Appendices 130
Figure B1 Calculation of expected driving distances
y = -2.0889E-05x + 2.2186E-01
0%
5%
10%
15%
20%
25%
30%
35%
40%
45%
50%
0 500 1000 1500 2000 2500 3000
Linear Distance
Diff
eren
ce b
etw
een
linea
r dis
tanc
e an
d dr
ivin
g di
stan
ce (%
)
The following relationship for calculating the expected driving distance was derived from the
figure:
( )51.2219 2.089 10zip zipD D D−= − ×
B6 IMPACT ASSESSMENT FACTORS Two impact categories are included in the Aveda assessment; these are global warming potential
(expressed in CO2 equivalents) and primary energy use (expressed in MJ).
Global warming potential values for carbon dioxide (CO2) and methane (CH4) are taken as
reported by the Intergovernmental Panel on Climate Change (IPCC) in the Third Assessment
Report (Houghton, Ding et al. 2001). The equivalency factors for CO2 and CH4 are 1.0 and 23
respectively. Based on a preliminary analysis of available data, the inclusion of a factor for an
additional emission (N2O) would increase the life cycle global warming potential of the system by
less than 1%2.
2 Preliminary analysis of the cradle-to-gate life cycle inventory of the annual packaging material required for the Roseville DC.
Section 9 – Appendices 131
Primary energy use factors for non-renewable fuels are taken as published for the SimaPro
database. Primary energy equivalents are expressed in lower heating value which is an estimate
of the energy content of the fuel assuming a combustion reaction results in gaseous water as a
product. Factors of greatest interest are those relevant to North American data sets (as
published by Franklin Associates Ltd.) as these provide a majority of the data for the study.
These factors are shown in the table below.
Table B5 Primary Energy Equivalents for Fuel Sources
Fuel Material Primary Energy Equivalent (LHV) Coal 26.4 MJ/kg Crude Oil 42 MJ/kg Natural Gas 46.8 MJ/kg Uranium (refined fuel) 2291 MJ/g
B7 MODEL IMPLEMENTATION The Aveda distribution model was implemented in Microsoft Access to provide maximum
flexibility in results calculation. This database model requires three input files:
• Distribution Data – information on shipments such as weight, from location and to
location
• Carrier Data – information on the routing used by specific carriers for various service
types such as transportation mode and hub distances
• Mode Data – information on energy and emissions associated with using various
transportation options
The model calculates energy impacts of transportation as follows:
,i i
fuel ii i
W DE ELoad FE
⎛ ⎞⎛ ⎞= ⎜ ⎟⎜ ⎟
⎝ ⎠⎝ ⎠∑
Where,
i represents a specific transportation stage such as transport to a regional hub from a
distribution center
Efuel represents primary energy associated with fuel production, delivery and combustion
(a function of the type of fuel being used for transportation)
W represents the weight of product being shipped (lbs.)
Load represents the total payload of the transportation vehicle (lbs.)
D represents the transportation distance (miles)
FE represents the fuel economy of the vehicle (mpg)
Section 9 – Appendices 132
Global warming potential impacts are calculated using a similar equation with a factor
representing global warming impacts of fuel production, delivery, and combustion replacing Efuel.
B8 UPS “BROWN” TRUCK DATA VARIANCE UPS delivery trucks (“brown” trucks) play an important role in the overall energy use and global
warming emissions of the product delivery system. These vehicles account for 10% of the total
energy use for product delivery while providing less than 1% of the total ton-miles of
transportation. This relatively high energy use is related to the requirements of efficient delivery,
e.g. packages must be easily identified within the storage space, and personnel must be able to
stand upright while loading and unloading the cargo. These requirements lead to large vehicles
that carry relatively low weights for delivery trips. Based on information provided by UPS, it was
assumed that Aveda products were delivered an average of 50 miles in a brown truck, with an
average total vehicle load of 2,500 lbs and an average fuel economy of 8 mpg. However, due to
the importance of these values in the overall system analysis, a more through statistical
investigation of these values is important.
If we assume the average values provided by UPS are mean values from a normal distribution
and further assume these distributions have the characteristic properties shown in Table B6, then
the variability in the overall results can be considered more thoroughly.
Table B6 Assumptions for the mean distance, fuel economy and payload for UPS “Brown” trucks per delivery
Variable Mean Value Standard Deviation Delivery Distance 50 miles ± 25 miles Fuel Economy 8 mpg ± 2 mpg Delivery Payload 2,500 lbs ± 500 lbs
These values suggest the energy use to deliver one pound of Aveda product via UPS brown truck
is 940 Btu/lb ± 700 Btu/lb (including the upstream fuel cycle energy). This range provides the
expected standard deviation in the delivery energy (statistical values for GWP would be similar
and are not repeated here for simplicity). This range provides the 68% confidence interval for
the energy use value; the 95% confidence interval would be 900 ± 1340 Btu. The 68%
confidence interval for total system energy use associated with brown truck deliveries is 2,300
MM Btu ± 1,700 MM Btu. This provides an overall variance in the total delivery system (for all
product deliveries) energy use of 7.5%.
Section 9 – Appendices 133
B9 UPS METHODOLOGY
B9.1 DATA COMPILATION Two separate excel spreadsheets each with 2.5 months of shipments were used for UPS/FedEx
modeling. “Aveda_UPS_New_Data_Part_A” included all invoice dates from October 18th, 2003
through December 14th 2003. “Aveda_UPS_New_Data_Part_B” included all invoice dates from
December 20th through February 29th. Each shipment was coded for “From Code” based on the
“Ship From Address,” “To Code” based on the “Ship To Address,” and “Designated Distributor”
based on the specified distributor assigned to a particular ship to region. The designated
distributor list was provided by Aveda.
Weights were calculated by sorting data by transportation node and summing weights for each
node.
B9.2 DATA MODELING ASSUMPTIONS - TYPE OF SHIPPING All UPS shipments were considered ground, based on the unique relationship Aveda has with UPS
to guarantee ground shipping.
B9.3 DATA MODELING ASSUMPTIONS - TRUCK CAPACITY Based on interviews with Brown Truck drivers and also an EPA staffer, the team used 2,500 lb as
the average Brown truck capacity. It must be noted that there are a number of different types
(and sizes) of brown trucks, but for the purpose of this report, we assumed all trucks were the
small Brown Trucks.
B10 FEDEX METHODOLOGY
B10.1 DATA COMPILATION Same as UPS Methodology
B10.2 DATA MODELING ASSUMPTIONS - TYPE OF SHIPPING
• “2nd Day”: >1000 miles shipped by air, otherwise shipped by ground
• “Ground”: All shipments are by ground
• “International Economy”: All shipments are by ground
• “International Priority”: All shipments are by ground
• “Standard Overnight”: >200 miles goes by air otherwise by ground
Section 9 – Appendices 134
• “Priority Overnight”: >200 miles goes by air otherwise by ground
B10. 3 DATA MODELING ASSUMPTIONS - TRUCK CAPACITY FedEx Capacity was considered equal to UPS. The team treated the efficiency of the UPS and
FedEx Networks as equal. We also assumed that the utilization of the network was 100% as per
Aveda’s recommendation. Other GWP reporting tools use lower efficiency factors as they assume
that trucks return empty.
Section 9 – Appendices 135
APPENDIX C METHODOLOGY FOR EVALUATING STRATEGIC RECOMMENDATION 2 This appendix provides detailed routes, transportation mode, and mileage for each quote
provided by different intermodal companies.
Table C1 Detailed steps for shipping with Clarke Intermodal Logistics. Costs do not include fuel surcharges. Quote dated 25 Oct 2004.
Roseville to LADC Roseville to USDC-B Roseville to USDC-A Roseville to PADC 1 Truck from Roseville
to Canadian Pacific Ramp in St. Paul = 10 miles
Truck from Roseville to Canadian Pacific Ramp in St. Paul = 10 miles
Truck from Roseville to Canadian Pacific Ramp in St. Paul = 10 miles
Truck from Roseville to Canadian Pacific Ramp in St. Paul = 10 miles
2 Canadian Pacific railroad from St. Paul to Chicago = 400 miles
Canadian Pacific railroad from St. Paul to Chicago = 400 miles
Canadian Pacific railroad from St. Paul to Chicago = 400 miles
Canadian Pacific railroad from St. Paul to Chicago = 400 miles
3 Union Pacific railroad from Chicago to Los Angeles = 2100 miles
Union Pacific railroad from Chicago to Denver = 1000 miles
Trucked from Canadian Pacific ramp to Canadian National ramp = 1 mile
CSX railroad to Philadelphia = 760 miles
4 Truck from Los Angeles rail yard to Compton, CA = 20 miles
Truck from Denver rail yard to USDC-B = 10 miles
Canadian National Rail from Chicago to New Orleans = 920 miles
Truck from Philly rail yard to PADC = 25 miles
5 Truck from New Orleans to USDC-B = 55 miles
Road Miles
30 20 66 35
Rail Miles
2,500 1,400 1,320 1,160
Total Days
7-9 days 4-5 days 3-4 days 4-5 days
Cost $1,872 $1,853 $1,693 $1,637
Contact: Jack Powers Director, Business Development 900 Ridge Road, Suite 3NW Homewood IL 60430 800-925-0125 [email protected]
Section 9 – Appendices 136
Table C2 Mileage by mode with CH Robinson Intermodal Logistics and includes fuel surcharges. Quote dated 15 Dec 2004.
Roseville to LADC Roseville to USDC-B Roseville to USDC-A Roseville to PADC 1 Truck from Roseville
to Canadian Pacific ramp in Minneapolis = 8 miles
Truck from Roseville to BNSF ramp = 21 miles
Truck from Roseville to BNSF ramp = 21 miles
Truck from Roseville to BNSF ramp = 21 miles
2 Rail - specific rail routes vary based on availability=1870 miles
Rail - specific rail routes vary based on availability=851 miles
Rail - specific rail routes vary based on availability=1316 miles
Rail - specific rail routes vary based on availability=1177 miles
3 Truck from Union Pacific ramp to Compton, CA = 13 miles
Truck from BNSF Ramp in Denver to USDC-B = 8 miles
Truck from Canadian National Ramp in New Orleans to USDC-A = 55 miles
Truck from Norfolk Southern ramp in Morrisville, PA to PADC = 8 miles
Road Miles
21 29 76 29
Rail Miles
1870 851 1316 1177
Total Days
7-8 days 3-4 days 6-7 days 6-7 days
Cost $2,100 $1,975 $2,300 $2,300
Table C3 Mileage by mode with Triple Crown Logistics and includes fuel surcharges. Quote dated 20 Dec 2004.
Roseville to PADC 1 Truck from Roseville to Triple Crown Ramp located at 525 Kasota
Ave, Minneapolis, MN = 14 miles 2 Minneapolis ramp to Bethlehem, PA ramp = 1094 miles 3 Bethlehem, PA ramp to PADC = 53 miles Road Miles
67
Rail Miles
1094
Total Days
3 days
Cost $1718 + $127.71 (fuel charge) = $1845.71
Contact: Allen Johnson Regional Marketing Manager Triple Crown Services 651-340-8404 [email protected]
Section 9 – Appendices 137
APPENDIX D RELATIVE IMPACT BETWEEN PARCEL VERSUS LTL SHIPPING Please note that loose-pick boxes describe the packaging used to ship by parcel while palletized
loads or full-pallets describe the packaging to shop by LTL.
The results presented in Section 5 reveal that shipping to salons has nearly four times the
environmental impact of shipping to retail locations. One can intuitively hypothesize that
shipping product in loose-pick boxes requires more packaging and less-efficient transportation
than shipping via palletized loads. However, other variables may be contributing to this
difference. In an effort to better understand this difference, two hypothetical scenarios for
delivery of the same quantity of products were developed to highlight the energy and
environmental tradeoffs of loose-pick verses palletized master cartons. The prototypical loose-
pick box was based on the following information:
• The average loose-pick box weighs approximately 20 pounds and contains a variety of products.123
• The product mix includes seven of the top ten products by volume sold in the summer of 2004 by volume.
Table D1 shows delivery quantities for both scenarios.
Table D1 Products and number of units shipped in the loose-pick versus palletized load scenario.
Product Name Number of Units Delivered Product 1 17,280 Product 2 5,760 Product 3 2,880 Product 4 5,760 Product 5 5,760 Product 6 11,520 Product 7 5,760
In both cases a hypothetical delivery distance of 1000 miles were considered.
D1 SCENARIO ONE – LOOSE-PICK In this scenario a total of 2,880 loose-pick boxes are delivered via UPS. Each box has identical
contents and packaging. Tables D2 and D3 detail the contents of the hypothetical loose-pick
box.
Section 9 – Appendices 138
Table D2 Contents of a the hypothetical loose-pick box Product Name Number of Units per
D3 RESULTS Results described in the Figures D1 through D4.
Figure D1 Energy requirements and global warming emissions associated with production and delivery of packaging materials used in loose-pick versus LTL
Section 9 – Appendices 140
Figure D2 Energy requirements and global warming potential emissions associated with delivery of the shipments considered in each scenario
Figure D3 Total energy use and global warming emissions for the package production and delivery considered in each scenario
Section 9 – Appendices 141
Figure D4 Differences in Energy and GWP on a per pound of product delivered
The range of values found (error bar on the loose-pick column) when the delivery distance for
the UPS brown truck was varies between 25 miles and 75 miles. Holding all variables equal, the
environmental impact associated with shipping loose-pick (parcel) is three to four times greater
that fully palletized loads (LTL).
Section 9 – Appendices 142
APPENDIX E SAMPLE LETTER TO CARRIER FOR EPA SMARTWAY TRANSPORT Dear Freight Carrier: The freight services you provide are a significant link in the supply chain that delivers our products to retailers and customers. Freight services like yours are amazingly efficient at quickly and affordably delivering products nationwide, safely and on-time. Yet, as you well know, that process carries an environmental cost as well. There are now more than six MM single-unit and two MM combination trucks on our nation’s roadways and each year those trucks drive over 200 billion miles total. Those trucks consume more than 35 billion gallons of fuel each year, and emit about 294 MM tons of greenhouse gases, in addition to 3 MM tons of nitrogen oxides and 160,000 tons of particulate matter. We believe that responsible corporate citizens will endeavor to find more sustainable business practices that reduce the environmental impact of producing and delivering consumer goods. We also believe that the goals of business and environmental protection are not mutually exclusive. We find that improved practices, with reduced environmental impacts, can actually improve the bottom line by reducing fuel use and improving operational efficiency. To that end, we are participating with dozens of other freight shippers and carriers in a voluntary effort called the SmartWay Transport Partnership. Industry leaders have agreed to work with the Environmental Protection Agency (EPA) to reduce greenhouse gas emissions from the freight sector. By 2012, SmartWay Transport aims to reduce carbon emissions by 9 to 18 MM metric tons. The SmartWay Transport Partnership will achieve these reductions through advancing technologies and improving the management practices used in the freight industry. Technologies being used include new approaches to reducing or eliminating truck idling, like truck stop electrification and auxiliary power units. Other technological approaches to reduced emissions include improved aerodynamics, self-inflating and wide-base tires, synthetic lubricants, speed controls and others. Improved management practices include load matching and driver training. Companies which adopt these strategies are doing so because of their environmental stewardship, and because it is good for business. Doing business the "SmartWay" is setting the benchmark for excellence, and rewarding companies for using sustainable technologies and practices that will become the industry standard. One of the more visible benefits for the highest performing participants in this voluntary program, will be the use of the SmartWay Transport brand for qualifying SmartWay Transport Partners. This logo can be used to acknowledge a company’s environmental excellence and will symbolize to consumers, other business customers and competitors that delivery services are being provided more efficiently and with reduced environmental impact. EPA and SmartWay Transport Partners will be actively promoting the Partnership, so that over time customers will recognize the SmartWay Transport label as a preferred option. We have joined (are joining) EPA in this voluntary effort as a Partner to promote our sustainable business practices and environmental commitment. As one of our preferred freight carriers, we would like you to join us as one of the leading carriers that are improving efficiencies. I believe that once you learn about this exciting new effort and the benefits that it offers your business, you will agree to come aboard. It would require a voluntary commitment on your behalf and some extra effort, but you will see both the near term and long term advantages of doing so. Consider the benefits:
Cost savings: save fuel with advanced technologies and strategies.
Section 9 – Appendices 143
Business-to-business advantages: Carrier Partners are preferred by Shipper Partners who commit to ship more of their goods with SmartWay Transport Carrier Partners. Management tools: the EPA Freight Logistics Environmental and Economic Tracking (FLEET) Performance model helps you to track and manage fuel use, evaluate fuel savings, and environmental benefits of various strategies, in addition to quantifying the benefits of future fleet enhancements. Technical support: EPA can assist you with the FLEET Performance Model and finding the best approaches to meet your goals. Recognition for existing fleet improvements: Your fleet’s existing improvements and your continued improvements are credited in your efficiency ratings. National Recognition and Promotional Opportunities: Public exposure, national and regional media events, articles and other special awards are provided to all Partners by EPA to recognize their participation and environmental performance. Exceptional performance will be recognized through the use of the SmartWay Transport Partner logo, a symbol of excellence that you may use in advertising and other marketing efforts.
The application process is simple; Sign a voluntary Partnership Agreement, calculate your efficiency and make a commitment for annual improvements that will ensure additional reductions over time. Our company has already agreed to work on this voluntary Partnership and we too have made commitments for efficiency improvements. We will also seek to ship more of our goods over time with higher scoring carriers that have committed to efficiency improvements. I hope that you will work with us to ensure the success of these important efforts. You can find more useful info at the Partnership website: http://www.epa.gov/smartway I hope that you agree with us that doing business the “SmartWay” will help all of us to become more competitive in our industry, improve our public image and foster more sustainable business practices that will have a lasting impact. If you have additional questions about the SmartWay Transport Partnership, please feel free to call the Partnership hotline at 734-214-4767, or e-mail [email protected]. We will look forward to working with you. Signed
Section 9 – Appendices 144
APPENDIX F SAMPLE TERTIARY PACKAGING PURCHASING POLICY The purpose of this policy is to establish recycled content procurement guidelines to increase the
procurement of recycled content in tertiary packaging products used by Aveda distribution
centers. This policy aims to encourage procurement of products with the greatest post-consumer
recycled (PCR) content. PCR content is paper that has been recovered after use by individuals
and organizations. It should be noted that some paper product manufacturers include in their
definition of "recycled content" the material generated in the paper manufacturing processes,
such as scrap and trimmings/cuttings. Since these are commonly generated from and reused
within a manufacturing process, they are not considered "recycled" under these guidelines. This
policy aims to increase the use of products with PCR content only.
Aveda’s policy is to purchase and use tertiary packaging products containing significant PCR
content when such products are:
• Of high quality and satisfy applicable specifications
• Available in the desired quantity within a reasonable period of time, and
• Available at a reasonable price.
Table F1 Minimum standards for PCR content in tertiary packaging Paper type Minimum Post-
consumer Fiber (%) Corrugated Cardboard Boxes
Linerboard Corrugated Medium
30
100 Kraft Paper / Wadding Paper 100 Kraft Grocery Bags 100 Corroseal Adhesive Wraps
Exterior Interior (Flute)
100 30
RanPak 80
Aveda staff purchasing tertiary packaging materials containing paper shall require suppliers to
provide documentation stating that their products meet the above requirements.
Section 9 – Appendices 145
APPENDIX G ENERGY AND GWP CONVERSION Throughout this report, the resulting energy and GWP impacts from the various components of
the PDS are provided in MJ of Energy and kg of CO2 equivalents respectively. As a frame of
reference, these figures are also presented in terms of equivalent gallons of gasoline and
equivalent automobile use. The calculations for this conversion are as follows:
• 42 gallons = 1 barrel of automotive gasoline
• 5.253 MM BTU = 1 Barrel of automotive gasoline124
Therefore 132 MJ = 1 gallon [U.S.] of automotive gasoline
• Average light vehicle (cars, trucks and SUVs) in the US travels 12,039 miles per year125
• The average light vehicle on the road in the US achieves 24 mpg126
• 19.564 lbs of CO2 emissions are generated per gallon of gasoline127
• 2.2046 lb/kg
• 1000 kg/metric ton
(12,039 miles per year per car)*(1 / 24 miles per gallon)
Therefore 502 gallons gas = 1 car for a year
(19.564 lbs CO2 / gallon)*(1 kg / 2.2046 lb)
Therefore 8.874 kg CO2 = 1 gallon [U.S.] of automotive gasoline
Example:
• 36.5MM MJ/132 = 276,515 gallons of gasoline
• 276,515 gallons/502 = Enough to fuel 551 cars for a year
• 2,811,000 kg CO2 = 316,768 gallons gasoline
• 316,768 gallons/502 = Enough to fuel 574 cars for a year
Section 10 – References / Bibliography 146
SECTION 10 - REFERENCES / BIBLIOGRAPHY
1 From April 2004 through March 2005, the Michigan student team worked with Aveda
employees, contractors, and vendors to collect and interpret data to provide a system-wide assessment of Aveda’s PDS. A significant amount of data for this report was gathered over a three-day visit to Aveda’s facilities in Blaine, MN and Roseville, MN from May 5 through May 7, 2004. At the Blaine site, the team toured the manufacturing facility and interviewed managers and directors of environmental affairs, packaging, distribution, and marketing. At the Roseville site, the team toured the distribution facility and interviewed the distribution personnel that manage facility operations, packing, transportation, and customer returns. The team paid subsequent visits to the Blaine and Roseville facilities in November 2004 and January 2005 to collect additional data and verify preliminary findings.
2 “Other” includes customer returns; from stores, salons, and distributors. Shipments from
distributors could be part of inventory management. 3 PDS denominator is total weight shipped out of Roseville, numerator includes energy and
emissions resulting from transporting goods to company owned distribution centers, retail stores, and salons
4 Notably, the carbon emissions resulting from the completion of this project (due to air, train,
and car transportation) will be offset through Native Energy. 5 Hook, Paula and Heimleich, Joe E. “Ohio State University Fact Sheet: Purposes of
packaging,” Ohio State University, http://ohioline.osu.edu/cd-fact/0134.html (accessed October 25, 2004).
6 “Waste, Product Stewardship, Products, Packaging Waste Fact Sheet,” Office of Solid Waste and Emergency Response, U.S. Environmental Protection Agency, http://www.epa.gov/epaoswer/non-hw/reduce/epr/products/packaging.html (accessed October 25, 2004).
7 “Municipal solid waste in the United States: 2001 facts and figures,” Office of Solid Waste and Emergency Response, U.S. Environmental Protection Agency, http://www.epa.gov/epaoswer/non-hw/muncpl/pubs/msw2001.pdf (accessed Jan 14, 2005).
8 Alastra, Anna. “Packing Light: Companies Cut Waste -- and Costs -- with Greener Packaging,” GreenBiz, http://www.greenbiz.com/news/reviews_third.cfm?NewsID=25499&CFID=14192682&CFTOKEN=1834596 (accessed on October 26, 2004).
9 “Aveda finds sustainability within,” Green@Work, March/April 2004, GreenBiz.com http://www.greenbiz.com/news/reviews_third.cfm?NewsID=26806&CFID=14192682&CFTOKEN=1834596 (accessed on October 26, 2004).
10 “Environment, Policies, Waste, Packaging Fact Sheet,” European Union Environmental Commission, http://europa.eu.int/comm/environment/waste/packaging_index.htm (accessed on November 9, 2004).
11 “Group reports Europe's packaging waste cut by third,” EDIE.net, http://www.greenbiz.com/news/news_third.cfm?NewsID=11517&CFID=14192682&CFTOKEN=1834596 (accessed November 9, 2004).
Section 10 – References / Bibliography 147
12 “Eco-friendly packaging could spread holiday cheer,” Greenbiz.com,
http://greenbiz.com/news/news_third.cfm?NewsID=13760&CFID=14192682&CFTOKEN=1834596 (accessed November 9, 2004).
“Minnesota pallet makers serve nice for certified wood resource,” Forest Stewardship Council, http://www.fscus.org/news/?article=16 (accessed June 9, 2004).
17 For a comparison in standards, go to http://www.certifiedwood.org.
18 Hansen, Peter and Bob Eriksson. Interviewed by Ted Ekkers, Tony Baptista, Jon Forrester, Nathan Arbitman, and Heather Kirshman. Written notes. May 5th, 2004. Aveda: Blaine Manufacturing Facility.
19 “What are greenhouse gases?” Global Warming Task Force, U.S. Environmental Protection Agency, http://yosemite.epa.gov/oar/globalwarming.nsf/content/Emissions.html (accessed January 3, 2004).
20 Ibid. 21 Energy Information Association, U.S. Department of Energy, “International Energy Outlook
2004,” http://www.eia.doe.gov/oiaf/ieo/world.html (accessed October 26, 2004). 22 Wood, John H., Gary R. Long and David F. Morehouse, “Long-term world oil supply
scenarios: The future is neither as bleak or rosy as some assert,” Energy Information Association, Department of Energy, http://www.eia.doe.gov/pub/oil_gas/petroleum/feature_articles/2004/worldoilsupply/pdf/itwos04.pdf (accessed November 1, 2004).
23 Greene, David L., and Andreas Schafer. Reducing greenhouse gas emissions from U.S. transportation. Prepared for the Pew Center on Global Climate Change, 2003.
24 U.S. Environmental Protection Agency. Inventory of U.S. greenhouse gas emissions and sinks: 1990 – 2002, EPA 430-R-04-003, 2003.
25 Greene, David L., and Andreas Schafer. Reducing greenhouse gas emissions from U.S. transportation. Prepared for the Pew Center on Global Climate Change, 2003.
26 Global Warming Task Force, U.S. Environmental Protection Agency. “Global Warming, Climate Webpage,” http://yosemite.epa.gov/oar/globalwarming.nsf/content/climate.html (accessed November 1, 2004).
27 Energy Information Association, U.S. Department of Energy, “International Energy Outlook 2004,” http://www.eia.doe.gov/oiaf/ieo/world.html (accessed November 1, 2004).
28 U.S. Environmental Protection Agency. Inventory of U.S. greenhouse gas emissions and sinks: 1990 – 2002, EPA 430-R-04-003, 2003.
29 Ibid. 30 Ibid.
Section 10 – References / Bibliography 148
31 Greene, David L., and Andreas Schafer. Reducing greenhouse gas emissions from U.S.
transportation. Prepared for the Pew Center on Global Climate Change, 2003. 32 Energy Information Administration, U.S. Department of Energy. 2003. Annual Energy Review
2003, Report #DOE/EIA-0384, 2003. 33 Ibid. 34 Office of Transportation and Air Quality, U.S. Environmental Protection Agency, “SmartWay
Transport Partnership,” http://www.epa.gov/smartway/swintro.htm (accessed November 15, 2004).
35 Corbett et al. “Ship emissions assessment: Presentation at EPA – Region 9 meeting.” 2001. 36
Truck assumes diesel tractor trailers with fuel efficiency of 7 mpg. Ocean assumes "marine" rather than "inland" shipping. Rail assumes diesel locomotive. Air assumes long-haul flights greater than 994 miles. Calculation made using: “Mobile Combustion CO2 Emission Calculation Tool,” GHG Protocol Initiative, http://www.ghgprotocol.org/standard/tools.htm (accessed November 18th, 2004).
37 The North American Railroad industry, “Association of American Railroads: Railroad Industry Info,” http://www.aar.org/AboutTheIndustry/AboutTheIndustry.asp (accessed December 1, 2004).
38 Ibid. 39 “Figure 5.1 Total primary transportation energy, Gross Domestic Purchases, and crude oil
price indices, 1977 to 1993,” Energy Consumption Division, Energy Information Administration, U.S. Department of Energy, http://www.eia.doe.gov/emeu/efficiency/eefig_ch5.htm#Figure 5.17 (accessed December 3, 2004).
40 The range comes from two sources. The bottom end of the range (i.e., eight) come from: Truck assumes diesel tractor trailers with fuel efficiency of 7 mpg. Ocean assumes "marine" rather than "inland" shipping. Rail assumes diesel locomotive. Air assumes long-haul flights greater than 994 miles. The top end of the range (i.e., ten) comes from the data represented in Figure 5C of this report. Calculation made using: “Mobile Combustion CO2 Emission Calculation Tool,” GHG Protocol Initiative, http://www.ghgprotocol.org/standard/tools.htm (accessed November 18, 2004).
41 Greene, David L., and Andreas Schafer. Reducing greenhouse gas emissions from U.S. transportation. Prepared for the Pew Center on Global Climate Change, 2003.
42 Three references were used for life cycle analysis:
Franklin Associates. Life Cycle Inventory of Packaging Options for Shipment of Retail Mail-Order Soft Goods. Department of Environmental Quality. Salem, OR: 2004. Franklin Associates. USA LCI Database Documentation. Kansas: Prairie Village, 1998.
PRé Consultants. SimaPro, v5.1, Life Cycle Analysis Software. The Netherlands: Amersfoort, 2003.
43 “About the Aveda founder, Horst M. Rechelbacher,” Aveda Website, http://aveda.aveda.com/about/bio/default.asp (accessed October 17, 2004).
Section 10 – References / Bibliography 149
44 “Mission of each of Estée Lauder Companies: Focus on Aveda,” Estée Lauder Website,
http://www.elcompanies.com/htm/frameset/frm_m2_aveda.htm (accessed October 18, 2004).
45 “What we do,” Aveda Website, http://aveda.com/protect/we/default.asp. (accessed October 25, 2004).
46 “What we do: Environmental Sustainability Mission,” Aveda Website, http://aveda.com/protect/we/default.asp. (accessed October 25, 2004).
47 “Minnesota pallet makers serve nice for certified wood resource,” Forest Stewardship Council, http://www.fscus.org/news/?article=16 (accessed June 9, 2004).
49 Brown, Mike. Interviewed by Jon Forrester. Phone. June 10, 2004. 50 “What we do,” Aveda Website, http://aveda.com/protect/we/default.asp. (accessed October
25, 2004). 51 Franklin Associates. USA LCI Database Documentation. Kansas: Prairie Village, 1998 52 Hansen, Peter and Bob Eriksson. Interviewed by Ted Ekkers, Tony Baptista, Jon Forrester,
Nathan Arbitman, and Heather Kirshman. Written notes. May 5th, 2004. Aveda: Blaine Manufacturing Facility.
53 Ibid..
54 Note: The Roseville DC will move in 2005. The recommendations in this report will be issued within the context of this situation.
55 Note: Aveda packaging suppliers provided purchasing data for 2002 and 2003. The data assessed in this report is an annual average of those two years.
56 Rowe, Doug. Interviewed by Ted Ekkers. Phone. June 15, 2004. 57
Erera, Alan. “Freight Rail Transportation.” PowerPoint presentation for ISyE 6203: Transporation and Supply Chain Systems, School of Industrial and Systems Engineering at Georgia Tech, Atlanta, GA. (1996).
58 Ibid.
59 Kennedy, Mike and Tom Wellen. Interviewed by Tony Baptista. Phone. August 20, 2004. 60
“Carbon Dioxide and Methane GHGs,” Northeast Advanced Vehicle Consortium, http://www.navc.org/HDghg.htm (accessed March 14, 2004).
61 Franklin Associates. Life Cycle Inventory of Packaging Options for Shipment of Retail Mail-
Order Soft Goods. Department of Environmental Quality. Salem, OR: 2004. 62
Rice, Tim, Dave Nordine, and Doug Rowe. Interviewed by Tony Baptista, Ted Ekkers, Nathan Arbitman, Jon Forrester, and Heather Kirshman. Written notes. May 6, 2004.
63 Watson, R.T. and the Core Writing Team, eds. IPCC Third Assessment Report: Climate Change 2001. 2001.
64 Franklin Associates. USA LCI Database Documentation. Kansas: Prairie Village, 1998. 65 Davis, S.C., and S.W. Diegel. Transportation Energy Data Boook: Edition 23. Oak Ridge
National Laboratory. Oak Ridge, TN: 2003.
Section 10 – References / Bibliography 150
66 “U.S.-Flag Cargo Carrying Fleet by Area of Operation,” Maritime Administration, U.S.
Department of Transportation, http://www.marad.dot.gov (accessed January 5, 2005). 67
“Other” includes customer returns; from stores, salons, and distributors. Shipments from distributors could be part of inventory management.
68 Rowe, Doug. Interviewed by Ted Ekkers. Phone. June 15, 2004.
69 Calculation assumes each automobile gets 20 mpg, travels 12,500 miles per year, and emits
twenty pounds of CO2 per gallon. 70
These numbers differ slightly from Figure 5F because the previous energy and GWP values were determined based on shipments leaving the facility, rather than shipments arriving in the regional stores. There are occasional “out-of-region” shipments (i.e. LADC shipping to a PADC region store) as well as some shipments to OR and WA stores fulfilled out of Roseville.
71 These numbers differ slightly from Figure 5F because the previous energy and GWP values
were determined based on shipments leaving the facility, rather than shipments arriving in the regional stores. There are occasional “out-of-region” shipments (i.e. LADC shipping to a PADC region store) as well as some shipments to OR and WA stores fulfilled out of Roseville.
72 Listgarten, Karen. Correspondence with Tony Baptista. E-mail. January 19, 2005.
73 “A Glance at Clean Freight Strategies,” Office of Transportation and Air Quality, U.S.
Environmental Protection Agency, http://www.epa.gov/smartway/documents/intermodal%20shipping.pdf (accessed December 6, 2004).
74 “Intermodal Industry Statistics 1999 – 2003,” Intermodal Association of North America,
http://www.intermodal.org/fact.html (accessed December 6, 2004). 75
Ibid. 76
“A Glance at Clean Freight Strategies,” Office of Transportation and Air Quality, U.S. Environmental Protection Agency, http://www.epa.gov/smartway/documents/intermodal%20shipping.pdf (accessed December 6, 2004).
77 Mongelluzzo, Bill. “Warnings on intermodal rail.” Journal of Commerce, (2004): 47-48.
78 “A Glance at Clean Freight Strategies,” Office of Transportation and Air Quality, U.S.
Environmental Protection Agency http://www.epa.gov/smartway/documents/intermodal%20shipping.pdf (accessed December 2004).
79 Rice, Tim and Doug Rowe. Interview by Tony Baptista. Written notes. November 22, 2004.
Aveda Roseville distribution center. 80
Ibid. 81
Rader, Steve. Interview by Tony Baptista. Phone. October 18, 2004. Aveda. 82
The data presented in Section 5 of the report is dated from Oct 2003 to Feb 2004. Total LTL pound-miles = 12,289 M and total Parcel pound-miles = 689 M. 689/12,289 *100 = 5.58%.
83 Haites, Eric. “The Global Carbon Market.” Margaree Consultants, Inc. February 3, 2003.
84 “What We Do,” Climate Care, http://www.co2.org/ (accessed January 3, 2004).
Section 10 – References / Bibliography 151
85 “About CCX®,” Chicago Climate Exchange, http://www.chicagoclimatex.com/ (accessed
December 18, 2004).
86 “About NativeEnergy,” NativeEnergy, www.nativeenergy.com (accessed December 18, 2004).
87 “The Climate Cool Brand,” Climate Neutral, http://www.climateneutral.com/pages/certifications.html (accessed March 20, 2005).
“New FedEx Express Hybrid Electric Trucks Begin Service,” Eaton, http://www1.eaton.com/hybrid_vehicle/ (accessed December 25, 2004).
103 “Biodiesel Backgrounder,” National Biodiesel Board, www.biodiesel.org (accessed December
13, 2004).
Section 10 – References / Bibliography 152
104
“Biodiesel Performance, Cost and Use,” Department of Energy, Energy Information Administration, http://www.eia.doe.gov/oiaf/analysispaper/biodiesel/ (accessed December 27, 2004).
105 Graboski, M.S. and R.L. McCormick. “Combustion of Fat and Vegetable Oil Derived Fuels in
Diesel Engines,” Progress in Energy and Combustion Science, Vol. 24, No. 2 (1998):131-132. 106
“Biodiesel—Clean, Green Diesel Fuel,” National Renewable Energy Laboratory, Department of Energy, www.afdc.doe.gov/pdfs/Bio_CleanGreen.pdf (accessed January 5, 2004).
107 “Biodiesel Usage Checklist,” National Biodiesel Board,
www.biodiesel.org/pdf_files/bdusage.PDF (accessed December 13, 2004). 108
“Biodiesel—Clean, Green Diesel Fuel,” National Renewable Energy Laboratory, Department of Energy, www.afdc.doe.gov/pdfs/Bio_CleanGreen.pdf (accessed January 5, 2004).
109 “Biodiesel Performance, Cost and Use,” Department of Energy, Energy Information
Administration, http://www.eia.doe.gov/oiaf/analysispaper/biodiesel/ (accessed December 27, 2004).
110 “Biodiesel – Guide to Buying Biodiesel,” National Biodiesel Board, www.biodiesel.org
(accessed December 27, 2004). 111
Kavanagh, David. Correspondence with Heather Kirshman. Email. December 29, 2004. Organic Engines.
112 Picture from Organic Engines website, http://www.organicengines.com/SUV/index.htm
(accessed March 20, 2005). 113
Eric Day. Correspondence with Heather Kirshman. Email. December 9th, 2004. Aveda. 114
Office of Transport and Air Quality, U.S. Environmental Protection Agency. A Glance at Clean Freight Strategies: Idle Reduction. http://www.epa.gov/smartway/smartway_fleets_strategies.htm (accessed October 15, 2004).
115 Department of Energy. Technology Roadmap for the 21st Century Truck Program. 2000.
http://www.eere.energy.gov/vehiclesandfuels/pdfs/program/21ct_roadmap.pdf (accessed January 6, 2004).
116 National Renewable Energy Laboratory. Advanced Fuels Properties Database. 2004,
Advanced Vehicles and Fuels Research. 117
Camobreco, V., J. Sheehan, J. Duffield, and M. Graboski. Understanding the Life-Cycle Costs and Environmental Profile of Biodiesel and Petroleum Diesel. in Total Life Cycle Conference. 2000. Detroit, Michigan: SAE International.
118 “Biodiesel Commonly Asked Questions,” National Biodiesel Board,
www.biodiesel.org/pdf_files/bdusage.PDF (accessed December 13, 2004). 119
“Safer, Cleaner Market for Government Fleets,” National Biodiesel Board, www.Biodiesel.org. (accessed December 20, 2004).
120 Ibid.
121 Kupbens, Bob, Director. Interview by Tony Baptista. Phone. February 6, 2004. Target.
Hassing, Ben. Interview by Tony Baptista. Phone. February 2, 2004. Wal-mart Inc.
Section 10 – References / Bibliography 153
122
Department of Energy. Technology Roadmap for the 21st Century Truck Program. 2000. http://www.eere.energy.gov/vehiclesandfuels/pdfs/program/21ct_roadmap.pdf (accessed January 6, 2004).
123 Nordine, Dave. Interview by Tony Baptista. Phone. October 18, 2004. Aveda.
124 Energy Information Administration, Annual Energy Review 2003, DOE/EIA-0384, September
2004. 125
US Department of Transportation, 2001 National Household Travel Survey. December 2004. Accessed via http://nhts.ornl.gov/2001/presentations/vehicleMiles/VehicleMiles.pdf
126 EPA, Light-Duty Automotive Technology and Fuel Economy Trends 1975 Through 2004, EPA
420-R-04-001, April 2004. 127
Department of Energy, Energy Information Agency. Greenhouse Gas Voluntary Reporting website, accessed March 15, 2005. http://www.eia.doe.gov/oiaf/1605/factors.html