DNV GL Headquarters, Veritasveien 1, P.O.Box 300, 1322 Høvik, Norway. Tel: +47 67 57 99 00. www.dnvgl.com A study for Lithuanian Power Sector Scenario Building for the Evolution of Lithuanian Power Sector for 2020 - 2050 Litgrid AB Date: 2020-12-16 REPORT: 2020-0430
copied, reproduced or transmitted in any form, or by any means, whether digitally or otherwise; (ii) The content of this publication
shall be kept confidential by the customer; (iii) No third party may rely on its contents; and (iv) DNV GL undertakes no duty of care
toward any third party. Reference to part of this publication which may lead to misinterpretation is prohibited. DNV GL and the Horizon Graphic are trademarks of DNV GL AS.
DNV GL Energy
Energy Markets and Technology
P.O.Box 300
1322 Høvik
Norway
Tel: +47 67 57 99 00
DNV GL - Scenario Building for the Evolution of Lithuanian Power Sector for 2020-2050
7 SYSTEM ADEQUACY ASSESSMENT: INTRODUCING THREE LEVELS OF FLEXIBILITY TO THE LITHUANIAN POWER MARKET .................................................................................. 78
7.1 Introduction 78
7.2 Outlining the challenges in a Low Flexibility Case 80
7.3 Outlining challenges and solutions in a medium flexibility case 84
7.4 Identifying surplus week solutions in a high flexibility case 91
7.5 System adequacy performance by scenario 94
8 IDENTIFICATION AND RECOMMENDATIONS FOR ACTIONS AND MEASURES ....................... 102
8.1 Wind Power Business Case 102
8.2 Power-To-Gas Business Case 103
8.3 Battery Storage Business Case 112
8.4 Demand-Side Flexibility Business Case 116
8.5 Summary of flexibility business cases: Technology trilemma 117
DNV GL - Scenario Building for the Evolution of Lithuanian Power Sector for 2020-2050
4
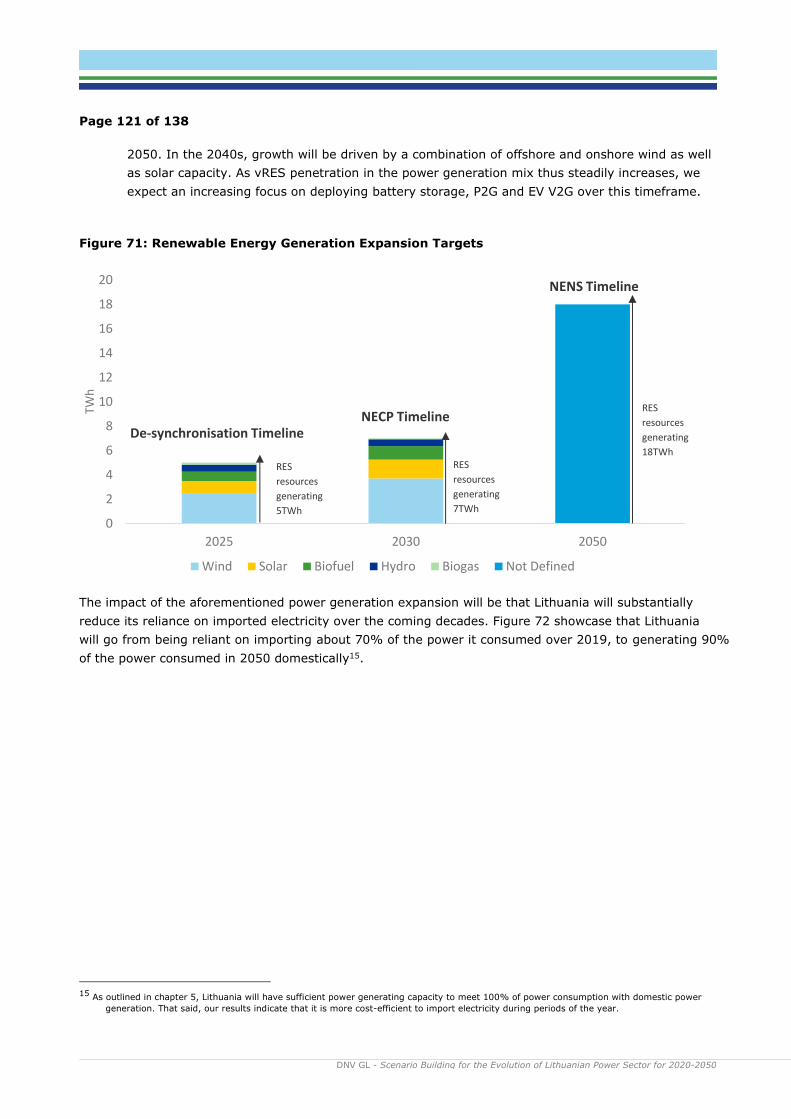
9 ROADMAP TO 2050 ..................................................................................................... 120
9.1 Introduction 120
9.2 2020-2025: Supporting the ramp-up towards de-synchronisation 123
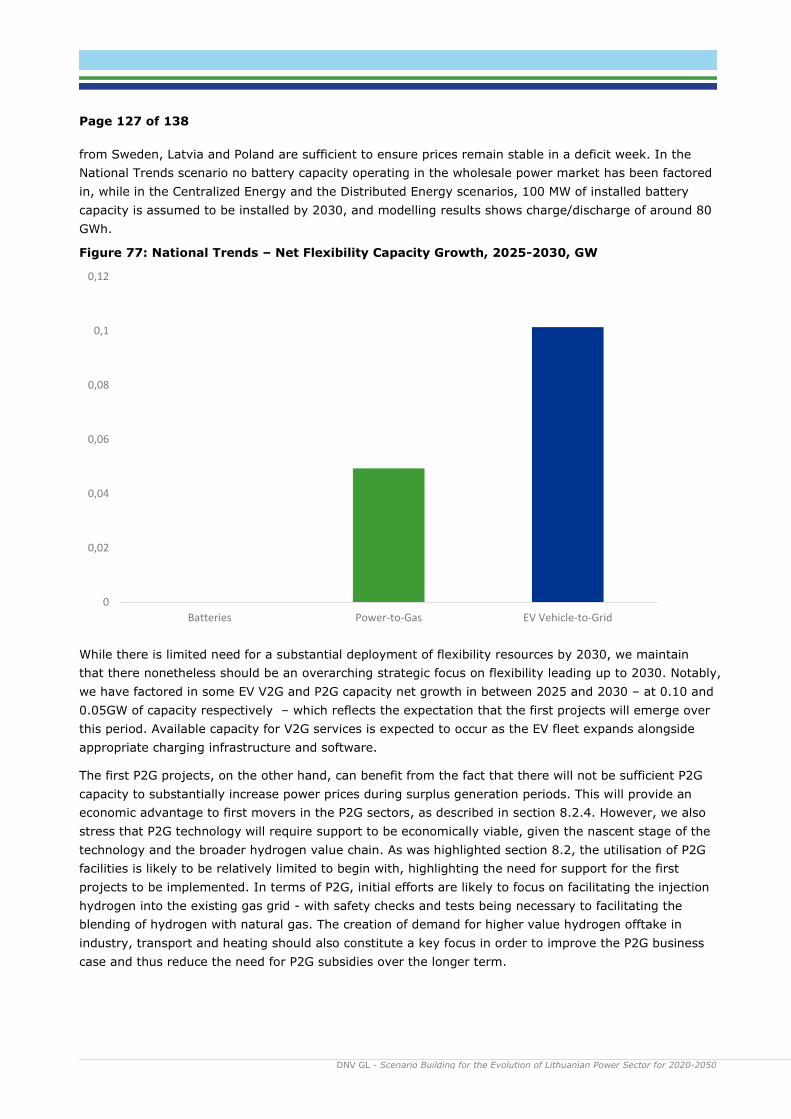
9.3 2025-2030: Delivering on EU targets and facilitating NENS implementation 125
APPENDIX 1: ANALYSIS TOOL AND MODELLING METHODOLOGY ................................................... 136
Main sources for scenario development 137
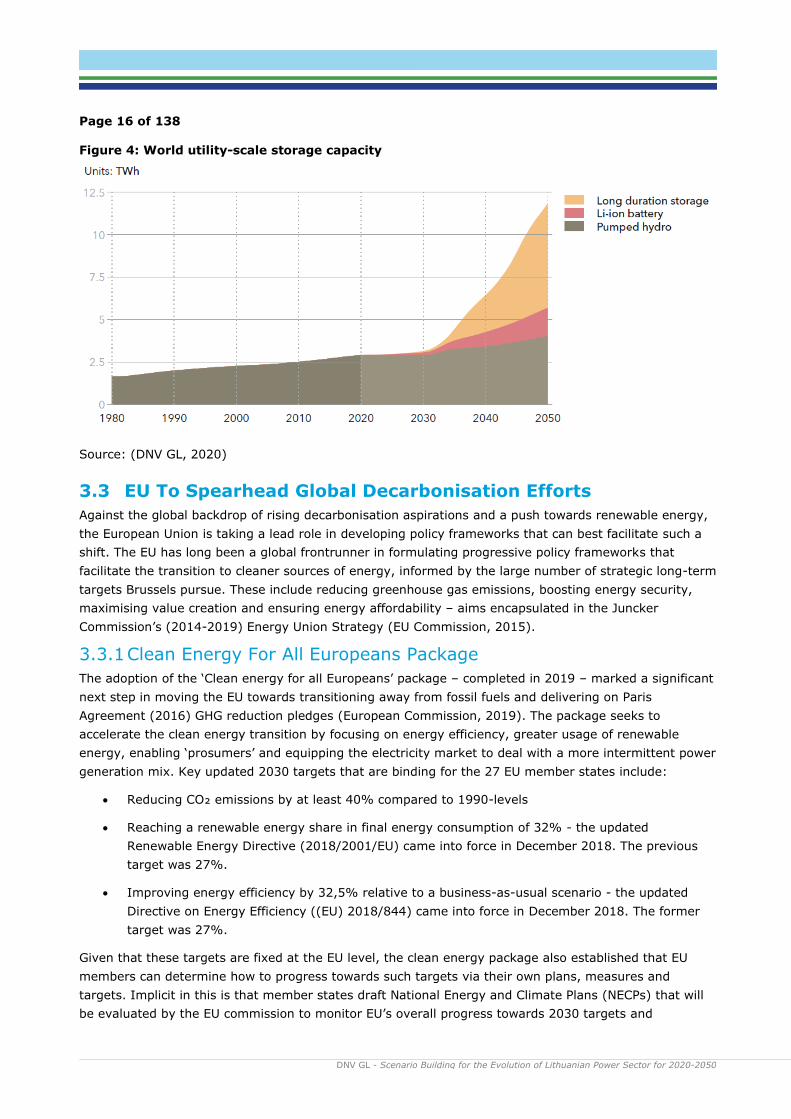
List of figures Figure 1: World Final Energy Demand By Carrier ........................................................................... 13 Figure 2: World electricity generation by power station type ........................................................... 14 Figure 3: Flexibility issues by timescale ........................................................................................ 15 Figure 4: World utility-scale storage capacity ................................................................................ 16 Figure 5: Overview Over Green Deal Aims .................................................................................... 17 Figure 6: Installed generation capacity in Lithuania in 2020, MW ..................................................... 19 Figure 7: Strategic Aims Under NENS ........................................................................................... 20 Figure 8: Power Consumption, Generation and Net Imports over 2019 ............................................. 21 Figure 9: Power generation over 2019 by technology % share of total .............................................. 21 Figure 10: Power generation by renewable energy source under NENS vision, TWh ............................ 23 Figure 11: TYNDP Development Scenarios .................................................................................... 26 Figure 12: Installed Capacities By DNV GL Scenario, 2030, GW ....................................................... 28 Figure 13: Power Generating Capacity By Technology By Scenario, 2050 .......................................... 29 Figure 14: Lithuanian electricity import and export capacity ............................................................ 30 Figure 15: Electricity Forecast Scenario By Sector .......................................................................... 31 Figure 16: Scenario for electricity demand from electric vehicles in Lithuania .................................... 34 Figure 17: Commodity prices in DNV GL’s power price model .......................................................... 35 Figure 18: Installed Capacity Under National Trends Scenario ......................................................... 37 Figure 19: Net Change By Technology By Year, GW ....................................................................... 38 Figure 20: Technology Share Of Total Capacity In 2040 .................................................................. 39 Figure 21: Installed Capacity Under Centralized Energy Scenario, GW .............................................. 41 Figure 22: Net Capacity Change By Technology By Year, GW........................................................... 42 Figure 23: Technology Share Of Total Capacity In 2040 .................................................................. 43 Figure 24: Net Capacity Growth By Technology By Year, GW ........................................................... 45 Figure 25: Net Capacity Change By Technology By Year, GW........................................................... 46 Figure 26: Technology Share Of Total Capacity In 2040 .................................................................. 47 Figure 27: National Trends Power Generation By Year, TWh ............................................................ 53 Figure 28: Centralised Energy Power Generation by Year, TWh ........................................................ 57 Figure 29: Distributed Energy Power Generation by Year, TWh ........................................................ 62 Figure 30: Lithuania peak load results compared with ENTSO-E scenarios ......................................... 65 Figure 31: Sources of variability and flexibility in the power system, based on (DNV GL, 2017) ........... 67 Figure 32: Time-scale of flexibility services, based on (DNV GL, 2017) ............................................. 68 Figure 33: EV electricity demand projection (left) and capacity profile (right) .................................... 72 Figure 34: Load curtailment versus load shifting ............................................................................ 73 Figure 35: Lithuania import and export capacity ............................................................................ 75 Figure: 36 Power to gas capacity scenario ..................................................................................... 76 Figure 37: Average annual power price and wind power capture price by flexibility case ..................... 79 Figure 38: Electricity price duration curves in the National Trends Scenario - Low flex case ................. 80
DNV GL - Scenario Building for the Evolution of Lithuanian Power Sector for 2020-2050
5
Figure 39: Low flex case, production, load and price during energy surplus week in 2050 ................... 82 Figure 40: Low Flex case - Power price in an energy deficit week in 2030, 2040 and 2050. ................. 83 Figure 41: Low flex case: Production, load and price during energy deficit week in 2050 ..................... 84 Figure 42: Medium Flex case - Price duration curves ...................................................................... 85 Figure 43: Medium flex case - Generation, load and power price - Energy surplus week in 2030 .......... 86 Figure 44: Medium flex case - Generation, load and power price - Energy surplus week in 2040 .......... 86 Figure 45: Medium flex case - Generation, load and power price - Energy surplus week in 2050 .......... 87 Figure 46: Medium flex case - Generation, load and power price - Energy deficit week in 2030 ............ 88 Figure 47: Medium flex case - Generation, load and power price - Energy deficit week in 2040 ............ 89 Figure 48: Medium flex case - generation, load and price – energy deficit week in 2050 ..................... 89 Figure 49: Medium flex case – Decomposition of electricity consumption – energy deficit week in 2050 90 Figure 50: Medium flex case - Flexibility effect on power price during deficit week in 2050 .................. 91 Figure 51: High Flex price duration curve ...................................................................................... 92 Figure 52: High flex case - production, load and price - energy surplus week in 2050 ......................... 93 Figure 53: High flex case - decomposition of load - energy surplus week in 2050 ............................... 93 Figure 54: High flex case - flexibility effect on power price - energy surplus week in 2050 .................. 94 Figure 55: National Trends - Price duration curves in 2050 by flexibility case .................................... 97 Figure 56: Development of wind power LCOE (DNV GL, 2020) ...................................................... 102 Figure 57: P2X effect on onshore and offshore wind capture price .................................................. 103 Figure 58: Power to gas capacity and consumption - National Trends scenario................................. 104 Figure 59: Electricity consumption from power to gas facilities throughout the year in 2050 .............. 104 Figure 60: European hydrogen potential scenario (European Commission, 2020) ............................. 105 Figure 61: The effect of power price for hydrogen production on cost of hydrogen, power price and wind power capture price ................................................................................................................. 107 Figure 62: Cost of power-to-gas-to-power (EUR/MWh) ................................................................. 108 Figure 63: Business case for power to hydrogen (for blending with natural gas at 20 EUR/MWh) ....... 109 Figure 64: Current and future prices* for natural gas in Lithuania (Heat Roadmap Europe, 2017) ...... 110 Figure 65: Illustrations of P2G business cases with more favourable market conditions .................... 112 Figure 66: Installed BESS capacity and use in the wholesale market .............................................. 113 Figure 67: Business case for stationary batteries ......................................................................... 114 Figure 68: Stacking of revenues (DNV GL, 2017) ......................................................................... 114 Figure 69: Annual net income from V2G ..................................................................................... 115 Figure 70: National Trends - the impact of P2G - Need for subsidies in Medium Flex vs High Flex....... 118 Figure 71: Renewable Energy Generation Expansion Targets ......................................................... 121 Figure 72: National Trends - Electricity consumption, generation and net imports by year, TWh ........ 122 Figure 73: National Trends - Installed power generating capacity by year, MW ................................ 122 Figure 74: National Trends - Net flexibility capacity growth by period, GW ...................................... 123 Figure 75: National Trends - Capacity Change By Year, GW........................................................... 124 Figure 76: National Trends - Generation Capacity Net Growth By Year, GW ..................................... 126 Figure 77: National Trends – Net Flexibility Capacity Growth, 2025-2030, GW ................................. 127 Figure 78: National Trends - Net power generating capacity growth by decade, GW ......................... 129 Figure 79: National Trends - Net flexibility capacity growth by decade, GW ..................................... 130 Figure 80: Focus countries in the power market model ................................................................. 136 Figure 81: Main sources for Lithuania scenario development ......................................................... 137
List of tables
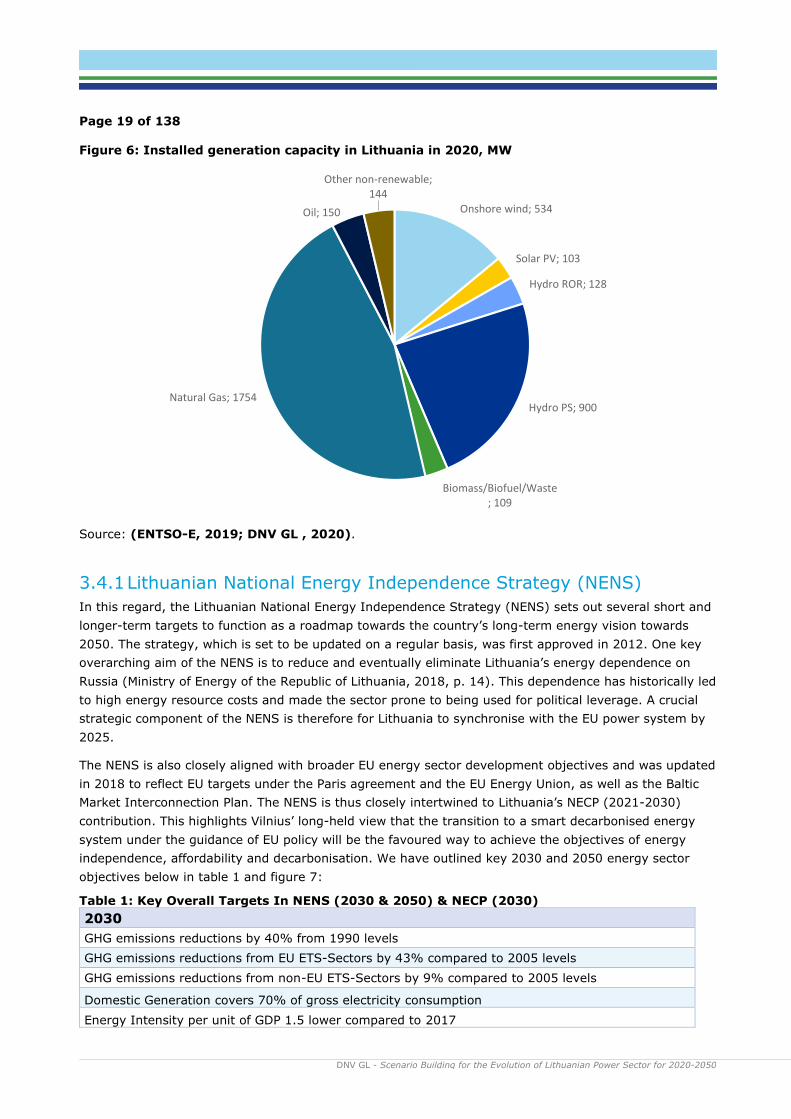
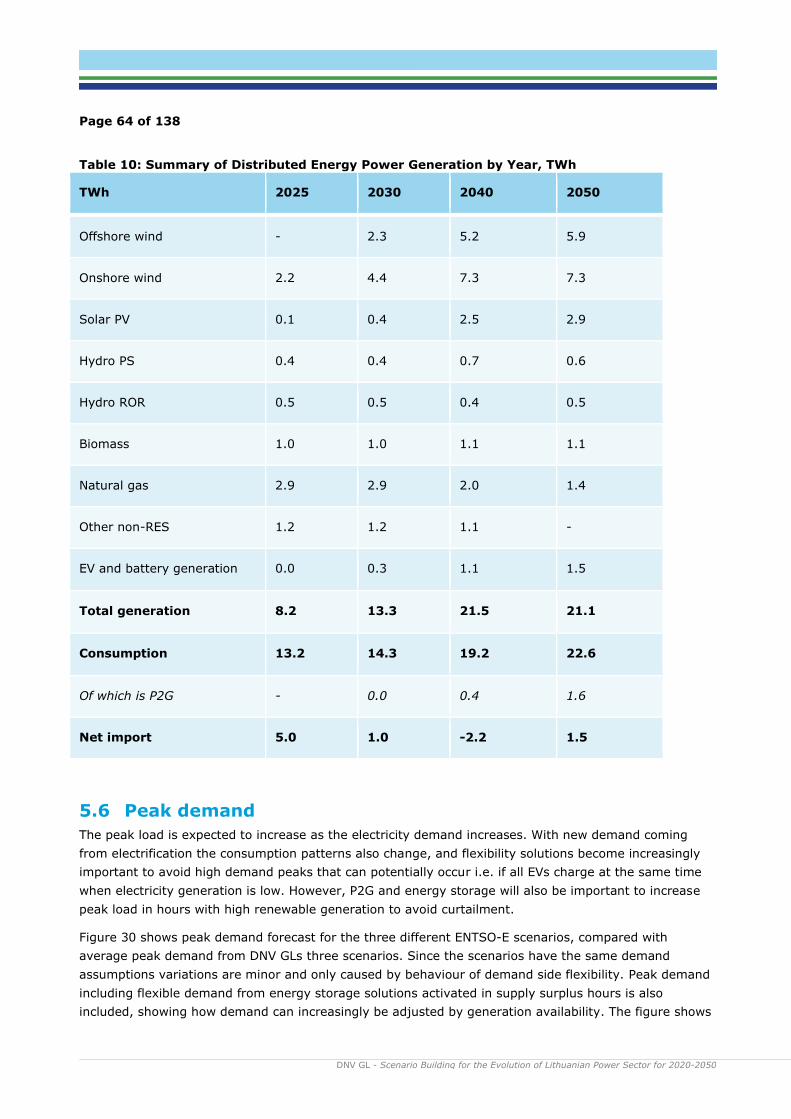
Table 1: Key Overall Targets In NENS (2030 & 2050) & NECP (2030) ............................................... 19 Table 2: Scenario for annual total load development in Lithuania (TWh) ........................................... 31 Table 3: Summary of national trends scenario ............................................................................... 40 Table 4: Summary Of Centralized Energy Scenario ......................................................................... 44 Table 5: Summary Of Distributed Energy Scenario ......................................................................... 48 Table 6: 2030 NENS Targets results by scenario ............................................................................ 50 Table 7: 2050 NENS Targets result by scenario ............................................................................. 51 Table 8: Summary of National Trends Power Generation By Year, TWh ............................................. 54 Table 9: Summary of Centralised Energy Power Generation by Year, TWh ......................................... 58 Table 10: Summary of Distributed Energy Power Generation by Year, TWh ....................................... 64 Table 11: Peak load results by scenario ........................................................................................ 65 Table 12: Overview of balancing market characteristics .................................................................. 69
DNV GL - Scenario Building for the Evolution of Lithuanian Power Sector for 2020-2050
6
Table 13: DSM methodology ....................................................................................................... 74 Table 14: Indicators of system stress in 2040 and 2050, by scenario and flexibility case ..................... 96 Table 15: Lithuania's resource requirements ................................................................................. 98 Table 16: Installed capacities and potential frequency resources (National Trends scenario) ................ 99 Table 17: Inertia in the Lithuanian power system in 2050 ............................................................. 100 Table 18: Investment costs for stationary batteries in the National Trends scenario ......................... 114 Table 19: Subsidies needed for wind power, P2G and batteries in 2050 .......................................... 118
Share of total Market response volume 10% 10% 25% 10% 30% 10% 5%
Page 75 of 138
DNV GL - Scenario Building for the Evolution of Lithuanian Power Sector for 2020-2050 litgrid test
6.4.5 Interconnectivity
As Lithuania transitions towards utilizing greater volumes of vRES electricity in its power generation mix,
electricity interconnectivity will play a key flexibility role in ensuring that the market can export supply
surpluses and import electricity to plug deficits. The overarching objective of completing the
synchronisation with the European energy system by 2025 will be a key driver of interconnectivity
investment in the near-term, notably through expanded capacity to Poland.
Increased interconnection capacity is considered as one of the flexibility solutions to ensure system
adequacy and contribute to supporting the business case of intermittent renewable generation. In 2040,
we forecast that interconnection capacity to Poland will expand further (from 700 to 1200 MW),
reflecting how rising flows of electricity between the two markets will be key to facilitating the steady
forecasted increase in renewables generation in the Lithuanian market. The extent of increasing
interconnection capacity available to support system adequacy is depicted in Figure 35. However, the
extent of how much new interconnection capacity should be implemented in order to achieve the optimal
mix of flexibility capacity from interconnections will depend on the power generation situation in the
relevant exporting country. In periods with low renewable generation in Lithuania there will likely be low
renewable generation in the neighbouring countries as well, meaning reduced import possibilities. This
will be reflected in the interconnector’s utilization ratio and market prices between interconnected
bidding zones.
Figure 35: Lithuania import and export capacity
0
500
1000
1500
2000
2500
3000
2020 2025 2030 2035 2040 2045 2050
MW
Importing capacity to Lithuania
LT-LV LT-SE LT-PL
0
1000
2000
3000
2020 2025 2030 2035 2040 2045 2050
MW
Exporting capacity from Lithuania
LT-LV LT-SE LT-PL
Page 76 of 138
DNV GL - Scenario Building for the Evolution of Lithuanian Power Sector for 2020-2050 litgrid test
6.4.6 Power-to-X
Power-to-X can be defined as a group of technologies that convert electricity to “X”, typically during
hours of surplus (renewable) power in the system. The “X” can refer to several things, amongst others
hydrogen, ammonia, fuel or heat. Power-to-X can either be seen as a form of energy storage, where the
“X” is converted back to electricity during hours of supply deficit (power-to-X-to-power), or as flexible
demand consuming electricity when needed and using the “X” in other sectors (such as transportation,
buildings or industry).
For this study, power-to-X is implemented as power-to-gas (P2G), or more precisely power-to-hydrogen,
where the hydrogen is produced from electrolysis. Hydrogen was chosen as the preferred energy vector
due to several factors:
1. Hydrogen can support the decarbonisation of several sectors in Lithuania and across Europe,
including transport, industry, power generation and buildings.
2. Hydrogen is pointed out as one of the key priorities to achieve the European Green Deal and
Europe’s clean energy transition, and the EU hydrogen strategy sees substantial investments in
the hydrogen economy towards 2030 and 2050.
3. Hydrogen can leverage the existing natural gas infrastructure in Lithuania.
Figure: 36 shows projections for installed
power to gas capacity in Lithuania towards
2050. The growth path is based on electrolysis
capacity in Europe from DNV GLs Energy
Transition Outlook 2020 (DNV GL, 2020). The
capacity increases from 49 MW in 2030 to 1.3
GW in 2050.
In our model, hydrogen production is activated
when the power price goes below a certain
limit, i.e. when there is a surplus of renewable
generation, with the aim of reducing the
number of hours with exceptionally low prices.
As mentioned above, the produced hydrogen can be used for various purposes. Most of the hydrogen
produced in Lithuania is expected to be injected into the gas grid and exported to neighbouring countries,
but it can also be used to decarbonise sectors like transportation and industry. This will be discussed in
greater detail in Chapter 8, where we will analyse the business cases for the different flexibility resources.
Figure: 36 Power to gas capacity scenario
Page 77 of 138
DNV GL - Scenario Building for the Evolution of Lithuanian Power Sector for 2020-2050 litgrid test
Page 78 of 138
DNV GL - Scenario Building for the Evolution of Lithuanian Power Sector for 2020-2050 litgrid test
7 SYSTEM ADEQUACY ASSESSMENT: INTRODUCING THREE LEVELS OF FLEXIBILITY TO THE LITHUANIAN POWER MARKET
7.1 Introduction
Building on the takeaways from the background discussion in chapter 6, we will in this chapter identify to
what extent flexibility resources will play a role in dealing with the challenges associated with an
increasingly intermittent power generation mix in Lithuania over the coming decades, as outlined in the
National Trends scenario identified in chapter 4 and 5. We will then highlight how the various flexibility
solutions identified in chapter 6 can help solve these challenges. These discussions will focus on solving:
• Surplus Supply Week: We have identified weeks with substantial power generation surplus,
driven by output from the wind power segment. Supply surplus is seen primarily towards 2040
and 2050, in tandem with the deployment of more wind capacity. The key role of flexibility
resources in such a week will be to export surplus energy or absorb it either through
consumption or storage solutions that shifts the energy to periods with less generation.
• Supply Deficit Week: This week entails a period when renewables generation is particularly low
while the load is high, meaning that there can be a mismatch between supply and demand. This
dynamic becomes more challenging over time as conventional generation is switched off and
replaced with intermittent renewables and the electricity demand increases. The key role of
flexibility will be to shift load to periods of higher generation, ramp up electricity imports from
Sweden, Latvia and Poland and to release energy stored from surplus periods.
In order to identify the relevant flexibility resource needs in Lithuania related to dealing with energy
surpluses and deficits leading up to 2050, and assessing the impact of such resources, we have
developed and modelled three specific flexibility cases that are based on our National Trends
Scenario for power generation7. The three cases will showcase how the availability of various levels
of flexibility resources – from low to high - can, to different extents, aggravate or solve the challenges
associated with an increasingly renewables-based power generation mix in Lithuania in weeks
characterised by energy surplus or deficits. The three cases discussed in this chapter are as follow:
1. Low Flexibility (’Low Flex’): In this scenario, only existing forms of flexibility such as power
plant response (including pumped hydro storage) and interconnectivity are taken into account.
As such, the variability in sunshine or wind conditions will yield a combination of very high and
zero electricity prices, depending of energy deficit and surplus periods respectively. Protracted
periods of very high prices skew the average price to close to EUR 90/MWh by 2050. We will
provide 2050 snapshots of surplus and deficit weeks to illustrate how deep the challenges would
become with a minimum of flexibility resources being available.
2. Medium Flexibility (’Medium Flex’ - all flexibility solutions except for Power-to-gas
(P2G)): Flexibility solutions such as stationary batteries, electric vehicle V2G, increased
interconnectivity and demand side solutions are integrated to absorb supply peaks and plug
supply deficits – leading to less supply volatility and lower average electricity prices. We will
provide snapshots on the evolution of the surplus and deficit weeks in 2030, 2040 and 2050 and
the use of flexibility resources in this section. The flexibility solutions introduced in the Medium
Flex case will address the challenges associated with the deficit week in the ’Low Flex’ case. That
7 The same flexibility cases are applied for all the countries in the model.
Page 79 of 138
DNV GL - Scenario Building for the Evolution of Lithuanian Power Sector for 2020-2050 litgrid test
said, on their own they will be unable to absorb enough surplus power supply to prevent
generation curtailment and facilitate attractive capture prices for intermittent renewables.
3. High Flexibility (’High Flex’ - all flexibility solutions including P2G): According to our
modelling results, the addition of P2G to the flexibility solutions outlined is key to a favourable
outcome when managing energy surplus periods. Crucially, P2G enables the absorption of
additional surplus electricity supply to that of the ’Medium Flex’ case. This will enable the
average price of electricity to become high enough to ensure profitability of intermittent
renewables generation through higher capture prices, and also prevent curtailment. At the same
time, the electricity price remains competitive for consumers. The High Flex case discussion will
focus on the Energy Surplus week in 2050.
The aim of our flexibility case discussion will thus be to highlight how the application of an appropriate
composition of flexibility solutions identified in the medium and high flex scenarios will be key to
ensuring that the challenges identified in the low flex scenario are addressed. Most notably, this means
ensuring that the electricity price is competitive for consumers while also ensuring that intermittent
renewables generation can access reasonable capture prices (see chart below). By extension, an
appropriate application of flexibility resources will enable Lithuania to progress towards key aims
envisioned by the NENS, namely to increasingly rely on domestically sourced renewable energy whilst
ensuring that the cost of energy is competitive vis-à-vis the EU average.
Figure 37 show how the assumptions in the different cases affect the average annual power prices in
Lithuania, and the effect of flexibility on the average capture price (generation weighted price) for wind
power.
Figure 37: Average annual power price and wind power capture price by flexibility case
Page 80 of 138
DNV GL - Scenario Building for the Evolution of Lithuanian Power Sector for 2020-2050 litgrid test
7.2 Outlining the challenges in a Low Flexibility Case
To initiate the discussion on flexibility, we will first delve into the low flex case in order to create a
foundation for our medium and high flex discussions. The key objective of this section will be to identify
the various challenges identified through our modelling of Lithuania’s National Trends power generation
scenario, in order to set the stage for how these challenges are to be solved in the ensuing sections of
this chapter. As such, we stress that the Low Flexibility case only incorporates existing forms of
flexibility such as power plant response (including pumped hydro storage) and
interconnectivity.
As is highlighted in the price duration curves of Figure 38, it is evident that only having the
aforementioned flexibility resources to deal with an increasingly intermittent generation mix would lead
to elevated price volatility in Lithuania towards 2050. In short, there would be longer periods of power
supply deficits and power supply surpluses, the former reflected in extremely high prices and latter low
prices. As the graph highlights this dynamic gets stronger post-2040. By 2050, in the Low Flex case 6
TWh out of a total generation of 18 TWh in Lithuania is generated when the price is below 0.1 EUR/MWh,
while another 1 TWh of solar and wind energy is curtailed. Both outcomes would have negative financial
consequences for renewables generators. We also note that another 0.2 TWh is generated during hours
of high prices >200 EUR/MWh (up to the maximum price of EUR 3,500/MWh), which in turn would
impact consumers negatively, but increase the annual average capture price for power generators.
Figure 38: Electricity price duration curves in the National Trends Scenario - Low flex case
In this section we will therefore go into detail on the composition of a low flex case, in order to pinpoint
the main challenges associated with having limited resources of flexibility readily available. More
specifically we will showcase the results from an example week with a high energy surplus and another
example week with a deep energy deficit. The surplus and deficit weeks are chosen based on low and
high average power price, respectively, and do not necessarily represent the same week for all years.
Page 81 of 138
DNV GL - Scenario Building for the Evolution of Lithuanian Power Sector for 2020-2050 litgrid test
This will then form the backdrop of a discussion on medium and high flexibility scenarios – and how they
can be solved through the introduction of flexibility resources.
7.2.1 Energy surplus week: Identifying the challenges
Firstly, we will delve into the characteristics of an energy surplus week in 2050 in a low flexibility case to
highlight how big the challenges associated with having an intermittent power generation mix can be
with a minimum of flexibility resources. Figure 39 shows the modelling results for generation, demand
and electricity price in an energy surplus week in Lithuania in 2050 in the low flex case. This is a winter
week with high wind power generation, and highlights how a substantial surplus in Lithuanian power
generation, driven by the wind power segment, impacts the power price over that week. The generation
above the black load line shows amount of energy exported to neighbouring countries, while the light
blue areas show curtailment of renewables. The power price (red line, left axis) is close to zero for most
hours, except for one price peak where wind generation is low.
In a power system increasingly based on intermittent wind and solar power, power generation will often
mismatch with electricity demand. When supply substantially exceeds demand, the power price drops to
zero, and power curtailment may be necessary to protect the integrity of the power system. Similar
weather patterns in neighbouring countries with increasing renewable share amplify the effect and
reduces the possibilities to export in surplus hours. This can have an adverse effect on wind and solar
project economics, as they require a set average electricity price per MWh (capture price) to be
profitable. In the early stages of renewables development, high technology cost meant that subsidies
covered the gap between the market price and the price needed to ensure profitability. As renewables
have now in many cases reached grid parity, such subsidies have been mostly phased out. This has in
turn made renewables generators exposed to merchant market risk. To address the issue of oversupply,
zero prices and curtailment, by extension supporting generator profitability, additional power demand
that can flexibly absorb power supplies must be introduced.
Page 82 of 138
DNV GL - Scenario Building for the Evolution of Lithuanian Power Sector for 2020-2050 litgrid test
Figure 39: Low flex case, production, load and price during energy surplus week in 2050
7.2.2 Energy deficit week: Identifying the challenges
In stark contrast to the energy surplus week, an energy deficit week is characterised by very limited
output from Lithuania’s wind power segment, due to weather conditions. Similar weather conditions in
neighbouring countries makes the effect stronger and in the worst case limit import availability. Supply
deficit periods become and increasing challenge as renewables capacity and electricity demand increases.
This can lead to extreme power price peaks due to demand outstripping supply, dramatically increasing
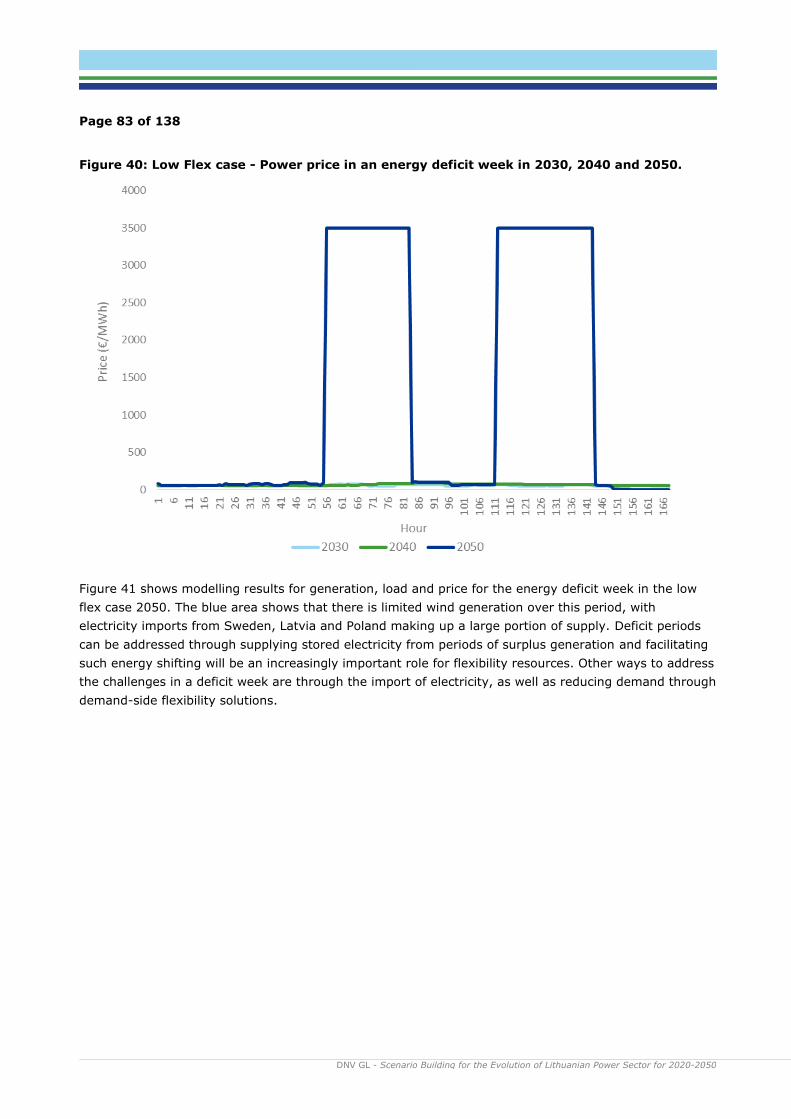
the electricity price. This is evident in Figure 40, which shows modelling results for the electricity price in
a deficit week in 2030, 2040 and 2050. It shows that in 2050, the low flexibility case would regularly
yield prices as high as EUR 3,500/MWh in 2050 (which is the value for lost load).
Page 83 of 138
DNV GL - Scenario Building for the Evolution of Lithuanian Power Sector for 2020-2050 litgrid test
Figure 40: Low Flex case - Power price in an energy deficit week in 2030, 2040 and 2050.
Figure 41 shows modelling results for generation, load and price for the energy deficit week in the low
flex case 2050. The blue area shows that there is limited wind generation over this period, with
electricity imports from Sweden, Latvia and Poland making up a large portion of supply. Deficit periods
can be addressed through supplying stored electricity from periods of surplus generation and facilitating
such energy shifting will be an increasingly important role for flexibility resources. Other ways to address
the challenges in a deficit week are through the import of electricity, as well as reducing demand through
demand-side flexibility solutions.
Page 84 of 138
DNV GL - Scenario Building for the Evolution of Lithuanian Power Sector for 2020-2050 litgrid test
Figure 41: Low flex case: Production, load and price during energy deficit week in 2050
7.3 Outlining challenges and solutions in a medium flexibility case
The low flexibility case highlights the substantial challenges that would face Lithuania in a scenario where
limited flexibility resources would be available to balance an increasingly intermittent power supply.
However, there are a number of flexibility solutions not applied in the low flexibility scenario available to
date, and new technologies set to reach maturity over the coming decades. As such, this section will
assess what and how flexibility resources can address such challenges through a combination of energy
storage absorbing and shifting surplus power generation to deficit periods, and the demand-side
responding to energy supply dynamics.
In line with this, we will showcase how introducing an increased level of flexibility resources in Lithuania,
and surrounding markets in Europe, will alter the results of the energy surplus and deficit weeks
assessed in the low flexibility scenario. In line with this, the medium flexibility case introduces the
following flexibility resources vis-à-vis the low flexibility case:
• Stationary battery storage and EV vehicle-to-grid, as described in section 6.4.2 and 6.4.3
• Higher levels of interconnectivity, as described in in 6.4.5.
• Demand-side flexibility as described in 6.4.4
In short, by assessing the price duration curves for the Medium Flex case in Figure 42 it is evident that
the aforementioned flexibility resources help address the long durations of high prices in 2040 and 2050.
In fact, in 2040 the peak price is reduced to 96 EUR/MWh and in 2050, the number of hours when the
power price exceeds EUR200/MWh reduced to 24. This highlights that flexible load and energy supply
shifting can address supply deficit challenges. On the other hand, it is evident in the chart below that
Page 85 of 138
DNV GL - Scenario Building for the Evolution of Lithuanian Power Sector for 2020-2050 litgrid test
extended periods of very low prices will remain a challenge, notably in 2050. This illustrates that the
flexibility resources introduced in this case are unable to absorb enough surplus generation to address all
the surplus period challenges.
Figure 42: Medium Flex case - Price duration curves
7.3.1 Energy surplus week: Identifying solutions and challenges
In the Medium Flexibility case we have introduced several flexibility technologies that will play an
increasingly important role in facilitating the transition towards greater usage of intermittent renewable
energy. In the following sections electricity surplus weeks with the flexibility introduced in the medium
flex case are presented for 2030, 2040 and 2050.
7.3.1.1 2030: Few Energy Surplus Challenges Anticipated
Leading up to 2030, we expect there to be limited challenges in dealing with surplus generation in
Lithuania. As is highlighted in the NENS, the market is set to remain a net importer of electricity over the
coming decade, and this is evident in our surplus generation week illustrated below in Figure 43. This is
a spring week, evidenced in the solar segment making up a relatively large share of total generation. In
2030, domestic power generation over the surplus week mostly remains below that of the black load line,
with electricity imports from Poland, Sweden and Latvia covering the gap between generation and load.
As such, there are no oversupply challenges anticipated for 2030, highlighted by the very limited period
of time with very low prices in the Medium Flex case price duration curve.
Page 86 of 138
DNV GL - Scenario Building for the Evolution of Lithuanian Power Sector for 2020-2050 litgrid test
Figure 43: Medium flex case - Generation, load and power price - Energy surplus week in 2030
7.3.1.2 2040: Low Prices Increasingly Common
By 2040 our model results show that the surplus supply situation in Lithuania has changed, with supply
exceeding load. This in turn reflected in lower prices over the selected surplus week – namely week 1.
The large share of wind power of total generation over this week is a result of higher wind generation
and lower solar generation over the winter months. Figure 44 showcases a load line that is more
responsive to supply fluctuations over the week than what was the case for the Low Flex case, the low
price indicates that not enough electricity is absorbed to account for the large supply. This is also
indicative of surplus periods also leading to low prices in neighboring markets, with electricity exports
being unable to bolster Lithuanian power prices during most of this week. As such, the flexibility
resources available are unable to boost demand flexibility enough to support higher prices – by
extension hitting the electricity capture price registered for renewables generation assets.
Figure 44: Medium flex case - Generation, load and power price - Energy surplus week in 2040
Page 87 of 138
DNV GL - Scenario Building for the Evolution of Lithuanian Power Sector for 2020-2050 litgrid test
Figure 45: Medium flex case - Generation, load and power price - Energy surplus week in 2050
7.3.1.3 2050: Deepened Surplus Challenges
By 2050, the challenges identified for 2040 have deepened further according to our results. While the
Medium Flex case helps to reduce the extent of issues associated with power supply curtailment,
extreme electricity price volatility and zero prices evident in the Low Flex case, it is not enough to avoid
curtailment and long periods of zero prices. This is shown in Figure 45 of generation, power price and
decomposition of load for week 1 in 2050.
The combination of pumped hydro storage, stationary batteries, EV V2G and demand side flexibility play
a key role in absorbing surplus electricity and shifting it to periods with less supply in the system. As can
be seem in the right figure the EV load (which is both electricity used for driving and for V2G) and the
stationary battery storage facilities play a key role in absorbing power generation peaks. However, this is
insufficient to deal with the large power surpluses available in the system over this time-period,
suggesting that additional flexibility measures are required to increase the power price and eliminate
curtailment.
As a result, the medium flexibility case yields an average electricity capture price for onshore wind
generation of EUR22/MWh in 2050 – even below that of the Low Flex case. This is the result of flexibility
resources being insufficient to stimulate enough demand to substantially support the electricity price
over surplus weeks.
7.3.2 Energy Deficit Week: Identifying solutions and challenges
The electricity price duration curves for the Medium Flex case highlights that the flexibility resources
introduced in this case can help to substantially reduce the extent and duration of peak electricity prices
in Lithuania leading up to 2050. Notably, by 2050, our results indicate that the power price only will
exceed EUR200/MWh for 24 hours through the year. The following sections present electricity deficit
Page 88 of 138
DNV GL - Scenario Building for the Evolution of Lithuanian Power Sector for 2020-2050 litgrid test
Figure 46: Medium flex case - Generation, load and power price - Energy deficit week in 2030
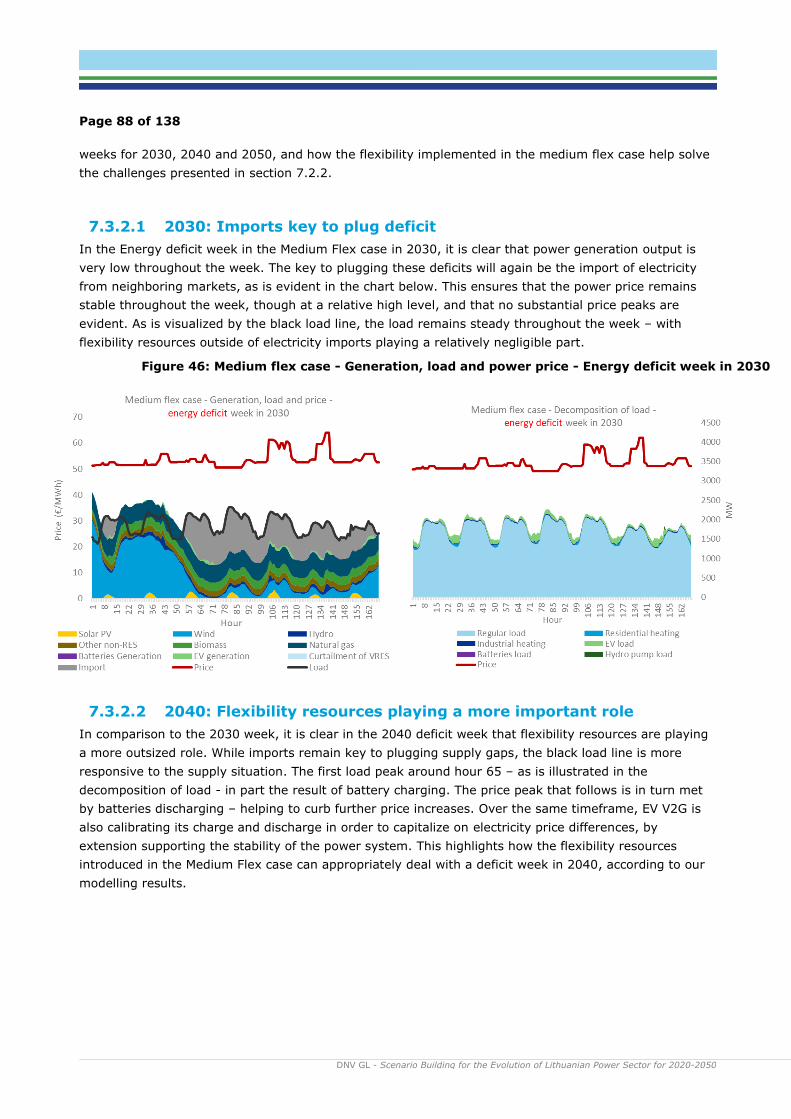
weeks for 2030, 2040 and 2050, and how the flexibility implemented in the medium flex case help solve
the challenges presented in section 7.2.2.
7.3.2.1 2030: Imports key to plug deficit
In the Energy deficit week in the Medium Flex case in 2030, it is clear that power generation output is
very low throughout the week. The key to plugging these deficits will again be the import of electricity
from neighboring markets, as is evident in the chart below. This ensures that the power price remains
stable throughout the week, though at a relative high level, and that no substantial price peaks are
evident. As is visualized by the black load line, the load remains steady throughout the week – with
flexibility resources outside of electricity imports playing a relatively negligible part.
7.3.2.2 2040: Flexibility resources playing a more important role
In comparison to the 2030 week, it is clear in the 2040 deficit week that flexibility resources are playing
a more outsized role. While imports remain key to plugging supply gaps, the black load line is more
responsive to the supply situation. The first load peak around hour 65 – as is illustrated in the
decomposition of load - in part the result of battery charging. The price peak that follows is in turn met
by batteries discharging – helping to curb further price increases. Over the same timeframe, EV V2G is
also calibrating its charge and discharge in order to capitalize on electricity price differences, by
extension supporting the stability of the power system. This highlights how the flexibility resources
introduced in the Medium Flex case can appropriately deal with a deficit week in 2040, according to our
modelling results.
Page 89 of 138
DNV GL - Scenario Building for the Evolution of Lithuanian Power Sector for 2020-2050 litgrid test
Figure 47: Medium flex case - Generation, load and power price - Energy deficit week in 2040
7.3.2.3 2050: Substantial flexibility resources curbing price peaks
Naturally, the supply situation in 2050 will be characterized by Lithuania having a higher load and more
supplies of intermittent renewables generation to contend with than in previous decades. A more
detailed breakdown of the gap between generation and load and how this is dealt with in 2050 is
provided in Figure 48. In 2050, it is again clear that imports will play the most important part in plugging
the supply deficit over this period, with extensive imports from Sweden, Latvia and Poland being
registered in our modelling results. At the same time, a much more flexible load in Lithuania and Europe
more generally compared to that of the Low Flex case is key to reducing price peaks over the deficit
week.
Figure 48: Medium flex case - generation, load and price – energy deficit week in 2050
Page 90 of 138
DNV GL - Scenario Building for the Evolution of Lithuanian Power Sector for 2020-2050 litgrid test
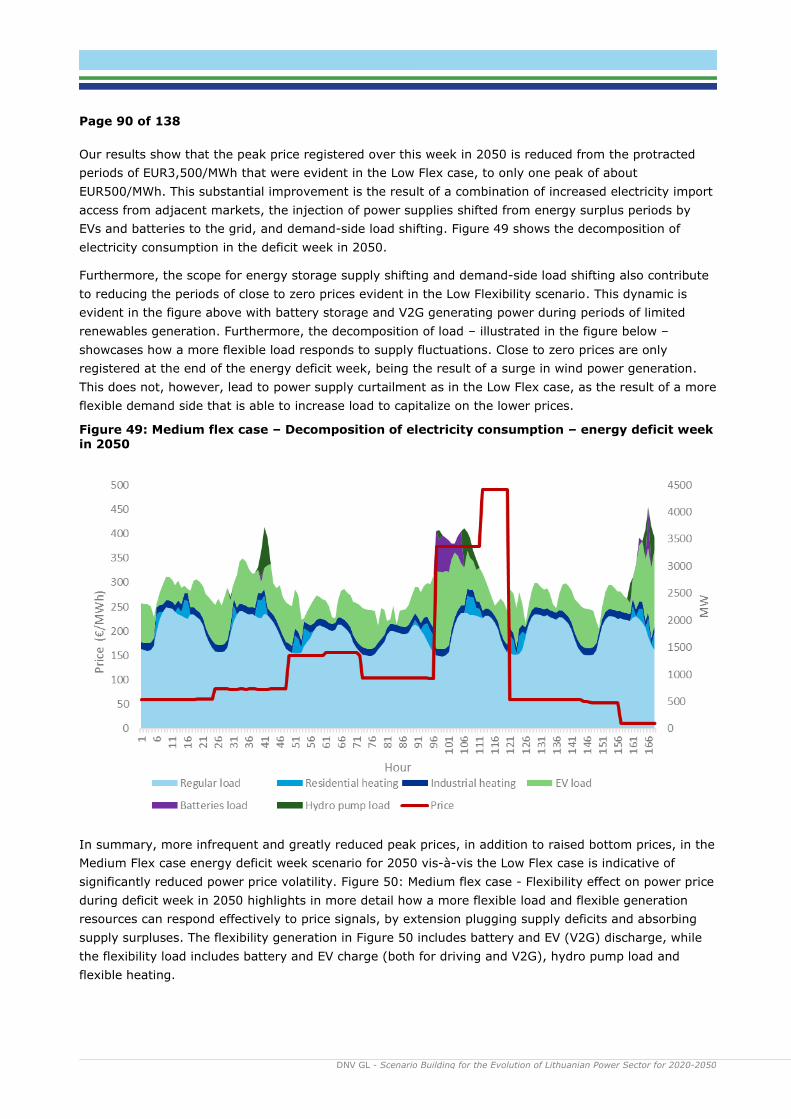
Our results show that the peak price registered over this week in 2050 is reduced from the protracted
periods of EUR3,500/MWh that were evident in the Low Flex case, to only one peak of about
EUR500/MWh. This substantial improvement is the result of a combination of increased electricity import
access from adjacent markets, the injection of power supplies shifted from energy surplus periods by
EVs and batteries to the grid, and demand-side load shifting. Figure 49 shows the decomposition of
electricity consumption in the deficit week in 2050.
Furthermore, the scope for energy storage supply shifting and demand-side load shifting also contribute
to reducing the periods of close to zero prices evident in the Low Flexibility scenario. This dynamic is
evident in the figure above with battery storage and V2G generating power during periods of limited
renewables generation. Furthermore, the decomposition of load – illustrated in the figure below –
showcases how a more flexible load responds to supply fluctuations. Close to zero prices are only
registered at the end of the energy deficit week, being the result of a surge in wind power generation.
This does not, however, lead to power supply curtailment as in the Low Flex case, as the result of a more
flexible demand side that is able to increase load to capitalize on the lower prices.
Figure 49: Medium flex case – Decomposition of electricity consumption – energy deficit week in 2050
In summary, more infrequent and greatly reduced peak prices, in addition to raised bottom prices, in the
Medium Flex case energy deficit week scenario for 2050 vis-à-vis the Low Flex case is indicative of
significantly reduced power price volatility. Figure 50: Medium flex case - Flexibility effect on power price
during deficit week in 2050 highlights in more detail how a more flexible load and flexible generation
resources can respond effectively to price signals, by extension plugging supply deficits and absorbing
supply surpluses. The flexibility generation in Figure 50 includes battery and EV (V2G) discharge, while
the flexibility load includes battery and EV charge (both for driving and V2G), hydro pump load and
flexible heating.
Page 91 of 138
DNV GL - Scenario Building for the Evolution of Lithuanian Power Sector for 2020-2050 litgrid test
Figure 50: Medium flex case - Flexibility effect on power price during deficit week in 2050
7.4 Identifying surplus week solutions in a high flexibility case
The Medium Flex case highlights the importance of introducing flexibility resources to address the
challenges associated with an increasing reliance on intermittent renewable energy generation. By
enabling the absorption of surplus energy and shifting of such supplies to deficit periods, coupled with a
demand-side more responsive to electricity price signals, flexibility resources can help bridge the gap
between supply and demand in various scenarios – by extension supporting the introduction of more
renewable energy capacity and bolstering energy security.
In our Medium Flex case, it was evident that the combination of EV V2G, battery storage, demand-side
flexibility and increased interconnectivity would dramatically improve the results registered in the Low
Flex case. This was particularly noticeable in a deficit week, for which price volatility was substantially
reduced. That said, it was also clear that during surplus periods renewables generation curtailment and
low electricity prices would remain key pressure points, even with the introduction of the flexibility
resources. This would result in capture prices that are unsustainably low for renewable energy over the
duration of 2050. More flexibility resources than those incorporated in the Medium Flex case will
therefore be required to deal with energy surplus periods in a satisfactory manner as the Lithuanian (and
European) renewable energy reliance increases over the coming decades.
With this in mind, we will in this section showcase how the introduction of power-to-gas in a High Flex
case can help appropriately address the challenges identified in the Medium Flex surplus week. In short,
the added capacity of P2G production facilities, producing hydrogen through electrolysis, can absorb
additional surplus power generation on top of the resources already identified in the Medium Flex case.
In our model, we have integrated the P2G electrolysers to start consuming power for hydrogen
production when the price drops below EUR20/MWh. As the installed P2G capacity both in Lithuania and
the rest of Europe is forecasted to increase substantially towards 2050, this additional consumption will
lift almost all low prices up to 20 EUR/MWh. The substantially reduced duration of periods with very low
Page 92 of 138
DNV GL - Scenario Building for the Evolution of Lithuanian Power Sector for 2020-2050 litgrid test
electricity prices results in more favourable capture prices for renewable energy. This is reflected in the
High Flex price duration curve below, clearly visible for the 2050 curve where almost all the zero prices
from Figure 42 are raised to 20 EUR/MWh. As a result, we argue that the introduction of P2G will be key
to supporting the build-out of new renewables capacity, as envisioned by the NENS plan.
Figure 51: High Flex price duration curve
7.4.1 Energy surplus week: the impact of P2G
The key role of P2G in the High Flex case will be to support addressing the challenges associated with
surplus generation periods by adding to the capacity of flexibility resources to absorb such surpluses. In
line with Lithuania’s steadily expanding renewables generation supply, challenges associated with surplus
power generation will appear by 2040 and increase towards 2050. The positive impact of introducing
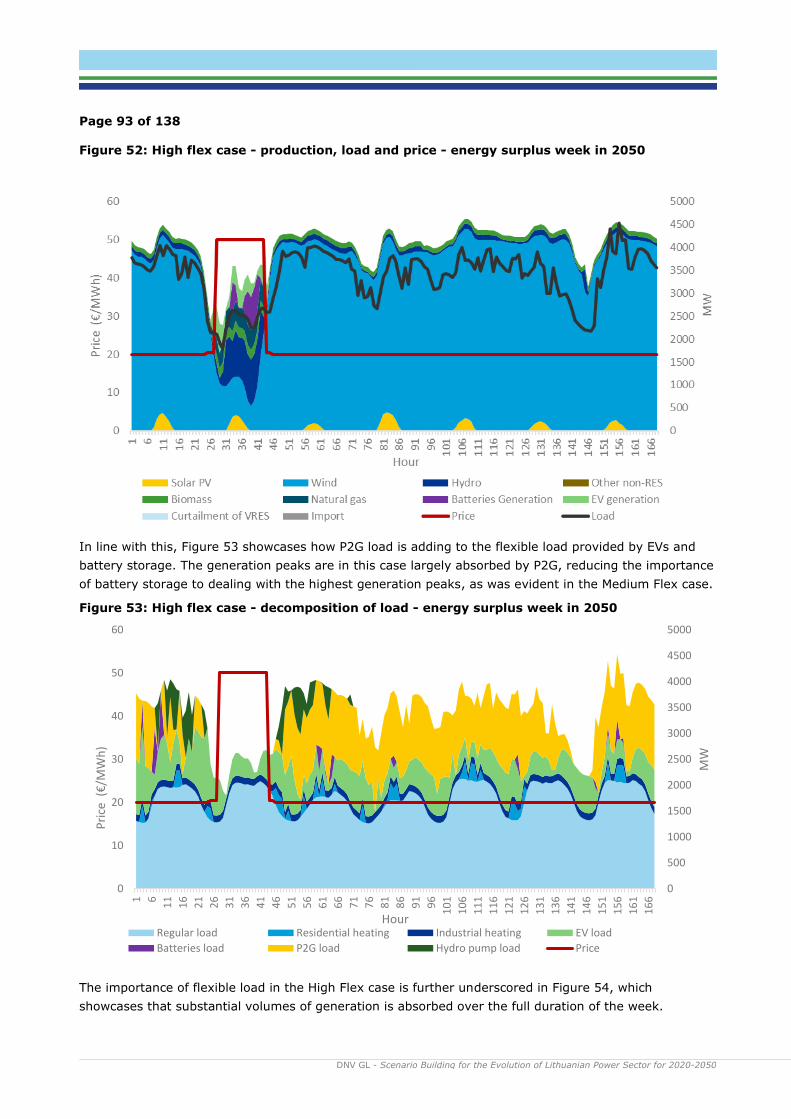
P2G on top of the flexibility resources available in the Medium Flex case is clearly illustrated in Figure 52
given that the black load line is even more responsive to generation output than what was the case in
the Medium Flex scenario. As a result, wind and solar curtailment is no longer necessary, while zero
prices are no longer evident with the bottom price again trending at around EUR20/MWh.
Page 93 of 138
DNV GL - Scenario Building for the Evolution of Lithuanian Power Sector for 2020-2050 litgrid test
Figure 52: High flex case - production, load and price - energy surplus week in 2050
In line with this, Figure 53 showcases how P2G load is adding to the flexible load provided by EVs and
battery storage. The generation peaks are in this case largely absorbed by P2G, reducing the importance
of battery storage to dealing with the highest generation peaks, as was evident in the Medium Flex case.
Figure 53: High flex case - decomposition of load - energy surplus week in 2050
The importance of flexible load in the High Flex case is further underscored in Figure 54, which
showcases that substantial volumes of generation is absorbed over the full duration of the week.
0
500
1000
1500
2000
2500
3000
3500
4000
4500
5000
0
10
20
30
40
50
60
1 6
11
16
21
26
31
36
41
46
51
56
61
66
71
76
81
86
91
96
10
1
10
6
11
1
11
6
12
1
12
6
13
1
13
6
14
1
14
6
15
1
15
6
16
1
16
6
MW
Pri
ce (
€/M
Wh
)
HourRegular load Residential heating Industrial heating EV load
Batteries load P2G load Hydro pump load Price
Page 94 of 138
DNV GL - Scenario Building for the Evolution of Lithuanian Power Sector for 2020-2050 litgrid test
Crucially, P2G enables the flexible load to absorb greater bulks of electricity over longer timeframes,
thereby preventing the zero prices evident in the Low and Medium Flex case, as is illustrated in the dark
blue (High Flex) and light blue (Low Flex) power price lines in the figure below. The price peak registered
in the Low flex case is also prevented, in line with energy storage resources being available to supply
electricity in response to higher prices.
Figure 54: High flex case - flexibility effect on power price - energy surplus week in 2050
7.5 System adequacy performance by scenario
System adequacy can be defined as the ability of a power system to satisfy demand – at all times. There
are several ways of assessing the system adequacy of a power system. In building up the scenarios and
flexibility cases above, we have observed four indicators of system stress for each of the projected
market equilibriums, further explained in section 7.5.2 below. Two of these indicators, the loss of load
expectation (LOLE) and the energy not served (ENS) are also observed by ENTSO-E. ENTSO-E
continuously develops methodologies to assess the system adequacy for the different members and
regularly publish methodology and adequacy forecast reports with LOLE and ENS numbers (ENTSO-E,
2019), see comparison in section 7.5.1.
A different approach to analyse system adequacy is to focus on the resources TSOs would need to
ensure security of supply and a resilient power system. In section 7.5.3 we assess system requirements
and balancing capabilities of the modelled electricity system for the different scenarios.
7.5.1 Analytical approach and comparison with ENTSO-E
The approach to system adequacy assessment in this report is based on extensive analyses by means of
DNV GL’s PLEXOS model of the European electricity market, with a special focus on the Lithuanian and
system. This is an electricity market model with hourly time resolution and a simplified description of the
Page 95 of 138
DNV GL - Scenario Building for the Evolution of Lithuanian Power Sector for 2020-2050 litgrid test
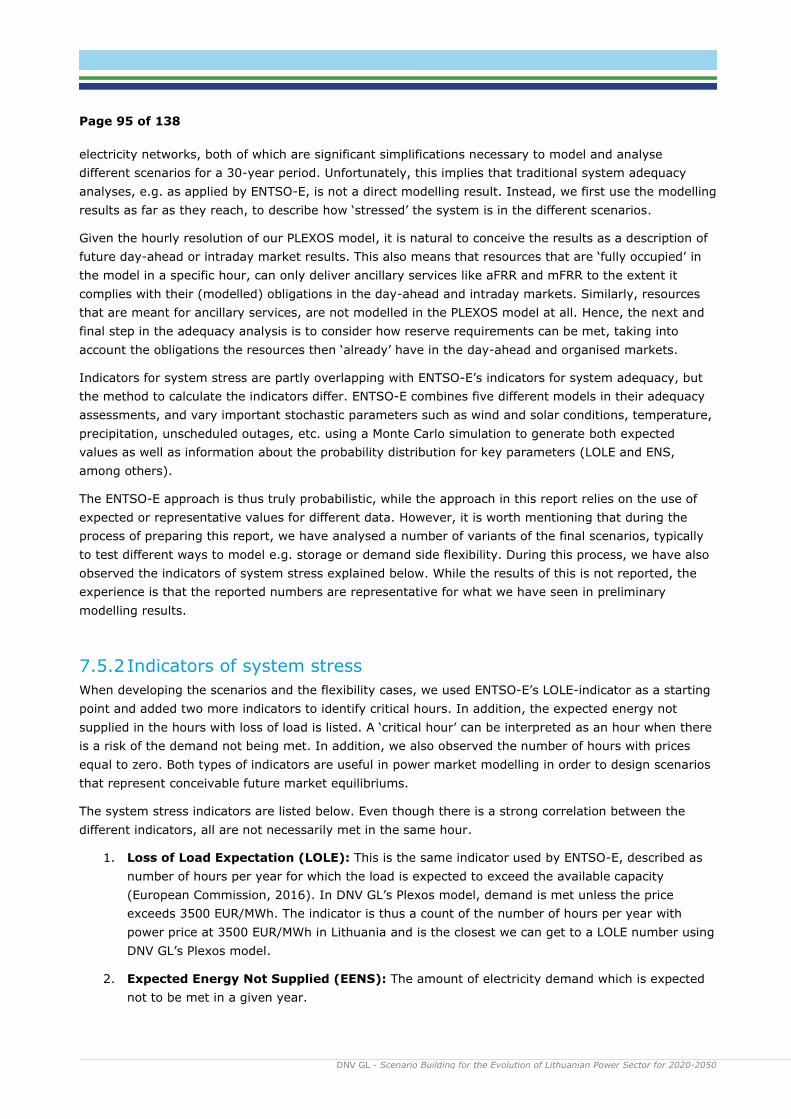
electricity networks, both of which are significant simplifications necessary to model and analyse
different scenarios for a 30-year period. Unfortunately, this implies that traditional system adequacy
analyses, e.g. as applied by ENTSO-E, is not a direct modelling result. Instead, we first use the modelling
results as far as they reach, to describe how ‘stressed’ the system is in the different scenarios.
Given the hourly resolution of our PLEXOS model, it is natural to conceive the results as a description of
future day-ahead or intraday market results. This also means that resources that are ‘fully occupied’ in
the model in a specific hour, can only deliver ancillary services like aFRR and mFRR to the extent it
complies with their (modelled) obligations in the day-ahead and intraday markets. Similarly, resources
that are meant for ancillary services, are not modelled in the PLEXOS model at all. Hence, the next and
final step in the adequacy analysis is to consider how reserve requirements can be met, taking into
account the obligations the resources then ‘already’ have in the day-ahead and organised markets.
Indicators for system stress are partly overlapping with ENTSO-E’s indicators for system adequacy, but
the method to calculate the indicators differ. ENTSO-E combines five different models in their adequacy
assessments, and vary important stochastic parameters such as wind and solar conditions, temperature,
precipitation, unscheduled outages, etc. using a Monte Carlo simulation to generate both expected
values as well as information about the probability distribution for key parameters (LOLE and ENS,
among others).
The ENTSO-E approach is thus truly probabilistic, while the approach in this report relies on the use of
expected or representative values for different data. However, it is worth mentioning that during the
process of preparing this report, we have analysed a number of variants of the final scenarios, typically
to test different ways to model e.g. storage or demand side flexibility. During this process, we have also
observed the indicators of system stress explained below. While the results of this is not reported, the
experience is that the reported numbers are representative for what we have seen in preliminary
modelling results.
7.5.2 Indicators of system stress
When developing the scenarios and the flexibility cases, we used ENTSO-E’s LOLE-indicator as a starting
point and added two more indicators to identify critical hours. In addition, the expected energy not
supplied in the hours with loss of load is listed. A ‘critical hour’ can be interpreted as an hour when there
is a risk of the demand not being met. In addition, we also observed the number of hours with prices
equal to zero. Both types of indicators are useful in power market modelling in order to design scenarios
that represent conceivable future market equilibriums.
The system stress indicators are listed below. Even though there is a strong correlation between the
different indicators, all are not necessarily met in the same hour.
1. Loss of Load Expectation (LOLE): This is the same indicator used by ENTSO-E, described as
number of hours per year for which the load is expected to exceed the available capacity
(European Commission, 2016). In DNV GL’s Plexos model, demand is met unless the price
exceeds 3500 EUR/MWh. The indicator is thus a count of the number of hours per year with
power price at 3500 EUR/MWh in Lithuania and is the closest we can get to a LOLE number using
DNV GL’s Plexos model.
2. Expected Energy Not Supplied (EENS): The amount of electricity demand which is expected
not to be met in a given year.
Page 96 of 138
DNV GL - Scenario Building for the Evolution of Lithuanian Power Sector for 2020-2050 litgrid test
3. Power prices exceeding a threshold of 200 EUR/MWh. In power market models based on
economic principles, scarcity of some sort would typically result in relatively high prices. To
observe how often there is some scarcity in the model, and then indirectly how close the system
might be to require a load curtailment, we count the number of hours with prices above 200
EUR/MWh.
4. Number of hours with reserve margin below 700 MW. As an indication of system stress, we
have counted the number of hours where the available, not utilized capacity in the model is
below 700 MW. The result illustrates the vulnerability of the system for unplanned outages; a
low score means the system has a higher reserve margin, all else equal. The motivation is an N-
1 approach: If one of the large units (either a generator or a transmission line) in the system
fails, and there is not enough available generation or import capacity to meet the requested
demand in that hour, security of supply is at risk. The largest unit in the system is the 700 MW
NordBalt HVDC interconnection link between Sweden and Lithuania.
Table 14 shows the scores of these system stress indicators for the different flexibility cases in the
National Trends scenario, as well as for the high flex cases of the the Centralised and Distributed Energy
scenarios for 2040 and 2050. Earlier years are not included in the table as modelling results showed no
hours fulfilling the indicators of system stress before 2040.
Table 14: Indicators of system stress in 2040 and 2050, by scenario and flexibility case
Adequacy
indicators
Year National Trends Centralised
Energy
(high flex)
Distributed
Energy
(high flex) Low
flex
Medium
flex
High
flex
Loss of Load
Expectation
(hours/year;
price =
3500EUR/MWh)
2040 7 0 0 0 0
2050 139 0 0 0 0
Expected Energy
Not Supplied
(GWh/year)
2040 0.02 0 0 0 0
2050 45.8 0 0 0 0
Number of hours
with relatively
high power-
prices (above
200 EUR/MWh)
2040 7 0 0 0 0
2050 146 24 24 25 24
Number of hours
with available
capacity less
than 700 MW
2040 13 0 0 0 0
2050 66 0 0 0 0
Page 97 of 138
DNV GL - Scenario Building for the Evolution of Lithuanian Power Sector for 2020-2050 litgrid test
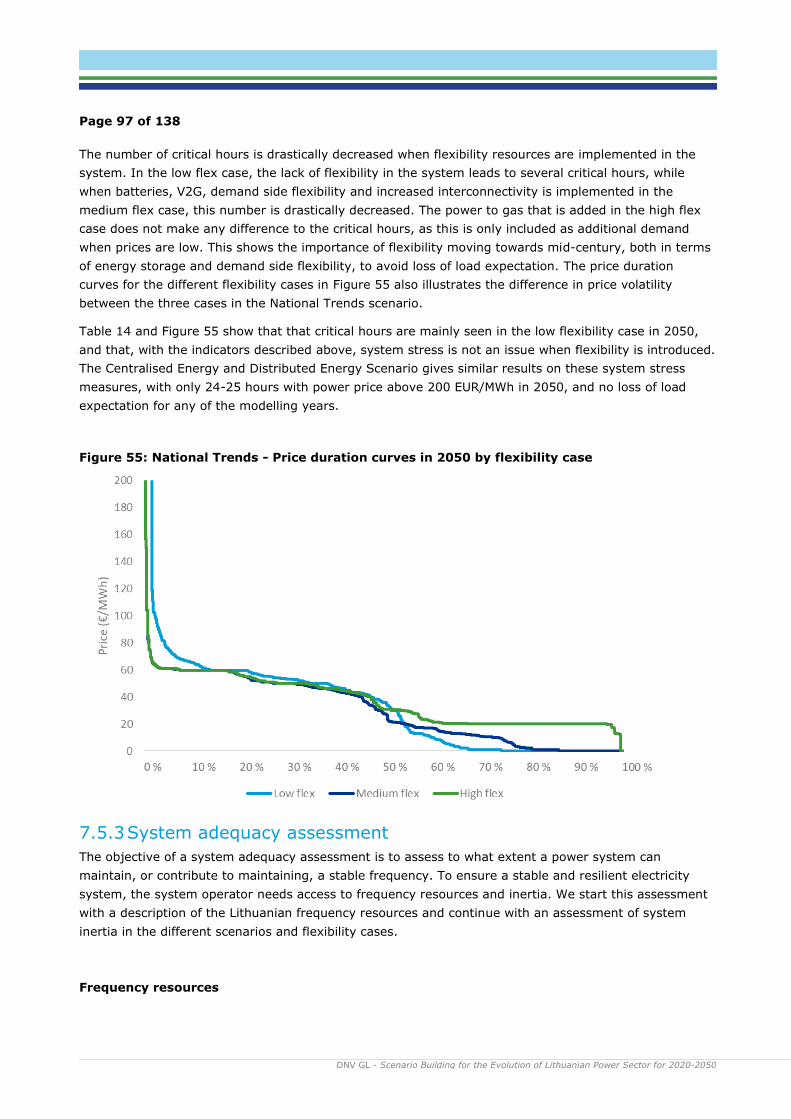
The number of critical hours is drastically decreased when flexibility resources are implemented in the
system. In the low flex case, the lack of flexibility in the system leads to several critical hours, while
when batteries, V2G, demand side flexibility and increased interconnectivity is implemented in the
medium flex case, this number is drastically decreased. The power to gas that is added in the high flex
case does not make any difference to the critical hours, as this is only included as additional demand
when prices are low. This shows the importance of flexibility moving towards mid-century, both in terms
of energy storage and demand side flexibility, to avoid loss of load expectation. The price duration
curves for the different flexibility cases in Figure 55 also illustrates the difference in price volatility
between the three cases in the National Trends scenario.
Table 14 and Figure 55 show that that critical hours are mainly seen in the low flexibility case in 2050,
and that, with the indicators described above, system stress is not an issue when flexibility is introduced.
The Centralised Energy and Distributed Energy Scenario gives similar results on these system stress
measures, with only 24-25 hours with power price above 200 EUR/MWh in 2050, and no loss of load
expectation for any of the modelling years.
Figure 55: National Trends - Price duration curves in 2050 by flexibility case
7.5.3 System adequacy assessment
The objective of a system adequacy assessment is to assess to what extent a power system can
maintain, or contribute to maintaining, a stable frequency. To ensure a stable and resilient electricity
system, the system operator needs access to frequency resources and inertia. We start this assessment
with a description of the Lithuanian frequency resources and continue with an assessment of system
inertia in the different scenarios and flexibility cases.
Frequency resources
Page 98 of 138
DNV GL - Scenario Building for the Evolution of Lithuanian Power Sector for 2020-2050 litgrid test
The overall conclusion is that with the amount of flexible resources introduced in the high flexibility case
(batteries, EV’s and power-to-gas), providing frequency control will be feasible, despite the high share of
intermittent generating resources.
After the synchronisation with the Western European system by the end of 2025, Lithuania will be
responsible for ensuring access to resources as specified in Table 15. The synchronous area applies a
system of sharing of reserves. Each participant contributes with a share, such that the aggregated needs
are met in a cost-efficient manner. This implies that the contribution from each participant is lower than
the individual needs.
Table 15: Lithuania's resource requirements8
Resource Responsibility (MW)
(upward/downward)
FCR 9 / 9
aFRR 60 / 60
mFRR 226 / 276
RR n.a.
The above resource requirements must be met by local resources in Lithuania. Traditionally, most of
these services are delivered from conventional power plants in most electricity systems. But going
forward, it is expected that both demand side resources as well as intermittent renewable power
generation will be competitive resources applied in frequency management.
The capabilities of such electricity resources to ensure power reserves in terms of FCR, aFRR, mFRR and
RR (see Table 12) naturally varies across the scenarios and flexibility cases as well as over time during
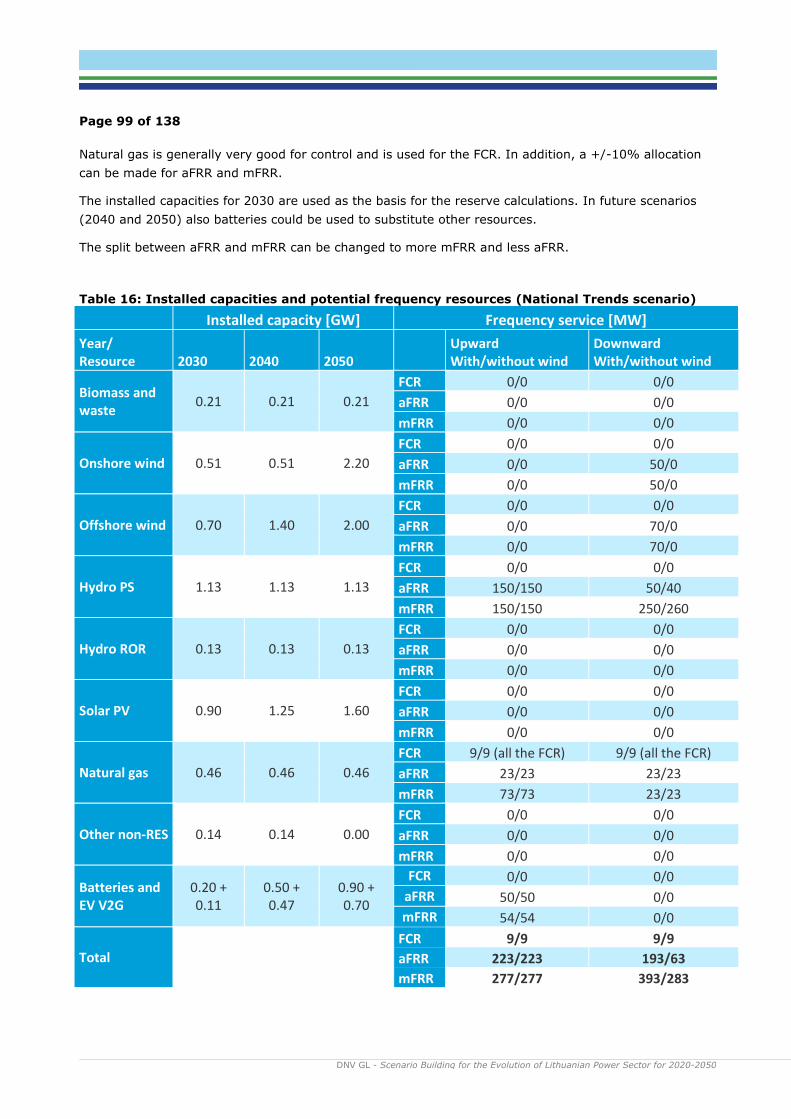
the year, depending on in particular wind conditions. Table 16 below outlines the actual Lithuanian
resources in the National Trends scenario and how the provision of frequency resources might be split
between the sources. Two figures are given for frequency services - with wind available / without wind at
all. The Centralised Energy and Distributed Energy scenarios are identical with respect to hydropower
and thermal capacity, and thus have at least as good reserve capabilities as the National Trends scenario
without wind.
A reasonable share of the totally installed capacity is reserved for frequency reserves. E.g. biomass is
modelled as must-run for 50%, which gives reserves up to 0.5x210 MW = 105 MW upwards and
downwards, depending its commitment in the day-ahead and intraday market and the nature of the
must-run condition. To avoid double counting and to be conservative, we assume no contribution from
biomass.9 Pumped storage hydro (PS) is estimated to be able to provide +/- 30 % capacity, while run of
river (RoR) capability is normally very limited, and we do not count on it. If possible, it will provide an
option to reduce requirements on other sources.
Solar is not used for frequency control, although downward regulation during sunny days would be
possible.
8 The numbers are taken from a joint Baltic document; Baltic Load-Frequency Control block concept, dated 30/9-2020, and downloaded from
https://www.litgrid.eu/uploads/files/dir555/dir27/dir1/17_0.php. 9 This implies that plants using biomass and waste represent additional reserve potential.
Page 99 of 138
DNV GL - Scenario Building for the Evolution of Lithuanian Power Sector for 2020-2050 litgrid test
Natural gas is generally very good for control and is used for the FCR. In addition, a +/-10% allocation
can be made for aFRR and mFRR.
The installed capacities for 2030 are used as the basis for the reserve calculations. In future scenarios
(2040 and 2050) also batteries could be used to substitute other resources.
The split between aFRR and mFRR can be changed to more mFRR and less aFRR.
Table 16: Installed capacities and potential frequency resources (National Trends scenario)
Installed capacity [GW] Frequency service [MW]
Year/ Resource 2030 2040 2050
Upward With/without wind
Downward With/without wind
Biomass and waste
0.21 0.21 0.21
FCR 0/0 0/0
aFRR 0/0 0/0
mFRR 0/0 0/0
Onshore wind 0.51 0.51 2.20
FCR 0/0 0/0
aFRR 0/0 50/0
mFRR 0/0 50/0
Offshore wind 0.70 1.40 2.00
FCR 0/0 0/0
aFRR 0/0 70/0
mFRR 0/0 70/0
Hydro PS 1.13 1.13 1.13
FCR 0/0 0/0
aFRR 150/150 50/40
mFRR 150/150 250/260
Hydro ROR 0.13 0.13 0.13
FCR 0/0 0/0
aFRR 0/0 0/0
mFRR 0/0 0/0
Solar PV 0.90 1.25 1.60
FCR 0/0 0/0
aFRR 0/0 0/0
mFRR 0/0 0/0
Natural gas 0.46 0.46 0.46
FCR 9/9 (all the FCR) 9/9 (all the FCR)
aFRR 23/23 23/23
mFRR 73/73 23/23
Other non-RES 0.14 0.14 0.00
FCR 0/0 0/0
aFRR 0/0 0/0
mFRR 0/0 0/0
Batteries and EV V2G
0.20 + 0.11
0.50 + 0.47
0.90 + 0.70
FCR 0/0 0/0
aFRR 50/50 0/0
mFRR 54/54 0/0
Total
FCR 9/9 9/9
aFRR 223/223 193/63
mFRR 277/277 393/283
Page 100 of 138
DNV GL - Scenario Building for the Evolution of Lithuanian Power Sector for 2020-2050 litgrid test
System inertia
Another aspect to grid stability is the amount of inertia in the system. Inertia refers to the energy stored
in rotating mass, such as generators and industrial motors. These rotate at the same frequency as the
grid, acting as a buffer against rapid change. If, for example, demand for power spikes, the rotating
mass acts like a shock absorber and slows down the resulting rate of change in frequency.
Intermittent renewable resources, such as solar and wind, do not inherently provide inertia. With little to
no inertia in the system, it will be more difficult to keep the frequency within its normal range. A power
system with a large share of renewables, such as the Lithuanian power system in 2050, would therefore
be more vulnerable to sudden changes in supply or demand.
The ability of a power generating unit to supply inertia is often referred to as the ‘inertia constant’ (H).
The inertia constant of a generator-turbine unit is the ratio of kinetic energy stored at synchronous
speed to the generator rating (MVA). The total system inertia, or the rotating mass, can then be
calculated as:
∑𝑀𝑉𝐴𝑝𝑝
∙ 𝐻𝑝
Here, p is the specific generator unit, MVAp the total installed capacity of the unit, and Hp the inertia
constant of the unit.
When synchronized to the CE, system operators in the Baltic region must ensure at least 17 100 MW/s of
power system inertia to be used for frequency stability. At least three synchronous compensators shall
be installed in each Baltic country (Litgrid, u.d.). The maximum system inertia in the Lithuanian power
grid in 2050 is calculated as 4 553 MW/s, see Table 17.
Table 17: Inertia in the Lithuanian power system in 2050
Power generator unit Inertia constant (H) Installed capacity
National Trends, 2050
(MW)
Maximum inertia
(MW/s)
Hydro 2 1264 2528
Natural gas and bio 3 675 2025
Wind 0 4200 0
Solar 0 1600 0
Batteries (stationary
and EV V2G)
0 1255 0
Assuming Litgrid would need to ensure at least 6 000 MW/s, this is not enough. Hence, adding three
synchronous compensators would give sufficient margin. Assuming each compensator is rated 600 MVA
with an H-constant of 2, this gives an additional 3 600 MW/s inertia to the system. Moreover, battery
controllers can be designed to provide fast frequency response (FFR), which to some extent can replace
inertia.
Page 101 of 138
DNV GL - Scenario Building for the Evolution of Lithuanian Power Sector for 2020-2050 litgrid test
Conclusion
Comparing Table 16 with the requirements in Table 15, we see that the pumped storage plant is quite
important. The utilisation of pumped storage in the scenarios is limited, mostly because the scenarios
assume a positive development of dedicated battery storage and electric vehicles. Utilisation of
electricity storage is often cheaper and thus the often ‘preferred’ option for the model in the scenarios.
As seen from the perspective of the model, and then implicitly the domestic electricity market, it is more
efficient that the pumped storage is largely ‘occupied’ delivering frequency resources to the TSO and not
utilised too much in the day-ahead and intraday markets.
For the similar reasons, we have in Table 16 suggested not to rely on EVs and batteries for frequency
resources; it is expected that these resources will be active in the day-ahead and intraday markets in
addition to serving EV owners.
Without wind, the frequency requirements are met with only a small margin for downward regulation. If
critical, it might be possible to regulate biomass and waste further down, but this might create other
concerns as regards heat supply, etc.
Inertia seems to be the major unsolved challenge as regards the system adequacy and adding three
synchronous compensators currently seems as the preferred option, in addition to encouraging or
ensuring battery controllers are designed to provide fast frequency response.
The overall conclusion is thus that from a system adequacy perspective, the RES scenarios offer
challenging but manageable pathways to a sustainable and less carbon intensive Lithuanian energy
supply.
Page 102 of 138
DNV GL - Scenario Building for the Evolution of Lithuanian Power Sector for 2020-2050 litgrid test
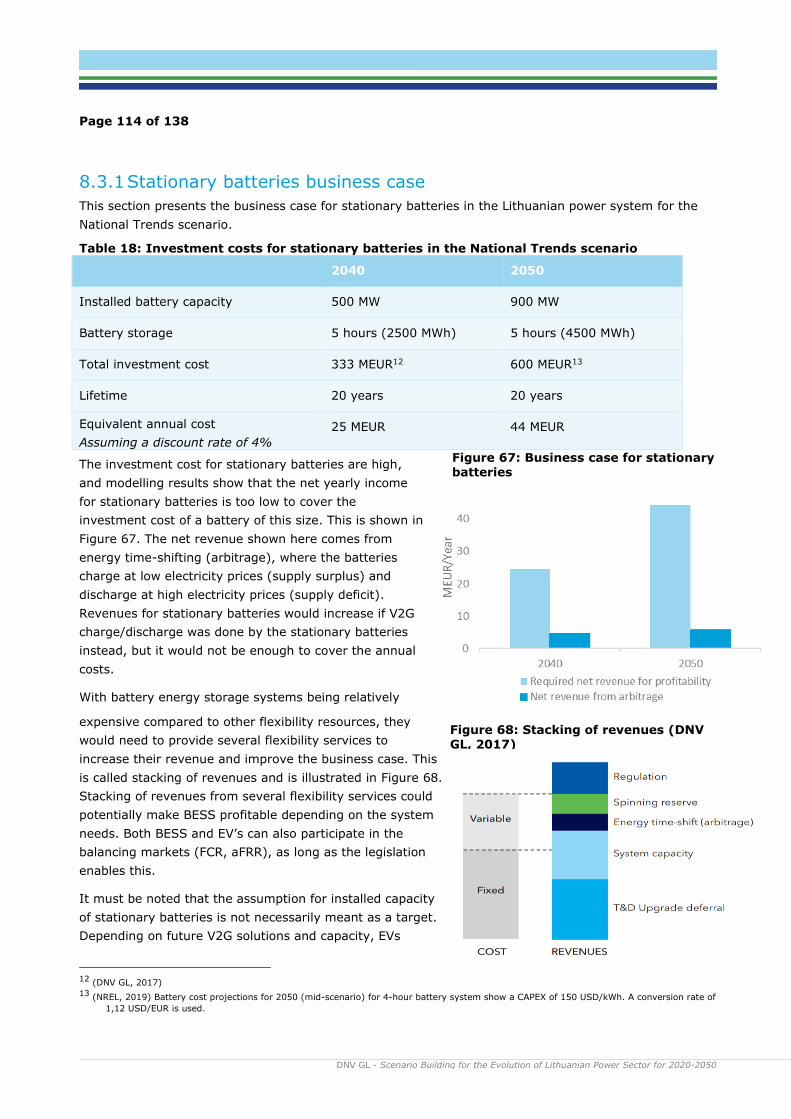
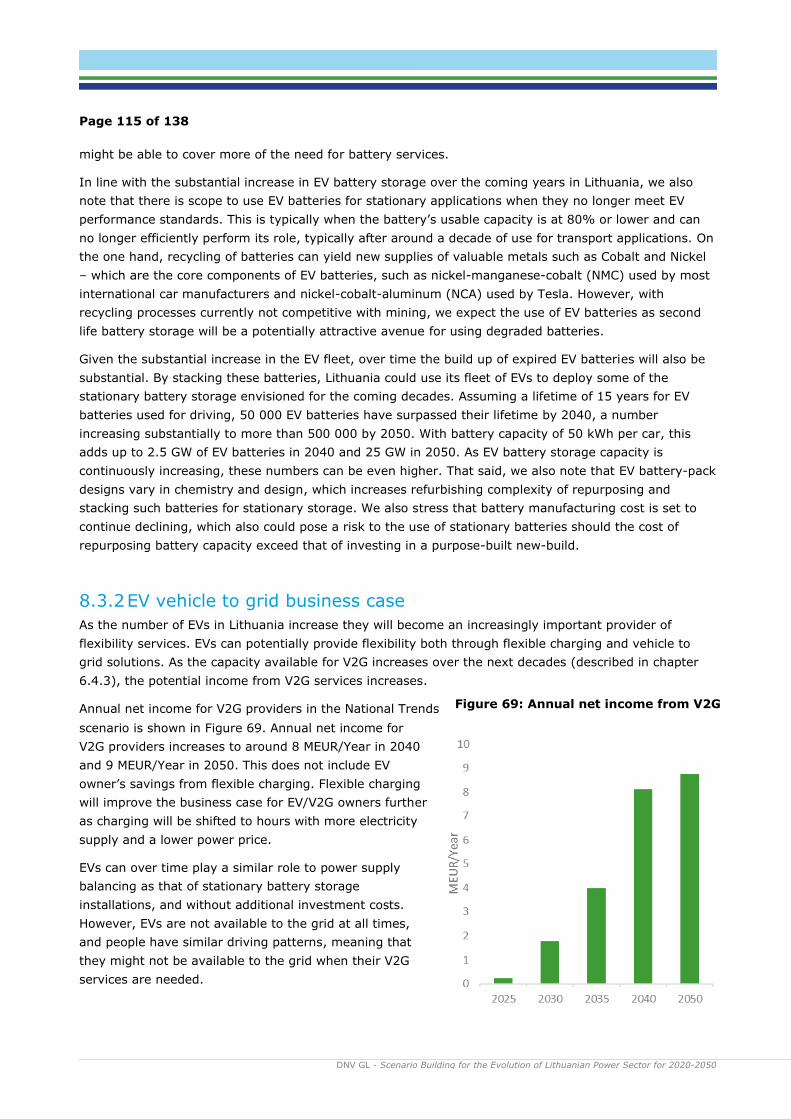
8 IDENTIFICATION AND RECOMMENDATIONS FOR ACTIONS AND MEASURES
In this chapter, we will analyse business cases for wind power and the different flexibility solutions. The
business cases are presented for 2050, but recommendations for actions and measures and roadmaps
will be discussed for both short- and long-term perspectives.
8.1 Wind Power Business Case
In order to achieve the wind power investment growth trajectory that is assumed for the future
Lithuanian power system, the average generation weighted price the wind power producers receive
(capture price) must be at least equal to their levelised cost of energy (LCOE).
The LCOE of wind power is continuously decreasing but is expected to stabilize towards 2050. IRENA
expects the LCOE of onshore and offshore wind in 2050 to be 18-27 EUR/MWh (20-30 USD/MWh) and
27-64 EUR/MWh (30-70 USD/MWh), respectively. DNV GLs Energy Transition Outlook 2020 presents
2050 LCOE of onshore wind to be 30 EUR/MWh, and offshore wind slightly higher, shown in Figure 56.
Figure 56: Development of wind power LCOE (DNV GL, 2020)
In order to raise the average capture price for wind power to these levels in 2050, there must be a
demand for power (P2X) at a power price limit of at least 20 EUR/MWh, i.e. activation of P2X (here
power-to-gas) during surplus hours when the price goes below this limit. This is shown in Figure 57,
where the average annual onshore and offshore wind capture price is plotted against the forecasted
LCOE. The dark blue dotted line shows the wind capture price in the Medium Flex case, while the green
line shows the wind capture price in the High Flex case. By including P2X with these assumptions, the
onshore wind capture price is raised from 21.6 to 31.4 EUR/MWh in 2050, meeting LCOE levels.
Even though batteries and demand side flexibility reduce the number of hours with zero prices, without
additional flexible demand from P2X 27 % of the total wind power production in 2050 will be at power
prices below 0.1 EUR/MWh, in addition to 1.4% curtailment. With a flexible demand activated at a
certain power price limit, the extremely low prices and the VRES curtailment are eliminated. With the
assumption of this P2X being power-to-hydrogen, there must be demand for hydrogen produced at that
price.
Page 103 of 138
DNV GL - Scenario Building for the Evolution of Lithuanian Power Sector for 2020-2050 litgrid test
Figure 57: P2X effect on onshore and offshore wind capture price
8.2 Power-To-Gas Business Case
The main drivers for the business case for power to gas are the demand for hydrogen, the power price,
the investment cost and the production facility capacity factor. These variables all involve uncertainty
and may impact a business case negatively or positively. Given our assumptions, we expect power to
gas to become increasingly needed in the longer-term in order to address power generation surplus
periods in Lithuania, while by 2030 these surplus periods imply fewer challenges as highlighted in
chapter 7. That said, while a near-term business case for P2G is uncertain, we maintain that the long-
term need for P2G will warrant Lithuania moving to support the development of the technology earlier in
order to prepare for longer-term challenges. This would enable the building of P2G competence,
development of foundations for a technology supply chain and appropriate infrastructure for hydrogen
transport, as well as the facilitation of an emerging market for hydrogen offtake in industry and
transport.
As described in 0, the necessary flexible consumption power-to-X is implemented as power-to-hydrogen,
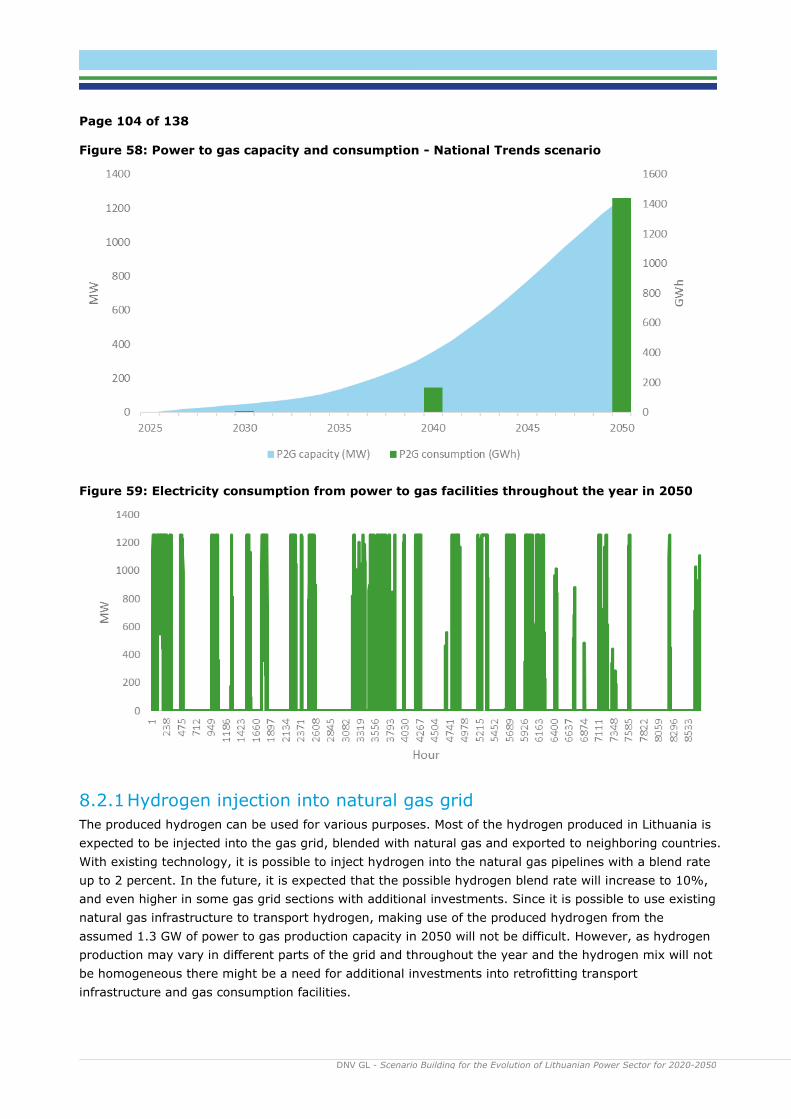
specifically hydrogen produced from electrolysis. Figure 58 shows installed capacity and generation
results for the National Trends scenario with power to gas activated at prices below 20 EUR/MWh. In
2050 total annual electricity consumption for power to gas is 1.4 TWh, with electrolysers operating
between 0 and 100% in 1518 hours. Figure 59 shows how the P2G consumption is distributed over the
year in 2050. The amount of hydrogen produced from the consumed electricity depends on the
electrolysis losses and required compression and storage.
The utilization of the assumed power to gas capacity in Lithuania and the resulting amount of hydrogen
produced is dependent on the power to gas assumptions in the neighboring countries. If P2G/P2X
capacity is high in the other countries, it contributes to increasing the power price, also in Lithuania,
which decreases the number of hours with P2G production in Lithuania. Other European countries can
have such a high flexible P2G/P2X demand that most of the surplus electricity in Lithuania can be
exported and there will be limited need for P2G capacity in the country. Also, if the total capacity is high
enough to increase all low prices up to the set price limit, changing the installed capacity will not make
further difference on the average power price. Hence, it must be noted that the scenario for installed
P2G capacity in Lithuania in this study is not meant as target, but rather to show that a flexible
electricity demand like power to hydrogen can help to solve future challenges in the power system.
Page 104 of 138
DNV GL - Scenario Building for the Evolution of Lithuanian Power Sector for 2020-2050 litgrid test
Figure 58: Power to gas capacity and consumption - National Trends scenario
Figure 59: Electricity consumption from power to gas facilities throughout the year in 2050
8.2.1 Hydrogen injection into natural gas grid
The produced hydrogen can be used for various purposes. Most of the hydrogen produced in Lithuania is
expected to be injected into the gas grid, blended with natural gas and exported to neighboring countries.
With existing technology, it is possible to inject hydrogen into the natural gas pipelines with a blend rate
up to 2 percent. In the future, it is expected that the possible hydrogen blend rate will increase to 10%,
and even higher in some gas grid sections with additional investments. Since it is possible to use existing
natural gas infrastructure to transport hydrogen, making use of the produced hydrogen from the
assumed 1.3 GW of power to gas production capacity in 2050 will not be difficult. However, as hydrogen
production may vary in different parts of the grid and throughout the year and the hydrogen mix will not
be homogeneous there might be a need for additional investments into retrofitting transport
infrastructure and gas consumption facilities.
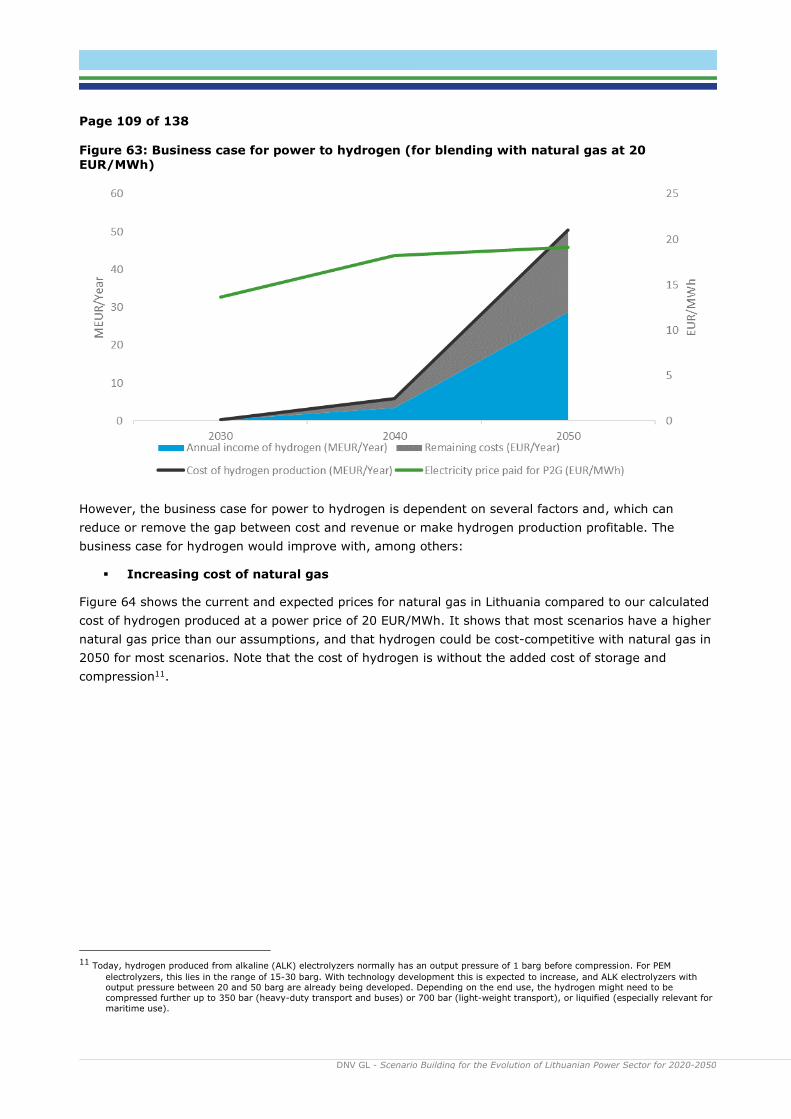
Page 105 of 138
DNV GL - Scenario Building for the Evolution of Lithuanian Power Sector for 2020-2050 litgrid test
The EU-study ”Impact of the use of the biomethane and hydrogen potential on trans-European
infrastructure” (European Commission, 2020) indicates a large potential for hydrogen in Lithuania in
2050, shown in Figure 60. Realizing a potential of this size would however require large gas grid
investments.
Figure 60: European hydrogen potential scenario (European Commission, 2020)
8.2.2 The cost of hydrogen vs the required capture price for wind power
In order to have a business case for hydrogen injection into the gas grid, the cost of hydrogen from
power (electrolysis) must be competitive with the cost of natural gas, which in our modelling
assumptions is 20 EUR/MWh from 2025 and onwards. In addition to the cost of electricity for electrolysis,
CAPEX, OPEX and energy losses during production decides the cost of hydrogen.
The cost of hydrogen was calculated for two different power price levels (10 and 20 EUR/MWh) using
DNV GL’s tool ExplEnergy and the following assumptions:
▪ All produced hydrogen is fed into the gas infrastructure.
▪ The cheapest electrolysis technology for producing hydrogen (AEL) with CAPEX, OPEX and losses
in a range expected from 2030.
▪ No compression and storage of hydrogen.
The results for the calculated hydrogen cost at the two different power price levels, as well as the
resulting capture price for onshore wind and power piece is shown in Figure 61.
As described in section 8.1; to ensure investments in wind power, we most likely need a wind power
capture price of at least 30 EUR/MWh. To achieve a wind capture price of 30 EUR/MWh in our 2050
Page 106 of 138
DNV GL - Scenario Building for the Evolution of Lithuanian Power Sector for 2020-2050 litgrid test
scenario, P2G is necessary to absorb surplus electricity at prices of 20 EUR/MWh and below. However,
this gives an estimated cost of hydrogen of minimum of 35 EUR/MWh (1.1 EUR/kg)10, which is not
competitive with the assumed natural gas cost. In addition, some storage and compression of hydrogen
would be necessary to ensure the percentage mix of hydrogen into the gas grid stays within the
requirements at all times, which increases the cost further.
It must be noted that the estimated cost of hydrogen is uncertain. There are several factors that can
increase the costs, including storage and compression costs and higher than expected electrolysis
investment costs. The main share of the hydrogen cost is the electricity cost (including costs for energy
losses), while a lower share of the costs is CAPEX and OPEX costs. Hence, higher or lower electricity
price will have the highest impact on hydrogen production costs. In addition, in order for the CAPEX part
of the cost per kg hydrogen to remain relatively low, a certain number of operating hours is required for
the hydrogen production. A low number of operating hours gives a higher cost per kg of hydrogen
produced.
For hydrogen to be competitive with natural gas at an assumed natural gas cost of 20 EUR/MWh, the
required power price paid by hydrogen producers would have to be 10 EUR/MWh or lower. With the
assumptions described above, this leads to a cost of hydrogen of 21 EUR/MWh (0.7 EUR/kg),
approximately the same as assumptions for the natural gas price. This means that hydrogen must be
produced at 10 EUR/MWh or lower to be competitive with natural gas to be injected into the gas grid.
However, market modelling results for this case gives an average wind capture price of 25 EUR/MWh.
To summarize, our results show that in order to have a business case both for wind power and power-to-
hydrogen in 2050, there must most likely be a demand for hydrogen at a cost of at least 35 EUR/MWh (1
EUR/kg), plus additional compression, storage and transport costs. However, as both the LCOE of wind
power and the cost of hydrogen production 30 years from now are uncertain business cases might
change.
10 BNEF and IRENA project significant cost reductions of green hydrogen, showing costs down to $0.8-$1.0 per kg or lower in 2050 (BNEF,
2020), (IRENA). The EU green hydrogen strategy presents cost projections as low as EUR 1.1/kg already in 2030 (European commission, 2020).
Page 107 of 138
DNV GL - Scenario Building for the Evolution of Lithuanian Power Sector for 2020-2050 litgrid test
Figure 61: The effect of power price for hydrogen production on cost of hydrogen, power price and wind power capture price
8.2.3 Power-to-gas-to-power
Another solution is to utilize the hydrogen produced during surplus hours to produce electricity in deficit
hours; power-to-gas-to-power (P2G2P). In order to have a business case for P2G2P, the associated cost
of energy must be cheaper than the electricity price received. P2G2P has some challenges that drive up
the costs:
▪ The overall process efficiency is low (~35%) due to losses in hydrogen production, compression
and conversion back to electricity.
▪ Large investments are needed, since P2G2P requires compression and storage units,
transportation and power plants. To reduce the need for transportation, it would be favourable to
locate the electrolyser and the power plant next to each other.
The business case for power to gas in Lithuania was analysed by calculating the overall cost of P2G2P
per MWh using the DNV GL tool ExplEnergy. The following assumptions have been made:
• The hydrogen production is charged at 20 EUR/MWh for its use of electricity.
▪ A lifetime of 15 years for all components
▪ Losses, CAPEX and OPEX in the lower range expected from 2030 onwards
Page 108 of 138
DNV GL - Scenario Building for the Evolution of Lithuanian Power Sector for 2020-2050 litgrid test
▪ No transportation needs, and an
average storage requirement of 3
days2
The results for the total cost of P2G2P is 123
EUR/MWh, with hydrogen-to-power being the
largest contributor to the high cost. The
contribution of the different cost elements in
EUR/MWh is shown in Figure 62.
In our modelling results for 2050, there are in
total only 48 hours with power prices above 120
EUR/MWh. Considering the large investments
needed, this is not enough to create a viable
business case for P2G2P without substantial
subsidies. Also, with a larger need for storage,
the cost increases. Having a storage capacity of
7 days would increase the total cost to 156
EUR/MWh.
To conclude, it will be more economically
favourable to utilise the hydrogen for other
purposes (e.g. industry or transport or injection
it into the gas grid) than to convert it back to
power.
8.2.4 The business case for hydrogen is dependent on several factors
If hydrogen is going to be competitive with a natural gas price of 20 EUR/MWh, there is a need to
subsidise the hydrogen production in order to cover the production costs. A simplified illustration of this
is shown in Figure 63, where the black line is the minimum cost of hydrogen, the blue area is the annual
income for selling hydrogen at 20 EUR/MWh (0.7 EUR/kg). This is based on the P2G scenario presented
in Figure 58.
Figure 62: Cost of power-to-gas-to-power (EUR/MWh)
Page 109 of 138
DNV GL - Scenario Building for the Evolution of Lithuanian Power Sector for 2020-2050 litgrid test
Figure 63: Business case for power to hydrogen (for blending with natural gas at 20 EUR/MWh)
However, the business case for power to hydrogen is dependent on several factors and, which can
reduce or remove the gap between cost and revenue or make hydrogen production profitable. The
business case for hydrogen would improve with, among others:
▪ Increasing cost of natural gas
Figure 64 shows the current and expected prices for natural gas in Lithuania compared to our calculated
cost of hydrogen produced at a power price of 20 EUR/MWh. It shows that most scenarios have a higher
natural gas price than our assumptions, and that hydrogen could be cost-competitive with natural gas in
2050 for most scenarios. Note that the cost of hydrogen is without the added cost of storage and
compression11.
11 Today, hydrogen produced from alkaline (ALK) electrolyzers normally has an output pressure of 1 barg before compression. For PEM
electrolyzers, this lies in the range of 15-30 barg. With technology development this is expected to increase, and ALK electrolyzers with output pressure between 20 and 50 barg are already being developed. Depending on the end use, the hydrogen might need to be
compressed further up to 350 bar (heavy-duty transport and buses) or 700 bar (light-weight transport), or liquified (especially relevant for
maritime use).
Page 110 of 138
DNV GL - Scenario Building for the Evolution of Lithuanian Power Sector for 2020-2050 litgrid test
Figure 64: Current and future prices* for natural gas in Lithuania (Heat Roadmap Europe, 2017)
▪ Increasing carbon taxes
Emissions stemming from the consumption of natural gas is subject to carbon taxes, while consumption
of hydrogen from renewable sources is not. With an expected scenario toward 2050 of incrementally
increasing carbon taxes, hydrogen produced from renewable sources (green hydrogen) would become
increasingly cost-competitive with natural gas. How the share of hydrogen in a natural gas blend can be
visible in terms of carbon taxes is uncertain, but for direct comparison to natural gas and other fossil
fuels green hydrogen will become more competitive if carbon taxes are high. Note that Figure 64 shows
the prices of natural gas excluding taxes.
▪ Hydrogen for other end-user applications
Hydrogen can be utilized for several other purposes than injecting it into the gas grid; as fuel for heavy-
duty transport, to replace fossil hydrogen in existing refining and fertilizer industry, or to decarbonise
heating in buildings or industry. The California Energy Commission recently published a report where the
target cost range of renewable hydrogen for different end-user applications was analysed (California
Energy Comission, 2020):
– Medium- to heavy-duty vehicles (replacing gasoline or diesel): $2-$4/kg (€1.8-€3.6/kg)
– Refining and fertilizer industry (replacing fossil hydrogen): $2.2-$3.4/kg (€2-€3/kg)
Page 111 of 138
DNV GL - Scenario Building for the Evolution of Lithuanian Power Sector for 2020-2050 litgrid test
– Industrial, commercial and residential heating: $3-$6/kg (€2.7-€5.4/kg)
As shown here, the expected target cost range of renewable hydrogen is significantly higher for these
applications, ranging from around 2 to 6 EUR/kg, which is around 60 to 180 EUR/MWh. This would also
require investments in compression, storage and transportation.
• Provision of ancillary services
Both P2G and P2G2P can theoretically support the grid through participation in the ancillary services
market. When producing hydrogen, the electrolyser can control the use of electricity and power drawn
from the grid to stabilise the frequency when needed. The hydrogen can then be used in other sectors or
stored over longer periods (e.g. in cheap salt caverns) and re-electrified through fuel cells to provide
power to the grid. Both modern electrolysers and fuel cells are capable of rapidly increasing or
decreasing the power demand or supply, respectively. However, as seen in 8.2.3, the power price would
need to be high in order for there to be a business case for re-electrifying hydrogen (power-to-gas-to-
power).
• Being a “first mover”
The calculations of hydrogen cost in chapter 8.2.2 assume that all hydrogen production is happening
when the power price is at the price limit (EUR10/MWh or EUR20/MWh). This implies that it is assumed
that there is enough power to gas (or P2X) capacity and demand in the European system to increase all
the low prices to this level. If the installed P2X capacity is too low to affect the power price, like it is
assumed to be in the earlier modelling years, the hydrogen can be produced at lower prices. Hence, it
will be favorable for hydrogen producers to start producing when overall P2X capacity is low and the
system still has hours with low or zero prices.
Figure 65 shows simple illustrations on how the P2G business case can look like if the market conditions
are more favorable. The remaining costs can either be covered with revenues from selling the hydrogen
as a transport fuel, or to the natural gas grid at a higher price. Note that these are just illustrations and
not modelling results, and do not include factors such as the effect of higher natural gas price on the
power market. Also, when using hydrogen as a fuel, i.e. for heavy duty road transport, there will be
need for compression and storage that drive up the costs. The cost of P2G is uncertain, and is dependent
on compression, storage and transport needs, power price and electrolysis operating hours, as well as
technology development.
Page 112 of 138
DNV GL - Scenario Building for the Evolution of Lithuanian Power Sector for 2020-2050 litgrid test
Figure 65: Illustrations of P2G business cases with more favourable market conditions
8.2.5 Power-To-X SWOT analysis
8.3 Battery Storage Business Case
Battery energy storage systems (BESS) can provide flexibility at multiple levels in the power system,
depending on their characteristics and size. In our model, we have both utility-scale stationary BESS
(100 MW per unit) and smaller-scale moving batteries in EV’s. The installed capacities for stationary
batteries in the three different scenarios follow the corresponding TYNDP scenarios to 2040. It is
assumed that the growth trend will continue to 2050, giving an installed battery capacity in Lithuania of
900 MW in 2050 the National Trends scenario.
Both the stationary batteries and the EV’s (with vehicle to grid) can provide several flexibility services:
Page 113 of 138
DNV GL - Scenario Building for the Evolution of Lithuanian Power Sector for 2020-2050 litgrid test
▪ Ancillary services to the grid (e.g. voltage support, frequency response, power quality) due to
their fast response time.
▪ RES absorption at times with surplus generation.
▪ Grid congestion management at times with high demand.
Figure 66 shows our National Trends scenario for installed battery capacities and modelling results for
generation towards 2050, both for stationary batteries and EV vehicle to grid. Some key observations
from the results are that:
• The relatively low annual utilization of the batteries compared to capacity indicate that the
scenario for installed battery capacity might be higher than necessary. The scenarios for installed
battery capacity in the Distributed Energy and Centralized Energy scenarios are lower, 700 and
300 MW in 2050, respectively, while the utilisation in MWh charge/discharge per MW capacity is
higher than in the National Trends scenario.
▪ An increased amount of power to gas in the system reduces the usage and the business case for
batteries as it reduces the need for surplus energy absorption and removes the lowest power
prices.
▪ V2G is utilized more than stationary batteries compared to available capacity. This is because our
modelling assumptions favour EV batteries slightly over stationary batteries at times when the
EVs are assumed to be connected to the grid.
Figure 66: Installed BESS capacity and use in the wholesale market
Page 114 of 138
DNV GL - Scenario Building for the Evolution of Lithuanian Power Sector for 2020-2050 litgrid test
Figure 67: Business case for stationary batteries
Figure 68: Stacking of revenues (DNV GL, 2017)
8.3.1 Stationary batteries business case
This section presents the business case for stationary batteries in the Lithuanian power system for the
National Trends scenario.
Table 18: Investment costs for stationary batteries in the National Trends scenario
AST. (2020, September 1). System Balancing . Retrieved from AST.LV:
https://www.ast.lv/en/content/system-balancing AST, Elering & Litgrid. (2020, September 30). Baltic Load-Frequency Control block concept document.
Retrieved from www.litgrid.eu: https://www.litgrid.eu/uploads/files/dir555/dir27/dir1/17_0.php BBC. (2019, December 13). EU carbon neutrality: Leaders agree 2050 target without Poland. Retrieved
from BBC: https://www.bbc.com/news/world-europe-50778001 BNEF. (2020). Liebreich: Separating Hype from Hydrogen - Part One: The Supply Side. Retrieved from
California Energy Comission. (2020). Renewable Hydropen Transportation Fuel Production. Commission, E. (2017, November 28). COMMISSION REGULATION (EU) 2017/2195 of 23 November
2017 establishing a guideline on electricity balancing. Retrieved from EUR-LEX.EUROPA.EU : https://eur-lex.europa.eu/legal-content/EN/TXT/PDF/?uri=CELEX:32017R2195&from=EN
Commission, E. (2020, 04 30). Pursuant to Article 20(5) of Regulation (EC) No 2019/943 on the implementation plan of. Retrieved from EC.EUROPA.EU:
https://ec.europa.eu/energy/sites/ener/files/documents/adopted_opinion_lt_en.pdf DNV GL . (2020). DNV GL Calculations . DNV GL. (2017). Flexibility in the power system. DNV GL. DNV GL. (2019). Energy Transition Outlook 2019: A Global and Regional Forecast To 2050. Oslo: DNV
GL.
DNV GL. (2020). Energy Transition Outlook 2020: A global and regional forecast to 2050. DNV GL. (2020). Energy Transition Outlook 2020: Power Supply and Use. Oslo: DNV GL.
Ea Energy Analyses. (2018). Summary Report & recommendations, Lithuania demand response study. Elia. (2017). Electricity scenarios for belgium towards 2050. ENTSO-E. (2019, December). Data Visualisation Platform. Retrieved December 2013, 2019, from entsos-
tyndp2020-scenarios: https://www.entsos-tyndp2020-scenarios.eu/#download ENTSO-E. (2019). Mid-term Adequacy Forecast. Retrieved from
ENTSO-E. (n.d.). System Development Committee. Retrieved from ENSTO-E: https://www.entsoe.eu/about/system-development/
EU Commission. (2015). Energy Union Package. Brussels: European Commission.
European Commission. (2016). Identification of Appropriate Generation and System Adequacy Standards
for the Internal Electricity Market. Retrieved from https://ec.europa.eu/energy/sites/ener/files/documents/Generation%20adequacy%20Final%20Report_for%20publication.pdf
European Commission. (2018, September 14). Synchronisation of the Baltic States' electricity grid with the continental European system. Retrieved from https://ec.europa.eu/info/news/synchronisation-baltic-states-electricity-grid-continental-european-system-2018-sep-14_en
European Commission. (2019). Clean Energy For All Europeans Package. Retrieved from https://ec.europa.eu/energy/topics/energy-strategy/clean-energy-all-europeans_en
European Commission. (2019). COMMUNICATION FROM THE COMMISSION TO THE EUROPEAN PARLIAMENT, THE EUROPEAN COUNCIL, THE COUNCIL, THE EUROPEAN ECONOMIC AND SOCIAL COMMITTEE AND THE COMMITTEE OF THE REGION. Brussels: European Commission.
European commission. (2020). A hydrogen strategy for a climate-netural Europe. Retrieved from https://ec.europa.eu/energy/sites/ener/files/hydrogen_strategy.pdf
European Commission. (2020, July 8). A hydrogen strategy for a climate-neutral Europe. Retrieved from EC.EUROPA.EU: https://ec.europa.eu/energy/sites/ener/files/hydrogen_strategy.pdf
European Commission. (2020). Impact of the use of the biomethane and hydrogen potential on trans-European infrastructure.
European Commission. (n.d.). Effort sharing: Member States' emission targets. Retrieved from https://ec.europa.eu/clima/policies/effort_en
Page 135 of 138
DNV GL - Scenario Building for the Evolution of Lithuanian Power Sector for 2020-2050 litgrid test
European Commission. (n.d.). https://ec.europa.eu/clima/policies/ets_en. Retrieved May 15, 2020, from https://ec.europa.eu/clima/policies/ets_en
Heat Roadmap Europe. (2017). EU28 fuel prices for 2015, 2030 and 2050. IEA. (2020). IEA. Retrieved from https://www.iea.org/data-and-statistics/data-
tables?country=LITHUANIA&energy=Electricity&year=2018 IRENA. (n.d.). Hydrogen: A renewable energy perspective. Retrieved from 2019:
Litgrid. (2020). National electricity demand and generation. Retrieved from https://www.litgrid.eu/index.php/power-system/power-system-information/national-electricity-
demand-and-generation/3523
Litgrid. (n.d.). Synchronous operation. Retrieved from Litgrid: https://www.litgrid.eu/index.php/grid-development-/strategic-projects-/synchronous-operation-/137
Ministry of Energy of the Republic of Lithuania. (2018). National Energy Independence Strategy: Energy For Lithuania's Future (Nacionaline energetines nepriklausomybes strategija). Ministry of Energy of the Republic of Lithuania.
Ministry of Energy of the Republic of Lithuania. (2019). National Energy and Climate Action Plan of the
Republic of Lithuania for 2021-2030. Vilnius. NREL. (2019). Cost Projections for Utility-Scale Battery Storage. Offshorewind.biz. (2020, September 3). Lithuania Opts For CfD Offshore Wind Auction Scheme.
Retrieved from Offshorewind.biz: https://www.offshorewind.biz/2020/09/03/lithuania-opts-for-cfd-offshore-wind-auction-scheme/
PV Magazine . (2019, September 10). Lithuanian energy ministry issues timeline for renewables auctions. Retrieved from PV Magazine : https://www.pv-magazine.com/2019/09/10/lithuanian-energy-
%C5%ABnas,a%20statement%20from%20the%20ministry. Recharge. (2020, January 17). Retrieved from Recharge: https://www.rechargenews.com/wind/onshore-
wind-wins-lithuanian-tech-neutral-auction-with-zero-bid/2-1-739647 Recharge. (2020, May 14). Lithuania eyes 700MW offshore wind zone that could meet 25% of its power
needs. Retrieved from Recharge: https://www.rechargenews.com/wind/lithuania-eyes-700mw-offshore-wind-zone-that-could-meet-25-of-its-power-needs/2-1-809240
Reuters. (2020). Lithuania to build one of the largest battery parksin the world. Retrieved from https://www.reuters.com/article/lithuania-battery-idUSL8N2GZ280
Stern, D. I. (2010). The Role of Energy in Economic Growth. The Australian National University: Centre for Climate Economics & Policy.
Page 136 of 138
DNV GL - Scenario Building for the Evolution of Lithuanian Power Sector for 2020-2050 litgrid test
APPENDIX 1: ANALYSIS TOOL AND MODELLING METHODOLOGY
The results in this study is based on a power market model developed by DNV GL. The model is
developed with focus around Lithuania, and includes detailed representation of the dark blue countries in
the figure and generic representation of the light blue countries. Before the desynchronization from
IPS/UPS by the end of 2025, imports to the Baltic countries from this area is included.
Figure 80: Focus countries in the power market model
DNV GL is using the PLEXOS® Integrated Energy Model, an industry state-of-art power market and
transmission network modelling framework developed by Energy Exemplar (http://energyexemplar.com).
PLEXOS is simulation software of choice for a range of power generators, transmission system operators,
electricity and gas market operators, investors, regulators, energy traders, power generation
manufacturers, and consultants and academia over the world. DNV GL is among the most sophisticated
users of PLEXOS, and is using PLEXOS for power market and dispatch modelling, as well as for
transmission network modelling including load flow security and redispatch analysis, herewith using a
nodal representation of the power system in Europe.
Deploying PLEXOS has several key benefits, as it allows for:
• a detailed representation of generation units including using technology attributes such as start cost,
ramp rate, minimum turndown level, and part load efficiency;
• the usage of hourly profiles for electricity load, heat, wind and solar generation;
• the modelling of neighbouring markets, by considering a detailed representation of neighbouring
markets (core region) and assumptions on interconnection capacities;
• assessment of power prices representative of day ahead power market prices, and generation
dispatch economics acknowledged by generators, OEMs and the investor community;
Page 137 of 138
DNV GL - Scenario Building for the Evolution of Lithuanian Power Sector for 2020-2050 litgrid test
• the potential integration of DC transmission network analysis to assess the impact of network
constraints on generation dispatch (load flow security and redispatch analysis), optionally to be
extended with AC network modelling.
Main sources for scenario development
The European modelling scenario is based on DNV GL’s vision of the most likely future quantified per
country. The main sources are:
- DNV GLs Energy Transition Outlook 2020 (DNV GL, 2020)
- ENTSO-E Ten Year Network Development Plan (TYNDP) 2020
- National reports and insights from country experts
Figure 81 shows the main sources used for development of the scenarios for Lithuania.
Figure 81: Main sources for Lithuania scenario development
Page 138 of 138
DNV GL - Scenario Building for the Evolution of Lithuanian Power Sector for 2020-2050 litgrid test
About DNV GL DNV GL is a global quality assurance and risk management company. Driven by our purpose of safeguarding life, property and the environment, we enable our customers to advance the safety and sustainability of their business. We provide classification, technical assurance, software and independent expert advisory services to the maritime, oil & gas, power and renewables industries. We also provide
certification, supply chain and data management services to customers across a wide range of industries. Operating in more than 100 countries, our experts are dedicated to helping customers make the world