Abstract This was done to the the temperature a star on the of the hydrogen in the star's spectrum. The """c"'".'" of stars from spectraJ were recorded a DSLR camera equipped with a Rainbow Optics Spectroscope, on a Meade LX200 telescope. Spectra images were processed IRIS and software to CCD response The equivalent widths of the absorption lines profile were calculated and widths stronger lines. o stars, with tt>w,npt'<l 20,OOOK and not have hydrogen Spectral K and M, temperatures 2,000 and 5,000 K also did not have strong lines. hydrogen Balmer were the for type A 1 with TP""""'''ro:> around 1 O,OOOK. In order to create an line, the atom state so that the can photons. The temperature of 0 stars is so hot most of the atoms are unable to photons. as types M, more ,!ro'rAl',t>1F'I atoms are in ground are unable to photons. optimum temperature to have the O'rp·<>tp"t hydrogen atoms their electrons the excited and so had strongest Balmer lines.
Transcript
Abstract
This was done to the the temperature a star on the of the
hydrogen in the star's spectrum. The """c"'".'" of stars from spectraJ
were recorded a DSLR camera equipped with a Rainbow Optics Spectroscope, on a Meade
LX200 telescope. Spectra images were processed IRIS and software to CCD
response The equivalent widths of the absorption lines profile were calculated and
widths stronger lines.
o stars, with tt>w,npt'<l 20,OOOK and not have hydrogen
Spectral K and M, temperatures 2,000 and 5,000 K also did not have strong
lines. hydrogen Balmer were the for type A 1 with TP""""'''ro:>
around 1 O,OOOK. In order to create an line, the atom
state so that the can photons. The temperature of 0 stars is so hot most of the
atoms are unable to photons. as types M,
more ,!ro'rAl',t>1F'I atoms are in ground are unable to photons.
optimum temperature to have the O'rp·<>tp"t hydrogen atoms their electrons the
excited and so had strongest Balmer lines.
Andrew Hitchner - Script PowerPoint Presentation A Study in Stellar Spectroscopy
Slide 1: Intro: Hello, my name
Slide 2: Spectroscopy is the study of the dispersion an colors, such as when white through a to a rainbow. In the case of a
star, the spectrum shown is an absorption spectrum, with black bands showing the
components of the star. spectrum of a star can about the including what type of star it the of any
winds, The main purpose stellar spectroscopy is to stars. Catalog, known as the
temperature, with 0 stars the h(\T1~p"t
and M stars are their luminosity, which position on the Hertzsprung-Russell In this project low resolution spectroscopy was used to observe and major absorption in the stellar spectrum of different stars.
SHde The problem was "What is effect of a star on the
hydrogen Balmer absorption lines in the spectrum?" Absorption lines are
caused by the photons the created in mner the star absorbed by the elements in the photosphere. The hydrogen atom will only absorb photons of wavelengths, specifically at 1, 4341 angstroms.
Slide 4: hypothesis was: If the temperature of star then hydrogen lines the spectrum will also In OBAFGKM 0 stars are the hottest M stars are the coolest. Spectral types 0 and B will have more prominent hydrogen lines than types K and M.
Slides 5,6,7: the (steps on
Slide 8: Here is an the raw The image was then cropped and rotated to just spectrum. It was then converted to a .fit so that it would compatible with
the I then used V spec to an profile. I created a CCD curve and a corrected intensity profile to compensate for CCD loss in
going from to to red.
Slide 9: Here is a in this project. luminosity class. number represents star's temperature within zero being the and 9.5 the coolest. The number in parenthesis magnitude of the star. For types A, G, class was used because these are main
stars. For F, luminosity class was used, for types and M class was
used. is because main sequence stars become increasingly fainter as their decreases. were not F, or M main sequence stars with a magnitude or
location.
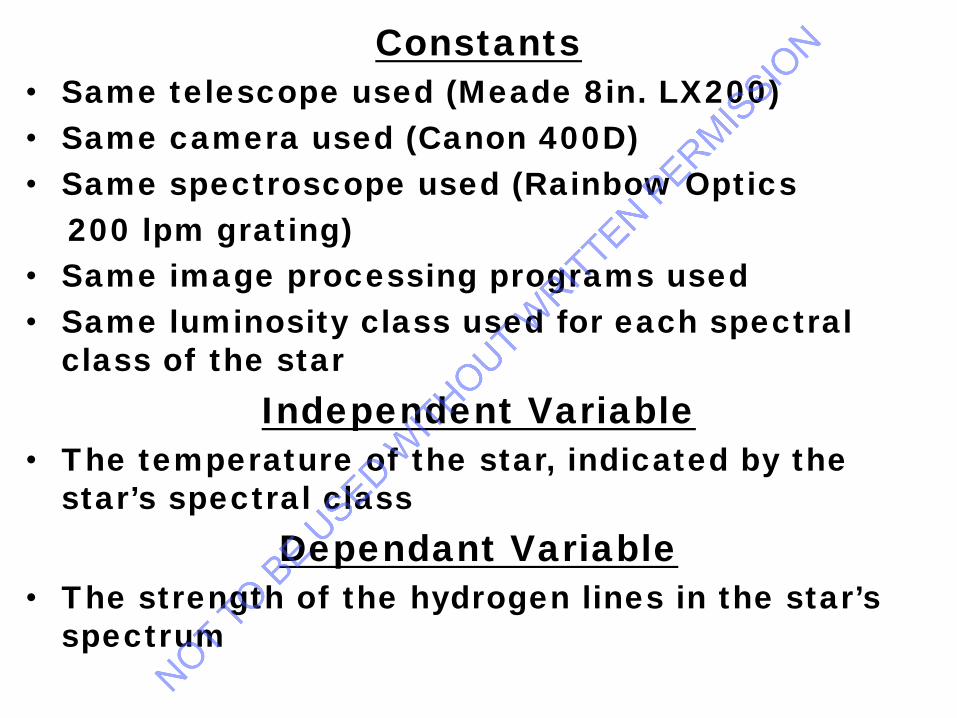
Slide 10: My constants were ... ( see slide)
Slide 11: profile a star from each class. axis shows the wavelength while Y shows intensity the the bottom is a legend spectral class. Each dip in profile is an absorption The hydrogen lines compared are H Gamma and H
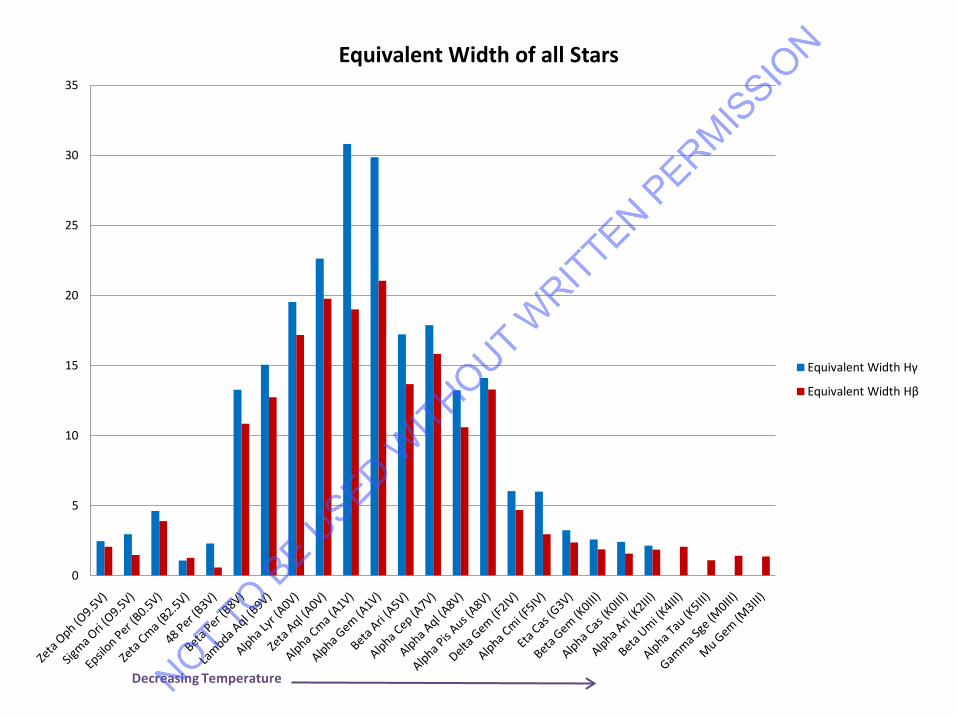
12: compares the equivalent widths of the each of stars. greater equivalent width, stronger the hydrogen type 0 the
equivalent widths were low, from 2.465 to for Hy, and 1.474 to 2.074 the HB. equivalent width until it maximum at spectral type A,
from 13 to 30.814 for the 10.601 to 21.048 for HB line. Hy value was maximum HB value was .048. equivalent widths
then until reached a minimum at spectral M. The value the HP line was I while the Hy visible.
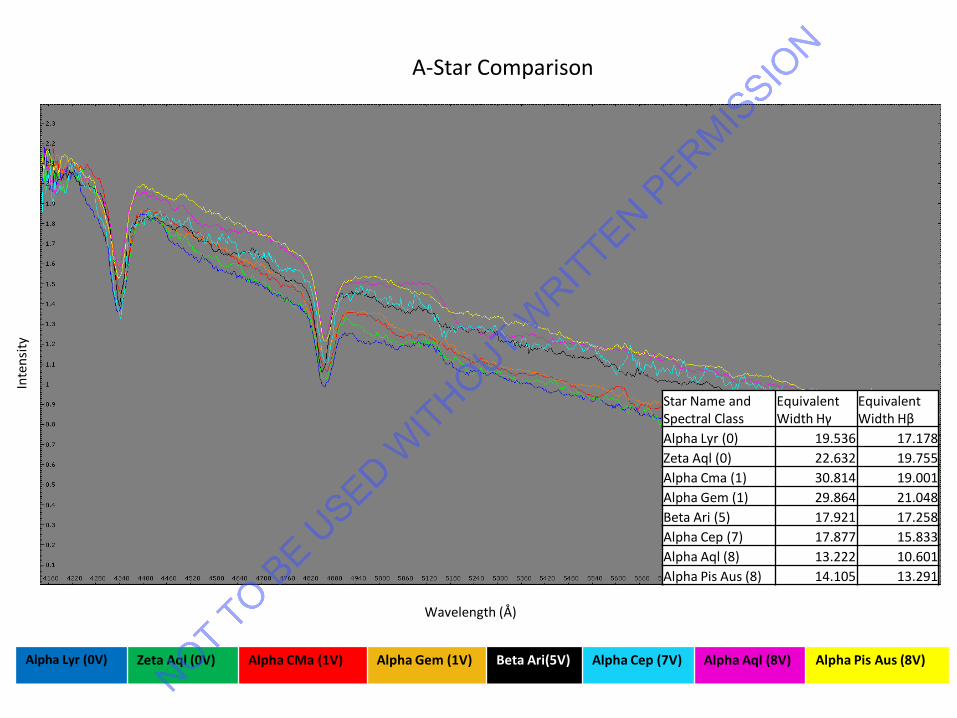
Slide 13: This compares the star that was photographed. The axis shows the wavelength in shows intensity line. On the bottom is a for each star. The on the shows the width for each star. width from AO until it reached maximum strength at Al V, then decreased from to A8.
Slide 14: My hypothesis, as stated, was partially supported. o type with temperatures around 20,000K and did not very hydrogen spectral types and M, temperatures between 2,000 and 5,000 K also not have hydrogen lines. hydrogen Balmer were strongest type Al with temperatures around 10,000K.
Slide In order to create an absorption line, hydrogen atom to be in excited state, so that the can absorb the tempcrature is too the hydrogen atom
loses its electron, becoming ionized. hydrogen atoms cannot ,>he.,",rh the is too cool, more hydrogen atoms will be the ground n= I state and of stars is so hot most of temperature such as in and more and more
atoms are found to in the ground rendering them unable to absorb photons. A stars the "just temperature to have greatest of atoms with electron the state.
Slide 16: This could improved by able to collect more spectral from more stars each Weather conditions the times various stars were visible made it difficult to collect data. A future spectroscopy project could include a custom built spectroscope. types of such as B Stars, Wolf-Rayet could
A Study in Stellar Spectroscopy
Andrew Hitchner11th Grade
Methacton High School
Background• Spectroscopy: the study of the dispersion of
an object's light into its component colors
• Spectrum of Star can reveal information about that star
• Stars classified by Henry Draper Catalog, or OBAFGKM sequence
• Stars also classified by luminosity
• Low resolution spectroscopy can detect major absorption lines in stellar spectrum
Problem
• What is the effect of the temperature of a star on the strength of the hydrogen Balmer absorption lines in the star’s spectrum?
– Hydrogen atoms will absorb photons of wavelengths 6563, 4861, and 4341Å
Hypothesis
• If the temperature of the star decreases, then the strength of the hydrogen absorption lines in the star’s spectrum will also decrease.
Procedure
Set Up The Equipment• Set up the telescope• Align the telescope’s drivers• Attach the spectroscope to the camera body• Mount the camera onto the telescope
Procedure
Take the Photograph• Move the star and the first-order spectrum
into the view• Take test images to test focus• Once focused, take exposures with
appropriate time and ISO• Record the number of the first and last image
Procedure
Process the images• Download the pictures onto computer• Open the desired picture in Photoshop and crop and
rotate the image• Open the edited photo in IRIS, and convert and save as
.fit image• Open the .fit image in Vspec• Create an intensity profile of the image• Generate a CCD response curve of the profile and a
corrected intensity profile• Repeat this procedure for all stars• Open the desired profiles for comparison• Select the desired absorption line and calculate the
line’s Equivalent Width
Raw Image
Cropped and rotated
.fit image
Intensity Profile Corrected Intensity Profile
Star List
O B A F G K M
9.5V Zeta Oph (2.5) 0.5V Epsilon Per (2.87) 0V Alpha Lyr (0.0) 2IV Delta Gem (3.5) 3V Eta Cas (3.43) 0III Beta Gem (1.15) 0III Gamma Sge (3.50)
9.5V Sigma Ori (3.75) 2.5V Zeta Cma (3) 0V Zeta Aql (3) 5IV Alpha CMi (0.37) 8V Tau Cet (3.46) 0III Alpha Cas (2.21) 3III Mu Gem (2.84)
3V 48 Per (4) 1V Alpha CMa (-1.5) 2III Alpha Ari (2.00)