63
A study into the feasibility of a community owned solar farm in Goulburn NSW April 2016

CE4G Feasibility Study – April 2016 Page 1 http://www.ce4g.org.au
A study into the feasibility of a
community owned solar farm in
Goulburn NSW
April 2016

CE4G Feasibility Study – April 2016 Page 2 http://www.ce4g.org.au
This Feasibility Study into the Goulburn Community Solar Farm was conducted by Community Energy for Goulburn (CE4G) under the auspices of The Goulburn Group Inc. The study was funded by the NSW Office of Environment and Heritage through the Community Energy Feasibility Grants Program and completed in April 2016. The study can be downloaded from the CE4G website at: http://www.ce4g.org.au/index.php
Project Supporters
DISCLAIMER The indicative investment performance presented in this document relies on projections and other predictive statements that represent our assumptions and expectations. Due to their predictive nature, this information is clearly subject to an inherent level of uncertainty and risk, which may extend beyond that explored in our risk analysis modelling. Actual investment performance may differ from that projected, and no guarantees can be made, neither expressed nor implied, as to the accuracy of projections or indicative investment performance. The document has been prepared without taking into account your current financial situation or objectives. In considering this information, we recommend obtaining independent advice, in specific consideration of your circumstances.

CE4G Feasibility Study – April 2016 Page 3 http://www.ce4g.org.au
Contents
EXECUTIVE SUMMARY 4
SUMMARY OF RECOMMENDATIONS: 5
AN OVERVIEW OF THE FEASIBILITY STUDY INTO A 1.2 MW COMMUNITY OWNED SOLAR FARM FOR GOULBURN 6
Introduction 6
Background to the study 6
Planning compliance – The DA 7
FINANCE 9
ENERGY MARKET 13
LEGAL ENTITY FOR THE GOULBURN COMMUNITY SOLAR FARM 14
GOVERNANCE AND DECISION MAKING FOR THE GOULBURN COMMUNITY SOLAR FARM 15
A SOCIAL LICENCE TO OPERATE 16
APPENDICES: 19 Appendix 1: Brief background to the feasibility study Appendix 2: Community Engagement Summary Table Appendix 3: Acknowledgements
ATTACHMENTS: TJ Solen - Governance and Finance E2 Design Lab - Business Case

CE4G Feasibility Study – April 2016 Page 4 http://www.ce4g.org.au
Executive Summary
“Here's an opportunity for community independence, cleaner energy, cheaper power.”
Goulburn resident at the Community Solar Farm information session August 2015
In April 2015 The Goulburn Group (TGG) appointed a committee, Community Energy for Goulburn (CE4G), to apply for a grant under the NSW Government’s Community Energy Feasibility Grants Program. This application was successful and CE4G proceeded to coordinate and deliver a twelve month feasibility study into a 1 MWp (1 Megawatt peak) community solar farm on a site three kilometres from the centre of Goulburn city.
CE4G brought together a technical team to provide advice in the early stages of the study. The input from these renewable energy specialists, Council employees and local businesses was invaluable in setting the study parameters. At strategic points in the study, CE4G contracted consultants with finance, energy and communications expertise to conduct more detailed investigations and provide expert advice.
CE4G consulted the community throughout the study to identify the level of community support for the project. Through a dedicated community energy website CE4G provided regular information updates to approximately 600 stakeholders including individual residents, business groups and decision makers across the Southern Region.
During the twelve month study, advances in PV technology and adjustments to the proposed site increased the capacity of the solar farm to 1.2 MWp. CE4G also identified a possible future expansion of the project to take advantage of Crown Land adjacent to the Goulburn Correctional Centre. A potential Stage Two project will deliver 0.5MWp additional electricity capacity sold behind the meter to the Correctional Centre. Preliminary discussions with Corrective Services look promising for this future solar farm expansion.
Stage One of the project will cost approximately $2.7 million. The solar farm will host 4000 PV panels on a site, with suitable zoning and grid connection. A Power Purchase Agreement will be negotiated with a clean energy retailer in the development phase. Preliminary discussions have commenced with two potential clean energy retail partners able to purchase the electricity from the solar farm as part of their renewable energy portfolio. Goulburn residents will be able to support the solar farm by becoming a customer of the selected clean energy retail partner through a white label agreement.
The proposed community solar farm will have a minimum community ownership of 51% and be constituted as a public company (unlisted). The solar farm will be governed by a Board of Directors to represent community shareholders and ensure that community remains the primary driver of the business model. This Report must be read in conjunction with the attached Reports that provide details of the finance modelling, technical investigations, legal and governance recommendations.
Community Energy for Goulburn will transition to a community energy association (CE4G Inc.), independent of TGG, to drive the next phase of the community solar farm project and kick start future community energy projects in the Goulburn Region. It is pleasing to see that the project has the potential to expand to a Stage Two, adding a further 0.5MW capacity. This can only further benefit investors and the wider Goulburn community. NB: This study must be read in conjunction with the Reports in Attachments 4 and 5 that provide details and underpinning assumptions for the finance modelling as well as advice on legal and governance issues.
This feasibility study confirms that the Goulburn Community Solar Farm is feasible based on the information available at the time of the study. CE4G recommends that the project progress to the development phase facilitated by the establishment of CE4G Inc. A major task of CE4G Inc. will be to raise funds to establish the legal entity and investment vehicle for the solar farm, and undertake development work required prior to construction.

CE4G Feasibility Study – April 2016 Page 5 http://www.ce4g.org.au
Summary of Recommendations: 1. The Goulburn Community Solar Farm (GCSF) progress to the next stage. 2. CE4G transition to an incorporated community energy association (CE4G Inc.) to facilitate the next phase
of the GCSF and explore additional community energy projects for the Goulburn Region. 3. A minimum 51% of project equity be sourced from the community. 4. Commercial developer investment is limited to 49% of the equity in the project. 5. That CE4G pursue funding and/or finance to progress the development phase. 6. That any community investment raised prior to signing the EPC (Engineering Procurement Construction)
contract be held in trust until development milestones are complete. 7. The preferred customer for the GCSF is a ‘white label’ arrangement with a progressive clean energy
retailer. 8. A public unlisted company be established as the legal entity to progress the GCSF. 9. The GCSF will have a minimum 51% community ownership and be managed by a Board of Directors
drawn from the regional community. 10. CE4G facilitate the formation of a suitable board by approaching possible candidates through personal
and professional networks. 11. CE4G facilitate the establishment of a legal entity for the GCSF including the organisational structure,
rules, decision-making parameters and business model. 12. Community investment will be sourced from specified areas in a hierarchy of preference. 13. A sufficient pool of investors will be drawn from the specified area(s) in order to satisfy the requirement
of a minimum 51% community ownership of the GCSF. 14. The newly constituted CE4G Inc. investigate opportunities for community projects that can directly
benefit low income households experiencing energy poverty. 15. The CE4G website continue as an information hub for updates on GCSF and other community energy
initiatives that will benefit a wide range of groups in Goulburn including low income households. 16. Should the GCSF expand the operation to the land adjacent to the Goulburn Correctional Centre that
CE4G Inc. and the Goulburn Solar Farm Ltd revisit the feasibility to establish a community fund.
“GCSF will help my region achieve a clean, cheaper, carbon-free power future. I want to be part of making that happen.”
Potential investor – Community information session, Goulburn Connects Festival Nov 2015.
Young engineers plan their future at CE4G information day.

CE4G Feasibility Study – April 2016 Page 6 http://www.ce4g.org.au
An overview of the feasibility study into a 1.2 MW community owned solar farm for Goulburn
Introduction In 2015/16 Community Energy 4 Goulburn undertook a twelve month feasibility study into a 1.2 MW community solar farm. The study was funded through the NSW Government’s Community Energy Grants Fund and supported through community-business-government collaboration. The study supports the proposition that a community owned solar farm in Goulburn is feasible based on the assumptions and projections available during the study.
This Report provides an overview of the activities and outcomes of the feasibility study and must be read in conjunction with Reports from T.J. Solen Sustainable Investments and E2 Design Lab (E2DL) (Attachments 4 and 5). These reports provide detailed information including the financial modelling underpinning the study for potential investors and community stakeholders.
To take the project to the next stage Community Energy 4 Goulburn will transition to an incorporated association dedicated to the solar farm and facilitating other community energy projects in the Goulburn region.
The Feasibility Study makes a strong business case for the proposed 1.2 MW Goulburn Community Solar Farm and CE4G recommends progress to the next stage. The next stage involves:
x Establishing a legal entity to manage the solar farm x Ensuring 51% community equity x Raising finance.
RECOMMENDATIONS
x That the Goulburn Community Solar Farm (GCSF) progress to the next stage. x That CE4G transition to an incorporated community energy association (CE4G Inc.) to facilitate the next
stage of the GCSF and explore additional community energy projects for the Goulburn Region.
The Study conclusion: The Goulburn Community Solar Farm is feasible and should progress to the next stage facilitated by an incorporated Community Energy for Goulburn Inc.

CE4G Feasibility Study – April 2016 Page 7 http://www.ce4g.org.au
Background to the study In 2015 The Goulburn Group (TGG) provided the auspice for the feasibility study into the Goulburn Community Solar Farm. Community Energy 4 Goulburn (CE4G) was set up to coordinate the study and engage community support for a 1 MW community owned solar farm. The capacity of the proposed solar farm was increased from 1 MW to 1.2 MW during the study as a result of advances in solar PV technology and adjustments to the site. CE4G engaged technical experts with experience in similar projects to assist with the study:
x E2Design Lab provided financial modelling for a 1.2 MW solar farm. See Attachment 5
x T.J. Solen provided advice on legal and governance considerations. See Attachment 4
x KJA Communications assisted with community engagement See Appendix 2
Planning compliance – The DA CE4G also commissioned Laterals Planning to complete the initial Development Application for Council approval. The DA can be found on CE4G website: http://www.ce4g.org.au/index.php
A community solar farm can deliver environmental, social and economic benefits The proposed Goulburn Community Solar Farm (GCSF) is one of a growing number of community energy projects that enables local communities to be directly involved in generating renewable energy. The benefits of the GCSF include:
x The ability of local customers to purchase clean energy from their own solar farm x Community investment in the solar farm x Opportunities for local employment during the life of the project x The potential for education and training opportunities. x 1,960MWh p.a. of clean energy will be generated to supply approx 250-350 homes x A reduction of 1,600 tonnes each year in carbon emissions (1,500 CO2-e)
The proposed GCSF will be located close to town The GCSF will be constructed on a 2.5 ha site off Bridge Street on Goulburn’s northern gateway, 3kms from the city centre. It is zoned B6 - Enterprise Corridor and owned by Divall’s Earthmoving and Bulk Haulage (Divall’s) and the Australian Rail Track Corporation (ARTC).
Collaboration made things happen

CE4G Feasibility Study – April 2016 Page 8 http://www.ce4g.org.au
Clearing site and pegging out boundary.
The proposed site ticks all the boxes x Has minimal visual impact on residential neighbours x Is located adjacent to a connection point on the Essential Energy
network with spare capacity. x Will accommodate approx 4000 non reflective solar panels to
supply 1.2 MWp electricity. x Owners support the community solar farm project x Is accessible for large vehicles x Provides a positive image of sustainability to visitors as they
enter the city x Is located close to a large potential customer and additional land
for future expansion
Approximately 4000 non-reflective solar panels will be installed on site and a solar monitoring station is currently recording solar radiation data for the project.
Future expansion is a real possibility Preliminary discussions with Goulburn Correctional Services identified the potential for future expansion of the GCSF to Crown land adjacent to the Correctional Facility. This would add 0.5MW capacity & provide a behind-the-meter electricity supply to the Correctional Centre.
Anna Cain (Infigen Electrical Engineer) installs the solar monitoring station - September 2015

CE4G Feasibility Study – April 2016 Page 9 http://www.ce4g.org.au
Finance
A. How much will it cost?
The total construction cost of the project will be approximately $2.7M. Variables include exchange rates and the price of PV panels at the time of purchase.
GCSF will need to be financed during each of the three stages of the twenty five year project:
i. Development ii. Construction
iii. Operations
i. Development Stage
CE4G has allowed a development budget of $73,000 for connections studies, approvals and design work. A further $60,000 is required to establish the community investment vehicle and prepare fundraising documents.
See table 2 in Attachment 5 for a breakdown of costs associated with the Development stage.
ii Construction Stage
Estimated total construction budget (including Development Stage): $2.669 million. The project cost estimate has been formulated based on current industry price benchmarks, engineers’ estimates, as well as a direct project quotation from an installation company in the region. While the estimated cost is considered to be at the lower end of current industry benchmarks, it is believed to be achievable due to our partnership with landholders Divall’s and ARTC and competitive project quotation have already been provided.
A recent EOI round conducted by ARENA for large-scale solar (typically larger than GCSF), revealed an average price in NSW of less than $2/watt. NSW was shown to be the most competitive state for fixed solar arrays.
iii Operations Stage
The table below provides the expected operational budget over the first three years. From an anticipated revenue of $285K p.a., approximately $99,000 p.a. is set aside for repayments on borrowed capital, on the assumption of a 33% LVR (Loan to Value ratio).
OPERATIONAL COMPONENT Q2 2017 – Q2
2018 Q2 2018 – Q2
2019 Q2 2019 – Q2
2020 Community investment manager
$8,000 $8,000 $8,000
Lease of Bridge Street site $25,000 $26,000 $27,000 Operations manager $40,000 $41,000 $43,000 Maintenance budget $8,000 $8,000 $8,000 Financing costs $99,000 $99,000 $99,000 Sinking fund $15,000 $15,000 $16.000 Total $195,000 $199,000 $208,000

CE4G Feasibility Study – April 2016 Page 10 http://www.ce4g.org.au
B. How will it be financed? It is anticipated that approximately two thirds of the delivery cost of the GCSF may need to be funded by the community, with the other third funded through debt financing. The three stages will be financed separately:
i Development Stage The development phase can be difficult to finance as it is too early to risk community investment when grid connection studies or planning approvals may uncover unexpected costs. However, the total investment is relatively small.
Co-contributory sources of financing for development may be sourced as follows. x Commercial developers that can price the risk. x Grant money x A seed investment from a small number of 'angel' community members - who understand the
risks. During the study, several commercial renewable energy developers expressed interest in becoming development partners.
ii Construction Stage
Based on a LVR (Loan-to-Value Ratio) of 33%, $1,789,000 will need to be equity financed from the following:
a) Community equity CE4G believes a minimum target of $1.25 million can be sourced through local community investment, provided that community investor expectations are met. (See the definition of “Community” on page 16.). For example:
x The project has a return hurdle rate of 5% x A suitable governance and legal structure is established x A credible Offer Information Statement is issued with all relevant information, including risk.
RECOMMENDATION
That a minimum 51% of project equity be sourced from the community.
Projected layout of PV panels with room for inspection and maintenance.

CE4G Feasibility Study – April 2016 Page 11 http://www.ce4g.org.au
b) Commercial developer equity Based on a target LVR of 33% further investment from the commercial development partner or suitable grant funding may be required, to augment the level of community equity. For potential commercial developer expectations, see page 6 of Attachment 4.
c) Borrowing Based on an LVR of 33%, it may be necessary to borrow up to $880K to complete construction. A more complete analysis of the construction budget can be found in Section 4 of Attachment 5. See also Table 1, Attachment 4 for
information on a possible leveraged capital structure.
iii Operations stage Operational costs will be met entirely from the revenue from solar farm and will not require further funding. Revenue will be derived from the sale of electricity and the sale of LGCs (Large Scale Generation Certificates).
RECOMMENDATION
That commercial developer investment is limited to 49% of equity in the project.
Artist’s impression of the proposed solar farm as seen from Sydney Road
RECOMMENDATION
That any community investment be raised prior to signing the EPC contract and held in trust until development milestones are complete.

CE4G Feasibility Study – April 2016 Page 12 http://www.ce4g.org.au
C. Return on Investment Based on the financial analysis, the 1.2MWp Goulburn Community Solar Farm project offers modest investment returns over the expected life of the project (25 years).
However, the IRR will vary depending on:
x Price of Electricity x Price of Large Scale Generation Certificates (LGCs) x Level of debt to equity
Figure 14 in Attachment 5 shows the IRR variations caused by changes in the level of debt relative to equity. Figure 15 in Attachment 5 presents the forecast cash flows for the project over its 25 year life cycle and the potential dividend rate as a proportion of community investment. It shows the contribution of debt financing and community investment towards the project costs, based on community investment of $1.8m. Figure 17 in Attachment 5 shows the IRR variations caused by changes in Electricity Sales Prices.
Cumulative cash flows increase rapidly following the repayment of the borrowed capital after 12 years - providing approximately $1.9m in returns to investors (nominal). The dividend potential follows a similar profile, tracking in the range of 4% to 5% in early years, then escalating to above 10% (see figure 11 in Attachment 5).
First Community Information Session attracted over 120 people, August 2015
“I’d like to invest some of my super in the community solar farm. I want to make sure that my super is ethical and not propping up coal fired power.”
Potential investor, community solar farm information session, August 2015.
The expected return (IRR) is 5.1%, based on a community investment of $1.8m supplemented through debt finance.
For a full financial analysis refer to T.J. Solen Report and E2DL Report - Attachments 4 and 5.

CE4G Feasibility Study – April 2016 Page 13 http://www.ce4g.org.au
Energy market
“I would love to buy my electricity from our very own community solar farm.” A common view expressed by local residents inquiring about the solar farm
Brief overview of the NEM (National Energy Market) The Australian energy retailing industry is a $51 billion a year industry. It is characterised by a low level of market concentration. The four largest operators account for 40% of revenues.
Typically, energy retail companies purchase energy from: x Wholesale markets and industry operators (who manage price volatility for end users) x Spot markets
Retailers are required to purchase Large Scale Renewable Energy Certificates (LGCs), under the Renewable Energy Target. The price of LGCs has advanced rapidly over the last six months due to market supply shortage. Energy purchasers Potential purchasers of electricity from the GCSF include:
A local energy retailer or NEM Electricity is sold directly to a local retailer (via Essential Energy network), at approximately $50-$60/Mwh, under a Power Purchase Agreement (PPA). Alternatively, GCSF could sell electricity to the National Electricity Market (NEM). However, the current market price in the NSW NEM is $40-$50/MWh.
Local retailer-customer ‘white label’ ‘White-label’ contracts give generators the ability to create their own retail brand, and sell to local customers under their own brand name. This arrangement supports a premium wholesale price and allows the Goulburn Community to directly support the GCSF as a customer of a local clean energy supplier.
Large local institution Electricity is sold via a PPA direct to a large customer. This usually attracts a higher price compared to a typical retail agreement ($100-$200/MWh versus $40-$50/MWh). An opportunity for such a customer is currently being explored with the Goulburn Correctional Facility.
Large-scale generation certificate (LGC) market GCSF is eligible to generate LGCs, and sell on the spot market or under an ongoing contract. The LGCs price is currently at $75-$85.
RECOMMENDATION
The preferred customer for the GCSF is a ‘white label’ arrangement with a progressive clean energy retailer.

CE4G Feasibility Study – April 2016 Page 14 http://www.ce4g.org.au
Legal entity for the Goulburn Community Solar Farm
Legal structure comparison Many legal entities in Australia were considered during the study:
x Co-operative x Incorporated association x Company limited by guarantee x Private company (Pty Ltd) x Public company limited (unlisted) x Trusts
CE4G shortlisted the options to two models: Co-operative and Public Company (unlisted). The table 2 in Attachment 4 gives a full comparison of the structures of two options shortlisted for consideration by CE4G.
CE4G believes that a Public unlisted Company is the most appropriate legal entity for the solar farm. Some of the key considerations for this include:
x It is a common legal structure in Australia and easy to access legal advice x The structure allows for a large number of share holders x The structure can facilitate community involvement in decision-making x Voting rights can be structured on a 'one vote per person (or family) x Minimum investment size can be small enough to allow broad participation x The ability to facilitate co-investment with commercial solar project developer (up to 49% equity) in
the event of community investment under-subscription For additional criteria refer to Section 1 “Governance and Legal Structures” in Attachment 4.
RECOMMENDATION
That a public unlisted company be established as the legal entity to progress the GCSF.

CE4G Feasibility Study – April 2016 Page 15 http://www.ce4g.org.au
Governance and decision making for the Goulburn Community Solar Farm
A Board of Directors should be appointed to represent member interests The Board of Directors will comprise seven - nine board members, with at least one from CE4G. The Board should seek to strike both a skills and gender balance.
The Board will operate to maximise the decision making power of community investors in line with the values and purpose of the GCSF.
An outline of the skill sets required by the board, or accessible by the board (via professional advisors), should include:
Government Relations Corporate Compliance Business Administration Community Relations
Capital raising Audit (Financial) Corporate Finance Solar PV Business strategy Audit (Performance) Marketing strategy Energy Generation Risk (Corporate) Legal and Legal Risk Social Analysis Asset management Governance and policy Executive Management Mergers and
Acquisitions Construction and maintenance
During the study a number of local and regional people were identified as potential Directors of the first Board of GCSF Ltd.
“Yes I would be happy to be appointed to the first Board of Directors to see the
Community Solar Farm up and running sooner than later.” Prominent Goulburn business representative and long- term supporter of sustainable industry
RECOMMENDATIONS
x The GCSF will have a minimum 51% community ownership and be managed by a Board of Directors drawn from the regional community.
x CE4G facilitate the formation of a suitable board by approaching possible candidates through personal and professional networks.
x CE4G facilitate the establishment of a legal entity for the GCSF including the organisational structure, rules, decision-making parameters and business model.

CE4G Feasibility Study – April 2016 Page 16 http://www.ce4g.org.au
A social licence to operate “Thanks for knocking on my door to tell me about the solar farm idea and ask me what I
think. Shows respect. I think looking out over a community solar farm will be great!” Neighbour to the solar farm, July 2015.
Along with technical, legal and planning compliance, the GCSF requires social acceptance and participation to succeed. Determining how the GCSF will deliver both community benefits and community control requires a clear definition of
what constitutes “community” for the purpose of the project. CE4G defines “community” with reference to geographical affinity and communities of interest CE4G defines community as “individuals and other entities within the local government area (LGA)”. This definition guides decision making within the life of the project e.g. the location of the solar farm, future employment contracts for the project, and prospective customers agreements.
In this definition ‘other entities’ can include: x Locally owned businesses x Locally based organisations (including local government and not for profit organisations) x Locally operated businesses and organisations but owned outside the boundaries.
Who can be a community investor? Attracting sufficient community investment in the GCSF, may require a wider geographical scope. CE4G developed a hierarchical order of preference for investors:
1. Individuals and other entities within the Goulburn LGA. 2. Individuals and other entities from adjoining LGAs (Wingecarribee, Palerang, Upper Lachlan),
and/or the Federal electorate of Hume. 3. Individuals and other entities within the SE region as defined by SERREE. 4. Individuals and other entities that have a common interest in renewable energy, within NSW.
Time restrictions may be applied before opening the investment opportunity to the 'next level' of investor. CE4G is confident that a sufficient pool of investors can be drawn from the specified area(s) in order to satisfy the requirement of a minimum 51% community ownership of the GCSF.
Talking to locals about the Goulburn Community Solar Farm at Saturday markets
RECOMMENDATIONS
x Community investment will be sourced from specified areas in a hierarchy of preference. x A sufficient pool of investors will be drawn from the specified area(s) in order to satisfy the
requirement of a minimum 51% community ownership of the GCSF.

CE4G Feasibility Study – April 2016 Page 17 http://www.ce4g.org.au
A community engagement plan (CEP) enabled CE4G to: x Produce a promotional video as a community resource x Establish a website to provide up-to-date information and capture supporter details x Develop promotional collateral x Door knock the residents near the site x Letterbox invitations to attend the open day and to distribute information sheets. x Submit regular media releases to local print and radio media. x Meet face-to-face with local people at community information days, local markets, Goulburn Connects
Festival. x Send regular newsletter updates to 600 e-mail subscribers. x Promote the project through social media channels (See Appendix 2 for a summary of the CEP).
CE4G achieved the following outcomes from engagement activities:
x 100% acceptance of proposal and site by immediate neighbours x Significant local support for the project - no detractors to date x Strong attendance and positive feedback at community information events x Growth in the supporter sign ups via the website and offers of volunteer assistance x Approximately $300,000 in indicative investor pledges drawn from one community event (150 people) x Keen interest from business and regional councils x Fruitful discussions with Goulburn Correctional Centre as a prospective large customer x Positive initial responses from two electricity retailers to buy power under ‘white label’ agreements x Discussions begun with local welfare NGOs regarding 'energy poverty' in Goulburn
The Goulburn Community Solar Farm and energy poverty “It is a real struggle for low income families to implement energy efficiency measures
that lower electricity bills. They are very vulnerable to price hikes and bill default.” CE4G member feedback after consultation with local welfare providers.
CE4G identified the growing problem of ‘energy poverty’, experienced by low-income households in the Goulburn region. These households often remain locked into increasingly expensive carbon intensive electricity with an inability to afford energy efficiency measures to reduce energy consumption. CE4G explored a number of mechanisms to redistribute a proportion of the solar farms profits to address energy poverty and improve access to energy efficiency measures. Various strategies were examined:
x Quarantining a percentage of profits for a community fund to distribute to projects that address energy poverty and efficiency.
x Issuing a quota of shares to a community fund to provide a dividend for redistribution to agencies working with low income households. Identifying potential community partners to increase the efficacy of quarantined funds from the GCSF.
Reluctantly CE4G came to the conclusion that the first stage of the solar farm would be unlikely to generate sufficient profit to make a community fund viable. The ability of the GCSF to effectively address the complexities of energy poverty is therefore limited. If the project expands to a stage two to be able to sell electricity behind the meter to Goulburn Correctional Centre then there may be additional profit that could be set aside for a community fund.
RECOMMENDATIONS
x The newly constituted CE4G Inc. investigate opportunities for community projects that can directly benefit low income households experiencing energy poverty.
x That the CE4G website continue as an information hub for updates on GCSF and other community energy initiatives that will benefit a wide range of groups in Goulburn including low income households
x Should the GCSF expand the operation to the land adjacent to the Goulburn Correctional Centre that CE4G and the Goulburn Solar Farm Ltd revisit the feasibility to establish a community fund. .

CE4G Feasibility Study – April 2016 Page 18 http://www.ce4g.org.au
References and useful websites:
� CE4G website http://www.ce4g.org.au/index.php � Solar Share: https://www.solarshare.com.au/ � Embark: https://www.embark.com.au/display � Repower Shoalhaven http://www.repower.net.au � Energy for Eternity http://cleanenergyforeternity.net.au � Enova Energy retailer http://www.enovaenergy.com.au/ � Australian Solar Council: http: www.solar.org.au/ � NSW Office of Environment and Heritage: http://www.environment.nsw.gov.au/communities/clean-
energy-projects.htm

CE4G Feasibility Study – April 2016 Page 19 http://www.ce4g.org.au
APPENDICES:
Appendix 1: Brief background to the feasibility study
The purpose of the feasibility study was to confirm whether a solar farm was: x Technically possible x Financially viable x Compliant with planning regulations x Supported by the Goulburn community x Able to deliver social, environmental and economic benefits to the region
The Goulburn Group Inc. acted as the auspice for the study The Goulburn Group (TGG) is a not for profit community association committed to sustainable economic, social and environmental development in the Goulburn Region. CE4G was set up to coordinate and deliver the Feasibility Study.
The feasibility study required collaboration between community, government and business:
� Respectful collaboration was a key factor
The feasibility study was made possible through an effective collaboration between CE4G, Divall’s, Infigen Energy, The Australian Solar Council and Goulburn Mulwaree Council. � Inspiration came from successful projects in Australia and overseas
In July 2014, after attending the Congress 4 Community Energy in Canberra, TGG and Divall’s were aware of the potential for community owned renewable energy projects. In November 2014, TGG hosted a Community Energy Forum at the Goulburn Connects Sustainability Festival. � The Government funding kick started the project
At that Forum the NSW Government announced a new funding round to support feasibility investigations for community energy projects. At the conclusion of the Forum, Divall’s encouraged TGG to consider applying for the grant and coordinating the study with their support. � Getting a diverse team on the same page was important
To help empower community stakeholders, Divall’s funded an Inception Workshop facilitated by Community Power Agency to familiarise all stakeholders with community energy and begin to map the study. Attendees included members of TGG, representatives from Goulburn Mulwaree Council, Infigen Energy, Australian Solar Council and Divall’s. All stakeholders maintained their support for the study to the end.
CE4G was established as the community driver for the feasibility study and future community energy projects Following the workshop, TGG applied to the Community Energy Grants Program and secured $50,000 to conduct a feasibility study into the Goulburn Community Solar Farm. TGG appointed CE4G to coordinate and deliver the feasibility study. TGG’s objective is to seed CE4G as an independent association to facilitate the next phase of the GCSF and to kick start future community energy projects in the region.
“The GCSF project offers a wonderful opportunity for the community and business to work in partnership
for the benefit of the environment and the regional economy.”

CE4G Feasibility Study – April 2016 Page 20 http://www.ce4g.org.au
Appendix 2: Community Engagement Summary Table TITLE: SYNOPSIS:
1. Background to project x Proposal: The feasibility of a 1 MW community solar farm in Goulburn. x An initiative of TGG. x Funded by $50,000 grant from O.E.& H.
2. Purpose of CEP x To identify strategies/methodologies and tools to facilitate engagement with the community and stakeholders. x To ascertain whether or not the solar farm is a viable, sustainable, energy project for the Goulburn community. x To provide pertinent details for use in any subsequent environmental assessment, and during the construction
and operational phase.
3. Key messages CE4G: To promote: x Renewable energy for Goulburn. x Transparent, open, accountable, credible governance. x Sensitivity towards the local environment, heritage and indigenous issues.
Of the solar farm: x A vehicle to provide Goulburn with clean energy, employment, skills training and learning opportunities, and an
investment opportunity.
4. Key stakeholders x Commercial project partners x Funding body – O.E & H. x Federal, State and Local government x Relevant government agencies x Aviation and transport x Emergency services
x Community groups x Community: residents in the immediate vicinity
and the broader community x Education and training providers x Employment agencies x Media outlets
5. Communication and engagement strategies
x Website and e-mail x Media release x Site map x Drop – in sessions x Survey and feedback forms x Project updates x Meeting notes x Briefings with specific stakeholders
x Personal consultation (door knocking) x Market stalls x Brochures and fact sheets x Consistent branding x Display boards x Promotional material x Utilise social media x Contact databases
6. Post feasibility stage Submit material for Environmental Assessment and presentation to stakeholders.
7. Risk analysis Key risks: 1. Lack of community support 2. Negative media attention

CE4G Feasibility Study – April 2016 Page 21 http://www.ce4g.org.au
3. Disturbance of Aboriginal/cultural heritage 4. Property (site) damage
8. Action calendar Implement as directed.
9. External communication Facilitate by: x Website, e-mail and contact details. x Contact databases – of stakeholders and the community. x Regular updates to O.E & H. as required. x Prompt complaint processing and dispute resolution procedures in place. x Public relations strategies – to engage with media and government agencies.
10. Internal communication x Regular steering committee meetings. x Regularly update TGG with monthly progress reports. x Facilitate teamwork through effective use of web updates, e-mail notifications, briefing notes, etc. x All CE4G members to model the principle of being a 'good neighbour' at all times. x All inductees are introduced to the CE4G ethos and required code of conduct from the outset.
11. Incident management x Pre-empt any dissatisfaction/ discontent by monitoring feedback and keeping the community/ stakeholders up to date with the project’s progress.
x Prompt response to any concerns or complaints.
12. Activity reports x Evaluate feedback from any consultations and community engagement activities a.s.a.p. x Regularly evaluate project milestones for progress.

CE4G Feasibility Study – April 2016 Page 22 http://www.ce4g.org.au
Appendix 3: Acknowledgements
The community solar farm represents a positive collaboration between community sustainability advocates, Goulburn Mulwaree Council, the renewable energy and regional business community. Special thanks to the following: The CE4G Steering Committee for enthusiasm and application of diverse skills during the study:
� Peter Fraser (Convenor) � Bill Wilkes � Alex Ferrara � Sonya Smythe � Ed Suttle � Mhairi Fraser � Nestor Ellinopoullos.
The technical advisory team for generous advice and support: � John DeGroote Chief Engineer, Divall’s � Caleb Fisher Senior Electrician, Divall’s � Anna Cain, Solar Engineer, Infigen Energy � Steve Blume, Australian Solar Council � Larry Meng, Goulburn Mulwaree Council � Peter Fraser, Bill Wilkes and Alex Ferrara from CE4G
Office of Environment and Heritage – thank you Mark Fleming from The NSW Office of Environment and Heritage (OEH) provided invaluable advice and support with patience and good humour throughout the study. CE4G thanks the consultants who worked tirelessly in the preparation of this study:
� Byron Serjeantson and Toby Roxborough (E2Design Lab) � Lawrence McIntosh (T.J. Solen, SolarShare and Community Power Agency) � Nikki Ison (Community Power Agency) � Moira Sharp (KJA Communications). � Vincent McManus, Short Black Films (videographer) � Robert Mowle (Laterals Planning)
Heartfelt thanks to The Goulburn Community CE4G thanks members of TGG for their support and the wider Goulburn community for their keen interest and encouragement throughout the study.
CE4G thanks Ms Pru Goward, Member for Goulburn for her advocacy.
CE4G meeting celebrating Christmas and Paris COP21 21
TJ Solen Report to CE4G 1.
Attachment 4
Governance and Finance (Report by T.J. Solen Sustainable Investments)
1. Governance and Legal Structures
Description on Decision-making structure (Governance) vs Legal structure It is important to understand that legal structure and governance structure are terms often used interchangeably. The authors consider these concepts to be related however consider there to be an important distinction between the two:
x Legal structure is the legal form that the organisation takes, as recognised under Australia law. E.g. incorporated association, company, trust etc.
x Governance structure is the set of processes by which an organisation makes decisions. This will include aspects of member voting on who to represent the member base as directors, directors (the board) setting policies on how the organisation is to run, and community consultation processes for important decisions.
These structures are interrelated, as a choice of legal structure will determine some aspects of how decisions are to be made within the organisation, through Annual General Meetings (AGMs), for example. Nonetheless, there is enough flexibility in Australian law to allow for considerable tailoring of the governance of an organisation within the legal structure chosen.
Criteria for legal and governance structures In developing the community solar farm project, CE4G have determined the following criteria as important for the project. The legal and governance structures chosen need to allow for: Consultation
i. Community involvement in decision-making. ii. Investor/member numbers in the range of 100 to 1000 people.
Control iii. Voting to be equitable, democratic and not be dominated by any one person or small group of
people iv. Voting to be conducted on a ‘one vote per family’ basis. v. Appropriate levels of responsibility and accountability to be held by different roles within the
organisation. Investment
vi. A minimum investment size small enough to allow broad participation yet not so low as to create burdensome administration.
vii. Co-investment from a commercial solar project developer (up to 49% of equity) to provide a further avenue of finance if community investment is undersubscribed
viii. A return to be paid to investors, meeting an expectation of 5-7% ix. An ability for an investor to trade shares/sell their investment x. An appropriate (medium term) investment length t
xi. Ability to source total funding of approximately $2.7 million Membership
xii. Investment & membership eligibility to consider the geographical location of the investor. xiii. Investors considered as ‘non-sophisticated’ by Australian investment law.

TJ Solen Report to CE4G 2.
Possible legal structures All major legal structures in Australia were considered in assessing what legal structure would suit the above criteria. A brief summary table is presented in Table 3. Two structures were considered in detail: Cooperative and Public Company (unlisted). In narrowing the options to these two the following was considered:
Twenty, Twelve, $2million rule1 x The 20/12/$2mil rule is the colloquial term for a facet of Australian corporations law which
describes the limit for ‘small scale offerings’ that do not require a disclosure document (s708 of the Corporations ACT 2001). To classify as a small scale offering, no more than 20 people must accept an investment offer and raise no more than $2m may be raised in a (rolling) 12 month period. CE4G expect to not be able to rely exemptions provided for by this rule due to the low investor number limit and also potentially to the $2m upper limit. Companies wishing to raise beyond these limits must use an Offer Information Statement (OIS) for raises up to $10m. As small scale offering rule is in corporation’s law it does not apply to cooperatives which are legislated under a different act.
Proprietary company 50 owner limit x A pty ltd company has a limit of 50 owners. (s113 of the Corporations ACT 2001.)
Australian Financial Services Licensing and the self-dealing exemption x Where a third party manages the investment it is the author’s understanding that an Australian
Financial Services License (AFSL) would be required due to investment being considered a ‘managed investment scheme’ (unless the investment is a small scale offering). As obtaining an AFSL is onerous, this rules out a unit trust type structure where a third party trustee is required to look after the investment on the unit holder’s behalf. Organisations offering their own shares for sale are exempt from this AFSL requirement due to the ‘self-dealing exemption’ (s766C(4)(c) of the Corporations ACT 2001.)
The result of the above sections of Australian law is that proprietary companies and unit trusts are effectively ruled out. The remaining viable options are public company (unlisted)2 and cooperative. A full comparison is provided in Table 2.
Recommendation A public unlisted company is recommended as the legal structure to progress. While the full list comparison or pros, cons and consequences for later decisions is shown in the table, the main points influencing the decision are:
x Legal advice easier to obtain x Offer information statement will be used for capital raise x CE4G believe sufficient skills and experience exist in the community to take on the responsibilities of
directorships of a company conducting such a capital raise and running the community solar project. x Democratic and sustainability values can be included in the constitution. x Risks of being perceived as too ‘corporate’ can be addressed to through suitable provisions in the
constitution regarding a socially responsible mission and through a communications strategy that highlights these values.
1 It is worth noting that the other structures previously used in Australia by some community energy projects such as Clearsky solar investments (small unit trust) and Repower Shoalhaven (pty ltd company) were ruled out largely on the basis of these rules. 2 Unlisted refers to the company not being listed on the Australia Stock Exchange

TJ Solen Report to CE4G 3.
Governance options All the contemplated legal structures require a board of directors to represent the members’ interests.
Board of directors The board of directors for the project should comprise 7-9 board members, with at least 1 from CE4G. The board should also seek to strike a skills balance and gender balance. More than 9 members should be avoided as group decision-making becomes more difficult in larger groups. An outline of the skill sets needed within the board or accessible by the board (via professional advisors) should include:
Government relations
Corporate Compliance
Business Administration
Community relations
Capital raising Audit (Financial) Corporate Finance Solar PV Business strategy Audit (Performance) Marketing strategy Energy Generation Risk (Corporate) Legal & Legal Risk Social Analysis Asset management Governance and policy
Executive Management
Mergers and Acquisitions
Construction & maintenance
While not absolutely necessary, it is generally considered best practise in current times for the Executive (those responsible for doing) to be separate from the Board (those response for directing). In practise this means that the CEO and executive should report to the board but not be directors. As such there would be no directors taking a ‘Managing director’ or ‘Executive director’ type role.
Board committees and or advisory committees A board may establish any number of sub committees, at the minimum it is considered good practise to establish a ‘finance, risk and audit subcommittee’ To facilitate strong community engagement the board may also seek to establish a community advisory committee to enable community input into decision-making. This would allow community members who perhaps do not have the adequate skills to become a director to still have input without being exposed to the higher levels of liability and risk associated with directorship.
Recommendation: The next steps to forming a suitable board are to establish some base documentation and begin approaching possible candidates through personal and professional networks. Documentation that will help potential board members to have a clear picture of the organisation and their potential role in it is:
x Organisation Values and Vision x Draft board terms of reference, roles and descriptions3 x Business plan x Diagram of organizational structure identifying reporting channels and levels of decision making
delegation
3 Other community energy organisations such as SolarShare Canberra have published template drafts of these documents at http://www.see-change.org.au/community-solar-toolkit/

TJ Solen Report to CE4G 4.
2. Finance
Financing the different stages of the project CE4G have identified four different project stages, each with different financing requirements. These stages are feasibility, development, construction and operations. As different stages of the project represent different levels of risk for the money spent at each stage different sources of funding are appropriate. In general, as the project progresses from feasibility to development and onto construction the risk of the project decreases. Different sources of funds will be willing to take on different levels of risk and expected return. As the feasibility stage is now complete, this report section looks at the feasibility of obtaining suitable finance for the remaining stages of the project.
Financial modelling feasibility At each stage of the project CE4G expects that potential financiers will require financial modeling to be conducted on the project. CE4G have identified professional advisors capable of conducting this modeling and have also identified toolkits such as the Frontier energy finance toolkit that contains template financial models for use and adaptation by community energy projects.
Project Stages
(i) Development CE4G have identified a required development budget of $73,000 through the consultancy E2 Design for connections studies, approvals and design work. In addition to this, the community investment vehicle needs to be established and fundraising documents need to be prepared. An allowance for this of $60,000 has also been budgeted for in the E2 Design report. This will need to cover such aspects as, company formation, share registry creation, legal assistance, accounting setup, initial auditing, and investigative accountancy report for the offer document, ASIC lodgements and communications and outreach The development phase can be difficult to finance as it is generally considered too early to risk community investor’s money when studies such as the grid connection study or planning approvals may uncover significant costs that render the project unviable. Potential sources of funding for this work are:
x Commercial project developers who are familiar with assessing the risks and can price the risk accordingly
x Grant money x A seed investment from a small number of community members who understand the risks.
Involving a commercial development partner has been deemed the most feasible of the above list insofar as funding the project development work. CE4G have already engaged in discussions with one commercial renewable energy developer. In return for placing their capital at risk CE4G expects that the development partner would benefit from receiving one or more of the following in return.
x Control of development activities undertaken x Ability to invest a particular amount in the larger project x Full repayment plus a risk premium upon completion of development activities x Co-branding of the project
CE4G also deem it feasible to secure this initial seed funding from grant sources and ‘angel’ community members to finance the creation of the community investment vehicle. In return for the higher level of risk taken by these early stage investors CE4G anticipates a risk premium of 10% to 20% would be

TJ Solen Report to CE4G 5.
appropriate for the investment they make. I.e., that these investors would receive 10 to 20 percent more shares than an investor would receive in investing in the main round.
(ii) Construction The solar farm construction budget is estimated at $2.669 million, including the Development stage. In financing this, CE4G expect to make use of debt and equity finance detailed below.
Debt In using debt, the ability of the asset to generate cash flow to make repayments will be paramount. This is due to there being no parent organisation with a large balance sheet to act as guarantor. A brief assessment of the ability to repay and provide sufficient security is as follows:
x The operations budget presented in the following section indicates an annual Cash Flow Available for Debt Service (CFADS) of $179,000
x Applying a Debt Service Coverage Ratio (DCSR) of 1.8 results in the maximum debt repayment that the farm could support as $99,000
x Based on current interest rates of a Bank Bill Swap Rate of 2.5% plus an additional 2.5% margin and a 12 year loan period this represents the capacity to leverage a principal of $881,000.
x It is expected that a debt provider would require first mortgage over the asset.
Table 1: Possible (leveraged) capital structure. Debt terms: BBSW 2.50% Lender Margin over BBSW 2.50% Term 12 Debt service coverage ratio (DSCR) 1.8 Debt service Annual cash flow available for debt service (CFADS) $179,000 Affordable repayment (after DSCR applied) $99,444 Interest rate 5.00% Total borrowings able to be leveraged $881,401 Rounded total $880,000 Capital Structure Total asset value $2,669,000 Total equity required $1,789,000 Total Debt $880,000 Resulting LVR 33%
Equity The balance of the solar plant will need to be equity financed. Representing approximately $1.79m. CE4G have explored the feasibility of the following sources of equity:

TJ Solen Report to CE4G 6.
Community equity CE4G have conducted initial assessments the investment interest of the local community and believe that $1.25 million will be an achievable amount of local community funds. The community equity is expected to have a unique set of requirements when making an investment decision:
x The project should achieve a minimum return hurdle of 5%
x The project should have reached a level of development that represents a satisfactory level of project de-risking.
CE4G deem that the appropriate point to raise community equity would be towards finalisation of all the project contracts. This money would be held in trust until the contracts were then fully executed. In addition to this it would not be appropriate to raise these funds prior to all of the following being finalised: Grid connection approval, off take agreement option signed, land lease option signed, governance board and legal structure established.
x The project governance should be suitably established and involve suitably skilled people promulgating the investment representing local investor interests.
x The project should present all relevant information including investment risks in a credible offer information statement.
x The project legal structure shall be formed with community values in mind, including the
democratic voting structure discussed in the governance section of this report.
Commercial developer equity In the event of under-subscription, CE4G have assessed the feasibility for the project to receive top-up equity investment from the commercial development partner. The investment requirements of a commercial investor are different to community investors. A commercial developer could be expected to require:
x Returns to be higher than the typical level that community investors would be satisfied with. As a result of this the commercial developer is expected to extract value thorough positive branding.
x Strong amounts of control in the project, especially during construction, as a result however
an Offer Information Statement would not be required.
x A proportional voting structure, whereby they invest directly into the project SPV (a unit trust or a pty ltd ‘shelf’ company with a standard 1 share 1 vote structure)
CE4G have determined that it would be feasible for up to 49% of the equity of the project to be sourced from a commercial developer in this manner.
Underwriter equity If community investment interest is potentially below 51% of the total project equity requirement, it may be necessary to secure a project underwriter. An underwriter is a party willing to buy the balance of shares not bought by the community. This could be a philanthropic party an impact investor, or the commercial development partner. Depending on the nature and motivations of the underwriter, a premium or fee may be added to their investment. The fee is in place to compensate the underwriter for them for the lost ability to use their funds elsewhere until the community capital raising is completed and the extent of the draw on the underwrite is known.

TJ Solen Report to CE4G 7.
In order to progress to an EPC contract there will need to be committed funding for the life of the project. Some organizations offer construction ‘bridge’ financing but require this ‘bridge’ finance to be bought out after construction or after a short period of operations. Unless the community investments is in the bank at beginning of construction, a bridge financier would not commit funding unless they could be sure that an underwriter with a willingness to have a long term position in the project will be present as a financing backstop. At this time CE4G propose the most feasible option is to raise community money prior to signing the EPC contract and holding it in trust until nominated development and / or construction milestones are completed.
(iii) Operations Finance of operations activities is feasible entirely from the revenue from solar generation. It is appropriate for the project to set aside some this revenue into a ‘sinking fund’ for equipment repairs and replacement during the lifetime of the farm. A solar farm operations budget is presented for both the farm and community investment vehicle operating costs
Energy Sales Revenue $285,000 Operational Costs Administrative operational costs Insurance - Public liability & Directors and officers cover) $5,000 Share registry management $4,800 Accounting Fees $3,500 Annual Audit $2,000 Communications and events $1,000 AGM $500 ASIC annual registration $1,200 Total community operations costs $18,000 Project operational costs Lease $25,000 Operations and Maintenance Costs $48,000 Sinking fund for replacements $15,000 Total project operations costs $88,000 Total operations costs $106,000 Cash flow available for Debt service $179,000 Finance Costs $99,444 Cash flow available for Equity service (dividends) $79,556

TJ Solen Report to CE4G 8.
Table 2. Full Comparison of Cooperative and Public Company (unlisted) structure for CE4G and follow on consequences
Cooperative (distributing) Public company (unlisted)
Sub classification
Distributing cooperative, meaning that the cooperative has the ability to pay dividends on shares
Unlisted: meaning the company would not be listed on any stock exchange
Legal assistance
Legal assistance can be more difficult to obtain on a pro-bono or discounted basis due to cooperatives being less common.
Legal structure well understood and it is relatively easy to find suitable advisors.
Consultation Both structures can chose to be as consultative as desired through activities such as setting up community representative committees, holding surveys, or determining what matters they wish to see put to member vote.
Investor numbers
Both structures allow for unlimited investor numbers
Democratic Voting
Cooperatives must use a democratic voting structure. A company may adopt provision in its constitution to allow democratic voting instead of the more standard proportional voting.
1 family-1 vote The organization should adopt membership provisions that specify that a member must disclose if it has an interest or relationship, controlling or otherwise, in another member of the organization. A membership policy should be put in place by the board giving the board discretion not to accept membership from more than one person in the circumstance where multiple subscribers are related.
Board While a cooperative could usually not require the same level of professionalism from board members as a public company it would be strongly advisable in this case to have just as capable board members as would be required for the public company model. The responsibility that investors expect board members to take given the nature of the investment will not simply because a different legal structure is used.
A relatively professional and experienced board of directors is required for this type of legal structure. It is recommended the board contain at least a few directors with Australian Institute of Company Directors (AICD) qualifications, and that board members be appointed on a ‘skills’ basis (see section 3 on Governance)
Director liabilities
Board members will need to be comfortable with the relatively thorough requirements and liabilities they are subject to, especially with regards to making a public offering.
Disclosure Disclosure document lodged with state-based registrar of coops. An ‘Offer Information Statement’ OIS is required as the small scale offering rule would not apply. OIS to be lodged with ASIC and has reasonable strict requirements around what this contains.
Minimum investment
size
Can set by policy of the board, the choice between a cooperative and public company will not limit this decision
Commercial The democratic voting structure may limit the appetite a commercial equity partner such as a commercial solar developer has for

TJ Solen Report to CE4G 9.
investment investing directly in the community investment vehicle. For this reason it is likely to be appropriate to establish a subsidiary pty ltd company or unit trust to hold the project. This type of subsidiary entity to hold an infrastructure asset is often called a Special Purpose Vehicle (SPV). The community company (or cooperative) and the commercial developer would each hold an interest in this SPV proportional to the amount of capital each contributes.
Return Limited by section 3.19 of Cooperatives National Regulations. Limit is likely to be higher than 6%-11% return desired to be paid however clarification should be sought from the registrar if this model is to be pursued
No limit.
Share trading In both cases, the organization will need to establish a matchmaking service for interested buyers and sellers. Shares will be not be considered to very liquid (easy to buy or sell)
Investment length
A decision between cooperative and public company will not affect investment length, the board should be sure to inform members however that they should consider the investment as a long term one as the shares will not necessarily be easy to sell. (See above point on share trading)
Total funding No limit. $10million limit if OIS used as disclosure document.
Member location
The introduction of Cooperatives National Law has reduced restrictions on interstate members and trading. It would be prudent to seek further legal advices as to whether some restrictions still exist. If the organization wished to restrict membership to a particular area, such as the Goulburn area, it could do so through setting a membership policy.
There is no legislated restriction on member geographical location. If the organization wished to restrict membership to a particular area, such as the Goulburn area, it could do so through setting a membership policy
Maximum shareholding
No person may own more than 20% of the share capital of a cooperative
No legislated maximums exist however maximums may be adopted into the constitution or as a board policy if desired.
Members not sophisticated
Both structures permit non-sophisticated investors.
Public perception
Can be seen as less professional. Communications strategy will need to ensure professionalism is communicated
Can be seen as too ‘corporate’. Communications strategy and constitution will need to ensure community values are adopted and communicated.
Active membership
Cooperatives must have an active membership provision. This can typically be tailor to not be particularly onerous.
Companies are not forced to have requirements about members remaining active in the business of the company. Nonetheless such active membership requirements can however be adopted if desired.

TJ Solen Report to CE4G 10.
Table 3: Legal structure summary:
Governing body
Profit Example Geography Voting Disclosure Challenges Benefits
Cooperative distributing
non-distributing
Registrar of Coops NSW Dept. of Fair Trading
NFP and for profit alternatives available.
Hepburn Wind
State: Can register as foreign coop in other states
Demo Disclosure document checked by registrar
Legal advice. Interstate investors. Can be seen as ‘Kooky’
Values align, Offer document checks, Can distribute before tax Unlimited members
Incorporated Association
Dept. of Fair Trading
NFP Pingala State Demo N/a No investment allowed
Easy to setup
Company limited by
Guarantee
ASIC NFP None National
Demo N/a No investment allowed
National substitute for Incorporated assoc.
Private company (pty ltd)
ASIC For Profit Company tax rate
Repower Shoalhaven
National Usually Prop can be demo
Info Memorandum
20/12/$2m 50 people total
Easy to setup
Public company (ltd, unlisted)
AISC For Profit Company tax rate
SolarShare, Sydney Renewable Power co.
National Usually Prop can be Demo
<$10mil: OIS >$10mil Prospectus
Compliance costs
Unlimited members
Trust Unit
Discretionary
ASIC For Profit Tax rate of individual investors
Clearsky Solar Investments
National Trustee Info Memorandum OR Managed investment scheme
20/12/$2m OR Australian Financial Services License
Tax treatment of profits Capital returns
Demo = democratic: 1 person 1 vote Prop = Proportional: 1
i
Community Energy for Goulburn (CE4G)
Goulburn Community Solar Farm Business Case Report Version 5 / March 2016
Appendix 5

Version Date Approved Details
1 23.02.2016 Draft Report
2 10.03.2016 TR Revised draft
3 23.03.2016 TR Revised draft
4 31.03.2016 TR For Issue
5 04.04.2016 TR For Issue
Document Control Sheet
Project Community Energy for Goulburn Solar Farm
Report Title Goulburn Community Solar Farm - Business Case Report
Version 5
Author(s) Byron Serjeantson
Approved by Toby Roxburgh
Signed
Date 4 April 2016
File Location
Distribution 4 April 2016
This document has been prepared solely for the benefit of Community Energy for Goulburn and is issued in confidence for the purposes only for which it is supplied. Unauthorised use of this document in any form whatsoever is prohibited. No liability is accepted by e2designlab or any employee, contractor, or sub-consultant of this company with respect to its use by any other person.
This disclaimer shall apply notwithstanding that the document may be made available to other persons for an application for permission or approval to fulfil a legal obligation.

- - - - - - - - - - - - - - - - - - - - - - - - - - - - - - - - - - - - - - - - - - - - - - - - - - - - - - - - - - - -
EXECUTIVE SUMMARY - - - - - - - - - - - - - - - - - - - - - - - - - - - - - - - - - - - - - - - - - - - - - - - - - - - - - - - - - - - -
The business case report for the Community Energy for Goulburn (CE4G) Solar Farm project considers the following three solar farm concepts in terms of their financial and technical feasibility in order to identify the most promising option for the business case:
� Option A: 1MWp solar farm on Divalls site � Option B: 1.2MWp solar farm on Divalls site and adjacent ARTC site � Option C: 1MWp solar farm on Divalls site and 0.5MW at Goulburn Correctional Facility
The results of comparative feasibility analysis indicated that Option B presented the greatest project benefits, due to the economies of scale for the larger system and non-reliance on prolonged discussions with the Goulburn Correctional Facility – however this would remain a future option.
In agreement with the CE4G group, Option B was further developed, including discussions with progressive energy retailers offering ‘white label’ contracts. Such contracts are preferred by the project team as they would allow the Solar Farm to sell directly to pre-identified customers in the Goulburn community (including council facilities), allowing the project to be more readily supported by the community and the potential benefits, such as reduced energy prices, more readily shared.
Based on the results of our financial analysis, the 1.2MWp Solar Farm project shows relatively modest investment returns over the expected 25 year project lifecycle. An expected return of 5.1% was observed based on a community investment of $1.8m, equivalent to two thirds of the total project establishment cost ($2.67m), with the remainder sourced via-debt finance.
The results of the sensitivity analysis showed that the uncertainty surrounding the LCG price is shown to have the most significant influence on project returns, based on the market volatility of LCGs as well as its dependence on the Commonwealth government Renewable Energy Target policy. Variations in the achievable energy sales price were also shown to have a strong influence on investor returns, emphasising the importance of ongoing sales price negotiations with retailers; should an improved energy sales price be negotiated, project returns of 6.5% are considered to be achievable.
The sensitivity analysis highlighted the degree of investment risk to potential investors in the community. The expected likelihood of the project achieving an IRR of < 0% is approximately 3% and an IRR of < 3% is approximately 20%.
Discussions with the preferred energy retailer(s) are ongoing and subject to a confidential non-disclosure agreement to support purchase price negotiations. At this stage, the expected energy sales price is based on our preliminary discussions, with sensitivity analysis employed to capture uncertainty.

- - - - - - - - - - - - - - - - - - - - - - - - - - - - - - - - - - - - - - - - - - - - - - - - - - - - - - - - - - - -
CONTENTS - - - - - - - - - - - - - - - - - - - - - - - - - - - - - - - - - - - - - - - - - - - - - - - - - - - - - - - - - - - -
1. PROJECT BACKGROUND ...................................................................................... 1
1.1 Introduction 1
1.2 The community energy concept 1
1.3 The Community Energy for Goulburn Group 1
2. PROJECT OVERVIEW ............................................................................................. 2
2.1 The Goulburn Community Solar Farm 2
2.2 Technical information 3
2.3 Expected generation 5
2.4 System operation and maintenance 5
2.5 Energy market opportunities 5
3. MARKET ANALYSIS ................................................................................................ 6
3.1 Economic outlook 6
3.2 Industry analysis 8
3.3 Energy purchasers 10
3.4 Competitive analysis 12
4. BUSINESS CASE OPTIONS .................................................................................. 13
4.1 Overview 13
4.2 Comparative results 14
4.3 Selection of preferred solar farm option 16
5. SELECTED SOLUTION FINANCIAL PLAN ........................................................... 17
5.1 Expected Costs 17
5.2 Operational Budget 17
5.3 Expected Revenues 18
5.4 Sources of funding 18
5.5 Project cash flows 19
6. INVESTMENT PROFILE ........................................................................................ 20
6.2 Financial Analysis Results 21
6.3 Sensitivity Analysis 22
7. ADDITIONAL INFORMATION ................................................................................ 24
7.1 Marketing Plan 24
7.2 Organisational Structure 24
8. CONCLUSION ........................................................................................................ 25
APPENDIX A ................................................................................................................... 26

Page | 1
- - - - - - - - - - - - - - - - - - - - - - - - - - - - - - - - - - - - - - - - - - - - - - - - - - - - - - - - - - - -
1. PROJECT BACKGROUND - - - - - - - - - - - - - - - - - - - - - - - - - - - - - - - - - - - - - - - - - - - - - - - - - - - - - - - - - - - -
1.1 Introduction The Community Energy for Goulburn (CE4G) group received a grant from the NSW Office of Environment and Heritage to investigate the financial and technical feasibility of a community energy solar farm in the Goulburn region. E2Designlab were engaged to undertake this work and are the authors of this report.
This report presents the main economic, social and environmental impacts for a regional community solar farm project business case.
1.2 The community energy concept Community energy projects describe energy projects which are developed, delivered and majority owned by a community for the primary benefit of local residents as well as the environment. These projects typically involve renewable energy generation, such as solar and wind farms, but may also include energy efficiency, storage and demand management.
Community energy projects provide individuals with the chance to benefit from the opportunities offered by the current renewable energy transformation occurring across Australia and the globe, and in so doing provide a range of benefits for the wider community.
The community energy sector in Australia is growing steadily, driven by rising energy prices, the falling cost of renewable energy technologies and climate change policy settings. Some prominent examples of community energy projects include:
� Tathra Community Solar Farm � Repower Solar Farm, Shoalhaven � Denmark Community Wind Western Australia – Australia’s second community wind farm; � Darebin Solar Savers, Melbourne
1.3 The Community Energy for Goulburn Group CE4G is a not-for-profit community group established by The Goulburn Group (TGG) through grant funding provided by the NSW Office of Environment and Heritage. Its aim is to identify opportunities for regional community energy projects and partnerships, starting with the ~1MW Goulburn Community Solar Farm project, located approximately 3km from the city centre.
The CE4G committee is committed to identifying community energy opportunities which can draw upon the abundant resources of the region to provide direct benefits for Goulburn residents and strengthen the local community.

Page | 2
- - - - - - - - - - - - - - - - - - - - - - - - - - - - - - - - - - - - - - - - - - - - - - - - - - - - - - - - - - - -
2. PROJECT OVERVIEW - - - - - - - - - - - - - - - - - - - - - - - - - - - - - - - - - - - - - - - - - - - - - - - - - - - - - - - - - - - -
2.1 The Goulburn Community Solar Farm The proposed Goulburn Community Solar Farm (The Solar Farm) would involve the construction of a 1.2MWp solar farm on 2.5Ha of vacant land, approximately 3km from the Goulburn city centre. The proposed site is located adjacent to Bridge Street and the Mulwaree River, spanning land owned by Divalls and the Australian Rail Track Corporation (ARTC) Ltd. Divalls have endorsed the use of their land. Negotiations with the ARTC are currently underway; it is expected that the use of the lands will be granted in the near future.
Figure 1 provides the concept design layout of The Solar Farm, indicating the locations of the solar panel arrays across the two land parcels as well as the proposed substation and network connection point. This layout has been designed around the 100 year flood level posed by the Mulwaree River.
The proposed site is favourably located adjacent to a connection point on the Essential Energy network. Initial discussions with the utility indicate that this section of the network is sufficiently robust and has spare capacity; as such a connection study (if required), protection report and connection application are unlikely to reveal significant complications. While indications remain positive at this stage, the project must meet all Essential Energy requirements for the connection application to be approved.
Two other options have been considered as part of the feasibility study; 1) a smaller 1MWp system on the Divalls site; and 2) 1MWp on the Divalls site combined a 0.5MWp ‘behind-the-meter’ installation located at the Goulburn Correctional Centre site. ‘Behind-the-meter’ installations can generally achieve a higher sales price.
Figure 1 – Concept layout of the proposed Goulburn Community Solar Farm project
Network Connection Point
Sub-Station
Divalls Land
ARTC Ltd Land

Page | 3
2.2 Technical information The key technical information for the proposed 1.2MWp Solar Farm is provided in Figure 2, Figure 3, Figure 4 and Figure 5. This information includes the solar array design characteristics and mounting frame details, system generation and losses diagram and concept single line diagram.
While the information presented in this section specifically applies to the proposed 1.2MWp Solar Farm, it is largely scalable for the smaller 1MWp option as well as the behind-the-meter array at the Goulburn Correctional Facility.
Figure 2 – Solar array design characteristics
Figure 3 – System loss diagram of the 1.2MWp Solar Farm. This diagram is scalable for the other two options considered.

Page | 4
Figure 4 – Concept single line diagram of solar array. This design is consistent for all other options investigated.
Figure 5 – Concept design of solar array mounting frames including dimensions angle and separation.

Page | 5
2.3 Expected generation The expected generation of the 1.2MWp Solar Farm is approximately 1,960MWh p.a. in a typical year. Figure 6 provides the expected monthly generation profile of the system based on PVsyst solar modelling software1. Actual generation will be subject to fluctuations in weather and solar irradiance and will vary to some degree.
The expected generation profile presented in Figure 6 is typically scalable for the smaller 1MWp option as well as the behind-the-meter array at the Goulburn Correctional Facility.
Figure 6 – Expected energy generation profile of the 1.2MW system
2.4 System operation and maintenance The operation and maintenance of The Solar Farm is expected to be contracted to a third party experienced in solar farm management and operation. For a system of this scale, the operational and maintenance resources required are expected to be relatively modest.
Potential operators have yet to be identified however it is anticipated that these skills are available in the region. At this stage, a tentative operation and maintenance budget has been allocated.
2.5 Energy market opportunities There are a number of energy market opportunities available to The Solar Farm, which are explored in greater detail in section 3.3. These opportunities can be broadly divided into four categories:
� Grid electricity sales – generated electricity is sold to a local energy retailer
� Renewable Energy Certificate revenues – sale of Large-Scale Generation Certificates
� Retailer-Customer ‘white label’ sales – generated electricity is sold to Goulburn residents via an agreement with local energy retailer.
� Behind-the-meter electricity sales – generated electricity sold to a physically linked load; applies to potential installation at Goulburn Correctional Centre site.
1 http://www.pvsyst.com/en/

Page | 6
- - - - - - - - - - - - - - - - - - - - - - - - - - - - - - - - - - - - - - - - - - - - - - - - - - - - - - - - - - - -
3. MARKET ANALYSIS - - - - - - - - - - - - - - - - - - - - - - - - - - - - - - - - - - - - - - - - - - - - - - - - - - - - - - - - - - - -
3.1 Economic outlook
3.1.1 Australia-wide
The following statement of the Australian economic outlook has been derived from RBA Statement on Monetary Policy – February 20162.
The current Australia-wide economic outlook could be described as a mixed picture. The outlook for GDP growth of Australia's major trading partners (MTPs) is expected to remain around its current rate, which is slightly below its decade average. Globally, core inflation has been stable at low rates, reflecting spare capacity in many labour, product and commodity markets. This, together with the decline in oil prices, suggests that headline inflation rates will remain below central bank targets for some time yet.
The Australian economy has grown at a below-average pace in the last year, activity continued to shift from mining to non-mining sectors of the economy, Dwelling investment continued to grow strongly and consumption growth picked up to be close to its decade average. Public demand grew at a below-average pace over the year. Low interest rates and ongoing growth in employment are expected to lead to a further pickup in household incomes and demand.
Expectations for GDP growth are forecast to be between 2.5% and 3.5% over the year to December 2016, and to increase to between 2.5% and 3.5% over the year to June 2018.
3.1.2 NSW energy market
From the local energy market perspective, the Australian Energy Market Operator (AEMO) places current energy consumption in NSW at the base of a 25 year historic-to-forecast period (2009-2035), as illustrated in Figure 7. The reduction in energy demand from the 2009-10 historic high, is attributed to large-scale closures and production curtailment in the industrial sector. Over the short term, the AEMO forecasts a recovery in consumption, driven by the residential and commercial sector, which represents the largest proportion of the total state load
2 http://www.rba.gov.au/publications/smp/2016/feb/

Page | 7
Figure 7 – Historic and forecast energy consumption, NSW (incl. ACT), Detailed Summary of 2015 Electricity Forecasts, AEMO, 2015.
Medium and long term forecasts indicate a stronger recovery in operational consumption, again driven primarily by the residential and commercial sector. New South Wales is the only NEM region to have a slight increase in per capita consumption, driven by a relative fall in electricity prices and increase in average income. New South Wales also has the lowest proportion of rooftop PV of all the NEM regions, so it has a lower impact of rooftop PV offsetting consumption from the grid.
Price forecasting from Frontier Economics (commissioned by AEMC, 2015) for the NSW region cites that energy prices increased rapidly from 2007 to 2013, largely due to rising network costs and the introduction of the carbon price; prices then fell from 2014 to 2015 largely due to the removal of the carbon price. Wholesale power prices are currently at record lows, due to increased competition from extra generating capacity added under the Renewable Energy Target (RET). This is creating challenges for the broader energy sector, particularly as many older coal power plants have remained in use long after their expected retirement date.
Based on their ‘medium case’ forecasting, projected retail prices are expected to increase in line with inflation until around 2040.

Page | 8
3.2 Industry analysis
3.2.1 Large-scale renewable energy generators
Over recent years, the amount of large-scale wind and solar renewable energy generation has been rising steadily. While activity in the renewable energy sector was subdued during 2014-2015, due to investment uncertainty created by the Federal Government’s review of the Renewable Energy Target (RET), industry confidence has rebounded following a perceived improvement in government and policy settings.
A number of new large-scale renewable energy projects have been completed in recent years, including several large wind farms and the 20MW Royalla solar farm. Due to the high potential of large-scale solar a number of projects are taking shape across the country. These include projects in: Nyngan (102 MW), Broken Hill (53 MW), Moree (56 MW) and Toowoomba (2,000 MW). The cost of the solar technology has fallen sharply, and is expected to be competitive with the cheapest forms of renewable energy in the near future.
Figure 8 – Renewable contribution, Clean Energy Australia Report 2014, Clean Energy Council, 2014
3.2.2 Energy retailing industry
The Australian energy retailing industry is a $51 billion a year industry characterised by a low level of market concentration. In 2015-16, the four largest operators are estimated to account for approximately 40% of revenues. There are two major energy markets in Australia; the National Electricity Market, which includes New South Wales, and the South West Interconnected System.
The electricity retailing industry has emerged from a challenging environment over recent years due to declines in underlying demand and changing policy settings. Retail companies facilitate the supply of electricity from generators to end users through electricity transport networks. By purchasing energy from wholesale markets, industry operators are able to manage price volatility for end users. Several industry operators are also active in power generation industries, which provides them with a less volatile supply of electricity.

Page | 9
In addition to purchasing energy from the whole-sale and spot markets, retailers are required to purchase renewable generation certificates, called Large-Scale Generation Certificates (LGCs), under the Renewable Energy Target. LGCs are generated by eligible renewable energy generators such as the proposed Solar Farm. The price of LGCs has been advancing rapidly over the last six months due to a market supply shortage.
Figure 9 – Rising spot price of LGCs from July 2015, complied by Green Energy Markets.

Page | 10
3.3 Energy purchasers The financial evaluation (section 6.2) demonstrates that the achievable price for energy and LGCs represents a governing variable for potential returns of the Solar Farm. This (somewhat intuitive) result highlights the importance of securing a healthy energy sales price, as it will be crucial for the feasibility of the project and mitigating risk to investors.
Energy price (and LGC price) variability is another key uncertainty governing the potential returns of the Solar Farm (modelled in section 6.2). While the risk of future price uncertainty is difficult to mitigate over the medium to long-term, it can be managed over the short-term through 3 to 6 year energy purchase contracts.
Securing a purchaser of energy (potentially combined with LGCs) at a healthy sales price, and over a contracted period, is important for providing security for investors and consistent project returns.
The following energy purchaser profiles have been identified for the sale of The Solar Farm’s energy:
� Local energy retailer power purchase agreement � Large-Scale Generation Certificate market � Local retailer-customer ‘white label’ customers � Behind-the-meter customer - Goulburn Correctional Centre
3.3.1 Local energy retailer
Electricity may be sold directly to a local retailer (via Essential Energy network) at approximately $50-$60/MWh under a power purchase agreement with a retailer. Such agreements are usually undertaken for 20MWp or larger solar farms, given the inherent cost around contractual negotiations, long-term nature and requirement to fit into generally larger energy portfolios. This means arrangements for smaller projects become challenging on an individual basis, although become more marketable if multiple projects can be marketed together.
At presently an offtake PPA in the magnitude of 1.2MW would be priced at between $94 - $106 MWh inclusive of LGC, contracted over a five year period. This reflects the intermittent nature of solar generation and additional hedging costs to firm up offtake price, market expectation around the underlying cost of black energy and forecast value of LGC certificates. Whilst under the required LCOE for the project, a PPA of this nature can still form an important risk mitigation role, when combined with behind the meter or white label agreement with a retail.
Alternatively, The Solar Farm could sell electricity to the National Electricity Market (NEM) however the current market price in NSW is $40-$50/MWh.
It is noted that additional revenues may be achieved through a rule change currently under consideration by the Australian Energy Market Commission (AEMC), which seeks to introduce a payment from distribution networks to embedded generators.
3.3.2 Large-scale generation certificate market
The federal Renewable Energy Target (RET) scheme allows eligible renewable energy sources to generate renewable energy certificates. For each unit (1 MWh) of electricity generated, the project is eligible to generate one renewable energy certificate. Generators above 100 kW are eligible for LGCs.

Page | 11
The solar farm will be eligible to generate LGCs, which can be sold on the spot market or under an ongoing contract. The LGCs price has been advancing rapidly over recent months and is now in the range of $75-$85.
3.3.3 Local retailer-customer ‘white label’
Local retailer-customer ‘white label’ contracts are able to combine the attributes of a distribution network connection for sales to retailer and a behind-the-meter savings to a direct customer. Progressive retailers may provide ‘white-label’ contracts, which allow the solar farm to sell directly to contracted customers via a retailer, provided that sufficient customers have been signed up to purchase the generated energy.
Under a white label agreement, the community would collective purchase and consume energy generated from the project, via a retail tariff at a rate sufficient to ensure appropriate return for the project. The community would be responsible for collectively forming customer group, with the retailer providing market settlement, regulatory and billing services on their behalf. In the case of Goulburn a residential community group of between 250 and 500 customers would be required.
The term ‘white-label’ allows generators to create their own energy retail brand, i.e. the Goulburn Community Solar Farm Energy Plan. This mechanism would potentially allow Goulburn households to reduce their energy bills, while advocating and supporting the community solar farm.
Agreements of this nature are undertaken for large customer groups and are only provided by limited retailers. Two retailers have been identified as potential candidates for ‘white label’ retail contract; Enova Energy3 and a confidential tier-2 energy retailer.
A similar concept referred to as virtual net metering (VNM) is being trialled in Byron Bay Shire currently for another community solar farm project within the Essential Energy Network.
3.3.4 Behind-the-meter customer
A behind-the-meter customer purchases electricity through a physical connection between the solar farm and a metered load. Electricity is sold via a Power Purchase Agreement (PPA), which typically attracts a higher price compared to a typical retail agreement ($100-$200/MWh versus $40-$50/MWh). A higher price is achievable as a behind-the-meter connection offsets electricity consumption, which includes retail energy costs as well as additional costs such as network charges, renewable energy policy obligations and retailer margins. Grid connected loads are typically subject to Time of Use (ToU) tariffs with peak pricing during daytime, coincident with solar farm generation. At times where the solar farm generates excess electricity in excess of the customer requirements, it can be sold to the retailer or the NEM pool.
A connection behind the meter option is more easily achieved by smaller solar systems on roof tops or located at large energy user sites. An opportunity for a behind-the-meter installation has been pursued with Goulburn Correctional Facility however it appears that is less likely to be achieved within the project timeline.
3 http://www.enovaenergy.com.au/

Page | 12
3.4 Competitive analysis Energy generation is a relatively free market in Australia, with little opportunity for product differentiation between suppliers. Almost any company that generates electricity is a potential competitor for The Solar Farm, particularly other solar energy projects, which will compete during similar generation periods.
While solar energy is becoming an increasingly prevalent method of producing electricity, the Solar Farm will seek to maintain a competitive advantage through first-mover advantage, its ability to attract community partners in the region and by negotiating contracts with purchasers.
The energy industry is a rapidly changing industry and will remain so for the foreseeable future. As such, it is difficult to anticipate the competitors that may be encountered in the years to come.

Page | 13
- - - - - - - - - - - - - - - - - - - - - - - - - - - - - - - - - - - - - - - - - - - - - - - - - - - - - - - - - - - -
4. BUSINESS CASE OPTIONS - - - - - - - - - - - - - - - - - - - - - - - - - - - - - - - - - - - - - - - - - - - - - - - - - - - - - - - - - - - -
4.1 Overview Three options for the solar farm were developed and evaluated during the early stages of the feasibility study, with the intention to select a single option to be taken forward for the final business case. These options included the use of the proposed Divalls and ARTC sites, as well as an additional behind-the-meter installation at the Goulburn Correctional Facility.
The following options were evaluated as part of the preliminary financial analysis:
� Option A: 1MWp solar farm on the Divalls site � Option B: 1.2MWp solar farm on the Divalls site including additional panels located on adjacent site � Option C: 1MWp solar farm on the Divalls site, and 0.5MW at the Goulburn Correctional Facility
Estimates of capital costs, operational costs, and expected revenues were developed for each option, which were then used to develop long-term cash flow forecasts over the expected 25 year project lifecycle period together with key financial performance indicators.
Monte Carlo simulation-based sensitivity analysis of project variable was used to identify key risk parameters.
Figure 10 below illustrates the concept design layouts developed for the solar farm options. The 0.2MWp originally located on the land adjacent to the Divalls site (left image) has since been located to the adjacent ARTC site (Figure 1).
Figure 10 – Original concept solar farm designs for: 1MWp array on the Divalls site and 0.2MWp array on adjacent land – this array has since been located on the ARTC site (Figure 1) [left]; and, 0.5MWp array adjacent to the Goulburn Correctional Facility [right].
Divalls Site (1MWp) and adjacent land 0.2MWp Goulburn Correctional Facility

Page | 14
4.2 Comparative results The comparative results of the preliminary financial analysis are presented in Table 1 and Figure 11.
Option 3 is shown to present the greatest investment returns however this option requires the greatest capital costs and development at both the Divalls site and the Goulburn Correctional Facility. This option presents the greatest returns due to the higher energy sales price considered to be achievable for a behind-the-meter installation. Option 1 presents the lowest capital costs as well as the poorest investment performance.
If the project is constrained to the Divalls and ARTC sites (which is considered the probable in the near term), Option 2 demonstrates the strongest investment performance. As elements of the project establishment cost and annual expenses are fixed, economies of scale improve the performance of the larger 1.2MWp system.
Figure 11 presents comparative forecasts of cumulative net cash flows (nominal) over the 25 year project lifecycle period. For each option, columns represent initial capital cost outlays occurring over a 2 year period as well as replacement cost outlays after 15 years. It can be seen that Option 3 provides the greatest return over the period, despite higher capital costs; the steeper line indicates proportionally higher annual revenues due to the higher sales price achievable for the behind-the-meter installation.
Table 1 –Summary of preliminary financial analysis results comparing the three Solar Farm options. Results are based on an indicative energy sales price of $0.076/kWh; this price is targeted for a ‘white label’ agreement.
Option Project
Establishment Cost (real)
Annual Revenues
(annualised)
Annual Expenses
(annualised)
Net Cash Flows
(annualised)
Levelised Cost of Energy
(LCOE) (/MWh)
Internal Rate of Return (IRR)
Return on Investment
(ROI)
Option 1 $2,170,000 $190,000 $80,000 $110,000 $84 4.9% 70% Option 2 $2,669,000 $228,000 $81,000 $147,000 $80 5.8% 86% Option 3 $3,295,000 $301,000 $89,000 $212,000 $81 6.5% 109%
Figure 11 – Forecast cumulative net cash flows each option illustrating capital cost outlays and replacement cost outlays as columns
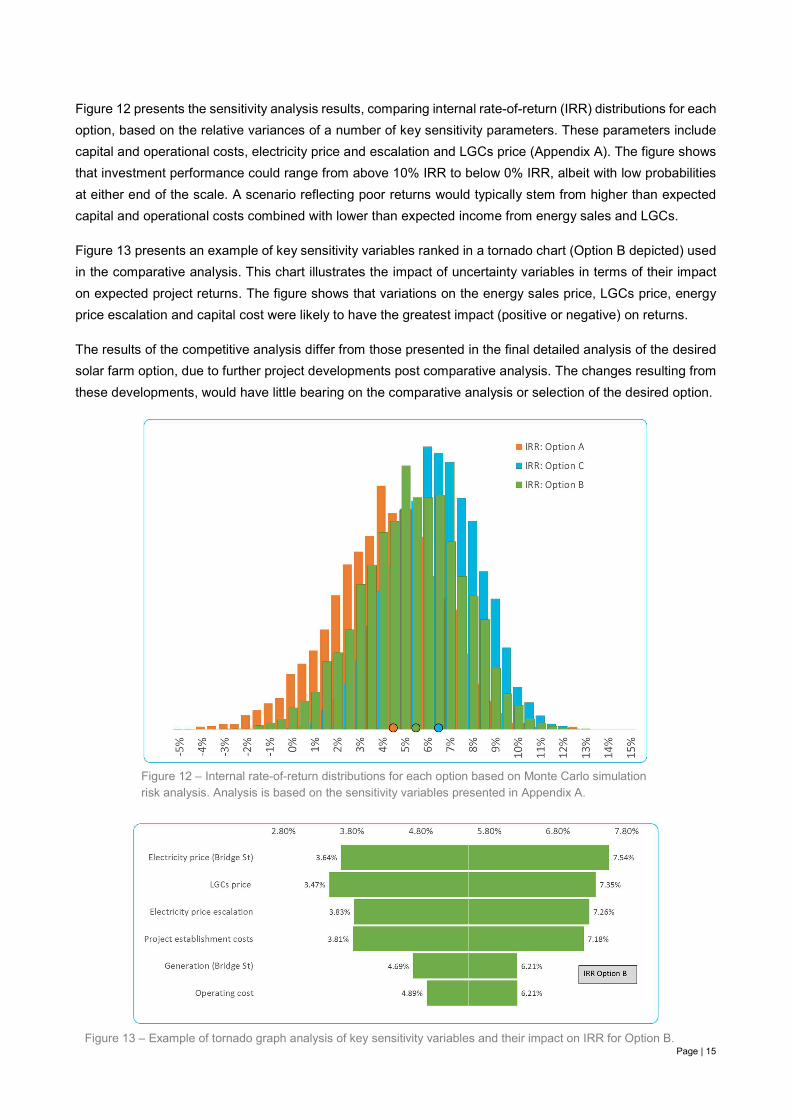
Page | 15
Figure 12 presents the sensitivity analysis results, comparing internal rate-of-return (IRR) distributions for each option, based on the relative variances of a number of key sensitivity parameters. These parameters include capital and operational costs, electricity price and escalation and LGCs price (Appendix A). The figure shows that investment performance could range from above 10% IRR to below 0% IRR, albeit with low probabilities at either end of the scale. A scenario reflecting poor returns would typically stem from higher than expected capital and operational costs combined with lower than expected income from energy sales and LGCs.
Figure 13 presents an example of key sensitivity variables ranked in a tornado chart (Option B depicted) used in the comparative analysis. This chart illustrates the impact of uncertainty variables in terms of their impact on expected project returns. The figure shows that variations on the energy sales price, LGCs price, energy price escalation and capital cost were likely to have the greatest impact (positive or negative) on returns.
The results of the competitive analysis differ from those presented in the final detailed analysis of the desired solar farm option, due to further project developments post comparative analysis. The changes resulting from these developments, would have little bearing on the comparative analysis or selection of the desired option.
Figure 12 – Internal rate-of-return distributions for each option based on Monte Carlo simulation risk analysis. Analysis is based on the sensitivity variables presented in Appendix A.
Figure 13 – Example of tornado graph analysis of key sensitivity variables and their impact on IRR for Option B.

Page | 16
4.3 Selection of preferred solar farm option Based on the results of the preliminary financial analysis, Option B (1.2MWp solar farm on the Divalls site including additional panels located on adjacent ARTC site) was selected as the preferred option for the final business case. This option was selected as it maximised the generation potential of the site, with improved economies-of-scale compared to the 1MWp alternatives.
While Option B offered lower returns than those achievable with a behind-the-meter installation (Option C), it is not dependent on a negotiated deal with the Goulburn Correctional Facility; which may prove difficult within the time-scale of the project. In contrast, the approval to use the ARTC site, adjacent to the Divalls site, appears to be readily achievable. The opportunity for a behind-the-meter installation at the Goulburn Correctional Facility may present itself as a viable option for future CE4G projects.
The preferred customer for the Solar Farm is a ‘white label’ arrangement with a progressive energy retailer (section 3.3.3). This option is preferred, as this would support a higher sales price and allow the Goulburn Community to support the project, while potentially receiving a discount to their energy bills, by purchasing their energy through the CE4G labelled retail agreement. In addition to residential customers there is the opportunity to sign up local business as well as a large number of sites operated by the Goulburn Council.

Page | 17
- - - - - - - - - - - - - - - - - - - - - - - - - - - - - - - - - - - - - - - - - - - - - - - - - - - - - - - - - - - -
5. SELECTED SOLUTION FINANCIAL PLAN - - - - - - - - - - - - - - - - - - - - - - - - - - - - - - - - - - - - - - - - - - - - - - - - - - - - - - - - - - - -
5.1 Expected Costs Table 2 provides the expected project delivery costs over the expected six month delivery timeline, Q4 2016-Q1 2017 (indicative only). Project costs are based on concept design cost estimates as well as additional allowances for consultancy fees and services.
It is envisaged that the project could be completed as early as Q1 2017 however a project delivery timeline has yet to be formalised.
Table 2 – Estimated project delivery costs across indicative timeline (excluding GST).
Cost Component Q4 2016 Q1 2017 Total
Consultancy fees – design, connection and approvals $29,000 $44,000 $73,000 Managing community investment process $8,000 $12,000 $20,000 Legal, administration and marketing $24,000 $36,000 $60,000 Site preparation and construction $1,006,000 $1,510,000 $2,516,000 Total $1,067,000 $1,602,000 $2,669,000
5.2 Operational Budget Table 3 provides the expected operational budget over the first three years. This includes the lease price tentatively agreed with Divalls as well as allowances for operation, maintenance and financing costs.
An allowance of approximately $99,000 p.a. is provided for repayments on borrowed capital (see section 5.4). It is anticipated that approximately two thirds of the delivery cost of the Solar Farm may need to be funded by the community, with the other third funded through debt financing.
Table 3 – Operational budget (excluding GST). Costs (excl. financing) are indexed to a 2.5% inflation rate.
Operational Component Q2 2017-Q2 2018 Q2 2018-Q2 2019 Q2 2019-Q2 2020
Community investment manager $8,000 $8,000 $8,000 Lease of Bridge Street site $25,000 $26,000 $27,000 Operations manager $40,000 $41,000 $43,000 Maintenance budget $8,000 $8,000 $8,000 Financing costs $99,000 $99,000 $99,000 Sinking fund $15,000 $15,000 $16,000 Total $195,000 $199,000 $208,000
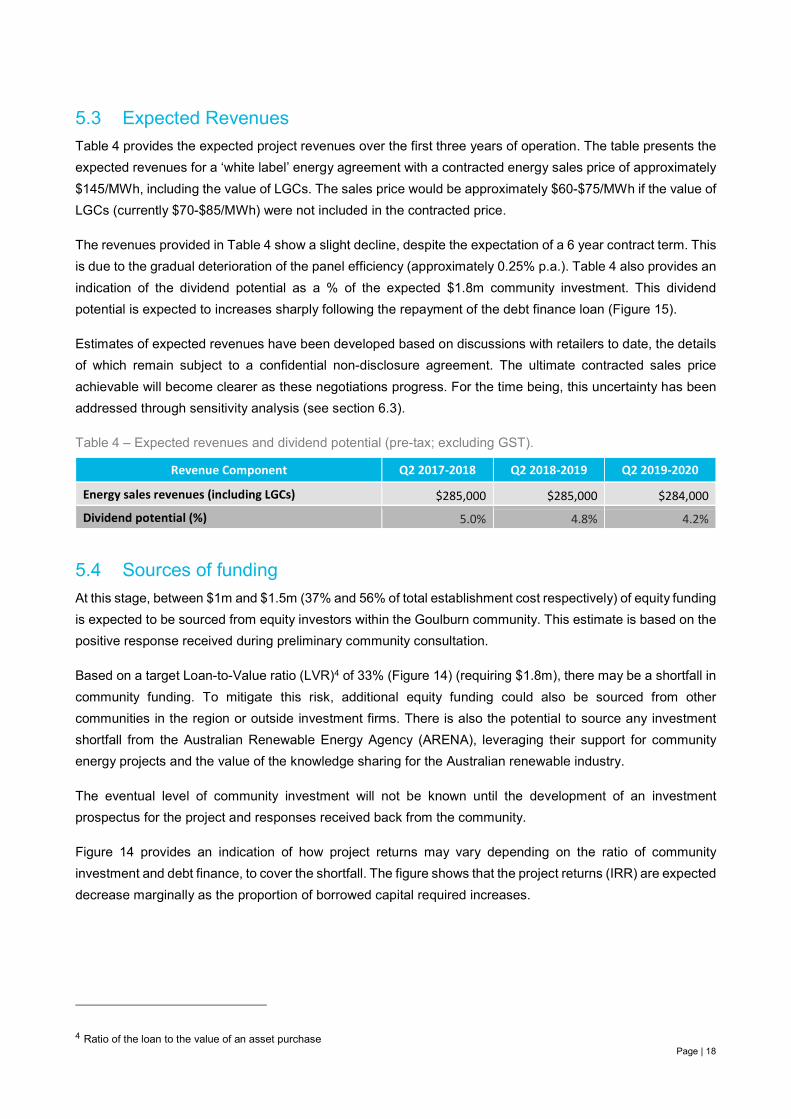
Page | 18
5.3 Expected Revenues Table 4 provides the expected project revenues over the first three years of operation. The table presents the expected revenues for a ‘white label’ energy agreement with a contracted energy sales price of approximately $145/MWh, including the value of LGCs. The sales price would be approximately $60-$75/MWh if the value of LGCs (currently $70-$85/MWh) were not included in the contracted price.
The revenues provided in Table 4 show a slight decline, despite the expectation of a 6 year contract term. This is due to the gradual deterioration of the panel efficiency (approximately 0.25% p.a.). Table 4 also provides an indication of the dividend potential as a % of the expected $1.8m community investment. This dividend potential is expected to increases sharply following the repayment of the debt finance loan (Figure 15).
Estimates of expected revenues have been developed based on discussions with retailers to date, the details of which remain subject to a confidential non-disclosure agreement. The ultimate contracted sales price achievable will become clearer as these negotiations progress. For the time being, this uncertainty has been addressed through sensitivity analysis (see section 6.3).
Table 4 – Expected revenues and dividend potential (pre-tax; excluding GST).
Revenue Component Q2 2017-2018 Q2 2018-2019 Q2 2019-2020
Energy sales revenues (including LGCs) $285,000 $285,000 $284,000 Dividend potential (%) 5.0% 4.8% 4.2%
5.4 Sources of funding At this stage, between $1m and $1.5m (37% and 56% of total establishment cost respectively) of equity funding is expected to be sourced from equity investors within the Goulburn community. This estimate is based on the positive response received during preliminary community consultation.
Based on a target Loan-to-Value ratio (LVR)4 of 33% (Figure 14) (requiring $1.8m), there may be a shortfall in community funding. To mitigate this risk, additional equity funding could also be sourced from other communities in the region or outside investment firms. There is also the potential to source any investment shortfall from the Australian Renewable Energy Agency (ARENA), leveraging their support for community energy projects and the value of the knowledge sharing for the Australian renewable industry.
The eventual level of community investment will not be known until the development of an investment prospectus for the project and responses received back from the community.
Figure 14 provides an indication of how project returns may vary depending on the ratio of community investment and debt finance, to cover the shortfall. The figure shows that the project returns (IRR) are expected decrease marginally as the proportion of borrowed capital required increases.
4 Ratio of the loan to the value of an asset purchase

Page | 19
Figure 14 – graphical representation of how expected project returns may vary against the proportion of project capital borrowed. Results are based on a 5% low-interest ‘green-loan’ facility.
5.5 Project cash flows Figure 15 presents the forecast cash flows for the project over the 25 year project lifecycle period as well as the potential dividend rate as a proportion of community investment. The figure shows the contribution of debt financing and community investment towards the project costs, based on community investment of $1.8m (two thirds of total establishment costs) (section 5.4).
The cumulative cash flows are shown to increase rapidly following the repayment of the borrowed capital after 12 years, ultimately providing approximately $1.9m in returns to investors (nominal). The dividend potential follows a similar profile, tracking in the range of 4% to 5% in early years, then escalating above 10%.
Figure 15 – Forecast cumulative net cash flows for the project based on community investment of $1.8m.

Page | 20
- - - - - - - - - - - - - - - - - - - - - - - - - - - - - - - - - - - - - - - - - - - - - - - - - - - - - - - - - - - -
6. INVESTMENT PROFILE - - - - - - - - - - - - - - - - - - - - - - - - - - - - - - - - - - - - - - - - - - - - - - - - - - - - - - - - - - - -
Financial analysis of The Solar Farm been undertaken to estimate long-term cash flows and determine key and investment performance indicators, including net present value (NPV) simple payback period, return on investment (ROI) and internal rate of return (IRR).
Risk/sensitivity analysis of the results was then undertaken using Monte Carlo simulation to evaluate the potential variation due to the inherent uncertainties surrounding financial analysis.
Important notice regarding financial projections and investment indicators
The indicative investment performance presented in this document relies on projections and other predictive statements that represent our assumptions and expectations. Due to their predictive nature, this information is clearly subject to an inherent level of uncertainty and risk, which may extend beyond that explored in our risk analysis modelling. Actual investment performance may differ from that projected, and no guarantees can be made, neither expressed nor implied, as to the accuracy of projections or indicative investment performance.
The document has been prepared without taking into account your current financial situation or objectives. In considering this information, we recommend obtaining independent advice, in specific consideration of your circumstances.
6.1.1 The financial analysis process
The financial analysis process is illustrated in Figure 16. The figure shows the process used to determine the annual cash flows over the assessment period, as well as the key financial performance indicators and sensitivity outputs. The assumptions underpinning the financial analysis are provided in Appendix A.
Figure 16 – Financial modelling process

Page | 21
6.2 Financial Analysis Results Table 5 provides the financial analysis results over the 25 year assessment period, based on the information presented in section 5. The results show a marginally positive net present value (NPV) of $29,000 and an indicative IRR of 5.1%. The project has annualised net annual revenues (real) (includes loan repayments) and a breakeven period of approximately 17 years.
The results indicate positive but relatively modest investment returns for the project, based on key assumptions including energy sales price, which will become clearer as negotiations with energy retails continue to develop. Figure 17 illustrates the range of investment returns (IRR) across a range of energy sales prices. Should an improved energy sales price be negotiated, project returns could increase to almost 6.5%.
Table 5 – Summary of financial analysis results (excludes GST).
Project Establishment Cost
Net Annual Revenues
(annualised) (real)
Breakeven Period
Internal Rate of Return (IRR)
Return-on-Investment (ROI)
Net Present Value (NPV)
$2,669,000 $101,000 17 5.1% 71% $29,000
Figure 17 – Risk analysis results illustrating variability of investment returns across a range of energy sales prices

Page | 22
6.3 Sensitivity Analysis Sensitivity analysis of the financial analysis results was undertaken to evaluate the inherent uncertainties surrounding the project. This analysis utilised Monte Carlo simulations to model the potential variation of financial performance (IRR) due to potential variations in future energy prices, capital and replacement cost estimates and the modelled energy generation (see Appendix A).
The results of the sensitivity analysis are provided below. Figure 18 illustrates the potential spread of investment return over a frequency distribution, with an expected value of 5.1%. The chart shows that the expected likelihood of the project achieving an IRR < 3% is approximately 20% and the expected likelihood of the project achieving an IRR < 0% is approximately 3%. Alternatively, the expected likelihood of the project achieving an IRR > 7% is approximately 17%.
Figure 18 – Risk analysis results illustrating the IRR distribution

Page | 23
The tornado graph provided in Figure 19 illustrates the relative impact of each uncertainty variable on expected project returns (IRR). The uncertainty surrounding the LCG price is shown to have the most significant influence on project returns, scaling them between 2.5% and 7.5% based on a variability of +/-40% (Appendix A). This high variability factor is based on the market volatility of LCGs as well as its dependence on the Commonwealth government Renewable Energy Target policy.
Electricity price escalation is another sensitivity parameter shown to have a significant influence over returns. Price escalation variability models the uncertainty in the expected energy price growth forecast over the 25 year period (Appendix A). Energy price growth is discussed further in section 3.1.2.
The electricity price also ranks highly in Figure 19, emphasising the importance of ongoing sales price negotiations with retailers. The cost of borrowed capital (interest rate) is shown to have to least influence.
Figure 19 – Risk analysis results illustrating tornado graph of sensitivity variables

Page | 24
- - - - - - - - - - - - - - - - - - - - - - - - - - - - - - - - - - - - - - - - - - - - - - - - - - - - - - - - - - - -
7. ADDITIONAL INFORMATION - - - - - - - - - - - - - - - - - - - - - - - - - - - - - - - - - - - - - - - - - - - - - - - - - - - - - - - - - - - -
7.1 Marketing Plan As The Solar Farm intends to sell its produced energy to pre-signed purchasers, the marketing required by the business is expected to be minimal. However The Solar Farm will remain committed to increasing the awareness of the benefits of community energy projects, in the region and beyond.
5.1 Marketing objectives
� Develop an online presence by developing a website to further increase awareness of the benefits of community energy projects.
� Establish relationships with energy retailers and potential future customers in the region.
5.2 Marketing strategies
Once established, The Solar Farm management team will develop marketing strategies aimed to achieve the marketing objectives.
7.2 Organisational Structure It is anticipated that the organisational of the Solar Farm management team will be a simple two tiered structure. The organisation structure, and elected members, will be developed in the following stages of the project.

Page | 25
- - - - - - - - - - - - - - - - - - - - - - - - - - - - - - - - - - - - - - - - - - - - - - - - - - - - - - - - - - - -
8. CONCLUSION - - - - - - - - - - - - - - - - - - - - - - - - - - - - - - - - - - - - - - - - - - - - - - - - - - - - - - - - - - - -
In developing this business case report for the Solar Farm project, we have evaluated three solar farm concepts in terms of their financial and technical feasibility, with the intention of identifying the most promising option for the development of the business case. The results of this analysis indicated that Option B: 1.2MWp solar farm on the Divalls and ARTC sites presented the greatest benefits.
In agreement with CE4G, we have further developed the 1.2MWp Solar Farm option, including discussions with progressive energy retailers offering ‘white label’ contracts. Such contracts are preferred by the project team as they allow electricity generators (i.e. the Solar Farm) to sell directly to pre-identified customers (i.e. the Goulburn community) via a retailer, which would allow the project to be more readily supported by the community as well as sharing the potential benefits. As an indication, this would require a community group of between 250 and 500 residential customers (or equivalent non-residential customers).
Discussions with the preferred energy retailer(s) are ongoing and currently subject to a confidential non-disclosure agreement to support purchase price negotiations. At this stage, the expected energy sales price is based on discussions to date, with sensitivity analysis used to capture uncertainty.
Based on the results of our financial analysis, the 1.2MWp Solar Farm project displays relatively modest investment returns over the expected 25 year project lifecycle. An expected return (IRR) of 5.1% was observed based on a community investment of $1.8m, approximately two-thirds of the total project establishment cost ($2.76m), with the remainder sourced via-debt finance. The expected return (IRR) was shown to decrease marginally with increasing debt financing.
The results of the sensitivity analysis showed that variations in the achievable energy sales price (LCG price and electricity price) presented the greatest influence over investor returns. This emphasises the importance of ongoing sales price negotiations with retailers; should an improved energy sales price be negotiated, project returns of 6.5% may be achievable.

Page | 26
- - - - - - - - - - - - - - - - - - - - - - - - - - - - - - - - - - - - - - - - - - - - - - - - - - - - - - - - - - - -
APPENDIX A - - - - - - - - - - - - - - - - - - - - - - - - - - - - - - - - - - - - - - - - - - - - - - - - - - - - - - - - - - - -
Assumptions
The assumptions forming the basis of the financial analysis are provided in Table 6, Figure 20 and Figure 21.
Table 6 – Financial analysis assumptions
Assumption Value Comments
Assessment period 25 years Consistent with major plant and equipment upgrade works
Discount rate (nominal) 5% Based on estimated cost of capital
General price inflation rate 2.5% Midpoint of Reserve Bank of Australia targets
Electricity price escalation Figure 20 Based on Australian Energy Market Operator (AEMO) forecasting
Energy price escalation Figure 20 Based on AEMO and Clean Energy Council forecasts
LGCs price escalation Figure 20 Based on energy price forecasts until 2030; then static
Electricity sales – target price $0.076/kWh Target for ‘white label’ agreement sales price
Emissions intensity electricity (EIE) 0.96 kg CO2-e/kWh National Greenhouse Accounts factors August 2015
EIE escalation Figure 21 Based on Treasury carbon price modelling
Generation efficiency deterioration -0.25% Design estimate
Cost of capital 5% Based on low-interest ‘green loan’ facilities
Figure 20 – Assumed price indices for long-term projections. Electricity price and LGCs price index reflect an envisaged 6 year constant price contract period.
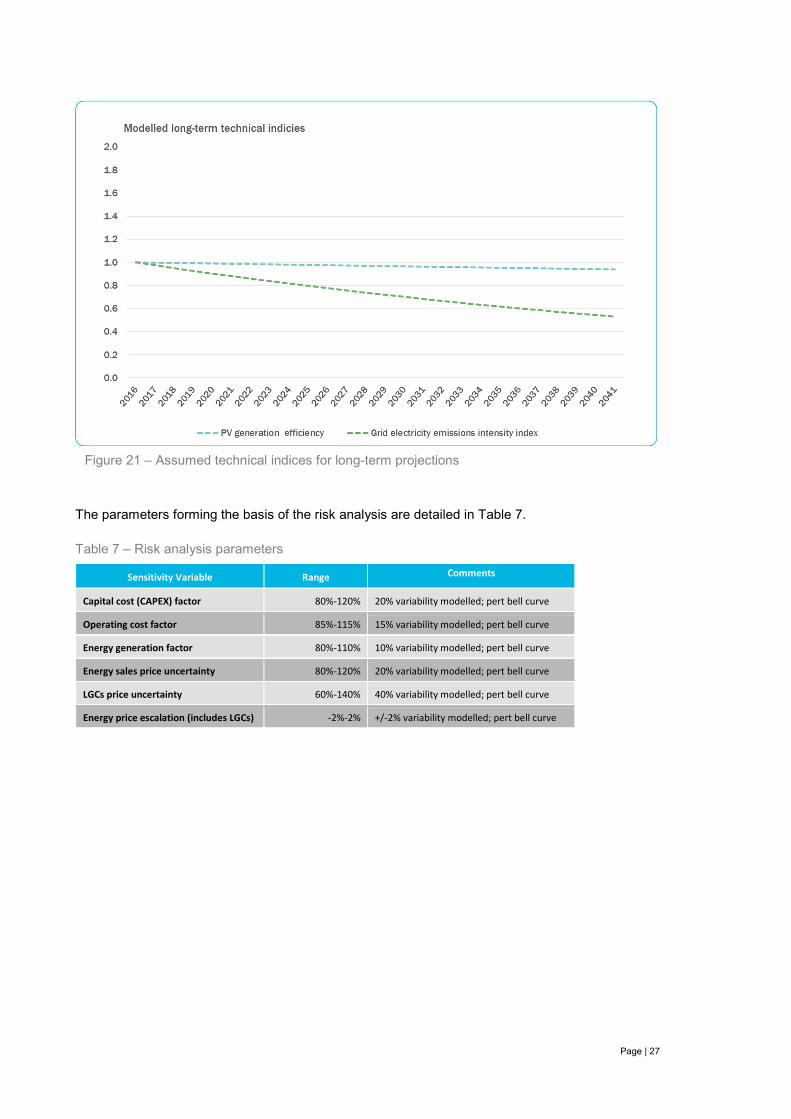
Page | 27
Figure 21 – Assumed technical indices for long-term projections
The parameters forming the basis of the risk analysis are detailed in Table 7.
Table 7 – Risk analysis parameters
Sensitivity Variable Range Comments
Capital cost (CAPEX) factor 80%-120% 20% variability modelled; pert bell curve
Operating cost factor 85%-115% 15% variability modelled; pert bell curve
Energy generation factor 80%-110% 10% variability modelled; pert bell curve
Energy sales price uncertainty 80%-120% 20% variability modelled; pert bell curve
LGCs price uncertainty 60%-140% 40% variability modelled; pert bell curve
Energy price escalation (includes LGCs) -2%-2% +/-2% variability modelled; pert bell curve


