B28 A STUDY OF BEHAVIOURAL FINANCE: INDUSTRY–BASED OVERREACTION AND UNDERREACTION IN MALAYSIA BY ALYSA WONG TSEU MUN CHIA GENG SENG CHIN SU TENG LEE JIA LING WONG KAH YEN A research project submitted in partial fulfillment of the requirement for the degree of BACHELOR OF BUSINESS ADMINISTRATION (HONS) BANKING AND FINANCE UNIVERSITI TUNKU ABDUL RAHMAN FACULTY OF BUSINESS AND FINANCE DEPARTMENT OF FINANCE APRIL 2015
Transcript
B28
A STUDY OF BEHAVIOURAL FINANCE:
INDUSTRY–BASED OVERREACTION AND
UNDERREACTION IN MALAYSIA
BY
ALYSA WONG TSEU MUN
CHIA GENG SENG
CHIN SU TENG
LEE JIA LING
WONG KAH YEN
A research project submitted in partial fulfillment of the
requirement for the degree of
BACHELOR OF BUSINESS ADMINISTRATION
(HONS) BANKING AND FINANCE
UNIVERSITI TUNKU ABDUL RAHMAN
FACULTY OF BUSINESS AND FINANCE
DEPARTMENT OF FINANCE
APRIL 2015
A Study of Behavioural Finance: Industry-based Overreaction and Underreaction in Malaysia
ii
Copyright @ 2015
ALL RIGHTS RESERVED. No part of this paper may be reproduced, stored in a
retrieval system, or transmitted in any form or by any means, graphic, electronic,
mechanical, photocopying, recording, scanning, or otherwise, without the prior
consent of the authors.
A Study of Behavioural Finance: Industry-based Overreaction and Underreaction in Malaysia
iii
DECLARATION
We hereby declare that:
(1) This undergraduate research project is the end result of our own work and
that due acknowledgement has been given in the references to ALL
sources of information be they printed, electronic, or personal.
(2) No portion of this research project has been submitted in support of any
application for any other degree or qualification of this or any other
university, or other institutes of learning.
(3) Equal contribution has been made by each group member in completing
the research project.
(4) The word count of this research report is 15772 words.
Name of Student: Student ID: Signature:
1. ALYSA WONG TSEU MUN 11ABB04138
2. CHIA GENG SENG 11ABB04276
3. CHIN SU TENG 11ABB05875
4. LEE JIA LING 11ABB04813
5. WONG KAH YEN 11ABB04098
Date: 17th April 2015
A Study of Behavioural Finance: Industry-based Overreaction and Underreaction in Malaysia
iv
ACKNOWLEDGEMENT
First and foremost, we would like to express our deepest gratitude to our
supervisor, Mr. Lim Chong Heng for the valuable guidance and advice. He
inspires us greatly to work in this project. We also would like to thank him for
showing his willingness to motivate us contributed tremendously to our research.
We would like also thank our second examiner, Mr. Chong Tun Pin, for further
enlightening our research project with valuable comments and suggestions.
In addition, we would like to express million thanks to our research coordinators,
Cik Nurfadhilah Binti Abu Hasan and Mr. William Choo Keng Soon for the
guidance and ready assistance throughout the completion of this study.
Besides, we would like to thank the authority of Universiti Tunku Abdul Rahman
(UTAR) for providing us with a good environment and facilities to complete this
research. We able to obtain useful information in the library and contributed to our
research.
Finally, an honorable mention goes to our families and friends for their
understanding and support on us in completing this research. Without helps of the
particular that mentioned above, we would face many difficulties while doing this
research.
A Study of Behavioural Finance: Industry-based Overreaction and Underreaction in Malaysia
v
DEDICATION
We would like to dedicate this final year project to:
Mr. Lim Chong Heng
Our supervisor who has guided and supported us all the time during the process of
this research with constructive feedbacks and precious encouragements.
Parents
Our respective parents who have been our constant source of inspiration and given
us the drive and discipline to tackle any task with enthusiasm and determination.
Team Members
All the members who have played respective roles while completing this research
project and the full cooperation and tolerance given at all times.
Thank You.
A Study of Behavioural Finance: Industry-based Overreaction and Underreaction in Malaysia
vi
TABLE OF CONTENTS
Page
Copyright page ………………………………………………....…. ii
Declaration ……………………………………………………..…. iii
Acknowledgement ……………………………………………..…. iv
Dedication ……………………………………………………...…. v
Table of Content…………………………………………………… vi
List of Tables …………..……………………………………….…. ix
List of Figures ………………………………………………….….. x
List of Abbreviations …..………………………………………..… xi
List of Appendices…………………………………………………. xii
Preface ………………………………………..………………….… xiii
Abstract ……….…………………………………………………… xiv
CHAPTER 1 INTRODUCTION…………………………………. 1
1.1 Background of Study ………………………………. 1
1.2 Problem Statement ……….………………………… 7
1.3 Objectives of Study………………………................ 8
1.4 Research Questions of Study ………………............ 9
1.5 Hypothesis of Study ….…..…………..……............. 9
Figure 4.2.1.4: 2008 Monthly Residual Return - All Five Sectors 50
Figure 4.2.2.1: Number of Residential Units, Malaysia from 2007Q4 54
to 2008Q4
A Study of Behavioural Finance: Industry-based Overreaction and Underreaction in Malaysia
xi
LIST OF APPENDICES
Page
Appendix 3.2.1: 30 Selected Stocks in Consumer Sector 71
Appendix 3.2.2: 30 Selected Stocks in Industrial Sector 72
Appendix 3.2.3: 30 Selected Stocks in Plantation Sector 73
Appendix 3.2.4: 30 Selected Stocks in Properties Sector 74
Appendix 3.2.5: 30 Selected Stocks in Trading and Services Sector 75
Appendix 3.2.6: 30 Listed Stocks in KLCI and their Respective Industry 76
A Study of Behavioural Finance: Industry-based Overreaction and Underreaction in Malaysia
xii
LIST OF ABBREVIATIONS
ARR Average Residual Return
CARR Cumulative Average Residual Return
EMH Efficient Market Hypothesis
IPC Infrastructure Project Company
ISIS Islamic State in Iraq and Syria
KLCI Kuala Lumpur Composite Index
MPT Modern Portfolio Theory
MYR Malaysia Ringgit
NASDAQ National Association of Securities Dealers Automated
Quotation
NYSE New York Stock Exchange
RR Residual Return
S&P 500 Standard & Poor’s 500
U.S. United States
A Study of Behavioural Finance: Industry-based Overreaction and Underreaction in Malaysia
xiii
PREFACE
In this era, stock markets, serving as vital sources of capital, have contributed
significantly to the economic growth of a country. In other words, the
performance of the stock market may not only influence an investor’s wealth, but
also a country’s wealth. Many financial economists and statisticians believe the
stock markets can be served as the well predictors of the future direction of a
country’s economy.
As a result, the studies on stock market behaviours have been more and more
prevalent. However, two conflicting theories exist in explaining the behaviours of
stock market, specifically, the Efficient Market Hypothesis (EMH) and
Behavioural Finance. Although EMH is still greatly accepted by investors, there
are many unexpected events happened such as crisis, likely to challenge the theory.
Hence, this study intends to examine the Malaysian stock market irrational
behaviours, specifically investors’ overreaction and underreaction, in relation to
behavioural finance, a relatively new developed field in finance which suggests
the stock markets are inefficient due to the investors’ irrational behaviours.
With a better understanding of the Malaysian stock market behaviours, the
investors see the opportunity excelling in making investments and maximize their
investment returns in the stock market, with better investment management skills.
Furthermore, researchers can better explain the historical and current conditions of
Malaysian stock market, while forecasting the future world economic outlook by
employing the behavioural models.
A Study of Behavioural Finance: Industry-based Overreaction and Underreaction in Malaysia
xiv
ABSTRACT
Among the historical studies in relation to stock market, two conflicting theories,
namely Efficient Market Hypothesis (EMH) and Behavioural Finance gain great
attention and controversy. Despite EMH proposes markets are efficient,
Behavioural Finance highlights that market inefficiencies such as overreaction and
underreaction serve as one of the sources of market trends or some extreme events
such as crisis. Therefore, the primary objective of this study is to show the
existence of irrational investor behaviours specifically overreaction and
underreaction phenomenon in five different Malaysian industries, namely
consumer, plantation, properties, industrial, and trading and services sectors, from
2004 to 2012. This study concludes that overreaction happened during 2008 in
properties, and trading and services sectors, while underreaction only happened
during 2005 in plantation sector. The empirical result shows that EMH does not
hold in Malaysian stock market especially during 2005 and 2008, as investors
overreacted and underreacted inefficiently in the market.
A Study of Behavioural Finance: Industry-based Overreaction and Underreaction in Malaysia
Undergraduate Research Project Page 1 of 77 Faculty of Business and Finance
CHAPTER 1: INTRODUCTION
1.1 Background of Study
Despite the prevalent joke said “Wall Street indexes predicted nine out of the last five
recessions” signifying the economy and the stock market are not the same, the stock
markets are well predictors of the business cycle even though they do not often move
with the economy in lockstep. As a result, the studies regarding the behaviour of
stock market have been more and more significant. Many researchers attempt to
examine the stock market behaviour in order to forecast the future stock prices as well
as the direction of the economy. However, one must understand that the stock market
performance and the investors’ financial decisions are bi-directionally correlated.
Generally, in the context of financial decisions, it consists of conflicting theories
which gain great attention and controversy, specifically the Efficient Market
Hypothesis (EMH) and the Behavioural Finance.
Around the 1970s, the EMH was widely accepted by the financial economists and
statisticians. Earlier empirical studies on the behaviour of stock market are based on
the assumption of efficient market. The EMH assumes that the economic agents or
market participants are “rational” and the stock prices will fully reflect all the
information available in the market. Basically, when new information arises, the news
spreads very quickly and is incorporated instantaneously into the securities prices
without any delay. Thus, all the securities are priced correctly as the market prices
reflect the fundamental values of the securities. Besides, EMH is also associated with
the idea of “random walk”, a theory which proposes that the past movement or
direction of the stock prices cannot be used to predict its future movement as the
changes of stock prices are unpredictable and random. Hence, neither technical
analysis nor fundamental analysis techniques would help investors to earn excess
risk-adjusted returns.
A Study of Behavioural Finance: Industry-based Overreaction and Underreaction in Malaysia
Undergraduate Research Project Page 2 of 77 Faculty of Business and Finance
Since the beginning of the twenty-first century, the application of EMH in explaining
the stock market behaviours had become far less common, owing to the regular
occurrences of stock market anomalies as well as the emergence of Behavioural
Finance. The stock market anomalies refer to the deviation or departure from the
intrinsic value of securities. Specifically, the price reversal and momentum effect are
the major anomalies studied since the 1980s. The price reversal assumes that the prior
losers tend to be the future winners over the long run and it is consistent with the
overreaction hypothesis. In contrast, the momentum effect proposes that the stock
market exhibits significant return continuation in the short run and it is often
attributed to the underreaction hypothesis. The discoveries of the market anomalies
provide evidence to show that the stock returns are predictable, which seem to be
inconsistent with the EMH.
Recently, another group of researchers found that investors are subject to cognitive
biases, causing them to behave irrationally when making financial decisions.
Therefore, the researchers believe that they can better explain the stock market
inefficiencies based on the behavioural finance models. Behavioural finance is a new
approach that seeks to explain the stock market behaviours from the behavioural
viewpoint. Basically, it focuses on two building blocks, which are cognitive
psychology and limit of arbitrage. Cognitive psychology suggests that investors
systematically make mistakes in the way they think, which eventually lead to
inappropriate investment decisions and price distortions in the financial markets.
Typical psychological biases include overreaction, overconfidence, representativeness,
anchoring, conservatism, loss aversion, herding, and the like. On the other hand, limit
to arbitrage claims that the impact of irrationality on market prices can be substantial
and long-standing. This study only emphasizes on the cognitive psychology as the
goal is to examine the existence of market inefficiencies as a consequence of the
investors’ behavioural biases in Malaysian stock market.
A Study of Behavioural Finance: Industry-based Overreaction and Underreaction in Malaysia
Undergraduate Research Project Page 3 of 77 Faculty of Business and Finance
The behavioural finance highlighted that the stock market inefficiencies such as
overreaction and underreaction resulting from the price reversal and momentum
effect, serve as the sources of the market trends or some extreme events like bubbles
and crashes. The market overreaction implies that excessive investor optimism or
pessimism could cause the stock prices to deviate temporarily from its fair value. This
overreaction phenomenon can be supported by the Investor Contrarian Strategy,
holding that investors could earn abnormal return by buying the past loser stocks and
selling the past winner stocks in the anticipation that the stock prices will reverse. On
the contrary, the market underreaction suggests that the securities prices tend to
underreact to the unexpected good or bad news. One strategy that is reconciled with
the underreaction phenomenon is the strategy of momentum, in which the investors
simultaneously buy the former winners and sell the former losers, would eventually
obtain abnormal profits.
Many researchers believed that these market inefficiencies can be attributed to the
behavioural biases, including overconfidence, representativeness bias, herding,
anchoring, and conservatism bias. Many studies reported that overconfidence,
representativeness heuristic, and herding are strongly related to the long term reversal
effect and the overreaction hypothesis. Overconfidence suggests that market
participants tend to be overly confident in the precision of their private information
and subsequently trade more frequently than the rational investors, causing the stocks
to be overvalued or undervalued. In other words, overconfidence would lead to the
market overreaction, which eventually lead to high trading volume, volatility and
price distortion in the stock market. On the other hand, representativeness heuristic
refers to the tendency of market participants to interpret the future performance of a
given firm based on its historical performance, causing the securities to be mispriced.
Furthermore, herding implies that market participants tend to follow the majority
action as they seek preference for conformity with the market, in the presence of any
surprises of events or news. Consequently, it leads to stock market overreaction.
A Study of Behavioural Finance: Industry-based Overreaction and Underreaction in Malaysia
Undergraduate Research Project Page 4 of 77 Faculty of Business and Finance
The bursting of dot-com bubble has clearly indicated the existence of stock market
overreaction, owing to the investors’ behavioural biases. During 1992 to 2000,
software was seen a highly profitable investment and the software development
companies were strong performers on the stock exchange. Many individual and
institutional investors had made a gain in the stock market. Consequently, it created a
high degree of confidence level among the investors. Also, many investors believed
that these remarkable performance of technology firms tend to reproduced in the
following years. Owing to these cognitive biases, investors aggressively invest in the
technology stocks, causing a stock market overreaction. In particular, National
Association of Securities Dealers Automated Quotation (NASDAQ) stock composite
index, which emphasizes on technology stocks, exploded from 600 points to almost
5000 points. However, in March 2000, the dot-com bubble burst when the NASDAQ
Composite index, peaked at 5,048.62. When the dot-com bubble collapsed and stock
prices fell, investors sell their shareholdings as quickly as possible. Eventually, the
NASDAQ Composite index had lost 78% of its value. This case clearly indicated that
financial bubble can be the result of market overreaction, due to the irrational
behaviours of investors.
Furthermore, one known instance of winner (loser) stock lately happened is Apollo
Education Group which traded at NASDAQ. The Group’s revenue continued to fall
dramatically since 2010, owing to the sharp declines in student enrolment. Investors
who subject to the representative bias tend to believe that the Group will continue
perform badly in the following years. As a result, Apollo’s shares were gradually
being ranked as loser stocks, along with constant revenue reductions over the years,
especially with 55.1% drops of net income from $553 million to $248.5 million on
2010. However, Apollo’s shares increased 14.2% as the announced adjusted earnings
of $1.04 per share in the first quarter of 2014 had beaten the Wall Street analyst
estimates of $0.90 per share. Since the expectation on earnings failed to materialize,
the share prices are likely to increase as investors recognized that Apollo’s shares are
undervalued due to the market overreaction. With the share price appreciation,
Apollo’s shares now are ranked as the winner stock. Thus, it is believed that market
A Study of Behavioural Finance: Industry-based Overreaction and Underreaction in Malaysia
Undergraduate Research Project Page 5 of 77 Faculty of Business and Finance
overreaction, as past loser stock transformed into winner stock over time, can be
attributed to the representativeness heuristic.
While in Malaysia context, the Kuala Lumpur Composite Index (KLCI) experienced
a dramatic fall during January 2013, when the 13th
General Election was around the
corner. The investors were insecure with the outcome of the coming election and
chosen to quickly sell off their stocks holding in order to reduce the risks. This is
because the stock prices will drop if there are changes in the leading politic party as
the changes in regulatory rules and regulation may happen possibly afterwards and
affect significantly companies’ profits and economy. As a result of the huge shares
selling from investors, the Malaysian stock market has experienced a sharp decline
and the KLCI has made a loss. Besides, there is a slump in Malaysian stock market in
November and December of 2014 due to the recent crash in global crude oil prices.
The oil and gas products have significant contribution to the government revenues in
Malaysia. The market is worried about the shrink in oil revenues may increase the
country’s budget deficit as the oil revenues are important for government funding.
Consequently, the local stock market tumbled as the crude oil prices continue to
decline in the global markets. In short, Malaysian investors may tend to overreact to
any news and events (domestic or economical events) and in response to impacting
the country’s economy. These recent cases have demonstrated the volatility of stock
returns in Bursa Malaysia. Hence, it is suspected that overreaction occurs while EMH
does not hold, in the Malaysian stock market.
In contrast, several studies revealed that the behavioural biases, specifically the
anchoring and conservatism bias, can be the important sources of stock market
underreaction. These cognitive biases are closely associated to the conservative
decision making. Anchoring assumes that the market participants overly rely on
certain reference point, known as “anchor”, when making financial decisions. When
new information arises, investors insufficiently adjust their initial anchor, causing the
market underreaction. On the other hand, conservatism bias refers to the tendency of
market participants to update their existing beliefs more slowly and weakly than the
A Study of Behavioural Finance: Industry-based Overreaction and Underreaction in Malaysia
Undergraduate Research Project Page 6 of 77 Faculty of Business and Finance
rational way they should be. Since investors do not correctly react and process the
new information, it causes market underreaction and returns continuation in the
following periods.
The phenomenon of underreaction in stock market as a consequence of the
psychological biases is shown clearly in the case of destabilization of Iraq in 2014.
The situation in Iraq started to get worsened as more and more cities throughout the
region have been subject to the attacks from the Sunni militant group, which led by
the Islamic State in Iraq and Syria (ISIS). However, the stock markets did not react
negatively toward the destabilization of Iraq. In the second week of June 2014, the
Standard & Poor’s 500 (S&P 500) only showed a minor drop of 0.7%, after a rally for
three weeks, which approximately added 3.8% to the index. Also, the crude oil
futures have increased about 5% within first and second week in June. It is observed
that the investors did not fully incorporate the new information, but rather to
gradually process it over the time, causing an underreaction phenomenon in stock
market. Therefore, it is believed that the cognitive biases can cause stock market to
behave in an irrational way.
This study presents an in-depth discussion of the stock market inefficiencies,
specifically the overreaction and underreaction to the unexpected news or events. The
stock market anomalies uncovered in the past few decades pose a major challenge to
the assumptions of EMH as it provides significant evidence to show the existence of
predictability in stock markets. To meet the challenge, this study is conducted based
on the behavioural finance model, which uses behavioural traits to explain the
investors’ irrationality and stock market inefficiencies. Behavioural finance holds that
the emotion and psychology of investors may influence their decisions, causing them
to behave in unpredictable or irrational ways. Thus, it is believed that the use of
behavioural models can provide better explanation for the stock market behaviour.
The main goal of this study focuses on investigating the evidence of stock market
inefficiencies, specifically the overreaction and underreaction as a result of the
investors’ irrationality in Malaysia.
A Study of Behavioural Finance: Industry-based Overreaction and Underreaction in Malaysia
Undergraduate Research Project Page 7 of 77 Faculty of Business and Finance
1.2 Problem Statement
Studies on behavioural finance effect on the stock price are relatively new field in the
financial market. The psychological effects of investor decision have been
acknowledged as one of the important determinants of stock prices recently.
Therefore, researches on this topic, especially on the empirical testing of behavioural
finance are limited as most of the previous studies focus on the theoretical and
literature review of this area. For example, Ritter (2003) and Stracca (2004) provided
a detailed review on how the psychological traits in investors affect the asset pricing
which are against the traditional framework which assumed that investors are rational
in efficient market due to their inability to capture the market anomalies. Although
the comprehensive methods on testing the behavioural finance have been provided
but there are still insignificant numbers of researches paying attention on it.
Apart from that, the traditional finance theory, rational expectation framework
implied that the stock price should be equal to the discounted present value of future
cash flow which means there should not be any abnormal returns for all investors.
Although EMH is still greatly accepted by investors, there are many unexpected
events happened that are likely to challenge the theory. For instance, McCarthy,
Solomon and Mihalek (2012) argue that Fama’s classic EMH does not hold in the
recent financial crisis in United States and human behaviour plays an important role
in future financial market. Barberis (2011) also mentions that the psychology impact
from investor is required to understand the crisis happened which violate the EMH.
He argues that the bubble formation of asset prices could be due to the investor
beliefs towards the stock market during crisis. If investors are bullish, the bearish one
will exit the market and asset prices are most likely to be overvalued.
Despite the recent financial crisis proved that the market is inefficient, there are
researchers found that the EMH is still hold. For example, Arthur, Holland, LeBaron,
Palmer and Tayler (1996) argued that both the traditional efficient view and traders’
behavioural view are valid under different circumstances. Another study from
A Study of Behavioural Finance: Industry-based Overreaction and Underreaction in Malaysia
Undergraduate Research Project Page 8 of 77 Faculty of Business and Finance
Malkiel (2011) also supports the statement and critics that the hypothesis does not
state that bubbles in stock prices are not likely to be formed. The market theory also
does not deny that the investor behaviour will have significant impact on the returns
and both efficient market theory and behavioural finance can be coexisting in
explaining the recent crisis.
Additionally, there have been extremely limited secondary-data studies done on
examining overreaction in Malaysia. Ali, Nassir, Hassan and Abidin (2010) studied
on how events and news affected Malaysian market in term of overreaction, with only
time scope from 1987 to 2006. Besides, no specific study was found to study on
industry overreaction specifically in Malaysia. Since there are contradict theories in
different researchers in explaining the market anomalies that happened recent years, it
is important to study on whether the investor behaviour can have profound impacts
towards the stock market in Malaysia.
1.3 Objectives of Study
The objectives of the study are as below:
The general objective of this study is to show the existence of irrational behaviour
among investors in the Malaysian stock market.
The specific objective of this study is to investigate the existence of overreaction
effects which affect the Malaysian stock market in different industries, namely
consumer, industrial, plantation, properties, and trading and services sectors from
year 2004 to year 2012.
A Study of Behavioural Finance: Industry-based Overreaction and Underreaction in Malaysia
Undergraduate Research Project Page 9 of 77 Faculty of Business and Finance
1.4 Research Questions of Study
The study has formed a research question, as follows:
Does overreaction phenomenon exist in the Malaysian stock market,
specifically in different industries, namely consumer, industrial, plantation,
properties, and trading and services sectors from year 2004 to year 2012?
1.5 Hypothesis of Study
The study has also presented null and alternative hypotheses for the main hypotheses
formed. The hypothesis is:
H0: Malaysian stock market does not exhibit any overreaction effects in
different industries, namely consumer, industrial, plantation, properties, and
trading and services sectors from year 2004 to year 2012.
H1: Malaysian stock market does exhibit any overreaction effects in different
industries, namely consumer, industrial, plantation, properties, and trading
and services sectors from year 2004 to year 2012.
1.6 Significance of Study
The findings from this study have theoretical and empirical implications. Standing
from the institutional and individual investors’ point of view, this study can serve as a
useful guideline for them to manage their portfolio. The study explained the
behaviour of stock market from the behavioural perspective, which is known as
behavioural finance. Typically, behavioural finance deals with the influence of
emotion and psychology on the financial decisions of investors. Therefore, this study
will allow investors to have better understanding of the stock market condition in
Malaysia as it provides a clear picture of the institutional and individual investors’
A Study of Behavioural Finance: Industry-based Overreaction and Underreaction in Malaysia
Undergraduate Research Project Page 10 of 77 Faculty of Business and Finance
actual behaviour and how they differ from each other when they receive the same
information. Consequently, it can make investors aware of these behavioural
tendencies and increase their insights into the stock market returns. As a result,
institutional and individual investors can enhance their stock market predictability
and thus, improve their investment strategies and make more accurate analysis in
Malaysian stock market. Since this study focuses on overreaction and underreaction
phenomenon in stock market, by identifying its existence, investors can have a better
insight on what investment strategies in what circumstances, upon any event signal.
From the view of researchers, this study can be served as a foundation for the future
research. The study borrows the ideas from previous studies to investigate the
behaviour of stock markets on the basis of behavioural finance. According to Toh and
Ahmad (2010), behavioural finance is a rapidly growing field in both developed and
emerging stock markets. By taking the human psychology into account, it could better
explain the conditions of Malaysian stock market. Therefore, it is believed that this
study carries specific significance for the further investigation in stock market in
consideration of the behavioural factors.
1.7 Chapter Layout
The study basically comprises of five sections: Chapter 1 presents an introduction of
study including the background of study, problem statement, objectives, research
questions, hypotheses, and significance of the study. Chapter 2 presents the literature
review which reviews some theories lie behind the study which are EMH, Market
Anomalies, Behavioural Finance, Overreaction and Underreaction. Chapter 3
discusses the proposed methodology of the study, namely its scope of study and
research design. Chapter 4 mainly focuses on the data analysis which includes the
interpretation of result and discussion of major findings of the study. Lastly chapter 5
files a conclusion with some policy implications, study’s limitations and
recommendations for future researchers.
A Study of Behavioural Finance: Industry-based Overreaction and Underreaction in Malaysia
Undergraduate Research Project Page 11 of 77 Faculty of Business and Finance
CHAPTER 2: LITERATURE REVIEW
2.1 Introduction
This chapter reviews the literatures related to the study. These literatures include the
studies emphasized on the stock market overreaction and underreaction, as well as the
well-known conflicting theories in stock market, specifically the EMH and
Behavioural Finance.
2.2 Efficient Market Hypothesis (EMH)
EMH, one of the traditional finance theories, has been the central of attention of many
financial economists and statisticians around 1970s. The EMH assumes that the stock
market is efficient, in which the market participants behave rationally and process
correctly all the available information, thus a security’s price reflects its fundamental
value (Sewell, 2011). In other words, no securities are mispriced as all the available
information is fully incorporated into the securities prices. Basically, the nature of
EMH is built on two pillars (Degutis and Novickyte, 2014). Firstly, in an efficient
market, the current market prices reflect all the available information. Secondly, in an
efficient market, the market participants are not allowed to earn excess risk-adjusted
return. Besides, the EMH framework also asserts the existence of rational market
participant (Hamadi, Rengifo and Salzman, 2005). Barberis and Thaler (2003) stated
that this rationality assumption can be characterized by two aspects. Firstly, the
market participants correctly update their beliefs by fully processing all the relevant
information. Secondly, the market participants make normatively acceptable financial
decisions.
A Study of Behavioural Finance: Industry-based Overreaction and Underreaction in Malaysia
Undergraduate Research Project Page 12 of 77 Faculty of Business and Finance
In order to earn a return higher than the market return, many investors attempt to
identify the mispriced securities by using various forecasting techniques, including
the technical analysis and fundamental analysis. Technical analysis suggests the use
of historical stock prices to forecast the future stock prices, whereas fundamental
analysis seeks to emphasize on the company financial information such as earnings
and asset values to help investors to choose the undervalued securities (Malkiel,
2003). However, EMH claims that none of these forecasting and valuation techniques
are effective for investors to earn abnormal returns (Clarke, Jandik and Mandelker,
2001). This is because a market is said to be “efficient” when the current securities
prices fully reflect all the available information (Fama, 1970). As the securities prices
adjust quickly to the new information, no one can foreseeably beat the market.
In addition, the EMH suggests that it is extremely difficult and unlikely for investors
to profit from predicting the movement of stock prices (Clarke et al., 2001). This is
because stock price changes only in the presence of new information. In an efficient
market, stock prices fully incorporate all the available information. In other words,
the security prices adjust before the investors have time to trade on and profit from
the new piece of information. Therefore, it is believed that all the securities are fairly
priced. Moreover, Gupta and Yang (2011) proposed that EMH is connected with the
idea of “random walk”. This random walk theory implies that the price changes today
will only reflect today’s news and it will be independent of the price changes
yesterday. Since the new information is unpredictable, the securities prices are
expected to change randomly in an unpredictable manner. Hence, there is no room for
investors to earn additional risk-weighted returns.
According to Fama (1970), the market efficiency is generally divided into three levels:
the weak form, semi-strong form, and the strong form. The weak form of EMH states
that the current asset prices fully incorporate the information related to the historical
prices only (Dimson and Mussavian, 1998). It implies that it is impossible to profit
from analyzing the data on past stock price series. The semi-strong form of EMH
asserts that the current asset prices fully reflect the information about the historical
A Study of Behavioural Finance: Industry-based Overreaction and Underreaction in Malaysia
Undergraduate Research Project Page 13 of 77 Faculty of Business and Finance
prices and all the current publicly available information (Clarke et al., 2001). In the
semi-strongly efficient market, it is believed that nobody can earn excess return by
using the information that is publicly available such as the data reported in financial
statement, earnings and dividends announcement, announced merger and acquisition
plans, change in accounting policy, future expectations on inflation and
unemployment, and so on. The strong form of EMH suggests that the current asset
prices adjust instantaneously to all possible information in the market, including both
public and private information (Degutis and Novickyte, 2014). It means that one
should not be able to systematically profit from the trading on insider information.
Over the years, EMH came out as economic terms and reached its peak of popularity
at the end of 19th
century. Many researchers have broadly applied the idea of EMH
into the theoretical models as well as the empirical studies of financial markets.
Numerous studies have indicated that the stock markets are apparently efficient. In
particular, the pioneer studies done by E. Fama have significant contribution to the
field of market efficiency. Fama (1965) found a zero correlation for a sample of 30
Dow Jones Industrial stocks. It implies that the historical stock prices cannot be used
to increase the investors’ expected returns as stock prices follow a pattern called
“random walk”. Moreover, Fama (1970) defined an efficient market as a market
where the current asset prices fully reflect all the information made available to the
market participants. In his study, a number of weak, semi-strong and strong form
market efficiency tests have been performed and the results obtained have presented
evidence in support of EMH. Furthermore, Fama (1998) proven that the idea of EMH
still remains valid as the overreaction of securities prices to information is as common
as underreaction.
In addition, the evidence in favour of EMH were also provided by the other
researchers. Poshakwale (1996) stated that there is weak form efficiency in the Indian
stock market. Also, Chan, Gup and Pan (1997) found evidence supporting the
existence of weak form efficiency in the stock market of eighteen nations, including
Australia, Belgium, Canada, Denmark, Finland, France, Germany, India, Italy, Japan,
A Study of Behavioural Finance: Industry-based Overreaction and Underreaction in Malaysia
Undergraduate Research Project Page 14 of 77 Faculty of Business and Finance
Netherlands, Norway, Pakistan, Spain, Sweden, Switzerland, the United Kingdom
(UK) and the United States (US). Likewise, similar results were obtained in the study
conducted by Dickinson and Muragu (1994) in the Nairobi stock market, as well as
Kim and Shamsuddin (2008) in the Asian stock markets, specifically Hong Kong,
Japanese, Korean and Taiwanese markets. On the other hand, Groenewold and Kang
(1993) analysed the aggregate share price indexes and concluded that the Australian
market is in semi-strong form of market efficiency.
2.3 Anomalies in the EMH
The application of EMH in the financial market has been widely accepted for nearly
thirty years. Nevertheless, the growing number of anomalies discovered in the stock
market poses a major challenge to the EMH as the existence of these anomalies has
questioned the validity of EMH. Basically, the stock market anomalies are the
deviation of securities prices or returns, in which the patterns of the returns are
inconsistent with the EMH (Archana, Safeer and Kevin, 2014). The examples of these
anomalies include the January Effect, Size Effect, Low Price to Earnings, Momentum
Effect, Price Reversal and the like. According to Latif, Arshad, Fatima and Farooq
(2011), some of the anomalies could occur once and disappear, or could occur
frequently and continuously. Among the market anomalies uncovered over the past
few decades, two stand out as they have been receiving a great deal of attention in the
study of stock market behaviours. They are long-term returns reversal and short-term
returns momentum (Barberis, Shleifer and Vishny, 1998).
According to Malkiel (2003), the long term returns reversal or price reversal implies
that former loser stocks tend to outperform the former winner stocks over the period
of three to five years. This predictable return reversal pattern is often compatible with
the market overreaction hypothesis (Ali et al., 2010). As investors tend to react
disproportionately to the new events or new information released, it causes the stock
market to overreact in the initial period and correct itself in the following period.
A Study of Behavioural Finance: Industry-based Overreaction and Underreaction in Malaysia
Undergraduate Research Project Page 15 of 77 Faculty of Business and Finance
Eventually, the investors would earn abnormal profit because the stocks which have
underperformed the market over the past few periods tend to generate higher returns
over the subsequent periods. A number of studies have found significant reversal in
the stock market at longer horizons. De Bondt and Thaler (1985) analysed the New
York Stock Exchange (NYSE) stocks and discovered the long term return reversals
effect was a result of the irrational behaviours of market participants. Similarly,
Chopra, Lakonishok and Ritter (1992) concluded that there is a strong return reversal
pattern in NYSE and the overreaction effect is superior for the small firms.
Furthermore, the findings of Poterba and Summers (1988) and Campbell and
Limmack (1997) showed statistical evidence that stock returns are negatively
autocorrelated, that is, return reversals in the long run, thus supporting the
overreaction hypothesis. In addition, Baytas and Cakici (1999) examined the
international stock markets and proved the return reversal effect in Canada, the UK,
Japan, Germany, France and Italy.
In contrast, the short-term returns momentum asserts that the recent past winners tend
to outperform the recent past losers over the subsequent period, specifically three to
twelve months (Jegadeesh and Titman, 1993). This momentum effect is consistent
with the underreaction hypothesis, which assumes investors tend to underreact the
new or unexpected information (Malkiel, 2003). At first, the stock prices exhibit
underreaction and then gradually adjust itself to the equilibrium level in the following
period. As a result, the former winners (losers) continue to be the future winners
(losers) (Archana et al., 2014). Several studies have documented the evidence of short
run return continuation, which allow the researchers to reject the random walks
theory. Lo and MacKinlay (2011) stated that in the stock market, serial correlations in
the short run are not zero and there are many successive moves in the same direction.
Moreover, Schnusenberg and Madura (2001) investigated the six US stock market
indexes and found evidence in supporting the underreaction hypothesis. Consistently,
the findings of Alrabadi (2012) in Amman Stock Exchange also presented the
existence of stock market underreaction in the arrival of new information. In addition,
Lasfer, Melnik and Thomas (2003) studied the short run price reaction of thirty nine
A Study of Behavioural Finance: Industry-based Overreaction and Underreaction in Malaysia
Undergraduate Research Project Page 16 of 77 Faculty of Business and Finance
international stock market indexes and concluded that investors show underreaction
toward both the unexpected positive and negative news. Yet, the authors argued that
there was reduction in the abnormal returns in the late 1990s.
According to Ali et al. (2010), the long term price reversal pattern and the short term
momentum effect are often characterized as the evidence of stock market
overreaction and underreation. The authors argued that these market inefficiencies
have explicitly shown the existence of excess volatility and returns predictability in
the stock market, appeared inconsistent with the EMH. Together with the other
market anomalies such as the January Effect, Size Effect, and Low Price to Earnings,
it presents a major challenge to the financial economists and statisticians. To meet
these challenges, many researchers conduct their studies by using the models in
which some market participants tend to be irrational.
2.4 Emergence of Behavioural Finance
Behavioural finance is a relatively new developed field in finance that combines the
behavioural and cognitive psychological theory with conventional economics and
finance. It helps to provide explanations to stock market inefficiencies by focusing on
the psychological and behavioural factors (Shiller, 2003). Basically it assumes that
the emotion and psychology of investors may influence their investment decisions,
causing them to behave in an unpredictable or irrational way. Statman (1995) stated
that the cognitive factors would influence the individual investors and portfolio
managers regarding the financial decision making process in terms of risk assessment
and the way they process information and make decisions. As a consequence, the
assets prices tend to move further away from their fair values, resulting in securities
mispricing.
A Study of Behavioural Finance: Industry-based Overreaction and Underreaction in Malaysia
Undergraduate Research Project Page 17 of 77 Faculty of Business and Finance
Shiller (2003) stated that the development of behavioural finance is mainly due to the
regular occurrences of market anomalies and the failure of EMH to explain these
anomalies. According to Alrabadi (2012), the existence of anomalies has clearly
indicated the inefficiencies in stock market. Moreover, Levišauskaitė and Kartašova
(2011) proposed that stock market anomalies are primarily caused by the irrational
behaviours and decisions of investors, owing to their psychological biases. The
market inefficiencies such as overreaction and underreaction as a result of the
investors’ irrational behaviour, suggest that stock returns are predictable, and thus, it
allows investors to beat the market and earn abnormal returns, a situation which
violates the assumptions of EMH (Tripathi and Aggarwal, 2009). Therefore, it is
believed that the stock markets are not expected to be efficient and the investors tend
to behave irrationally at some times. Hence, behavioural finance model seemed to be
a better approach to explain the stock markets behaviours.
According to Barberis and Thaler (2003), there are two buildings blocks for
behavioural finance, specifically the cognitive psychology and limit of arbitrage.
Cognitive psychology principally refers to how actual behaviours of investors in
making financial decisions differ from the rational behaviours assumed in EMH, due
to their preferences or self-beliefs (Ritter, 2003). It suggests that the investors would
make systematic errors in judgment as a result of some cognitive biases (Lee and Lin,
2006). Subsequently, it could cause the investors to form biased expectations toward
the future direction of stock market. Eventually, it leads to excess volatility in the
stock market, causing the securities to be mispriced and the stock market to be
inefficient. The cognitive biases in financial decision makings involve overconfidence,
representativeness, anchoring, conservatism, loss aversion, mental accounting,
herding and the like (Lo, 2005). On the other hand, limit to arbitrage claims that the
irrational decisions made by the investors can have substantial and long-lived impact
on asset prices (Barberis and Thaler, 2003). It assumes that irrational investors tend to
misprice the securities and it is difficult for the rational investors to undo the price
deviations made by the irrational investors.
A Study of Behavioural Finance: Industry-based Overreaction and Underreaction in Malaysia
Undergraduate Research Project Page 18 of 77 Faculty of Business and Finance
In addition, Lo (2005) stated that the behavioural finance models take into account
the irrationalities in investors’ behaviour, including all the cognitive factors and
emotional issues so as to explain the stock market behaviours. Thus, it allows the
situations in which the investors fail to update their beliefs correctly in the presence
of new information or the investors update the new information rationally but make
improper or questionable choices (Barberis and Thaler, 2003). Furthermore,
behavioural models also allow the possibility that market participants may overreact
or underreact to the unexpected news, which may lead to the stock return regularities
or some extreme events like stock market bubbles and crashes (Sharma, 2014).
Therefore, it is believed that taking the behavioural biases, including overconfidence,
representativeness, anchoring and conservatism into consideration could provide a
better understanding of the stock market inefficiencies (Kaestner, 2006).
2.5 Overreaction
Market overreaction shows that stock prices tend to exhibit reversal behaviour over
the long run, that is, the past losing stocks outperform the past winning stocks,
suggesting that predictability exists in stock market returns (Maheshwari and Dhankar,
2014). According to Ali et al. (2010), these return reversals are generally resulting
from the overreaction effect, in which the irrational behaviours of market participants
would eventually lead to abnormal price movements in the stock market. Generally,
investors are subject to cognitive biases and it could cause them to overweight the
new information and make irrational tradings (Ali, Ahmad and Anusakumar, 2011).
In the presence of unexpected good or bad news, investors tend to be overly
optimistic or pessimistic about a particular stock, driving the stock price up or down
to an unreasonable level. Over a period of time, specifically three to five years, the
market corrects its initial price reaction and the stock price slowly reverts back to its
fair value, resulting in a return reversal pattern.
A Study of Behavioural Finance: Industry-based Overreaction and Underreaction in Malaysia
Undergraduate Research Project Page 19 of 77 Faculty of Business and Finance
Maheshwari and Dhankar (2014) stated that investors adopting the contrarian strategy,
which involves buying the prior losers and selling the prior winners, are able to profit
from this market overreaction. By knowing that the market tends to overreact to the
extremely good (bad) news, the contrarian investors assume the winner (loser) stock
prices will be pulled much higher (lower) than its true value (Fung and Lam, 2004).
Therefore, they would apply the contrarian strategy by simultaneously buying the
losing stocks and selling the winning stocks. Over the long run, the market realized its
initial overreaction to the previous information and took corrective action, causing the
stock prices move to the opposite direction. Consequently, the former loser stocks
would generate higher average returns than the former winner stocks. Tripathi and
Aggarwal (2009) claimed that the consistent positive returns earned by the contrarian
strategy have clearly indicated the existence of predictability in stock market, in
which the investors can make future abnormal returns by using the past information
of the securities, seem to be incompatible with the EMH.
Various studies reported findings in favour of the overreaction hypothesis in stock
markets. The phenomenon of stock market overreaction was first documented by De
Bondt and Thaler (1985). The authors analysed the NYSE stocks and indicated the
effect of long term return reversals, appeared consistent to the overreaction
hypothesis. Moreover, Chiao and Hueng (2005) observed that overreaction occurs in
Japanese stock market. Similarly, Tripathi and Aggarwal (2009) and Joshipura (2010)
found the presence of stock market overreaction in the India. Additionally, the study
conducted by Chopra et al. (1992), Poterba and Summers (1988), Campbell and
Limmack (1997) and Baytas and Cakici (1999) have proven the return reversal effect
in the global stock market over the long horizons, which provide significant evidence
to show the existence of market overreaction. Furthremore, the results obtained by
Mylonakis (2012) also suggested that the overreaction to new information causes the
reversion of returns in Athens Stock Exchange. In the case of Malaysia, Ali et al.
(2011) showed that Bursa Malaysia was subject to the phenomenon of return
reversals and market overreaction. Likewise, Ali et al. (2010) found overreaction
effect in Malaysian stock market by employing event study methodology. The authors
A Study of Behavioural Finance: Industry-based Overreaction and Underreaction in Malaysia
Undergraduate Research Project Page 20 of 77 Faculty of Business and Finance
investigated the overreaction effects of domestics, economics and international events
on Malaysian stock market from 1987 to 2006. The authors argued that Bursa
Malaysia tends to overreact to new dramatic events, such as economic crisis and
extraordinary political events. Besides, the findings of Huang, Chan, Huang and
Chang (2011) revealed that in Taiwanese stock market, the stock prices tend to
overreact in response to the political crisis.
In addition, Kaestner (2006) proposed that stock market overreaction can be
explained from the behavioural perspective, in which the cognitive bias would affect
the investors’ investment decisions. A number of literatures have documented that
overconfidence seem to be one of the sources of market overreaction. According to
Daniel, Hirshleifer and Subrahmanyam (1998), overconfident investors tend to
overweight the private information that they have possessed and ignore the public
information available in the stock market. As a result, the overconfident investors
overreact to their private information signal and invest to a greater extent than usual.
Consequently, the irrational trading would temporarily drive the stock prices further
away from its true value in the short run. Followed by the long run correction, the
stock prices move in the opposite direction and approach to its true equilibrium level.
The study carried out by Daniel et al. (1998) has clearly demonstrated the existence
of overreaction in stock market, as a result of the investors’ overestimation of the
precision of their private information. Similarly, Chuang and Lee (2006) observed
that the stock prices strongly overreact to private information and underreact to public
information in the presence of overconfident investors by employing a just-identified
bivariate moving average representation model. Moreover, Odean (1998) revealed
that if investors are overconfident, there is a tendency that the market will overreact
to salient, but less relevant information and at the same time, underreact to the
statistical and highly relevant information. Conversely, Zaiane and Abaoub (2009)
use the model proposed by Daniel et al. (1998) to analyze the existence of
overconfidence in Tunisian stock market. The authors found that only one third of the
sample supporting the overconfidence theory. Therefore, it is concluded that there is
A Study of Behavioural Finance: Industry-based Overreaction and Underreaction in Malaysia
Undergraduate Research Project Page 21 of 77 Faculty of Business and Finance
only little evidence to confirm that Tunisian investors overact to their private
information signals as a consequence of overconfidence bias.
On the other hand, many studies have proven that stock market overreaction can arise
from the representativeness heuristic. According to Boussaidi (2013),
representativeness heuritstic refers to the tendency of investors to believe that the
remarkable performance of a firm in the past is a representative of the general
performance of the particular firm that is more likely to occur in the future. In other
words, investors who subject to representativeness heuristic would believe that the
past performance of a firm tends to be reproduced. Therefore, investors would exhibit
excessive pessimism (optimism), causing market overreaction which drives the stock
prices below (above) its fair values, as a consequence of the past negative (positive)
earnings announcements. Since the investors have undervalued (overvalued) the
stocks, they will be disappointed in the future when their expectation on the reduction
(growth) of revenues fails to materialize (Barberis et al., 1998). Subsequently, the
stock prices are likely to increase (decrease) and revert back to its true value.
Among these studies, Aguiar and Sales (2010) introduced a methodology based on
the Fuzzy Clustering Means Algorithm and suggested that representativeness
heuristics can be used to explain the phenomenon of industry-overreaction in the
American stock market. Also, the study of Aguiar, Sales and Sousa (2008) has proven
the industry-overreaction effect in Brazilian stock market by using the Fuzzy
Behavioural Model. In the study of Aguair et al. (2008), the petrol/petrochemical
sector exhibits significant overreaction effect generally from 2001 to 2005 in
Brazilian stock market. Besides, Aguiar and Sales (2010) proved that overreaction
occurred in three different sectors namely petrol/petrochemical, textile, and steel and
iron sectors in American stock market, from 2005 to 2007. Besides, Barberis et al.
(1998) used a model of investor sentiment and concluded that investors strongly
extrapolate the history performance of firms far into future. In other words, the
representativeness heuristic may cause the overreaction in American stock market.
Likewise, Kaestner (2006) provided significant evidence that overreaction occurs in
A Study of Behavioural Finance: Industry-based Overreaction and Underreaction in Malaysia
Undergraduate Research Project Page 22 of 77 Faculty of Business and Finance
American stock market as a result of the representativeness bias. Additionally, the
findings of Lam, Liu and Wong (2010) revealed that investors are likely to exhibit
representativeness bias and thus, lead to short-term underreaction and long-term
overreaction in Hong Kong stock market, through the application of a separate model,
pseudo-Bayesian approach to reflect the investors’ biased heuristics. On the contrary,
the study done by Boussaidi (2013) argued that there is only a weak evidence to
support that the overreaction to the accounting earnings announcement is caused by
the heuristic of representativeness among the Tunisian investors. Similarly, Wu, Wu
and Liu (2009) found little support for the overreaction hypothesis under
representativeness effect. Instead, their results showed the existence of stock market
underreaction in Taiwan.
Last but not least, several studies have revealed that herding behaviours could also
lead to market overreaction. Herding behaviour refers to the tendency of investors to
mimic/imitate the actions of a larger group of investors rationally or irrationally.
Typically, in the context of overreaction, they tend to react irrationally. According to
Yao, Ma and He (2014), herding results in deviation of stocks prices from its
fundamental values upon any surprises in events and news. According to Christie and
Huang (1995), herding behaviours cause investors to rely on the collective actions of
majority investors, which may already suppress their beliefs or even when they
dissent with the actions. Seeking the preference for market consensus, the herding
investors believe that the majority decisions are unlikely to occur discrepancy. This
preference tends to even magnify the effect of overreaction, as when news arises, they
tend to mimic the overreaction effect of majority investors. It is further supported by
Brown, Wei and Wermers (2013), commenting that investors herding in response to
event surprises leads to shard stock price overreaction. This has further supported by
Iihara, Kato, and Tokinaga (2001) saying that significant return reversals implies that
positive returns are due to overreaction caused by herding behaviours among
Japanese investors. Authors suggested that investors overreact by following the trend-
chasing investment strategies. Besides, somehow the investors may also overestimate
or underestimate the level of information in the market (Hott, 2009). Therefore,
A Study of Behavioural Finance: Industry-based Overreaction and Underreaction in Malaysia
Undergraduate Research Project Page 23 of 77 Faculty of Business and Finance
investors tend to derive the asset information from the actions of majority, which
contributed largely to asset price discrepancy due to overreaction (Hott, 2009).
2.6 Underreaction
Market underreaction refers to the tendency of stock prices to underreact to the
unexpected news or events, which in turn lead to a momentum in profits over the
short horizons (Barberis et al., 1998). According to Archana et al. (2014), the
momentum effect suggests that the former winning (losing) stocks have a higher than
expected probability of continuing be the winning (losing) stocks in the short run, as a
consequence of the market underreaction. Basically, investors who suffering from the
psychological biases do not perfectly and fully process the new information
immediately, but rather to integrate the new information gradually over the time. The
slow adjustment to the new information would cause the securities prices continue to
move in the same direction in the subsequent period, specifically three to twelve
months (Jegadeesh and Titman, 1993). In other words, the stock prices continue to
rise after the positive earnings announcements, or continue to fall after the negative
earnings announcements, resulting in market returns continuation. Eventually, the
recent past winners tend to outperform the recent past losers.
Basically, investors can gain advantage of market underreaction by using the strategy
of momentum, holding that investors buy the past winning stocks and sell the past
losing stocks (Lam et al., 2010). Jegadeesh and Titman (1993) stated that the return
continuation was a consequence of stock market underreact to new information and
gradually incorporate the information into the securities prices. Investors who
recognized the momentum in securities prices can achieve abnormal returns by
utilizing the current positive information to predict positive returns in the future
(Barberis et al., 1998). This is because the market tends to underreact to the
unexpected news or announcements, causing a mispricing of securities in the initial
period, and a price correction in the following period. As a result, the investors who
A Study of Behavioural Finance: Industry-based Overreaction and Underreaction in Malaysia
Undergraduate Research Project Page 24 of 77 Faculty of Business and Finance
use the momentum strategy would eventually obtain abnormal profits as the recent
past winners (losers) tend to be the future winners (winners). Latif et al. (2011)
argued that the trends in returns over the short horizons present the evidence of
predictability in stock market, contradict to the assumptions made in EMH.
Numerous studies have provided convincing support for the underreaction hypothesis
in stock market. Cutler, Poterba and Summers (1991) found reliable evidence that
stock prices gradually incorporate information, causing the market underreaction and
continuation of stock returns in the short run. Similarly, Chan, Jegadeesh and
Lakonishok (1996) reported that stock prices respond slowly to the new information,
particularly earnings announcements, suggesting the existence of underreaction in US
stock market. Moreover, Rouwenhorst (1998) examined the stock markets in twelve
European countries. The author claimed that the stock markets tend to underreact to
the new information and the investors are allowed to beat the market and make
abnormal returns by applying momentum strategy. Besides, the findings of Lo and
MacKinlay (2011), Schnusenberg and Madura (2001), Alrabadi (2012) and Lasfer et
al. (2003) showed significant evidence of the underreaction effect in international
stock markets. Their studies revealed that the stock markets exhibit trends in returns,
in which the stock prices continue to drift in a single direction over the short horizons.
Likewise, Chan, Hameed and Tong (2000) analysed the global stock markets and the
proven the existence of momentum profits and market underreaction. Furthermore,
Ali et al. (2010) detected the underreaction effect to the national election
announcement in Malaysian stock market.
According to Kaestner (2006), taking into accounts the behavioural biases,
particularly the anchoring and conservatism bias can better explain the phenomenon
of stock market underreaction. A few studies have revealed that short run
underreaction in stock market can be the result of anchoring. Mc Elroy and Dowd
(2007) stated that anchoring is an information-processing bias, in which the market
participants overweight their first piece of information when making financial
decisions. Generally, investors make decisions by starting with the known
A Study of Behavioural Finance: Industry-based Overreaction and Underreaction in Malaysia
Undergraduate Research Project Page 25 of 77 Faculty of Business and Finance
information and set a certain reference point based on that information, known as
“anchor” (Ngoc, 2014). Once anchor is set, investors would gradually adjust their
original anchors as they tend to underreact the subsequent new information. As a
result, the final estimates will stick closely to the investors’ original estimates as the
new information is inadequately incorporated (Epley and Gilovich, 2006). This is
because investors adjust their anchors insufficiently, thus producing biased estimation
for the future. In other words, anchoring effect would lead to excessive moderation in
the investors’ decision making process, which eventually causes the underreaction
phenomenon in stock market (Aguiar and Sales, 2010).
The findings of Li and Yu (2011) discovered the existence of momentum effect in the
US stock market, appeared consistent with the underreaction hypothesis. Also, the
authors suggested that the anchoring effect would not only influence the individual
stock prices, but also give impact to the entire stock market. Furthermore, Aguiar et al.
(2008) employed the Fuzzy Behavioural Model to investigate the Brazilian stock
market. The authors argued that stock market underreaction occurs in the textile
sector, owing to the anchoring effect. In the case of Taiwan, Liao, Chou and Chiu
(2013) examined the anchoring effect in the investors’ trading decisions and proven
the existence of stock market underreaction, through the application of the regression
models.
On the other hand, several studies have been conducted in attempt to explain how
conservatism bias causes underreaction in the stock market. According to Barberis et
al. (1998), conservatism bias is a belief perseverance bias, whereby the market
participants often overweight their initial beliefs and resist quick changes in their
beliefs when new information arises. Owing to this behavioural bias, investors are
overconfident about their previous forecasts and tend to put little weight on the new
information presented. Basically, the investors would choose to stick to the past
information and slowly update their beliefs in the face of new evidence in order to
maintain the beliefs close to their prior views (Latif et al., 2011). As a result, the
investors fail to react to the new information in a rational way, causing the stock
A Study of Behavioural Finance: Industry-based Overreaction and Underreaction in Malaysia
Undergraduate Research Project Page 26 of 77 Faculty of Business and Finance
market underreaction (Ritter, 2003). Subsequently, the stock prices will slowly adjust
to that information and return back to its fundamental values. In other words,
investors subject to conservatism bias would make conservative judgment, which
would eventually lead to the market underreaction.
The findings of Barberis et al. (1998) showed that short term underreaction can arise
from the conservatism heuristics. The authors applied a parsimonious model of
investor sentiment and assumed the investors suffering from the conservatism bias
would deduce wrong beliefs, causing the market underreaction over the short
horizons. Moreover, Jegadeesh and Titman (1993) found that stock market
underreaction in the short run is caused by conservatism heuristics. Similarly, Lam et
al. (2010) used a pseudo-Bayesian model and observed that the momentum profit
obtained in the Hong Kong stock market under the effect of conservatism bias. The
authors stated that the investors tend to overweight the prior information and
underweight the new information, causing the underreaction phenomenon. In addition,
the study conducted by Wu et al. (2009) in Taiwanese stock market revealed that
investors prone to underreact to the corporate earnings announcement in the medium
term horizon, as a consequence of conservatism bias.
2.7 Hypothesis Development
According to Salamudin, Ariff and Nassir (1999), Malaysian stock market is
described as a semi-strong efficient market. Hence, the securities prices have already
reflected all publicly available information and therefore investors cannot earn
abnormal return through the use of publicly available information. Another way of
speaking, investors can only earn abnormal returns at the possession of internal or
private information.
A Study of Behavioural Finance: Industry-based Overreaction and Underreaction in Malaysia
Undergraduate Research Project Page 27 of 77 Faculty of Business and Finance
The hypothesis developed in this study is based on Aguair et al. (2008), and Aguiar
and Sales (2010). Aguiar et al. (2008) investigated the existence of overreaction and
underreaction of petrol/petrochemical sector in Brazilian stock market from 2001 to
2005, while Aguiar and Sales (2010) examined the occurrence of overreaction in
three different sectors namely petrol/petrochemical, textile, and steel and iron sectors
in American stock market from 2005 to 2007. As this study aims to examine the
overreaction phenomenon in five different sectors in Malaysian stock market, hence
similar concept of hypothesis is developed, as follows:
H0: Malaysian stock market does not exhibit any overreaction effects in
different industries, namely consumer, industrial, plantation, properties, and
trading and services sectors from year 2004 to year 2012.
H1: Malaysian stock market does exhibit any overreaction effects in different
industries, namely consumer, industrial, plantation, properties, and trading
and services sectors from year 2004 to year 2012.
2.8 Conclusion
In brief, the literatures review provides a better understanding on the stock market
behaviours. It is observed that the stock markets are inefficient and the investors tend
to behave irrationally when making investment decisions. Moreover, there are
evidences showing that stock market inefficiencies, specifically the overreaction and
underreaction can arise from the investors’ behavioural biases, which are herding,
overconfidence, representativeness heuristics, anchoring, and conservatism bias.
Regardless of overall or industry-specific overreaction and underreaction effect, the
existence of these market inefficiencies allows the investors to enhance their
predictability of stock returns and thus achieve abnormal profits.
A Study of Behavioural Finance: Industry-based Overreaction and Underreaction in Malaysia
Undergraduate Research Project Page 28 of 77 Faculty of Business and Finance
CHAPTER 3: METHODOLOGY
3.1 Introduction
In this study, time series analysis is used to examine the overreaction and
underreaction phenomenon in five different sectors of Malaysian stock markets. The
selected sectors include Consumer sector, Industrial sector, Plantation sector,
Properties sector, and Trading and Services sector. Besides, the study also assesses
the overall market overreaction effect on a portfolio which combines all 150 stocks
from all five sectors.
This chapter can be divided into three sections. Section one describes the scope of
study. Section two describes the research design of the study providing a detailed
analysis on the behavioural model, which includes sample selection, data processing,
winner and loser portfolios formation, data analysis, hypothesis testing, and overall
industrial-based overreaction effect. Lastly, section three provides a chapter summary.
3.2 Scope of study
The data employed in this study includes prices of 30 most active stocks from five
sectors namely consumer, plantation, properties, industrial and trading and services
sectors. Also, stock prices are denominated in Ringgit Malaysia currency. Apart from
that, indexes of market specifically Bursa Malaysia Kuala Lumpur Composite Index
(KLCI) were also collected. All historical data from year 2004 to year 2013 was
obtained from Yahoo! Finance. Additionally, the frequency of the both stocks prices
and KLCI is in monthly basis. The reason for excluding year 2014 as the research
time scope is due to the unavailability of complete monthly prices of some stocks.
A Study of Behavioural Finance: Industry-based Overreaction and Underreaction in Malaysia
Undergraduate Research Project Page 29 of 77 Faculty of Business and Finance
3.3 Research Design
This study applies and modifies the methodology employed by Aguair et al. (2008),
and Aguiar and Sales (2010) for the analysis of overreaction and underreaction within
industries. In the studies of American and Brazilian industrial-based overreaction
conducted by Aguiar et al. (2008), Aguiar and Sales (2010), Aguiar (2012), and
Aguiar and Belardi (2013), common steps in conducting overreaction study were
reviewed and summarized. The steps are listed as follows:
Source: Developed for the research
Step 1: Establish firm selection criteria, and select companies from each industry.
Step 2: Process the stock prices and market indexes into returns.
Step 3: Build winner and loser portfolios based on industrial average return of t+1 year.
Step 4: Calculate residual returns of winner and loser portfolios of each month during t year, by comparing with KLCI return.
Step 5: Perform hypothesis testing to indicate the validity of overreaction or underreaction effect.
Step 6: Compute the cumulative average residual returns (CARR) of winner and loser portfolios, provided that the sector exhibits significant overreaction effect.
A Study of Behavioural Finance: Industry-based Overreaction and Underreaction in Malaysia
Undergraduate Research Project Page 30 of 77 Faculty of Business and Finance
Step 1: Establish firm selection criteria, and select companies from each
industry.
Lakonishock, Shleifer and Vishny (1992) commented that most of the investors
follow the strategies of actively choosing and trading stocks, instead of merely buying
and holding the market stocks or portfolios. When investors trade in active manners
by reacting to news, their buying and selling decisions effectively move stock prices
(Lakonishock, et al., 1992). Besides, Zhang (2010) pointed out that active trading
investors have become a dominant force in capital market increasingly in recent years.
In United States capital market, it accounts for over 70% of dollar trading volume.
Throughout the study conducted by Zhang (2010), generally active trading is
positively correlated with stock price volatility. The correlation is even stronger
during the periods of high market uncertainty. Hence, to study overreaction in which
investors tend to overreact to uncertain events, active stocks have to be considered in
building the portfolios of each sector. In short, understanding the overreaction
influences requires an understanding of the behaviours of active stocks with the
involvement from active investors.
In addition, there is positive correlation between investor herding behaviour and
overreaction influences (Yao et al., 2014). It is supported by Brown et al. (2013),
saying that herding by investors in response to events or news leads to sharp stock
price overreaction. Herding behaviour refers to the tendency for investors to
mimic/imitate the actions of a larger group, rationally or irrationally. When news,
either good or bad, is announced, investors tend to follow majority for decision
making, and thus leads to a greater effect of overreaction (Iihara et al., 2001).
Specifically, investors believe that major decisions are not likely to occur discrepancy.
Most importantly, according to Yao et al. (2014), herding behaviour is more prevalent
at industry-level and more noticeable under highly uncertain market. The purpose of
the study to investigate the Malaysian industry-based overreaction (underreaction)
responding to events has been strengthened by Yao’s study (2014). Therefore,
A Study of Behavioural Finance: Industry-based Overreaction and Underreaction in Malaysia
Undergraduate Research Project Page 31 of 77 Faculty of Business and Finance
choosing active stocks relatively to inactive stocks in dollar volume from each sector
helps to understand how the herding behaviours leads to overreaction.
As of 2014, table 3.3.1 summarizes the total number of stocks listed in Bursa
Malaysia from Consumer, Industrial, Plantation, Properties, and Trading and Services
sector.
Table 3.3.1 Total Number of Stocks of the Selected Sectors
Types of Sector Number of stocks available
Consumer 134
Industrial 259
Plantation 41
Properties 83
Trading and Services 195
Source: Developed for the research
There are several criteria to select the most active/volatile stocks, such as most active
by share volume, most active by dollar volume, and so on. The study chooses 30 most
active stocks, in terms of most active by dollar volume, from each sector respectively.
The reason for not choosing most active by share volume is that stocks with low price
ranges are likely to have larger trading volume, as compared with stocks with high
price ranges. This is because investors tend to trade more in term of volume when the
stock is cheaper. Therefore, the criterion of most active in trading volume is not good
enough to be used. Consequently, the study applies and chooses most active stocks in
dollar volume as it considers both trading volume and stock prices.
There are basically two steps applied by the study in stock selection. Bear in mind
that these steps were applied independently in each industry. Firstly, the study filtered
the all available stocks and only considered the stocks with complete monthly data
from 2004 to 2013. This step is to ensure that no missing data in between the time
A Study of Behavioural Finance: Industry-based Overreaction and Underreaction in Malaysia
Undergraduate Research Project Page 32 of 77 Faculty of Business and Finance
scope of study which may cause result discrepancies (De Bondt and Thaler, 1985).
Secondly, in order to choose the most active stocks over period considered, the study
computed the dollar volume of each remaining stocks from first step. It is done by
multiplying monthly trading volume and stock prices. Hence, the study computed the
average dollar volume of each stock. The top 30 stocks with the highest average
dollar volume are selected to form winner and loser portfolios in the study.
Appendices 3.2.1, 3.2.2, 3.2.3, 3.2.4, and 3.2.5 provide lists of 30 most stocks by
dollar volume of each industries.
The number of stock selected to form portfolio, 30, is based on Modern Portfolio
Theory (MPT). Researches on MPT have shown that a well-diversified share
portfolio can reduce unsystematic risk effectively to minimal level. According to
Statman (1987) which applied MPT to investigate the number of stocks needed to
achieve effective diversification, no less than 30 stocks are needed for a well-
diversified portfolio. Recent studies such as Jiang (2013) which applied MPT to
Thailand equity market showed that 30-stock is the appropriate number to be
sufficient to diversify the risk of portfolio. This has also further strengthened by
Chong and Phillips (2013), stating that 30 stocks are required when investors aim to
achieve average return through risk diversification (as cited in Jiang, 2013).
Additionally, it is necessary to justify why these five sectors (consumer, plantation,
properties, industrial and trading and services sectors) have been selected to be
investigated on overreaction and underreaction effect. There are total of ten sectors of
listed companies in Malaysian stock exchange, listed as follows:
Construction
Consumer
Finance
Industrial
Infrastructure Project Company (IPC)
Mining
Plantation
A Study of Behavioural Finance: Industry-based Overreaction and Underreaction in Malaysia
Undergraduate Research Project Page 33 of 77 Faculty of Business and Finance
Properties
Technology
Trading and Services
Appendix 3.2.6 specifies the companies’ stocks listed in KLCI and which sector each
stock belongs to, as of 2014. While table 3.3.2 summarizes the number of stocks
listed in KLCI according to its respective industry.
Table 3.3.2 Number of Stocks and Industries listed in KLCI
Types of Sector Number of stocks available
Trading and Services 13
Finance 7
Plantation 3
Consumer 3
Industrial 2
Properties 1
IPC 1
Total 30
Source: Developed for the research
To be specific, the study chooses the five sectors as targeted sectors based on 2
criteria. At first, there must be at least a stock from the industry to be listed in KLCI.
Hence, among the ten industries, construction, mining, and technology sectors had
been eliminated from the option, as referring to table 3.3.2. Specifically, KLCI is a
capitalization-weighted stock market index which comprises of 30 known companies
on the Bursa Malaysia. KLCI is widely being used as a major stock market index as it
tracks the performance of 30 largest companies by capitalization (Ali et al., 2010). As
the study has to compare the portfolio returns with market returns in order to
demonstrate the portfolio performance later, matching between the sample industry
A Study of Behavioural Finance: Industry-based Overreaction and Underreaction in Malaysia
Undergraduate Research Project Page 34 of 77 Faculty of Business and Finance
and KLCI stocks’ industry has to be done. It is to ensure that the comparability
between portfolio and market index.
Secondly, there must be at least 30 stocks with complete data from year 2004 to year
2013, in order to be selected as sample industry, as to perform data analysis without
any result discrepancies. Out of the seven remaining sectors, IPC and finance sectors
were then excluded from sample industry. This is because IPC industry only has six
companies listed in Bursa Malaysia. Besides, despite the amount of finance
companies listed in KLCI, finance sector has less than 30 stocks with complete data
from 2004 to 2013, as some of the listed companies were only established in recent
years. As a result, only five sectors which are consumer, properties, plantation,
industry, and trading and services industries, have fulfilled two criteria and chosen as
sample industry.
Step 2: Process the stock prices and market indexes into returns.
The behavioural model deals with monthly stock returns and stock market returns.
The study considers both capital gains and dividend gains, as the stock prices that
employed are the adjusted prices which were available in Yahoo! Finance. Adjusted
price refers to the price that has been amended by including any distributions and
corporate actions that occurred such as dividends. It provides a relatively accurate
track record of stocks’ performance. In this step, monthly stock prices and the
monthly KLCI generated from Yahoo! Finance are transformed into monthly returns
by using the following equations:
Monthly stock return is calculated as:
rj (Pj 1
i Pji)
Pji
Where rj is the financial return of stock i at the end of month j
Pij is the price of stock i at the end of month j, and
Pij+1 is the price of stock i at the end of month j+1,
A Study of Behavioural Finance: Industry-based Overreaction and Underreaction in Malaysia
Undergraduate Research Project Page 35 of 77 Faculty of Business and Finance
Monthly KLCI return is calculated as:
r jKLCI
(INDE j 1 INDE j)
INDE j
Where rKLCI
j is the financial return of the KLCI in the month j,
INDEXj is the index of KLCI in the month j, and
INDEXj+1 is the index of KLCI in the month j+1.
The use of KLCI return is to calculate the residual return of portfolios formed by
comparing portfolio return with KLCI return, which will be discussed in following
steps.
Step 3: Build winner and loser portfolios based on industrial average return of
t+1 year.
In this step, the study classified the stocks into winner and loser portfolios based on
their financial performance at the end of t+1 year. For each year, winner portfolio
will be formed with a combination of promising group of stocks, and the loser
portfolio will be formed with a combination of non-promising group of stocks. The
classification of stocks into promising and non-promising stocks portfolio was made
in the period from 2004 to 2013.
Since the collected data frequency is in monthly, average financial returns of t+1 year
for each stock have been calculated at first. The study then ranked all the 30 stocks
from high to low based on their average financial returns. Subsequently, for every t+1
year, an average value of average financial returns of each stock has been computed
with the purpose of grouping promising stocks and non-promising stocks into winner
and loser portfolios respectively at t year. The stocks with higher average financial
returns is to be grouped as winner portfolio for t year, and the group with lower
average financial returns is to be grouped as loser portfolio for t year. The steps of
forming winner and loser portfolio are summarized as follows:
A Study of Behavioural Finance: Industry-based Overreaction and Underreaction in Malaysia
Undergraduate Research Project Page 36 of 77 Faculty of Business and Finance
Source: Developed for the research
The idea implies for using t+1 year in building winner and loser portfolios is to
identify the future winner stocks and future loser stocks. By identifying them, the
study then investigates how the winner and loser stocks in t+1 year were performed
during t year. It provides an insight regarding the previous stock performance. Did the
stocks perform well (poor) before they transformed into loser (winner) stocks in the
future? The overreaction and underreaction hypotheses can be answered in this sense.
Step 4: Calculate residual returns of winner and loser portfolios of each
month during t year, by comparing with KLCI return.
Using the classification of winner and loser portfolios in step 3, in order to visualize
the overreaction (underreaction) effect, the study has to show the magnitude of how
loser (winner) portfolios outperform winner (loser) portfolios. To perform that,
residual returns of both winner and loser portfolios for each month of t year were
calculated. Residual return describes the financial return generated by a portfolio over
a period of time that differs from the market return. According to overreaction studies
conducted by Aguiar et al. (2008), and Aguiar and Sales (2010), the monthly residual
Calculate the t+1 average financial returns of each stock
Calculate the t+1 average of stocks' average financial returns
Stocks with higher-than-average t+1 financial returns - Winner Portfolio for t year
Stocks with lower-than-average t+1 financial returns - Loser Portfolio for t year
A Study of Behavioural Finance: Industry-based Overreaction and Underreaction in Malaysia
Undergraduate Research Project Page 37 of 77 Faculty of Business and Finance
returns of both winner and loser portfolios were calculated, according to the equations
listed as follows:
RRt, jW rt, j
W rt, jKLCI
Where RRW
t,j is the residual return of the winner portfolio in the
month j of the year t,
rW
t,j is the financial return of the winner portfolio in the
month j of the year t, and
rKLCI
t.j is the financial return of the KLCI (as market index)
in the month j of the year t.
RRt, jL rt, j
L rt, jKLCI
Where RRL
t,j is the residual return of the loser portfolio in the
month j of the year t,
rL
t,j is the financial return of the loser portfolio in the
month j of the year t, and
rKLCI
t.j is the financial return of the KLCI (as market index)
in the month j of the year t.
From the residuals returns corresponding to the 12 months of each year, the average
residual returns of the winner portfolio ARRW
t and of the loser portfolios ARRL
t are
calculated from year 2004 to 2012. The idea is mainly to study the effect of
overreaction (underreaction) on yearly basis. The average residual returns were
calculated using equations listed as follows:
ARRtW
1
n RRt,j
W
n
i 1
Where ARRW
t is the average residual return of winner portfolio in
the year t,
RRW
t,j is the residual return of winner portfolio in month j of
the year t, and
n is the number of month in the year t.
A Study of Behavioural Finance: Industry-based Overreaction and Underreaction in Malaysia
Undergraduate Research Project Page 38 of 77 Faculty of Business and Finance
ARRtL
1
n RRt,j
L
n
i 1
Where ARRL
t is the average residual return of loser portfolio in
the year t,
RRL
t,j is the residual return of loser portfolio in month j of
the year t, and
n is the number of month in the year t.
The study then investigates for evidence of overreaction by comparing the
performance of the winner and loser portfolios during the study period.
ARRtW
ARRtL
Referring to the overreaction phenomenon, overreaction happens when the former
loser stocks tend to outperform the former winner stocks. Hence, if ARRtW
- ARRtL
shows a negative value, it basically indicates that loser portfolio has higher average
residual return than winner portfolio. It can be interpreted as loser portfolio has
outperformed winner portfolio during the t year. On the other hand, if ARRtW
- ARRtL
provides a positive value, it means the former winner portfolio maintained its
outstanding performance in the stock markets than former loser portfolio. The market
is then appeared to be underreacted during the t year.
Step 5: Perform hypothesis testing to indicate the validity of overreaction or
underreaction effect.
The study uses parametric t-test for two independent samples, in order to test if the
difference between average residual returns is statistically meaningful. According to
Aguiar et al. (2008), Aguiar and Sales (2010), Aguiar (2012), and Aguiar and Belardi
(2013), the null and alternative hypotheses are as follows:
A Study of Behavioural Finance: Industry-based Overreaction and Underreaction in Malaysia
Undergraduate Research Project Page 39 of 77 Faculty of Business and Finance
H0: ARRtW
- ARRtL = 0
H1(A): ARRtW
- ARRtL < 0
H1(B): ARRtW
- ARRtL > 0
Null hypothesis proposes that the sector does not exhibit neither overreaction nor
underreaction characteristics throughout the year. On the other hand, alternative
hypothesis A proposes that the sector does exhibit overreaction effects meaningfully
throughout the year, as winner portfolio underperforms loser portfolio with lower
residual returns. While alternative hypothesis B proposes that the sector does exhibit
underreaction effects meaningfully, as winner portfolio outperforms loser portfolio
with higher residual returns. The null hypothesis will be rejected if the t-statistics
figure is lower than the significance level.
The test statistics is listed as follows:
T statistics ARRt
W ARRt
T
S
ARRtW
2
nARRt
W S
ARRtT
2
nARRt
T
Where ARRtW
is the average residual returns of winner portfolio,
ARRt
L is the average residual returns of loser portfolio,
S2
ARRtw is the standard deviation of average residual return of
winner portfolio,
S2
ARRtL is the standard deviation of average residual return of loser
portfolio,
nARRtW is the number of months taken into account in calculating
winner yearly average residual returns, and
nARRtL the number of months taken into account in calculating
loser yearly average residual returns.
A Study of Behavioural Finance: Industry-based Overreaction and Underreaction in Malaysia
Undergraduate Research Project Page 40 of 77 Faculty of Business and Finance
Step 6: Compute the cumulative average residual returns (CARR) of winner
and loser portfolios, provided that the sector exhibits significant
overreaction effect.
According to Aguiar and Sales (2010), providing that the sector exhibits significant
overreaction (underreaction) characteristics, the cumulative average residual returns
for winner portfolio (CARRnW
) and for loser portfolio (CARRnL) from year 2004 to
2012 have to be calculated, in order to investigate the overall overreaction effect
during the period considered. The CARRnW
and CARRnL are calculated based on
equations listed as follows:
CARRnW
ARRtW
n
i 1
Where CARRnW
is the cumulative average residual return of
winner portfolio from 2004 to 2012
ARRtW
is the average residual return of winner portfolio in
year t, and
n is the number of year from year 2004 to 2012
CARRnL ARRt
L
n
i 1
Where CARRnL is the cumulative average residual return of
loser portfolio from 2004 to 2012
ARR t Lis the average residual return of loser portfolio in
year t, and
n is the number of year from year 2004 to 2012
A Study of Behavioural Finance: Industry-based Overreaction and Underreaction in Malaysia
Undergraduate Research Project Page 41 of 77 Faculty of Business and Finance
3.4 Conclusion
All tests and methods that employed to examine overreaction (underreaction) effect in
this study have been explained in detailed manner. It comprises of sample (active
stocks) selection, data (stock prices and KLCI) collection from Yahoo! Finance, data
processing, winner and loser portfolios formation for each year, some mathematical-
based methods to demonstrate the performance of the portfolios by comparing actual
return with market return (KLCI), and hypothesis testing to examine if the result is
statistically meaningful. The methodology employed in this study is an adaptation and
a modification of studies conducted by Aguiar et al. (2008), and Aguiar and Sales
(2010), in studying industrial overreaction effects. Hence, the next chapter discusses
the descriptive analysis of the findings of the study.
A Study of Behavioural Finance: Industry-based Overreaction and Underreaction in Malaysia
Undergraduate Research Project Page 42 of 77 Faculty of Business and Finance
CHAPTER 4: DATA ANALYSIS
4.1 Introduction
In this chapter, the methodology proposed in chapter 3 is utilized in forming
portfolios of different sectors which are Consumer sector, Industrial sector, Plantation
sector, Properties sector, and Trading and Services sector. Besides, another portfolio
which comprises of all 150 stocks from five different sectors is formed to assess the
overreaction effect in overall market. Subsequently, tests for overreaction
(underreaction) hypothesis are performed by assessing the winner and loser portfolios.
Next, hypothesis testing at 1%, 5%, and 10% significance level were performed to
verify the results of the finding. Findings are to be explained and interpreted
independently according to each sector.
This chapter can be divided into 2 sections. Section one describes the descriptive
analysis which interprets the results obtained and discusses the main findings, while
last section provides a summary of this chapter.
4.2 Descriptive Analysis
4.2.1 Interpretation of Results
Share prices from five different sectors were obtained to calculate the returns
for period ranging from 2004 to 2012. The data are used to form winner and
loser portfolio for period t based on the average return in the period of t+1. By
compared with the market index which is KLCI index, the residual return for
each year is acquired to determine the effect of underreaction or overreaction.
A Study of Behavioural Finance: Industry-based Overreaction and Underreaction in Malaysia
Undergraduate Research Project Page 43 of 77 Faculty of Business and Finance
The main findings of the study show that overreaction does exist in the
Malaysia stock market for both properties and trading and services sector
during 2008 where the global financial crisis exploded. Justification of the
overreaction is to be explained in the next section.
The average residual returns, ARRW
and ARRL
as well as their differences for
each sector are tabulated as below together with their t-statistics at the 1%, 5%,
and 10% significance level. Referring to the hypothesis that proposed in
Chapter 3, hypothesis testing was performed as follows:
Table 4.2.1.1 Hypothesis Testing
Overreaction Underreaction
H0 ARRtW
- ARRtL = 0 ARRt
W - ARRt
L = 0
H1 ARRtW
- ARRtL < 0 ARRt
W - ARRt
L > 0
Decision Rule
The value of
ARRtW
- ARRtL is only
significant when
t-statistics < the
significant level
The value of
ARRtW
- ARRtL is only
significant when
t-statistics > the
significant level
Significance level: 10% -1.363 1.363
Significance level: 5% -1.796 1.796
Significance level: 1% -2.718 2.718
Source: Developed for the research
A Study of Behavioural Finance: Industry-based Overreaction and Underreaction in Malaysia
Undergraduate Research Project Page 44 of 77 Faculty of Business and Finance
Table 4.2.1.2: Average Residual Returns and T-Statistics - Trading and Services


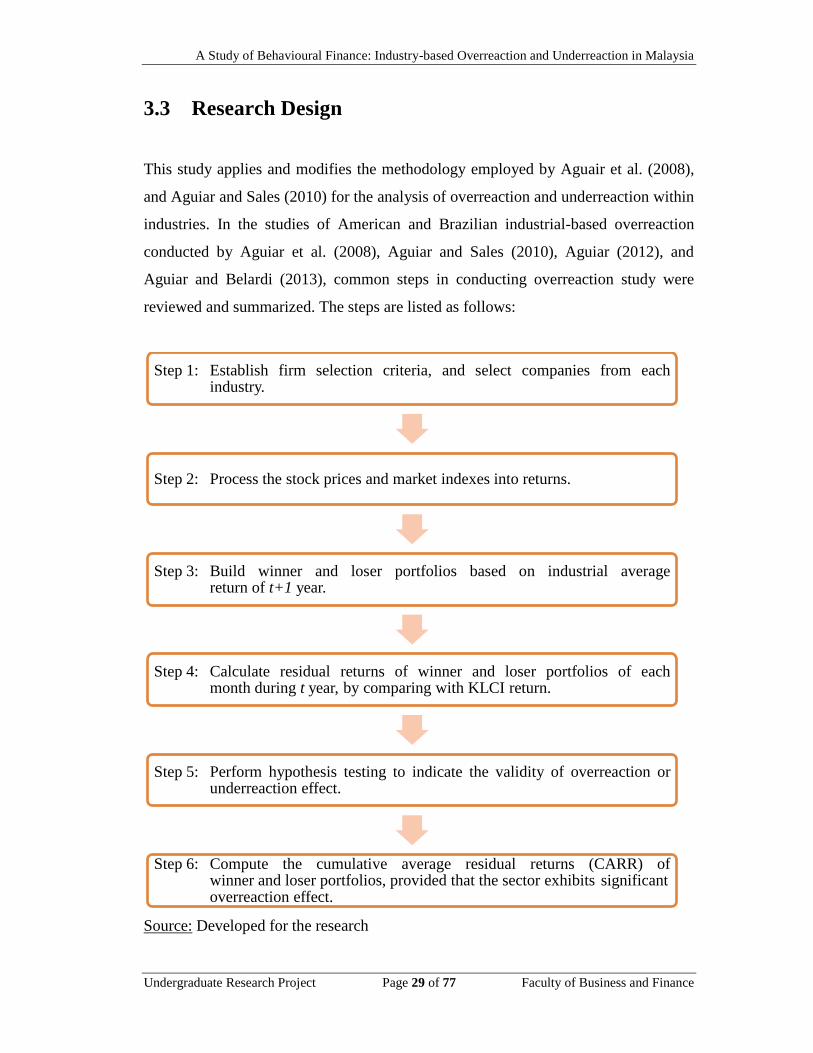

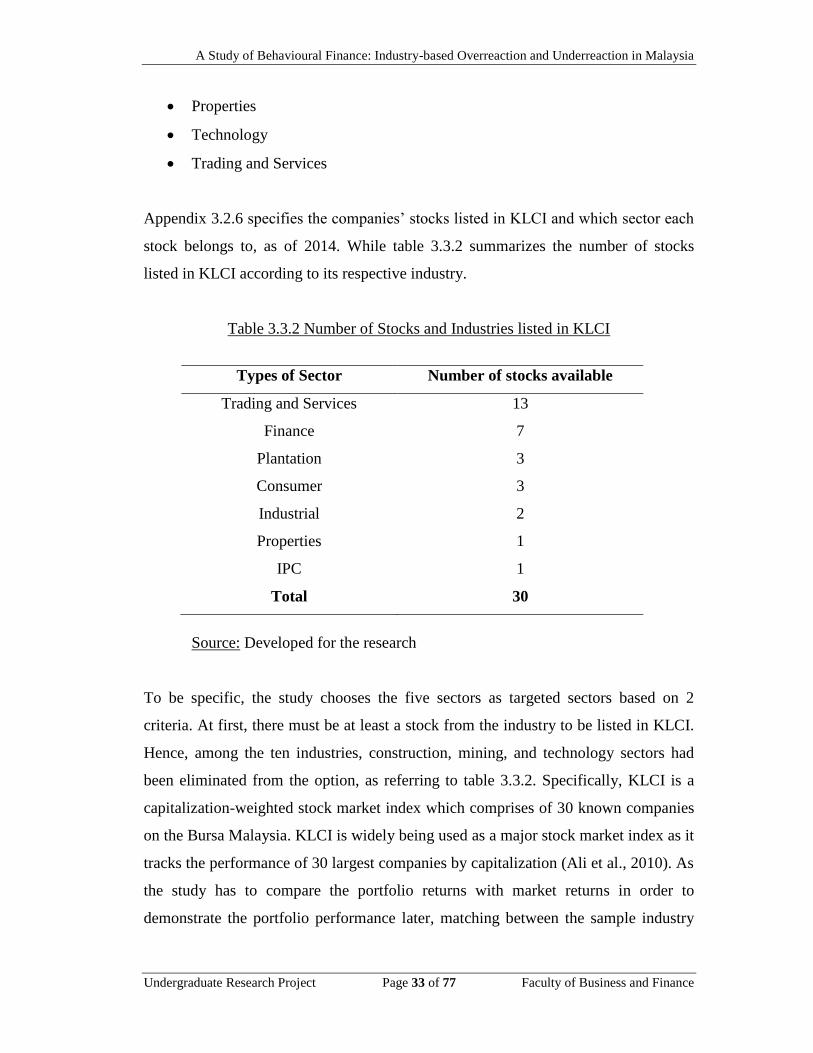

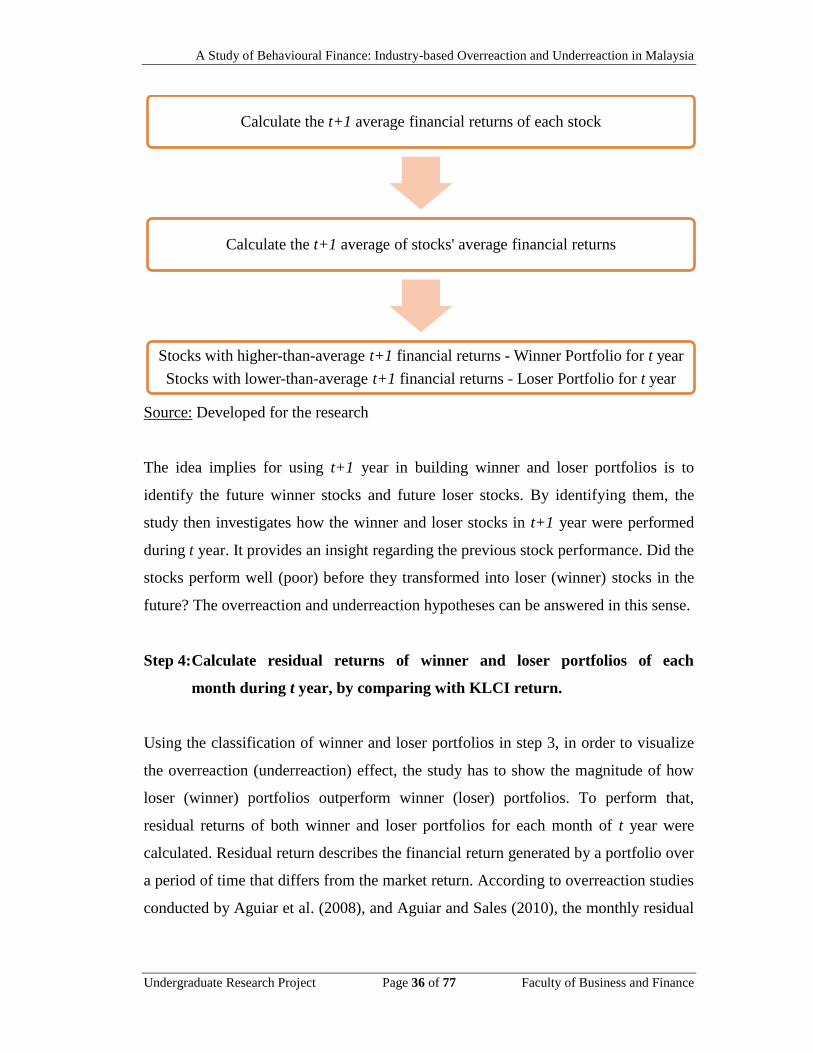
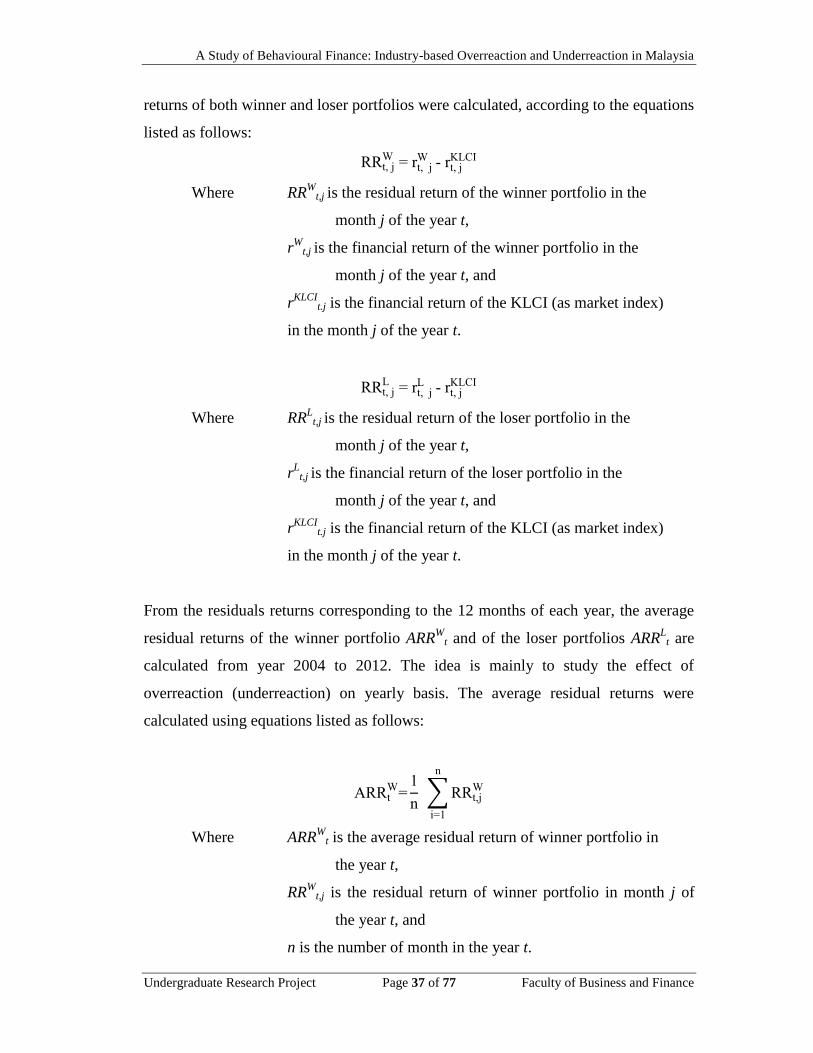
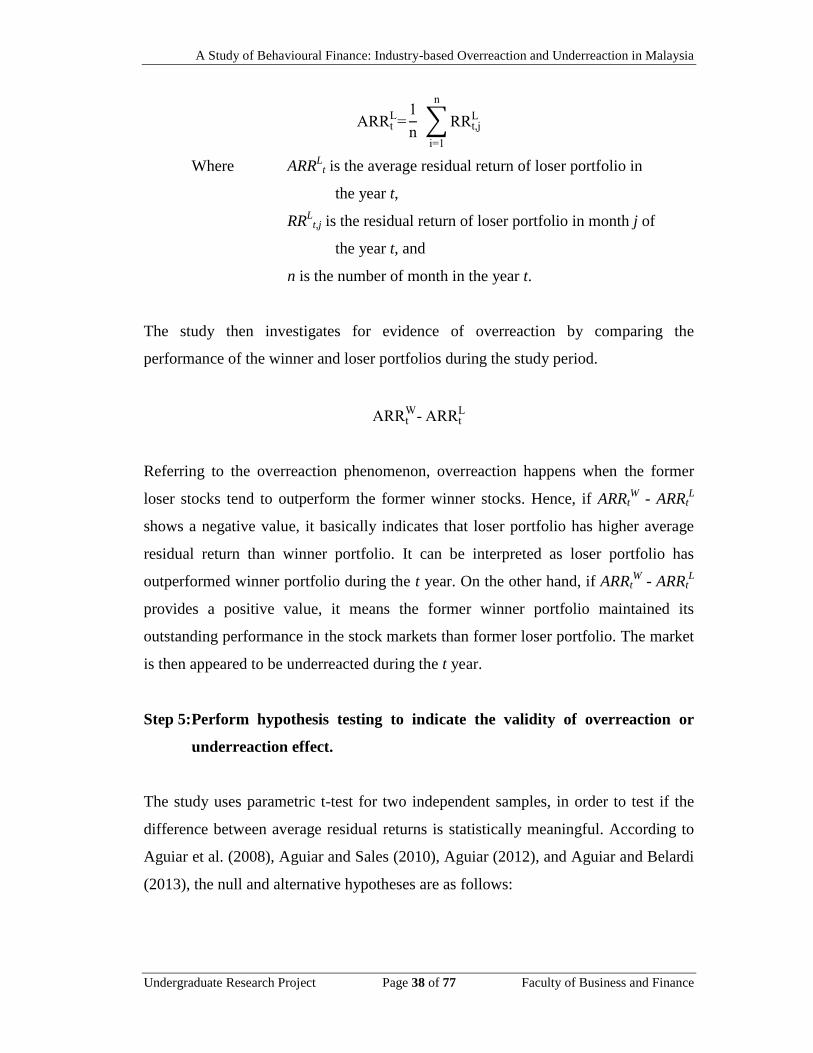

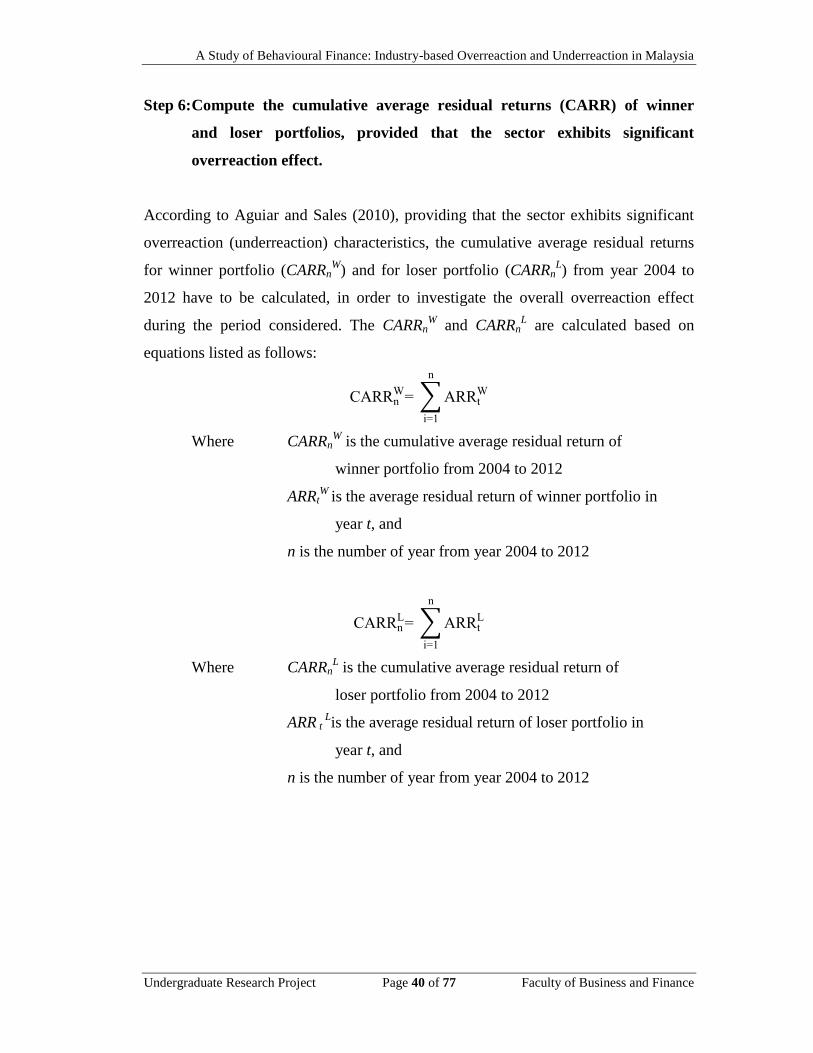
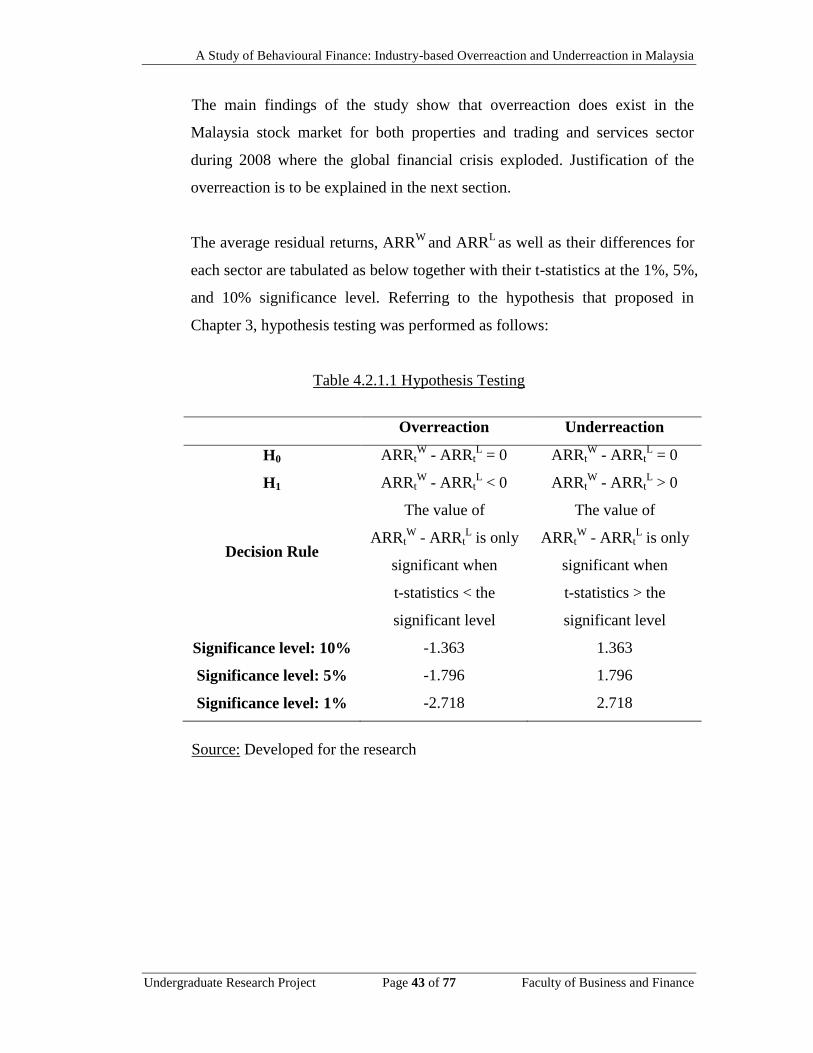
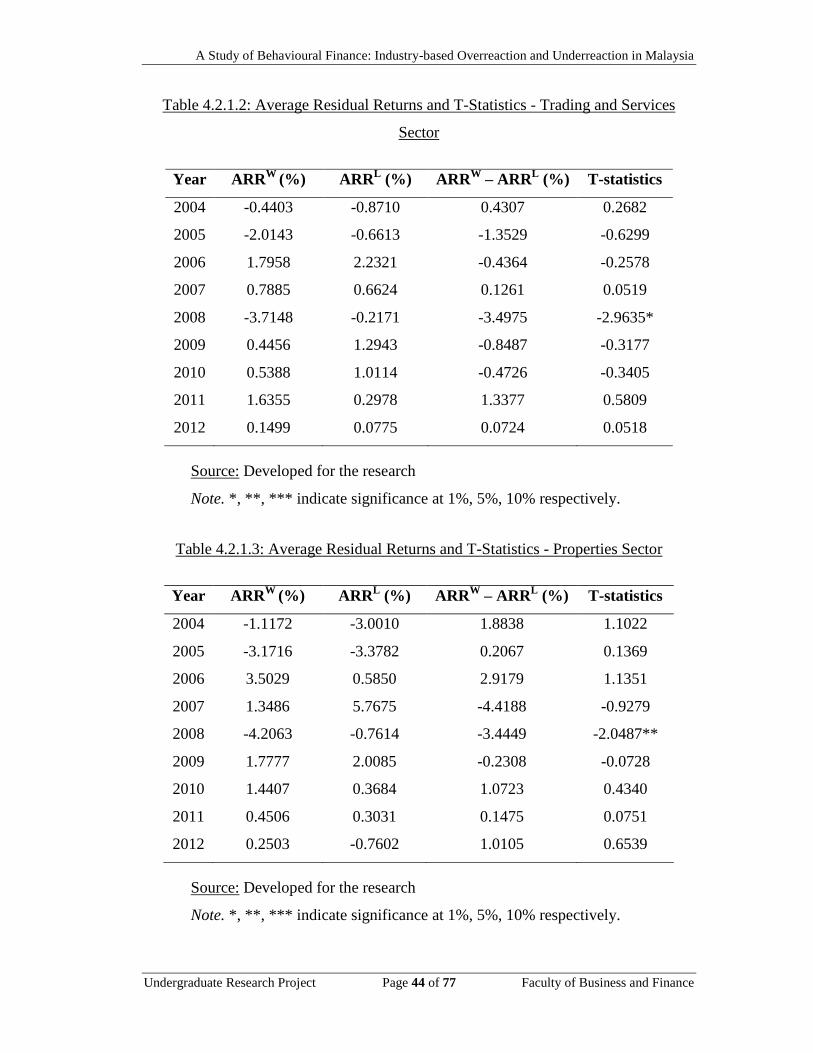
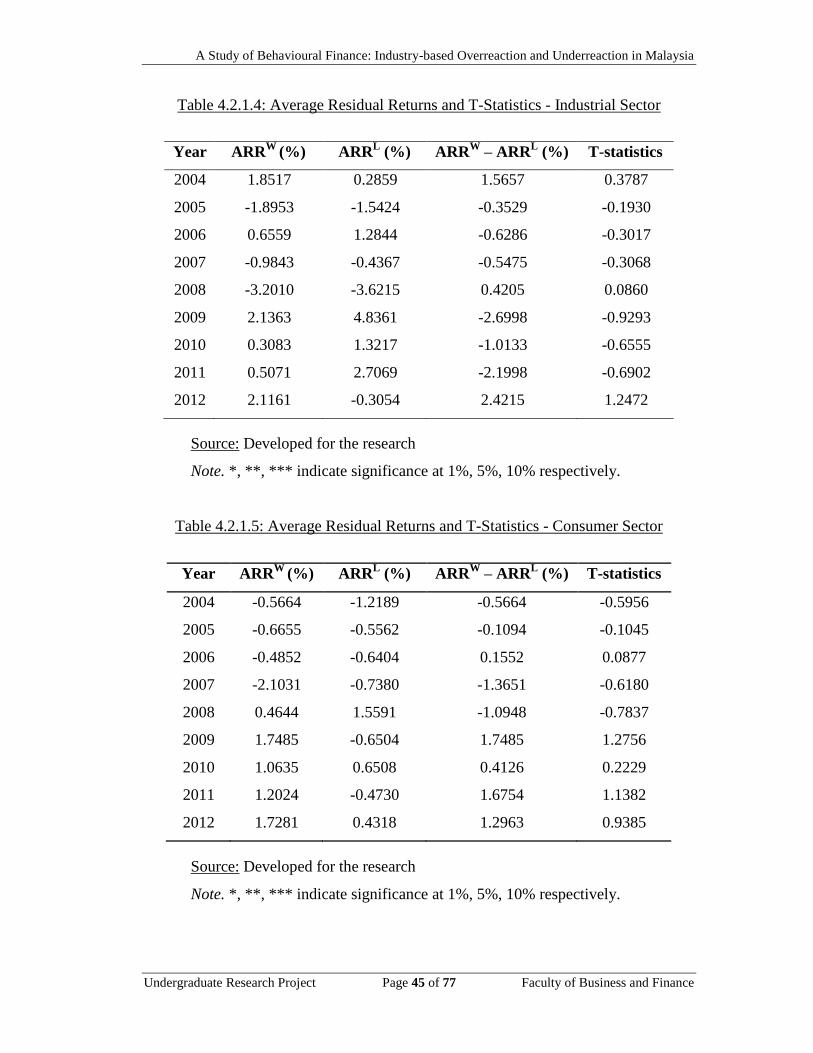
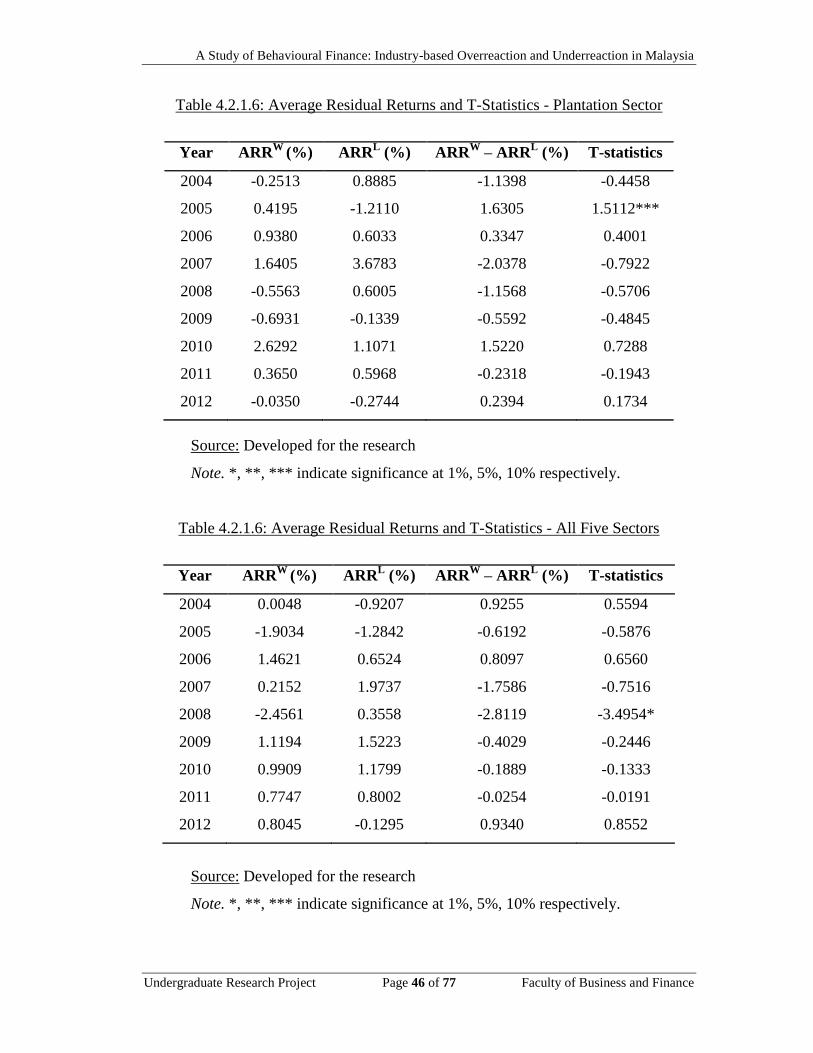
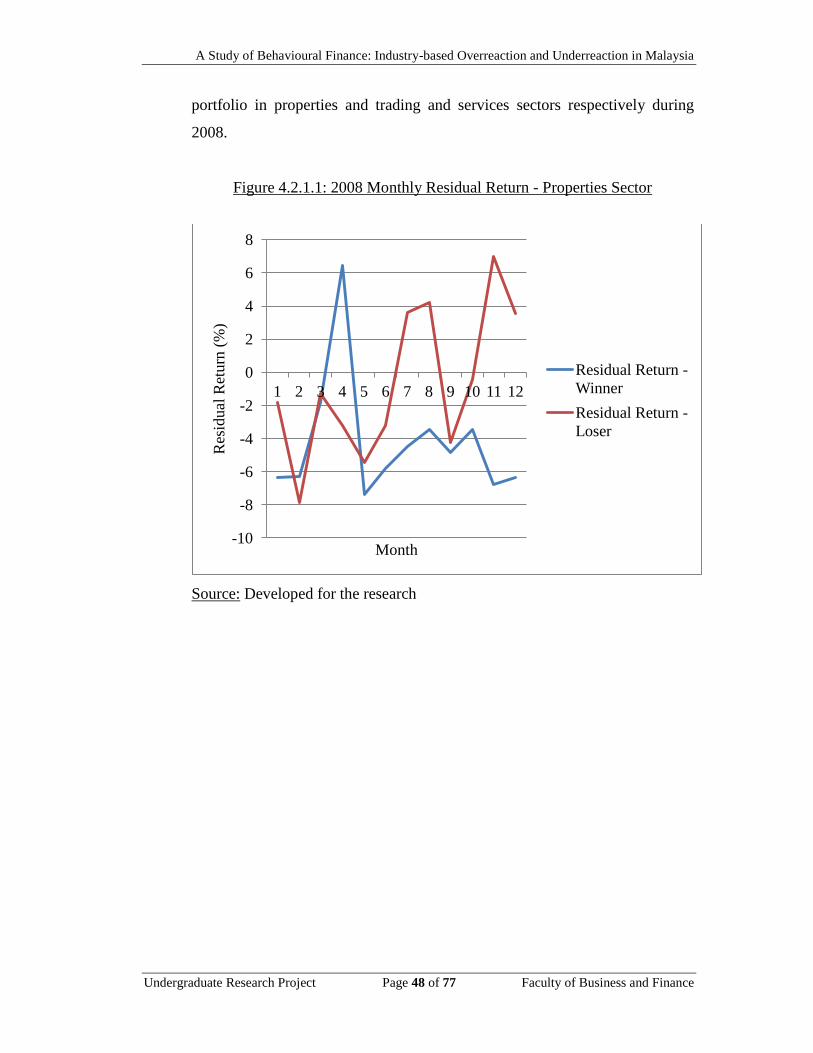
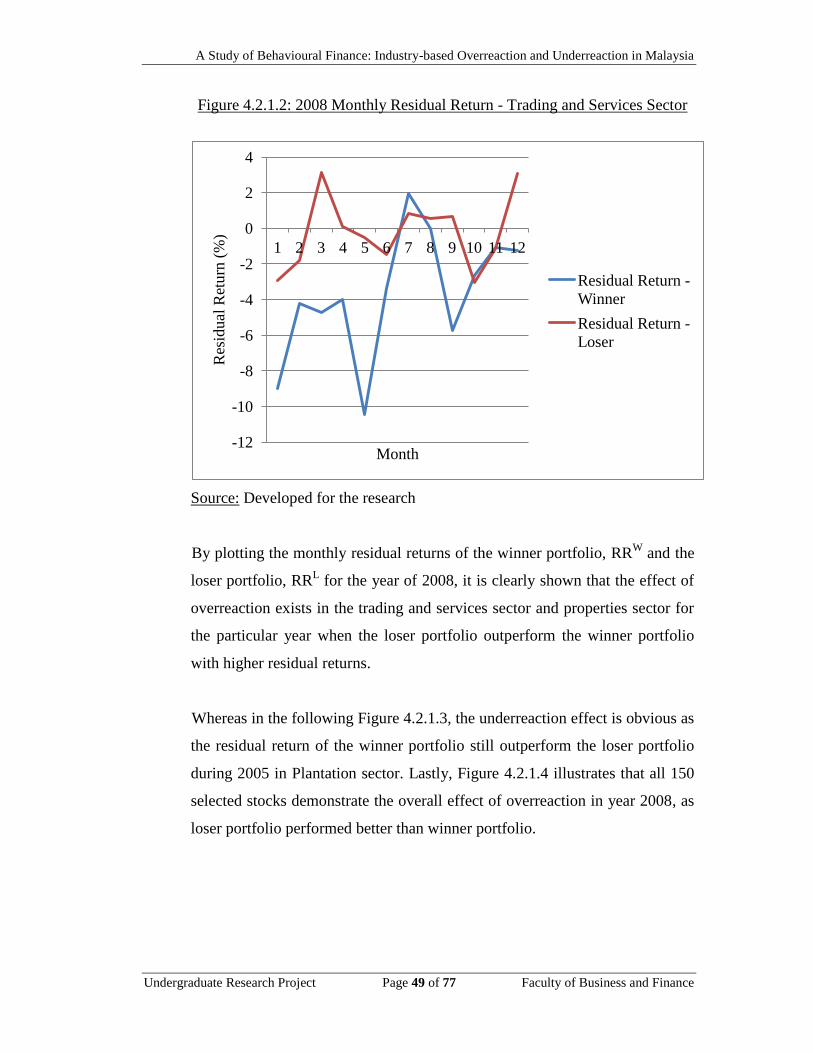
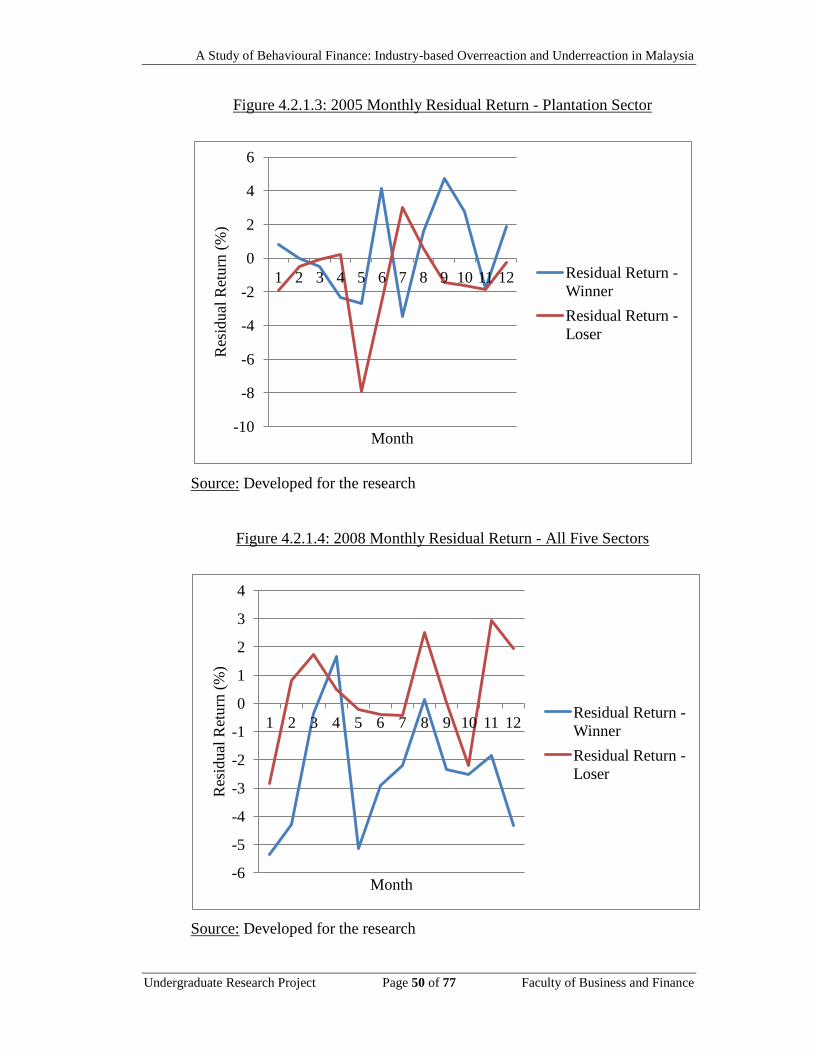
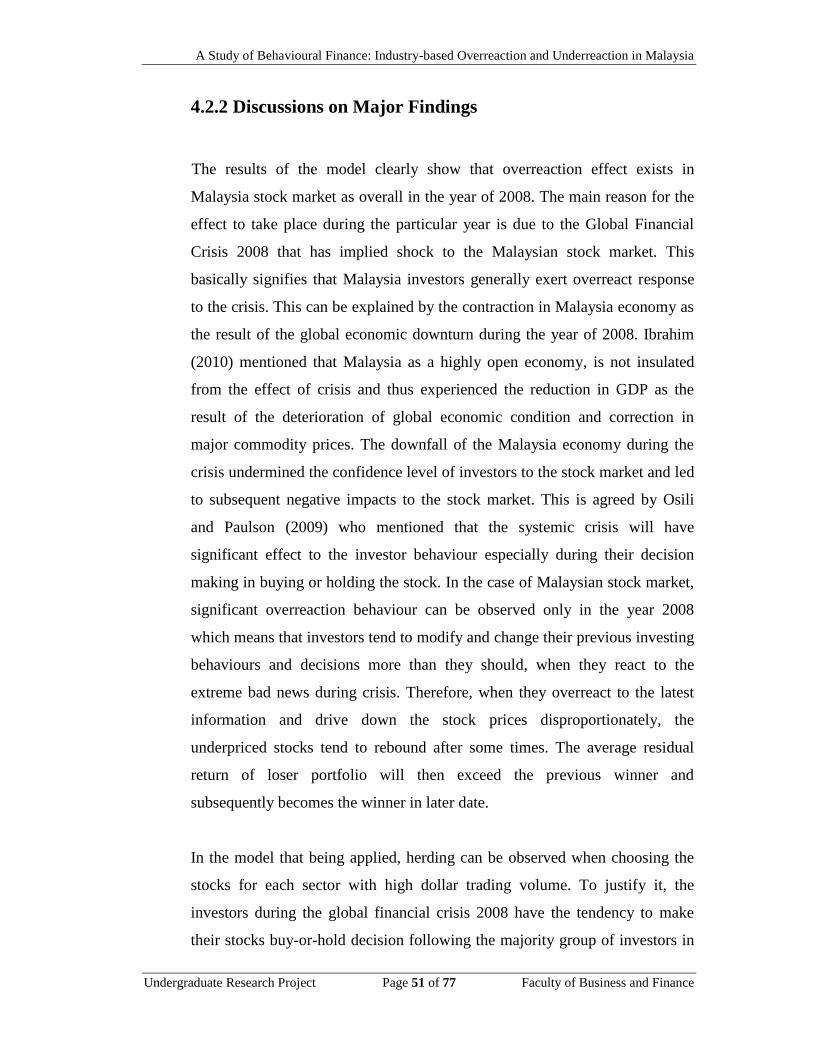

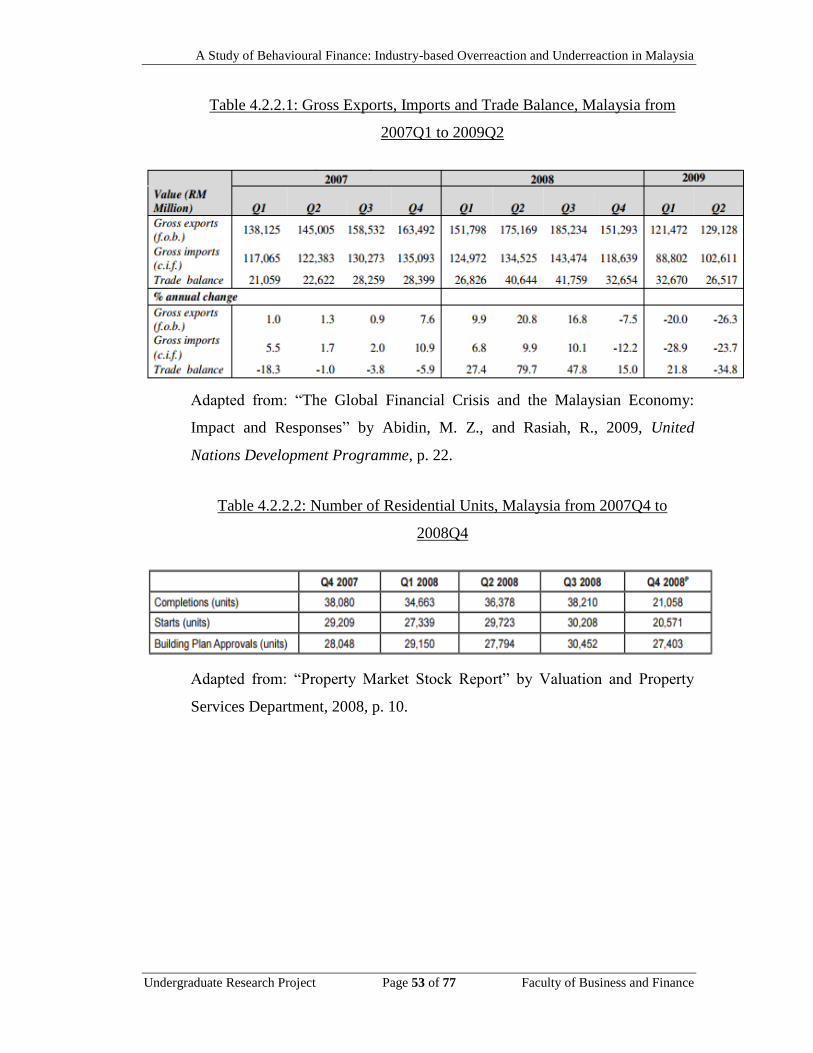
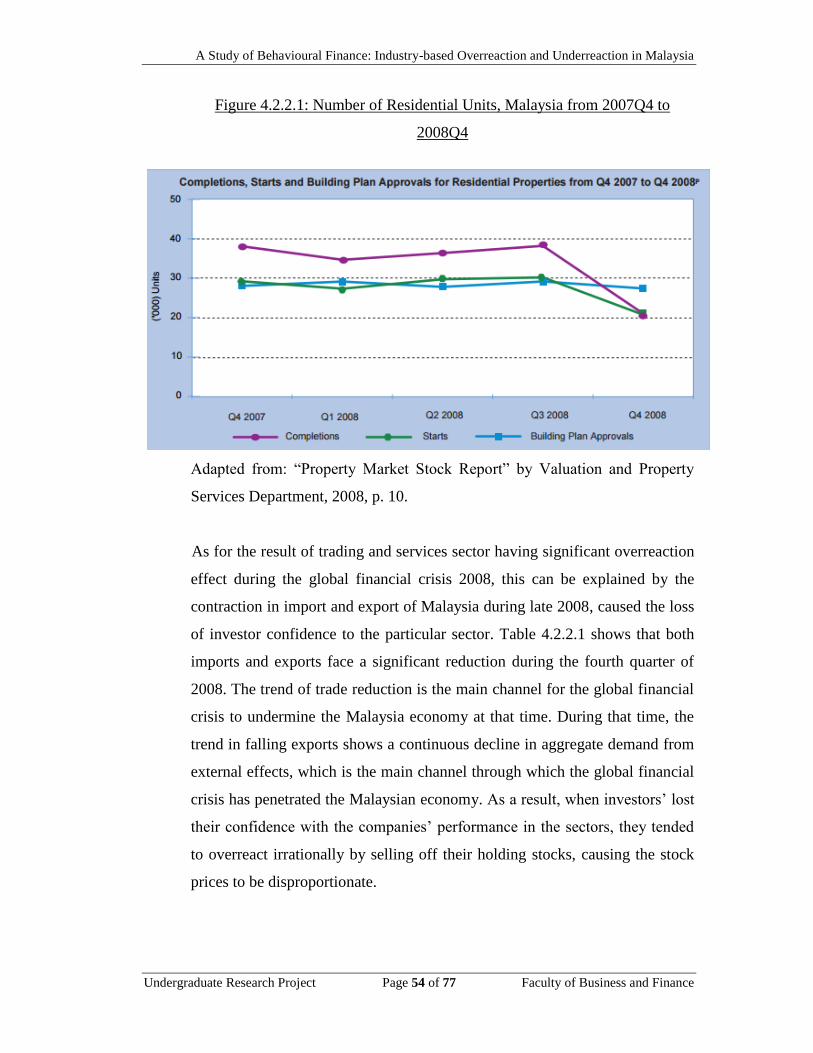
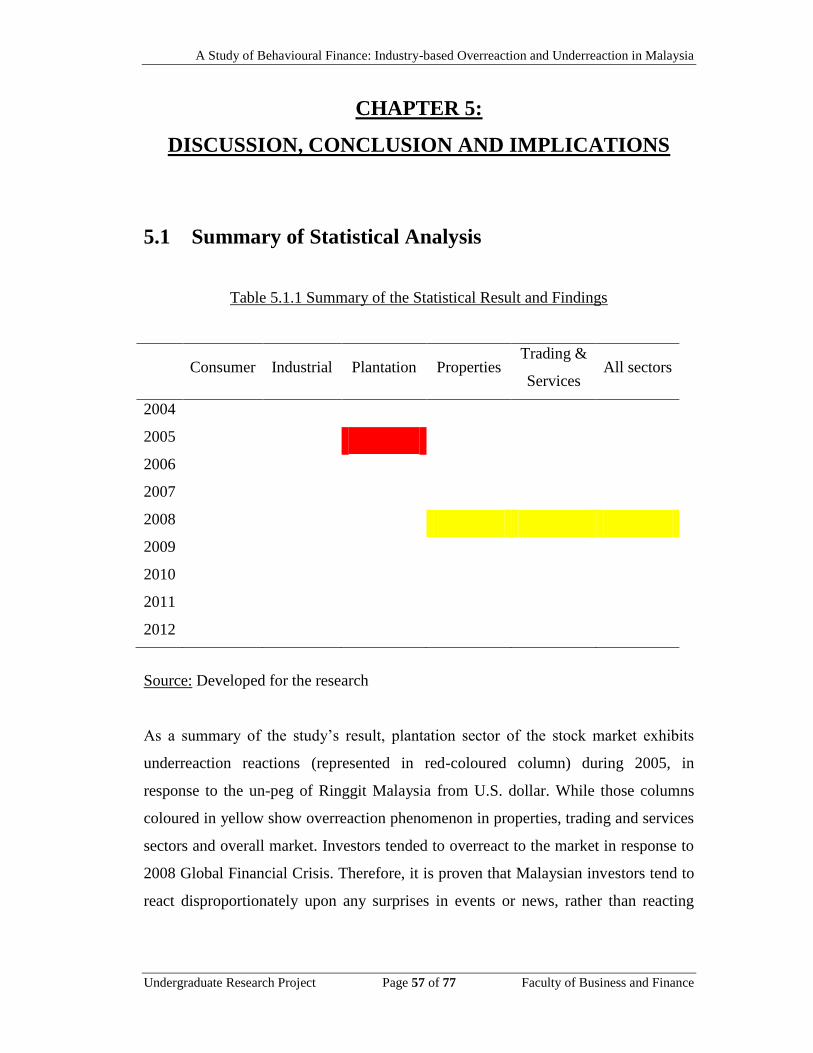


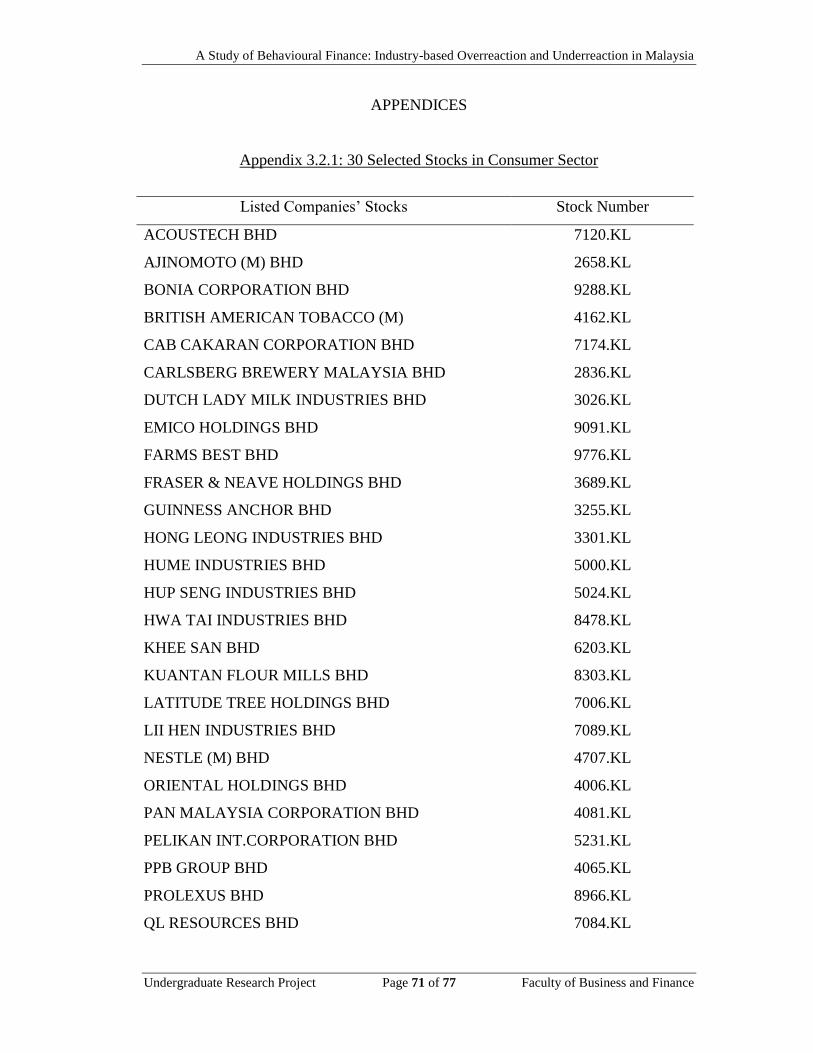

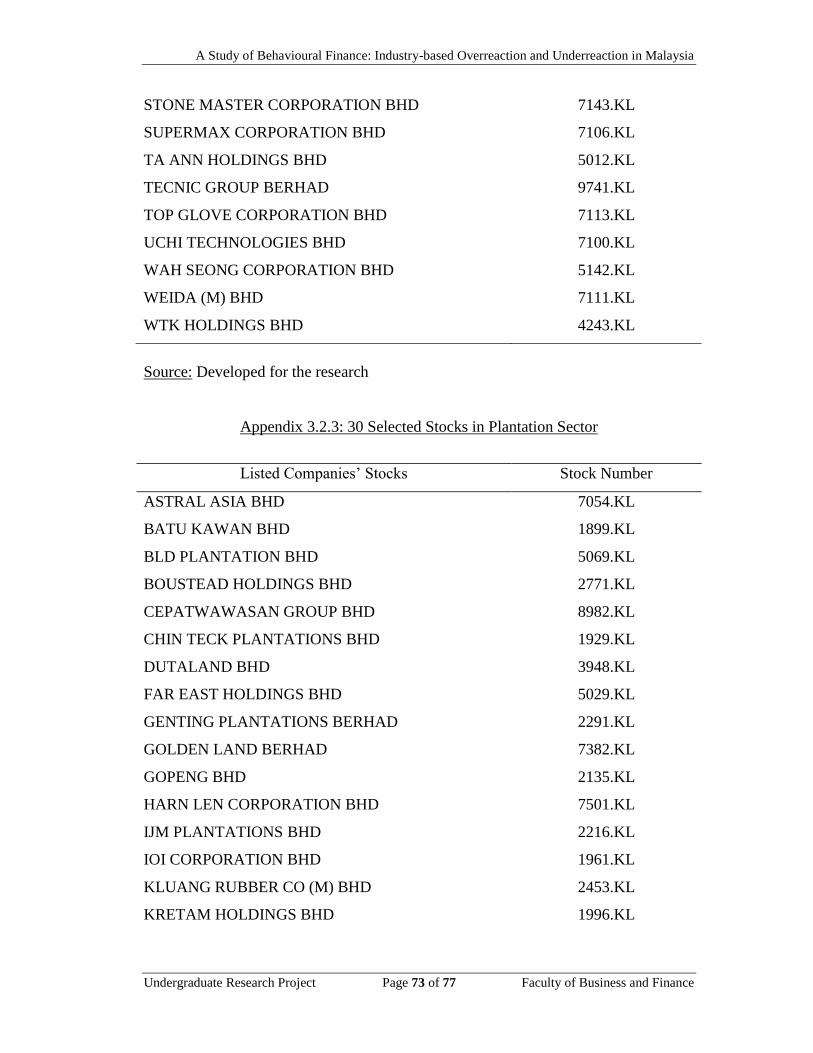
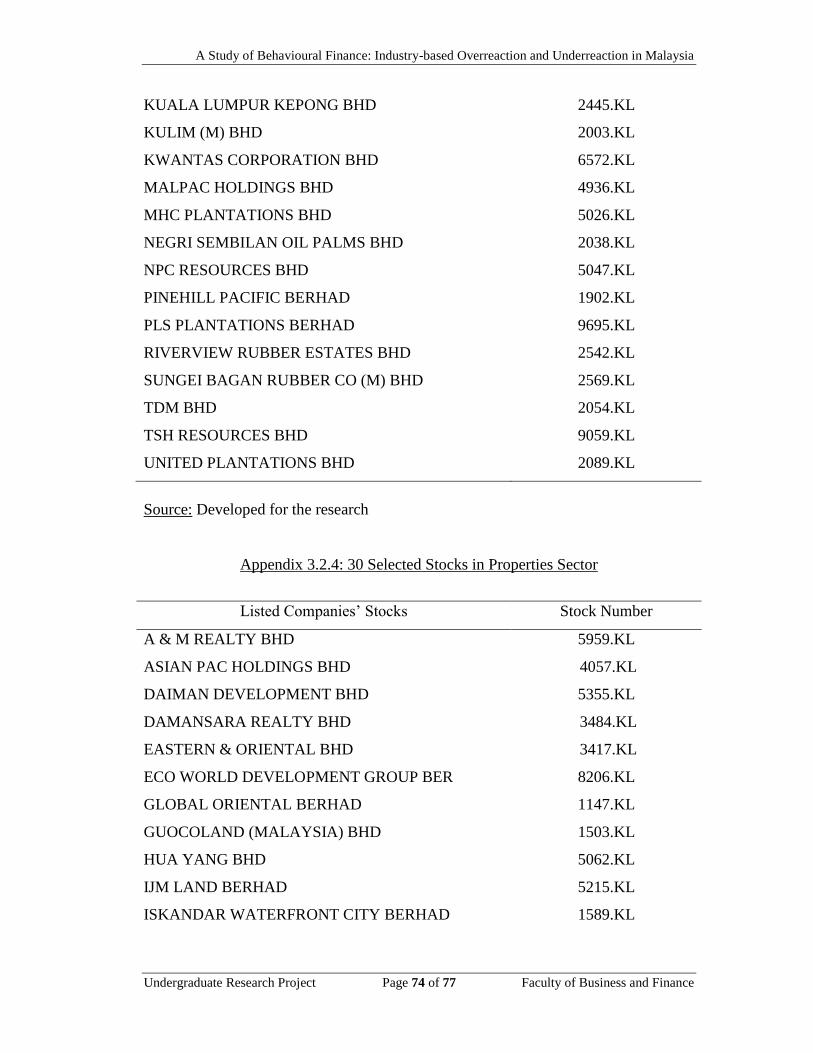
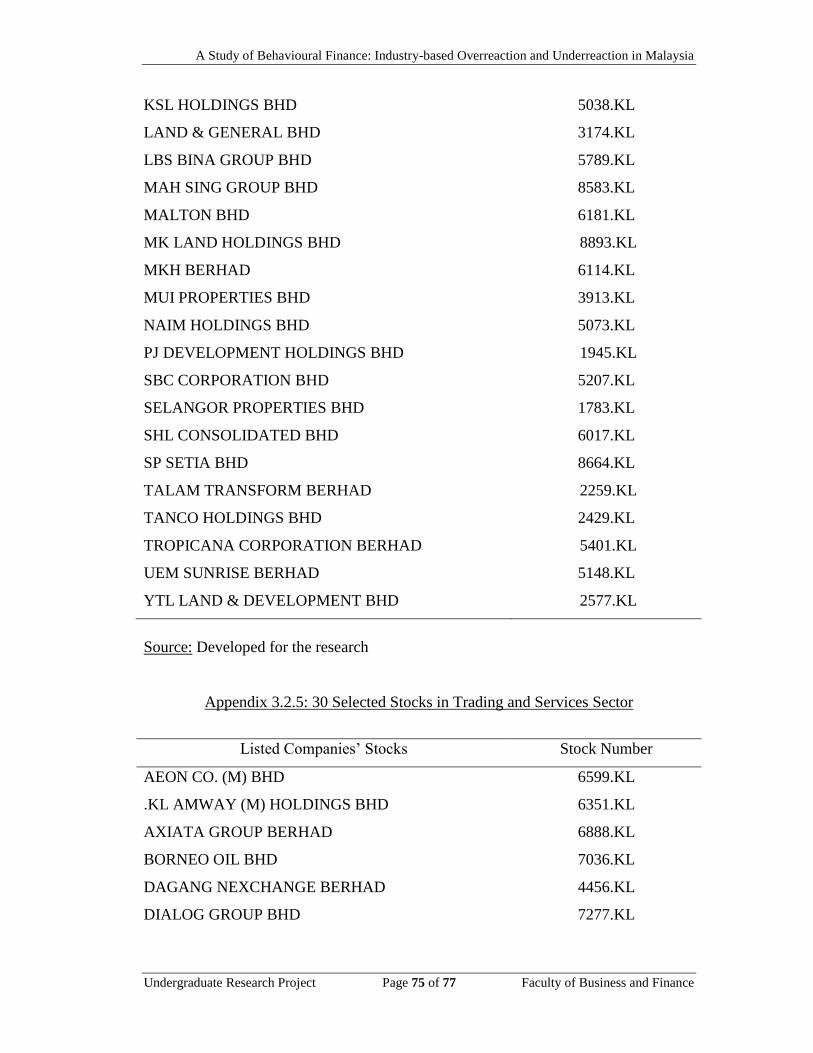
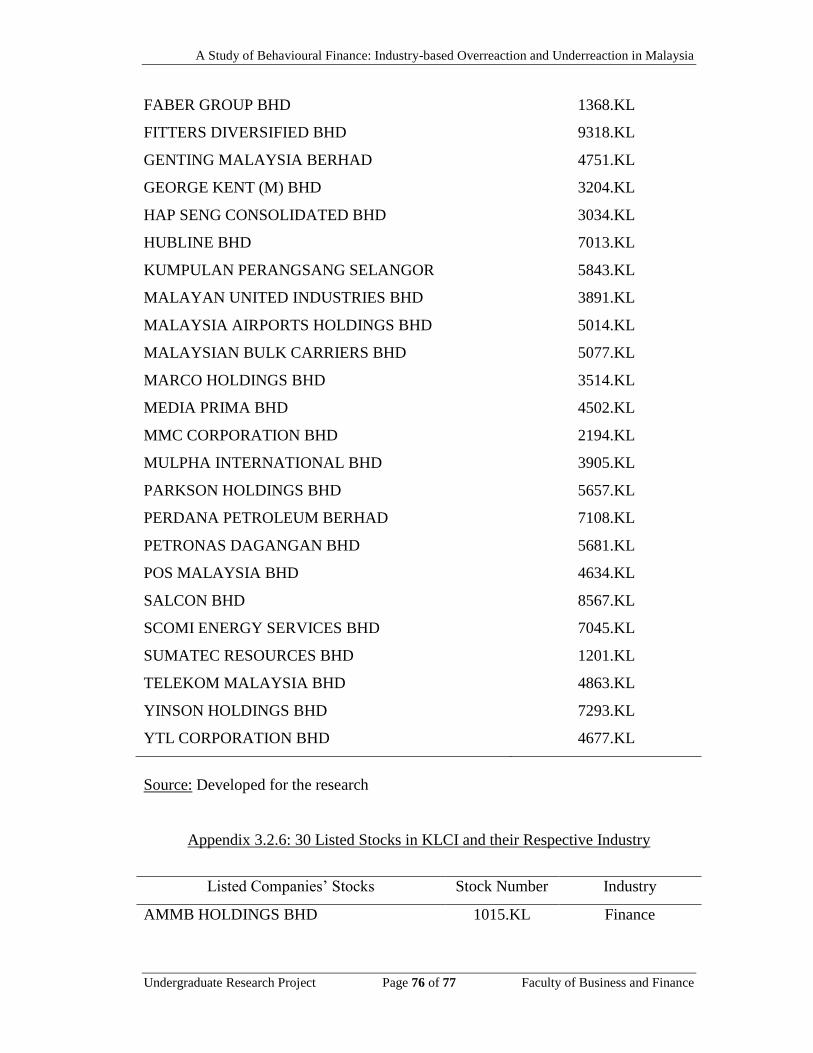
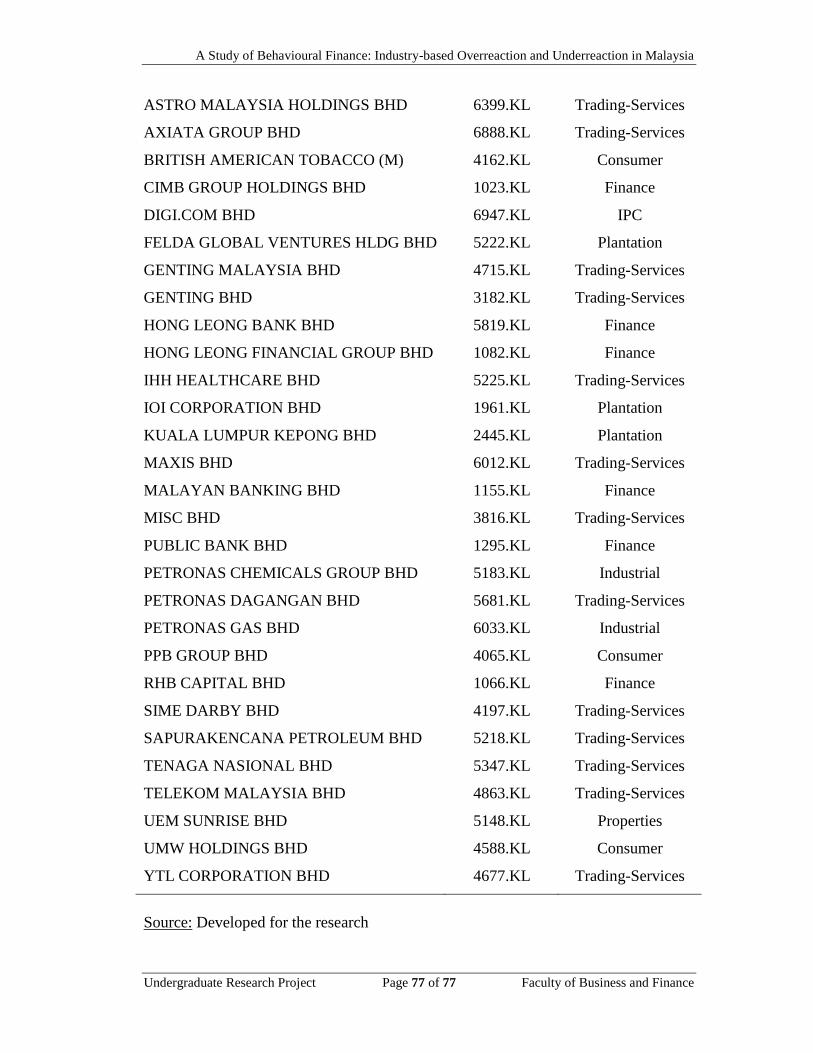


![Chapter 4 Behavioural Finance[1]](https://static.documents.pub/doc/80x56/577cd7041a28ab9e789dd2ce/chapter-4-behavioural-finance1.jpg)


