193
FHWA/IN/JTRP-2007/12 Final Report A STUDY OF EFFECTIVE SOIL COMPACTION CONTROL OF GRANULAR SOILS Vincent Drnevich Aaron Evans Adam Prochaska July 2007
FHWA/IN/JTRP-2007/12
Final Report
A STUDY OF EFFECTIVE SOIL COMPACTION CONTROL OF GRANULAR SOILS
Vincent Drnevich Aaron Evans Adam Prochaska
July 2007
Final Report
FHWA/IN/JTRP-2007/12
A Study of Effective Soil Compaction Control of Granular Soils
by
Vincent Drnevich, P.E., Ph.D., Professor Aaron C. Evans, M.S., Research Assistant Adam Prochaska, M.S., Research Assistant
School of Civil Engineering
Purdue University
Joint Transportation Research Program Project No. C-36-36OO
File No. 6-14-41 SPR-2783
Conducted in Cooperation with the
Indiana Department of Transportation and the U.S. Department of Transportation
Federal Highway Administration
The content of this report reflect the views of the authors who are responsible for the facts and the accuracy of the data presented herein. The contents do not necessarily reflect the official views or policies of the Indiana Department of Transportation or the Federal Highway Administration at the time of publication. This report does not constitute a standard, specification, or regulation.
School of Civil Engineering Purdue University
July 2007
TECHNICAL REPORT STANDARD TITLE PAGE 1. Report No.
2. Government Accession No. 3. Recipient's Catalog No.
FHWA/IN/JTRP-2007/12
4. Title and Subtitle A Study of Effective Soil Compaction Control of Granular Soils
5. Report Date July 2007
6. Performing Organization Code 7. Author(s) Vincent Drnevich, Aaron Evans, Adam Prochaska
8. Performing Organization Report No. FHWA/IN/JTRP-2007/12
9. Performing Organization Name and Address Joint Transportation Research Program 1284 Civil Engineering Building Purdue University West Lafayette, IN 47907-1284
10. Work Unit No.
11. Contract or Grant No. SPR-2783
12. Sponsoring Agency Name and Address Indiana Department of Transportation State Office Building 100 North Senate Avenue Indianapolis, IN 46204
13. Type of Report and Period Covered
Final Report
14. Sponsoring Agency Code 15. Supplementary Notes Prepared in cooperation with the Indiana Department of Transportation and Federal Highway Administration. 16. Abstract Although it is known that impact compaction tests are not appropriate for granular soils, these tests continue to be widely used. Excessive settlements frequently occur in granular soils where specified field compaction is based on Standard Proctor (ASTM D 698; AASHTO T 99) maximum dry unit weights. A laboratory test program evaluated alternative test methods for granular soil compaction control and showed that a Vibrating Hammer method (similar to British Standard BS 1377:1975, Test 14) has great promise for laboratory compaction of these soils.
A One-Point Vibrating Hammer test on an oven-dry soil sample is able to provide the maximum dry unit weight and water content range for effective field compaction of most granular soils. The maximum dry unit weight obtained is comparable to that from other current methods such as the Vibrating Table test (ASTM D 4253) and the Modified Proctor test (ASTM D 1557), and is greater than that from the Standard Proctor test (ASTM D 698). The method is applicable to a broader range of soils than current vibratory table compaction tests (up to 35 percent non-plastic fines and up to 15 percent plastic fines). The equipment is relatively inexpensive and is portable enough to be taken into the field. The test is easier and quicker to perform than the other methods mentioned above and provides reproducible and consistent results.
Large sized granular soils/aggregates create potential problems for compaction control methods due to the presence of oversize particles. Oversize particles defined here are those retained on a 3/4-inch (19-mm) sieve. INDOT Specification 202.34 (b) 2 requiring correction of densities from laboratory compaction tests on soils with oversized particles is not being used in practice. It is not being followed primarily because guidance is not provided. As a result, the values of maximum dry unit weight from standard compaction tests will be significantly lower than those corrected for oversized particles. This finding may be the biggest reason why granular fills with oversized particles are under- performing. The proposed Vibrating Hammer Method of Compaction specifically addresses the influence of oversize particles.
Based on the results from this research, a draft ASTM Standard for the Vibrating Hammer Method of Compaction has been written, is well into the balloting process, and should become an ASTM Standard Method of Test in late 2007 or early 2008. It is included in Appendix A. This report also introduces a simple calibration procedure to verify that the vibrating hammer is supplying sufficient energy to the soil.
The Vibrating Hammer Method of Compaction is an alternative method for specifying maximum dry unit weights for granular soils. The method also establishes a water content range for field compaction. This research expands the applicable range of granular soils to those containing oversize particles. An experimental program, along with review of previous compaction research, was carried out to determine the effect of oversize particles on compaction performance. Testing was performed in two sizes of compaction molds, 6-inch and 11-inch, in determining this effect. An oversize correction method was considered for water content and dry density when performing a test in a 6-inch mold with scalping, i.e. removal of oversize particles. Results of an INDOT pilot implementation project used to determine the viability of using the Vibrating Hammer for field compaction are reported. Results indicate that the Vibrating Hammer method is sufficient for use with oversize particles and that maximum dry unit weights may occur at or near saturation. 17. Key Words Compaction, granular soils, sands, gravels, laboratory compaction device, vibratory hammer, field measurements of compaction, soil density, soil water content, TDR measurements
18. Distribution Statement No restrictions. This document is available to the public through the National Technical Information Service, Springfield, VA 22161
19. Security Classif. (of this report)
Unclassified
20. Security Classif. (of this page)
Unclassified
21. No. of Pages
197
22. Price
Form DOT F 1700.7 (8-69)
Final Report
SPR 2783 Effective Compaction of Granular Soils, 7/20/07, Pg. viii
TABLE OF CONTENTS
Page
TABLE OF CONTENTS ................................................................................................. viii
LIST OF TABLES ........................................................................................................... xiii
LIST OF FIGURES .......................................................................................................... xv
CHAPTER 1. INTRODUCTION ....................................................................................... 1
1.1. Objectives ..................................................................................................................1
1.2. Research Tasks ..........................................................................................................1
1.3. Background ...............................................................................................................3
1.4. Cohesive Soils and Impact Compaction ....................................................................4
1.5. Granular Soils and Vibratory Compaction ................................................................7
1.5.1. Compaction Characteristics ............................................................................... 7
1.5.2. Relative Density ................................................................................................. 8
1.5.3. Vibrating Table Tests ....................................................................................... 10
1.5.4. Vibrating Hammer Compaction Tests ............................................................. 12
1.6. Current State of Practice ..........................................................................................13
1.6.1. INDOT Practices .............................................................................................. 15
1.7. Compaction Issues ...................................................................................................16
1.7.1. Water Content .................................................................................................. 16
1.7.2. Mold Size ......................................................................................................... 17
1.7.3. Oversized Particles ........................................................................................... 18
Final Report
SPR 2783 Effective Compaction of Granular Soils, 7/20/07, Pg. ix
1.7.4. Particle Angularity ........................................................................................... 21
1.7.5. Segregation ....................................................................................................... 21
1.8. Recent Trends in Compaction Research .................................................................22
1.8.1. Gyratory Compaction ....................................................................................... 22
1.8.2. Intelligent Compaction Systems ...................................................................... 22
1.8.3. Iowa State Embankment Quality Study ........................................................... 23
1.8.4. Vibrating Hammer Compaction ....................................................................... 24
1.9. Soil Classification by Particle Size (Granular vs. Fine-grained materials) .............25
1.10. Oversize Particles ..................................................................................................26
CHAPTER 2. COMPACTION AND THE VIBRATING HAMMER METHOD FOR GRANULAR SOILS WITHOUT OVERSIZED PARTICLES ....................................... 27
2.1. Introduction .............................................................................................................27
2.2. INDOT Materials ....................................................................................................27
2.3. Materials Tested ......................................................................................................27
2.4. Equipment Used ......................................................................................................32
2.5. Procedures ...............................................................................................................37
2.6. Results and Discussion ............................................................................................39
2.6.1. Soils with Less Than 15 Percent Fines ............................................................ 39
2.6.2. Soils with Greater Than 15 Percent Fines ........................................................ 42
2.7. One-Point Vibrating Hammer Compaction Method ...............................................46
CHAPTER 3. COMPACTION AND THE VIBRATING HAMMER METHODfor GRANULAR SOILS WITH OVERSIZED PARTICLES ............................................... 53
3.1. Introduction .............................................................................................................53
3.2. Correction for Oversize Particles ............................................................................53
Final Report
SPR 2783 Effective Compaction of Granular Soils, 7/20/07, Pg. x
3.3. INDOT Current Methods ........................................................................................55
3.4. Materials Tested ......................................................................................................56
3.5. Equipment Used ......................................................................................................59
3.6. Testing Procedures ..................................................................................................64
3.6.1. Vibrating Hammer ........................................................................................... 64
3.6.2. Calculations and Data Corrections ................................................................... 70
3.7. Results and Discussion ............................................................................................70
3.7.1. Vibratory Tests at INDOT Crawfordsville District Materials Testing Lab ..... 76
CHAPTER 4. TIME DOMAIN REFLECTOMERY FOR SOIL WATER CONTENT AND DENSITY ................................................................................................................ 80
4.1. TDR Basics and History ..........................................................................................80
4.2. Purdue TDR Method ...............................................................................................81
4.3. Determining Water Content and Dry Density .........................................................83
4.3.1. Apparent Dielectric Constant ........................................................................... 83
4.3.2. Bulk Electrical Conductivity ............................................................................ 85
4.3.3. Temperature Corrections for Ka ....................................................................... 85
4.3.4. Semi-empirical Calibration Equations ............................................................. 86
4.4. Effects on Measurement of Ka Using a Coaxial Probe ...........................................88
4.4.1. Effect of Conductor Spacing and Diameters .................................................... 88
4.4.2. Effect of Change in Density ............................................................................. 88
4.4.3. Effect of Air Gap Around Center Rod/Skin Effects ........................................ 91
4.5. Mold (Coaxial) Probe versus MRP .........................................................................91
4.6. ECb Correction for Probe Configuration .................................................................93
4.7. Effect of Wavelength on EM Wave Propagation ....................................................94
Final Report
SPR 2783 Effective Compaction of Granular Soils, 7/20/07, Pg. xi
4.8. Soil Effects on Electrical Conductivity ...................................................................96
CHAPTER 5. TDR (CALIBRATION) TESTING ........................................................... 98
5.1. Materials Tested ......................................................................................................98
5.2. Equipment Used ......................................................................................................99
5.3. Testing Procedures ................................................................................................100
5.3.1. TDR testing .................................................................................................... 100
5.3.2. Calibration Calculations ................................................................................. 103
5.4. Results and Discussion ..........................................................................................103
CHAPTER 6. PILOT IMPLEMENTATION PROJECT ............................................... 113
6.1. Objectives ..............................................................................................................113
6.2. Location and Information ......................................................................................113
6.3. Details of Project ...................................................................................................114
6.4. Preparation for Compaction Control and On-site Testing .....................................116
6.4.1. Vibrating Hammer Method of Compaction ................................................... 116
6.4.2. TDR ................................................................................................................ 118
6.5. Compaction Control and On-Site Testing .............................................................118
6.6. Results and Discussion ..........................................................................................120
6.6.1. Vibrating Hammer: Dry Unit Weight and Water Content ............................ 120
6.6.2. TDR ................................................................................................................ 124
CHAPTER 7. CONCLUSIONS AND RECOMMENDATIONS .................................. 129
7.1. Summary of Results and Conclusions ...................................................................129
7.1.1. Vibrating Hammer ......................................................................................... 129
7.1.2. Time Domain Reflectometry .......................................................................... 129
Final Report
SPR 2783 Effective Compaction of Granular Soils, 7/20/07, Pg. xii
7.2. Recommendations for Future Research (Further Study) .......................................130
7.3. Recommendations for Implementation .................................................................130
ACKNOWLEDGMENTS .............................................................................................. 132
LIST OF REFERENCES ................................................................................................ 133
APPENDICES ................................................................................................................ 146
Appendix A. Draft ASTM Standard for Vibrating Hammer ........................................147
Appendix B. Vibrating Hammer Additional Tests and Result .....................................170
Appendix C. Noise Reducing Enclosure for Vibrating Hammer .................................174
Appendix D. Pilot Implementation Project Supplement Specification .......................177
Final Report
SPR 2783 Effective Compaction of Granular Soils, 7/20/07, Pg. xiii
LIST OF TABLES
Page
Table 1.1 Impact Compaction Test Specifications ............................................................. 6
Table 1.2. Vibrating Table Test Specifications ................................................................ 11
Table 1.3. Technical Specifications for BS 1377 and BS 5835 ........................................ 12
Table 1.4. Embankment Compaction Control Specifications for State DOTs ................. 14
Table 1.5. Operating Characteristics of Vibratory Compaction Equipment ..................... 14
Table 1.6. Technical Specifications for Draft of USBR 5535 .......................................... 24
Table 1.7 Soil classification by particle size (from Das, 2002) ........................................ 25
Table 2.1 Gradation Requirements for B Borrow ............................................................. 28
Table 2.2 Gradation Requirements for Indiana 53 ............................................................ 28
Table 2.3 Index Properties of Soils Tested ....................................................................... 31
Table 2.4 Classifications of Soils Tested .......................................................................... 31
Table 2.5 Technical Specifications for the Bosch model 11248EVS Hammer ................ 32
Table 2.6 Vibrating Hammer Test Specifics ..................................................................... 38
Table 2.7 Soils included in the One-Point Vibrating Hammer Compaction Method ....... 47
Table 2.8 Water Content Ranges for Effective Field Compaction for the One-Point Vibrating Hammer Compaction Test ......................................................................... 49
Table 3.1 INDOT aggregate size classification and gradation (INDOT, 2006) .............. 57
Table 3.2 Materials tested; including source and gradation ............................................. 57
Table 3.3 Index properties of materials tested .................................................................. 59
Table 3.4 Soil classifications of materials tested .............................................................. 59
Table 4.1 Shape factors and equivalent outer and inner conductor ratios (Dallinger, 2006) .................................................................................................................................... 94
Final Report
SPR 2783 Effective Compaction of Granular Soils, 7/20/07, Pg. xiv
Table 4.2 Approximate max. frequencies to limit spatial dispersion ............................... 96
Table 5.1 Dielectric constant and electrical conductivity values for components of materials tested (Santamarina, 2001 and Weast, 1988) ............................................. 98
Table 5.2 Calibration factors, a andb , and R2 for apparent dielectric constant, aK .... 104
Table 5.3 Calibration factors, c and d , and R2 for bulk electrical conductivity, bEC .. 104
Table 5.4 Calibration factors, f and g , and R2 for aK and bEC .................................. 105
Table 6.1 Maximum dry unit weight and water content range specified for pilot project .................................................................................................................................. 117
Table 6.2 TDR calibration constants based on 6-inch mold (coaxial) calibration .......... 118
Table 6.3 TDR calibration constants based on 6-inch mold with MRP calibration ....... 118
Table 6.4 TDR calibration constants based on 11-inch mold with MRP calibration ..... 118
Table 6.5 INDOT nuclear test results with percent compaction ..................................... 122
Table B.1 Additional aggregates tested; including source and gradation ....................... 171
Final Report
SPR 2783 Effective Compaction of Granular Soils, 7/20/07, Pg. xv
LIST OF FIGURES
Page
Figure 1.1 Compaction Curve for a Cohesive Soil ............................................................. 4
Figure 1.2. Compaction Curve for a Granular Soil ............................................................. 8
Figure 2.1 Particle Size Distributions for Uniform Sands ................................................ 29
Figure 2.2 Particle Size Distributions for Crosby Till and Grundite ................................ 30
Figure 2.3 Particle Size Distributions for Mixtures of Concrete Sand and Crosby Till ... 30
Figure 2.4 Particle Size Distributions for Mixtures of Concrete Sand and Grundite ...... 30
Figure 2.5 Vibrating Hammer and Frame ........................................................................ 33
Figure 2.6 Elevation (a) and Plan View (b) of Hammer Clamp Assembly ..................... 33
Figure 2.7 Elevation (a) and Plan View (b) of Complete Hammer Frame ...................... 34
Figure 2.8 Plan View (a) and Elevation (b) of 11-inch Compaction Mold ..................... 35
Figure 2.9 Plan View (a) and Elevation (b) of 6-inch Tamper Foot ................................. 36
Figure 2.10 Compaction Results for Dune Sand .............................................................. 39
Figure 2.11 Compaction Results for Masonry Sand ......................................................... 40
Figure 2.12 Compaction Results for Play Sand ............................................................... 41
Figure 2.13 Compaction Results for Concrete Sand ......................................................... 41
Figure 2.14 Compaction Results for Concrete Sand mixed with Grundite to 9% Fines .. 42
Figure 2.15 Compaction Results for Concrete Sand mixed with Crosby Till to 16% Fines .................................................................................................................................... 43
Figure 2.16 Compaction Results for Concrete Sand mixed with Crosby Till to 38% Fines .................................................................................................................................... 43
Figure 2.17 Compaction Results for Concrete Sand mixed with Grundite to 18% Fines 44
Figure 2.18 Compaction Results for Concrete Sand mixed with Grundite to 26% Fines 44
Final Report
SPR 2783 Effective Compaction of Granular Soils, 7/20/07, Pg. xvi
Figure 2.19 Compaction Results for Concrete Sand mixed with Grundite to 32% Fines 45
Figure 2.20 Vibrating Hammer versus Vibrating Table Maximum Dry Unit Weight Results ........................................................................................................................ 46
Figure 2.21 Vibrating Hammer versus Standard Proctor Maximum Dry Unit Weight Results ........................................................................................................................ 46
Figure 2.22 Normalized Family of Curves ...................................................................... 47
Figure 2.23 One-Point Vibrating Hammer Compaction Test Example for Concrete Sand mixed with Grundite to 9 percent Fines ..................................................................... 49
Figure 2.24 Relative Density versus w/wZAV ................................................................... 50
Figure 2.25 Comparison of Calculated Water Content Ranges ....................................... 51
Figure 2.26 Values of ( )/d d oven dryγ γ
−obtainable between 80 and 100 percent of ZAVw
versus Percent Fines ................................................................................................... 52
Figure 3.1 Particle size distribution for Indiana 53s ........................................................ 58
Figure 3.2 Particle size distribution of Indiana 8 coarse aggregates ................................ 58
Figure 3.3 a) Plan and b) elevation view of 11-inch compaction mold (Prochaska, 2004) .................................................................................................................................... 60
Figure 3.4 Noise reducing enclosure for Vibrating hammer: a) closed b) one side opened .................................................................................................................................... 61
Figure 3.5 Sound measurements of Vibrating Hammer ................................................... 62
Figure 3.6 Vibrating Hammer modified with mechanical lifting mechanism ................. 63
Figure 3.7 Vibrating Hammer modified with heavy duty casters .................................... 63
Figure 3.8 Vibrating pattern and sequence of 6-in tamper within 11-in mold ................ 65
Figure 3.9 a) Sticking of aggregate to tamper for 6-inch mold and b) resulting in loosened surface within 6-inch mold; c) sticking of aggregate to tamper for 11-inch mold; d) sticking of aggregate for 6-inch mold, resulting in surface below top of mold ............................................................................................................................ 67
Figure 3.10 Preparing 11-inch compaction specimen for oven-drying: a) emptying of mold into large pan with hoist and b) lifting of specimen into oven ......................... 69
Final Report
SPR 2783 Effective Compaction of Granular Soils, 7/20/07, Pg. xvii
Figure 3.11 Upward fine migration for 6-mold compaction tests near saturation: a) Indiana 53 crushed stone and b) Indiana 53 gravel .................................................... 70
Figure 3.12 IN-53S-2180 compaction results ................................................................... 71
Figure 3.13 IN-53G-2119 compaction results .................................................................. 72
Figure 3.14 IN-53SLAG-B compaction results ................................................................ 73
Figure 3.15 IN-08S-VM compaction results .................................................................... 73
Figure 3.16 IN-08GAP-SSG compaction results .............................................................. 74
Figure 3.17 Vibrating hammer and standard Proctor maximum dry unit weights for Indiana 53 crushed stones (INDOT Crawfordsville District Materials Testing Lab) 77
Figure 3.18 Vibrating hammer and standard Proctor maximum dry unit weights for Indiana 53 gravels (INDOT Crawfordsville District Materials Testing Lab) ............ 77
Figure 3.19 Particle size degradation of Indiana 53 crushed stone (IN-53S-2180) .......... 78
Figure 3.20 Particle size degradation of Indiana 53 gravel (IN-53G-2119) ..................... 79
Figure 4.1 TDR system main components (Robinson et al. 2003) ................................... 81
Figure 4.2 TDR system schematic (Yu and Drnevich, 2004) ........................................... 82
Figure 4.3 a) Mold (coaxial) and b) multiple rod probe (MRP) probe configurations (Lin et al., 2006) ................................................................................................................. 82
Figure 4.4 A typical TDR waveform ................................................................................ 84
Figure 4.5 Purdue TDR One-Step Method data analysis for determining dry density and water content of soils (Yu and Drnevich, 2004) ........................................................ 87
Figure 4.6 Change in apparent dielectric constant due to center rod insertion for a mold (coaxial) probe (Siddiqui et al., 2000) ....................................................................... 89
Figure 4.7 Relative density, Dr, as a function of radial distance due to cavity expansion for initial values of a) 30% and b) 70% (Siddiqui and Drnevich, 1995) ................... 91
Figure 4.8 a) Mold (coaxial) probe and b) MRP configurations with associated electrical potential or voltage distribution (Lin et al., 2006) ..................................................... 92
Figure 4.9 Brillouin effect of elastic waves in particulate media: a) no excitation and harmonic excitation with 20aλ = and 2aλ = , b) velocity as dependent upon wavelength and spatial scale (Santamarina, 2001) .................................................... 95
Final Report
SPR 2783 Effective Compaction of Granular Soils, 7/20/07, Pg. xviii
Figure 5.1 The 6-inch compaction mold with a Delrin (plastic) base .............................. 99
Figure 5.2 TDR testing in 6-inch compaction mold: a) center conductor rod and adapter ring installed, c) MRP aluminum template with all probe rods installed, and c) coaxial probe head placed upon MRP configuration ............................................... 101
Figure 5.3 TDR testing in 11-inch compaction mold with MRP configuration: a) all conductor rods installed, b) coaxial probe head placed upon conductor rods.......... 102
Figure 5.4 IN-53S-2180 calibration of a) constants a and b for apparent dielectric constant, b) constants c and d for bulk electrical conductivity, and c) constants f and g relating aK and bEC ............................................................................................ 107
Figure 5.5 IN-53G-2119 calibration of a) constants a and b for apparent dielectric constant, b) constants c and d for bulk electrical conductivity, and c) constants f and g relating aK and bEC ............................................................................................ 108
Figure 5.6 IN-53SLAG-B calibration of a) constants a and b for apparent dielectric constant, b) constants c and d for bulk electrical conductivity, and c) constants f and g relating aK and bEC ............................................................................................ 109
Figure 5.7 IN-08S-VM calibration of a) constants a and b for apparent dielectric constant, b) constants c and d for bulk electrical conductivity, and c) constants f and g relating aK and bEC ............................................................................................ 110
Figure 5.8 IN-08GAP-SSG calibration of a) constants a and b for apparent dielectric constant, b) constants c and d for bulk electrical conductivity, and c) constants f and g relating aK and bEC ............................................................................................ 111
Figure 6.1 Pilot project site location (INDOT, 2005) ..................................................... 114
Figure 6.2 Sequence of compaction process: a) aggregate has been dumped from a truck into a windrow, b) spreading of aggregate with a grader, c) compaction with a smooth single drum vibratory roller, and d) cutting of lift to final grade and placing of windrow for adjacent lift ...................................................................................... 115
Figure 6.3 Moisture + Density Indicator (M+DI): a) a new unit (DGSI, 2005) and b) unit on pilot project site ................................................................................................... 120
Figure 6.4 INDOT water contents for IN-53S-2180 before/during compaction ............ 121
Figure 6.5 INDOT water contents for IN-53G-2119 before/during compaction ............ 122
Final Report
SPR 2783 Effective Compaction of Granular Soils, 7/20/07, Pg. xix
Figure 6.6 Compacted surfaces of Indiana 53 a) gravel with no rutting, b) gravel with rutting, and c) crushed stone with no rutting ............................................................ 125
Figure 6.7 IN-53S-2180 TDR water content comparison for pilot project ..................... 125
Figure 6.8 IN-53S-2180 TDR dry unit weight comparison for pilot project .................. 126
Figure 6.9 IN-53G-2119 TDR water content comparison for pilot project .................... 127
Figure 6.10 IN-53G-2119 TDR dry unit weight comparison for pilot project ............... 128
Figure B.1 Particle size distribution of Indiana 53 coarse aggregates; additional aggregates tested ...................................................................................................... 172
Figure B.2 IN-53S-VM compaction results .................................................................... 172
Figure B.3 IN-53G-2134 compaction results .................................................................. 173
Figure B.4 IN-53G-UN compaction results .................................................................... 173
Final Report
SPR 2783 Effective Compaction of Granular Soils, 7/20/07, Pg. 1 of 178
CHAPTER 1. INTRODUCTION
1.1. Objectives
The ultimate objective of this project was to develop for INDOT an improved specification for compaction control of granular soils, along with recommendations for implementation of this new specification. The second objective was to define “granular soil”, and to develop simple criteria that would determine which compaction specification would be appropriate for an intermediate soil that is neither purely granular nor purely cohesive.
1.2. Research Tasks
This research involved the following tasks:
1. Further Definition of the Problem – While we have a reasonably good understanding of the problem, we obtained a much better description of the problem through an even more extensive literature search, discussions with those who have to deal with the problem, and examination of cases where the problem was encountered.
2. Analysis of Present Practices – Present practices in Indiana and in most states involve the use of the Standard Compaction Test (ASTM D698). Results from these test on granular materials do not provide the characteristic “parabolic” shape that allows for determining the maximum dry density and the optimum water content, but generate ones that are relatively flat with poorly defined peaks that may be due more to “bulking action” than a truly dense state for the soil. For this project, we examined:
a. Alternative laboratory test procedures to Standard and Modified Compaction tests for establishing compaction specifications for granular soils. These included:
i. Relative Density Tests (ASTM D4253 “Standard Test Methods for Maximum Index Density and Unit Weight of Soils Using a Vibratory Table” and ASTM D4254 “Standard Test Methods for Maximum Index Density and Unit Weight of Soils and Calculation of Relative Density”)
ii. Use of a vibratory hammer in place of the vibratory table, which better simulates field compaction, is more portable and simpler to use, and is less expensive.
Final Report
SPR 2783 Effective Compaction of Granular Soils, 7/20/07, Pg. 2 of 178
b. Construction specifications for placing and compacting granular soils.
c. Methods used for checking that specifications have been met.
3. Exploration and Validation of the Vibrating Hammer Method as a viable tool for establishing compaction control specifications for granular soils, including:
a. Applicability of this method with granular soils containing plastic and non-plastic fines.
b. Applicability of the Vibrating Hammer Method for soils/aggregates containing oversize particles.
c. Determine the applicability of current TDR methods for compaction control of soils/aggregates containing oversize particles.
4. Drafting of an ASTM Standard for use of the Vibrating Hammer Method – The Draft Standard was established from the testing done in this research and is well into the approval process in Committee D18 of ASTM.
5. Development of Guidelines for INDOT Use – This task translated the preferred alternatives identified in Task 4 to guidelines for use in practice. We worked with the SAC and INDOT Personnel to make the guidelines simple, easy to understand, and practical to implement. They include quality control measures.
6. Working with INDOT Personnel to Implement Guidelines on a demonstration project - This was done in conjunction with the Crawfordsville District to determine the overall applicability of the Vibrating Hammer Method for field use where large particle sized materials were used. The project was located at the Ivy Tech Campus in Terre Haute.
7. Evaluating Effectiveness of Guidelines – Obtained feedback from INDOT and users of the guidelines.
8. Dissemination of Findings through Publications and Presentations - This problem probably exists in many other states and regions. Results of this work have been disseminated through publications and presentations at the Transportation Research Board, the GeoFrontiers Conference, Geotechnical Group of Indiana, and the Purdue Geotechnical Society Workshop. Two master’s degree theses resulted from this project.
Final Report
SPR 2783 Effective Compaction of Granular Soils, 7/20/07, Pg. 3 of 178
1.3. Background
For almost all soil fills on construction projects, the soil must be compacted. The process of compaction involves the application of mechanical energy to expel air voids from the soil with a minimal, if any, change in the water content. Compaction differs from consolidation of soil, which is the reduction of voids in a saturated soil over time due to the expulsion of water. The process of compaction alters and improves the engineering properties of soils. When soils are compacted to a denser state, they will exhibit higher strength, lower compressibility, and lower permeability. Since it is expensive and time consuming to determine these properties, they are often estimated through the water content and degree of compactness of a soil mass.
Due to the expulsion of air during compaction, the density and unit weight of the soil are both increased. These two terms are often used mistakenly. Density refers to the amount of mass per unit of volume and can be expressed as lbm/ft3 (pounds-mass per cubic foot) or kg/m3 (kilograms per cubic meter) using the symbol ρ. Unit weight, on the other hand, is a measure of weight per unit of volume and is commonly expressed as lbf/ft3 (pounds-force per cubic foot, or pcf) or kN/m3 (kiloNewtons per cubic meter) using the symbol γ. In a gravitational system of units, 1 lbm/ft3 is equal to 1 lbf/ft3.
Throughout this report, unit weight and the inch-pound system of units are used almost exclusively. SI units may be provided in some instances for informational purposes. In a few cases for convenience, or in order to conform to an existing standard, SI units may be used exclusively.
To evaluate the degree of compactness of a soil, the dry unit weight (γd) is used as a criterion instead of the total unit weight (γ). This is because water offers no strength, and thus the performance of a fill can best be correlated to the amount of soil solids per unit volume. The dry unit weight is calculated as
1d wγγ =+
(1.1)
where w is the gravimetric water content of the soil, expressed as a decimal. The gravimetric water content is equal to the mass of water in a soil divided by the mass of soil solids that are present in the same unit of soil.
Dry unit weight is not a direct measure of soil properties, i.e. two different soils with the same dry unit weight will not exhibit the same engineering properties. In order to compare states of compactness between different soils, laboratory compaction tests must be conducted to determine the maximum dry unit weights for these soils. The appropriate laboratory compaction test varies for different soil types, as is described in the next two sections.
Final Report
SPR 2783 Effective Compaction of Granular Soils, 7/20/07, Pg. 4 of 178
1.4. Cohesive Soils and Impact Compaction
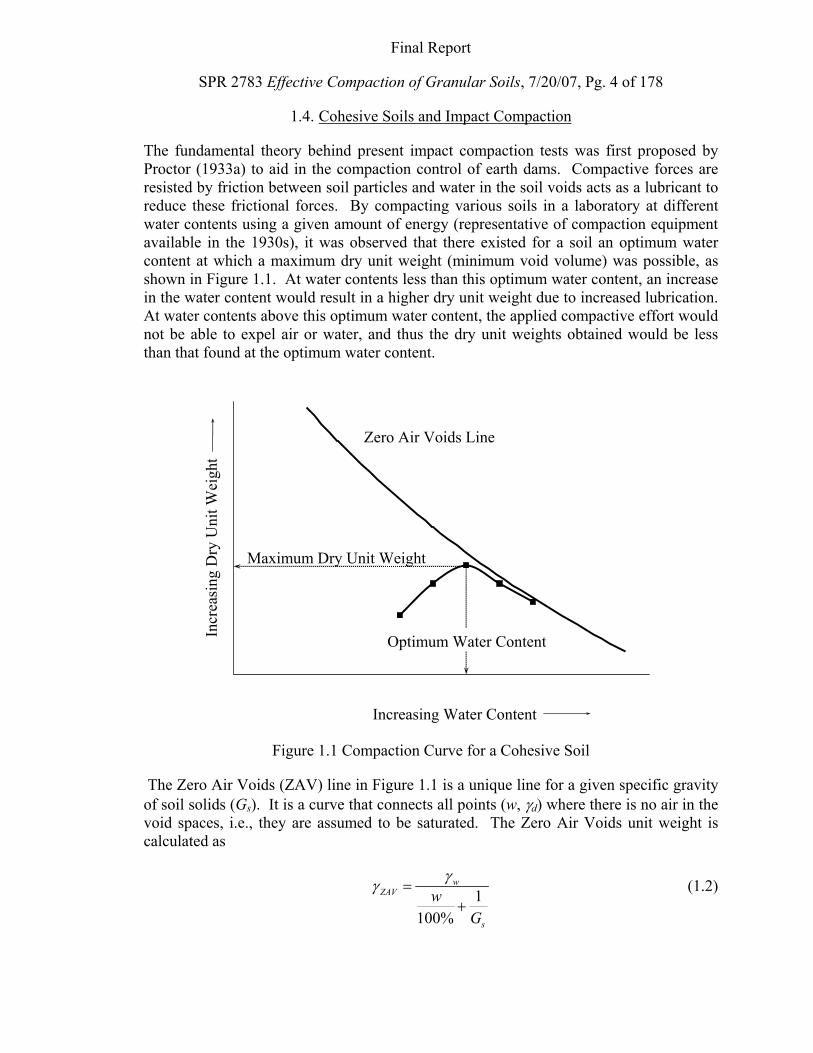
The fundamental theory behind present impact compaction tests was first proposed by Proctor (1933a) to aid in the compaction control of earth dams. Compactive forces are resisted by friction between soil particles and water in the soil voids acts as a lubricant to reduce these frictional forces. By compacting various soils in a laboratory at different water contents using a given amount of energy (representative of compaction equipment available in the 1930s), it was observed that there existed for a soil an optimum water content at which a maximum dry unit weight (minimum void volume) was possible, as shown in Figure 1.1. At water contents less than this optimum water content, an increase in the water content would result in a higher dry unit weight due to increased lubrication. At water contents above this optimum water content, the applied compactive effort would not be able to expel air or water, and thus the dry unit weights obtained would be less than that found at the optimum water content.
Figure 1.1 Compaction Curve for a Cohesive Soil
The Zero Air Voids (ZAV) line in Figure 1.1 is a unique line for a given specific gravity of soil solids (Gs). It is a curve that connects all points (w, γd) where there is no air in the void spaces, i.e., they are assumed to be saturated. The Zero Air Voids unit weight is calculated as
1100%
wZAV
s
wG
γγ =+
(1.2)
Optimum Water Content
Increasing Water Content
Incr
easi
ng D
ry U
nit W
eigh
t
Maximum Dry Unit Weight
Zero Air Voids Line
Final Report
SPR 2783 Effective Compaction of Granular Soils, 7/20/07, Pg. 5 of 178
where:
γZAV = unit weight assuming the voids are saturated
γw = unit weight of water (62.4 pcf or 9.81 kN/m3)
w = water content (percent) associated with no air in the void space, and
Gs = specific gravity of soil solids.
For dam construction, this optimum water content with the minimum percentage of voids was desirable for two reasons (Proctor, 1933a). First, less water would be required to saturate the soil; thus less lubrication would occur and the fill would have greater stability. Second, a fill with the minimum amount of voids would result in a more watertight dam.
While the original equipment used for the impact compaction test (Proctor, 1933b) has evolved, current tests (AASHTO T 99, ASTM D 698), commonly referred to as Standard Proctor tests, are identical in principle. In the 1940s new standards with higher compactive energies (AASHTO T 180, ASTM D 1557), commonly called Modified Proctor tests, were developed to account for advancements in field compaction equipment. Since the 1940s, although the performance of field compaction equipment has increased, no new advancements in impact compaction have been made (Ping, Leonard, and Yang, 2003a). Compactive effort is applied by dropping a hammer of known weight from a known height for a given number of times on each of several soil layers in a mold. Table 1.1 shows the specific specifications of impact compaction tests.
Although never implemented, a draft of another impact compaction test was proposed by Roberts (1976). In this proposed Marshall Hammer Compaction Test, the fraction of soil that passed the 0.75-inch sieve was to be compacted in a 4-inch mold using 5 lifts and 40 blows from a Marshall hammer per lift in order to provide a compactive effort of 90,000 ft-lbf/ft3. The Marshall hammer, as used with ASTM D 1559, has a weight of 10 lbf and a drop distance of 18 inches. Unlike the hammers used for the Standard and Modified Proctor tests, which have diameters of 2 inches, the diameter of the Marshall hammer is 3.875 inches. Due to the increased confinement provided by the smaller mold and larger-diameter hammer, this test was found to provide maximum dry unit weights of dense graded aggregates that were more representative of field conditions than Modified Proctor maximum dry unit weights. Maximum dry unit weights obtained from the Marshall test were on average 3 lbf/ft3 higher than those obtained from Modified Proctor tests (Roberts, 1976).
Final Report
SPR 2783 Effective Compaction of Granular Soils, 7/20/07, Pg. 6 of 178
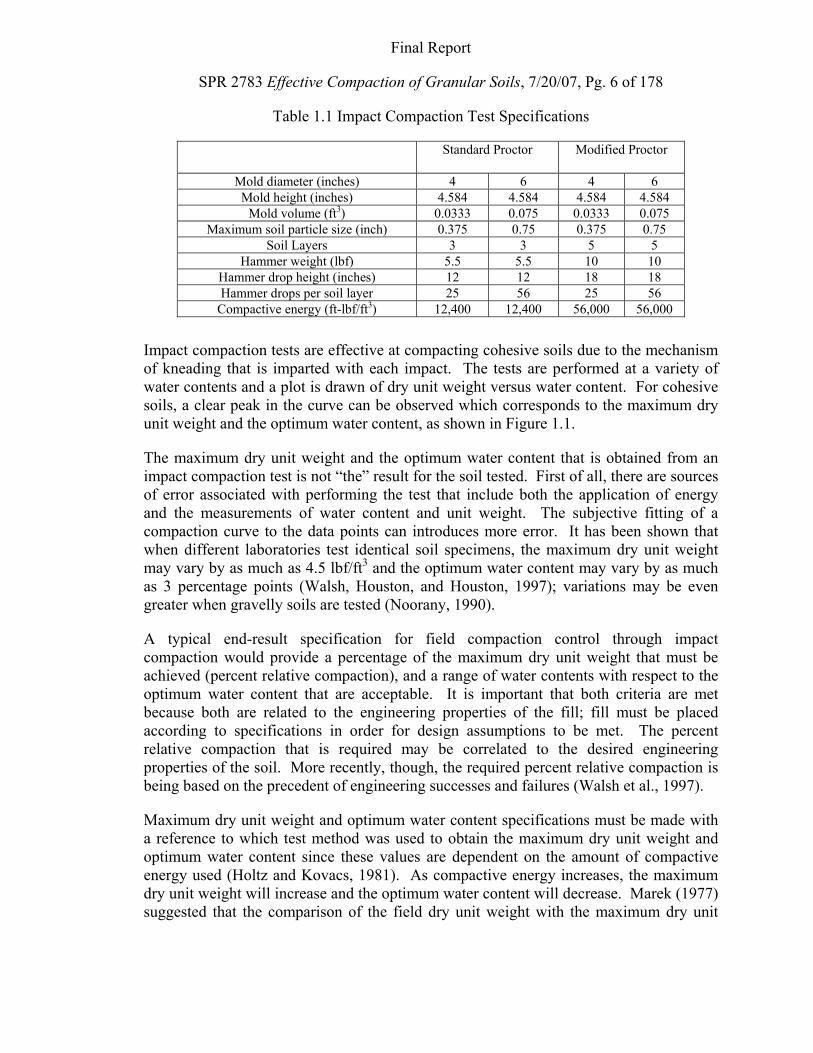
Table 1.1 Impact Compaction Test Specifications
Standard Proctor Modified Proctor
Mold diameter (inches) 4 6 4 6 Mold height (inches) 4.584 4.584 4.584 4.584
Mold volume (ft3) 0.0333 0.075 0.0333 0.075 Maximum soil particle size (inch) 0.375 0.75 0.375 0.75
Soil Layers 3 3 5 5 Hammer weight (lbf) 5.5 5.5 10 10
Hammer drop height (inches) 12 12 18 18 Hammer drops per soil layer 25 56 25 56
Compactive energy (ft-lbf/ft3) 12,400 12,400 56,000 56,000
Impact compaction tests are effective at compacting cohesive soils due to the mechanism of kneading that is imparted with each impact. The tests are performed at a variety of water contents and a plot is drawn of dry unit weight versus water content. For cohesive soils, a clear peak in the curve can be observed which corresponds to the maximum dry unit weight and the optimum water content, as shown in Figure 1.1.
The maximum dry unit weight and the optimum water content that is obtained from an impact compaction test is not “the” result for the soil tested. First of all, there are sources of error associated with performing the test that include both the application of energy and the measurements of water content and unit weight. The subjective fitting of a compaction curve to the data points can introduces more error. It has been shown that when different laboratories test identical soil specimens, the maximum dry unit weight may vary by as much as 4.5 lbf/ft3 and the optimum water content may vary by as much as 3 percentage points (Walsh, Houston, and Houston, 1997); variations may be even greater when gravelly soils are tested (Noorany, 1990).
A typical end-result specification for field compaction control through impact compaction would provide a percentage of the maximum dry unit weight that must be achieved (percent relative compaction), and a range of water contents with respect to the optimum water content that are acceptable. It is important that both criteria are met because both are related to the engineering properties of the fill; fill must be placed according to specifications in order for design assumptions to be met. The percent relative compaction that is required may be correlated to the desired engineering properties of the soil. More recently, though, the required percent relative compaction is being based on the precedent of engineering successes and failures (Walsh et al., 1997).
Maximum dry unit weight and optimum water content specifications must be made with a reference to which test method was used to obtain the maximum dry unit weight and optimum water content since these values are dependent on the amount of compactive energy used (Holtz and Kovacs, 1981). As compactive energy increases, the maximum dry unit weight will increase and the optimum water content will decrease. Marek (1977) suggested that the comparison of the field dry unit weight with the maximum dry unit
Final Report
SPR 2783 Effective Compaction of Granular Soils, 7/20/07, Pg. 7 of 178
weight determined from the laboratory is only correct if the same amount of compactive energy is used in both cases.
It is assumed that the compactive energy in the compaction test used will be representative of the compaction energy applied in the field. If soil in the field is drier than the optimum water content, an increase in compactive energy will increase the obtainable dry unit weight. If soil in the field is much wetter than the optimum water content, shearing of the soil rather than an increase in compaction will occur as the compactive energy is increased (USACE, 1995).
The above discussion should consider that compaction in the laboratory mold provides lateral restraint to the soil whereas in the field, there is less lateral restraint. Additionally, the mechanisms of applying compaction energy in the field are different from the laboratory methods.
1.5. Granular Soils and Vibratory Compaction
1.5.1. Compaction Characteristics
The definition of granular soil differs among different soil classification systems, with limits being placed on soils with maximum fines percentages of 50% (ASTM D 2487) and 35% (AASHTO M 145). Fines are any material that passes the #200 (0.075 mm) sieve. Within the range of granular soils, classifications of free-draining and semi-pervious are sometimes used. For most semi-pervious granular soils, fairly well defined maximum dry unit weights and optimum water contents can be determined through impact compaction (USACE, 1995). For free-draining granular soils, however, the effect of water content on compaction behavior is grossly different than that of cohesive and semi-pervious soils.
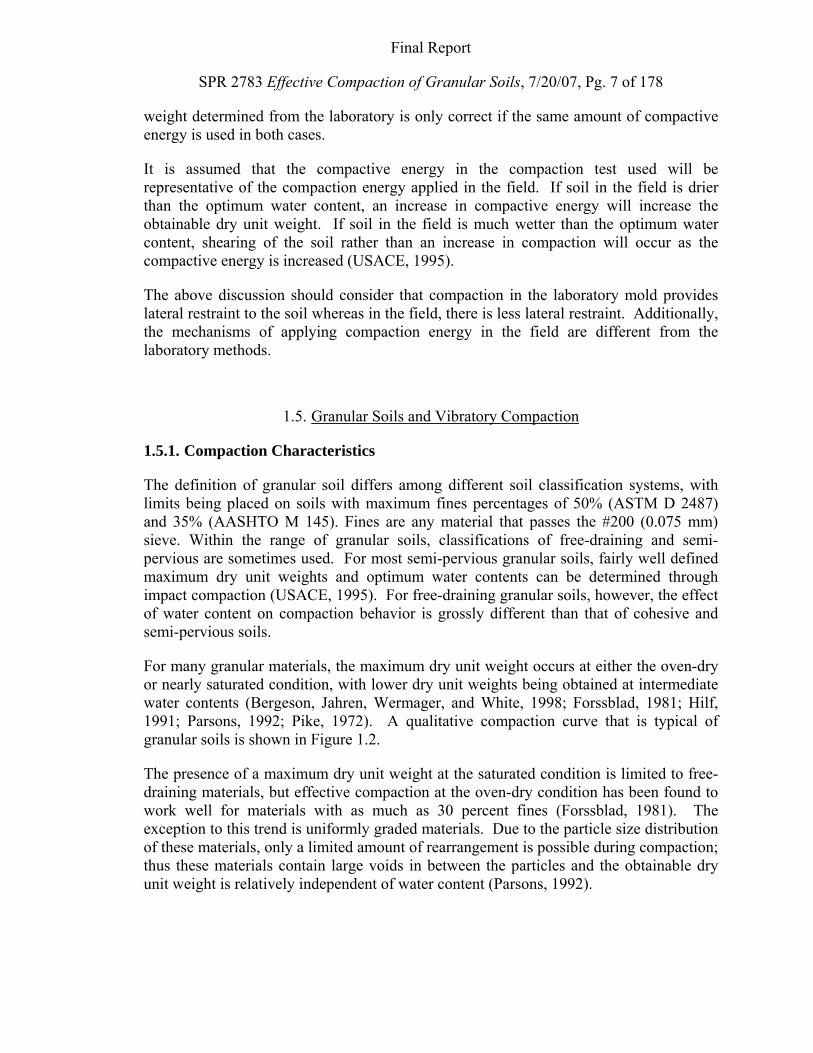
For many granular materials, the maximum dry unit weight occurs at either the oven-dry or nearly saturated condition, with lower dry unit weights being obtained at intermediate water contents (Bergeson, Jahren, Wermager, and White, 1998; Forssblad, 1981; Hilf, 1991; Parsons, 1992; Pike, 1972). A qualitative compaction curve that is typical of granular soils is shown in Figure 1.2.
The presence of a maximum dry unit weight at the saturated condition is limited to free-draining materials, but effective compaction at the oven-dry condition has been found to work well for materials with as much as 30 percent fines (Forssblad, 1981). The exception to this trend is uniformly graded materials. Due to the particle size distribution of these materials, only a limited amount of rearrangement is possible during compaction; thus these materials contain large voids in between the particles and the obtainable dry unit weight is relatively independent of water content (Parsons, 1992).
Final Report
SPR 2783 Effective Compaction of Granular Soils, 7/20/07, Pg. 8 of 178
0 Increasing Water Content
Incr
easi
ng D
ry U
nit W
eigh
t
Zero Air Voids Line
Figure 1.2. Compaction Curve for a Granular Soil
The reason for lower dry unit weights being obtainable at intermediate water contents is due to a phenomenon called bulking (Hilf, 1991); the water contents at which this phenomenon occurs are known as bulking water contents. Bulking is due to the capillary stresses that exist under low water contents. In a partially saturated soil, a curved surface develops at the water-air interface, which is stressed in tension. This tension stress is transmitted to the water, which acts to hold the soil particles in place and resist the compactive effort (USBR, 1990). Bulking effects are absent in completely dry soils and disappear when a moist sand is saturated (Hilf, 1991); i.e. it is not until the water is removed or the soil is sufficiently saturated that these capillary stresses are reduced, which allows for more effective compaction (Bergeson et al., 1998). Since it is not realistic to completely dry a fill material in most climates, free-draining granular soils must be thoroughly wetted prior to compaction in order to be effectively compacted, but some form of moisture control may be required if a significant amount of fines are present (USACE, 1995).
1.5.2. Relative Density
When impact compaction tests are performed on granular soils, maximum dry unit weights are ill-defined, compaction curves are erratic, and relative compaction results do not correlate well with other engineering properties (USBR, 1990). Therefore, relative density procedures for compaction control were developed in the 1960s.
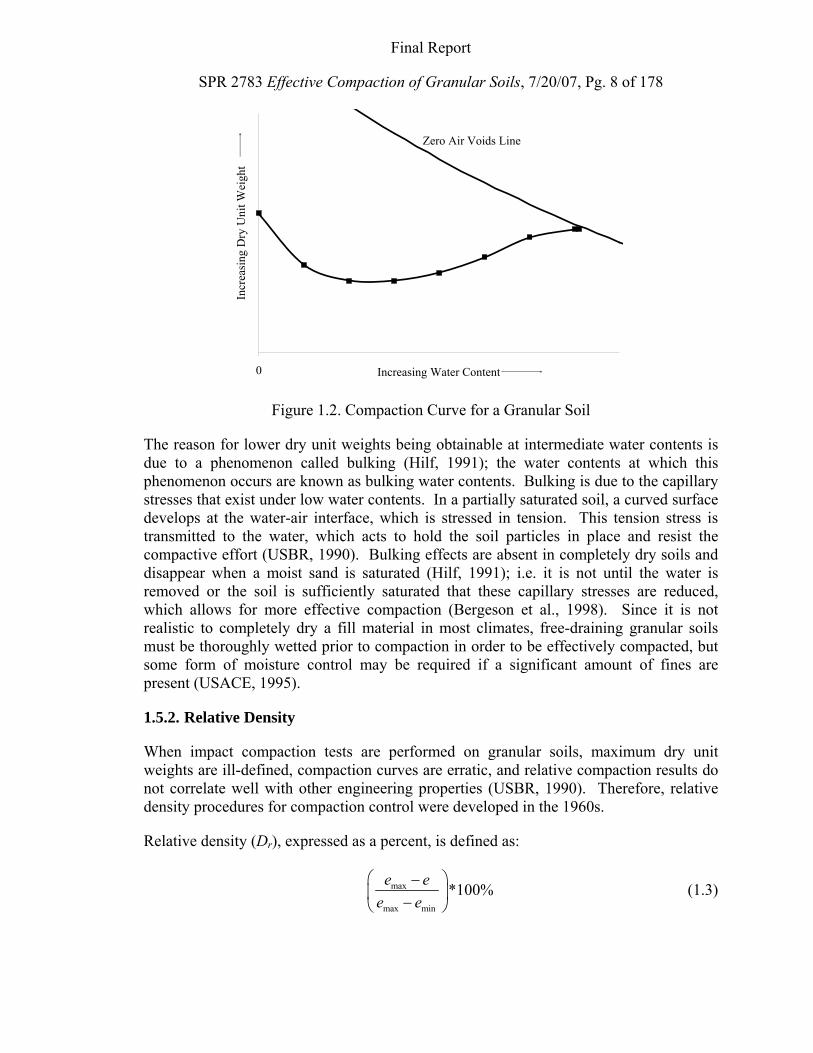
Relative density (Dr), expressed as a percent, is defined as:
max
max min
*100%e ee e
⎛ ⎞−⎜ ⎟−⎝ ⎠
(1.3)
Final Report
SPR 2783 Effective Compaction of Granular Soils, 7/20/07, Pg. 9 of 178
where:
e = void ratio in place
emax = void ratio in the loosest condition, and
emin = void ratio in the densest condition.
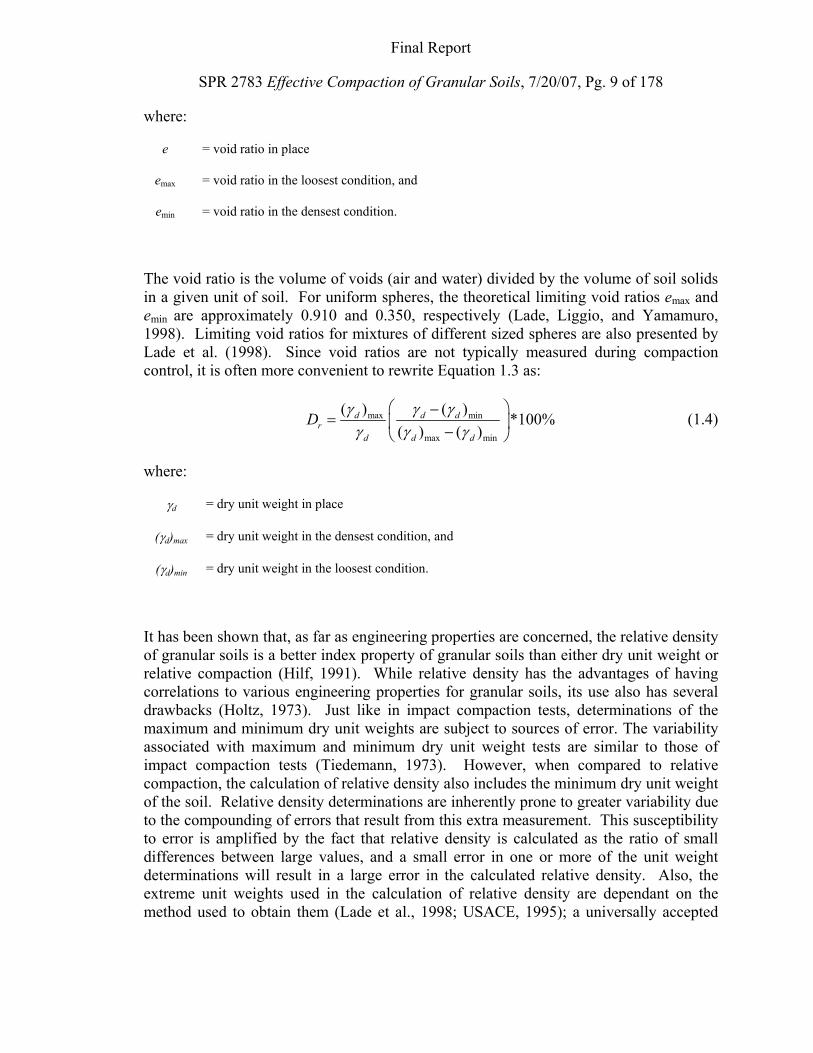
The void ratio is the volume of voids (air and water) divided by the volume of soil solids in a given unit of soil. For uniform spheres, the theoretical limiting void ratios emax and emin are approximately 0.910 and 0.350, respectively (Lade, Liggio, and Yamamuro, 1998). Limiting void ratios for mixtures of different sized spheres are also presented by Lade et al. (1998). Since void ratios are not typically measured during compaction control, it is often more convenient to rewrite Equation 1.3 as:
max min
max min
( ) ( ) *100%( ) ( )
d d dr
d d d
D γ γ γγ γ γ
⎛ ⎞−= ⎜ ⎟−⎝ ⎠
(1.4)
where:
γd = dry unit weight in place
(γd)max = dry unit weight in the densest condition, and
(γd)min = dry unit weight in the loosest condition.
It has been shown that, as far as engineering properties are concerned, the relative density of granular soils is a better index property of granular soils than either dry unit weight or relative compaction (Hilf, 1991). While relative density has the advantages of having correlations to various engineering properties for granular soils, its use also has several drawbacks (Holtz, 1973). Just like in impact compaction tests, determinations of the maximum and minimum dry unit weights are subject to sources of error. The variability associated with maximum and minimum dry unit weight tests are similar to those of impact compaction tests (Tiedemann, 1973). However, when compared to relative compaction, the calculation of relative density also includes the minimum dry unit weight of the soil. Relative density determinations are inherently prone to greater variability due to the compounding of errors that result from this extra measurement. This susceptibility to error is amplified by the fact that relative density is calculated as the ratio of small differences between large values, and a small error in one or more of the unit weight determinations will result in a large error in the calculated relative density. Also, the extreme unit weights used in the calculation of relative density are dependant on the method used to obtain them (Lade et al., 1998; USACE, 1995); a universally accepted
Final Report
SPR 2783 Effective Compaction of Granular Soils, 7/20/07, Pg. 10 of 178
method has not been found to determine the maximum dry unit weight of all cohesionless soils (Hilf, 1991).
Tavenas, Ladd, and La Rochelle (1973) conducted a comparative test program including 41 soil laboratories throughout the United States and Canada. Due to the vast variability of relative density values determined, they concluded that relative density values are practically meaningless when communicated to anyone besides the organization that has performed the tests. The purpose of relative density, which is to allow for the communication of granular soil properties between engineers, can not be met since the relative density of a soil at a given unit weight is a function of the person who determines it (Tavenas, et al. 1973).
Impact compaction is not an appropriate compaction mechanism for the compaction of granular soils. Because of the cohesionless nature of these materials, particles simply displace under each hammer drop when impact compaction tests are performed. Sand particles rearrange with each successive impact, but not much densification may occur (Pike, 1972). Granular materials need confinement in order to be compacted effectively, and vibration is the most efficient way to provide for reorientation of sand grains into a denser packing (White, Bergeson, Jahren, and Wermager, 1999; Selig, 1963). Due to these two conditions, vibratory tests have been developed in order to effectively compact granular soils.
Selig (1963) examined the effects of four crucial vibration parameters: frequency, acceleration, velocity, and displacement. As any one of these parameters increases up to some limiting value, the resulting dry unit weight will also increase. The best correlations to dry unit weight were found to be acceleration and frequency, with the obtainable dry unit weight being mostly dependent on acceleration (Krizek and Fernandez, 1971).
D’Appolonia, Whitman, and D’Appolonia (1969) explained the mechanisms through which compaction of granular soils occurs by vibration. Two different compaction mechanisms are at work. When sufficient acceleration is present, grains with less confinement are subjected to a free-fall and then an impact with each cycle of vibration that efficiently reorients the grains into a denser packing. Particles with greater confinement never experience free-fall, and are densified less efficiently through cycles of dynamic stresses. For particles with no confinement, though, vibrations cause chaotic motion and the soil is actually loosened.
1.5.3. Vibrating Table Tests
The minimum dry unit weight (or emax) is typically determined following ASTM D 4254. The soil is carefully deposited, following one of several methods, to determine its unit weight in the loosest condition. The corresponding standard that is commonly used to determine the maximum dry unit weight (or emin) of a granular soil is ASTM D 4253. A soil-filled mold is fastened to a vertically-vibrating table with a surcharge applied to the
Final Report
SPR 2783 Effective Compaction of Granular Soils, 7/20/07, Pg. 11 of 178
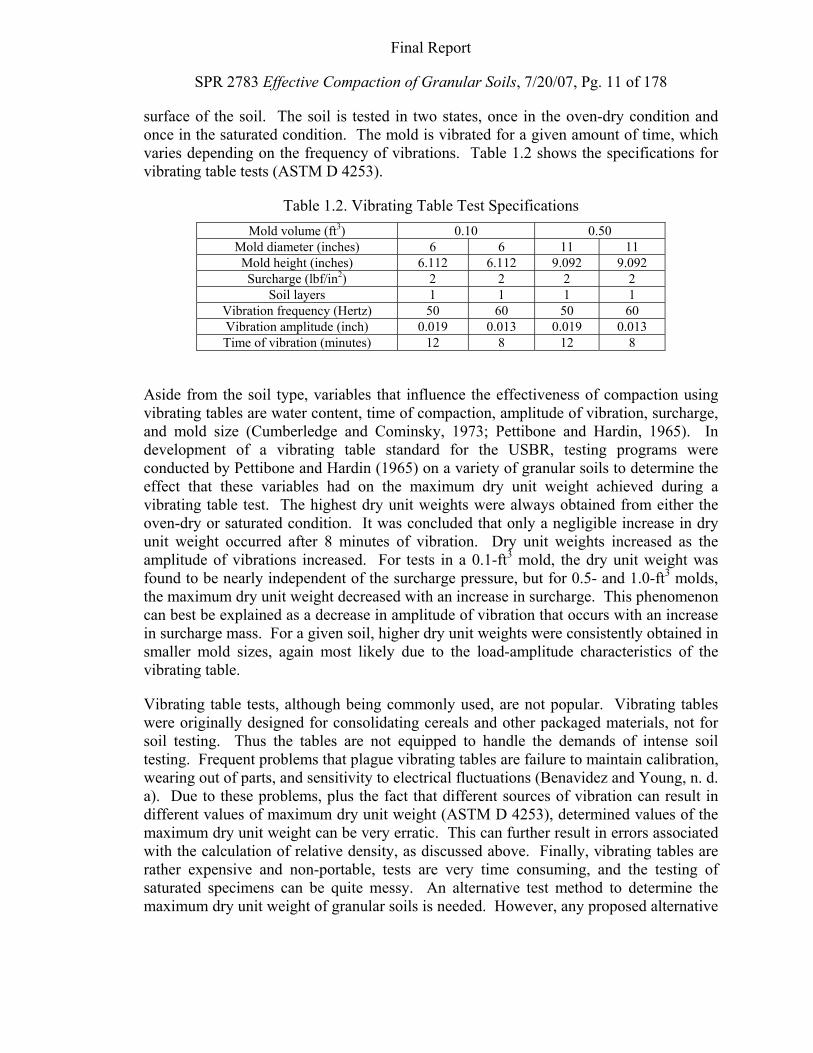
surface of the soil. The soil is tested in two states, once in the oven-dry condition and once in the saturated condition. The mold is vibrated for a given amount of time, which varies depending on the frequency of vibrations. Table 1.2 shows the specifications for vibrating table tests (ASTM D 4253).
Table 1.2. Vibrating Table Test Specifications Mold volume (ft3) 0.10 0.50
Mold diameter (inches) 6 6 11 11 Mold height (inches) 6.112 6.112 9.092 9.092 Surcharge (lbf/in2) 2 2 2 2
Soil layers 1 1 1 1 Vibration frequency (Hertz) 50 60 50 60 Vibration amplitude (inch) 0.019 0.013 0.019 0.013 Time of vibration (minutes) 12 8 12 8
Aside from the soil type, variables that influence the effectiveness of compaction using vibrating tables are water content, time of compaction, amplitude of vibration, surcharge, and mold size (Cumberledge and Cominsky, 1973; Pettibone and Hardin, 1965). In development of a vibrating table standard for the USBR, testing programs were conducted by Pettibone and Hardin (1965) on a variety of granular soils to determine the effect that these variables had on the maximum dry unit weight achieved during a vibrating table test. The highest dry unit weights were always obtained from either the oven-dry or saturated condition. It was concluded that only a negligible increase in dry unit weight occurred after 8 minutes of vibration. Dry unit weights increased as the amplitude of vibrations increased. For tests in a 0.1-ft3 mold, the dry unit weight was found to be nearly independent of the surcharge pressure, but for 0.5- and 1.0-ft3 molds, the maximum dry unit weight decreased with an increase in surcharge. This phenomenon can best be explained as a decrease in amplitude of vibration that occurs with an increase in surcharge mass. For a given soil, higher dry unit weights were consistently obtained in smaller mold sizes, again most likely due to the load-amplitude characteristics of the vibrating table.
Vibrating table tests, although being commonly used, are not popular. Vibrating tables were originally designed for consolidating cereals and other packaged materials, not for soil testing. Thus the tables are not equipped to handle the demands of intense soil testing. Frequent problems that plague vibrating tables are failure to maintain calibration, wearing out of parts, and sensitivity to electrical fluctuations (Benavidez and Young, n. d. a). Due to these problems, plus the fact that different sources of vibration can result in different values of maximum dry unit weight (ASTM D 4253), determined values of the maximum dry unit weight can be very erratic. This can further result in errors associated with the calculation of relative density, as discussed above. Finally, vibrating tables are rather expensive and non-portable, tests are very time consuming, and the testing of saturated specimens can be quite messy. An alternative test method to determine the maximum dry unit weight of granular soils is needed. However, any proposed alternative
Final Report
SPR 2783 Effective Compaction of Granular Soils, 7/20/07, Pg. 12 of 178
must not sacrifice the accuracy and precision that is currently specified in ASTM D 4253 (Selig and Ladd, 1973).
1.5.4. Vibrating Hammer Compaction Tests
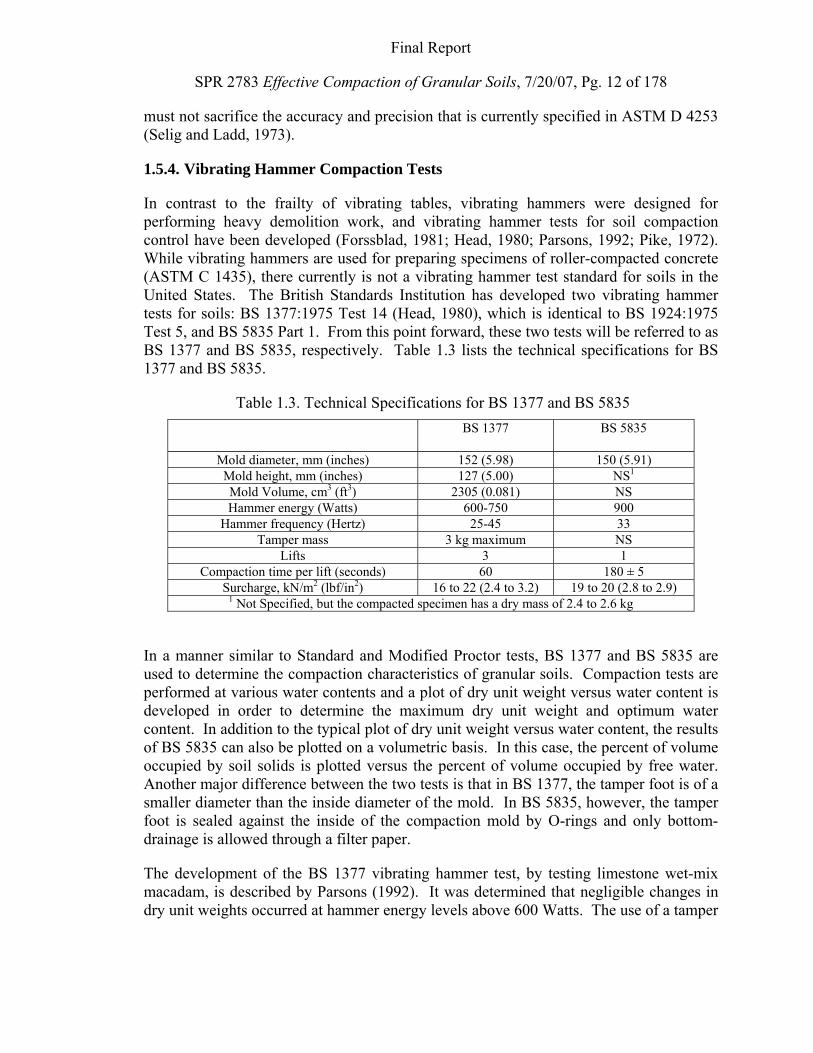
In contrast to the frailty of vibrating tables, vibrating hammers were designed for performing heavy demolition work, and vibrating hammer tests for soil compaction control have been developed (Forssblad, 1981; Head, 1980; Parsons, 1992; Pike, 1972). While vibrating hammers are used for preparing specimens of roller-compacted concrete (ASTM C 1435), there currently is not a vibrating hammer test standard for soils in the United States. The British Standards Institution has developed two vibrating hammer tests for soils: BS 1377:1975 Test 14 (Head, 1980), which is identical to BS 1924:1975 Test 5, and BS 5835 Part 1. From this point forward, these two tests will be referred to as BS 1377 and BS 5835, respectively. Table 1.3 lists the technical specifications for BS 1377 and BS 5835.
Table 1.3. Technical Specifications for BS 1377 and BS 5835 BS 1377 BS 5835
Mold diameter, mm (inches) 152 (5.98) 150 (5.91) Mold height, mm (inches) 127 (5.00) NS1 Mold Volume, cm3 (ft3) 2305 (0.081) NS Hammer energy (Watts) 600-750 900
Hammer frequency (Hertz) 25-45 33 Tamper mass 3 kg maximum NS
Lifts 3 1 Compaction time per lift (seconds) 60 180 ± 5
Surcharge, kN/m2 (lbf/in2) 16 to 22 (2.4 to 3.2) 19 to 20 (2.8 to 2.9) 1 Not Specified, but the compacted specimen has a dry mass of 2.4 to 2.6 kg
In a manner similar to Standard and Modified Proctor tests, BS 1377 and BS 5835 are used to determine the compaction characteristics of granular soils. Compaction tests are performed at various water contents and a plot of dry unit weight versus water content is developed in order to determine the maximum dry unit weight and optimum water content. In addition to the typical plot of dry unit weight versus water content, the results of BS 5835 can also be plotted on a volumetric basis. In this case, the percent of volume occupied by soil solids is plotted versus the percent of volume occupied by free water. Another major difference between the two tests is that in BS 1377, the tamper foot is of a smaller diameter than the inside diameter of the mold. In BS 5835, however, the tamper foot is sealed against the inside of the compaction mold by O-rings and only bottom-drainage is allowed through a filter paper.
The development of the BS 1377 vibrating hammer test, by testing limestone wet-mix macadam, is described by Parsons (1992). It was determined that negligible changes in dry unit weights occurred at hammer energy levels above 600 Watts. The use of a tamper
Final Report
SPR 2783 Effective Compaction of Granular Soils, 7/20/07, Pg. 13 of 178
foot that covers almost the entire area of the mold was chosen to prevent stress concentrations in the soil at the surface of each lift. Dry unit weights were found to increase with increasing surcharge; the values listed in Table 1.3 were found to be practical ranges that would provide little variation. Dry unit weight was found to increase with increasing time of compaction per lift, with a reduced rate of increase occurring at times greater than 60 seconds per lift. Sixty seconds per lift was chosen to minimize testing time and to avoid fatigue, since the surcharge is applied by a downward force provided by the operator. Based on the results of these tests, the final procedure found in Table 1.3 was adopted.
The compaction mechanism of vibrating hammer tests is identical to that of vibrating table tests: both compact the soil by applying a fixed nominal surcharge pressure and vertical vibrations. However, while a vibrating table places a static surcharge on the top of the soil and vibrates it from below, the vibrating hammer test applies both surcharge and vibration from the top through the same source. The compaction mechanism of vibrating hammer tests is more representative of field compaction than is the vibrating table test.
1.6. Current State of Practice
Although there is a broad consensus among geotechnical engineers that impact compaction tests are not appropriate for compaction control of granular soils (Bergeson et al., 1998; Hilf, 1991; Parsons, 1992; Ping et al., 2003a), these tests continue to be used. The popularity of these tests can most likely be attributed to the fact that they were the first compaction tests to be standardized (Ping et al., 2003a). The United States Bureau of Reclamation (USBR) includes a restriction that the impact compaction test should generally not be performed on soils with less than 15 percent fines (USBR 5500); however, neither the American Association of State Highway and Transportation Officials (AASHTO) nor the American Society for Testing and Materials (ASTM) include such a constraint on their impact compaction test standards.
A list of compaction control specifications for all state departments of transportation (DOTs) was presented by Bergeson et al. (1998); this data for embankment soil fill is shown in Table 1.4.
Final Report
SPR 2783 Effective Compaction of Granular Soils, 7/20/07, Pg. 14 of 178
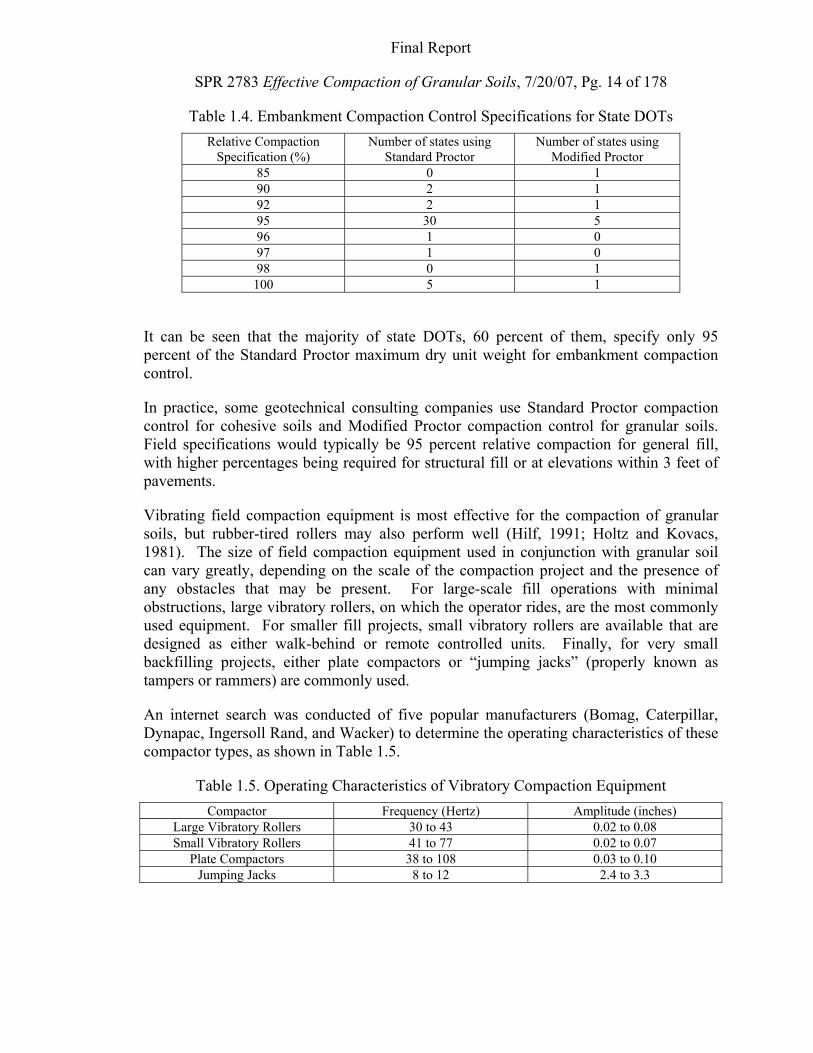
Table 1.4. Embankment Compaction Control Specifications for State DOTs Relative Compaction
Specification (%) Number of states using
Standard Proctor Number of states using
Modified Proctor 85 0 1 90 2 1 92 2 1 95 30 5 96 1 0 97 1 0 98 0 1 100 5 1
It can be seen that the majority of state DOTs, 60 percent of them, specify only 95 percent of the Standard Proctor maximum dry unit weight for embankment compaction control.
In practice, some geotechnical consulting companies use Standard Proctor compaction control for cohesive soils and Modified Proctor compaction control for granular soils. Field specifications would typically be 95 percent relative compaction for general fill, with higher percentages being required for structural fill or at elevations within 3 feet of pavements.
Vibrating field compaction equipment is most effective for the compaction of granular soils, but rubber-tired rollers may also perform well (Hilf, 1991; Holtz and Kovacs, 1981). The size of field compaction equipment used in conjunction with granular soil can vary greatly, depending on the scale of the compaction project and the presence of any obstacles that may be present. For large-scale fill operations with minimal obstructions, large vibratory rollers, on which the operator rides, are the most commonly used equipment. For smaller fill projects, small vibratory rollers are available that are designed as either walk-behind or remote controlled units. Finally, for very small backfilling projects, either plate compactors or “jumping jacks” (properly known as tampers or rammers) are commonly used.
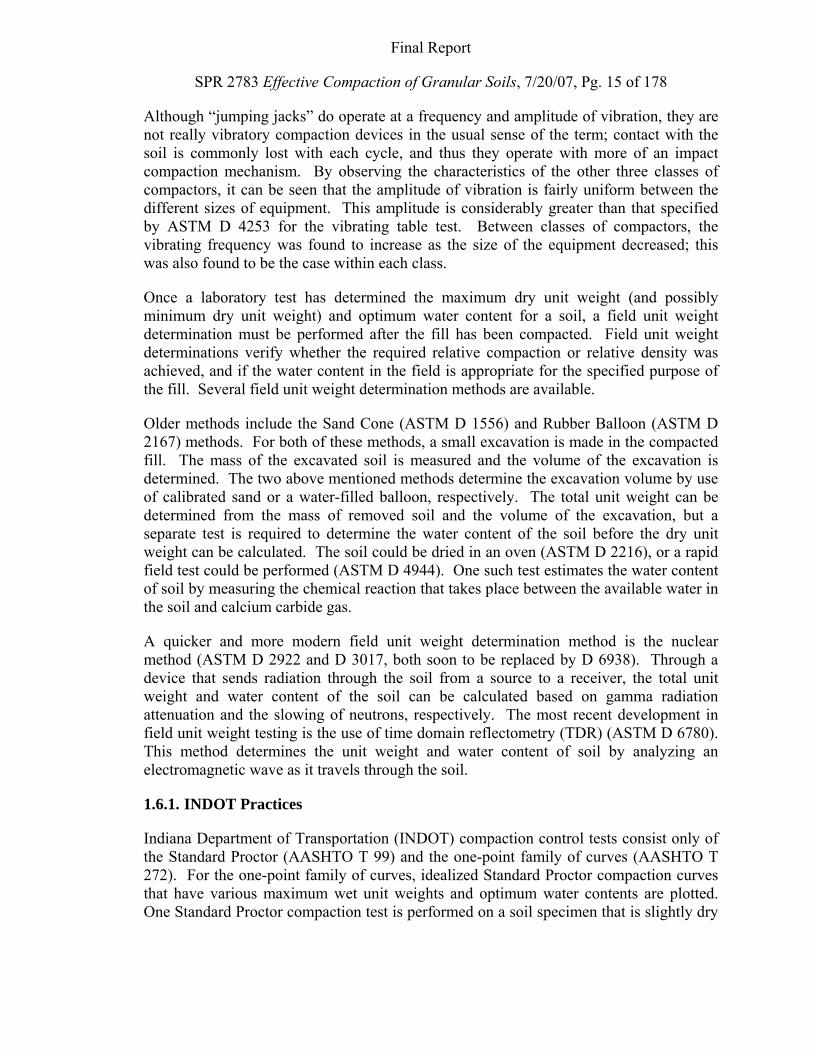
An internet search was conducted of five popular manufacturers (Bomag, Caterpillar, Dynapac, Ingersoll Rand, and Wacker) to determine the operating characteristics of these compactor types, as shown in Table 1.5.
Table 1.5. Operating Characteristics of Vibratory Compaction Equipment Compactor Frequency (Hertz) Amplitude (inches)
Large Vibratory Rollers 30 to 43 0.02 to 0.08 Small Vibratory Rollers 41 to 77 0.02 to 0.07
Plate Compactors 38 to 108 0.03 to 0.10 Jumping Jacks 8 to 12 2.4 to 3.3
Final Report
SPR 2783 Effective Compaction of Granular Soils, 7/20/07, Pg. 15 of 178
Although “jumping jacks” do operate at a frequency and amplitude of vibration, they are not really vibratory compaction devices in the usual sense of the term; contact with the soil is commonly lost with each cycle, and thus they operate with more of an impact compaction mechanism. By observing the characteristics of the other three classes of compactors, it can be seen that the amplitude of vibration is fairly uniform between the different sizes of equipment. This amplitude is considerably greater than that specified by ASTM D 4253 for the vibrating table test. Between classes of compactors, the vibrating frequency was found to increase as the size of the equipment decreased; this was also found to be the case within each class.
Once a laboratory test has determined the maximum dry unit weight (and possibly minimum dry unit weight) and optimum water content for a soil, a field unit weight determination must be performed after the fill has been compacted. Field unit weight determinations verify whether the required relative compaction or relative density was achieved, and if the water content in the field is appropriate for the specified purpose of the fill. Several field unit weight determination methods are available.
Older methods include the Sand Cone (ASTM D 1556) and Rubber Balloon (ASTM D 2167) methods. For both of these methods, a small excavation is made in the compacted fill. The mass of the excavated soil is measured and the volume of the excavation is determined. The two above mentioned methods determine the excavation volume by use of calibrated sand or a water-filled balloon, respectively. The total unit weight can be determined from the mass of removed soil and the volume of the excavation, but a separate test is required to determine the water content of the soil before the dry unit weight can be calculated. The soil could be dried in an oven (ASTM D 2216), or a rapid field test could be performed (ASTM D 4944). One such test estimates the water content of soil by measuring the chemical reaction that takes place between the available water in the soil and calcium carbide gas.
A quicker and more modern field unit weight determination method is the nuclear method (ASTM D 2922 and D 3017, both soon to be replaced by D 6938). Through a device that sends radiation through the soil from a source to a receiver, the total unit weight and water content of the soil can be calculated based on gamma radiation attenuation and the slowing of neutrons, respectively. The most recent development in field unit weight testing is the use of time domain reflectometry (TDR) (ASTM D 6780). This method determines the unit weight and water content of soil by analyzing an electromagnetic wave as it travels through the soil.
1.6.1. INDOT Practices
Indiana Department of Transportation (INDOT) compaction control tests consist only of the Standard Proctor (AASHTO T 99) and the one-point family of curves (AASHTO T 272). For the one-point family of curves, idealized Standard Proctor compaction curves that have various maximum wet unit weights and optimum water contents are plotted. One Standard Proctor compaction test is performed on a soil specimen that is slightly dry
Final Report
SPR 2783 Effective Compaction of Granular Soils, 7/20/07, Pg. 16 of 178
of the optimum water content; the resulting point (wet unit weight and water content) is plotted on the family of curves and an interpolation is made between the existing curves to estimate the maximum wet unit weight and the optimum water content of the tested soil. The water content for this test must be dry of optimum, since all of the curves tend to converge on the wet side of optimum and it would be impossible to determine which curves the point falls between. Due to the nature of granular soil compaction curves, the one-point family of curves can not be used. A separate family of curves does not exist for granular soils, but the development of one would be a great help (Sipes, 2003).
INDOT currently specifies 95 percent relative compaction for general fill, with 100 percent relative compaction being specified for base and subbase materials and within the top two feet of finished subgrade elevation. For soils containing less than 20 percent fines, no moisture control is placed on fill materials; any water content is acceptable as long as the required dry unit weight can be achieved (INDOT, 1999). Contractors typically do not have much trouble achieving the required relative compaction in the field, even at water contents that deviate far from optimum (Sipes, 2003). This is a good indication that the maximum dry unit weight specified by the Standard Proctor test is set too low.
INDOT has been experiencing excessive settlements in granular soils, even though they have been placed according to specifications. Specifically, settlements have been observed when B Borrow backfill that has been placed behind bridge abutments becomes wetted. This is one source of the characteristic bumps that are apparent at the transitions between pavements and bridge decks. Similar experiences of settlements in granular soils upon saturation can be found in a variety of other sources (Day, 1995; McCook, 1996; Ping et al., 2003a; Rizkallah and Hellweg, 1980; Silver and Seed, 1971).
1.7. Compaction Issues
1.7.1. Water Content
The importance of water content on the compaction process was discussed in Sections 1.4 and 1.5 above. When compacting granular soils, the issue becomes even more important because these soils are frequently free-draining materials. Hence, there are actually two water contents of concern, one at the time of compaction that lubricates and facilitates the rearrangements of soil particles as compaction is taking place and a second water content that exists in the compacted soil after compaction. In cohesive soils, these two water contents are usually very close to each other while in granular soils they could be quite different if the soil is free draining. Typically, the water content after compaction is less because water in the voids either drains to the soil below or in warm or windy conditions evaporates into the atmosphere.
The water content at the time of compaction is of exceptional importance in effectively compacting the soil. The water content of soil after compaction is of great importance in
Final Report
SPR 2783 Effective Compaction of Granular Soils, 7/20/07, Pg. 17 of 178
establishing the dry unit weight of the compacted soil from the measured total unit weight of the compacted soil as described in Eq. 1.1 to check on whether the measured dry unit weight meets or exceeds the specified value. Specifications should be written to require the specified water content to exist in the uncompacted soil, immediately before being compacted. This may require the use of water sprayed onto the soil just prior to compaction. Recall from Figure 1.2 that except for oven dry soils, the optimum water content is always near the water content at saturation.
The situation in compacting specimens in the laboratory is somewhat different from that in the field in that the mold usually does not allow much excess water to drain while the soil is being compacted and remains available for lubrication. However, there is a point where excess water just causes granular soils to liquefy and impaction is impeded.
1.7.2. Mold Size
The size of the compaction mold used has an effect on the dry unit weight obtained from the compaction test. Garga and Madureira (1985) found that molds with diameters six to eight times the maximum particle size would provide maximum dry unit weights. Results have shown that the use of a larger compaction mold, with all other factors being equal, will result in lower dry unit weights (Benavidez and Young, n. d. a; Garga and Madureira, 1985).
For vibrating table tests, lower dry unit weight results from larger molds are logical. For both mold sizes used the time of vibration is equal, and thus specimens tested in larger molds will receive less compactive effort per unit volume. Additionally, the increased weight from the larger mold assembly would reduce the amplitude of vibrations. ASTM D 4253 also indicates that mold size affects can be attributed to degradation of particles; as more degradation occurs, a higher dry unit weight is obtained. Since smaller molds receive more compactive effort per unit volume than larger molds, it would seem reasonable that more degradation would occur in smaller molds, thus further increasing the dry unit weight when compared to larger molds. For impact compaction tests, though, the compactive effort is equal between different mold volumes, which would lead to proportional amounts of degradation between different mold sizes. Other factors may cause lower dry unit weights to be obtained in larger molds.
Burmister (1965) theorized that differences in dry unit weights obtained from 4-inch and 6-inch molds used during impact compaction tests were due to sidewall friction. Since both molds have the same height, the smaller diameter mold will have a greater ratio of sidewall area to cross sectional area. The greater frictional area in the smaller mold restrains the natural rebound of the soil that would tend to occur following each hammer blow. Thus, maximum compaction results obtained from larger molds should be more representative of field conditions.
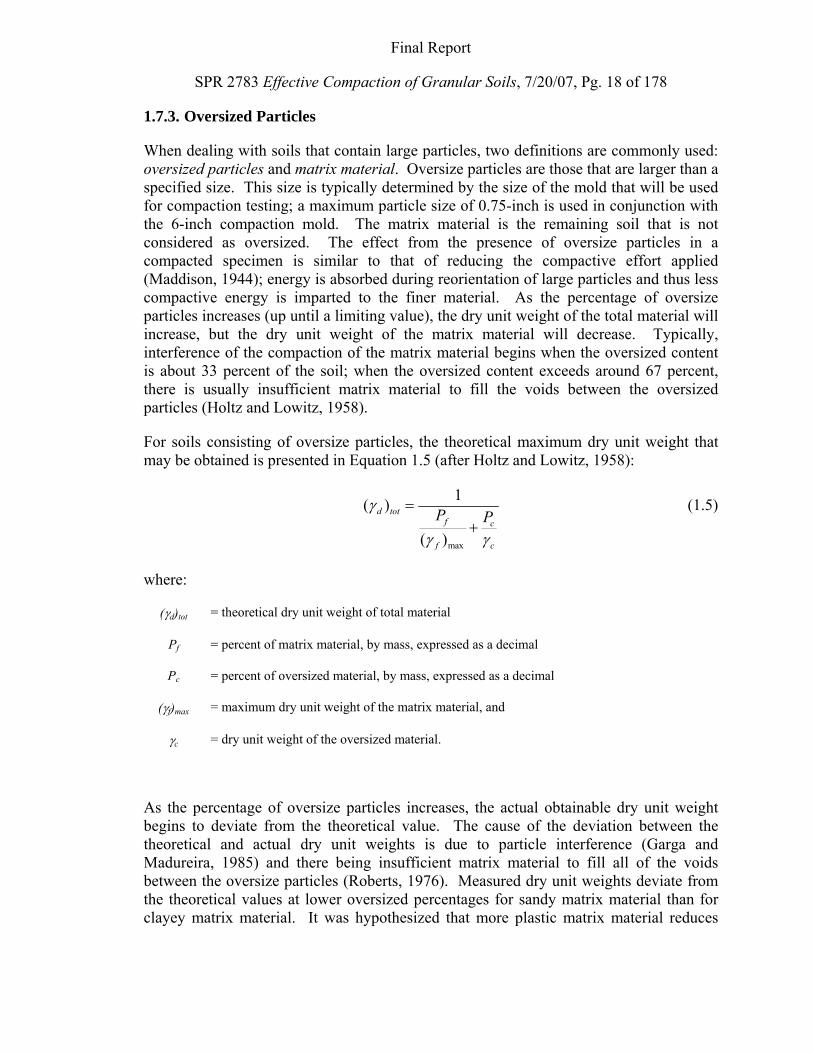
Final Report
SPR 2783 Effective Compaction of Granular Soils, 7/20/07, Pg. 18 of 178
1.7.3. Oversized Particles
When dealing with soils that contain large particles, two definitions are commonly used: oversized particles and matrix material. Oversize particles are those that are larger than a specified size. This size is typically determined by the size of the mold that will be used for compaction testing; a maximum particle size of 0.75-inch is used in conjunction with the 6-inch compaction mold. The matrix material is the remaining soil that is not considered as oversized. The effect from the presence of oversize particles in a compacted specimen is similar to that of reducing the compactive effort applied (Maddison, 1944); energy is absorbed during reorientation of large particles and thus less compactive energy is imparted to the finer material. As the percentage of oversize particles increases (up until a limiting value), the dry unit weight of the total material will increase, but the dry unit weight of the matrix material will decrease. Typically, interference of the compaction of the matrix material begins when the oversized content is about 33 percent of the soil; when the oversized content exceeds around 67 percent, there is usually insufficient matrix material to fill the voids between the oversized particles (Holtz and Lowitz, 1958).
For soils consisting of oversize particles, the theoretical maximum dry unit weight that may be obtained is presented in Equation 1.5 (after Holtz and Lowitz, 1958):
max
1( )
( )
d totf c
f c
P Pγ
γ γ
=+
(1.5)
where:
(γd)tot = theoretical dry unit weight of total material
Pf = percent of matrix material, by mass, expressed as a decimal
Pc = percent of oversized material, by mass, expressed as a decimal
(γf)max = maximum dry unit weight of the matrix material, and
γc = dry unit weight of the oversized material.
As the percentage of oversize particles increases, the actual obtainable dry unit weight begins to deviate from the theoretical value. The cause of the deviation between the theoretical and actual dry unit weights is due to particle interference (Garga and Madureira, 1985) and there being insufficient matrix material to fill all of the voids between the oversize particles (Roberts, 1976). Measured dry unit weights deviate from the theoretical values at lower oversized percentages for sandy matrix material than for clayey matrix material. It was hypothesized that more plastic matrix material reduces
Final Report
SPR 2783 Effective Compaction of Granular Soils, 7/20/07, Pg. 19 of 178
particle interference and also allows for the oversize particles to more easily penetrate the matrix, thus distributing the compactive energy more uniformly to the matrix material (Holtz and Lowitz, 1958).
Garga and Madureira (1985) showed that the actual obtainable dry unit weight of the total material will begin to deviate from the theoretical value when oversize particles comprise more than 20 percent of the soil. Roberts (1976) found the deviation to begin when the oversize particles was 20 to 30 percent. Holtz and Lowitz (1958) showed the deviation did not occur until oversized were between 28 and 44 percent, but Gordon, Hammond, and Miller (1965) found deviations to occur with as little as 6 percent oversize particles.
When dry unit weight is plotted versus percent oversize particles for different fractions of the soil, the total soil tends to achieve its highest dry unit weight when the soil is composed of 60 to 70 percent oversize particles (Garga and Madureira, 1985; Holtz and Lowitz, 1958). The soil fraction finer than 0.75-inch follows a similar trend, but with slightly lower values of dry unit weight. The soil fraction finer than the #4 sieve, however, is found to have continuously decreasing dry unit weights as the percentage of oversize particles increases. This may explain the commonality of using the 0.75-inch sieve as a cutoff for oversize particles (Garga and Madureira, 1985).
While working with rockfill, Matheson (1986) suggested the use of four different rockfill classifications based on the relative proportions of oversize particles and matrix material. Although Matheson used the #4 sieve as the cutoff between oversize particles and matrix material, these four classifications, described below, could be applied to any soil that contains oversize particles:
1. Clean rockfill is soil that does not have enough matrix material to fill all the voids in between the oversize particles (less than 20 percent matrix material).
2. Transition rockfill is soil that may or may not have enough matrix material to fill all of the voids between the oversize particles (20 to 30 percent matrix material).
3. Matrix encased rockfill is soil where the oversize particles are completely surrounded by matrix material (30 to 50 percent matrix material).
4. Rocky soil fill is soil in which at least 50 percent is matrix material.
Matheson and Parent (1989) showed that for classifications 3 and 4, the oversize particles had little, if any, effect on the compaction of the matrix material. These two classifications would include almost all commonly-used fill soils that contain oversize particles.
Due to practical issues, there is a limit to the maximum particle size that can be included in a laboratory compaction test (Walsh et al., 1997). As particles sizes increase, larger molds are required, which in turn leads to more material being tested, more energy being imparted, and larger compaction equipment being needed. Large-scale impact
Final Report
SPR 2783 Effective Compaction of Granular Soils, 7/20/07, Pg. 20 of 178
compaction (Holtz and Lowitz, 1958; Gordon et al., 1965) and vibratory compaction (Miller, 1965) equipment have been developed for use in research or in conjunction with special projects, but for all practical purposes the maximum particle size that may be tested routinely is 0.75-inch for impact compaction tests (ASTM D 698 or D 1557) and 3 inches for vibrating table compaction tests (ASTM D 4253).
Soils compacted in the field may include particles larger than those allowed for a given mold size. In order to perform compaction control, a representative maximum dry unit weight from a laboratory test is required. When compaction tests need to be performed on soils with oversize particles, there are three common options available (Day, 1989). These include the: (1) scalp method, (2) scalp and correct method, and (3) scalp and replace method. A fourth option would be to increase the mold size, but this is not realistic for routine testing purposes.
The method of scalping involves sieving off any oversize particles and performing the compaction test on the matrix material. During a field unit weight determination, the mass and volume of the oversize particles tested are determined and corrections are made for them; the dry unit weight of the matrix material in the field is directly compared to that determined in the lab. Using this method, the total dry unit weight of the entire field material must increase as the percentage of oversize particles increases in order to keep the same dry unit weight of the matrix material (Day, 1989).
The scalp and correct method is found in AASHTO T 224 and ASTM D 4718. In this method, by knowing the water content and specific gravity of the oversize particles, the maximum dry unit weight and the optimum water content that were determined for the matrix material are corrected for the presence of oversize particles on a proportional basis. The corrected values, which are supposed to be representative of the entire soil, can then be directly compared to the total results obtained from field unit weight determinations. Depending on what size particle is considered oversized, this method is limited to soils that have less than 40 percent retained on the #4 sieve or less than 30 percent retained on the 0.75-inch sieve.
The scalp and replace method used to be a permissible method for oversized corrections through Method D of ASTM D 698 and ASTM D 1557 (Day, 1989). For this method, the mass of soil passing the 3-inch sieve and retained on the 0.75-inch sieve was to be discarded and replaced by an equal mass of soil that passed the 0.75-inch sieve and was retained on the #4 sieve. The dry unit weight that was obtained by testing this scalped and replaced specimen was to be compared directly to field compaction test results. However, Holtz and Lowitz (1958) found that, for a given percentage of oversize particles, the compaction characteristics of the soil were dependent on the gradation of the oversized fraction. An oversized fraction that is more uniformly graded and has a smaller maximum particle size will have more particle interference and will not transmit compactive energy to the matrix material as effectively. The scalp and replace method drastically changes the gradation of the tested specimen as compared to that of the soil in the field, and thus the differences in compaction characteristics will be much different
Final Report
SPR 2783 Effective Compaction of Granular Soils, 7/20/07, Pg. 21 of 178
(Burmister, 1965; Roberts, 1976). The updated versions of impact compaction standards now forbid the scalp and replace method.
1.7.4. Particle Angularity
Theoretically, angular particles can exist in states either denser or looser than those of spherical particles. While particle size is not an important factor in determining the packing of granular materials, the distribution of particle sizes and their angularity both influence the limiting void ratios (Dickin, 1973; Youd, 1973). For materials with more angular and more uniformly sized particles, the limiting void ratios increase (Pike, 1972). The increase associated with increasing angularity is more marked for the maximum void ratio than the minimum void ratio (Holubec and D’Appolonia, 1973). It has been shown that smaller particles are typically less rounded than larger particles, and angular particles tend to exhibit higher limiting void ratios than equivalent spherical particles (Lade et al., 1998).
During vibratory compaction tests, Spanovich (1965) found that increasing the surcharge decreased the obtainable dry unit weight for angular materials much more than for rounded materials. This can be attributed to interlocking of the angular particles under the higher surcharge. However, Holtz and Lowitz (1958), while performing impact compaction tests on soils with 50 percent oversized particles, did not find appreciable differences in maximum dry unit weights and optimum water contents when the oversized particles consisted of angular crushed rock or a more-rounded river gravel. Impact compaction provides for sufficient rearranging so that less interlocking of angular particles can occur.
1.7.5. Segregation
In the field, a homogenous fill is desired in order to achieve uniform soil properties. Field compaction of granular soils can cause segregation in two different ways. If the soil is being over-vibrated, fines will settle down towards the bottom of the compacted lift. If particle crushing (degradation) occurs, finer material will result at the top of the compacted lift (USACE, 1995).
Segregation can also occur during laboratory vibrating table compaction tests. While Johnson and Morris (1973) were able to obtain uniformly compacted specimens, they only tested uniformly graded materials. It has been shown that during vibratory compaction of two-different-sized uniform spheres, segregation of particles does occur. This segregation is most pronounced in the upper portion of the compacted specimen (Johnson, 1965). In order to get a dense, uniformly-compacted sample, large particles need to be compacted first. Once the large particles have reached a maximum density, smaller particles are then added in and vibrated in order to fill all of the voids between the larger particles (Lade et al., 1998). Brand (1973) showed that at low vibration intensities, the resulting relative densities obtained were very inhomogeneous throughout a specimen.
Final Report
SPR 2783 Effective Compaction of Granular Soils, 7/20/07, Pg. 22 of 178
1.8. Recent Trends in Compaction Research
1.8.1. Gyratory Compaction
Recent work has been performed at Florida State University (FSU) to determine the feasibility of using a gyratory compactor for granular soil compaction control (Ping et al., 2003a and 2003b). Gyratory compaction is currently commonly used in the compaction control of asphalt for SUPERPAVE mix designs, and the U.S. Army Corps of Engineers has also investigated the use of gyratory compaction for compaction control of granular soils. Gyratory compaction is accomplished by applying a static surcharge to a soil specimen in a mold, and rotating the mold through a slight angle about its longitudinal axis.
Gyratory compaction tests were performed at FSU along with field unit weight determinations and Standard and Modified Proctor tests on A-3 and A-2-4 soils (AASHTO M 145); results look quite promising. For the soils tested, gyratory compaction curves matched quite well with results from field unit weight determinations, both of which produced higher dry unit weights and lower optimum water contents than both Standard and Modified Proctor compaction tests (Ping et al., 2003b). A major drawback of gyratory compaction, though, is that a new compactor will typically cost $20,000 to $25,000 (www.qcqa.com).
1.8.2. Intelligent Compaction Systems
Intelligent compaction systems represent the state of the art in field compaction equipment technology. This technology, introduced by Forssblad (1980), was developed to provide an instantaneous method of continuous compaction control that would replace the time-consuming density spot-checks that are typically performed (Hansbo and Pramborg, 1980; Thurner and Sandström, 1980). These systems utilize vibratory rollers whose drums are instrumented with accelerometers which are used to determine the stiffness of the soil. The eccentric weights of the vibrator can also be offset with relation to each other. The adjustment of the eccentric weights may be performed manually or automatically to select one of 6 different vibration directions (Kloubert, 2004).
Each vibration cycle is treated as a dynamic load test (Sandström and Pettersson, 2004); the compaction system is able to continuously calculate a modulus for the soil. A minimum required modulus or an acceptable range can be input to the system. An automatic feedback control then adjusts the eccentric weights so that stiffer areas receive less compactive effort and softer areas receive more compactive effort (Kloubert, 2004). The measured stiffness is also continuously displayed so that the operator can see which areas need additional roller passes (Sandström and Pettersson, 2004). Some systems even contain a global positioning system (GPS) so that the location of the roller can be tracked on a map of the jobsite (Anderegg and Kaufmann, 2004). This results in the most efficient use of compaction energy and a more uniform fill. Since all adjustments are made automatically, roller operators do not need to have any computer knowledge
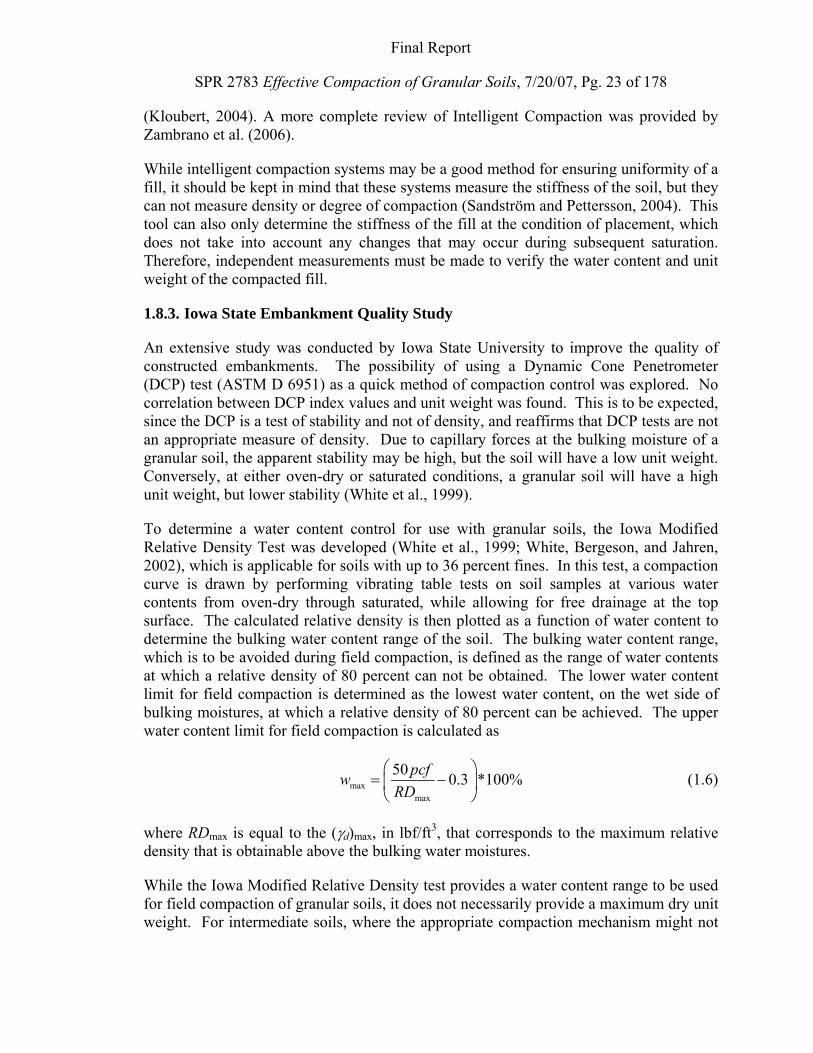
Final Report
SPR 2783 Effective Compaction of Granular Soils, 7/20/07, Pg. 23 of 178
(Kloubert, 2004). A more complete review of Intelligent Compaction was provided by Zambrano et al. (2006).
While intelligent compaction systems may be a good method for ensuring uniformity of a fill, it should be kept in mind that these systems measure the stiffness of the soil, but they can not measure density or degree of compaction (Sandström and Pettersson, 2004). This tool can also only determine the stiffness of the fill at the condition of placement, which does not take into account any changes that may occur during subsequent saturation. Therefore, independent measurements must be made to verify the water content and unit weight of the compacted fill.
1.8.3. Iowa State Embankment Quality Study
An extensive study was conducted by Iowa State University to improve the quality of constructed embankments. The possibility of using a Dynamic Cone Penetrometer (DCP) test (ASTM D 6951) as a quick method of compaction control was explored. No correlation between DCP index values and unit weight was found. This is to be expected, since the DCP is a test of stability and not of density, and reaffirms that DCP tests are not an appropriate measure of density. Due to capillary forces at the bulking moisture of a granular soil, the apparent stability may be high, but the soil will have a low unit weight. Conversely, at either oven-dry or saturated conditions, a granular soil will have a high unit weight, but lower stability (White et al., 1999).
To determine a water content control for use with granular soils, the Iowa Modified Relative Density Test was developed (White et al., 1999; White, Bergeson, and Jahren, 2002), which is applicable for soils with up to 36 percent fines. In this test, a compaction curve is drawn by performing vibrating table tests on soil samples at various water contents from oven-dry through saturated, while allowing for free drainage at the top surface. The calculated relative density is then plotted as a function of water content to determine the bulking water content range of the soil. The bulking water content range, which is to be avoided during field compaction, is defined as the range of water contents at which a relative density of 80 percent can not be obtained. The lower water content limit for field compaction is determined as the lowest water content, on the wet side of bulking moistures, at which a relative density of 80 percent can be achieved. The upper water content limit for field compaction is calculated as
maxmax
50 0.3 *100%pcfwRD
⎛ ⎞= −⎜ ⎟⎝ ⎠
(1.6)
where RDmax is equal to the (γd)max, in lbf/ft3, that corresponds to the maximum relative density that is obtainable above the bulking water moistures.
While the Iowa Modified Relative Density test provides a water content range to be used for field compaction of granular soils, it does not necessarily provide a maximum dry unit weight. For intermediate soils, where the appropriate compaction mechanism might not
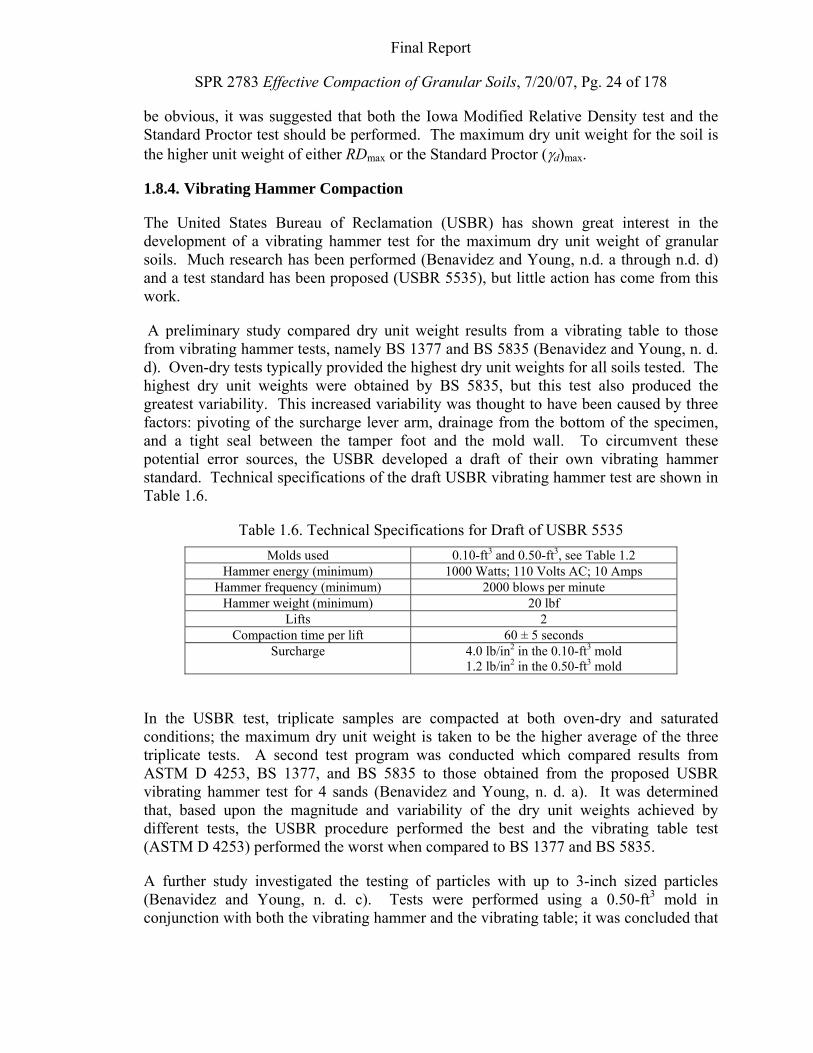
Final Report
SPR 2783 Effective Compaction of Granular Soils, 7/20/07, Pg. 24 of 178
be obvious, it was suggested that both the Iowa Modified Relative Density test and the Standard Proctor test should be performed. The maximum dry unit weight for the soil is the higher unit weight of either RDmax or the Standard Proctor (γd)max.
1.8.4. Vibrating Hammer Compaction
The United States Bureau of Reclamation (USBR) has shown great interest in the development of a vibrating hammer test for the maximum dry unit weight of granular soils. Much research has been performed (Benavidez and Young, n.d. a through n.d. d) and a test standard has been proposed (USBR 5535), but little action has come from this work.
A preliminary study compared dry unit weight results from a vibrating table to those from vibrating hammer tests, namely BS 1377 and BS 5835 (Benavidez and Young, n. d. d). Oven-dry tests typically provided the highest dry unit weights for all soils tested. The highest dry unit weights were obtained by BS 5835, but this test also produced the greatest variability. This increased variability was thought to have been caused by three factors: pivoting of the surcharge lever arm, drainage from the bottom of the specimen, and a tight seal between the tamper foot and the mold wall. To circumvent these potential error sources, the USBR developed a draft of their own vibrating hammer standard. Technical specifications of the draft USBR vibrating hammer test are shown in Table 1.6.
Table 1.6. Technical Specifications for Draft of USBR 5535 Molds used 0.10-ft3 and 0.50-ft3, see Table 1.2
Hammer energy (minimum) 1000 Watts; 110 Volts AC; 10 Amps Hammer frequency (minimum) 2000 blows per minute
Hammer weight (minimum) 20 lbf Lifts 2
Compaction time per lift 60 ± 5 seconds Surcharge 4.0 lb/in2 in the 0.10-ft3 mold
1.2 lb/in2 in the 0.50-ft3 mold
In the USBR test, triplicate samples are compacted at both oven-dry and saturated conditions; the maximum dry unit weight is taken to be the higher average of the three triplicate tests. A second test program was conducted which compared results from ASTM D 4253, BS 1377, and BS 5835 to those obtained from the proposed USBR vibrating hammer test for 4 sands (Benavidez and Young, n. d. a). It was determined that, based upon the magnitude and variability of the dry unit weights achieved by different tests, the USBR procedure performed the best and the vibrating table test (ASTM D 4253) performed the worst when compared to BS 1377 and BS 5835.
A further study investigated the testing of particles with up to 3-inch sized particles (Benavidez and Young, n. d. c). Tests were performed using a 0.50-ft3 mold in conjunction with both the vibrating hammer and the vibrating table; it was concluded that
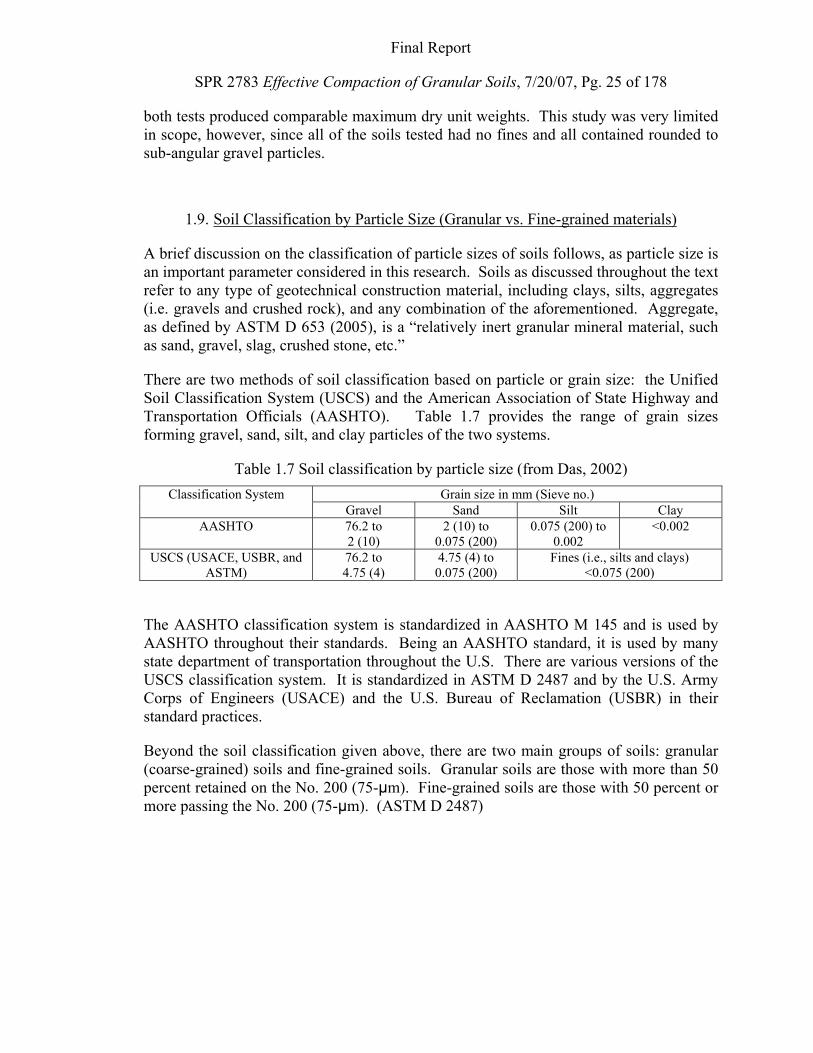
Final Report
SPR 2783 Effective Compaction of Granular Soils, 7/20/07, Pg. 25 of 178
both tests produced comparable maximum dry unit weights. This study was very limited in scope, however, since all of the soils tested had no fines and all contained rounded to sub-angular gravel particles.
1.9. Soil Classification by Particle Size (Granular vs. Fine-grained materials)
A brief discussion on the classification of particle sizes of soils follows, as particle size is an important parameter considered in this research. Soils as discussed throughout the text refer to any type of geotechnical construction material, including clays, silts, aggregates (i.e. gravels and crushed rock), and any combination of the aforementioned. Aggregate, as defined by ASTM D 653 (2005), is a “relatively inert granular mineral material, such as sand, gravel, slag, crushed stone, etc.”
There are two methods of soil classification based on particle or grain size: the Unified Soil Classification System (USCS) and the American Association of State Highway and Transportation Officials (AASHTO). Table 1.7 provides the range of grain sizes forming gravel, sand, silt, and clay particles of the two systems.
Table 1.7 Soil classification by particle size (from Das, 2002) Classification System Grain size in mm (Sieve no.)
Gravel Sand Silt Clay AASHTO 76.2 to
2 (10) 2 (10) to
0.075 (200) 0.075 (200) to
0.002 <0.002
USCS (USACE, USBR, and ASTM)
76.2 to 4.75 (4)
4.75 (4) to 0.075 (200)
Fines (i.e., silts and clays) <0.075 (200)
The AASHTO classification system is standardized in AASHTO M 145 and is used by AASHTO throughout their standards. Being an AASHTO standard, it is used by many state department of transportation throughout the U.S. There are various versions of the USCS classification system. It is standardized in ASTM D 2487 and by the U.S. Army Corps of Engineers (USACE) and the U.S. Bureau of Reclamation (USBR) in their standard practices.
Beyond the soil classification given above, there are two main groups of soils: granular (coarse-grained) soils and fine-grained soils. Granular soils are those with more than 50 percent retained on the No. 200 (75-μm). Fine-grained soils are those with 50 percent or more passing the No. 200 (75-μm). (ASTM D 2487)
Final Report
SPR 2783 Effective Compaction of Granular Soils, 7/20/07, Pg. 26 of 178
1.10. Oversize Particles
The Standard Practice for Correction of Unit Weight and Water Content for Soils Containing Oversized Particles (ASTM D 4718; AASHTO T 224) defines “Oversize (or coarse) particles” are those soil particles retained on the No. 4 (4.75-mm) sieve or larger. For a compaction test, the size of the oversize particles depends upon the mold size. For instance, the USACE (1995) refers to oversize particles as those particles retained on the No. 4 (4.75-mm) sieve for a 4-inch mold, ¾ -inch (19.0-mm) sieve for a 6-inch mold, and 2-inch (50-mm) sieve for a 12-inch mold.
The oversize particles of a soil sample may be known as the oversize fraction, while the rest of the sample as the fine fraction. The oversize fraction is typically removed for a compaction test when it is greater than 5% by mass of the total sample. The removal of such particles is termed “scalping”. For most 6-inch mold compaction tests, oversize particles refer to the fraction retained on the ¾-in. (19-mm) sieve.
The phrase “oversize particles” in this report refers to particles retained on the ¾ in. (19-mm) sieve, as these are the particles typically scalped for a 6-inch mold compaction test. A 6-inch mold or larger is used in this research.
As a note, oversize particles is not a standardized phrase in the two classification systems discussed in Section 1.9, but is defined in compaction standards.
Final Report
SPR 2783 Effective Compaction of Granular Soils, 7/20/07, Pg. 27 of 178
CHAPTER 2. COMPACTION AND THE VIBRATING HAMMER METHOD FOR GRANULAR SOILS WITHOUT OVERSIZED PARTICLES
2.1. Introduction Compaction of soils to their utmost density is important, as density of a soil has been shown to be related to important engineering parameters of a material. An increase in density typically results in a higher shear strength, lower compressibility (higher modulus), and lower permeability.
The early work of this research (Prochaska, 2004) developed the Vibrating Hammer Method for granular soils and was limited to those granular soils without oversized particles and the latter part of this research extended the method for usage with granular materials containing oversize particles.
This chapter describes the materials on which compaction tests were performed, the equipment used, the compaction procedures followed, and the compaction results that were obtained. Finally, the One-Point Vibrating Hammer Compaction Test is introduced. Materials other than those mentioned in this chapter, which were used for auxiliary tests only, will be introduced in subsequent chapters as the needs arise.
2.2. INDOT Materials Two granular materials commonly used by the Indiana Department of Transportation (INDOT) are B Borrow and Indiana 53. B Borrow is used as structural backfill and also as general fill below the water table; Indiana 53 is a dense graded aggregate that is widely used as a base course material. The composition of Indiana 53 that is used varies by region. Near Lafayette, gravel Indiana 53 is typically used. In the northern and southern regions of the state, crushed stone Indiana 53 is more widely used. Slag Indiana 53 may also sometimes be used in the northern part of the state (Sipes, 2003). Gradation requirements of B Borrow are shown in Table 2.1; Table 2.2 shows the gradation requirement for Indiana 53 (INDOT, 1999).
2.3. Materials Tested Prior to compaction testing, soil classifications were performed following both AASHTO M 145 and the Unified Soil Classification System (ASTM D 2487). Soil samples were reduced to a specimen size appropriate for testing following ASTM C 702. Particle size distributions of the soils to be used for compaction testing were determined by wet sieving (ASTM D 1140, Method A) followed by dry sieving (ASTM C 136). For finer material that was to be mixed with sand, particle size distributions were determined through a combined analysis following ASTM D 422. When appropriate, the Atterberg Limits were determined following ASTM D 4318.
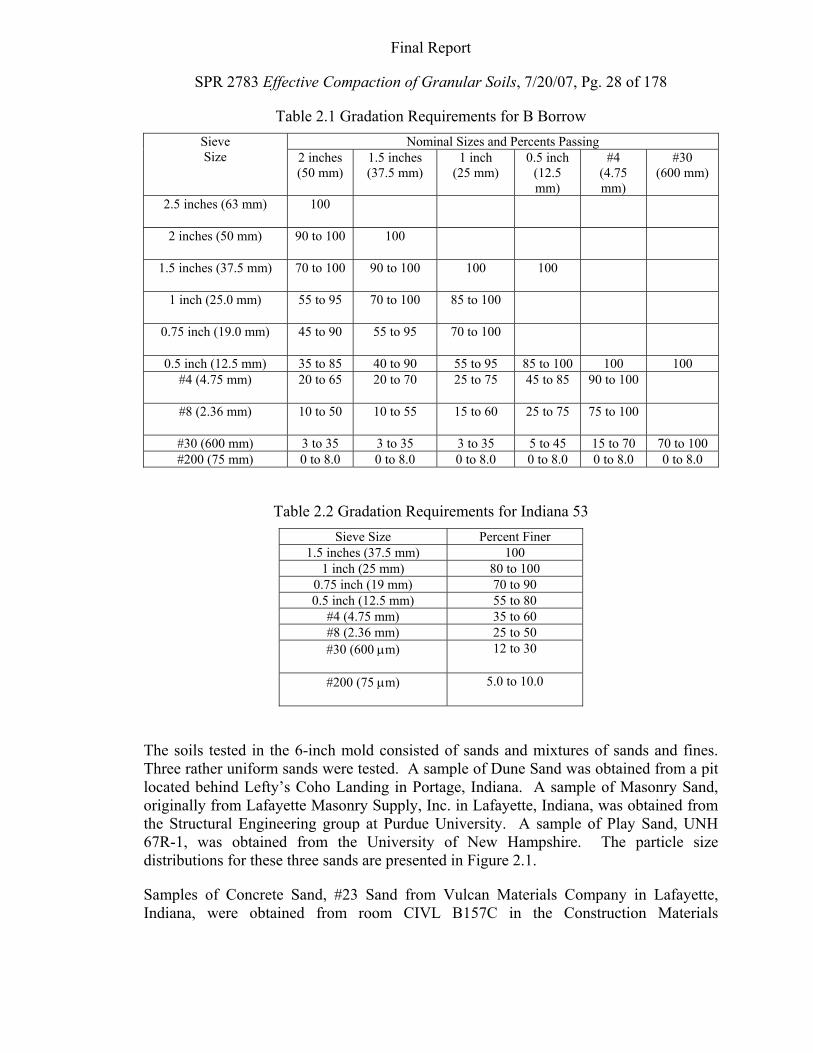
Final Report
SPR 2783 Effective Compaction of Granular Soils, 7/20/07, Pg. 28 of 178
Table 2.1 Gradation Requirements for B Borrow Sieve Size
Nominal Sizes and Percents Passing 2 inches (50 mm)
1.5 inches (37.5 mm)
1 inch (25 mm)
0.5 inch (12.5 mm)
#4 (4.75 mm)
#30 (600 mm)
2.5 inches (63 mm) 100
2 inches (50 mm) 90 to 100 100
1.5 inches (37.5 mm) 70 to 100 90 to 100 100 100
1 inch (25.0 mm) 55 to 95 70 to 100 85 to 100
0.75 inch (19.0 mm) 45 to 90 55 to 95 70 to 100
0.5 inch (12.5 mm) 35 to 85 40 to 90 55 to 95 85 to 100 100 100 #4 (4.75 mm) 20 to 65 20 to 70 25 to 75 45 to 85 90 to 100
#8 (2.36 mm) 10 to 50 10 to 55 15 to 60 25 to 75 75 to 100
#30 (600 mm) 3 to 35 3 to 35 3 to 35 5 to 45 15 to 70 70 to 100 #200 (75 mm) 0 to 8.0 0 to 8.0 0 to 8.0 0 to 8.0 0 to 8.0 0 to 8.0
Table 2.2 Gradation Requirements for Indiana 53 Sieve Size Percent Finer
1.5 inches (37.5 mm) 100 1 inch (25 mm) 80 to 100
0.75 inch (19 mm) 70 to 90 0.5 inch (12.5 mm) 55 to 80
#4 (4.75 mm) 35 to 60 #8 (2.36 mm) 25 to 50 #30 (600 μm) 12 to 30
#200 (75 μm) 5.0 to 10.0
The soils tested in the 6-inch mold consisted of sands and mixtures of sands and fines. Three rather uniform sands were tested. A sample of Dune Sand was obtained from a pit located behind Lefty’s Coho Landing in Portage, Indiana. A sample of Masonry Sand, originally from Lafayette Masonry Supply, Inc. in Lafayette, Indiana, was obtained from the Structural Engineering group at Purdue University. A sample of Play Sand, UNH 67R-1, was obtained from the University of New Hampshire. The particle size distributions for these three sands are presented in Figure 2.1.
Samples of Concrete Sand, #23 Sand from Vulcan Materials Company in Lafayette, Indiana, were obtained from room CIVL B157C in the Construction Materials
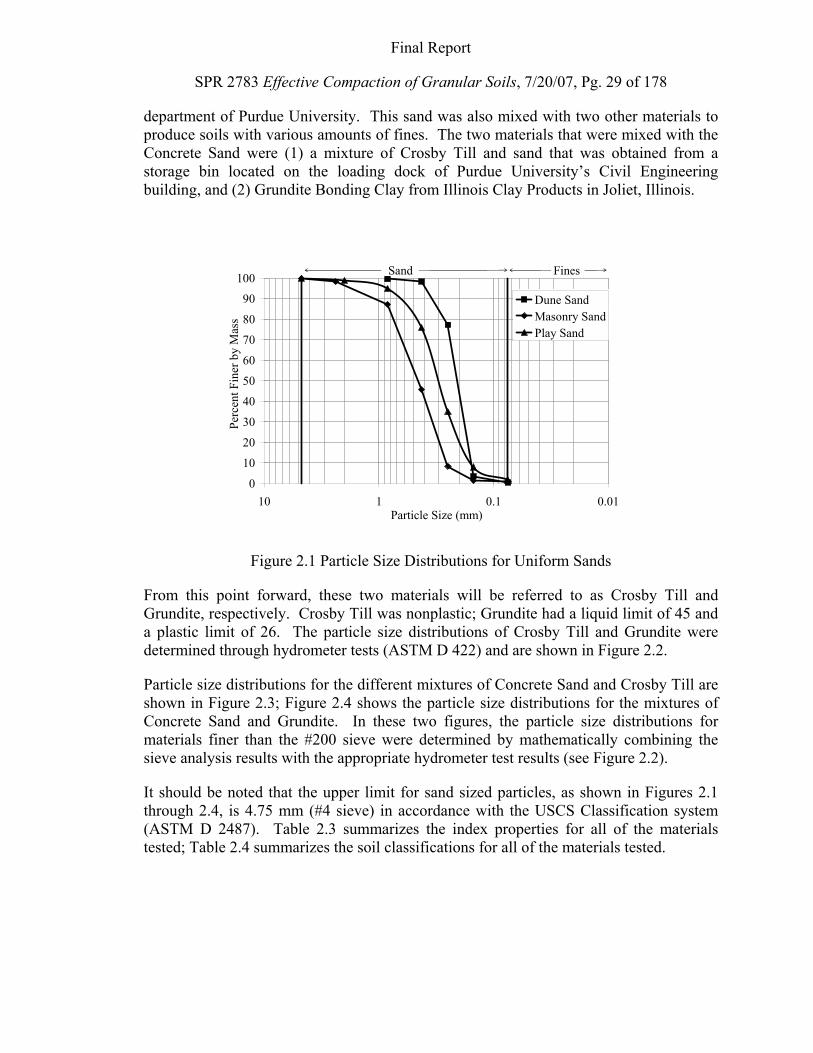
Final Report
SPR 2783 Effective Compaction of Granular Soils, 7/20/07, Pg. 29 of 178
department of Purdue University. This sand was also mixed with two other materials to produce soils with various amounts of fines. The two materials that were mixed with the Concrete Sand were (1) a mixture of Crosby Till and sand that was obtained from a storage bin located on the loading dock of Purdue University’s Civil Engineering building, and (2) Grundite Bonding Clay from Illinois Clay Products in Joliet, Illinois.
0
10
20
30
40
50
60
70
80
90
100
0.010.1110Particle Size (mm)
Perc
ent F
iner
by
Mas
s
Dune SandMasonry SandPlay Sand
Sand Fines
Figure 2.1 Particle Size Distributions for Uniform Sands
From this point forward, these two materials will be referred to as Crosby Till and Grundite, respectively. Crosby Till was nonplastic; Grundite had a liquid limit of 45 and a plastic limit of 26. The particle size distributions of Crosby Till and Grundite were determined through hydrometer tests (ASTM D 422) and are shown in Figure 2.2.
Particle size distributions for the different mixtures of Concrete Sand and Crosby Till are shown in Figure 2.3; Figure 2.4 shows the particle size distributions for the mixtures of Concrete Sand and Grundite. In these two figures, the particle size distributions for materials finer than the #200 sieve were determined by mathematically combining the sieve analysis results with the appropriate hydrometer test results (see Figure 2.2).
It should be noted that the upper limit for sand sized particles, as shown in Figures 2.1 through 2.4, is 4.75 mm (#4 sieve) in accordance with the USCS Classification system (ASTM D 2487). Table 2.3 summarizes the index properties for all of the materials tested; Table 2.4 summarizes the soil classifications for all of the materials tested.
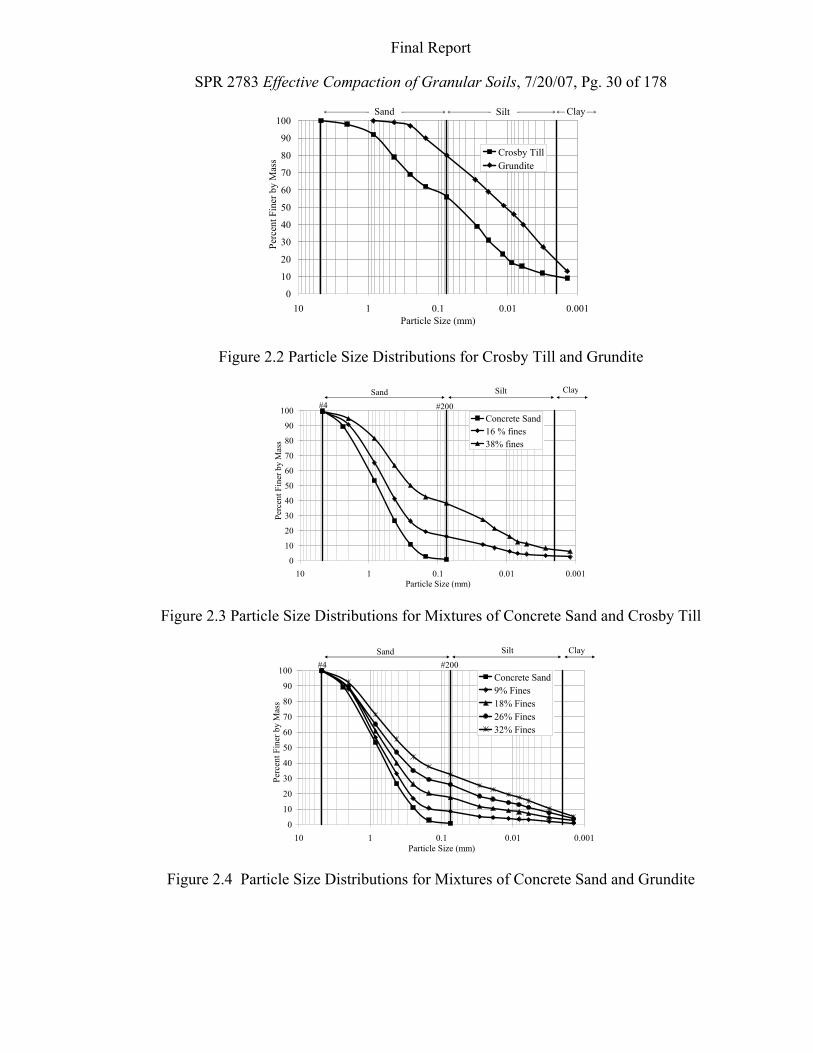
Final Report
SPR 2783 Effective Compaction of Granular Soils, 7/20/07, Pg. 30 of 178
0
10
20
30
40
50
60
70
80
90
100
0.0010.010.1110Particle Size (mm)
Perc
ent F
iner
by
Mas
s
Crosby TillGrundite
Sand Silt Clay
Figure 2.2 Particle Size Distributions for Crosby Till and Grundite
0
10
20
30
40
50
60
70
80
90
100
0.0010.010.1110Particle Size (mm)
Perc
ent F
iner
by
Mas
s
Concrete Sand16 % fines38% fines
#4 #200
Sand Silt Clay
1
Figure 2.3 Particle Size Distributions for Mixtures of Concrete Sand and Crosby Till
0
10
20
30
40
50
60
70
80
90
100
0.0010.010.1110Particle Size (mm)
Perc
ent F
iner
by
Mas
s
Concrete Sand9% Fines18% Fines26% Fines32% Fines
#4 #200 Sand Silt Clay
Figure 2.4 Particle Size Distributions for Mixtures of Concrete Sand and Grundite
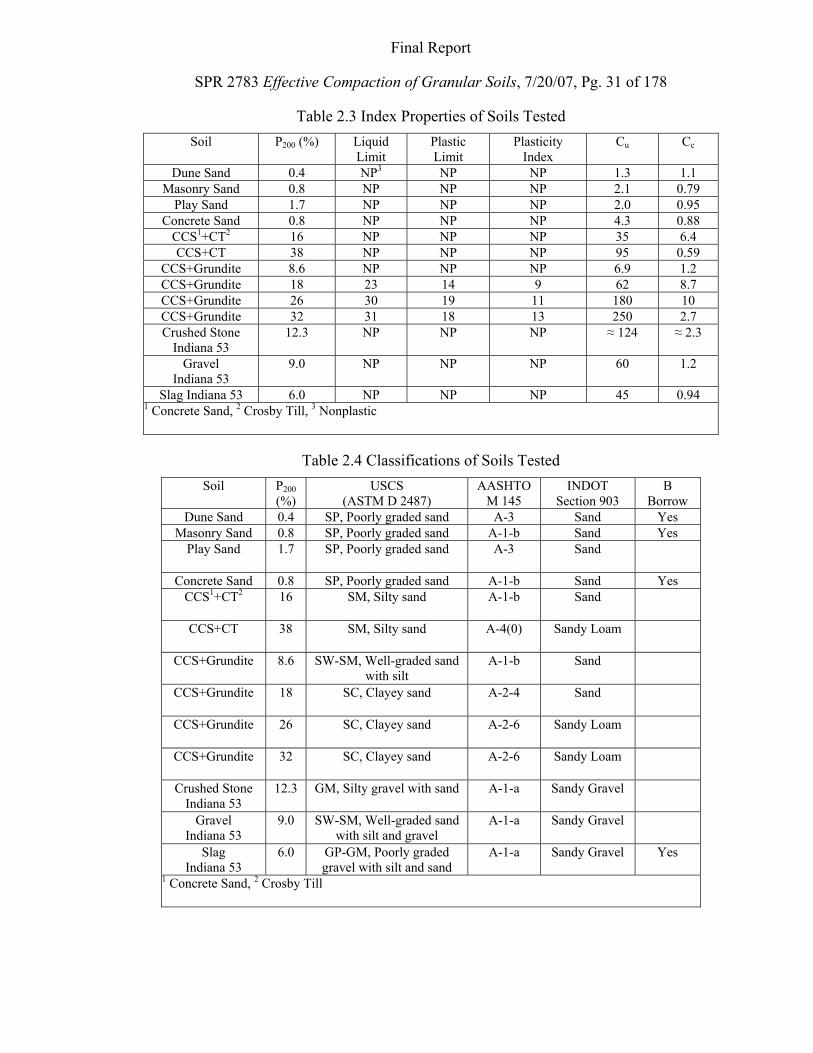
Final Report
SPR 2783 Effective Compaction of Granular Soils, 7/20/07, Pg. 31 of 178
Table 2.3 Index Properties of Soils Tested Soil P200 (%) Liquid
Limit Plastic Limit
Plasticity Index
Cu Cc
Dune Sand 0.4 NP3 NP NP 1.3 1.1 Masonry Sand 0.8 NP NP NP 2.1 0.79
Play Sand 1.7 NP NP NP 2.0 0.95 Concrete Sand 0.8 NP NP NP 4.3 0.88
CCS1+CT2 16 NP NP NP 35 6.4 CCS+CT 38 NP NP NP 95 0.59
CCS+Grundite 8.6 NP NP NP 6.9 1.2 CCS+Grundite 18 23 14 9 62 8.7 CCS+Grundite 26 30 19 11 180 10 CCS+Grundite 32 31 18 13 250 2.7 Crushed Stone
Indiana 53 12.3 NP NP NP ≈ 124 ≈ 2.3
Gravel Indiana 53
9.0 NP NP NP 60 1.2
Slag Indiana 53 6.0 NP NP NP 45 0.94 1 Concrete Sand, 2 Crosby Till, 3 Nonplastic
Table 2.4 Classifications of Soils Tested Soil P200
(%) USCS
(ASTM D 2487) AASHTO
M 145 INDOT
Section 903 B
Borrow Dune Sand 0.4 SP, Poorly graded sand A-3 Sand Yes
Masonry Sand 0.8 SP, Poorly graded sand A-1-b Sand Yes Play Sand 1.7 SP, Poorly graded sand A-3 Sand
Concrete Sand 0.8 SP, Poorly graded sand A-1-b Sand Yes CCS1+CT2 16 SM, Silty sand A-1-b Sand
CCS+CT 38 SM, Silty sand A-4(0) Sandy Loam
CCS+Grundite 8.6 SW-SM, Well-graded sand with silt
A-1-b Sand
CCS+Grundite 18 SC, Clayey sand A-2-4 Sand
CCS+Grundite 26 SC, Clayey sand A-2-6 Sandy Loam
CCS+Grundite 32 SC, Clayey sand A-2-6 Sandy Loam
Crushed Stone Indiana 53
12.3 GM, Silty gravel with sand A-1-a Sandy Gravel
Gravel Indiana 53
9.0 SW-SM, Well-graded sand with silt and gravel
A-1-a Sandy Gravel
Slag Indiana 53
6.0 GP-GM, Poorly graded gravel with silt and sand
A-1-a Sandy Gravel Yes
1 Concrete Sand, 2 Crosby Till
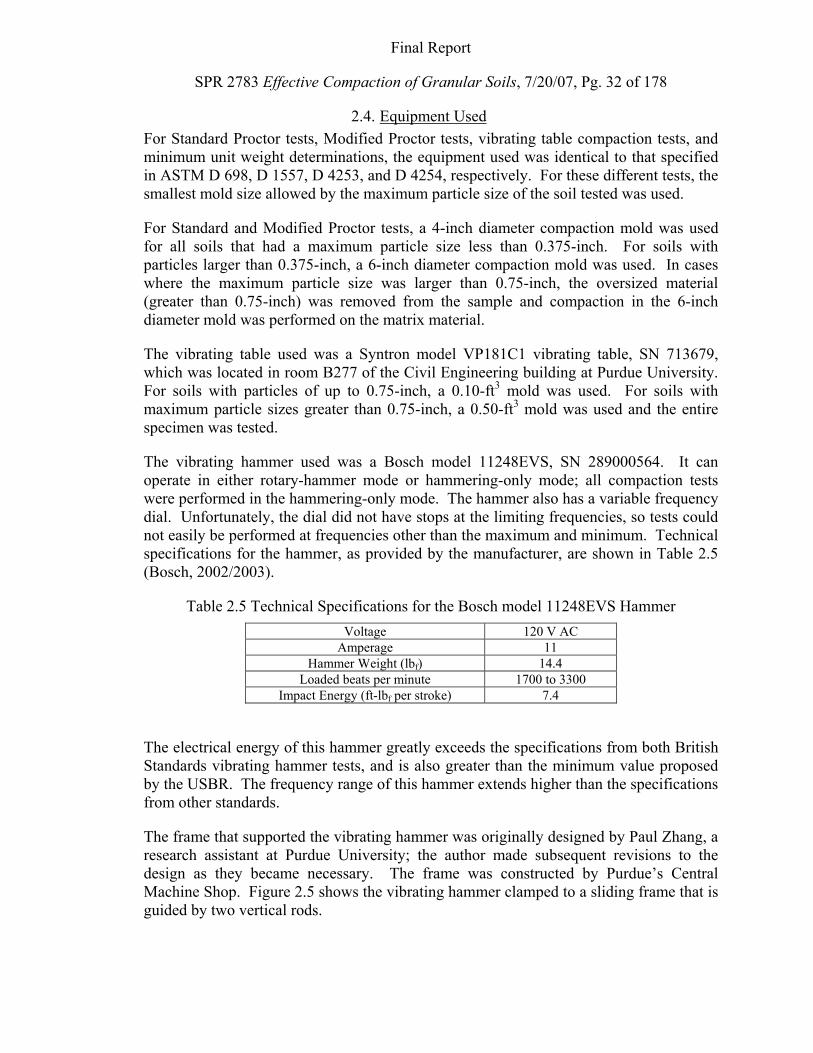
Final Report
SPR 2783 Effective Compaction of Granular Soils, 7/20/07, Pg. 32 of 178
2.4. Equipment Used For Standard Proctor tests, Modified Proctor tests, vibrating table compaction tests, and minimum unit weight determinations, the equipment used was identical to that specified in ASTM D 698, D 1557, D 4253, and D 4254, respectively. For these different tests, the smallest mold size allowed by the maximum particle size of the soil tested was used.
For Standard and Modified Proctor tests, a 4-inch diameter compaction mold was used for all soils that had a maximum particle size less than 0.375-inch. For soils with particles larger than 0.375-inch, a 6-inch diameter compaction mold was used. In cases where the maximum particle size was larger than 0.75-inch, the oversized material (greater than 0.75-inch) was removed from the sample and compaction in the 6-inch diameter mold was performed on the matrix material.
The vibrating table used was a Syntron model VP181C1 vibrating table, SN 713679, which was located in room B277 of the Civil Engineering building at Purdue University. For soils with particles of up to 0.75-inch, a 0.10-ft3 mold was used. For soils with maximum particle sizes greater than 0.75-inch, a 0.50-ft3 mold was used and the entire specimen was tested.
The vibrating hammer used was a Bosch model 11248EVS, SN 289000564. It can operate in either rotary-hammer mode or hammering-only mode; all compaction tests were performed in the hammering-only mode. The hammer also has a variable frequency dial. Unfortunately, the dial did not have stops at the limiting frequencies, so tests could not easily be performed at frequencies other than the maximum and minimum. Technical specifications for the hammer, as provided by the manufacturer, are shown in Table 2.5 (Bosch, 2002/2003).
Table 2.5 Technical Specifications for the Bosch model 11248EVS Hammer Voltage 120 V AC
Amperage 11 Hammer Weight (lbf) 14.4
Loaded beats per minute 1700 to 3300 Impact Energy (ft-lbf per stroke) 7.4
The electrical energy of this hammer greatly exceeds the specifications from both British Standards vibrating hammer tests, and is also greater than the minimum value proposed by the USBR. The frequency range of this hammer extends higher than the specifications from other standards.
The frame that supported the vibrating hammer was originally designed by Paul Zhang, a research assistant at Purdue University; the author made subsequent revisions to the design as they became necessary. The frame was constructed by Purdue’s Central Machine Shop. Figure 2.5 shows the vibrating hammer clamped to a sliding frame that is guided by two vertical rods.
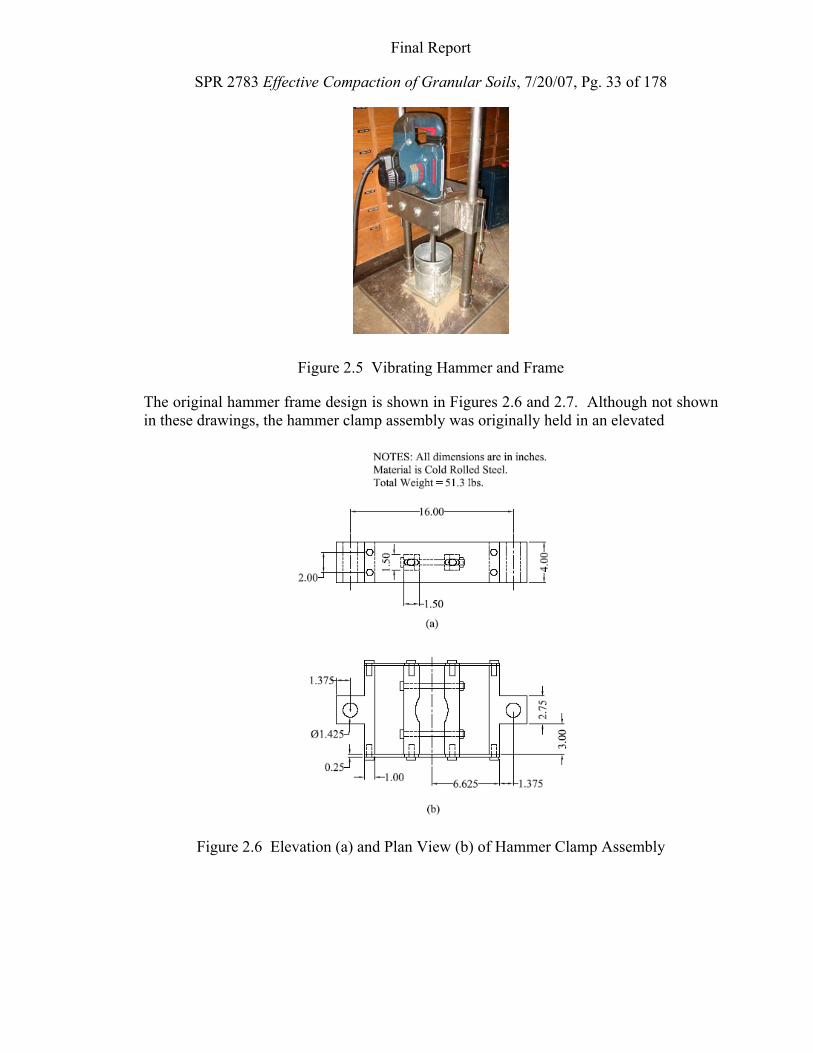
Final Report
SPR 2783 Effective Compaction of Granular Soils, 7/20/07, Pg. 33 of 178
Figure 2.5 Vibrating Hammer and Frame
The original hammer frame design is shown in Figures 2.6 and 2.7. Although not shown in these drawings, the hammer clamp assembly was originally held in an elevated
Figure 2.6 Elevation (a) and Plan View (b) of Hammer Clamp Assembly
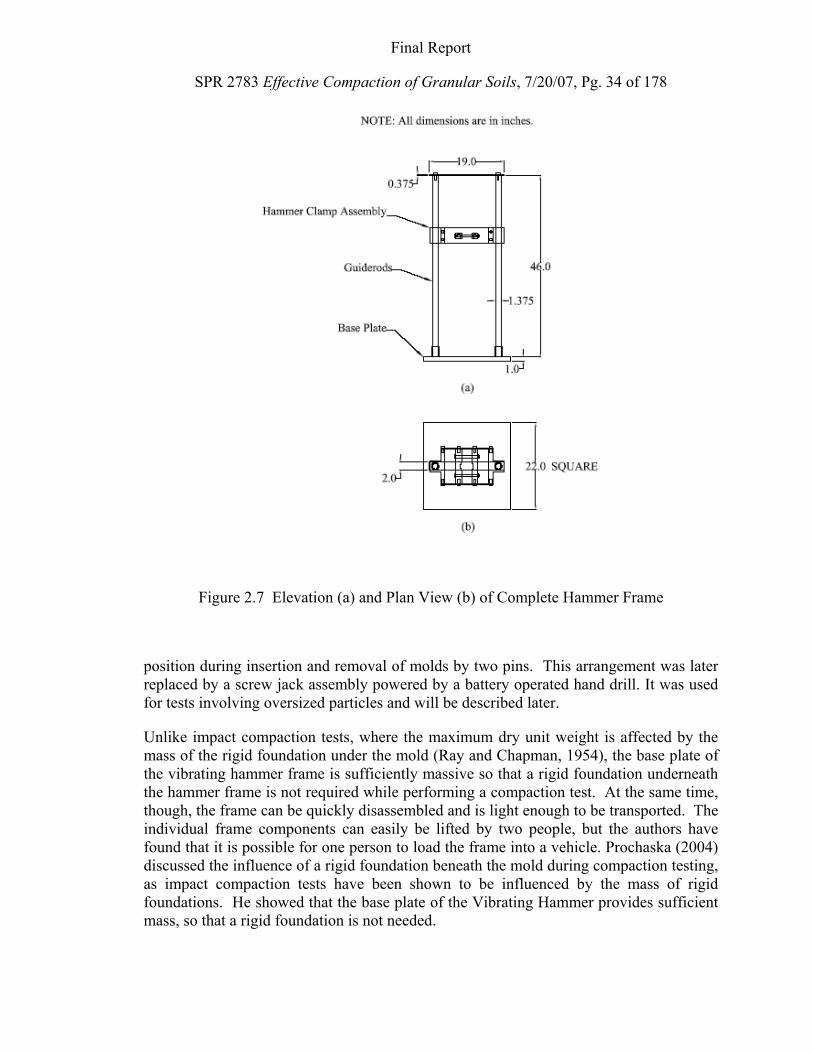
Final Report
SPR 2783 Effective Compaction of Granular Soils, 7/20/07, Pg. 34 of 178
Figure 2.7 Elevation (a) and Plan View (b) of Complete Hammer Frame
position during insertion and removal of molds by two pins. This arrangement was later replaced by a screw jack assembly powered by a battery operated hand drill. It was used for tests involving oversized particles and will be described later.
Unlike impact compaction tests, where the maximum dry unit weight is affected by the mass of the rigid foundation under the mold (Ray and Chapman, 1954), the base plate of the vibrating hammer frame is sufficiently massive so that a rigid foundation underneath the hammer frame is not required while performing a compaction test. At the same time, though, the frame can be quickly disassembled and is light enough to be transported. The individual frame components can easily be lifted by two people, but the authors have found that it is possible for one person to load the frame into a vehicle. Prochaska (2004) discussed the influence of a rigid foundation beneath the mold during compaction testing, as impact compaction tests have been shown to be influenced by the mass of rigid foundations. He showed that the base plate of the Vibrating Hammer provides sufficient mass, so that a rigid foundation is not needed.
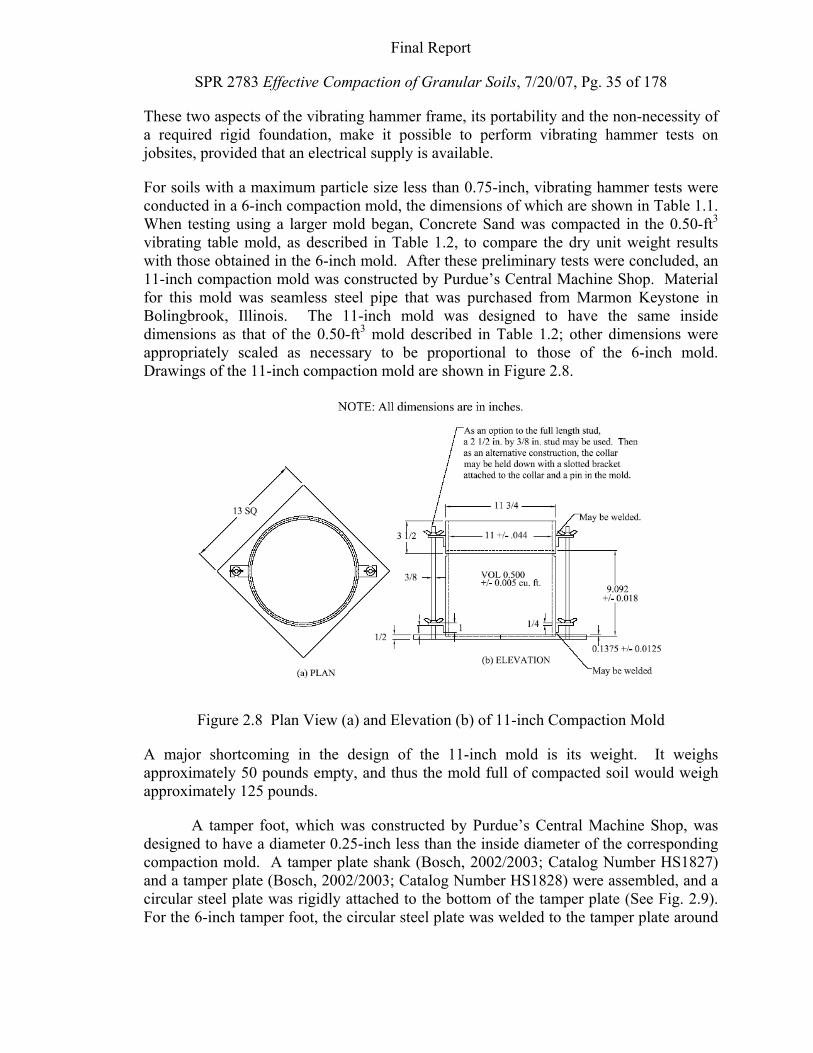
Final Report
SPR 2783 Effective Compaction of Granular Soils, 7/20/07, Pg. 35 of 178
These two aspects of the vibrating hammer frame, its portability and the non-necessity of a required rigid foundation, make it possible to perform vibrating hammer tests on jobsites, provided that an electrical supply is available.
For soils with a maximum particle size less than 0.75-inch, vibrating hammer tests were conducted in a 6-inch compaction mold, the dimensions of which are shown in Table 1.1. When testing using a larger mold began, Concrete Sand was compacted in the 0.50-ft3 vibrating table mold, as described in Table 1.2, to compare the dry unit weight results with those obtained in the 6-inch mold. After these preliminary tests were concluded, an 11-inch compaction mold was constructed by Purdue’s Central Machine Shop. Material for this mold was seamless steel pipe that was purchased from Marmon Keystone in Bolingbrook, Illinois. The 11-inch mold was designed to have the same inside dimensions as that of the 0.50-ft3 mold described in Table 1.2; other dimensions were appropriately scaled as necessary to be proportional to those of the 6-inch mold. Drawings of the 11-inch compaction mold are shown in Figure 2.8.
Figure 2.8 Plan View (a) and Elevation (b) of 11-inch Compaction Mold
A major shortcoming in the design of the 11-inch mold is its weight. It weighs approximately 50 pounds empty, and thus the mold full of compacted soil would weigh approximately 125 pounds.
A tamper foot, which was constructed by Purdue’s Central Machine Shop, was designed to have a diameter 0.25-inch less than the inside diameter of the corresponding compaction mold. A tamper plate shank (Bosch, 2002/2003; Catalog Number HS1827) and a tamper plate (Bosch, 2002/2003; Catalog Number HS1828) were assembled, and a circular steel plate was rigidly attached to the bottom of the tamper plate (See Fig. 2.9). For the 6-inch tamper foot, the circular steel plate was welded to the tamper plate around
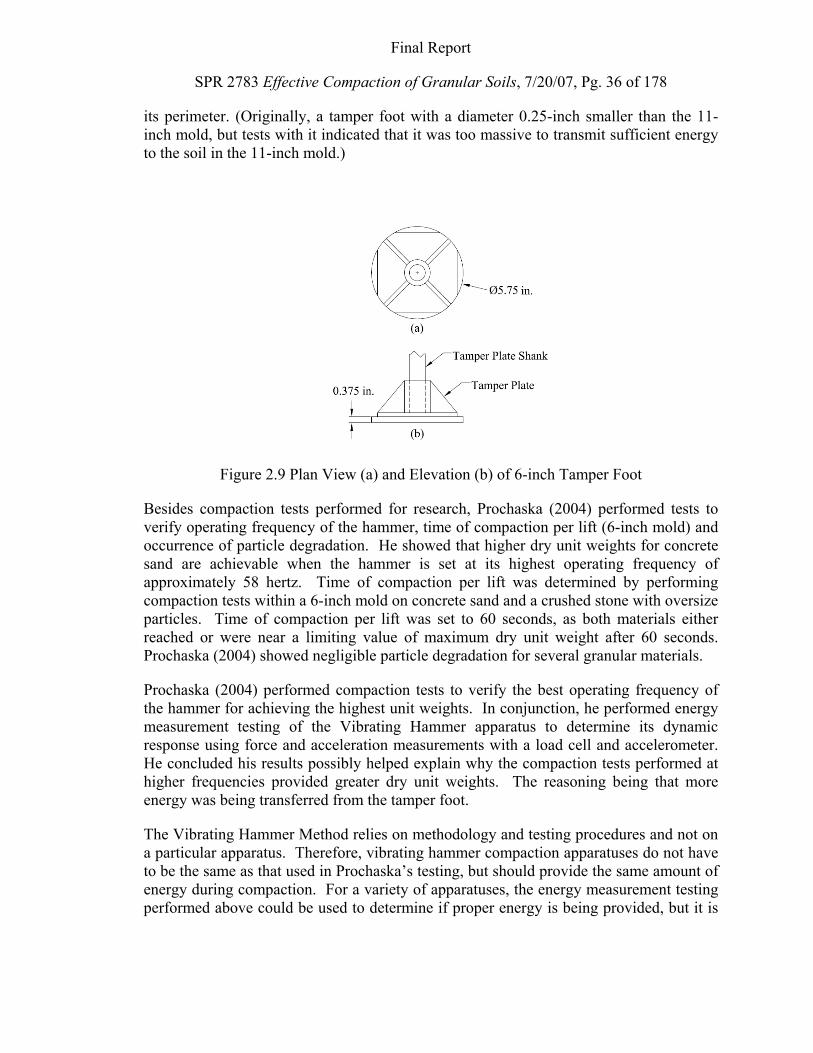
Final Report
SPR 2783 Effective Compaction of Granular Soils, 7/20/07, Pg. 36 of 178
its perimeter. (Originally, a tamper foot with a diameter 0.25-inch smaller than the 11-inch mold, but tests with it indicated that it was too massive to transmit sufficient energy to the soil in the 11-inch mold.)
Figure 2.9 Plan View (a) and Elevation (b) of 6-inch Tamper Foot
Besides compaction tests performed for research, Prochaska (2004) performed tests to verify operating frequency of the hammer, time of compaction per lift (6-inch mold) and occurrence of particle degradation. He showed that higher dry unit weights for concrete sand are achievable when the hammer is set at its highest operating frequency of approximately 58 hertz. Time of compaction per lift was determined by performing compaction tests within a 6-inch mold on concrete sand and a crushed stone with oversize particles. Time of compaction per lift was set to 60 seconds, as both materials either reached or were near a limiting value of maximum dry unit weight after 60 seconds. Prochaska (2004) showed negligible particle degradation for several granular materials.
Prochaska (2004) performed compaction tests to verify the best operating frequency of the hammer for achieving the highest unit weights. In conjunction, he performed energy measurement testing of the Vibrating Hammer apparatus to determine its dynamic response using force and acceleration measurements with a load cell and accelerometer. He concluded his results possibly helped explain why the compaction tests performed at higher frequencies provided greater dry unit weights. The reasoning being that more energy was being transferred from the tamper foot.
The Vibrating Hammer Method relies on methodology and testing procedures and not on a particular apparatus. Therefore, vibrating hammer compaction apparatuses do not have to be the same as that used in Prochaska’s testing, but should provide the same amount of energy during compaction. For a variety of apparatuses, the energy measurement testing performed above could be used to determine if proper energy is being provided, but it is
Final Report
SPR 2783 Effective Compaction of Granular Soils, 7/20/07, Pg. 37 of 178
not ideal to always have to perform such testing to ensure proper operation. Instead, he developed a calibration procedure based on other vibrating hammer compaction tests.
Current vibrating hammer calibration procedures, including those in the draft Standard, specify the use of standard sand achieving a specified dry unit weight as the calibration procedure for determining if enough energy is being supplied by the hammer (Prochaska, 2004). This is based on the fact that compaction curves move upwards in terms of dry unit weight, as compactive energy is increased, but reach a point where increases in dry unit weights lessens with increase in compaction energy. Thus, it was deemed that specifying a minimum dry unit weight that must be met, is sufficient in ensuring a minimum amount of energy is being applied, and that a calibration procedure as such would be easier to perform, rather than specifying a minimum energy and then having to measure it. ASTM C 778 20-30 silica sand was used. Prochaska (2004) determined the minimum acceptable dry unit weight to be 109.5 pcf. This was later modified by Evans (2006) to 110.0 pcf.
2.5. Procedures Since many of the materials to be tested were already in an air-dry condition, soil specimens were prepared following the Dry Preparation Method found in ASTM D 698 and D 1557. Dry samples were split following ASTM C 702 to obtain the required number of appropriately sized test specimens. For materials that required the mixing of finer material with Concrete Sand, the appropriate percentage of finer material was added to each test specimen individually and thoroughly mixed using a trowel. This preparation order was chosen so that finer material would not be lost as dust during the splitting process.
The Grundite was in the form of an air-dry powder, and thus could be easily mixed with the Concrete Sand. The Crosby Till, however, was in the form of air-dry clods of various sizes. Prior to mixing, the Crosby Till was pulverized using a mortar and pestle, without reducing the natural size of the sand particles, until the clods passed through a #40 sieve. Tap water was used for all tests.
Standard and Modified Proctor compaction tests were performed following the compaction procedures for the appropriate mold size used, as found in ASTM D 698 and D 1557, respectively. A representative water content sample was taken from each compacted specimen and the water content was determined following ASTM D 2216.
Minimum unit weight determinations were made following ASTM D 4254, Method A. For all of the sandy materials, a funnel and the 0.10-ft3 mold were used.
Vibrating table maximum unit weight determinations were performed following ASTM D 4253, Methods 1A and 1B. During compaction, the power level on the rheostat was set at 1. A previous calibration had shown that this power level would produce an average double amplitude within 0.013 ± 0.002 inch, as specified by ASTM D 4253 for vibrating tables operating at 60 Hertz. The calibration of the vibrating table was
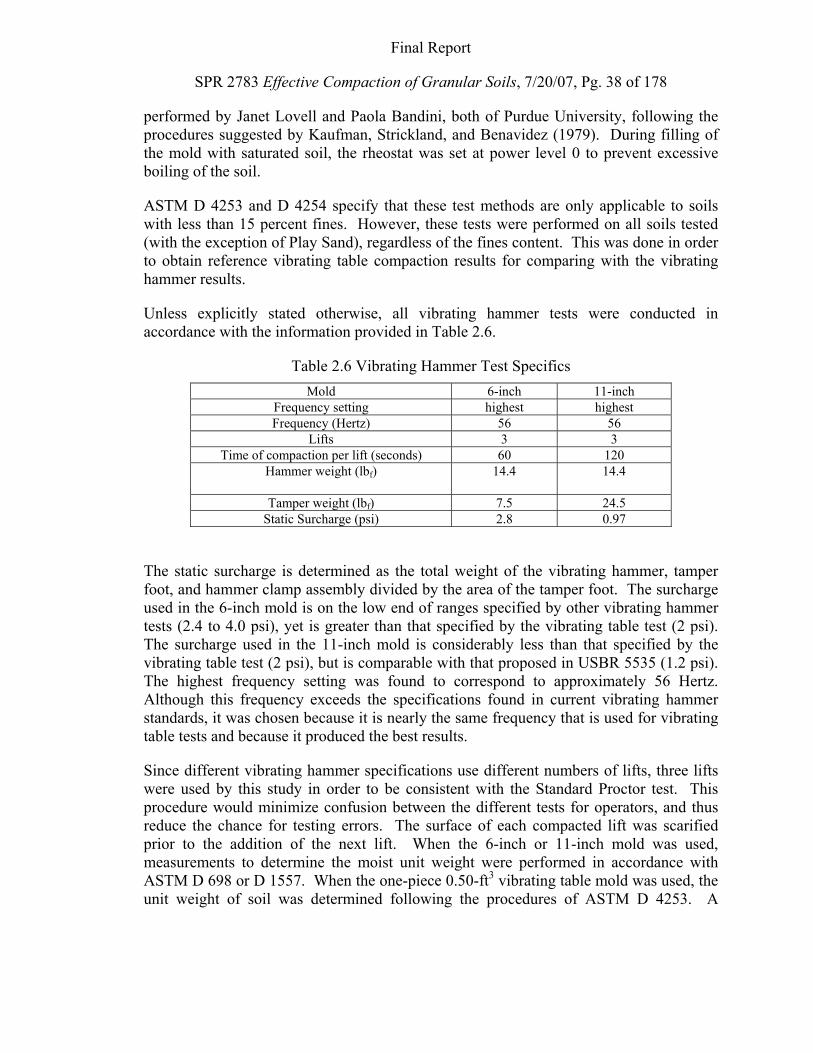
Final Report
SPR 2783 Effective Compaction of Granular Soils, 7/20/07, Pg. 38 of 178
performed by Janet Lovell and Paola Bandini, both of Purdue University, following the procedures suggested by Kaufman, Strickland, and Benavidez (1979). During filling of the mold with saturated soil, the rheostat was set at power level 0 to prevent excessive boiling of the soil.
ASTM D 4253 and D 4254 specify that these test methods are only applicable to soils with less than 15 percent fines. However, these tests were performed on all soils tested (with the exception of Play Sand), regardless of the fines content. This was done in order to obtain reference vibrating table compaction results for comparing with the vibrating hammer results.
Unless explicitly stated otherwise, all vibrating hammer tests were conducted in accordance with the information provided in Table 2.6.
Table 2.6 Vibrating Hammer Test Specifics Mold 6-inch 11-inch
Frequency setting highest highest Frequency (Hertz) 56 56
Lifts 3 3 Time of compaction per lift (seconds) 60 120
Hammer weight (lbf) 14.4 14.4
Tamper weight (lbf) 7.5 24.5 Static Surcharge (psi) 2.8 0.97
The static surcharge is determined as the total weight of the vibrating hammer, tamper foot, and hammer clamp assembly divided by the area of the tamper foot. The surcharge used in the 6-inch mold is on the low end of ranges specified by other vibrating hammer tests (2.4 to 4.0 psi), yet is greater than that specified by the vibrating table test (2 psi). The surcharge used in the 11-inch mold is considerably less than that specified by the vibrating table test (2 psi), but is comparable with that proposed in USBR 5535 (1.2 psi). The highest frequency setting was found to correspond to approximately 56 Hertz. Although this frequency exceeds the specifications found in current vibrating hammer standards, it was chosen because it is nearly the same frequency that is used for vibrating table tests and because it produced the best results.
Since different vibrating hammer specifications use different numbers of lifts, three lifts were used by this study in order to be consistent with the Standard Proctor test. This procedure would minimize confusion between the different tests for operators, and thus reduce the chance for testing errors. The surface of each compacted lift was scarified prior to the addition of the next lift. When the 6-inch or 11-inch mold was used, measurements to determine the moist unit weight were performed in accordance with ASTM D 698 or D 1557. When the one-piece 0.50-ft3 vibrating table mold was used, the unit weight of soil was determined following the procedures of ASTM D 4253. A
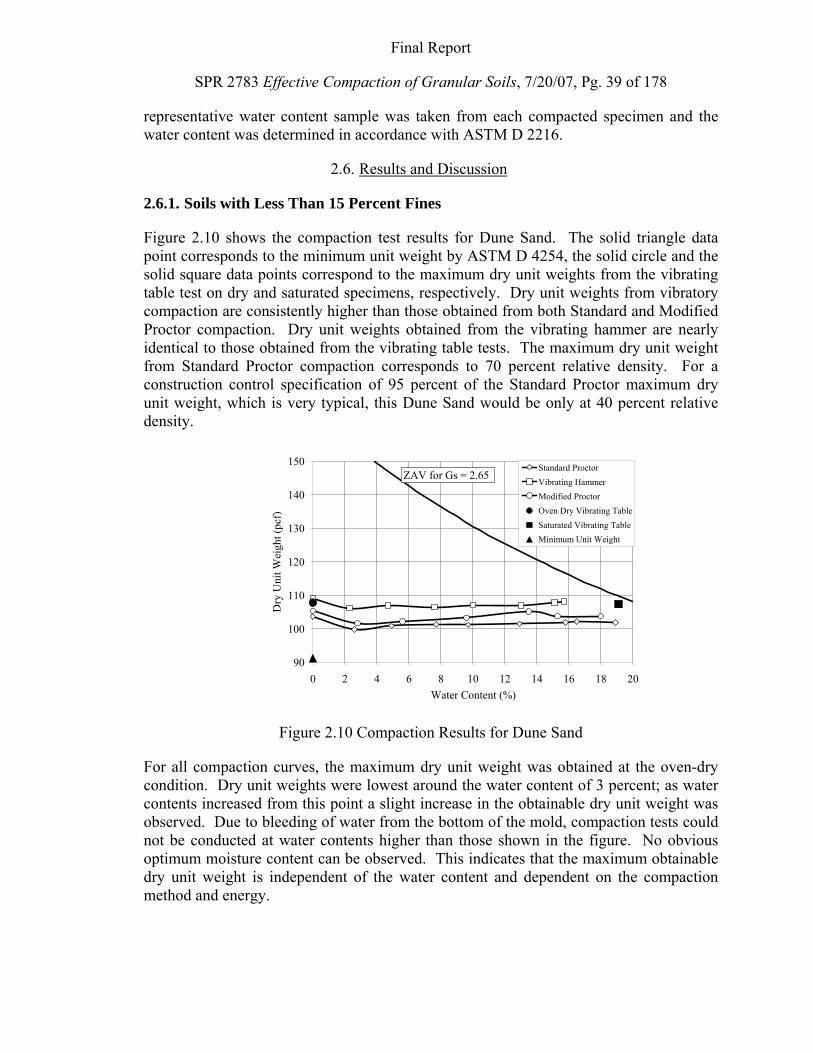
Final Report
SPR 2783 Effective Compaction of Granular Soils, 7/20/07, Pg. 39 of 178
representative water content sample was taken from each compacted specimen and the water content was determined in accordance with ASTM D 2216.
2.6. Results and Discussion
2.6.1. Soils with Less Than 15 Percent Fines
Figure 2.10 shows the compaction test results for Dune Sand. The solid triangle data point corresponds to the minimum unit weight by ASTM D 4254, the solid circle and the solid square data points correspond to the maximum dry unit weights from the vibrating table test on dry and saturated specimens, respectively. Dry unit weights from vibratory compaction are consistently higher than those obtained from both Standard and Modified Proctor compaction. Dry unit weights obtained from the vibrating hammer are nearly identical to those obtained from the vibrating table tests. The maximum dry unit weight from Standard Proctor compaction corresponds to 70 percent relative density. For a construction control specification of 95 percent of the Standard Proctor maximum dry unit weight, which is very typical, this Dune Sand would be only at 40 percent relative density.
90
100
110
120
130
140
150
0 2 4 6 8 10 12 14 16 18 20Water Content (%)
Dry
Uni
t Wei
ght (
pcf)
Standard ProctorVibrating HammerModified ProctorOven Dry Vibrating TableSaturated Vibrating TableMinimum Unit Weight
ZAV for Gs = 2.65
Figure 2.10 Compaction Results for Dune Sand
For all compaction curves, the maximum dry unit weight was obtained at the oven-dry condition. Dry unit weights were lowest around the water content of 3 percent; as water contents increased from this point a slight increase in the obtainable dry unit weight was observed. Due to bleeding of water from the bottom of the mold, compaction tests could not be conducted at water contents higher than those shown in the figure. No obvious optimum moisture content can be observed. This indicates that the maximum obtainable dry unit weight is independent of the water content and dependent on the compaction method and energy.
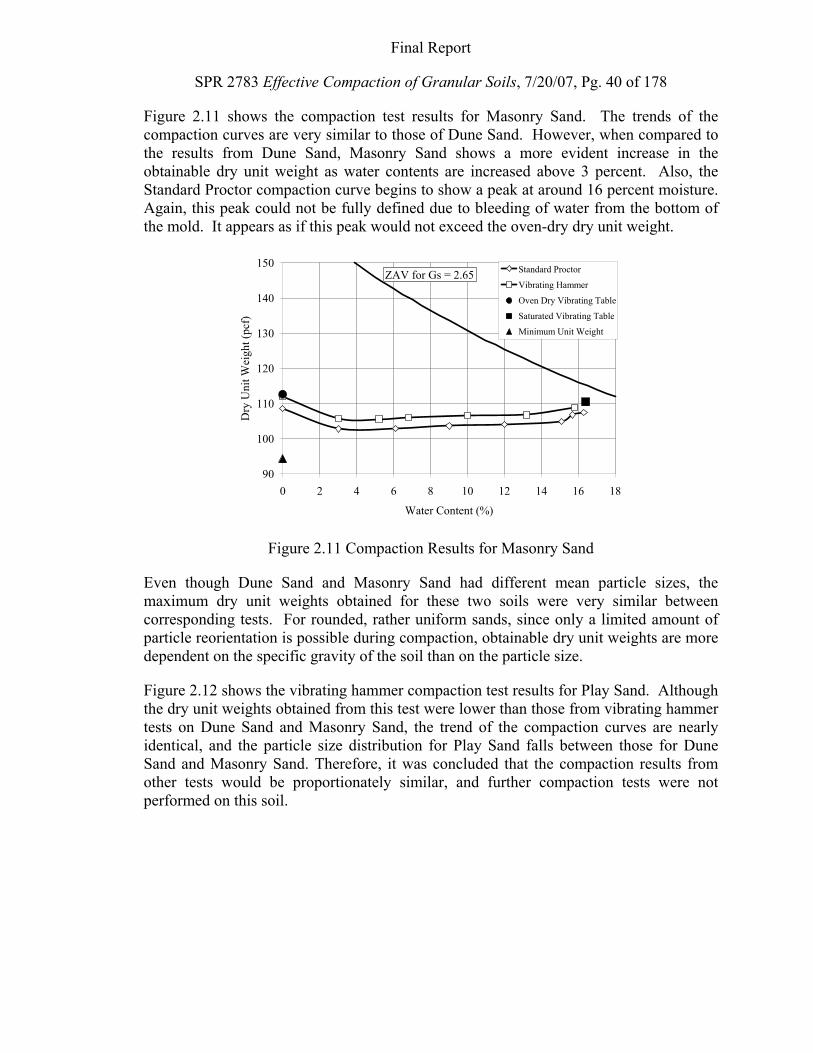
Final Report
SPR 2783 Effective Compaction of Granular Soils, 7/20/07, Pg. 40 of 178
Figure 2.11 shows the compaction test results for Masonry Sand. The trends of the compaction curves are very similar to those of Dune Sand. However, when compared to the results from Dune Sand, Masonry Sand shows a more evident increase in the obtainable dry unit weight as water contents are increased above 3 percent. Also, the Standard Proctor compaction curve begins to show a peak at around 16 percent moisture. Again, this peak could not be fully defined due to bleeding of water from the bottom of the mold. It appears as if this peak would not exceed the oven-dry dry unit weight.
90
100
110
120
130
140
150
0 2 4 6 8 10 12 14 16 18
Water Content (%)
Dry
Uni
t Wei
ght (
pcf)
Standard Proctor
Vibrating Hammer
Oven Dry Vibrating Table
Saturated Vibrating Table
Minimum Unit Weight
ZAV for Gs = 2.65
Figure 2.11 Compaction Results for Masonry Sand
Even though Dune Sand and Masonry Sand had different mean particle sizes, the maximum dry unit weights obtained for these two soils were very similar between corresponding tests. For rounded, rather uniform sands, since only a limited amount of particle reorientation is possible during compaction, obtainable dry unit weights are more dependent on the specific gravity of the soil than on the particle size.
Figure 2.12 shows the vibrating hammer compaction test results for Play Sand. Although the dry unit weights obtained from this test were lower than those from vibrating hammer tests on Dune Sand and Masonry Sand, the trend of the compaction curves are nearly identical, and the particle size distribution for Play Sand falls between those for Dune Sand and Masonry Sand. Therefore, it was concluded that the compaction results from other tests would be proportionately similar, and further compaction tests were not performed on this soil.
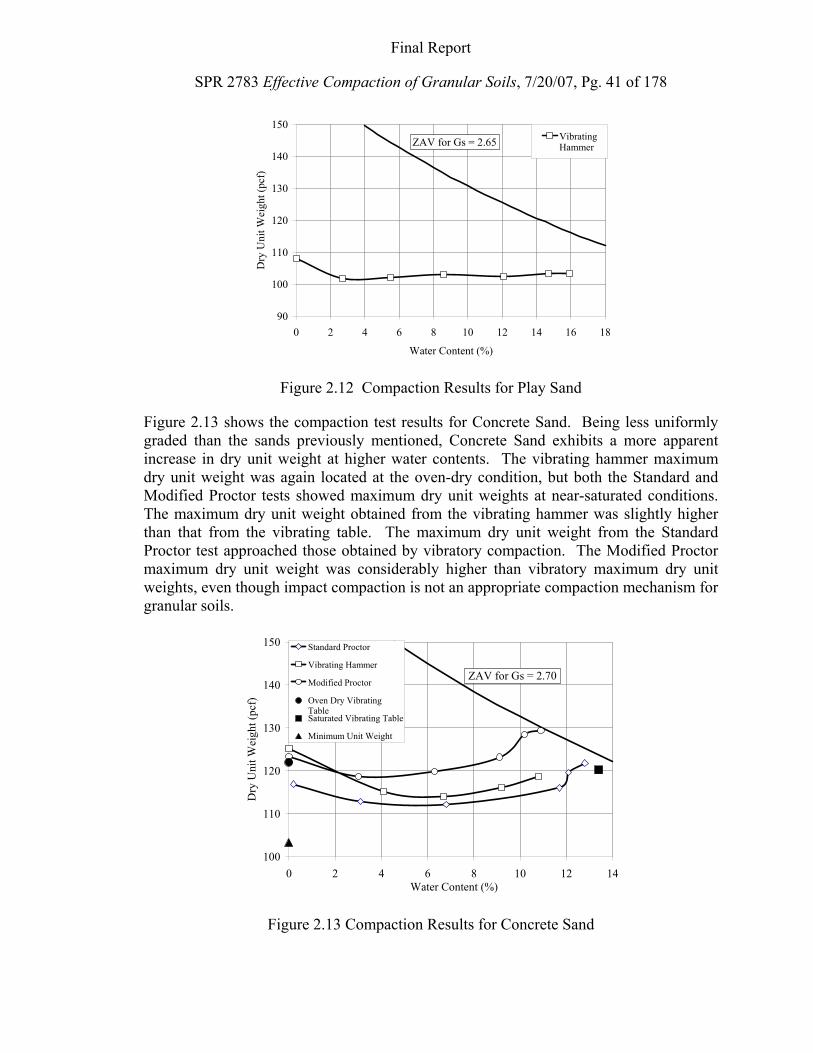
Final Report
SPR 2783 Effective Compaction of Granular Soils, 7/20/07, Pg. 41 of 178
90
100
110
120
130
140
150
0 2 4 6 8 10 12 14 16 18
Water Content (%)
Dry
Uni
t Wei
ght (
pcf)
VibratingHammerZAV for Gs = 2.65
Figure 2.12 Compaction Results for Play Sand
Figure 2.13 shows the compaction test results for Concrete Sand. Being less uniformly graded than the sands previously mentioned, Concrete Sand exhibits a more apparent increase in dry unit weight at higher water contents. The vibrating hammer maximum dry unit weight was again located at the oven-dry condition, but both the Standard and Modified Proctor tests showed maximum dry unit weights at near-saturated conditions. The maximum dry unit weight obtained from the vibrating hammer was slightly higher than that from the vibrating table. The maximum dry unit weight from the Standard Proctor test approached those obtained by vibratory compaction. The Modified Proctor maximum dry unit weight was considerably higher than vibratory maximum dry unit weights, even though impact compaction is not an appropriate compaction mechanism for granular soils.
100
110
120
130
140
150
0 2 4 6 8 10 12 14Water Content (%)
Dry
Uni
t Wei
ght (
pcf)
Standard Proctor
Vibrating Hammer
Modified Proctor
Oven Dry VibratingTableSaturated Vibrating Table
Minimum Unit Weight
ZAV for Gs = 2.70
Figure 2.13 Compaction Results for Concrete Sand
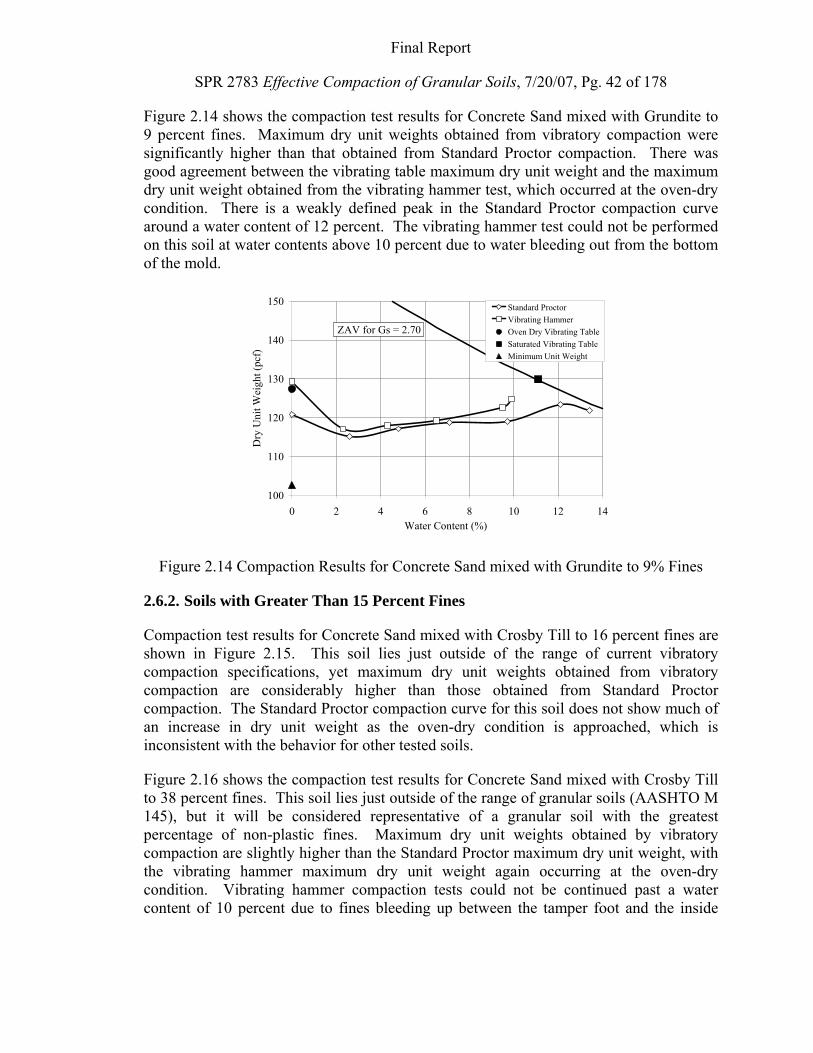
Final Report
SPR 2783 Effective Compaction of Granular Soils, 7/20/07, Pg. 42 of 178
Figure 2.14 shows the compaction test results for Concrete Sand mixed with Grundite to 9 percent fines. Maximum dry unit weights obtained from vibratory compaction were significantly higher than that obtained from Standard Proctor compaction. There was good agreement between the vibrating table maximum dry unit weight and the maximum dry unit weight obtained from the vibrating hammer test, which occurred at the oven-dry condition. There is a weakly defined peak in the Standard Proctor compaction curve around a water content of 12 percent. The vibrating hammer test could not be performed on this soil at water contents above 10 percent due to water bleeding out from the bottom of the mold.
100
110
120
130
140
150
0 2 4 6 8 10 12 14Water Content (%)
Dry
Uni
t Wei
ght (
pcf)
Standard ProctorVibrating HammerOven Dry Vibrating TableSaturated Vibrating TableMinimum Unit Weight
ZAV for Gs = 2.70
Figure 2.14 Compaction Results for Concrete Sand mixed with Grundite to 9% Fines
2.6.2. Soils with Greater Than 15 Percent Fines
Compaction test results for Concrete Sand mixed with Crosby Till to 16 percent fines are shown in Figure 2.15. This soil lies just outside of the range of current vibratory compaction specifications, yet maximum dry unit weights obtained from vibratory compaction are considerably higher than those obtained from Standard Proctor compaction. The Standard Proctor compaction curve for this soil does not show much of an increase in dry unit weight as the oven-dry condition is approached, which is inconsistent with the behavior for other tested soils.
Figure 2.16 shows the compaction test results for Concrete Sand mixed with Crosby Till to 38 percent fines. This soil lies just outside of the range of granular soils (AASHTO M 145), but it will be considered representative of a granular soil with the greatest percentage of non-plastic fines. Maximum dry unit weights obtained by vibratory compaction are slightly higher than the Standard Proctor maximum dry unit weight, with the vibrating hammer maximum dry unit weight again occurring at the oven-dry condition. Vibrating hammer compaction tests could not be continued past a water content of 10 percent due to fines bleeding up between the tamper foot and the inside
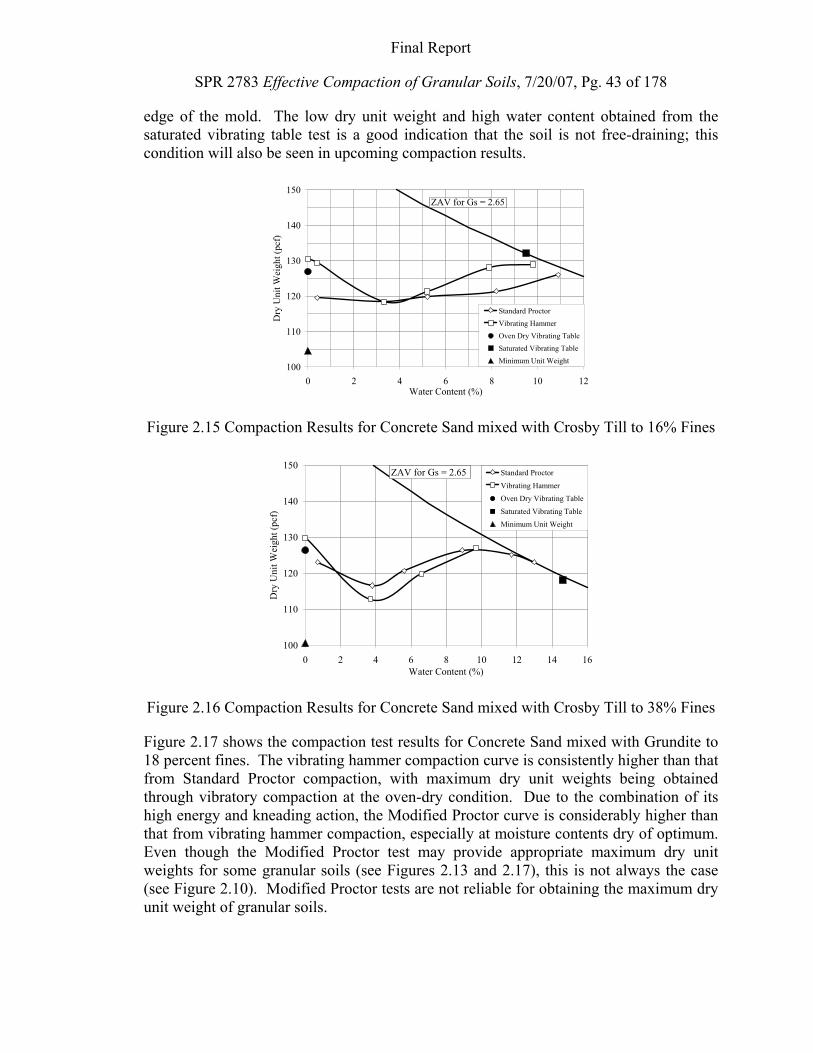
Final Report
SPR 2783 Effective Compaction of Granular Soils, 7/20/07, Pg. 43 of 178
edge of the mold. The low dry unit weight and high water content obtained from the saturated vibrating table test is a good indication that the soil is not free-draining; this condition will also be seen in upcoming compaction results.
100
110
120
130
140
150
0 2 4 6 8 10 12Water Content (%)
Dry
Uni
t Wei
ght (
pcf)
Standard ProctorVibrating HammerOven Dry Vibrating TableSaturated Vibrating TableMinimum Unit Weight
ZAV for Gs = 2.65
Figure 2.15 Compaction Results for Concrete Sand mixed with Crosby Till to 16% Fines
100
110
120
130
140
150
0 2 4 6 8 10 12 14 16Water Content (%)
Dry
Uni
t Wei
ght (
pcf)
Standard Proctor
Vibrating HammerOven Dry Vibrating Table
Saturated Vibrating TableMinimum Unit Weight
ZAV for Gs = 2.65
Figure 2.16 Compaction Results for Concrete Sand mixed with Crosby Till to 38% Fines
Figure 2.17 shows the compaction test results for Concrete Sand mixed with Grundite to 18 percent fines. The vibrating hammer compaction curve is consistently higher than that from Standard Proctor compaction, with maximum dry unit weights being obtained through vibratory compaction at the oven-dry condition. Due to the combination of its high energy and kneading action, the Modified Proctor curve is considerably higher than that from vibrating hammer compaction, especially at moisture contents dry of optimum. Even though the Modified Proctor test may provide appropriate maximum dry unit weights for some granular soils (see Figures 2.13 and 2.17), this is not always the case (see Figure 2.10). Modified Proctor tests are not reliable for obtaining the maximum dry unit weight of granular soils.
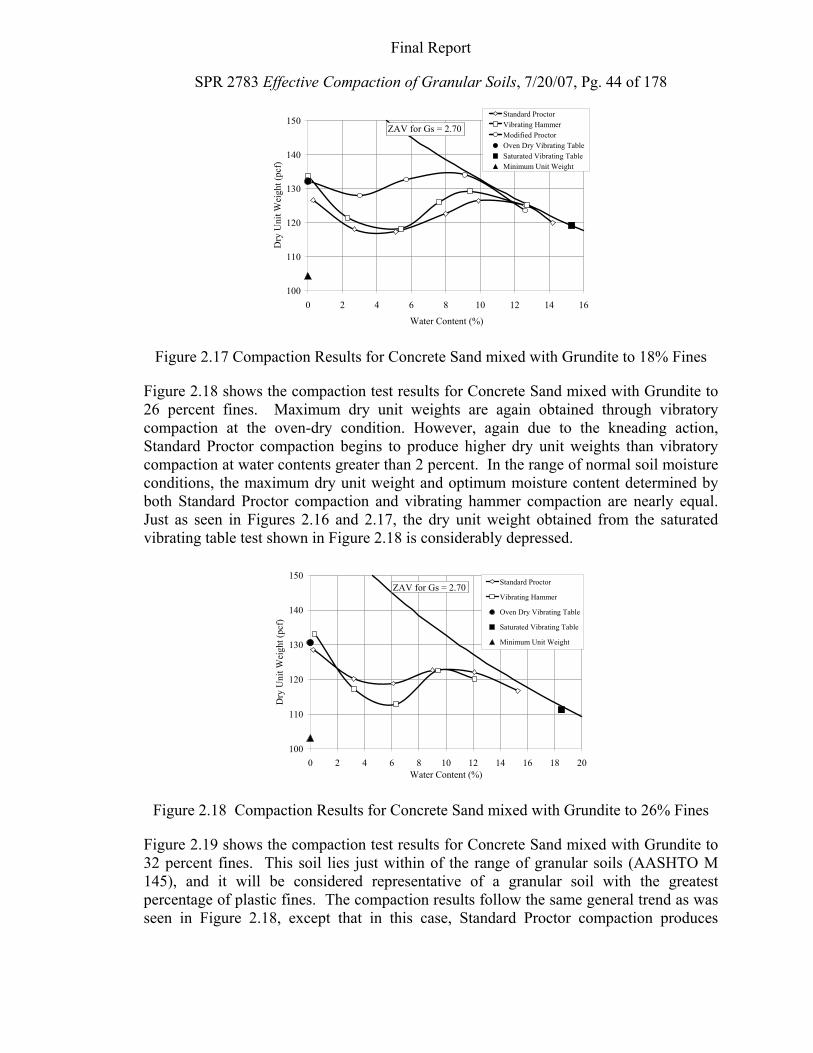
Final Report
SPR 2783 Effective Compaction of Granular Soils, 7/20/07, Pg. 44 of 178
100
110
120
130
140
150
0 2 4 6 8 10 12 14 16
Water Content (%)
Dry
Uni
t Wei
ght (
pcf)
Standard ProctorVibrating HammerModified ProctorOven Dry Vibrating TableSaturated Vibrating TableMinimum Unit Weight
ZAV for Gs = 2.70
Figure 2.17 Compaction Results for Concrete Sand mixed with Grundite to 18% Fines
Figure 2.18 shows the compaction test results for Concrete Sand mixed with Grundite to 26 percent fines. Maximum dry unit weights are again obtained through vibratory compaction at the oven-dry condition. However, again due to the kneading action, Standard Proctor compaction begins to produce higher dry unit weights than vibratory compaction at water contents greater than 2 percent. In the range of normal soil moisture conditions, the maximum dry unit weight and optimum moisture content determined by both Standard Proctor compaction and vibrating hammer compaction are nearly equal. Just as seen in Figures 2.16 and 2.17, the dry unit weight obtained from the saturated vibrating table test shown in Figure 2.18 is considerably depressed.
100
110
120
130
140
150
0 2 4 6 8 10 12 14 16 18 20Water Content (%)
Dry
Uni
t Wei
ght (
pcf)
Standard Proctor
Vibrating Hammer
Oven Dry Vibrating Table
Saturated Vibrating Table
Minimum Unit Weight
ZAV for Gs = 2.70
Figure 2.18 Compaction Results for Concrete Sand mixed with Grundite to 26% Fines
Figure 2.19 shows the compaction test results for Concrete Sand mixed with Grundite to 32 percent fines. This soil lies just within of the range of granular soils (AASHTO M 145), and it will be considered representative of a granular soil with the greatest percentage of plastic fines. The compaction results follow the same general trend as was seen in Figure 2.18, except that in this case, Standard Proctor compaction produces
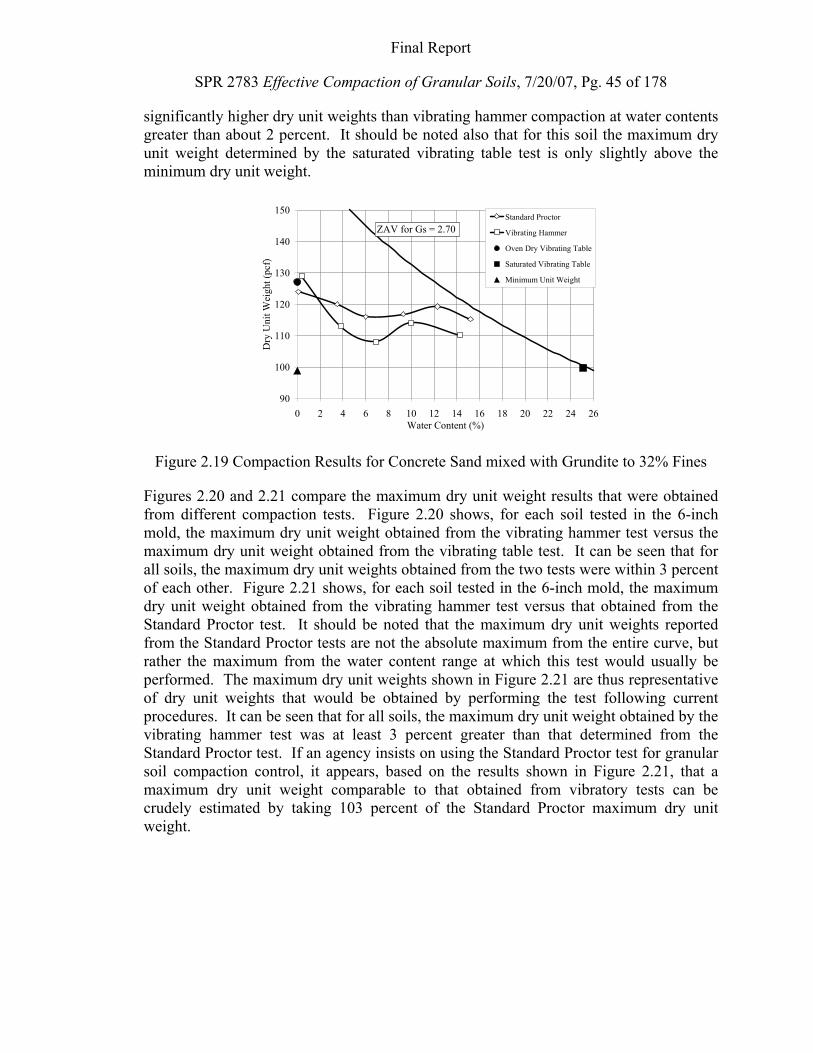
Final Report
SPR 2783 Effective Compaction of Granular Soils, 7/20/07, Pg. 45 of 178
significantly higher dry unit weights than vibrating hammer compaction at water contents greater than about 2 percent. It should be noted also that for this soil the maximum dry unit weight determined by the saturated vibrating table test is only slightly above the minimum dry unit weight.
90
100
110
120
130
140
150
0 2 4 6 8 10 12 14 16 18 20 22 24 26Water Content (%)
Dry
Uni
t Wei
ght (
pcf)
Standard Proctor
Vibrating Hammer
Oven Dry Vibrating Table
Saturated Vibrating Table
Minimum Unit Weight
ZAV for Gs = 2.70
Figure 2.19 Compaction Results for Concrete Sand mixed with Grundite to 32% Fines
Figures 2.20 and 2.21 compare the maximum dry unit weight results that were obtained from different compaction tests. Figure 2.20 shows, for each soil tested in the 6-inch mold, the maximum dry unit weight obtained from the vibrating hammer test versus the maximum dry unit weight obtained from the vibrating table test. It can be seen that for all soils, the maximum dry unit weights obtained from the two tests were within 3 percent of each other. Figure 2.21 shows, for each soil tested in the 6-inch mold, the maximum dry unit weight obtained from the vibrating hammer test versus that obtained from the Standard Proctor test. It should be noted that the maximum dry unit weights reported from the Standard Proctor tests are not the absolute maximum from the entire curve, but rather the maximum from the water content range at which this test would usually be performed. The maximum dry unit weights shown in Figure 2.21 are thus representative of dry unit weights that would be obtained by performing the test following current procedures. It can be seen that for all soils, the maximum dry unit weight obtained by the vibrating hammer test was at least 3 percent greater than that determined from the Standard Proctor test. If an agency insists on using the Standard Proctor test for granular soil compaction control, it appears, based on the results shown in Figure 2.21, that a maximum dry unit weight comparable to that obtained from vibratory tests can be crudely estimated by taking 103 percent of the Standard Proctor maximum dry unit weight.
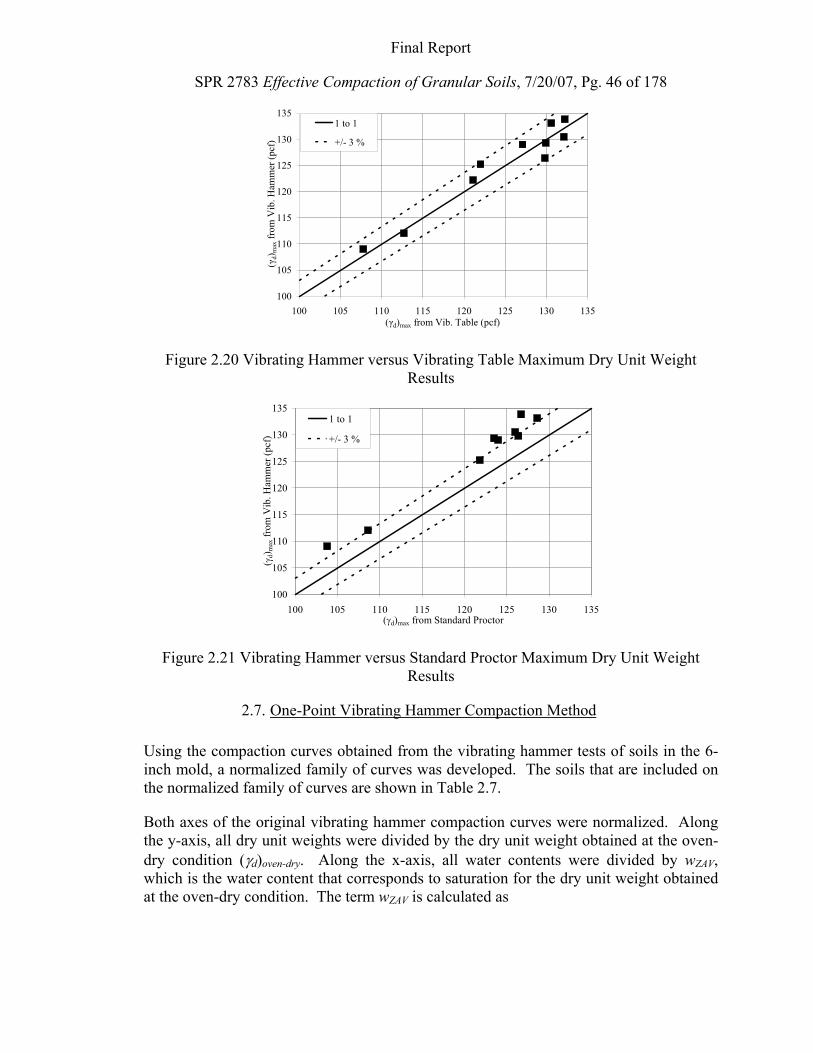
Final Report
SPR 2783 Effective Compaction of Granular Soils, 7/20/07, Pg. 46 of 178
100
105
110
115
120
125
130
135
100 105 110 115 120 125 130 135(γd)max from Vib. Table (pcf)
(γd)
max
from
Vib
. Ham
mer
(pcf
)
1 to 1
+/- 3 %
Figure 2.20 Vibrating Hammer versus Vibrating Table Maximum Dry Unit Weight Results
100
105
110
115
120
125
130
135
100 105 110 115 120 125 130 135(γd)max from Standard Proctor
( γd)
max
from
Vib
. Ham
mer
(pcf
)
1 to 1
+/- 3 %
Figure 2.21 Vibrating Hammer versus Standard Proctor Maximum Dry Unit Weight Results
2.7. One-Point Vibrating Hammer Compaction Method
Using the compaction curves obtained from the vibrating hammer tests of soils in the 6-inch mold, a normalized family of curves was developed. The soils that are included on the normalized family of curves are shown in Table 2.7.
Both axes of the original vibrating hammer compaction curves were normalized. Along the y-axis, all dry unit weights were divided by the dry unit weight obtained at the oven-dry condition (γd)oven-dry. Along the x-axis, all water contents were divided by wZAV, which is the water content that corresponds to saturation for the dry unit weight obtained at the oven-dry condition. The term wZAV is calculated as
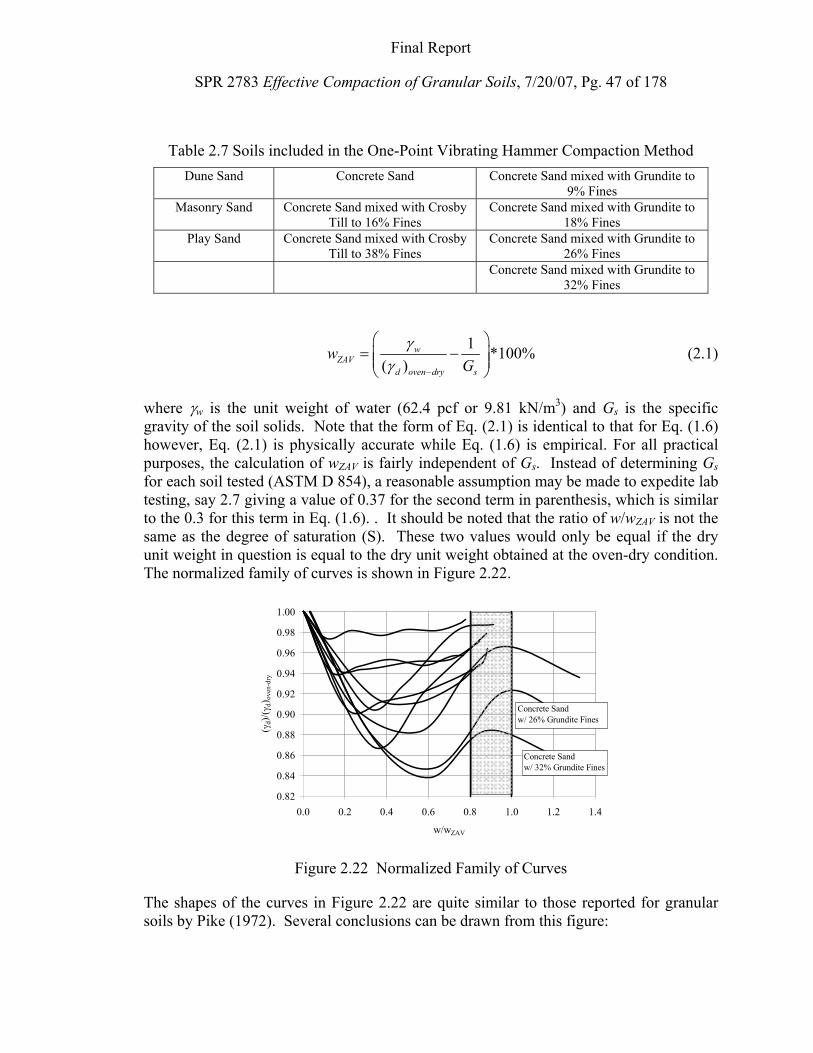
Final Report
SPR 2783 Effective Compaction of Granular Soils, 7/20/07, Pg. 47 of 178
Table 2.7 Soils included in the One-Point Vibrating Hammer Compaction Method Dune Sand Concrete Sand Concrete Sand mixed with Grundite to
9% Fines Masonry Sand Concrete Sand mixed with Crosby
Till to 16% Fines Concrete Sand mixed with Grundite to
18% Fines Play Sand Concrete Sand mixed with Crosby
Till to 38% Fines Concrete Sand mixed with Grundite to
26% Fines Concrete Sand mixed with Grundite to
32% Fines
1 *100%( )
wZAV
d oven dry s
wG
γγ −
⎛ ⎞= −⎜ ⎟⎜ ⎟⎝ ⎠
(2.1)
where γw is the unit weight of water (62.4 pcf or 9.81 kN/m3) and Gs is the specific gravity of the soil solids. Note that the form of Eq. (2.1) is identical to that for Eq. (1.6) however, Eq. (2.1) is physically accurate while Eq. (1.6) is empirical. For all practical purposes, the calculation of wZAV is fairly independent of Gs. Instead of determining Gs for each soil tested (ASTM D 854), a reasonable assumption may be made to expedite lab testing, say 2.7 giving a value of 0.37 for the second term in parenthesis, which is similar to the 0.3 for this term in Eq. (1.6). . It should be noted that the ratio of w/wZAV is not the same as the degree of saturation (S). These two values would only be equal if the dry unit weight in question is equal to the dry unit weight obtained at the oven-dry condition. The normalized family of curves is shown in Figure 2.22.
0.82
0.84
0.86
0.88
0.90
0.92
0.94
0.96
0.98
1.00
0.0 0.2 0.4 0.6 0.8 1.0 1.2 1.4
w/wZAV
( γd)
/( γd)
oven
-dry
Concrete Sand w/ 26% Grundite Fines
Concrete Sand w/ 32% Grundite Fines
Figure 2.22 Normalized Family of Curves
The shapes of the curves in Figure 2.22 are quite similar to those reported for granular soils by Pike (1972). Several conclusions can be drawn from this figure:
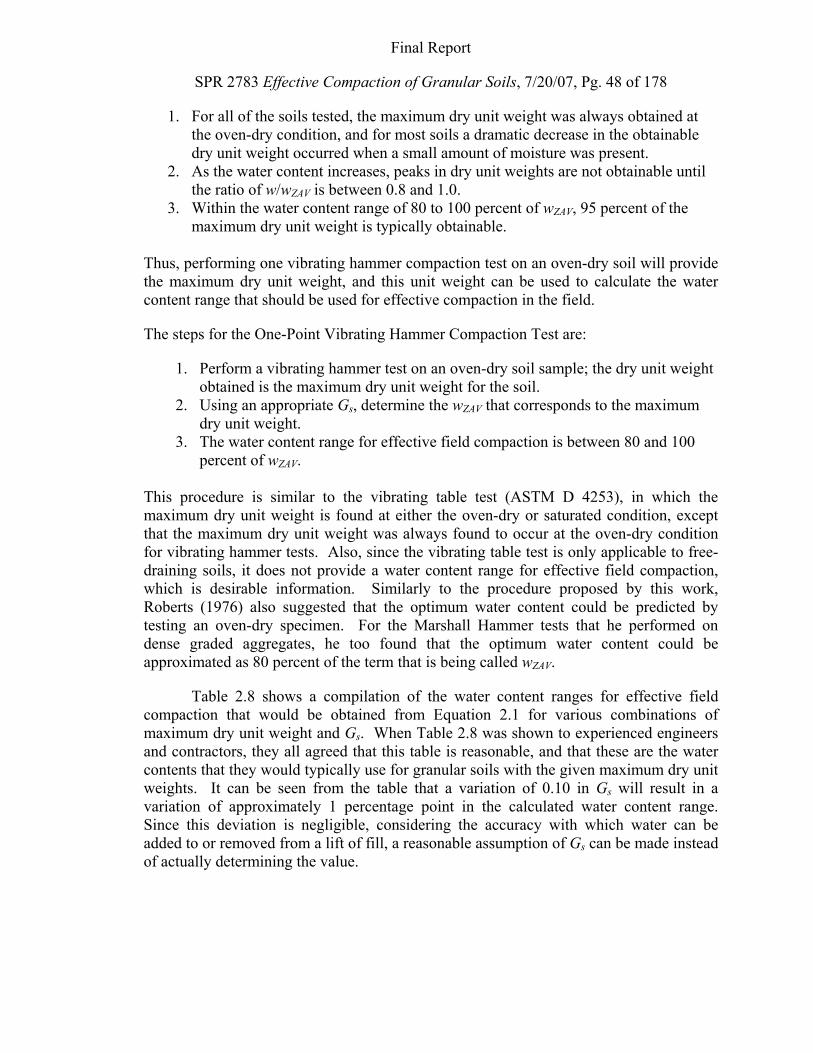
Final Report
SPR 2783 Effective Compaction of Granular Soils, 7/20/07, Pg. 48 of 178
1. For all of the soils tested, the maximum dry unit weight was always obtained at the oven-dry condition, and for most soils a dramatic decrease in the obtainable dry unit weight occurred when a small amount of moisture was present.
2. As the water content increases, peaks in dry unit weights are not obtainable until the ratio of w/wZAV is between 0.8 and 1.0.
3. Within the water content range of 80 to 100 percent of wZAV, 95 percent of the maximum dry unit weight is typically obtainable.
Thus, performing one vibrating hammer compaction test on an oven-dry soil will provide the maximum dry unit weight, and this unit weight can be used to calculate the water content range that should be used for effective compaction in the field.
The steps for the One-Point Vibrating Hammer Compaction Test are:
1. Perform a vibrating hammer test on an oven-dry soil sample; the dry unit weight obtained is the maximum dry unit weight for the soil.
2. Using an appropriate Gs, determine the wZAV that corresponds to the maximum dry unit weight.
3. The water content range for effective field compaction is between 80 and 100 percent of wZAV.
This procedure is similar to the vibrating table test (ASTM D 4253), in which the maximum dry unit weight is found at either the oven-dry or saturated condition, except that the maximum dry unit weight was always found to occur at the oven-dry condition for vibrating hammer tests. Also, since the vibrating table test is only applicable to free-draining soils, it does not provide a water content range for effective field compaction, which is desirable information. Similarly to the procedure proposed by this work, Roberts (1976) also suggested that the optimum water content could be predicted by testing an oven-dry specimen. For the Marshall Hammer tests that he performed on dense graded aggregates, he too found that the optimum water content could be approximated as 80 percent of the term that is being called wZAV.
Table 2.8 shows a compilation of the water content ranges for effective field compaction that would be obtained from Equation 2.1 for various combinations of maximum dry unit weight and Gs. When Table 2.8 was shown to experienced engineers and contractors, they all agreed that this table is reasonable, and that these are the water contents that they would typically use for granular soils with the given maximum dry unit weights. It can be seen from the table that a variation of 0.10 in Gs will result in a variation of approximately 1 percentage point in the calculated water content range. Since this deviation is negligible, considering the accuracy with which water can be added to or removed from a lift of fill, a reasonable assumption of Gs can be made instead of actually determining the value.
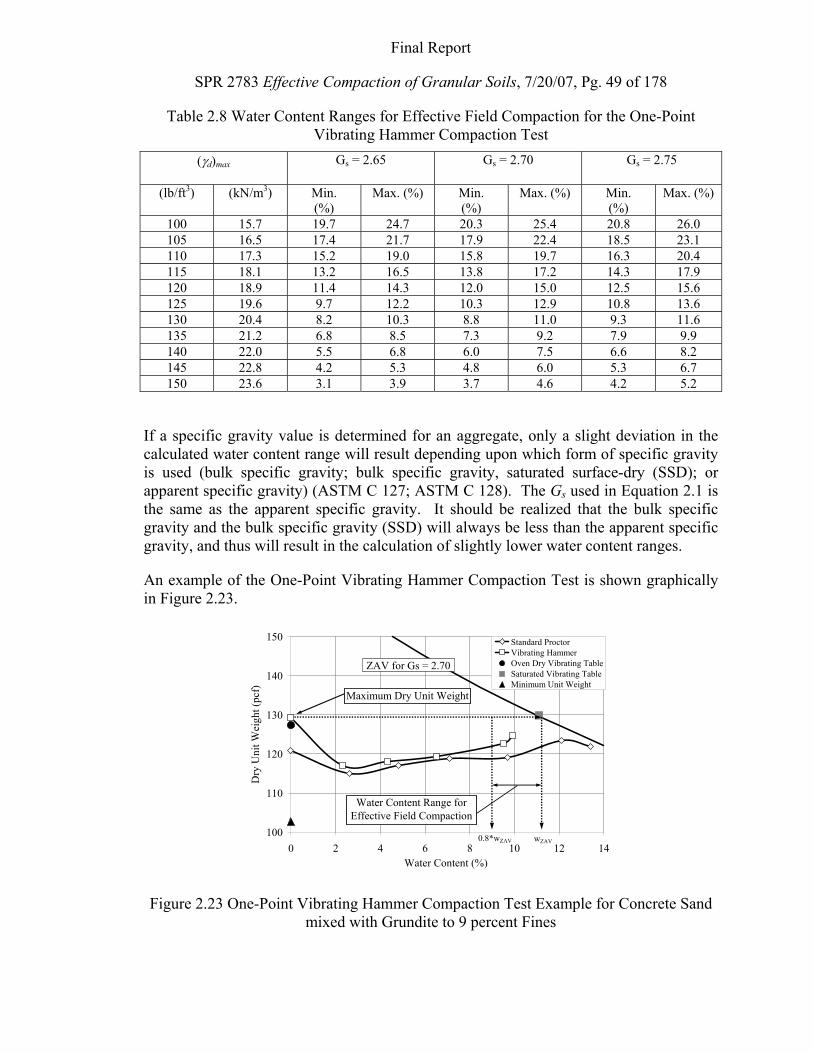
Final Report
SPR 2783 Effective Compaction of Granular Soils, 7/20/07, Pg. 49 of 178
Table 2.8 Water Content Ranges for Effective Field Compaction for the One-Point Vibrating Hammer Compaction Test
(γd)max Gs = 2.65 Gs = 2.70 Gs = 2.75
(lb/ft3) (kN/m3) Min. (%)
Max. (%) Min. (%)
Max. (%) Min. (%)
Max. (%)
100 15.7 19.7 24.7 20.3 25.4 20.8 26.0 105 16.5 17.4 21.7 17.9 22.4 18.5 23.1 110 17.3 15.2 19.0 15.8 19.7 16.3 20.4 115 18.1 13.2 16.5 13.8 17.2 14.3 17.9 120 18.9 11.4 14.3 12.0 15.0 12.5 15.6 125 19.6 9.7 12.2 10.3 12.9 10.8 13.6 130 20.4 8.2 10.3 8.8 11.0 9.3 11.6 135 21.2 6.8 8.5 7.3 9.2 7.9 9.9 140 22.0 5.5 6.8 6.0 7.5 6.6 8.2 145 22.8 4.2 5.3 4.8 6.0 5.3 6.7 150 23.6 3.1 3.9 3.7 4.6 4.2 5.2
If a specific gravity value is determined for an aggregate, only a slight deviation in the calculated water content range will result depending upon which form of specific gravity is used (bulk specific gravity; bulk specific gravity, saturated surface-dry (SSD); or apparent specific gravity) (ASTM C 127; ASTM C 128). The Gs used in Equation 2.1 is the same as the apparent specific gravity. It should be realized that the bulk specific gravity and the bulk specific gravity (SSD) will always be less than the apparent specific gravity, and thus will result in the calculation of slightly lower water content ranges.
An example of the One-Point Vibrating Hammer Compaction Test is shown graphically in Figure 2.23.
100
110
120
130
140
150
0 2 4 6 8 10 12 14Water Content (%)
Dry
Uni
t Wei
ght (
pcf)
Standard ProctorVibrating HammerOven Dry Vibrating TableSaturated Vibrating TableMinimum Unit Weight
ZAV for Gs = 2.70
Maximum Dry Unit Weight
Water Content Range for Effective Field Compaction
wZAV0.8*wZAV
Figure 2.23 One-Point Vibrating Hammer Compaction Test Example for Concrete Sand mixed with Grundite to 9 percent Fines
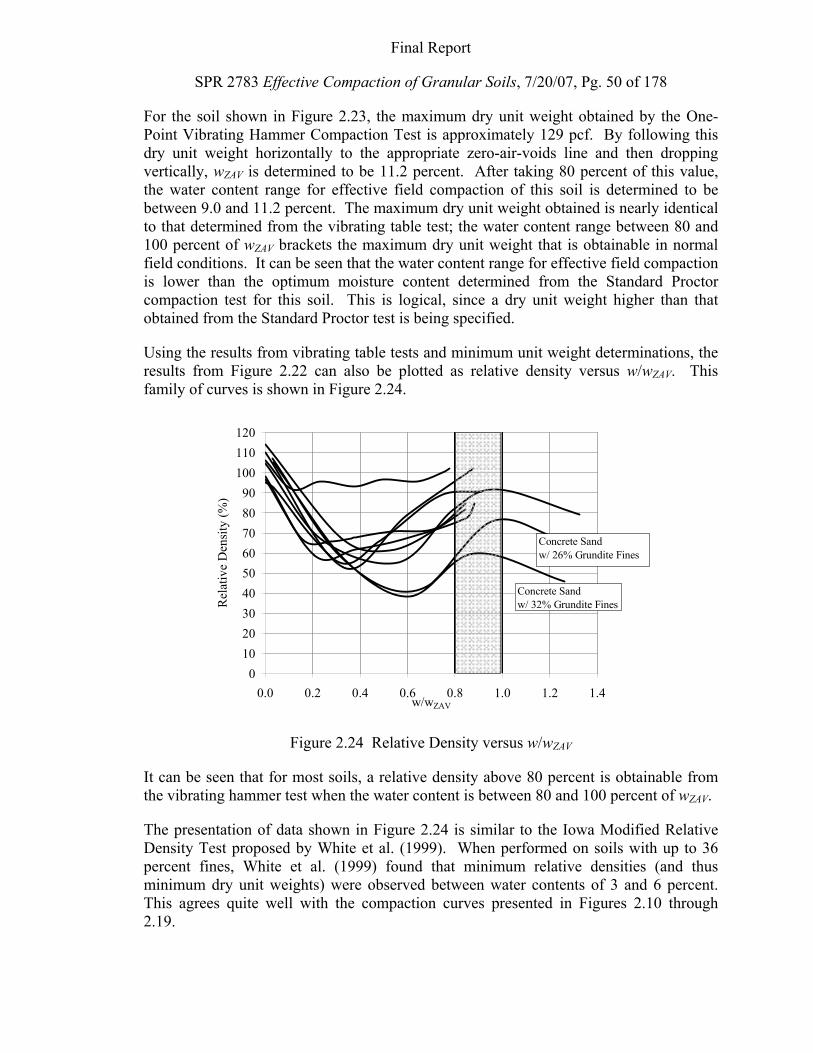
Final Report
SPR 2783 Effective Compaction of Granular Soils, 7/20/07, Pg. 50 of 178
For the soil shown in Figure 2.23, the maximum dry unit weight obtained by the One-Point Vibrating Hammer Compaction Test is approximately 129 pcf. By following this dry unit weight horizontally to the appropriate zero-air-voids line and then dropping vertically, wZAV is determined to be 11.2 percent. After taking 80 percent of this value, the water content range for effective field compaction of this soil is determined to be between 9.0 and 11.2 percent. The maximum dry unit weight obtained is nearly identical to that determined from the vibrating table test; the water content range between 80 and 100 percent of wZAV brackets the maximum dry unit weight that is obtainable in normal field conditions. It can be seen that the water content range for effective field compaction is lower than the optimum moisture content determined from the Standard Proctor compaction test for this soil. This is logical, since a dry unit weight higher than that obtained from the Standard Proctor test is being specified.
Using the results from vibrating table tests and minimum unit weight determinations, the results from Figure 2.22 can also be plotted as relative density versus w/wZAV. This family of curves is shown in Figure 2.24.
0102030405060708090
100110120
0.0 0.2 0.4 0.6 0.8 1.0 1.2 1.4w/wZAV
Rel
ativ
e D
ensi
ty (%
)
Concrete Sand w/ 26% Grundite Fines
Concrete Sand w/ 32% Grundite Fines
Figure 2.24 Relative Density versus w/wZAV
It can be seen that for most soils, a relative density above 80 percent is obtainable from the vibrating hammer test when the water content is between 80 and 100 percent of wZAV.
The presentation of data shown in Figure 2.24 is similar to the Iowa Modified Relative Density Test proposed by White et al. (1999). When performed on soils with up to 36 percent fines, White et al. (1999) found that minimum relative densities (and thus minimum dry unit weights) were observed between water contents of 3 and 6 percent. This agrees quite well with the compaction curves presented in Figures 2.10 through 2.19.
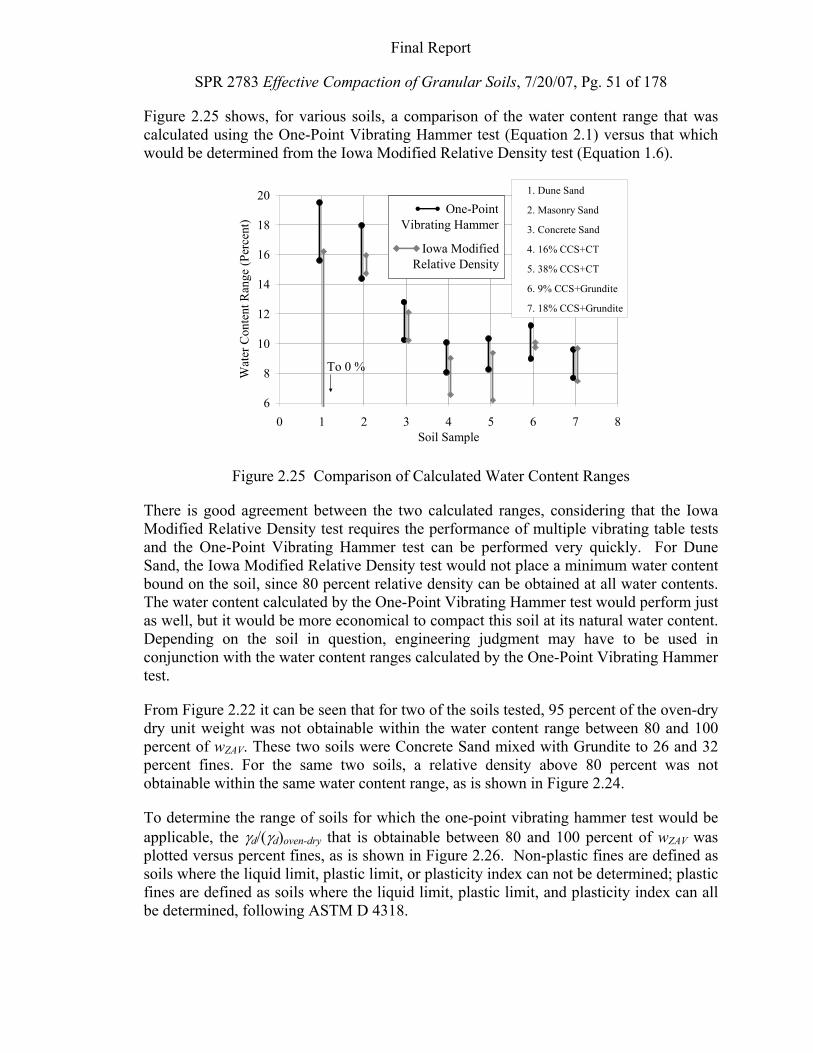
Final Report
SPR 2783 Effective Compaction of Granular Soils, 7/20/07, Pg. 51 of 178
Figure 2.25 shows, for various soils, a comparison of the water content range that was calculated using the One-Point Vibrating Hammer test (Equation 2.1) versus that which would be determined from the Iowa Modified Relative Density test (Equation 1.6).
6
8
10
12
14
16
18
20
0 1 2 3 4 5 6 7 8Soil Sample
Wat
er C
onte
nt R
ange
(Per
cent
)
1. Dune Sand
2. Masonry Sand
3. Concrete Sand
4. 16% CCS+CT
5. 38% CCS+CT
6. 9% CCS+Grundite
7. 18% CCS+Grundite
To 0 %
One-Point Vibrating Hammer
Iowa Modified Relative Density
Figure 2.25 Comparison of Calculated Water Content Ranges
There is good agreement between the two calculated ranges, considering that the Iowa Modified Relative Density test requires the performance of multiple vibrating table tests and the One-Point Vibrating Hammer test can be performed very quickly. For Dune Sand, the Iowa Modified Relative Density test would not place a minimum water content bound on the soil, since 80 percent relative density can be obtained at all water contents. The water content calculated by the One-Point Vibrating Hammer test would perform just as well, but it would be more economical to compact this soil at its natural water content. Depending on the soil in question, engineering judgment may have to be used in conjunction with the water content ranges calculated by the One-Point Vibrating Hammer test.
From Figure 2.22 it can be seen that for two of the soils tested, 95 percent of the oven-dry dry unit weight was not obtainable within the water content range between 80 and 100 percent of wZAV. These two soils were Concrete Sand mixed with Grundite to 26 and 32 percent fines. For the same two soils, a relative density above 80 percent was not obtainable within the same water content range, as is shown in Figure 2.24.
To determine the range of soils for which the one-point vibrating hammer test would be applicable, the γd/(γd)oven-dry that is obtainable between 80 and 100 percent of wZAV was plotted versus percent fines, as is shown in Figure 2.26. Non-plastic fines are defined as soils where the liquid limit, plastic limit, or plasticity index can not be determined; plastic fines are defined as soils where the liquid limit, plastic limit, and plasticity index can all be determined, following ASTM D 4318.
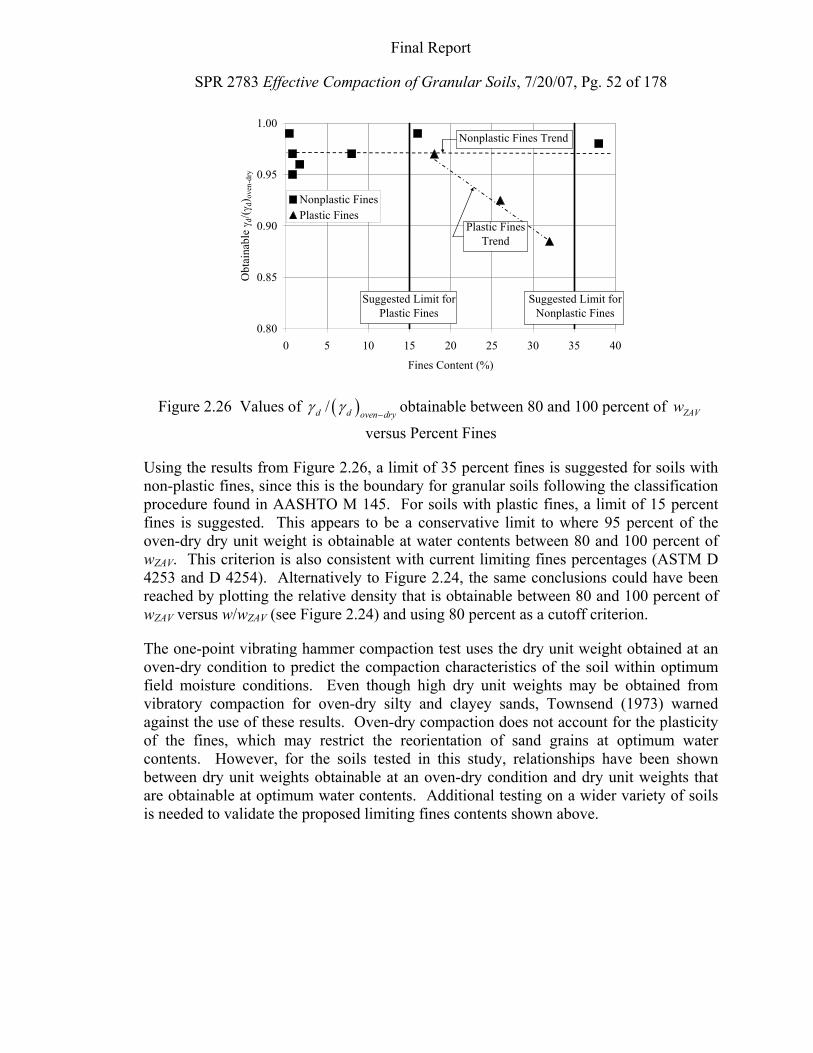
Final Report
SPR 2783 Effective Compaction of Granular Soils, 7/20/07, Pg. 52 of 178
0.80
0.85
0.90
0.95
1.00
0 5 10 15 20 25 30 35 40
Fines Content (%)
Obt
aina
ble γ d
/( γd)
oven
-dry
Nonplastic FinesPlastic Fines
Suggested Limit for Nonplastic Fines
Suggested Limit for Plastic Fines
Nonplastic Fines Trend
Plastic Fines Trend
Figure 2.26 Values of ( )/d d oven dryγ γ
−obtainable between 80 and 100 percent of ZAVw
versus Percent Fines
Using the results from Figure 2.26, a limit of 35 percent fines is suggested for soils with non-plastic fines, since this is the boundary for granular soils following the classification procedure found in AASHTO M 145. For soils with plastic fines, a limit of 15 percent fines is suggested. This appears to be a conservative limit to where 95 percent of the oven-dry dry unit weight is obtainable at water contents between 80 and 100 percent of wZAV. This criterion is also consistent with current limiting fines percentages (ASTM D 4253 and D 4254). Alternatively to Figure 2.24, the same conclusions could have been reached by plotting the relative density that is obtainable between 80 and 100 percent of wZAV versus w/wZAV (see Figure 2.24) and using 80 percent as a cutoff criterion.
The one-point vibrating hammer compaction test uses the dry unit weight obtained at an oven-dry condition to predict the compaction characteristics of the soil within optimum field moisture conditions. Even though high dry unit weights may be obtained from vibratory compaction for oven-dry silty and clayey sands, Townsend (1973) warned against the use of these results. Oven-dry compaction does not account for the plasticity of the fines, which may restrict the reorientation of sand grains at optimum water contents. However, for the soils tested in this study, relationships have been shown between dry unit weights obtainable at an oven-dry condition and dry unit weights that are obtainable at optimum water contents. Additional testing on a wider variety of soils is needed to validate the proposed limiting fines contents shown above.
Final Report
SPR 2783 Effective Compaction of Granular Soils, 7/20/07, Pg. 53 of 178
CHAPTER 3. COMPACTION AND THE VIBRATING HAMMER METHODFOR GRANULAR SOILS WITH OVERSIZED PARTICLES
3.1. Introduction
This chapter describes laboratory testing performed with the Vibrating Hammer for determining its applicability for use with granular soils containing oversize particles. It includes discussions of corrections for oversized particles and current INDOT practices, describes the materials tested, equipment used, and testing procedures, and provides compaction test results. Description and compaction results of materials tested that are not presented in this chapter are provided in Appendix B.
3.2. Correction for Oversize Particles
When using compaction tests, as discussed in Section 1.10, it is typically recommended that oversize particles be scalped from the sample when present. Scalping leads to a different soil matrix than that in the field.
Methods have been proposed to correct for the effect of scalping on achievable dry unit weights due to the difference in densities obtained from a non-scalped soil versus a scalped soil. ASTM D 4718 provides two procedures for the correction of dry unit weight and water content due to scalping of material. Corrections can be made from the finer fraction of the scalped soil to non-scalped values, as in going from laboratory values to field values. Or, the opposite can be performed in which non-scalped values are converted to the finer fraction of the scalped soil, as in going from field values to laboratory values. Since field compaction is done in mass quantities and the field represents the true matrix of the soil, the authors prefer to correct laboratory values (finer fraction) to equivalent values for the total soil (fine and oversize fractions). This is the correction method presented and used in this report. The corrected water content expressed as a percent is computed as (ASTM D 4718, Equation 4)
( )corrected F F C Cw w P w P= + (3.1)
where:
Fw = water content of finer fraction expressed as a decimal
Cw = water content of oversize fraction expressed as a decimal
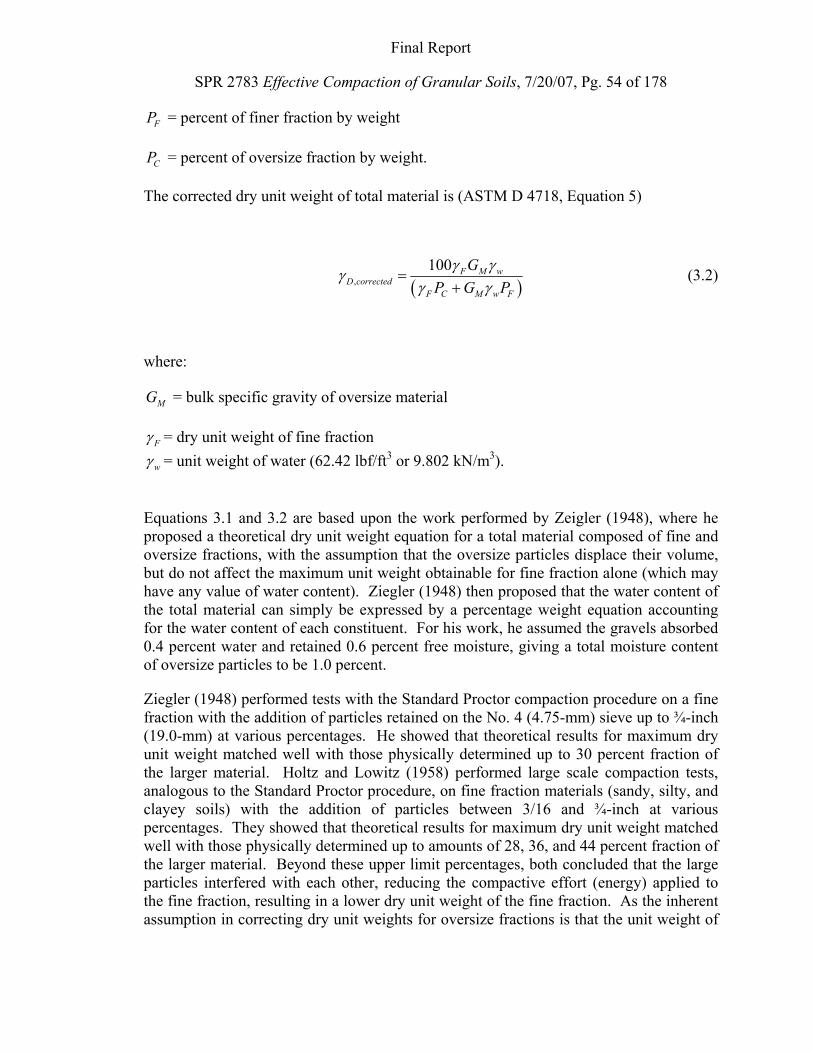
Final Report
SPR 2783 Effective Compaction of Granular Soils, 7/20/07, Pg. 54 of 178
FP = percent of finer fraction by weight
CP = percent of oversize fraction by weight.
The corrected dry unit weight of total material is (ASTM D 4718, Equation 5)
( ),
100 F M wD corrected
F C M w F
GP G Pγ γγ
γ γ=
+ (3.2)
where:
MG = bulk specific gravity of oversize material
Fγ = dry unit weight of fine fraction
wγ = unit weight of water (62.42 lbf/ft3 or 9.802 kN/m3).
Equations 3.1 and 3.2 are based upon the work performed by Zeigler (1948), where he proposed a theoretical dry unit weight equation for a total material composed of fine and oversize fractions, with the assumption that the oversize particles displace their volume, but do not affect the maximum unit weight obtainable for fine fraction alone (which may have any value of water content). Ziegler (1948) then proposed that the water content of the total material can simply be expressed by a percentage weight equation accounting for the water content of each constituent. For his work, he assumed the gravels absorbed 0.4 percent water and retained 0.6 percent free moisture, giving a total moisture content of oversize particles to be 1.0 percent.
Ziegler (1948) performed tests with the Standard Proctor compaction procedure on a fine fraction with the addition of particles retained on the No. 4 (4.75-mm) sieve up to ¾-inch (19.0-mm) at various percentages. He showed that theoretical results for maximum dry unit weight matched well with those physically determined up to 30 percent fraction of the larger material. Holtz and Lowitz (1958) performed large scale compaction tests, analogous to the Standard Proctor procedure, on fine fraction materials (sandy, silty, and clayey soils) with the addition of particles between 3/16 and ¾-inch at various percentages. They showed that theoretical results for maximum dry unit weight matched well with those physically determined up to amounts of 28, 36, and 44 percent fraction of the larger material. Beyond these upper limit percentages, both concluded that the large particles interfered with each other, reducing the compactive effort (energy) applied to the fine fraction, resulting in a lower dry unit weight of the fine fraction. As the inherent assumption in correcting dry unit weights for oversize fractions is that the unit weight of
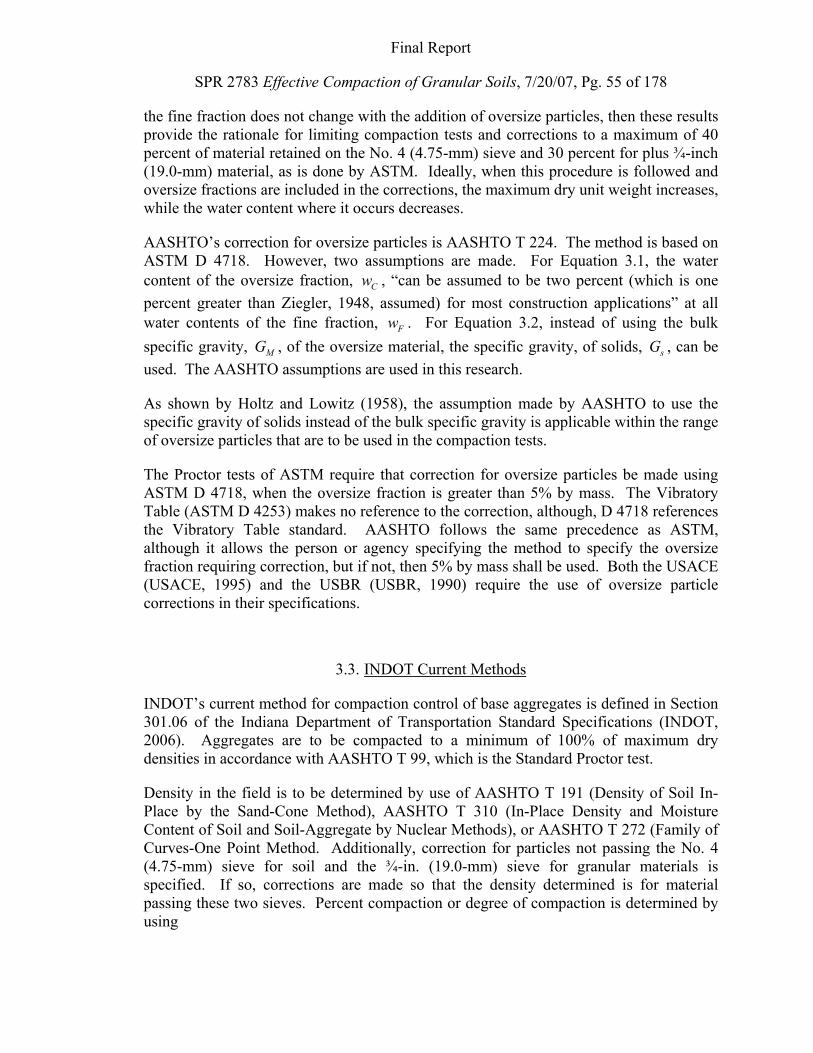
Final Report
SPR 2783 Effective Compaction of Granular Soils, 7/20/07, Pg. 55 of 178
the fine fraction does not change with the addition of oversize particles, then these results provide the rationale for limiting compaction tests and corrections to a maximum of 40 percent of material retained on the No. 4 (4.75-mm) sieve and 30 percent for plus ¾-inch (19.0-mm) material, as is done by ASTM. Ideally, when this procedure is followed and oversize fractions are included in the corrections, the maximum dry unit weight increases, while the water content where it occurs decreases.
AASHTO’s correction for oversize particles is AASHTO T 224. The method is based on ASTM D 4718. However, two assumptions are made. For Equation 3.1, the water content of the oversize fraction, Cw , “can be assumed to be two percent (which is one percent greater than Ziegler, 1948, assumed) for most construction applications” at all water contents of the fine fraction, Fw . For Equation 3.2, instead of using the bulk specific gravity, MG , of the oversize material, the specific gravity, of solids, sG , can be used. The AASHTO assumptions are used in this research.
As shown by Holtz and Lowitz (1958), the assumption made by AASHTO to use the specific gravity of solids instead of the bulk specific gravity is applicable within the range of oversize particles that are to be used in the compaction tests.
The Proctor tests of ASTM require that correction for oversize particles be made using ASTM D 4718, when the oversize fraction is greater than 5% by mass. The Vibratory Table (ASTM D 4253) makes no reference to the correction, although, D 4718 references the Vibratory Table standard. AASHTO follows the same precedence as ASTM, although it allows the person or agency specifying the method to specify the oversize fraction requiring correction, but if not, then 5% by mass shall be used. Both the USACE (USACE, 1995) and the USBR (USBR, 1990) require the use of oversize particle corrections in their specifications.
3.3. INDOT Current Methods
INDOT’s current method for compaction control of base aggregates is defined in Section 301.06 of the Indiana Department of Transportation Standard Specifications (INDOT, 2006). Aggregates are to be compacted to a minimum of 100% of maximum dry densities in accordance with AASHTO T 99, which is the Standard Proctor test.
Density in the field is to be determined by use of AASHTO T 191 (Density of Soil In-Place by the Sand-Cone Method), AASHTO T 310 (In-Place Density and Moisture Content of Soil and Soil-Aggregate by Nuclear Methods), or AASHTO T 272 (Family of Curves-One Point Method. Additionally, correction for particles not passing the No. 4 (4.75-mm) sieve for soil and the ¾-in. (19.0-mm) sieve for granular materials is specified. If so, corrections are made so that the density determined is for material passing these two sieves. Percent compaction or degree of compaction is determined by using
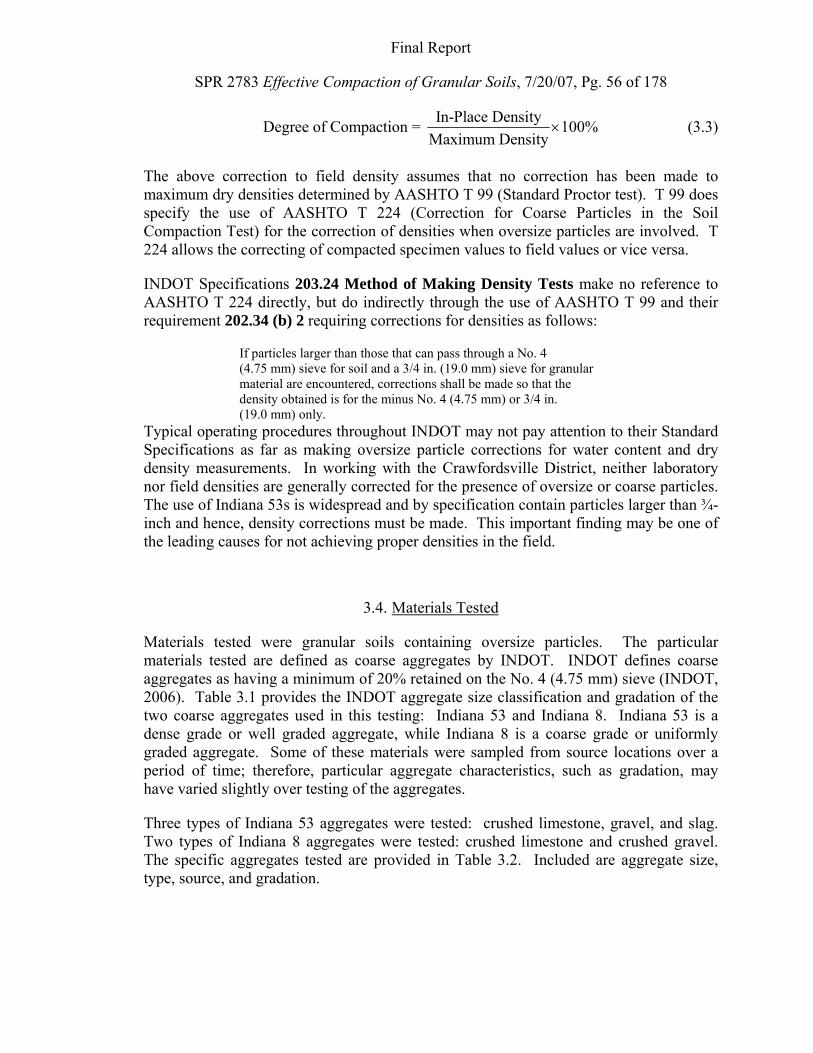
Final Report
SPR 2783 Effective Compaction of Granular Soils, 7/20/07, Pg. 56 of 178
In-Place DensityDegree of Compaction = 100%Maximum Density
× (3.3)
The above correction to field density assumes that no correction has been made to maximum dry densities determined by AASHTO T 99 (Standard Proctor test). T 99 does specify the use of AASHTO T 224 (Correction for Coarse Particles in the Soil Compaction Test) for the correction of densities when oversize particles are involved. T 224 allows the correcting of compacted specimen values to field values or vice versa.
INDOT Specifications 203.24 Method of Making Density Tests make no reference to AASHTO T 224 directly, but do indirectly through the use of AASHTO T 99 and their requirement 202.34 (b) 2 requiring corrections for densities as follows:
If particles larger than those that can pass through a No. 4 (4.75 mm) sieve for soil and a 3/4 in. (19.0 mm) sieve for granular material are encountered, corrections shall be made so that the density obtained is for the minus No. 4 (4.75 mm) or 3/4 in. (19.0 mm) only.
Typical operating procedures throughout INDOT may not pay attention to their Standard Specifications as far as making oversize particle corrections for water content and dry density measurements. In working with the Crawfordsville District, neither laboratory nor field densities are generally corrected for the presence of oversize or coarse particles. The use of Indiana 53s is widespread and by specification contain particles larger than ¾-inch and hence, density corrections must be made. This important finding may be one of the leading causes for not achieving proper densities in the field.
3.4. Materials Tested
Materials tested were granular soils containing oversize particles. The particular materials tested are defined as coarse aggregates by INDOT. INDOT defines coarse aggregates as having a minimum of 20% retained on the No. 4 (4.75 mm) sieve (INDOT, 2006). Table 3.1 provides the INDOT aggregate size classification and gradation of the two coarse aggregates used in this testing: Indiana 53 and Indiana 8. Indiana 53 is a dense grade or well graded aggregate, while Indiana 8 is a coarse grade or uniformly graded aggregate. Some of these materials were sampled from source locations over a period of time; therefore, particular aggregate characteristics, such as gradation, may have varied slightly over testing of the aggregates.
Three types of Indiana 53 aggregates were tested: crushed limestone, gravel, and slag. Two types of Indiana 8 aggregates were tested: crushed limestone and crushed gravel. The specific aggregates tested are provided in Table 3.2. Included are aggregate size, type, source, and gradation.
Final Report
SPR 2783 Effective Compaction of Granular Soils, 7/20/07, Pg. 57 of 178
Particle size distributions for the Indiana 53 aggregates are found in Figure 3.1. Figure 3.2 provides particle size distributions for the Indiana 8 aggregates. Index properties for the aggregates tested are provided in Table 3.3. Soil classifications based on the Unified Soil Classification System (ASTM D 2487), AASHTO M 145, and INDOT Standard Specification 903 are provided in Table 3.4.
Table 3.1 INDOT aggregate size classification and gradation (INDOT, 2006)
Sieve Size
COARSE AGGREGATE SIZES (PERCENT PASSING)
53 8 1 1/2 in. (37.5 mm) 100
1 in. (25 mm) 80-100 100 3/4 in. (19 mm) 70-90 75-95
1/2 in. (12.5 mm) 55-80 40-70 3/8 in. (9.5 mm) 20-50 No. 4 (4.75 mm) 35-60 0-15 No. 8 (2.36 mm) 25-50 0-10 No. 30 (600 μm) 12-30 No. 200 (75 μm) 5.0-10.0
Table 3.2 Materials tested; including source and gradation Aggregate
INDOT Size 53 53 53 8 8 Material Type Crushed
Limestone Gravel Slag Crushed
Limestone Crushed
(25%) Gravel Source Lincoln Park
Stone (Putnamville,
IN)
S and G Excavating
(Terre Haute, IN)
Beemsterboer (Gary, IN)
Vulcan Materials-
Monon Quarry (Monon, IN)
Vulcan Materials-
Swisher Sand and Gravel
(Lafayette, IN) Notation in this
document1 IN-53S-2180 IN-53G-2119 IN-53SLAG-B IN-08S-VM IN-08GAP-
SSG Sieve Size Percent passing
1 1/2 in. (37.5 mm)
100 100 100 - -
1 in. (25 mm) 91 95 100 100 3/4 in. (19 mm) 79 83 86 91 90
1/2 in. (12.5 mm) 63 71 48 51 3/8 in. (9.5 mm) - - - 26 31 No. 4 (4.75 mm) 43 53 51 7.1 2.0 No. 8 (2.36 mm) 32 45 38 2.9 0.9 No. 30 (600 μm) 16 26 19 - - No. 200 (75 μm) 8.7 7.8 6.0 - -
1IN signifies Indiana; middle portion signifies INDOT gradation and material type (S-crushed limestone, G-gravel, GAP-crushed gravel, SLAG-slag; final portion signifies source of aggregate.
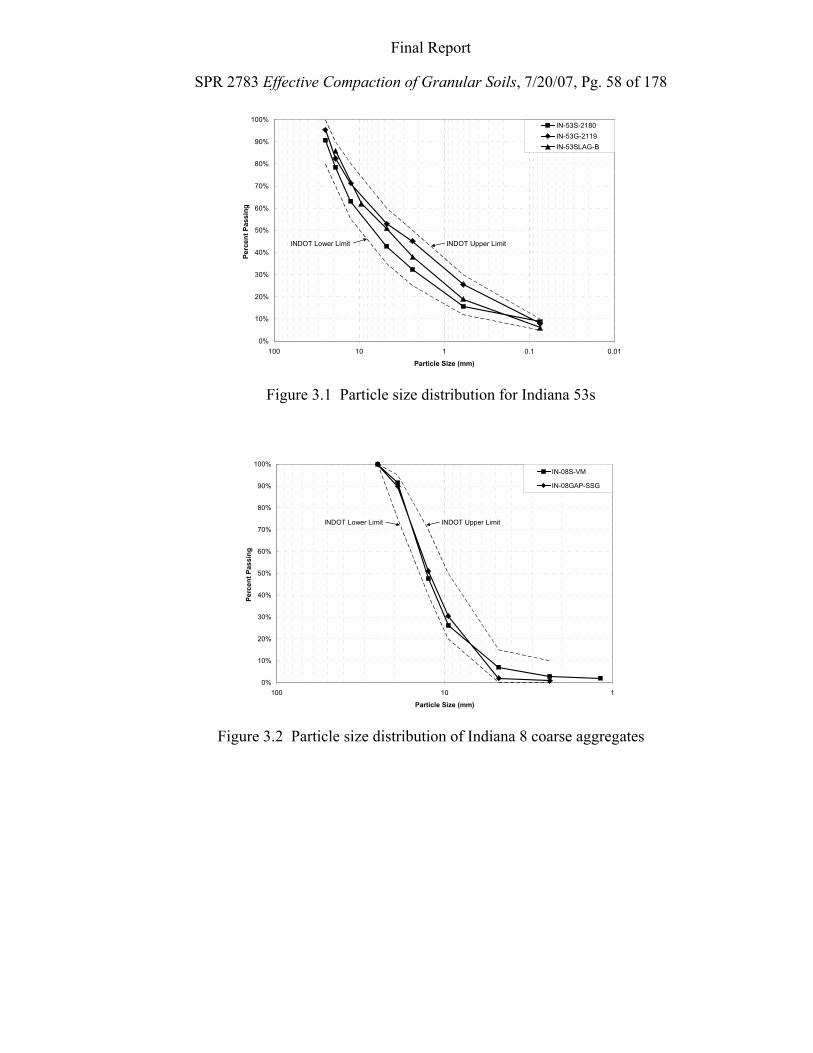
Final Report
SPR 2783 Effective Compaction of Granular Soils, 7/20/07, Pg. 58 of 178
0%
10%
20%
30%
40%
50%
60%
70%
80%
90%
100%
0.010.1110100
Particle Size (mm)
Perc
ent P
assi
ng
IN-53S-2180IN-53G-2119IN-53SLAG-B
INDOT Upper LimitINDOT Lower Limit
Figure 3.1 Particle size distribution for Indiana 53s
0%
10%
20%
30%
40%
50%
60%
70%
80%
90%
100%
110100
Particle Size (mm)
Perc
ent P
assi
ng
IN-08S-VM
IN-08GAP-SSG
INDOT Upper LimitINDOT Lower Limit
Figure 3.2 Particle size distribution of Indiana 8 coarse aggregates
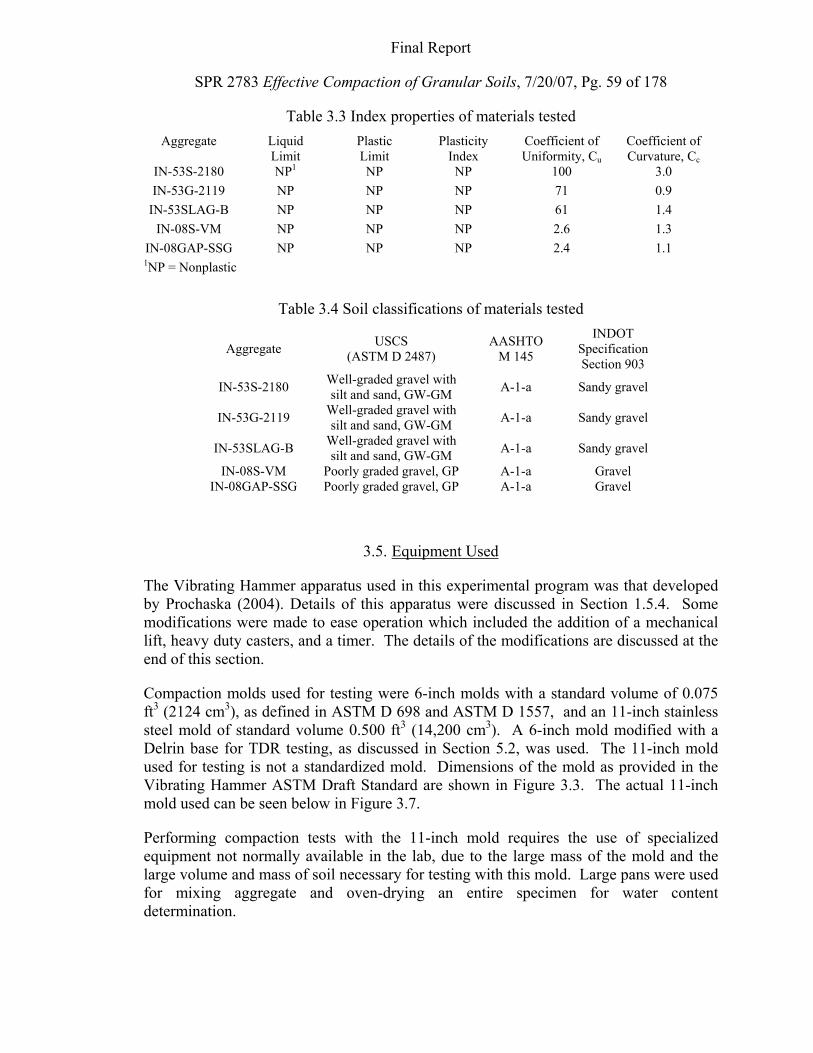
Final Report
SPR 2783 Effective Compaction of Granular Soils, 7/20/07, Pg. 59 of 178
Table 3.3 Index properties of materials tested Aggregate Liquid
Limit Plastic Limit
Plasticity Index
Coefficient of Uniformity, Cu
Coefficient of Curvature, Cc
IN-53S-2180 NP1 NP NP 100 3.0 IN-53G-2119 NP NP NP 71 0.9
IN-53SLAG-B NP NP NP 61 1.4 IN-08S-VM NP NP NP 2.6 1.3
IN-08GAP-SSG NP NP NP 2.4 1.1 1NP = Nonplastic
Table 3.4 Soil classifications of materials tested
Aggregate USCS (ASTM D 2487)
AASHTO M 145
INDOT Specification Section 903
IN-53S-2180 Well-graded gravel with silt and sand, GW-GM A-1-a Sandy gravel
IN-53G-2119 Well-graded gravel with silt and sand, GW-GM A-1-a Sandy gravel
IN-53SLAG-B Well-graded gravel with silt and sand, GW-GM A-1-a Sandy gravel
IN-08S-VM Poorly graded gravel, GP A-1-a Gravel IN-08GAP-SSG Poorly graded gravel, GP A-1-a Gravel
3.5. Equipment Used
The Vibrating Hammer apparatus used in this experimental program was that developed by Prochaska (2004). Details of this apparatus were discussed in Section 1.5.4. Some modifications were made to ease operation which included the addition of a mechanical lift, heavy duty casters, and a timer. The details of the modifications are discussed at the end of this section.
Compaction molds used for testing were 6-inch molds with a standard volume of 0.075 ft3 (2124 cm3), as defined in ASTM D 698 and ASTM D 1557, and an 11-inch stainless steel mold of standard volume 0.500 ft3 (14,200 cm3). A 6-inch mold modified with a Delrin base for TDR testing, as discussed in Section 5.2, was used. The 11-inch mold used for testing is not a standardized mold. Dimensions of the mold as provided in the Vibrating Hammer ASTM Draft Standard are shown in Figure 3.3. The actual 11-inch mold used can be seen below in Figure 3.7.
Performing compaction tests with the 11-inch mold requires the use of specialized equipment not normally available in the lab, due to the large mass of the mold and the large volume and mass of soil necessary for testing with this mold. Large pans were used for mixing aggregate and oven-drying an entire specimen for water content determination.
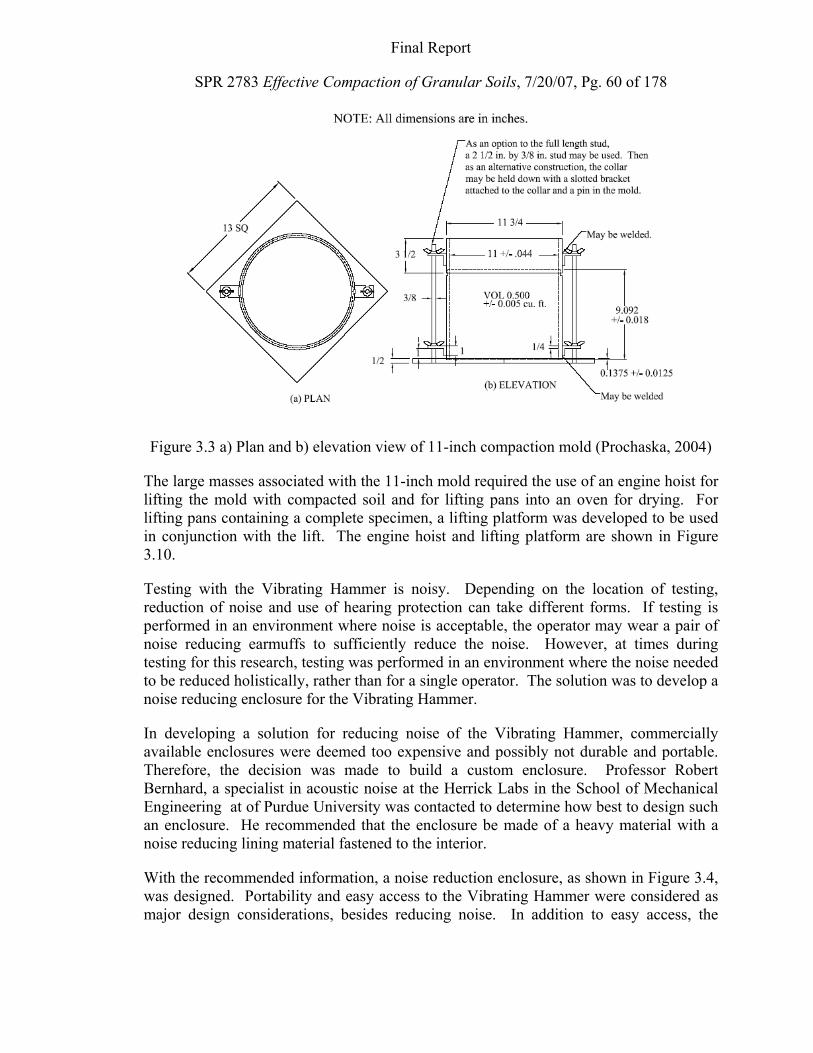
Final Report
SPR 2783 Effective Compaction of Granular Soils, 7/20/07, Pg. 60 of 178
Figure 3.3 a) Plan and b) elevation view of 11-inch compaction mold (Prochaska, 2004)
The large masses associated with the 11-inch mold required the use of an engine hoist for lifting the mold with compacted soil and for lifting pans into an oven for drying. For lifting pans containing a complete specimen, a lifting platform was developed to be used in conjunction with the lift. The engine hoist and lifting platform are shown in Figure 3.10.
Testing with the Vibrating Hammer is noisy. Depending on the location of testing, reduction of noise and use of hearing protection can take different forms. If testing is performed in an environment where noise is acceptable, the operator may wear a pair of noise reducing earmuffs to sufficiently reduce the noise. However, at times during testing for this research, testing was performed in an environment where the noise needed to be reduced holistically, rather than for a single operator. The solution was to develop a noise reducing enclosure for the Vibrating Hammer.
In developing a solution for reducing noise of the Vibrating Hammer, commercially available enclosures were deemed too expensive and possibly not durable and portable. Therefore, the decision was made to build a custom enclosure. Professor Robert Bernhard, a specialist in acoustic noise at the Herrick Labs in the School of Mechanical Engineering at of Purdue University was contacted to determine how best to design such an enclosure. He recommended that the enclosure be made of a heavy material with a noise reducing lining material fastened to the interior.
With the recommended information, a noise reduction enclosure, as shown in Figure 3.4, was designed. Portability and easy access to the Vibrating Hammer were considered as major design considerations, besides reducing noise. In addition to easy access, the
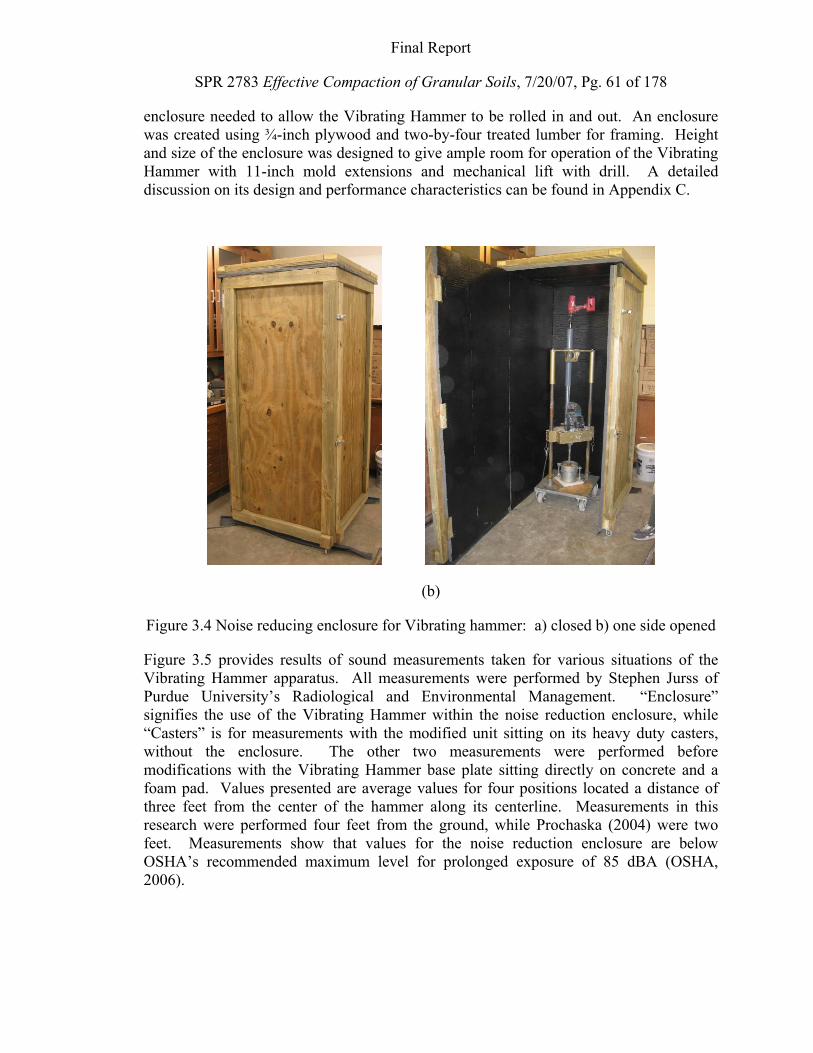
Final Report
SPR 2783 Effective Compaction of Granular Soils, 7/20/07, Pg. 61 of 178
enclosure needed to allow the Vibrating Hammer to be rolled in and out. An enclosure was created using ¾-inch plywood and two-by-four treated lumber for framing. Height and size of the enclosure was designed to give ample room for operation of the Vibrating Hammer with 11-inch mold extensions and mechanical lift with drill. A detailed discussion on its design and performance characteristics can be found in Appendix C.
(b)
Figure 3.4 Noise reducing enclosure for Vibrating hammer: a) closed b) one side opened
Figure 3.5 provides results of sound measurements taken for various situations of the Vibrating Hammer apparatus. All measurements were performed by Stephen Jurss of Purdue University’s Radiological and Environmental Management. “Enclosure” signifies the use of the Vibrating Hammer within the noise reduction enclosure, while “Casters” is for measurements with the modified unit sitting on its heavy duty casters, without the enclosure. The other two measurements were performed before modifications with the Vibrating Hammer base plate sitting directly on concrete and a foam pad. Values presented are average values for four positions located a distance of three feet from the center of the hammer along its centerline. Measurements in this research were performed four feet from the ground, while Prochaska (2004) were two feet. Measurements show that values for the noise reduction enclosure are below OSHA’s recommended maximum level for prolonged exposure of 85 dBA (OSHA, 2006).
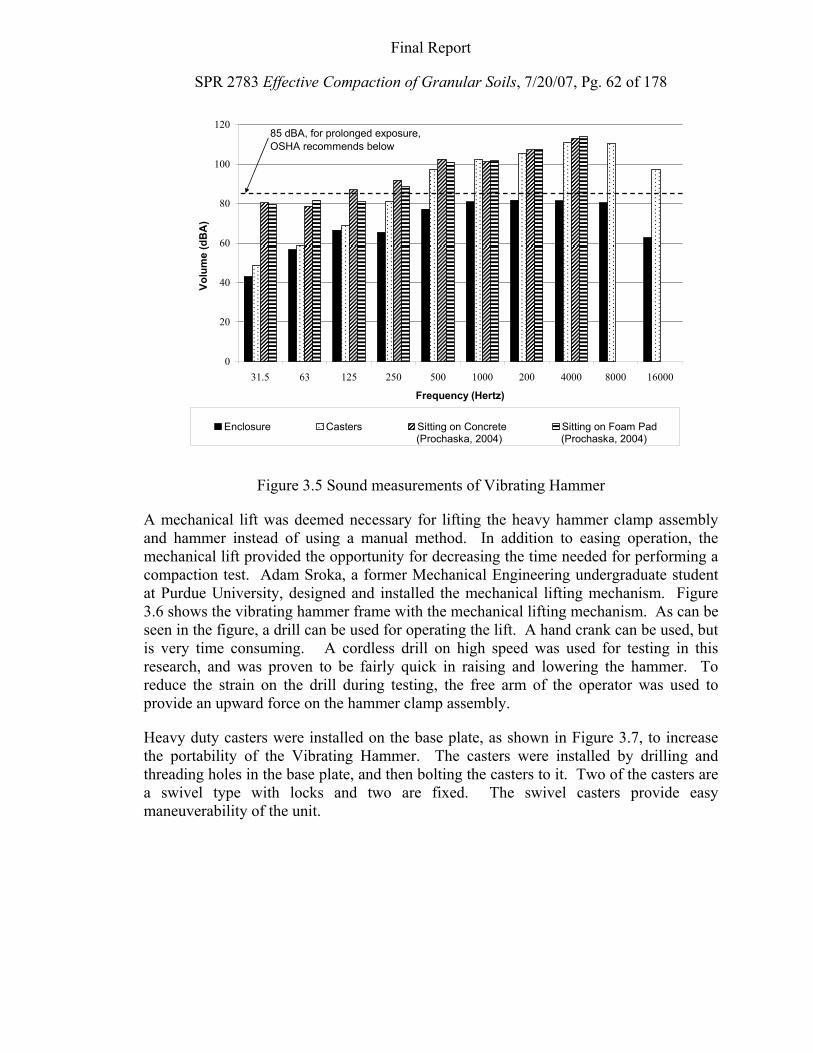
Final Report
SPR 2783 Effective Compaction of Granular Soils, 7/20/07, Pg. 62 of 178
0
20
40
60
80
100
120
31.5 63 125 250 500 1000 200 4000 8000 16000
Frequency (Hertz)
Volu
me
(dB
A)
Enclosure Casters Sitting on Concrete Sitting on Foam Pad
85 dBA, for prolonged exposure,OSHA recommends below
(Prochaska, 2004) (Prochaska, 2004)
Figure 3.5 Sound measurements of Vibrating Hammer
A mechanical lift was deemed necessary for lifting the heavy hammer clamp assembly and hammer instead of using a manual method. In addition to easing operation, the mechanical lift provided the opportunity for decreasing the time needed for performing a compaction test. Adam Sroka, a former Mechanical Engineering undergraduate student at Purdue University, designed and installed the mechanical lifting mechanism. Figure 3.6 shows the vibrating hammer frame with the mechanical lifting mechanism. As can be seen in the figure, a drill can be used for operating the lift. A hand crank can be used, but is very time consuming. A cordless drill on high speed was used for testing in this research, and was proven to be fairly quick in raising and lowering the hammer. To reduce the strain on the drill during testing, the free arm of the operator was used to provide an upward force on the hammer clamp assembly.
Heavy duty casters were installed on the base plate, as shown in Figure 3.7, to increase the portability of the Vibrating Hammer. The casters were installed by drilling and threading holes in the base plate, and then bolting the casters to it. Two of the casters are a swivel type with locks and two are fixed. The swivel casters provide easy maneuverability of the unit.
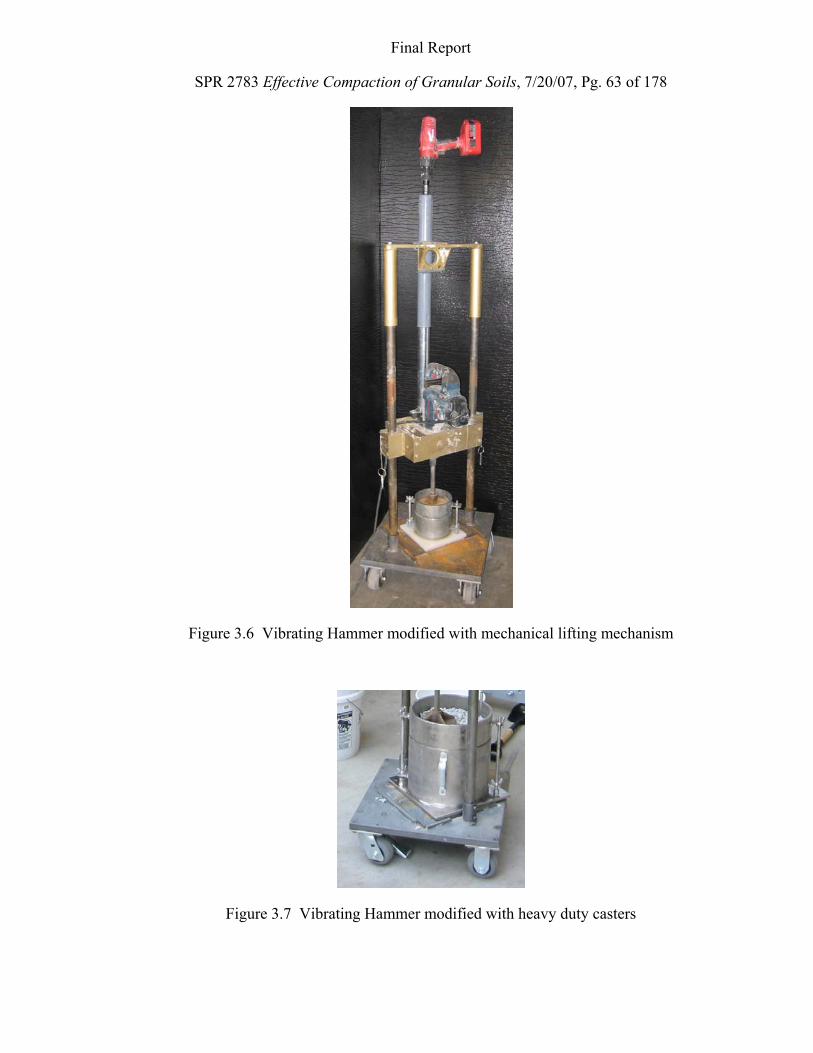
Final Report
SPR 2783 Effective Compaction of Granular Soils, 7/20/07, Pg. 63 of 178
Figure 3.6 Vibrating Hammer modified with mechanical lifting mechanism
Figure 3.7 Vibrating Hammer modified with heavy duty casters
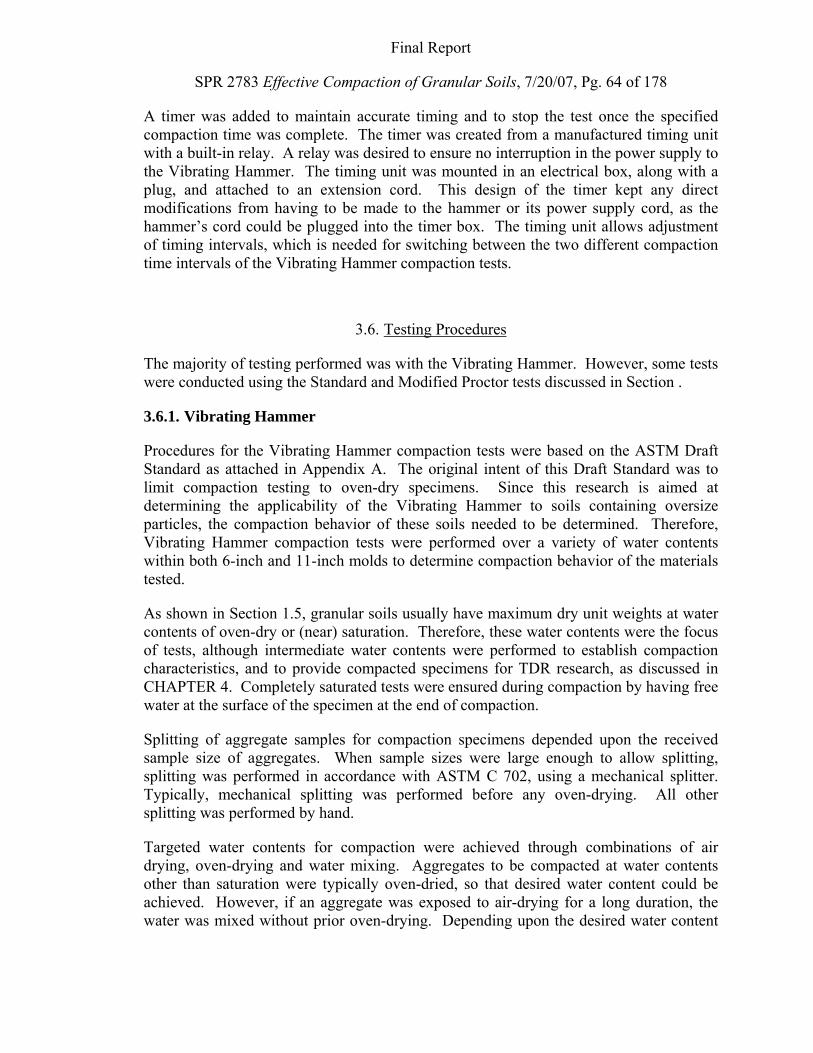
Final Report
SPR 2783 Effective Compaction of Granular Soils, 7/20/07, Pg. 64 of 178
A timer was added to maintain accurate timing and to stop the test once the specified compaction time was complete. The timer was created from a manufactured timing unit with a built-in relay. A relay was desired to ensure no interruption in the power supply to the Vibrating Hammer. The timing unit was mounted in an electrical box, along with a plug, and attached to an extension cord. This design of the timer kept any direct modifications from having to be made to the hammer or its power supply cord, as the hammer’s cord could be plugged into the timer box. The timing unit allows adjustment of timing intervals, which is needed for switching between the two different compaction time intervals of the Vibrating Hammer compaction tests.
3.6. Testing Procedures
The majority of testing performed was with the Vibrating Hammer. However, some tests were conducted using the Standard and Modified Proctor tests discussed in Section .
3.6.1. Vibrating Hammer
Procedures for the Vibrating Hammer compaction tests were based on the ASTM Draft Standard as attached in Appendix A. The original intent of this Draft Standard was to limit compaction testing to oven-dry specimens. Since this research is aimed at determining the applicability of the Vibrating Hammer to soils containing oversize particles, the compaction behavior of these soils needed to be determined. Therefore, Vibrating Hammer compaction tests were performed over a variety of water contents within both 6-inch and 11-inch molds to determine compaction behavior of the materials tested.
As shown in Section 1.5, granular soils usually have maximum dry unit weights at water contents of oven-dry or (near) saturation. Therefore, these water contents were the focus of tests, although intermediate water contents were performed to establish compaction characteristics, and to provide compacted specimens for TDR research, as discussed in CHAPTER 4. Completely saturated tests were ensured during compaction by having free water at the surface of the specimen at the end of compaction.
Splitting of aggregate samples for compaction specimens depended upon the received sample size of aggregates. When sample sizes were large enough to allow splitting, splitting was performed in accordance with ASTM C 702, using a mechanical splitter. Typically, mechanical splitting was performed before any oven-drying. All other splitting was performed by hand.
Targeted water contents for compaction were achieved through combinations of air drying, oven-drying and water mixing. Aggregates to be compacted at water contents other than saturation were typically oven-dried, so that desired water content could be achieved. However, if an aggregate was exposed to air-drying for a long duration, the water was mixed without prior oven-drying. Depending upon the desired water content
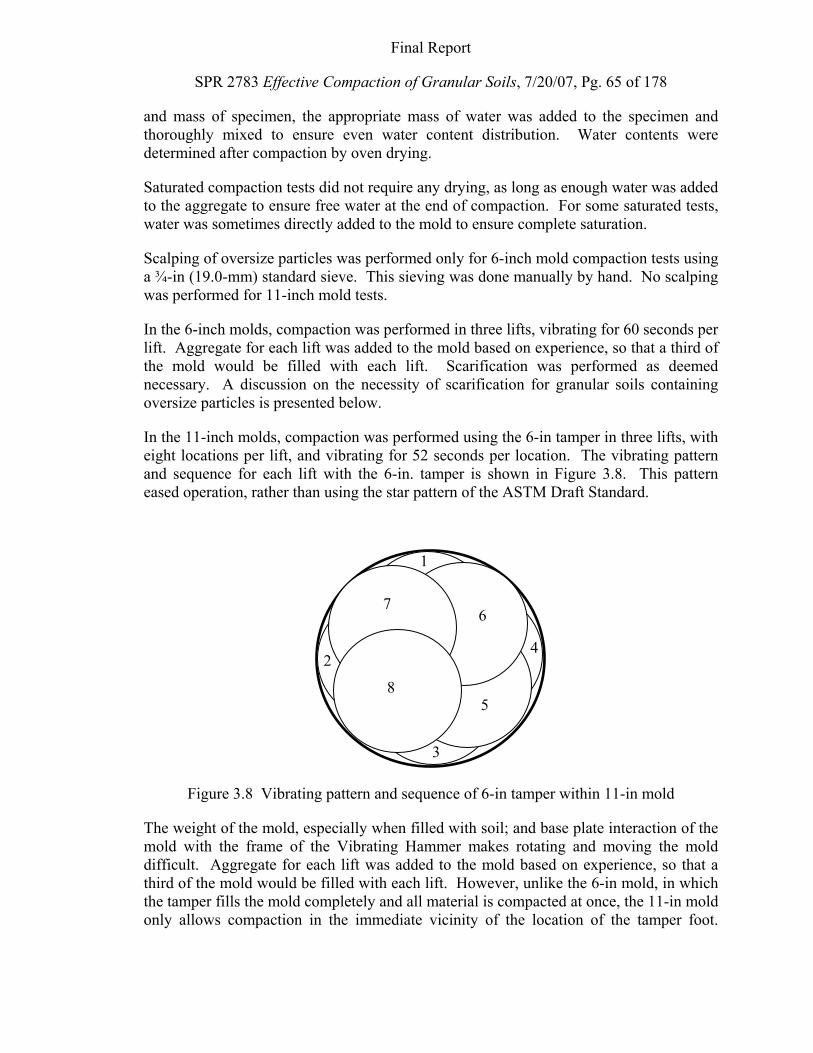
Final Report
SPR 2783 Effective Compaction of Granular Soils, 7/20/07, Pg. 65 of 178
and mass of specimen, the appropriate mass of water was added to the specimen and thoroughly mixed to ensure even water content distribution. Water contents were determined after compaction by oven drying.
Saturated compaction tests did not require any drying, as long as enough water was added to the aggregate to ensure free water at the end of compaction. For some saturated tests, water was sometimes directly added to the mold to ensure complete saturation.
Scalping of oversize particles was performed only for 6-inch mold compaction tests using a ¾-in (19.0-mm) standard sieve. This sieving was done manually by hand. No scalping was performed for 11-inch mold tests.
In the 6-inch molds, compaction was performed in three lifts, vibrating for 60 seconds per lift. Aggregate for each lift was added to the mold based on experience, so that a third of the mold would be filled with each lift. Scarification was performed as deemed necessary. A discussion on the necessity of scarification for granular soils containing oversize particles is presented below.
In the 11-inch molds, compaction was performed using the 6-in tamper in three lifts, with eight locations per lift, and vibrating for 52 seconds per location. The vibrating pattern and sequence for each lift with the 6-in. tamper is shown in Figure 3.8. This pattern eased operation, rather than using the star pattern of the ASTM Draft Standard.
42
3
1
5
67
8
Figure 3.8 Vibrating pattern and sequence of 6-in tamper within 11-in mold
The weight of the mold, especially when filled with soil; and base plate interaction of the mold with the frame of the Vibrating Hammer makes rotating and moving the mold difficult. Aggregate for each lift was added to the mold based on experience, so that a third of the mold would be filled with each lift. However, unlike the 6-in mold, in which the tamper fills the mold completely and all material is compacted at once, the 11-in mold only allows compaction in the immediate vicinity of the location of the tamper foot.
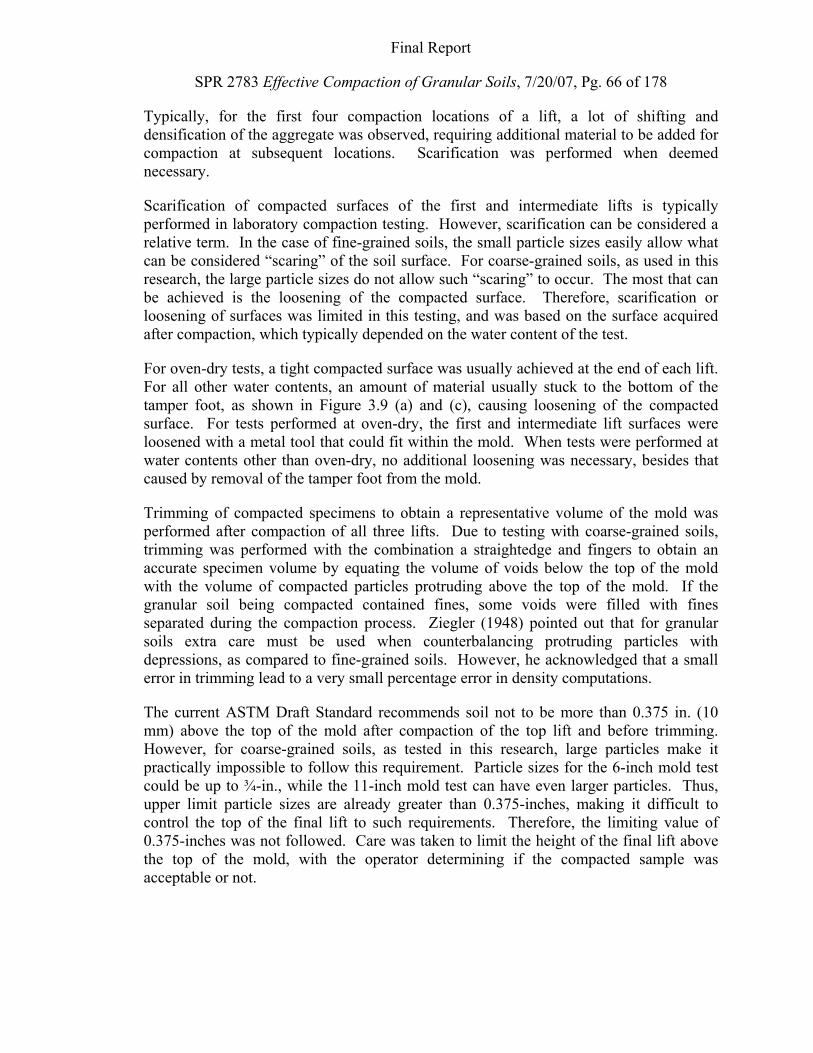
Final Report
SPR 2783 Effective Compaction of Granular Soils, 7/20/07, Pg. 66 of 178
Typically, for the first four compaction locations of a lift, a lot of shifting and densification of the aggregate was observed, requiring additional material to be added for compaction at subsequent locations. Scarification was performed when deemed necessary.
Scarification of compacted surfaces of the first and intermediate lifts is typically performed in laboratory compaction testing. However, scarification can be considered a relative term. In the case of fine-grained soils, the small particle sizes easily allow what can be considered “scaring” of the soil surface. For coarse-grained soils, as used in this research, the large particle sizes do not allow such “scaring” to occur. The most that can be achieved is the loosening of the compacted surface. Therefore, scarification or loosening of surfaces was limited in this testing, and was based on the surface acquired after compaction, which typically depended on the water content of the test.
For oven-dry tests, a tight compacted surface was usually achieved at the end of each lift. For all other water contents, an amount of material usually stuck to the bottom of the tamper foot, as shown in Figure 3.9 (a) and (c), causing loosening of the compacted surface. For tests performed at oven-dry, the first and intermediate lift surfaces were loosened with a metal tool that could fit within the mold. When tests were performed at water contents other than oven-dry, no additional loosening was necessary, besides that caused by removal of the tamper foot from the mold.
Trimming of compacted specimens to obtain a representative volume of the mold was performed after compaction of all three lifts. Due to testing with coarse-grained soils, trimming was performed with the combination a straightedge and fingers to obtain an accurate specimen volume by equating the volume of voids below the top of the mold with the volume of compacted particles protruding above the top of the mold. If the granular soil being compacted contained fines, some voids were filled with fines separated during the compaction process. Ziegler (1948) pointed out that for granular soils extra care must be used when counterbalancing protruding particles with depressions, as compared to fine-grained soils. However, he acknowledged that a small error in trimming lead to a very small percentage error in density computations.
The current ASTM Draft Standard recommends soil not to be more than 0.375 in. (10 mm) above the top of the mold after compaction of the top lift and before trimming. However, for coarse-grained soils, as tested in this research, large particles make it practically impossible to follow this requirement. Particle sizes for the 6-inch mold test could be up to ¾-in., while the 11-inch mold test can have even larger particles. Thus, upper limit particle sizes are already greater than 0.375-inches, making it difficult to control the top of the final lift to such requirements. Therefore, the limiting value of 0.375-inches was not followed. Care was taken to limit the height of the final lift above the top of the mold, with the operator determining if the compacted sample was acceptable or not.
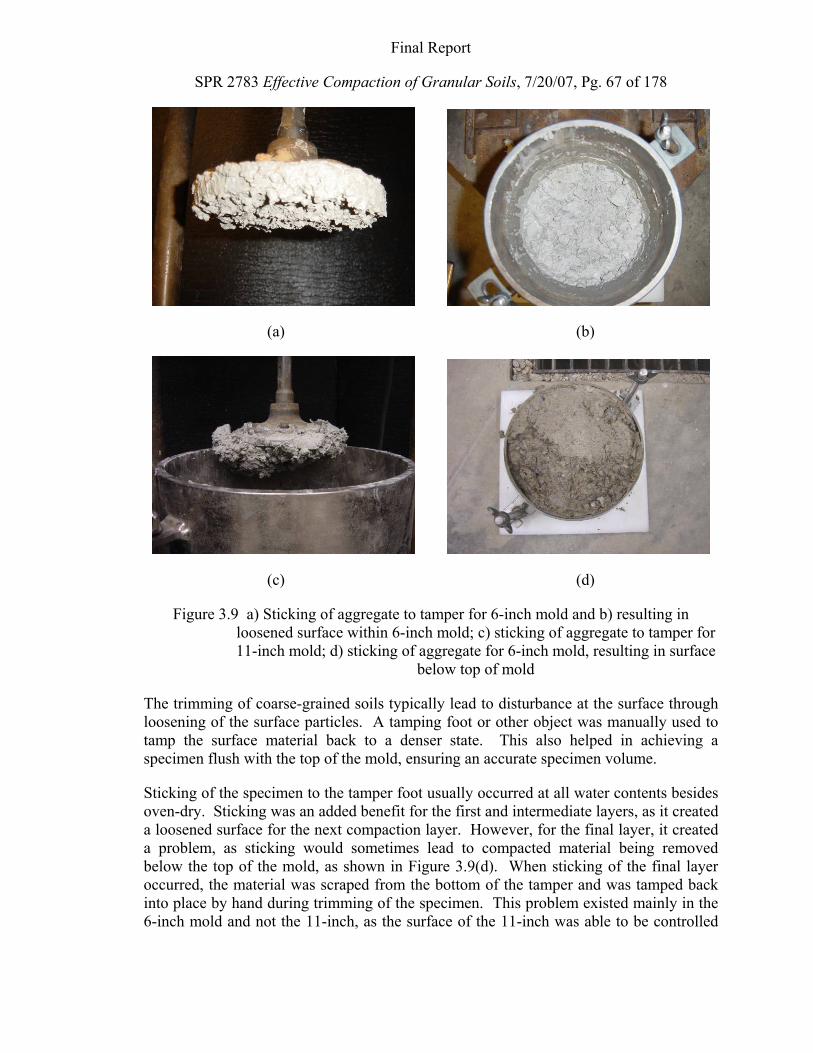
Final Report
SPR 2783 Effective Compaction of Granular Soils, 7/20/07, Pg. 67 of 178
(a) (b)
(c) (d)
Figure 3.9 a) Sticking of aggregate to tamper for 6-inch mold and b) resulting in loosened surface within 6-inch mold; c) sticking of aggregate to tamper for 11-inch mold; d) sticking of aggregate for 6-inch mold, resulting in surface
below top of mold
The trimming of coarse-grained soils typically lead to disturbance at the surface through loosening of the surface particles. A tamping foot or other object was manually used to tamp the surface material back to a denser state. This also helped in achieving a specimen flush with the top of the mold, ensuring an accurate specimen volume.
Sticking of the specimen to the tamper foot usually occurred at all water contents besides oven-dry. Sticking was an added benefit for the first and intermediate layers, as it created a loosened surface for the next compaction layer. However, for the final layer, it created a problem, as sticking would sometimes lead to compacted material being removed below the top of the mold, as shown in Figure 3.9(d). When sticking of the final layer occurred, the material was scraped from the bottom of the tamper and was tamped back into place by hand during trimming of the specimen. This problem existed mainly in the 6-inch mold and not the 11-inch, as the surface of the 11-inch was able to be controlled
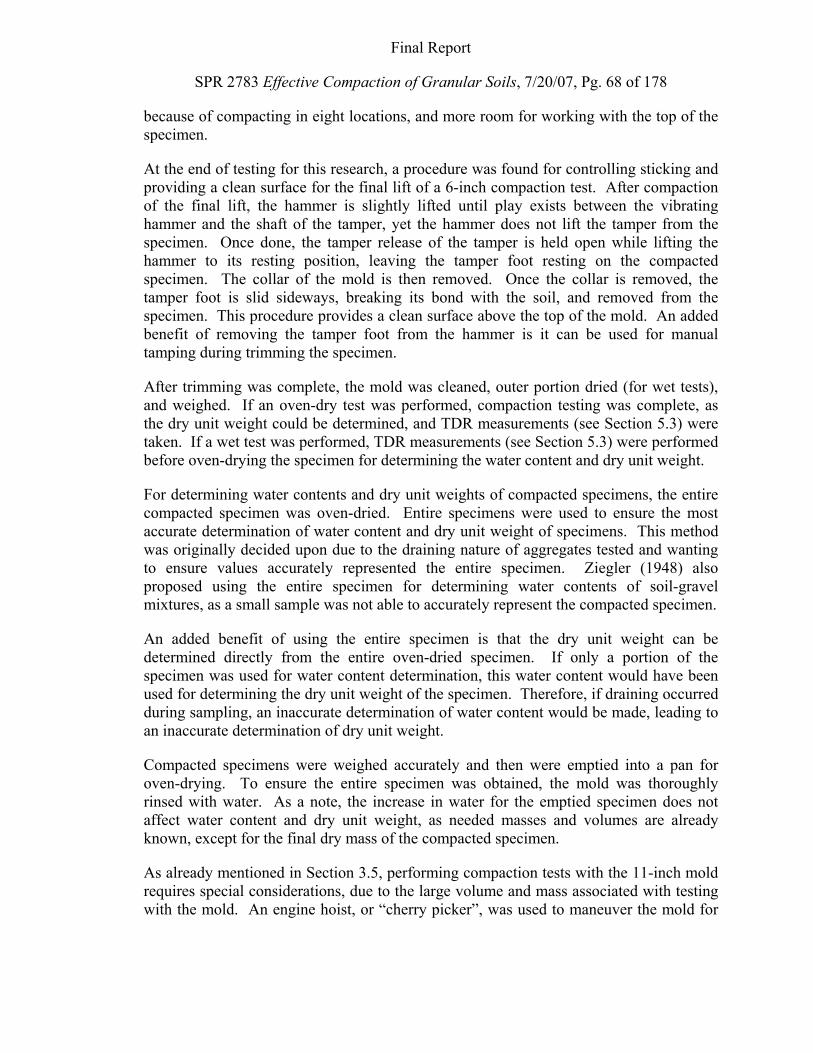
Final Report
SPR 2783 Effective Compaction of Granular Soils, 7/20/07, Pg. 68 of 178
because of compacting in eight locations, and more room for working with the top of the specimen.
At the end of testing for this research, a procedure was found for controlling sticking and providing a clean surface for the final lift of a 6-inch compaction test. After compaction of the final lift, the hammer is slightly lifted until play exists between the vibrating hammer and the shaft of the tamper, yet the hammer does not lift the tamper from the specimen. Once done, the tamper release of the tamper is held open while lifting the hammer to its resting position, leaving the tamper foot resting on the compacted specimen. The collar of the mold is then removed. Once the collar is removed, the tamper foot is slid sideways, breaking its bond with the soil, and removed from the specimen. This procedure provides a clean surface above the top of the mold. An added benefit of removing the tamper foot from the hammer is it can be used for manual tamping during trimming the specimen.
After trimming was complete, the mold was cleaned, outer portion dried (for wet tests), and weighed. If an oven-dry test was performed, compaction testing was complete, as the dry unit weight could be determined, and TDR measurements (see Section 5.3) were taken. If a wet test was performed, TDR measurements (see Section 5.3) were performed before oven-drying the specimen for determining the water content and dry unit weight.
For determining water contents and dry unit weights of compacted specimens, the entire compacted specimen was oven-dried. Entire specimens were used to ensure the most accurate determination of water content and dry unit weight of specimens. This method was originally decided upon due to the draining nature of aggregates tested and wanting to ensure values accurately represented the entire specimen. Ziegler (1948) also proposed using the entire specimen for determining water contents of soil-gravel mixtures, as a small sample was not able to accurately represent the compacted specimen.
An added benefit of using the entire specimen is that the dry unit weight can be determined directly from the entire oven-dried specimen. If only a portion of the specimen was used for water content determination, this water content would have been used for determining the dry unit weight of the specimen. Therefore, if draining occurred during sampling, an inaccurate determination of water content would be made, leading to an inaccurate determination of dry unit weight.
Compacted specimens were weighed accurately and then were emptied into a pan for oven-drying. To ensure the entire specimen was obtained, the mold was thoroughly rinsed with water. As a note, the increase in water for the emptied specimen does not affect water content and dry unit weight, as needed masses and volumes are already known, except for the final dry mass of the compacted specimen.
As already mentioned in Section 3.5, performing compaction tests with the 11-inch mold requires special considerations, due to the large volume and mass associated with testing with the mold. An engine hoist, or “cherry picker”, was used to maneuver the mold for
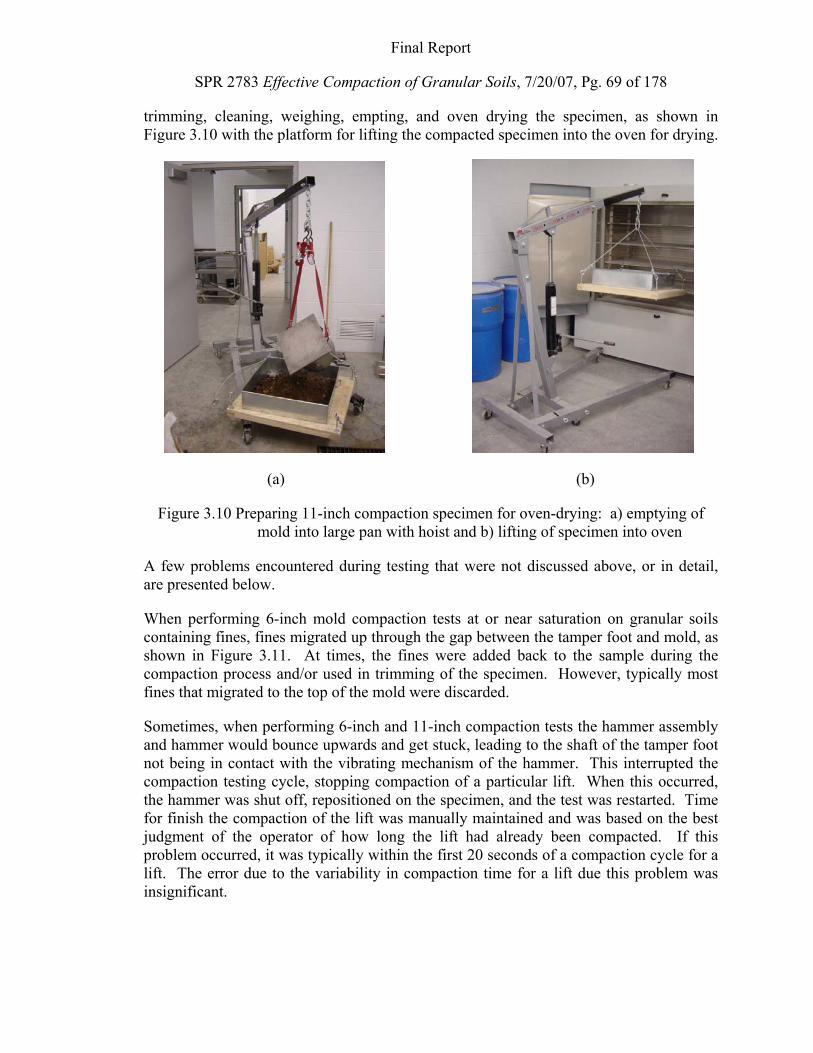
Final Report
SPR 2783 Effective Compaction of Granular Soils, 7/20/07, Pg. 69 of 178
trimming, cleaning, weighing, empting, and oven drying the specimen, as shown in Figure 3.10 with the platform for lifting the compacted specimen into the oven for drying.
(a) (b)
Figure 3.10 Preparing 11-inch compaction specimen for oven-drying: a) emptying of mold into large pan with hoist and b) lifting of specimen into oven
A few problems encountered during testing that were not discussed above, or in detail, are presented below.
When performing 6-inch mold compaction tests at or near saturation on granular soils containing fines, fines migrated up through the gap between the tamper foot and mold, as shown in Figure 3.11. At times, the fines were added back to the sample during the compaction process and/or used in trimming of the specimen. However, typically most fines that migrated to the top of the mold were discarded.
Sometimes, when performing 6-inch and 11-inch compaction tests the hammer assembly and hammer would bounce upwards and get stuck, leading to the shaft of the tamper foot not being in contact with the vibrating mechanism of the hammer. This interrupted the compaction testing cycle, stopping compaction of a particular lift. When this occurred, the hammer was shut off, repositioned on the specimen, and the test was restarted. Time for finish the compaction of the lift was manually maintained and was based on the best judgment of the operator of how long the lift had already been compacted. If this problem occurred, it was typically within the first 20 seconds of a compaction cycle for a lift. The error due to the variability in compaction time for a lift due this problem was insignificant.
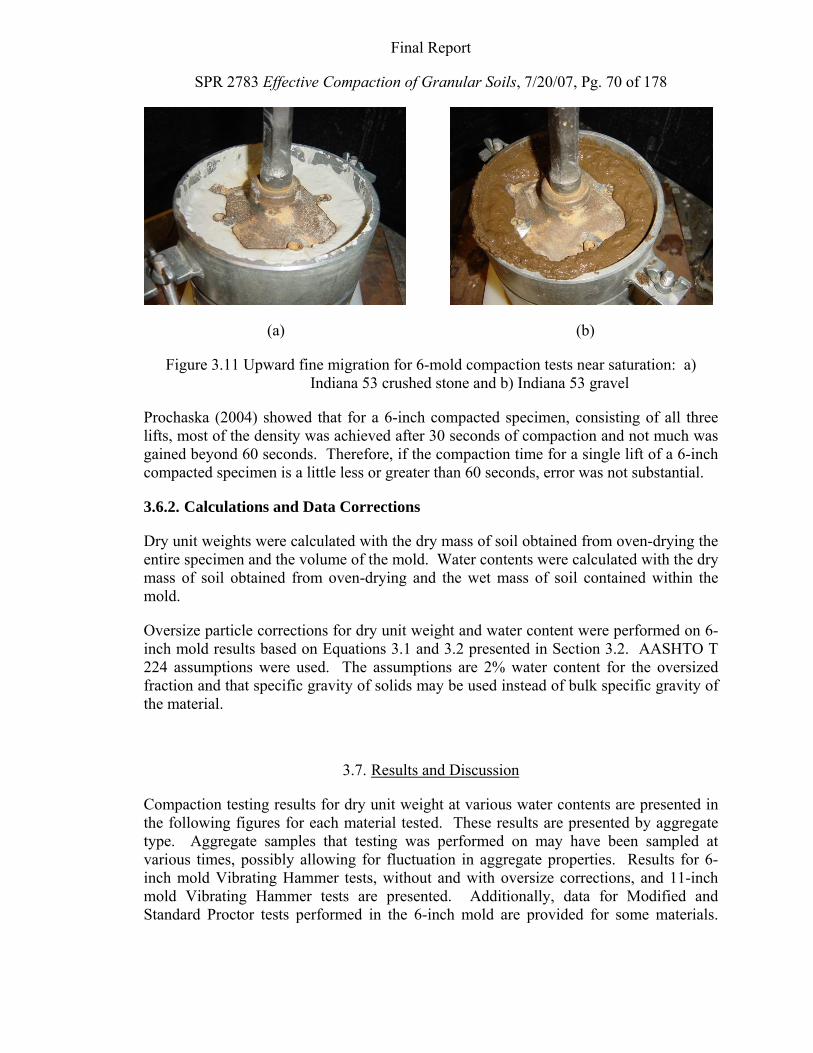
Final Report
SPR 2783 Effective Compaction of Granular Soils, 7/20/07, Pg. 70 of 178
(a) (b)
Figure 3.11 Upward fine migration for 6-mold compaction tests near saturation: a) Indiana 53 crushed stone and b) Indiana 53 gravel
Prochaska (2004) showed that for a 6-inch compacted specimen, consisting of all three lifts, most of the density was achieved after 30 seconds of compaction and not much was gained beyond 60 seconds. Therefore, if the compaction time for a single lift of a 6-inch compacted specimen is a little less or greater than 60 seconds, error was not substantial.
3.6.2. Calculations and Data Corrections
Dry unit weights were calculated with the dry mass of soil obtained from oven-drying the entire specimen and the volume of the mold. Water contents were calculated with the dry mass of soil obtained from oven-drying and the wet mass of soil contained within the mold.
Oversize particle corrections for dry unit weight and water content were performed on 6-inch mold results based on Equations 3.1 and 3.2 presented in Section 3.2. AASHTO T 224 assumptions were used. The assumptions are 2% water content for the oversized fraction and that specific gravity of solids may be used instead of bulk specific gravity of the material.
3.7. Results and Discussion
Compaction testing results for dry unit weight at various water contents are presented in the following figures for each material tested. These results are presented by aggregate type. Aggregate samples that testing was performed on may have been sampled at various times, possibly allowing for fluctuation in aggregate properties. Results for 6-inch mold Vibrating Hammer tests, without and with oversize corrections, and 11-inch mold Vibrating Hammer tests are presented. Additionally, data for Modified and Standard Proctor tests performed in the 6-inch mold are provided for some materials.
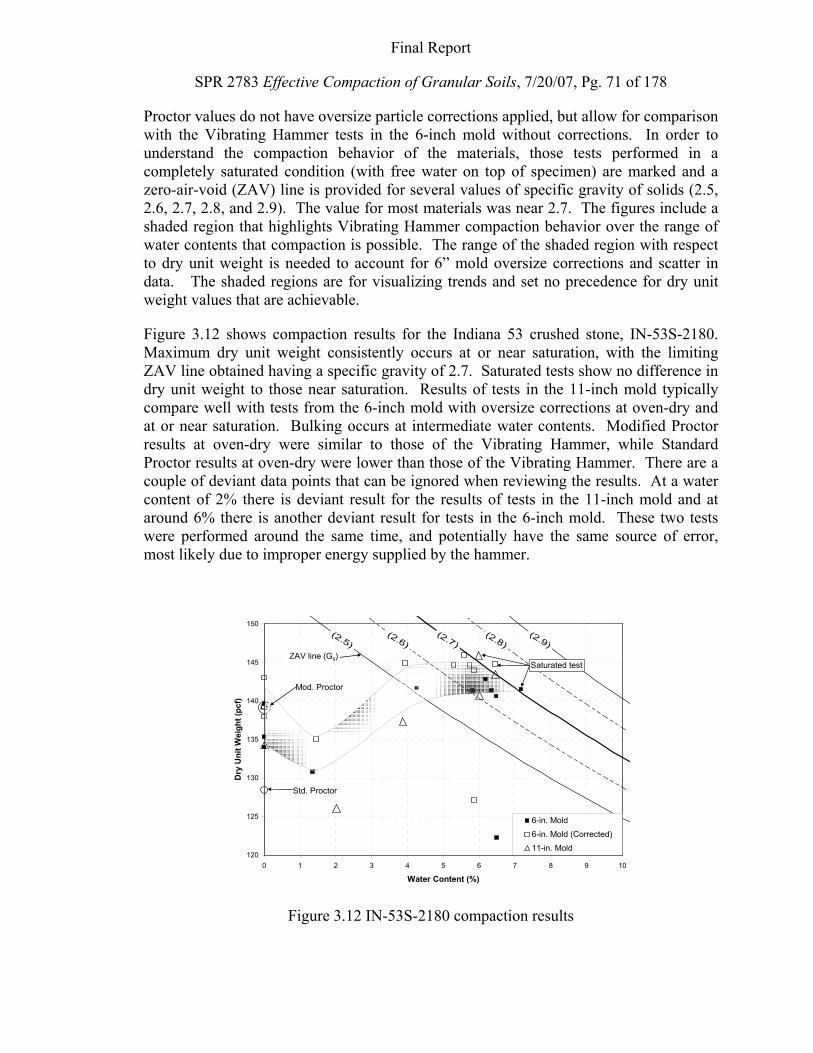
Final Report
SPR 2783 Effective Compaction of Granular Soils, 7/20/07, Pg. 71 of 178
Proctor values do not have oversize particle corrections applied, but allow for comparison with the Vibrating Hammer tests in the 6-inch mold without corrections. In order to understand the compaction behavior of the materials, those tests performed in a completely saturated condition (with free water on top of specimen) are marked and a zero-air-void (ZAV) line is provided for several values of specific gravity of solids (2.5, 2.6, 2.7, 2.8, and 2.9). The value for most materials was near 2.7. The figures include a shaded region that highlights Vibrating Hammer compaction behavior over the range of water contents that compaction is possible. The range of the shaded region with respect to dry unit weight is needed to account for 6” mold oversize corrections and scatter in data. The shaded regions are for visualizing trends and set no precedence for dry unit weight values that are achievable.
Figure 3.12 shows compaction results for the Indiana 53 crushed stone, IN-53S-2180. Maximum dry unit weight consistently occurs at or near saturation, with the limiting ZAV line obtained having a specific gravity of 2.7. Saturated tests show no difference in dry unit weight to those near saturation. Results of tests in the 11-inch mold typically compare well with tests from the 6-inch mold with oversize corrections at oven-dry and at or near saturation. Bulking occurs at intermediate water contents. Modified Proctor results at oven-dry were similar to those of the Vibrating Hammer, while Standard Proctor results at oven-dry were lower than those of the Vibrating Hammer. There are a couple of deviant data points that can be ignored when reviewing the results. At a water content of 2% there is deviant result for the results of tests in the 11-inch mold and at around 6% there is another deviant result for tests in the 6-inch mold. These two tests were performed around the same time, and potentially have the same source of error, most likely due to improper energy supplied by the hammer.
120
125
130
135
140
145
150
0 1 2 3 4 5 6 7 8 9 10
Water Content (%)
Dry
Uni
t Wei
ght (
pcf)
6-in. Mold
6-in. Mold (Corrected)11-in. Mold
ZAV line (Gs)
Std. Proctor
Mod. Proctor
Saturated test
Figure 3.12 IN-53S-2180 compaction results
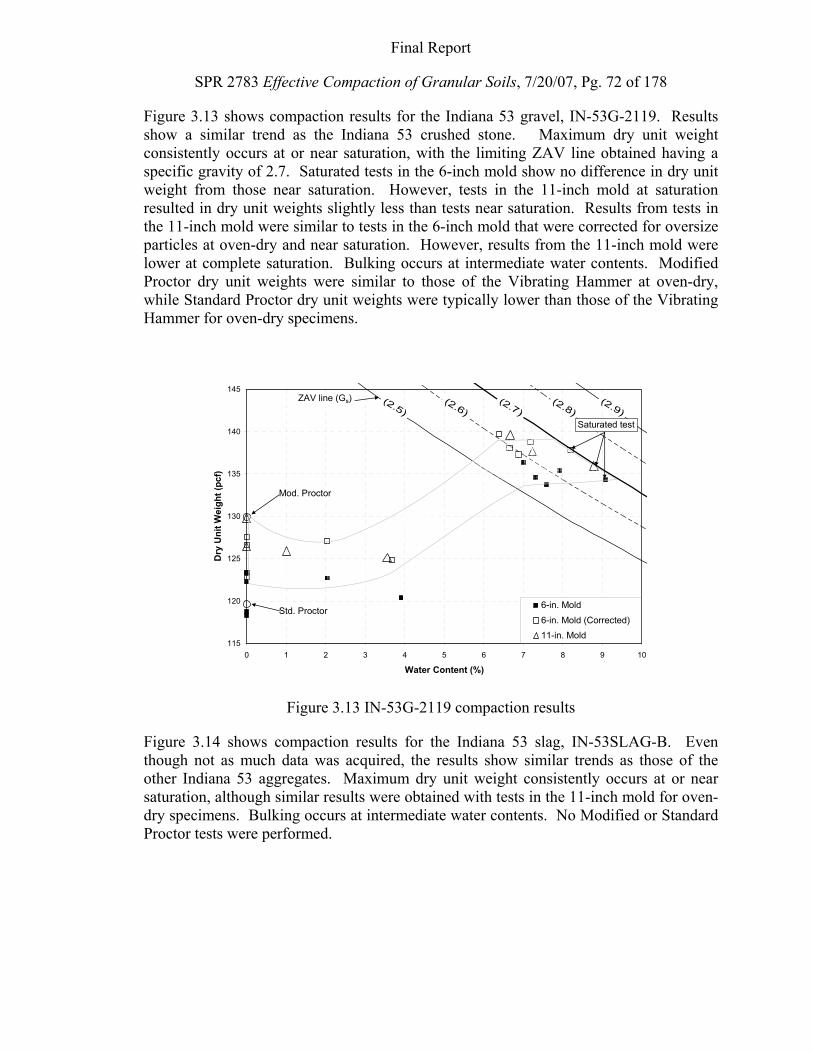
Final Report
SPR 2783 Effective Compaction of Granular Soils, 7/20/07, Pg. 72 of 178
Figure 3.13 shows compaction results for the Indiana 53 gravel, IN-53G-2119. Results show a similar trend as the Indiana 53 crushed stone. Maximum dry unit weight consistently occurs at or near saturation, with the limiting ZAV line obtained having a specific gravity of 2.7. Saturated tests in the 6-inch mold show no difference in dry unit weight from those near saturation. However, tests in the 11-inch mold at saturation resulted in dry unit weights slightly less than tests near saturation. Results from tests in the 11-inch mold were similar to tests in the 6-inch mold that were corrected for oversize particles at oven-dry and near saturation. However, results from the 11-inch mold were lower at complete saturation. Bulking occurs at intermediate water contents. Modified Proctor dry unit weights were similar to those of the Vibrating Hammer at oven-dry, while Standard Proctor dry unit weights were typically lower than those of the Vibrating Hammer for oven-dry specimens.
115
120
125
130
135
140
145
0 1 2 3 4 5 6 7 8 9 10
Water Content (%)
Dry
Uni
t Wei
ght (
pcf)
6-in. Mold
6-in. Mold (Corrected)11-in. Mold
ZAV line (Gs)
Std. Proctor
Mod. Proctor
Saturated test
Figure 3.13 IN-53G-2119 compaction results
Figure 3.14 shows compaction results for the Indiana 53 slag, IN-53SLAG-B. Even though not as much data was acquired, the results show similar trends as those of the other Indiana 53 aggregates. Maximum dry unit weight consistently occurs at or near saturation, although similar results were obtained with tests in the 11-inch mold for oven-dry specimens. Bulking occurs at intermediate water contents. No Modified or Standard Proctor tests were performed.
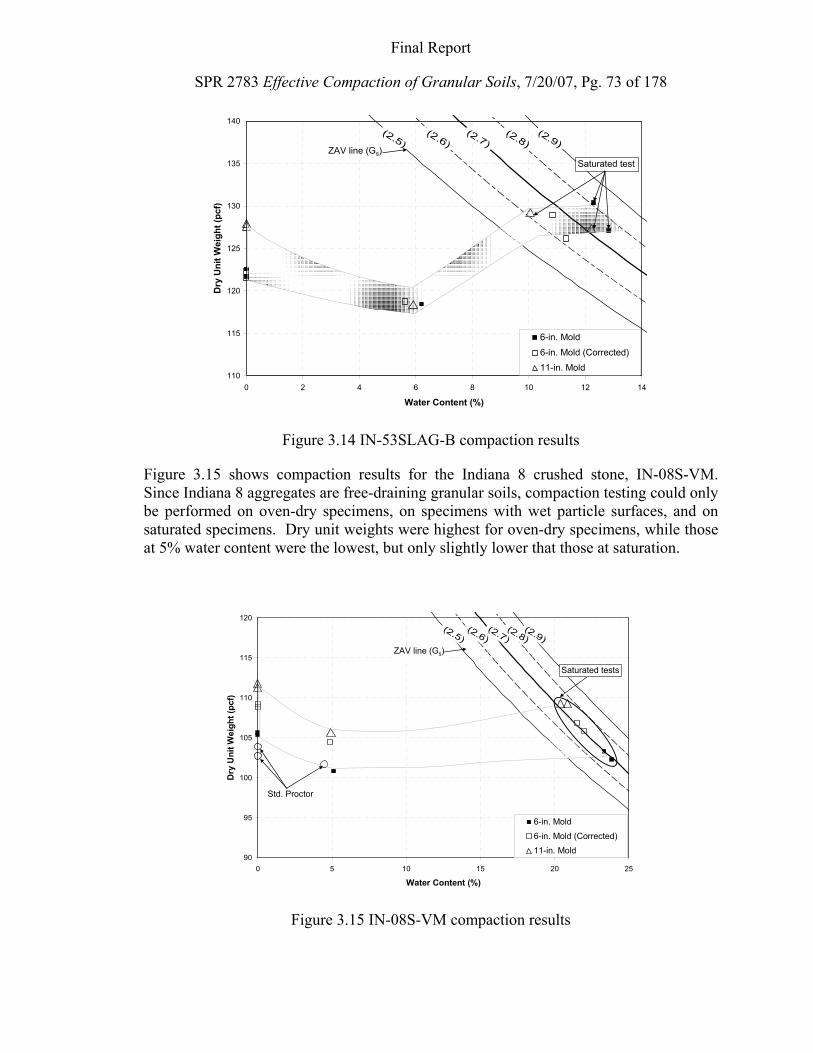
Final Report
SPR 2783 Effective Compaction of Granular Soils, 7/20/07, Pg. 73 of 178
110
115
120
125
130
135
140
0 2 4 6 8 10 12 14
Water Content (%)
Dry
Uni
t Wei
ght (
pcf)
6-in. Mold
6-in. Mold (Corrected)11-in. Mold
ZAV line (Gs)Saturated test
Figure 3.14 IN-53SLAG-B compaction results
Figure 3.15 shows compaction results for the Indiana 8 crushed stone, IN-08S-VM. Since Indiana 8 aggregates are free-draining granular soils, compaction testing could only be performed on oven-dry specimens, on specimens with wet particle surfaces, and on saturated specimens. Dry unit weights were highest for oven-dry specimens, while those at 5% water content were the lowest, but only slightly lower that those at saturation.
90
95
100
105
110
115
120
0 5 10 15 20 25
Water Content (%)
Dry
Uni
t Wei
ght (
pcf)
6-in. Mold
6-in. Mold (Corrected)11-in. Mold
ZAV line (Gs)
Std. Proctor
Saturated tests
Figure 3.15 IN-08S-VM compaction results
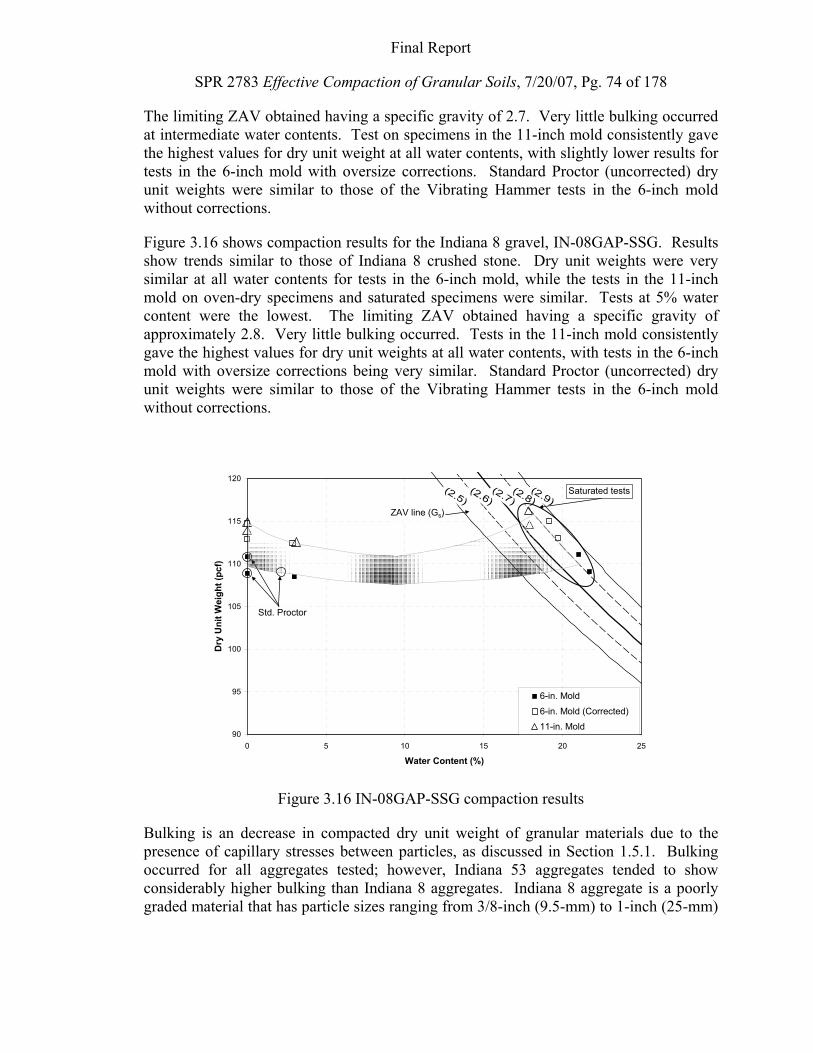
Final Report
SPR 2783 Effective Compaction of Granular Soils, 7/20/07, Pg. 74 of 178
The limiting ZAV obtained having a specific gravity of 2.7. Very little bulking occurred at intermediate water contents. Test on specimens in the 11-inch mold consistently gave the highest values for dry unit weight at all water contents, with slightly lower results for tests in the 6-inch mold with oversize corrections. Standard Proctor (uncorrected) dry unit weights were similar to those of the Vibrating Hammer tests in the 6-inch mold without corrections.
Figure 3.16 shows compaction results for the Indiana 8 gravel, IN-08GAP-SSG. Results show trends similar to those of Indiana 8 crushed stone. Dry unit weights were very similar at all water contents for tests in the 6-inch mold, while the tests in the 11-inch mold on oven-dry specimens and saturated specimens were similar. Tests at 5% water content were the lowest. The limiting ZAV obtained having a specific gravity of approximately 2.8. Very little bulking occurred. Tests in the 11-inch mold consistently gave the highest values for dry unit weights at all water contents, with tests in the 6-inch mold with oversize corrections being very similar. Standard Proctor (uncorrected) dry unit weights were similar to those of the Vibrating Hammer tests in the 6-inch mold without corrections.
90
95
100
105
110
115
120
0 5 10 15 20 25
Water Content (%)
Dry
Uni
t Wei
ght (
pcf)
6-in. Mold
6-in. Mold (Corrected)11-in. Mold
ZAV line (Gs)
Std. Proctor
Saturated tests
Figure 3.16 IN-08GAP-SSG compaction results
Bulking is an decrease in compacted dry unit weight of granular materials due to the presence of capillary stresses between particles, as discussed in Section 1.5.1. Bulking occurred for all aggregates tested; however, Indiana 53 aggregates tended to show considerably higher bulking than Indiana 8 aggregates. Indiana 8 aggregate is a poorly graded material that has particle sizes ranging from 3/8-inch (9.5-mm) to 1-inch (25-mm)
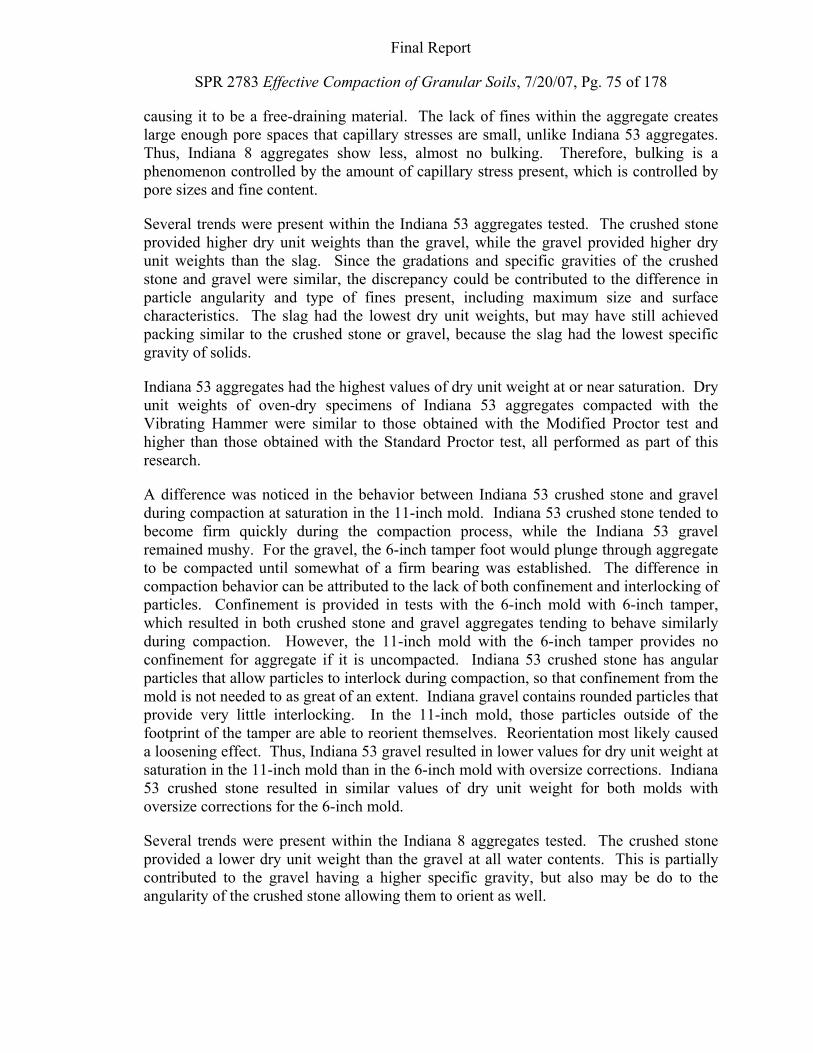
Final Report
SPR 2783 Effective Compaction of Granular Soils, 7/20/07, Pg. 75 of 178
causing it to be a free-draining material. The lack of fines within the aggregate creates large enough pore spaces that capillary stresses are small, unlike Indiana 53 aggregates. Thus, Indiana 8 aggregates show less, almost no bulking. Therefore, bulking is a phenomenon controlled by the amount of capillary stress present, which is controlled by pore sizes and fine content.
Several trends were present within the Indiana 53 aggregates tested. The crushed stone provided higher dry unit weights than the gravel, while the gravel provided higher dry unit weights than the slag. Since the gradations and specific gravities of the crushed stone and gravel were similar, the discrepancy could be contributed to the difference in particle angularity and type of fines present, including maximum size and surface characteristics. The slag had the lowest dry unit weights, but may have still achieved packing similar to the crushed stone or gravel, because the slag had the lowest specific gravity of solids.
Indiana 53 aggregates had the highest values of dry unit weight at or near saturation. Dry unit weights of oven-dry specimens of Indiana 53 aggregates compacted with the Vibrating Hammer were similar to those obtained with the Modified Proctor test and higher than those obtained with the Standard Proctor test, all performed as part of this research.
A difference was noticed in the behavior between Indiana 53 crushed stone and gravel during compaction at saturation in the 11-inch mold. Indiana 53 crushed stone tended to become firm quickly during the compaction process, while the Indiana 53 gravel remained mushy. For the gravel, the 6-inch tamper foot would plunge through aggregate to be compacted until somewhat of a firm bearing was established. The difference in compaction behavior can be attributed to the lack of both confinement and interlocking of particles. Confinement is provided in tests with the 6-inch mold with 6-inch tamper, which resulted in both crushed stone and gravel aggregates tending to behave similarly during compaction. However, the 11-inch mold with the 6-inch tamper provides no confinement for aggregate if it is uncompacted. Indiana 53 crushed stone has angular particles that allow particles to interlock during compaction, so that confinement from the mold is not needed to as great of an extent. Indiana gravel contains rounded particles that provide very little interlocking. In the 11-inch mold, those particles outside of the footprint of the tamper are able to reorient themselves. Reorientation most likely caused a loosening effect. Thus, Indiana 53 gravel resulted in lower values for dry unit weight at saturation in the 11-inch mold than in the 6-inch mold with oversize corrections. Indiana 53 crushed stone resulted in similar values of dry unit weight for both molds with oversize corrections for the 6-inch mold.
Several trends were present within the Indiana 8 aggregates tested. The crushed stone provided a lower dry unit weight than the gravel at all water contents. This is partially contributed to the gravel having a higher specific gravity, but also may be do to the angularity of the crushed stone allowing them to orient as well.
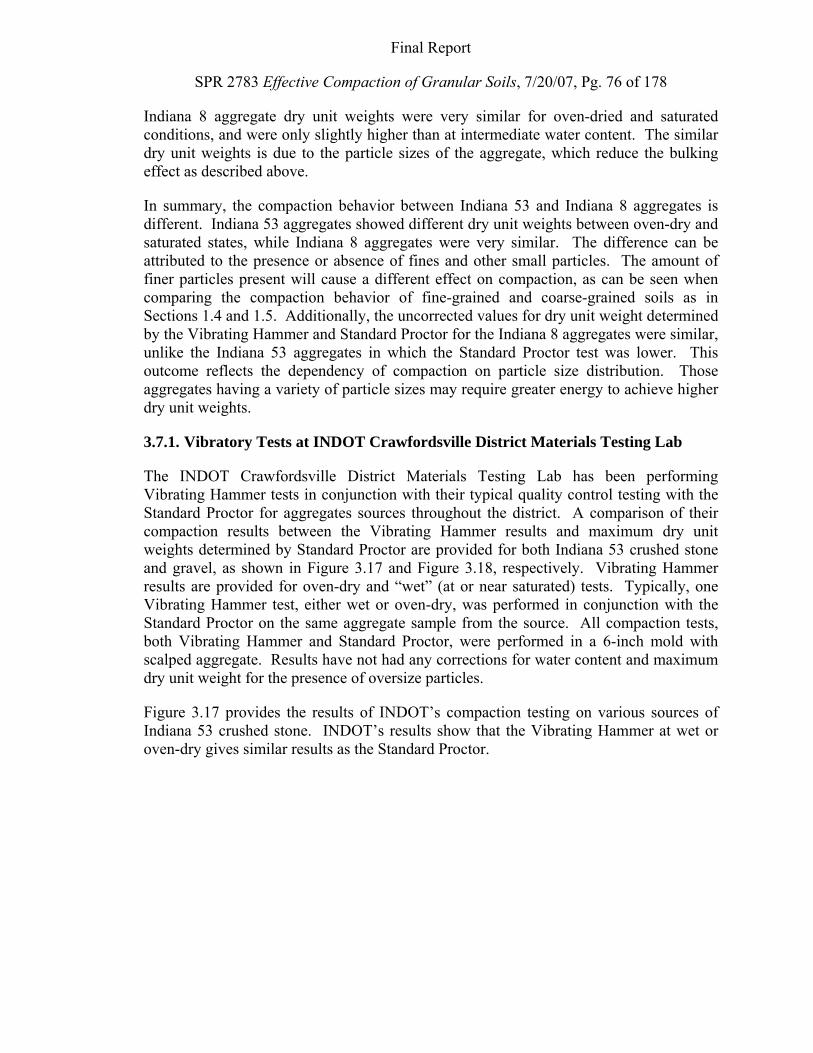
Final Report
SPR 2783 Effective Compaction of Granular Soils, 7/20/07, Pg. 76 of 178
Indiana 8 aggregate dry unit weights were very similar for oven-dried and saturated conditions, and were only slightly higher than at intermediate water content. The similar dry unit weights is due to the particle sizes of the aggregate, which reduce the bulking effect as described above.
In summary, the compaction behavior between Indiana 53 and Indiana 8 aggregates is different. Indiana 53 aggregates showed different dry unit weights between oven-dry and saturated states, while Indiana 8 aggregates were very similar. The difference can be attributed to the presence or absence of fines and other small particles. The amount of finer particles present will cause a different effect on compaction, as can be seen when comparing the compaction behavior of fine-grained and coarse-grained soils as in Sections 1.4 and 1.5. Additionally, the uncorrected values for dry unit weight determined by the Vibrating Hammer and Standard Proctor for the Indiana 8 aggregates were similar, unlike the Indiana 53 aggregates in which the Standard Proctor test was lower. This outcome reflects the dependency of compaction on particle size distribution. Those aggregates having a variety of particle sizes may require greater energy to achieve higher dry unit weights.
3.7.1. Vibratory Tests at INDOT Crawfordsville District Materials Testing Lab
The INDOT Crawfordsville District Materials Testing Lab has been performing Vibrating Hammer tests in conjunction with their typical quality control testing with the Standard Proctor for aggregates sources throughout the district. A comparison of their compaction results between the Vibrating Hammer results and maximum dry unit weights determined by Standard Proctor are provided for both Indiana 53 crushed stone and gravel, as shown in Figure 3.17 and Figure 3.18, respectively. Vibrating Hammer results are provided for oven-dry and “wet” (at or near saturated) tests. Typically, one Vibrating Hammer test, either wet or oven-dry, was performed in conjunction with the Standard Proctor on the same aggregate sample from the source. All compaction tests, both Vibrating Hammer and Standard Proctor, were performed in a 6-inch mold with scalped aggregate. Results have not had any corrections for water content and maximum dry unit weight for the presence of oversize particles.
Figure 3.17 provides the results of INDOT’s compaction testing on various sources of Indiana 53 crushed stone. INDOT’s results show that the Vibrating Hammer at wet or oven-dry gives similar results as the Standard Proctor.
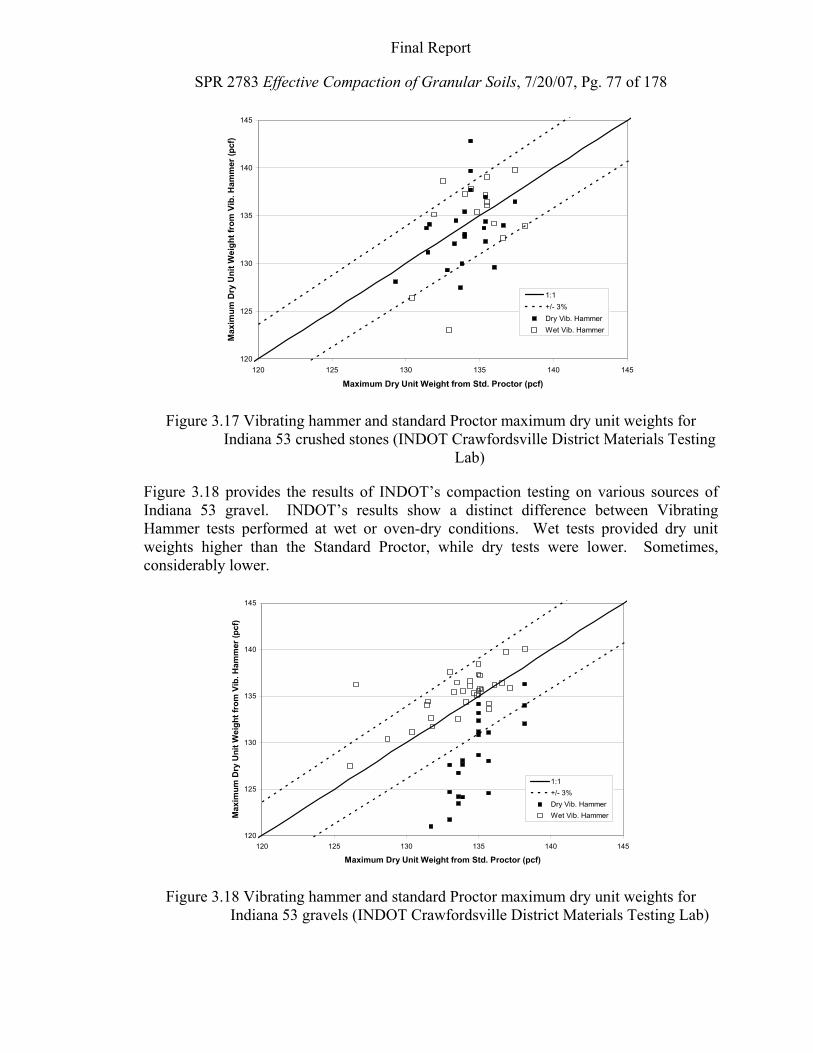
Final Report
SPR 2783 Effective Compaction of Granular Soils, 7/20/07, Pg. 77 of 178
120
125
130
135
140
145
120 125 130 135 140 145
Maximum Dry Unit Weight from Std. Proctor (pcf)
Max
imum
Dry
Uni
t Wei
ght f
rom
Vib
. Ham
mer
(pcf
)
1:1+/- 3%Dry Vib. HammerWet Vib. Hammer
Figure 3.17 Vibrating hammer and standard Proctor maximum dry unit weights for Indiana 53 crushed stones (INDOT Crawfordsville District Materials Testing
Lab)
Figure 3.18 provides the results of INDOT’s compaction testing on various sources of Indiana 53 gravel. INDOT’s results show a distinct difference between Vibrating Hammer tests performed at wet or oven-dry conditions. Wet tests provided dry unit weights higher than the Standard Proctor, while dry tests were lower. Sometimes, considerably lower.
120
125
130
135
140
145
120 125 130 135 140 145
Maximum Dry Unit Weight from Std. Proctor (pcf)
Max
imum
Dry
Uni
t Wei
ght f
rom
Vib
. Ham
mer
(pcf
)
1:1+/- 3%Dry Vib. HammerWet Vib. Hammer
Figure 3.18 Vibrating hammer and standard Proctor maximum dry unit weights for Indiana 53 gravels (INDOT Crawfordsville District Materials Testing Lab)
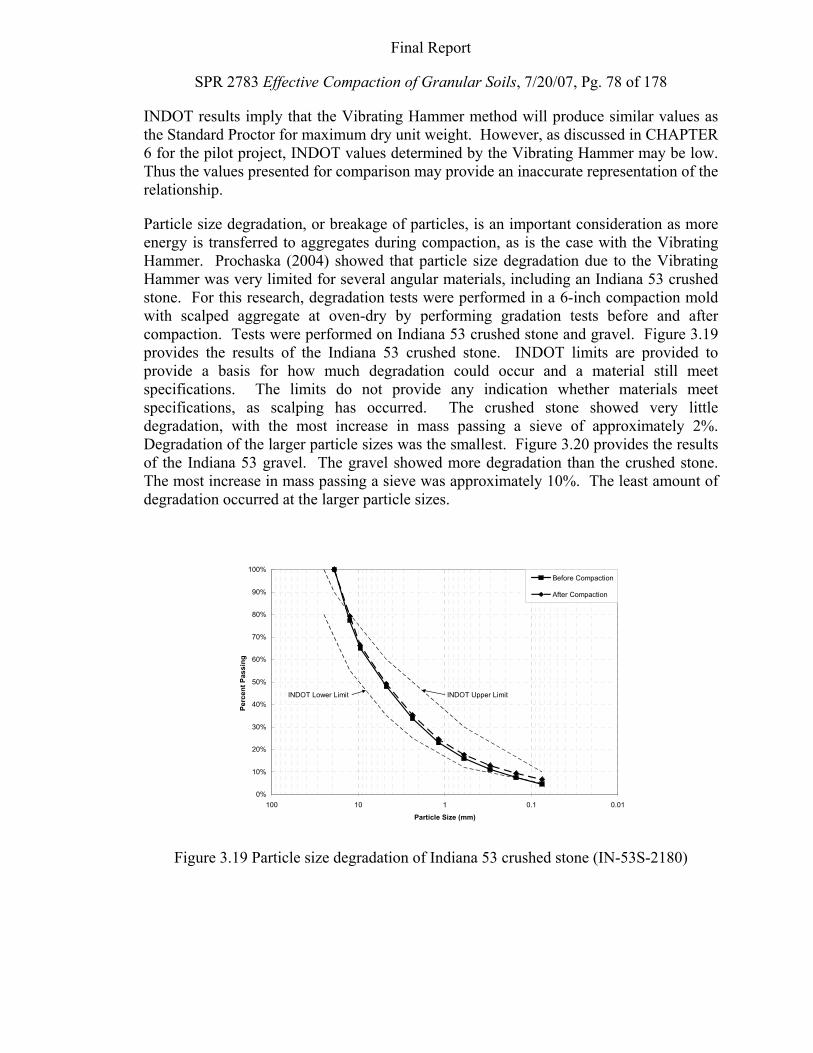
Final Report
SPR 2783 Effective Compaction of Granular Soils, 7/20/07, Pg. 78 of 178
INDOT results imply that the Vibrating Hammer method will produce similar values as the Standard Proctor for maximum dry unit weight. However, as discussed in CHAPTER 6 for the pilot project, INDOT values determined by the Vibrating Hammer may be low. Thus the values presented for comparison may provide an inaccurate representation of the relationship.
Particle size degradation, or breakage of particles, is an important consideration as more energy is transferred to aggregates during compaction, as is the case with the Vibrating Hammer. Prochaska (2004) showed that particle size degradation due to the Vibrating Hammer was very limited for several angular materials, including an Indiana 53 crushed stone. For this research, degradation tests were performed in a 6-inch compaction mold with scalped aggregate at oven-dry by performing gradation tests before and after compaction. Tests were performed on Indiana 53 crushed stone and gravel. Figure 3.19 provides the results of the Indiana 53 crushed stone. INDOT limits are provided to provide a basis for how much degradation could occur and a material still meet specifications. The limits do not provide any indication whether materials meet specifications, as scalping has occurred. The crushed stone showed very little degradation, with the most increase in mass passing a sieve of approximately 2%. Degradation of the larger particle sizes was the smallest. Figure 3.20 provides the results of the Indiana 53 gravel. The gravel showed more degradation than the crushed stone. The most increase in mass passing a sieve was approximately 10%. The least amount of degradation occurred at the larger particle sizes.
0%
10%
20%
30%
40%
50%
60%
70%
80%
90%
100%
0.010.1110100
Particle Size (mm)
Perc
ent P
assi
ng
Before Compaction
After Compaction
INDOT Upper LimitINDOT Lower Limit
Figure 3.19 Particle size degradation of Indiana 53 crushed stone (IN-53S-2180)
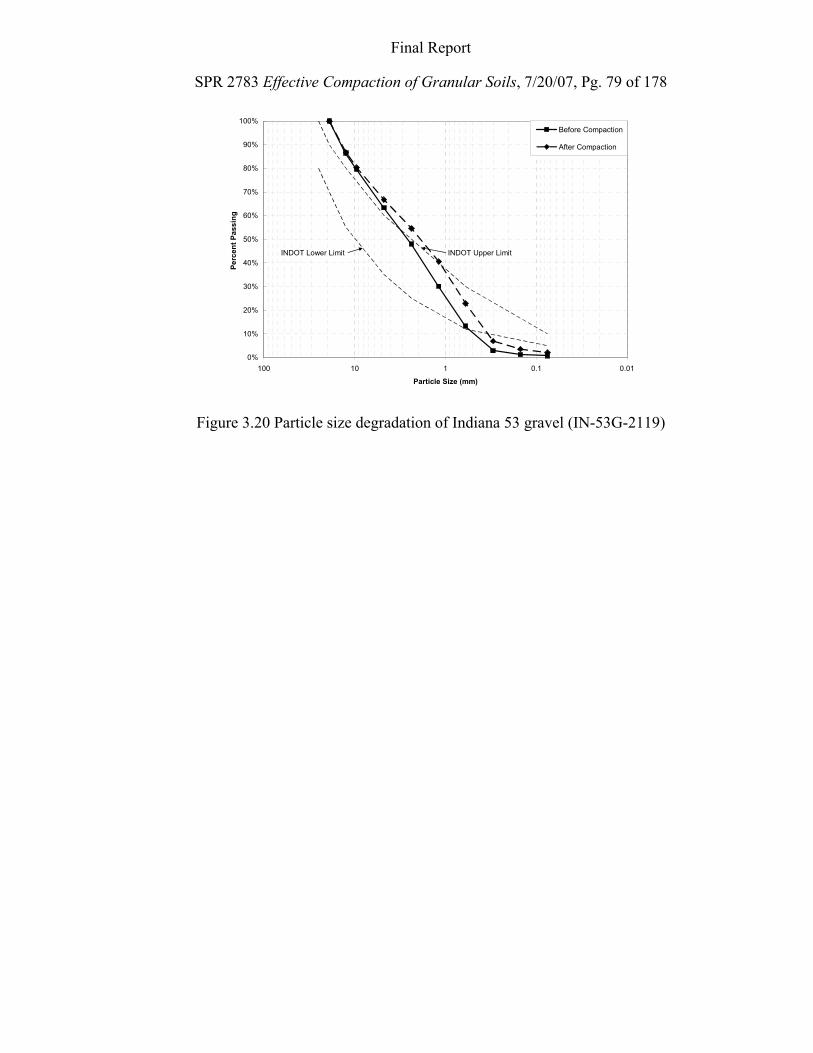
Final Report
SPR 2783 Effective Compaction of Granular Soils, 7/20/07, Pg. 79 of 178
0%
10%
20%
30%
40%
50%
60%
70%
80%
90%
100%
0.010.1110100
Particle Size (mm)
Perc
ent P
assi
ng
Before Compaction
After Compaction
INDOT Upper LimitINDOT Lower Limit
Figure 3.20 Particle size degradation of Indiana 53 gravel (IN-53G-2119)
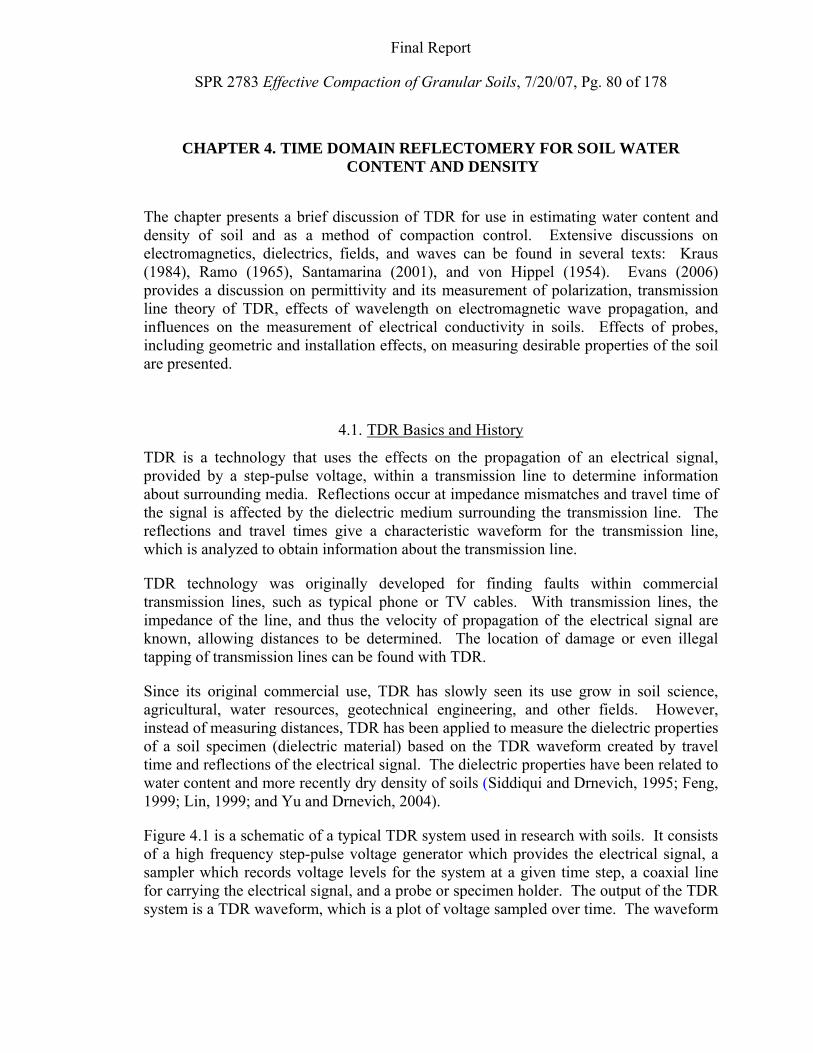
Final Report
SPR 2783 Effective Compaction of Granular Soils, 7/20/07, Pg. 80 of 178
CHAPTER 4. TIME DOMAIN REFLECTOMERY FOR SOIL WATER CONTENT AND DENSITY
The chapter presents a brief discussion of TDR for use in estimating water content and density of soil and as a method of compaction control. Extensive discussions on electromagnetics, dielectrics, fields, and waves can be found in several texts: Kraus (1984), Ramo (1965), Santamarina (2001), and von Hippel (1954). Evans (2006) provides a discussion on permittivity and its measurement of polarization, transmission line theory of TDR, effects of wavelength on electromagnetic wave propagation, and influences on the measurement of electrical conductivity in soils. Effects of probes, including geometric and installation effects, on measuring desirable properties of the soil are presented.
4.1. TDR Basics and History
TDR is a technology that uses the effects on the propagation of an electrical signal, provided by a step-pulse voltage, within a transmission line to determine information about surrounding media. Reflections occur at impedance mismatches and travel time of the signal is affected by the dielectric medium surrounding the transmission line. The reflections and travel times give a characteristic waveform for the transmission line, which is analyzed to obtain information about the transmission line.
TDR technology was originally developed for finding faults within commercial transmission lines, such as typical phone or TV cables. With transmission lines, the impedance of the line, and thus the velocity of propagation of the electrical signal are known, allowing distances to be determined. The location of damage or even illegal tapping of transmission lines can be found with TDR.
Since its original commercial use, TDR has slowly seen its use grow in soil science, agricultural, water resources, geotechnical engineering, and other fields. However, instead of measuring distances, TDR has been applied to measure the dielectric properties of a soil specimen (dielectric material) based on the TDR waveform created by travel time and reflections of the electrical signal. The dielectric properties have been related to water content and more recently dry density of soils (Siddiqui and Drnevich, 1995; Feng, 1999; Lin, 1999; and Yu and Drnevich, 2004).
Figure 4.1 is a schematic of a typical TDR system used in research with soils. It consists of a high frequency step-pulse voltage generator which provides the electrical signal, a sampler which records voltage levels for the system at a given time step, a coaxial line for carrying the electrical signal, and a probe or specimen holder. The output of the TDR system is a TDR waveform, which is a plot of voltage sampled over time. The waveform
Final Report
SPR 2783 Effective Compaction of Granular Soils, 7/20/07, Pg. 81 of 178
is a combination of voltage reflections occurring at impedance mismatches within the transmission line, consisting of the cable, coaxial head, and soil within the probe. Electrical properties of the soil, apparent dielectric constant and bulk electrical conductivity, can be determined from the waveform. Apparent dielectric constant can be determined when all parts of the system have known lengths, by determining the velocity of propagation of the electrical signal. Bulk electrical conductivity is determined from the long-term response of the TDR system. These two electrical properties are related to compaction control parameter of water content and dry density through calibration equations.
Figure 4.1 TDR system main components (Robinson et al. 2003)
4.2. Purdue TDR Method
This research made use of the Purdue TDR Method with the purpose of determining its applicability for use with granular materials with large particle sizes. The Purdue TDR Method is a TDR system intended for the geotechnical application of determining water content and dry density of soils. It was developed at Purdue University starting with the work of Siddiqui and Drnevich (1995), and extended by Feng (1999), Lin (1999), and Yu and Drnevich (2004).
A schematic of the system used is shown in Figure 4.2. A Campbell Scientific TDR 100 provides the functions of the Pulser, Timing, and Sampling in Fig. 3.1, generating a TDR waveform. The waveform is output to a computer containing the program PMTDR-SM (acronym of Purdue Method TDR-Simplified Method), originally developed by Yu (2003). PMTDR-SM allows the determination of dry density and water content using calibration data.
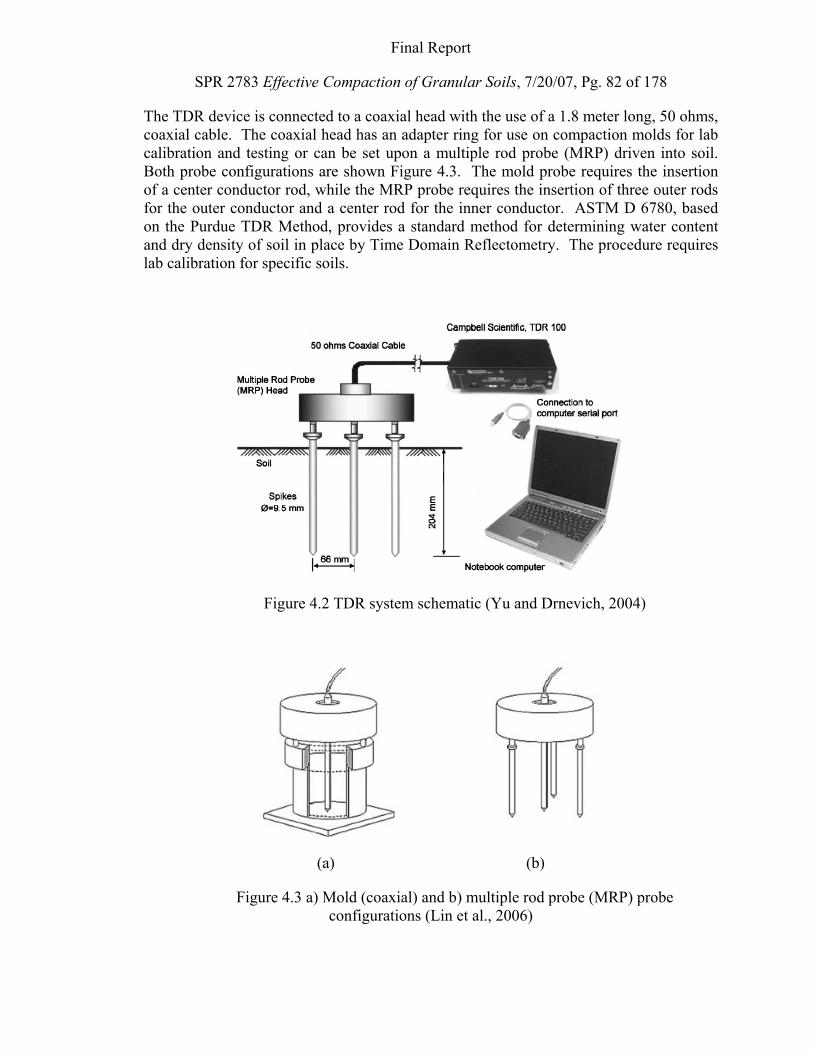
Final Report
SPR 2783 Effective Compaction of Granular Soils, 7/20/07, Pg. 82 of 178
The TDR device is connected to a coaxial head with the use of a 1.8 meter long, 50 ohms, coaxial cable. The coaxial head has an adapter ring for use on compaction molds for lab calibration and testing or can be set upon a multiple rod probe (MRP) driven into soil. Both probe configurations are shown Figure 4.3. The mold probe requires the insertion of a center conductor rod, while the MRP probe requires the insertion of three outer rods for the outer conductor and a center rod for the inner conductor. ASTM D 6780, based on the Purdue TDR Method, provides a standard method for determining water content and dry density of soil in place by Time Domain Reflectometry. The procedure requires lab calibration for specific soils.
Figure 4.2 TDR system schematic (Yu and Drnevich, 2004)
(a) (b)
Figure 4.3 a) Mold (coaxial) and b) multiple rod probe (MRP) probe configurations (Lin et al., 2006)
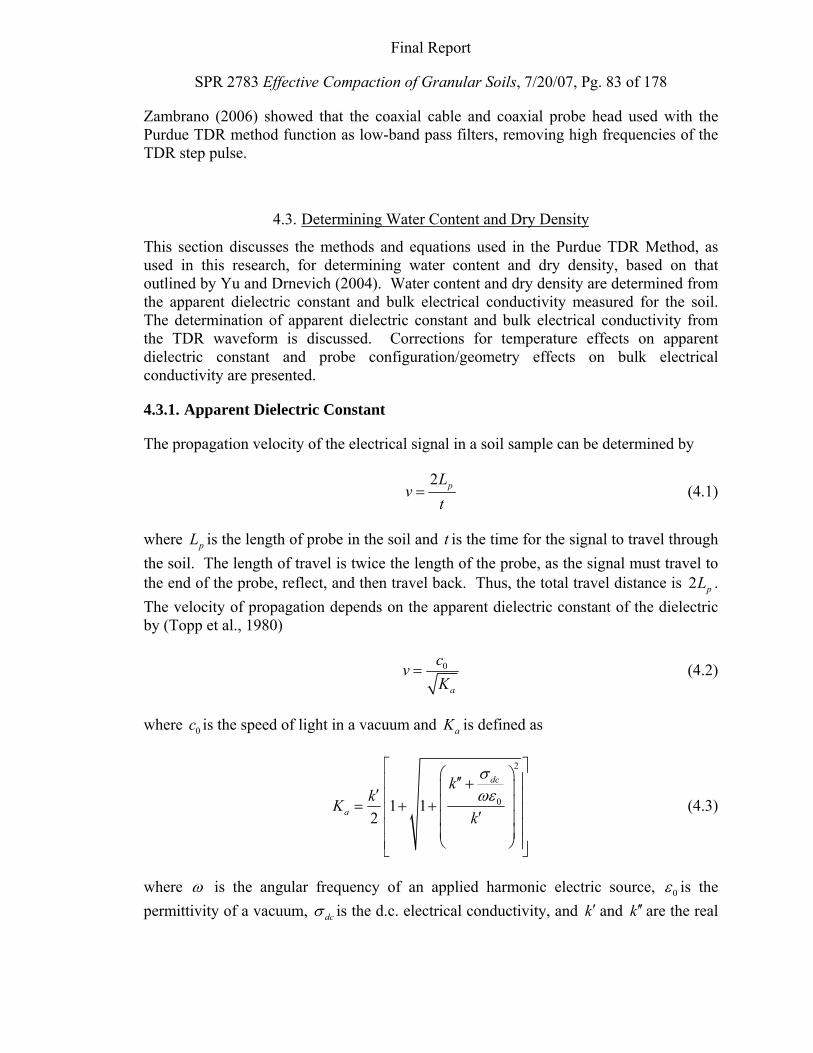
Final Report
SPR 2783 Effective Compaction of Granular Soils, 7/20/07, Pg. 83 of 178
Zambrano (2006) showed that the coaxial cable and coaxial probe head used with the Purdue TDR method function as low-band pass filters, removing high frequencies of the TDR step pulse.
4.3. Determining Water Content and Dry Density
This section discusses the methods and equations used in the Purdue TDR Method, as used in this research, for determining water content and dry density, based on that outlined by Yu and Drnevich (2004). Water content and dry density are determined from the apparent dielectric constant and bulk electrical conductivity measured for the soil. The determination of apparent dielectric constant and bulk electrical conductivity from the TDR waveform is discussed. Corrections for temperature effects on apparent dielectric constant and probe configuration/geometry effects on bulk electrical conductivity are presented.
4.3.1. Apparent Dielectric Constant
The propagation velocity of the electrical signal in a soil sample can be determined by
2 pL
vt
= (4.1)
where pL is the length of probe in the soil and t is the time for the signal to travel through the soil. The length of travel is twice the length of the probe, as the signal must travel to the end of the probe, reflect, and then travel back. Thus, the total travel distance is 2 pL . The velocity of propagation depends on the apparent dielectric constant of the dielectric by (Topp et al., 1980)
0
a
cvK
= (4.2)
where 0c is the speed of light in a vacuum and aK is defined as
2
01 12
dc
a
kkK
k
σωε
⎡ ⎤⎛ ⎞⎢ ⎥′′ +⎜ ⎟′ ⎢ ⎥⎜ ⎟= + +⎢ ⎥′⎜ ⎟⎢ ⎥⎜ ⎟⎝ ⎠⎢ ⎥⎣ ⎦
(4.3)
where ω is the angular frequency of an applied harmonic electric source, 0ε is the permittivity of a vacuum, dcσ is the d.c. electrical conductivity, and k ′ and k′′are the real
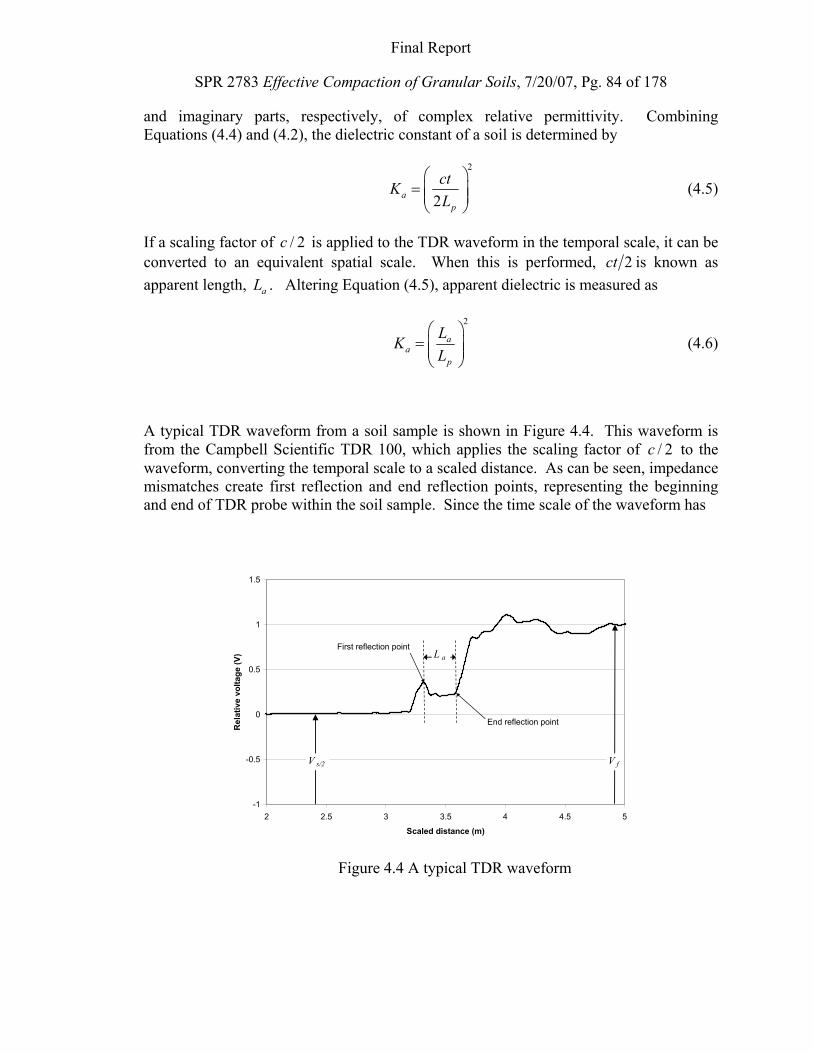
Final Report
SPR 2783 Effective Compaction of Granular Soils, 7/20/07, Pg. 84 of 178
and imaginary parts, respectively, of complex relative permittivity. Combining Equations (4.4) and (4.2), the dielectric constant of a soil is determined by
2
2ap
ctKL
⎛ ⎞= ⎜ ⎟⎜ ⎟⎝ ⎠
(4.5)
If a scaling factor of / 2c is applied to the TDR waveform in the temporal scale, it can be converted to an equivalent spatial scale. When this is performed, 2ct is known as apparent length, aL . Altering Equation (4.5), apparent dielectric is measured as
2
aa
p
LKL
⎛ ⎞= ⎜ ⎟⎜ ⎟⎝ ⎠
(4.6)
A typical TDR waveform from a soil sample is shown in Figure 4.4. This waveform is from the Campbell Scientific TDR 100, which applies the scaling factor of / 2c to the waveform, converting the temporal scale to a scaled distance. As can be seen, impedance mismatches create first reflection and end reflection points, representing the beginning and end of TDR probe within the soil sample. Since the time scale of the waveform has
-1
-0.5
0
0.5
1
1.5
2 2.5 3 3.5 4 4.5 5
Scaled distance (m)
Rel
ativ
e vo
ltage
(V)
V s/2 V f
First reflection point
End reflection point
L a
Figure 4.4 A typical TDR waveform
Final Report
SPR 2783 Effective Compaction of Granular Soils, 7/20/07, Pg. 85 of 178
been converted to an apparent distance scale, the apparent length of the sample is retrieved from the plot, reflecting the time for the electrical signal to travel through the sample. aK is computed from Equation (4.6).
4.3.2. Bulk Electrical Conductivity
According to Giese and Tiemann (1975), bulk electrical conductivity can be computed from the long-term response of a TDR system with a soil sample as the impedance end load, by
1 1b
s
f
VECC V⎛ ⎞
= −⎜ ⎟⎜ ⎟⎝ ⎠
(4.7)
where sV is the source voltage, fV is the long-term constant voltage, C is a system parameter considering geometry and internal resistance. For a coaxial system,
2
ln
p s
o
i
L RC
rr
π=
⎛ ⎞⎜ ⎟⎝ ⎠
(4.8)
where sR is the internal resistance of the pulse generator, and ir and or being the inner and outer radius of the conductors, respectively. The source voltage and long-term voltage can be seen in Figure 4.4 for the TDR waveform.
Conductivity is a property of a material and should not change with geometry. However, by Equation (4.7) the measurement technique causes the measurement of conductivity to depend on geometry. TDR methods typically assume a coaxial probe configuration; however, this is not always true, which will lead to inaccurate measurements of conductivity. Section 4.6 discusses corrections for various probe configurations and geometries.
4.3.3. Temperature Corrections for Ka
Measurement of apparent dielectric constant, aK , of soils is affected by temperature as shown by Drnevich et al. (2001). Generally, cohesionless soils, sands, showed a decrease in apparent dielectric constant with temperature, similar to that of water, but less pronounced. The opposite was true for cohesive soils, in which apparent dielectric constant increased with increase in temperature. To account for this affect, they proposed a linear temperature correction as
,20 ,a C a T C
K K TCF= × (4.9)
Final Report
SPR 2783 Effective Compaction of Granular Soils, 7/20/07, Pg. 86 of 178
where Temperature Correction FactorTCR =
,0.97 0.0015 test CT °= + for cohesionless soils, ,4 40test CC T C°° ≤ ≤ °
,1.10 0.005 test CT °= − for cohesive soils, ,4 40test CC T C°° ≤ ≤ °
Temperature corrections are typically quite small, therefore, Drnevich et al. (2001) recommended that they need not be applied if ,15 25test CC T C°° ≤ ≤ ° . Yu (2003) incorporated this temperature correction into the TDR waveform interpretation software PMTDR-SM.
4.3.4. Semi-empirical Calibration Equations
Water content and dry density are related to apparent dielectric constant and bulk electrical conductivity, as discussed by Yu and Drnevich (2004), by the linear relationships of
wa
d
K a bwρρ
= + (4.10)
and
wb
d
EC c dwρρ
= + (4.11)
where wρ is the density of water, dρ is the dry density of soil, w is the gravimetric water content, and a , b , c , and d are soil specific calibration constants. The four constants are determined by linear fitting of the laboratory compaction data at different water contents.
After performing calibration for a soil to determine the calibration constants, water content and dry density can be computed by solving Equations (4.10) and (4.11) simultaneously, giving
a b
b a
c K a ECw
b EC d K−
=−
(4.12)
and
a bd w
d K b ECad cb
ρ ρ−
=−
(4.13)
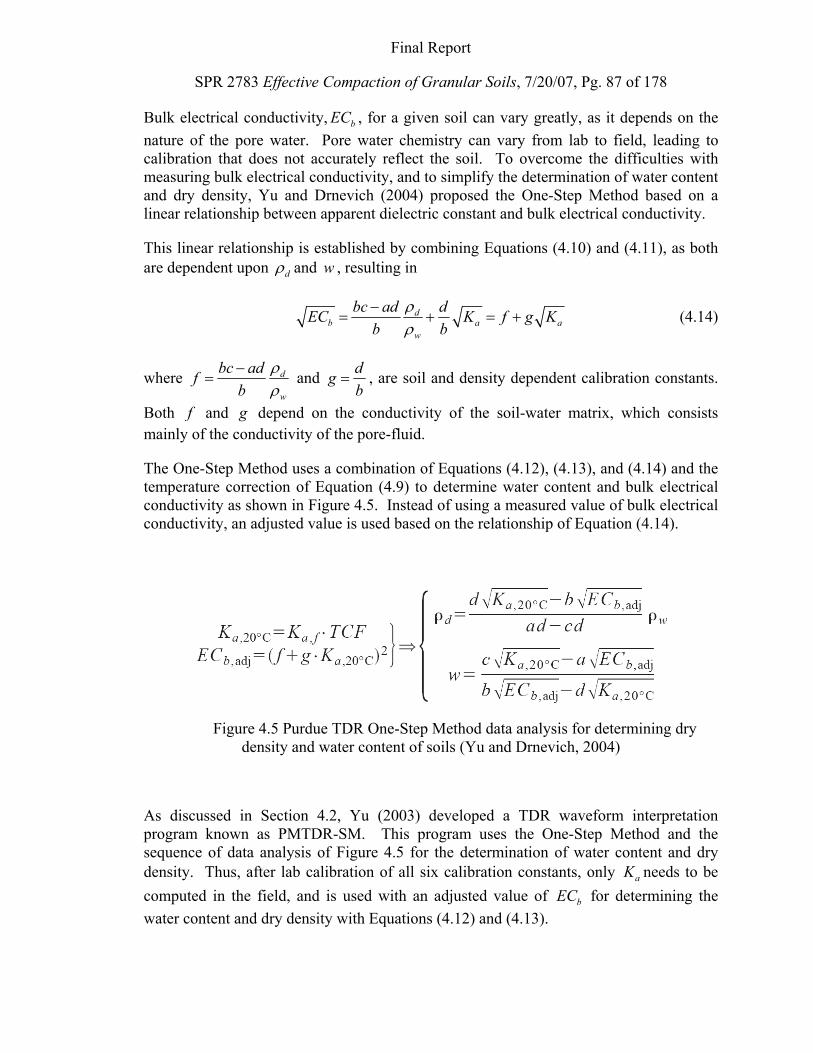
Final Report
SPR 2783 Effective Compaction of Granular Soils, 7/20/07, Pg. 87 of 178
Bulk electrical conductivity, bEC , for a given soil can vary greatly, as it depends on the nature of the pore water. Pore water chemistry can vary from lab to field, leading to calibration that does not accurately reflect the soil. To overcome the difficulties with measuring bulk electrical conductivity, and to simplify the determination of water content and dry density, Yu and Drnevich (2004) proposed the One-Step Method based on a linear relationship between apparent dielectric constant and bulk electrical conductivity.
This linear relationship is established by combining Equations (4.10) and (4.11), as both are dependent upon dρ and w , resulting in
db a a
w
bc ad dEC K f g Kb b
ρρ
−= + = + (4.14)
where d
w
bc adfb
ρρ
−= and dg
b= , are soil and density dependent calibration constants.
Both f and g depend on the conductivity of the soil-water matrix, which consists mainly of the conductivity of the pore-fluid.
The One-Step Method uses a combination of Equations (4.12), (4.13), and (4.14) and the temperature correction of Equation (4.9) to determine water content and bulk electrical conductivity as shown in Figure 4.5. Instead of using a measured value of bulk electrical conductivity, an adjusted value is used based on the relationship of Equation (4.14).
Figure 4.5 Purdue TDR One-Step Method data analysis for determining dry density and water content of soils (Yu and Drnevich, 2004)
As discussed in Section 4.2, Yu (2003) developed a TDR waveform interpretation program known as PMTDR-SM. This program uses the One-Step Method and the sequence of data analysis of Figure 4.5 for the determination of water content and dry density. Thus, after lab calibration of all six calibration constants, only aK needs to be computed in the field, and is used with an adjusted value of bEC for determining the water content and dry density with Equations (4.12) and (4.13).
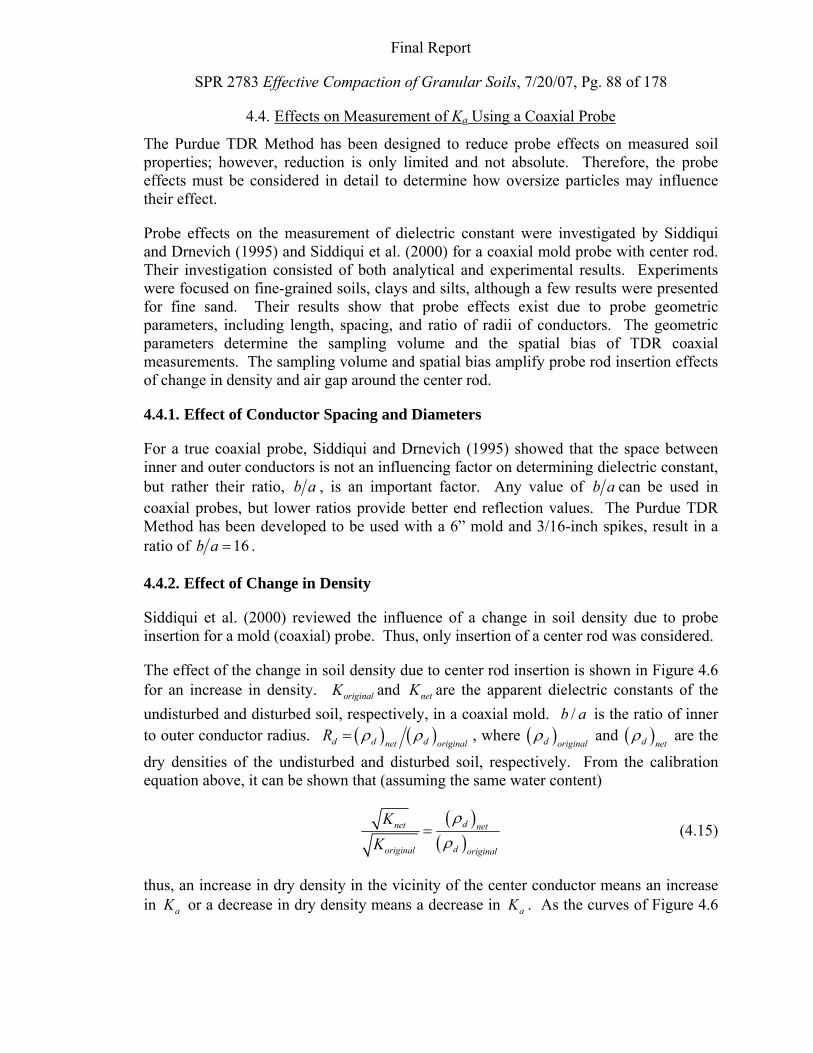
Final Report
SPR 2783 Effective Compaction of Granular Soils, 7/20/07, Pg. 88 of 178
4.4. Effects on Measurement of Ka Using a Coaxial Probe
The Purdue TDR Method has been designed to reduce probe effects on measured soil properties; however, reduction is only limited and not absolute. Therefore, the probe effects must be considered in detail to determine how oversize particles may influence their effect.
Probe effects on the measurement of dielectric constant were investigated by Siddiqui and Drnevich (1995) and Siddiqui et al. (2000) for a coaxial mold probe with center rod. Their investigation consisted of both analytical and experimental results. Experiments were focused on fine-grained soils, clays and silts, although a few results were presented for fine sand. Their results show that probe effects exist due to probe geometric parameters, including length, spacing, and ratio of radii of conductors. The geometric parameters determine the sampling volume and the spatial bias of TDR coaxial measurements. The sampling volume and spatial bias amplify probe rod insertion effects of change in density and air gap around the center rod.
4.4.1. Effect of Conductor Spacing and Diameters
For a true coaxial probe, Siddiqui and Drnevich (1995) showed that the space between inner and outer conductors is not an influencing factor on determining dielectric constant, but rather their ratio, b a , is an important factor. Any value of b a can be used in coaxial probes, but lower ratios provide better end reflection values. The Purdue TDR Method has been developed to be used with a 6” mold and 3/16-inch spikes, result in a ratio of 16b a = .
4.4.2. Effect of Change in Density
Siddiqui et al. (2000) reviewed the influence of a change in soil density due to probe insertion for a mold (coaxial) probe. Thus, only insertion of a center rod was considered.
The effect of the change in soil density due to center rod insertion is shown in Figure 4.6 for an increase in density. originalK and netK are the apparent dielectric constants of the undisturbed and disturbed soil, respectively, in a coaxial mold. /b a is the ratio of inner to outer conductor radius. ( ) ( )d d dnet original
R ρ ρ= , where ( )d originalρ and ( )d net
ρ are the
dry densities of the undisturbed and disturbed soil, respectively. From the calibration equation above, it can be shown that (assuming the same water content)
( )
( )dnet net
doriginal original
KK
ρρ
= (4.15)
thus, an increase in dry density in the vicinity of the center conductor means an increase in aK or a decrease in dry density means a decrease in aK . As the curves of Figure 4.6
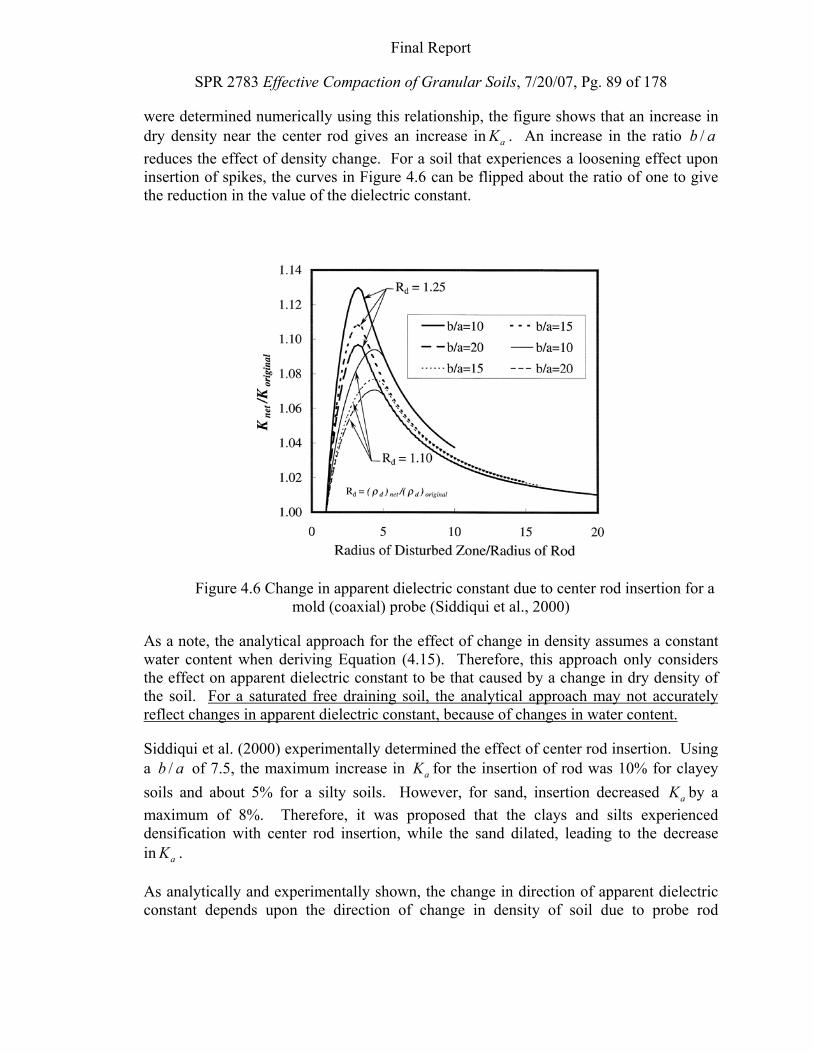
Final Report
SPR 2783 Effective Compaction of Granular Soils, 7/20/07, Pg. 89 of 178
were determined numerically using this relationship, the figure shows that an increase in dry density near the center rod gives an increase in aK . An increase in the ratio /b a reduces the effect of density change. For a soil that experiences a loosening effect upon insertion of spikes, the curves in Figure 4.6 can be flipped about the ratio of one to give the reduction in the value of the dielectric constant.
Figure 4.6 Change in apparent dielectric constant due to center rod insertion for a mold (coaxial) probe (Siddiqui et al., 2000)
As a note, the analytical approach for the effect of change in density assumes a constant water content when deriving Equation (4.15). Therefore, this approach only considers the effect on apparent dielectric constant to be that caused by a change in dry density of the soil. For a saturated free draining soil, the analytical approach may not accurately reflect changes in apparent dielectric constant, because of changes in water content.
Siddiqui et al. (2000) experimentally determined the effect of center rod insertion. Using a /b a of 7.5, the maximum increase in aK for the insertion of rod was 10% for clayey soils and about 5% for a silty soils. However, for sand, insertion decreased aK by a maximum of 8%. Therefore, it was proposed that the clays and silts experienced densification with center rod insertion, while the sand dilated, leading to the decrease in aK .
As analytically and experimentally shown, the change in direction of apparent dielectric constant depends upon the direction of change in density of soil due to probe rod
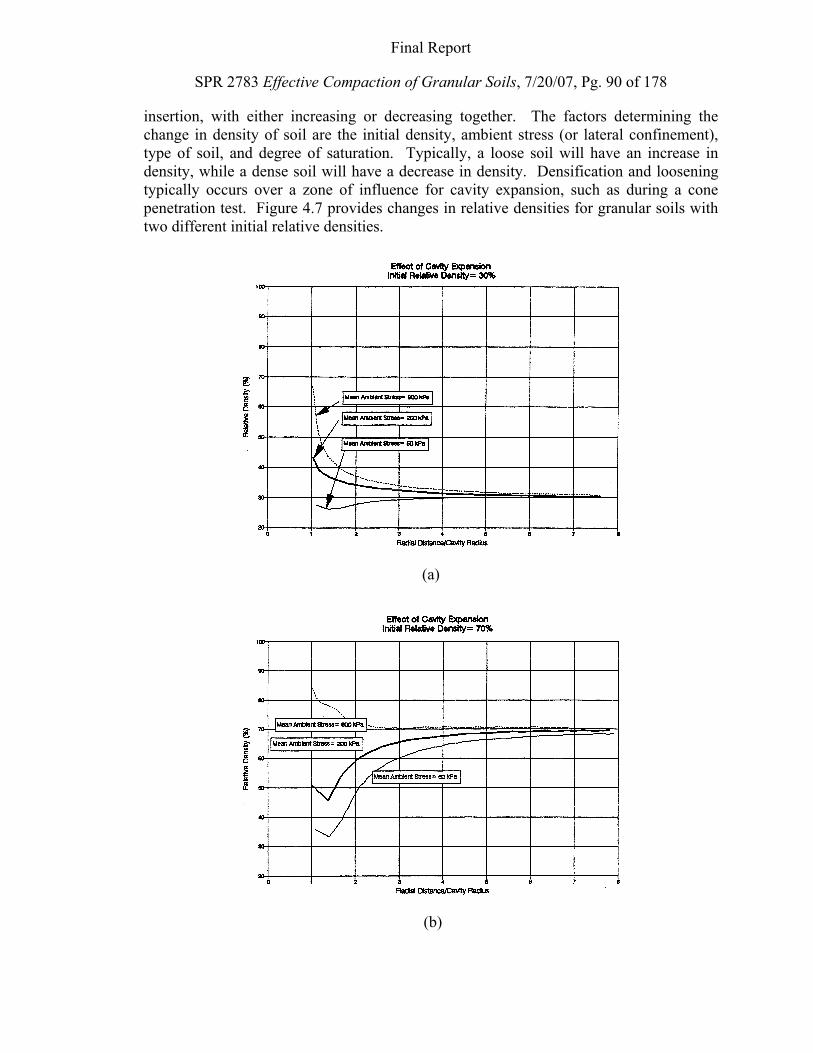
Final Report
SPR 2783 Effective Compaction of Granular Soils, 7/20/07, Pg. 90 of 178
insertion, with either increasing or decreasing together. The factors determining the change in density of soil are the initial density, ambient stress (or lateral confinement), type of soil, and degree of saturation. Typically, a loose soil will have an increase in density, while a dense soil will have a decrease in density. Densification and loosening typically occurs over a zone of influence for cavity expansion, such as during a cone penetration test. Figure 4.7 provides changes in relative densities for granular soils with two different initial relative densities.
(a)
(b)
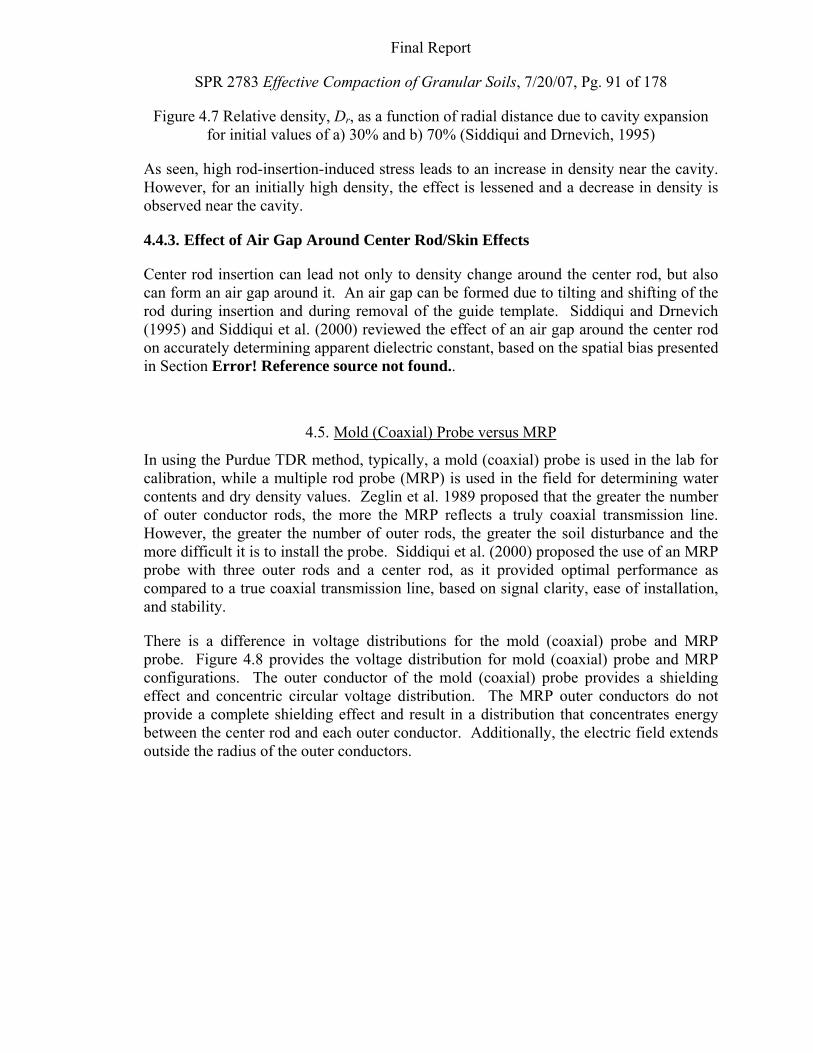
Final Report
SPR 2783 Effective Compaction of Granular Soils, 7/20/07, Pg. 91 of 178
Figure 4.7 Relative density, Dr, as a function of radial distance due to cavity expansion for initial values of a) 30% and b) 70% (Siddiqui and Drnevich, 1995)
As seen, high rod-insertion-induced stress leads to an increase in density near the cavity. However, for an initially high density, the effect is lessened and a decrease in density is observed near the cavity.
4.4.3. Effect of Air Gap Around Center Rod/Skin Effects
Center rod insertion can lead not only to density change around the center rod, but also can form an air gap around it. An air gap can be formed due to tilting and shifting of the rod during insertion and during removal of the guide template. Siddiqui and Drnevich (1995) and Siddiqui et al. (2000) reviewed the effect of an air gap around the center rod on accurately determining apparent dielectric constant, based on the spatial bias presented in Section Error! Reference source not found..
4.5. Mold (Coaxial) Probe versus MRP
In using the Purdue TDR method, typically, a mold (coaxial) probe is used in the lab for calibration, while a multiple rod probe (MRP) is used in the field for determining water contents and dry density values. Zeglin et al. 1989 proposed that the greater the number of outer conductor rods, the more the MRP reflects a truly coaxial transmission line. However, the greater the number of outer rods, the greater the soil disturbance and the more difficult it is to install the probe. Siddiqui et al. (2000) proposed the use of an MRP probe with three outer rods and a center rod, as it provided optimal performance as compared to a true coaxial transmission line, based on signal clarity, ease of installation, and stability.
There is a difference in voltage distributions for the mold (coaxial) probe and MRP probe. Figure 4.8 provides the voltage distribution for mold (coaxial) probe and MRP configurations. The outer conductor of the mold (coaxial) probe provides a shielding effect and concentric circular voltage distribution. The MRP outer conductors do not provide a complete shielding effect and result in a distribution that concentrates energy between the center rod and each outer conductor. Additionally, the electric field extends outside the radius of the outer conductors.
Final Report
SPR 2783 Effective Compaction of Granular Soils, 7/20/07, Pg. 92 of 178
(a) (b)
Figure 4.8 a) Mold (coaxial) probe and b) MRP configurations with associated electrical potential or voltage distribution (Lin et al., 2006)
The variation in the voltage distributions between the two probe configurations will have an effect on the measurement of the apparent dielectric constant and bulk electrical conductivity. We next attempt to provide a qualitative understanding of how the lateral spatial sensitivity can vary between the two types of probes due to the electrical potential or voltage (or electric field) distribution between and around the conductors of the probes.
A spatial bias exists for the mold (coaxial) probe, as discussed in Section 4.4, in which the area near the center rod contributes more measurements. As the MRP still has somewhat of a concentric distribution, it is expected to show a similar bias. However, the MRP requires the installation of three additional spikes, which can cause density changes and produce air gaps, just as the mold (coaxial) probe. The spatial bias is somewhat advantageous here, in that the influence of installing outer rods should be less than the center rod, leading to the MRP to behave more like the mold (coaxial) probe when performing measurements. However, the MRP has a high concentration of energy between the center and each outer conductor rod. These locations are where the most change in soil density is likely to occur due to concentric cavity expansion from the insertion of each spike. The greater amount of change in soil density may lead to even a greater error in measurement than with the mold (coaxial) probe.
The sampling volume of the mold (coaxial) probe is limited to within the mold due to the shielding effect of the outer conductor. However, for the MRP configuration the sampling volume is not concentric and leaves the bounds of the radius of the outer conductor rods.
Final Report
SPR 2783 Effective Compaction of Granular Soils, 7/20/07, Pg. 93 of 178
4.6. ECb Correction for Probe Configuration
The varying voltage distributions between probe configurations will have an effect on the measurement of electrical conductivity, as electrical flow will differ for the different distributions for the same potential difference between inner and outer conductors. Most TDR systems assume a coaxial probe configuration, with geometry effects as given in Equation (4.7). Therefore, corrections need to be made to measured values, as the calculation of bulk electrical conductivity is not properly reflecting the effects of probe configuration.
Dallinger (2006) investigated effects of TDR probe geometry and boundaries of probe installation on the determination of the bulk electrical conductivity,
bEC , for coaxial
mold probe and multiple rod probe (MRP) configurations. The analysis used is based on the assumption that water flow and electrical flow are similar, in that flow lines of water molecules under a hydraulic gradient are similar to the flow lines of electrical charges under a voltage gradient, with the flow being controlled by the nature of the material and its boundaries.
The methods of flownets is a commonly used method for characterizing and quantifying hydraulic flow in soils and relies on the shape factor, which is the number of flow channels, fn , to number of head drops, dn . Similarly, the electrical flow in the soil can be assumed to have the shape factor of
2'ln
f
d o
i
nC
n rr
π= =
⎛ ⎞⎜ ⎟⎝ ⎠
(4.16)
for a coaxial system based on Equation (4.8). Dallinger (2006) solved Equation (4.16) for the ratio of the outer to inner conductor which provided an equivalent ratio of radii for various shape factors associated with symmetrical, but non-coaxial probe configurations.
.
exp(2 /( / ))of d
i equiv
r n nr
π⎛ ⎞
=⎜ ⎟⎝ ⎠
(4.17)
Dallinger (2006) used a finite element method for groundwater flow to directly compute the shape factor and equivalent inner and outer conductor ratios for various probe configurations. Results are as shown in Table 4.1. True coaxial transmission lines of the 4-inch and 6-inch molds with a center spike are included. Additionally, MRP configurations with a 6-inch mold, 11-inch mold and a semi-infinite boundary are included. The semi-infinite boundary is representative of the MRP configuration being used in the field for compaction control.
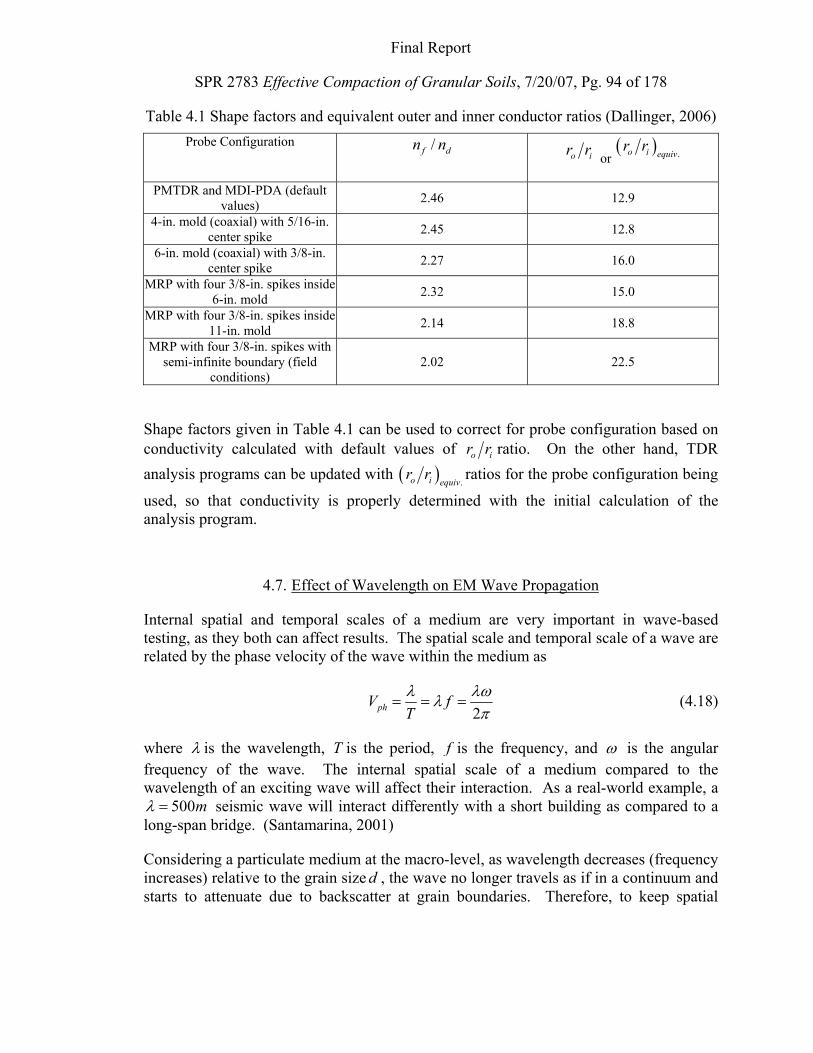
Final Report
SPR 2783 Effective Compaction of Granular Soils, 7/20/07, Pg. 94 of 178
Table 4.1 Shape factors and equivalent outer and inner conductor ratios (Dallinger, 2006) Probe Configuration /f dn n
o ir r or ( ) .o i equivr r
PMTDR and MDI-PDA (default values) 2.46 12.9
4-in. mold (coaxial) with 5/16-in. center spike 2.45 12.8
6-in. mold (coaxial) with 3/8-in. center spike 2.27 16.0
MRP with four 3/8-in. spikes inside 6-in. mold 2.32 15.0
MRP with four 3/8-in. spikes inside 11-in. mold 2.14 18.8
MRP with four 3/8-in. spikes with semi-infinite boundary (field
conditions) 2.02 22.5
Shape factors given in Table 4.1 can be used to correct for probe configuration based on conductivity calculated with default values of o ir r ratio. On the other hand, TDR analysis programs can be updated with ( ) .o i equiv
r r ratios for the probe configuration being
used, so that conductivity is properly determined with the initial calculation of the analysis program.
4.7. Effect of Wavelength on EM Wave Propagation
Internal spatial and temporal scales of a medium are very important in wave-based testing, as they both can affect results. The spatial scale and temporal scale of a wave are related by the phase velocity of the wave within the medium as
2phV f
Tλ λωλ
π= = = (4.18)
where λ is the wavelength, T is the period, f is the frequency, and ω is the angular frequency of the wave. The internal spatial scale of a medium compared to the wavelength of an exciting wave will affect their interaction. As a real-world example, a
500mλ = seismic wave will interact differently with a short building as compared to a long-span bridge. (Santamarina, 2001)
Considering a particulate medium at the macro-level, as wavelength decreases (frequency increases) relative to the grain size d , the wave no longer travels as if in a continuum and starts to attenuate due to backscatter at grain boundaries. Therefore, to keep spatial
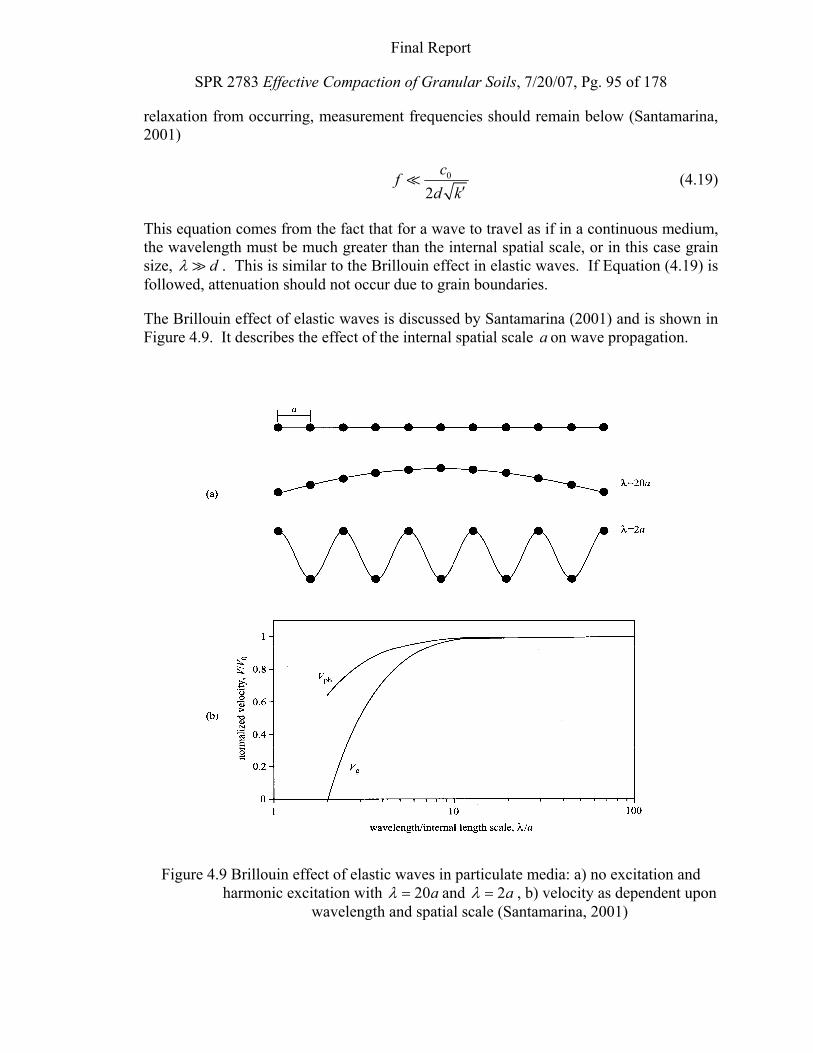
Final Report
SPR 2783 Effective Compaction of Granular Soils, 7/20/07, Pg. 95 of 178
relaxation from occurring, measurement frequencies should remain below (Santamarina, 2001)
0
2cf
d k′ (4.19)
This equation comes from the fact that for a wave to travel as if in a continuous medium, the wavelength must be much greater than the internal spatial scale, or in this case grain size, dλ . This is similar to the Brillouin effect in elastic waves. If Equation (4.19) is followed, attenuation should not occur due to grain boundaries.
The Brillouin effect of elastic waves is discussed by Santamarina (2001) and is shown in Figure 4.9. It describes the effect of the internal spatial scale a on wave propagation.
Figure 4.9 Brillouin effect of elastic waves in particulate media: a) no excitation and harmonic excitation with 20aλ = and 2aλ = , b) velocity as dependent upon
wavelength and spatial scale (Santamarina, 2001)
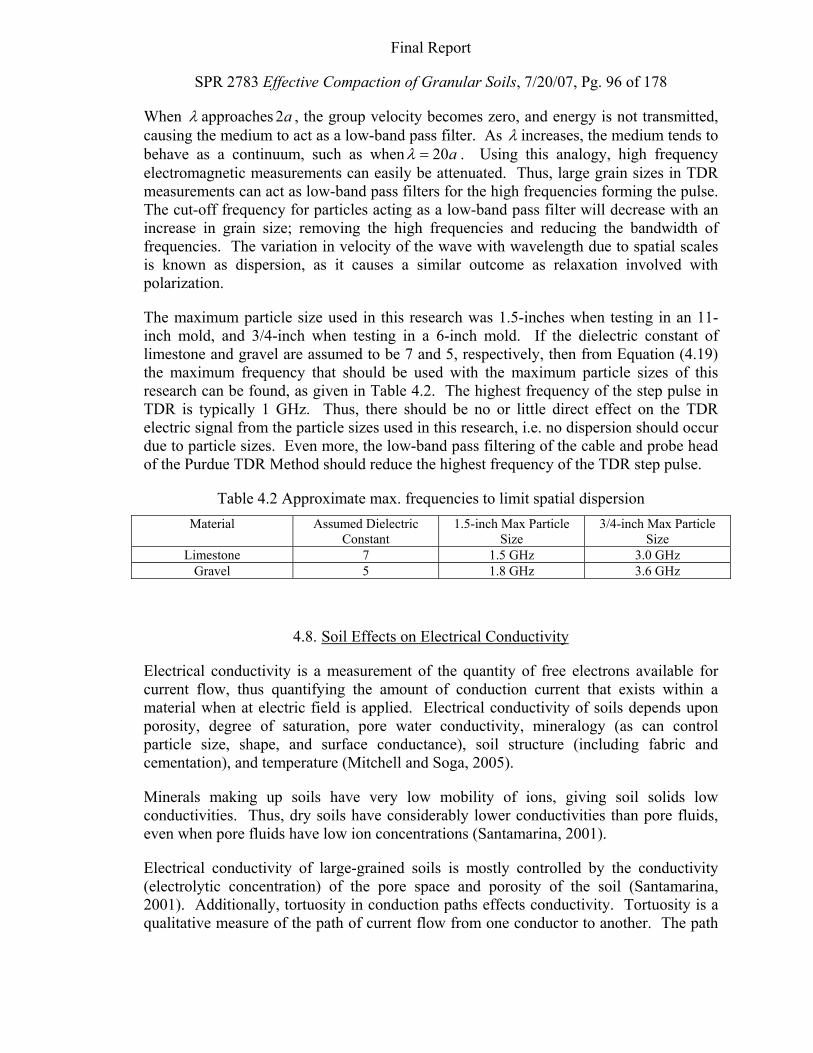
Final Report
SPR 2783 Effective Compaction of Granular Soils, 7/20/07, Pg. 96 of 178
When λ approaches 2a , the group velocity becomes zero, and energy is not transmitted, causing the medium to act as a low-band pass filter. As λ increases, the medium tends to behave as a continuum, such as when 20aλ = . Using this analogy, high frequency electromagnetic measurements can easily be attenuated. Thus, large grain sizes in TDR measurements can act as low-band pass filters for the high frequencies forming the pulse. The cut-off frequency for particles acting as a low-band pass filter will decrease with an increase in grain size; removing the high frequencies and reducing the bandwidth of frequencies. The variation in velocity of the wave with wavelength due to spatial scales is known as dispersion, as it causes a similar outcome as relaxation involved with polarization.
The maximum particle size used in this research was 1.5-inches when testing in an 11-inch mold, and 3/4-inch when testing in a 6-inch mold. If the dielectric constant of limestone and gravel are assumed to be 7 and 5, respectively, then from Equation (4.19) the maximum frequency that should be used with the maximum particle sizes of this research can be found, as given in Table 4.2. The highest frequency of the step pulse in TDR is typically 1 GHz. Thus, there should be no or little direct effect on the TDR electric signal from the particle sizes used in this research, i.e. no dispersion should occur due to particle sizes. Even more, the low-band pass filtering of the cable and probe head of the Purdue TDR Method should reduce the highest frequency of the TDR step pulse.
Table 4.2 Approximate max. frequencies to limit spatial dispersion Material Assumed Dielectric
Constant 1.5-inch Max Particle
Size 3/4-inch Max Particle
Size Limestone 7 1.5 GHz 3.0 GHz
Gravel 5 1.8 GHz 3.6 GHz
4.8. Soil Effects on Electrical Conductivity
Electrical conductivity is a measurement of the quantity of free electrons available for current flow, thus quantifying the amount of conduction current that exists within a material when at electric field is applied. Electrical conductivity of soils depends upon porosity, degree of saturation, pore water conductivity, mineralogy (as can control particle size, shape, and surface conductance), soil structure (including fabric and cementation), and temperature (Mitchell and Soga, 2005).
Minerals making up soils have very low mobility of ions, giving soil solids low conductivities. Thus, dry soils have considerably lower conductivities than pore fluids, even when pore fluids have low ion concentrations (Santamarina, 2001).
Electrical conductivity of large-grained soils is mostly controlled by the conductivity (electrolytic concentration) of the pore space and porosity of the soil (Santamarina, 2001). Additionally, tortuosity in conduction paths effects conductivity. Tortuosity is a qualitative measure of the path of current flow from one conductor to another. The path

Final Report
SPR 2783 Effective Compaction of Granular Soils, 7/20/07, Pg. 97 of 178
may vary with granular materials depending upon particle sizes and gradations. However, tortuosity does not have near the effect on electrical conductivity as the composition of the pore water.
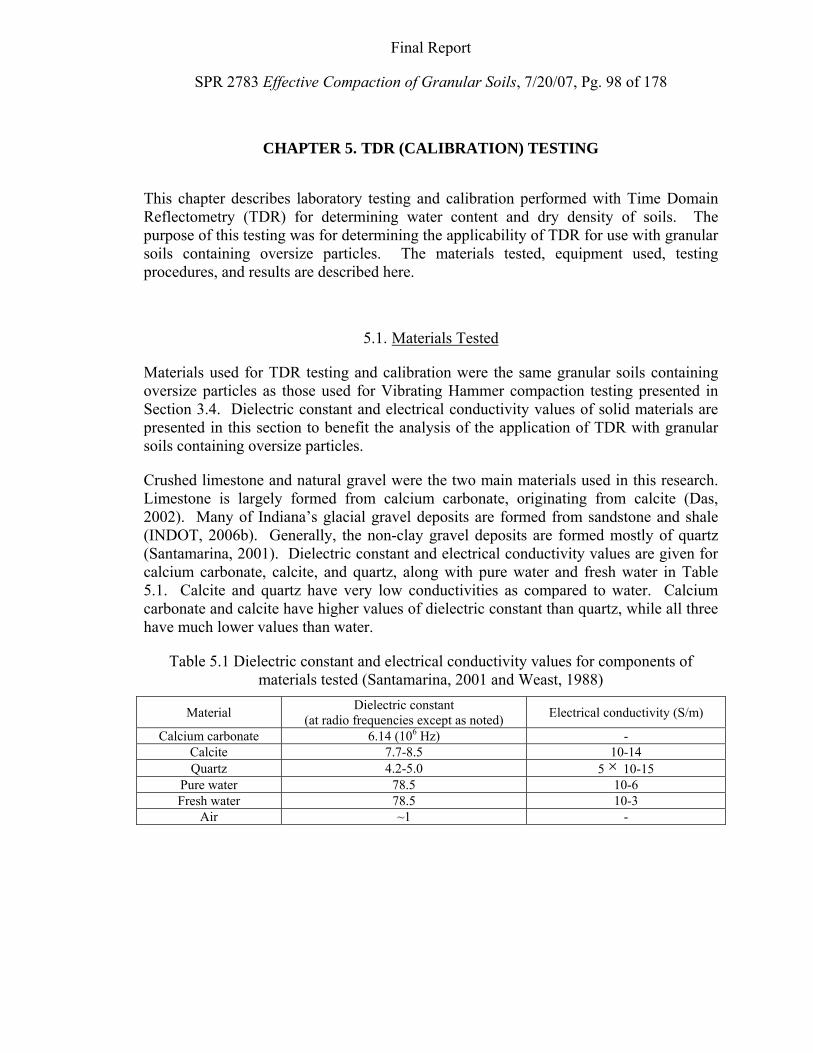
Final Report
SPR 2783 Effective Compaction of Granular Soils, 7/20/07, Pg. 98 of 178
CHAPTER 5. TDR (CALIBRATION) TESTING
This chapter describes laboratory testing and calibration performed with Time Domain Reflectometry (TDR) for determining water content and dry density of soils. The purpose of this testing was for determining the applicability of TDR for use with granular soils containing oversize particles. The materials tested, equipment used, testing procedures, and results are described here.
5.1. Materials Tested
Materials used for TDR testing and calibration were the same granular soils containing oversize particles as those used for Vibrating Hammer compaction testing presented in Section 3.4. Dielectric constant and electrical conductivity values of solid materials are presented in this section to benefit the analysis of the application of TDR with granular soils containing oversize particles.
Crushed limestone and natural gravel were the two main materials used in this research. Limestone is largely formed from calcium carbonate, originating from calcite (Das, 2002). Many of Indiana’s glacial gravel deposits are formed from sandstone and shale (INDOT, 2006b). Generally, the non-clay gravel deposits are formed mostly of quartz (Santamarina, 2001). Dielectric constant and electrical conductivity values are given for calcium carbonate, calcite, and quartz, along with pure water and fresh water in Table 5.1. Calcite and quartz have very low conductivities as compared to water. Calcium carbonate and calcite have higher values of dielectric constant than quartz, while all three have much lower values than water.
Table 5.1 Dielectric constant and electrical conductivity values for components of materials tested (Santamarina, 2001 and Weast, 1988)
Material Dielectric constant (at radio frequencies except as noted) Electrical conductivity (S/m)
Calcium carbonate 6.14 (106 Hz) - Calcite 7.7-8.5 10-14 Quartz 4.2-5.0 5 × 10-15
Pure water 78.5 10-6 Fresh water 78.5 10-3
Air ~1 -
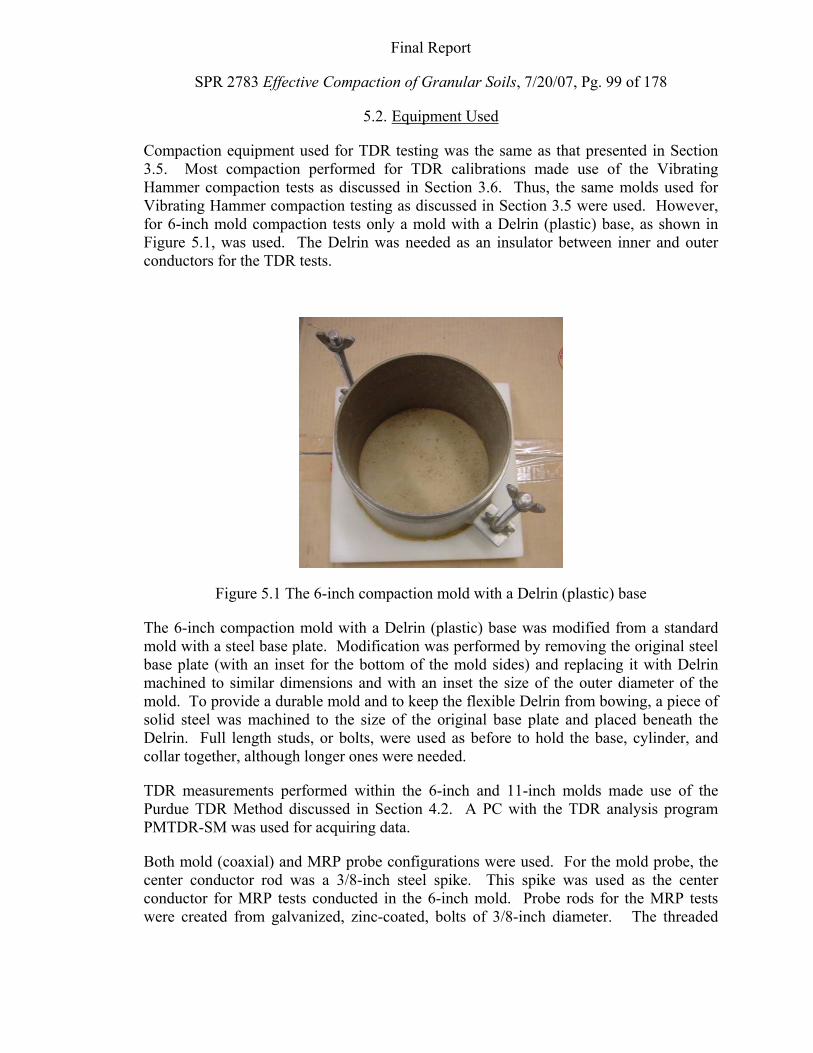
Final Report
SPR 2783 Effective Compaction of Granular Soils, 7/20/07, Pg. 99 of 178
5.2. Equipment Used
Compaction equipment used for TDR testing was the same as that presented in Section 3.5. Most compaction performed for TDR calibrations made use of the Vibrating Hammer compaction tests as discussed in Section 3.6. Thus, the same molds used for Vibrating Hammer compaction testing as discussed in Section 3.5 were used. However, for 6-inch mold compaction tests only a mold with a Delrin (plastic) base, as shown in Figure 5.1, was used. The Delrin was needed as an insulator between inner and outer conductors for the TDR tests.
Figure 5.1 The 6-inch compaction mold with a Delrin (plastic) base
The 6-inch compaction mold with a Delrin (plastic) base was modified from a standard mold with a steel base plate. Modification was performed by removing the original steel base plate (with an inset for the bottom of the mold sides) and replacing it with Delrin machined to similar dimensions and with an inset the size of the outer diameter of the mold. To provide a durable mold and to keep the flexible Delrin from bowing, a piece of solid steel was machined to the size of the original base plate and placed beneath the Delrin. Full length studs, or bolts, were used as before to hold the base, cylinder, and collar together, although longer ones were needed.
TDR measurements performed within the 6-inch and 11-inch molds made use of the Purdue TDR Method discussed in Section 4.2. A PC with the TDR analysis program PMTDR-SM was used for acquiring data.
Both mold (coaxial) and MRP probe configurations were used. For the mold probe, the center conductor rod was a 3/8-inch steel spike. This spike was used as the center conductor for MRP tests conducted in the 6-inch mold. Probe rods for the MRP tests were created from galvanized, zinc-coated, bolts of 3/8-inch diameter. The threaded
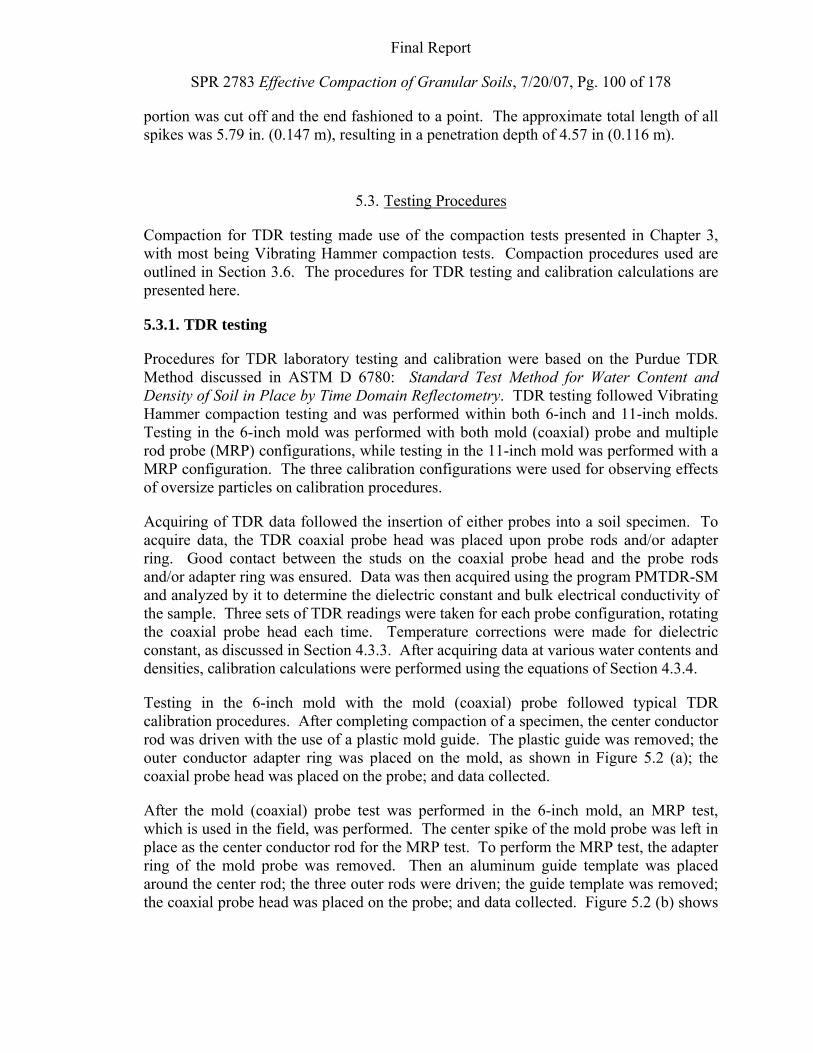
Final Report
SPR 2783 Effective Compaction of Granular Soils, 7/20/07, Pg. 100 of 178
portion was cut off and the end fashioned to a point. The approximate total length of all spikes was 5.79 in. (0.147 m), resulting in a penetration depth of 4.57 in (0.116 m).
5.3. Testing Procedures
Compaction for TDR testing made use of the compaction tests presented in Chapter 3, with most being Vibrating Hammer compaction tests. Compaction procedures used are outlined in Section 3.6. The procedures for TDR testing and calibration calculations are presented here.
5.3.1. TDR testing
Procedures for TDR laboratory testing and calibration were based on the Purdue TDR Method discussed in ASTM D 6780: Standard Test Method for Water Content and Density of Soil in Place by Time Domain Reflectometry. TDR testing followed Vibrating Hammer compaction testing and was performed within both 6-inch and 11-inch molds. Testing in the 6-inch mold was performed with both mold (coaxial) probe and multiple rod probe (MRP) configurations, while testing in the 11-inch mold was performed with a MRP configuration. The three calibration configurations were used for observing effects of oversize particles on calibration procedures.
Acquiring of TDR data followed the insertion of either probes into a soil specimen. To acquire data, the TDR coaxial probe head was placed upon probe rods and/or adapter ring. Good contact between the studs on the coaxial probe head and the probe rods and/or adapter ring was ensured. Data was then acquired using the program PMTDR-SM and analyzed by it to determine the dielectric constant and bulk electrical conductivity of the sample. Three sets of TDR readings were taken for each probe configuration, rotating the coaxial probe head each time. Temperature corrections were made for dielectric constant, as discussed in Section 4.3.3. After acquiring data at various water contents and densities, calibration calculations were performed using the equations of Section 4.3.4.
Testing in the 6-inch mold with the mold (coaxial) probe followed typical TDR calibration procedures. After completing compaction of a specimen, the center conductor rod was driven with the use of a plastic mold guide. The plastic guide was removed; the outer conductor adapter ring was placed on the mold, as shown in Figure 5.2 (a); the coaxial probe head was placed on the probe; and data collected.
After the mold (coaxial) probe test was performed in the 6-inch mold, an MRP test, which is used in the field, was performed. The center spike of the mold probe was left in place as the center conductor rod for the MRP test. To perform the MRP test, the adapter ring of the mold probe was removed. Then an aluminum guide template was placed around the center rod; the three outer rods were driven; the guide template was removed; the coaxial probe head was placed on the probe; and data collected. Figure 5.2 (b) shows
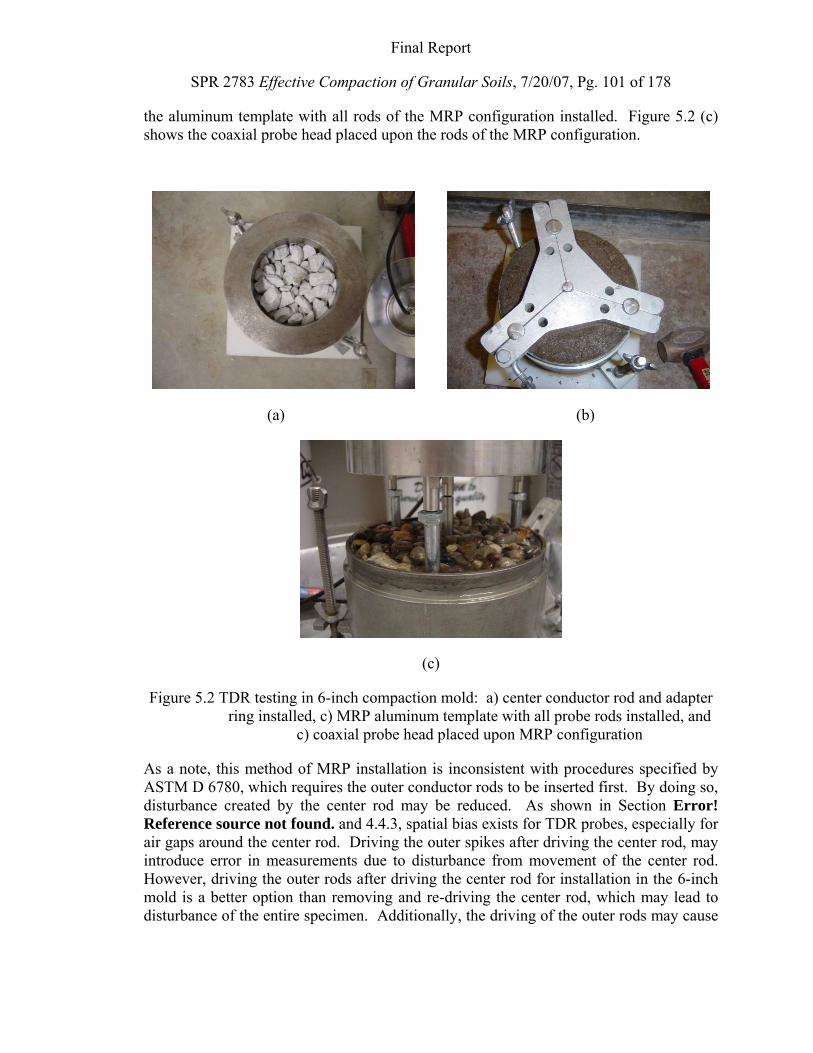
Final Report
SPR 2783 Effective Compaction of Granular Soils, 7/20/07, Pg. 101 of 178
the aluminum template with all rods of the MRP configuration installed. Figure 5.2 (c) shows the coaxial probe head placed upon the rods of the MRP configuration.
(a) (b)
(c)
Figure 5.2 TDR testing in 6-inch compaction mold: a) center conductor rod and adapter ring installed, c) MRP aluminum template with all probe rods installed, and
c) coaxial probe head placed upon MRP configuration
As a note, this method of MRP installation is inconsistent with procedures specified by ASTM D 6780, which requires the outer conductor rods to be inserted first. By doing so, disturbance created by the center rod may be reduced. As shown in Section Error! Reference source not found. and 4.4.3, spatial bias exists for TDR probes, especially for air gaps around the center rod. Driving the outer spikes after driving the center rod, may introduce error in measurements due to disturbance from movement of the center rod. However, driving the outer rods after driving the center rod for installation in the 6-inch mold is a better option than removing and re-driving the center rod, which may lead to disturbance of the entire specimen. Additionally, the driving of the outer rods may cause
Final Report
SPR 2783 Effective Compaction of Granular Soils, 7/20/07, Pg. 102 of 178
an increase in density of the entire specimen, not allowing any air gaps to form at the center. A major concern of MRP testing in the 6-inch mold is disturbance of the entire specimen, resulting inaccurate calibration. If the specimen is already in a fairly dense state, as is the case for highly compacted granular soils, loosening may occur causing a decrease in density of the specimen.
TDR Testing in the 11-inch compaction mold was performed using an MRP configuration that was installed by typical procedures used in the field (ASTM D 6780). The MRP was visually installed in the center of the mold, using four identical rods for inner and outer conductors. The aluminum guide template was placed on the surface of the specimen as would be done in the field. Outer conductor rods were driven first, followed by the center conductor rod. After all rods were driven, the guide template was removed, the coaxial probe head was placed on the probe, and data was collected. Figure 5.3 shows the MRP configuration installed in an 11-inch mold compacted specimen.
(a) (b)
Figure 5.3 TDR testing in 11-inch compaction mold with MRP configuration: a) all conductor rods installed, b) coaxial probe head placed upon conductor rods
The oversize particles in this research created problems for TDR procedures performed in the lab. Problems existed in both the 6-inch and 11-inch molds with the use of guides and adapter rings and the driving of spikes. As discussed in preparing the compacted specimens in Section 3.6, large particles may protrude above the top of the mold. These protrusions create problems in fitting the plastic guide and adapter ring of the 6-inch mold probe to the mold. This created difficulty in properly driving the center spike and being able to achieve good contacts all at the same time. Occasionally, the center spike had to be driven further after removing the plastic template or pulled upwards out of the specimen to create good contact. Typically, particles at the outer portion of the mold had to be rearranged, or even removed for the adapter ring to fit properly. The protrusions created difficulty for MRP testing in the 6-inch mold by not allowing the aluminum guide template to set properly upon the mold. For the 11-inch mold, the irregularity of the
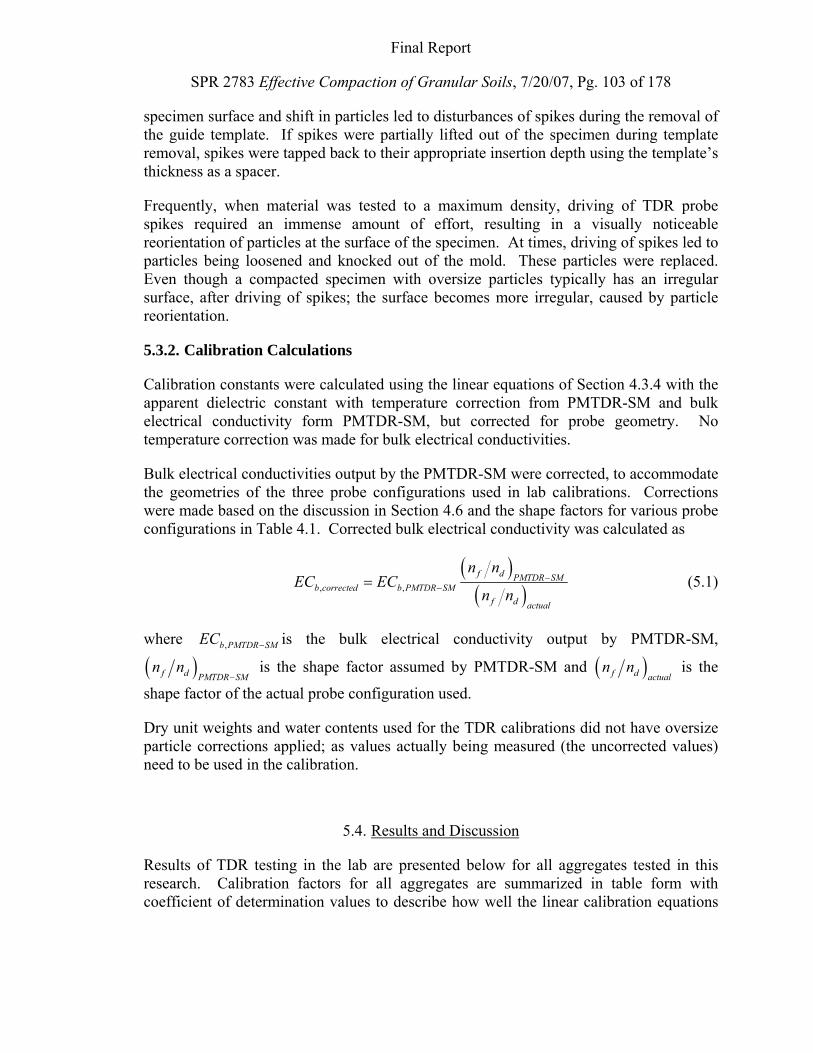
Final Report
SPR 2783 Effective Compaction of Granular Soils, 7/20/07, Pg. 103 of 178
specimen surface and shift in particles led to disturbances of spikes during the removal of the guide template. If spikes were partially lifted out of the specimen during template removal, spikes were tapped back to their appropriate insertion depth using the template’s thickness as a spacer.
Frequently, when material was tested to a maximum density, driving of TDR probe spikes required an immense amount of effort, resulting in a visually noticeable reorientation of particles at the surface of the specimen. At times, driving of spikes led to particles being loosened and knocked out of the mold. These particles were replaced. Even though a compacted specimen with oversize particles typically has an irregular surface, after driving of spikes; the surface becomes more irregular, caused by particle reorientation.
5.3.2. Calibration Calculations
Calibration constants were calculated using the linear equations of Section 4.3.4 with the apparent dielectric constant with temperature correction from PMTDR-SM and bulk electrical conductivity form PMTDR-SM, but corrected for probe geometry. No temperature correction was made for bulk electrical conductivities.
Bulk electrical conductivities output by the PMTDR-SM were corrected, to accommodate the geometries of the three probe configurations used in lab calibrations. Corrections were made based on the discussion in Section 4.6 and the shape factors for various probe configurations in Table 4.1. Corrected bulk electrical conductivity was calculated as
( )( ), ,f d PMTDR SM
b corrected b PMTDR SMf d actual
n nEC EC
n n−
−= (5.1)
where ,b PMTDR SMEC − is the bulk electrical conductivity output by PMTDR-SM,
( )f d PMTDR SMn n
− is the shape factor assumed by PMTDR-SM and ( )f d actual
n n is the
shape factor of the actual probe configuration used.
Dry unit weights and water contents used for the TDR calibrations did not have oversize particle corrections applied; as values actually being measured (the uncorrected values) need to be used in the calibration.
5.4. Results and Discussion
Results of TDR testing in the lab are presented below for all aggregates tested in this research. Calibration factors for all aggregates are summarized in table form with coefficient of determination values to describe how well the linear calibration equations
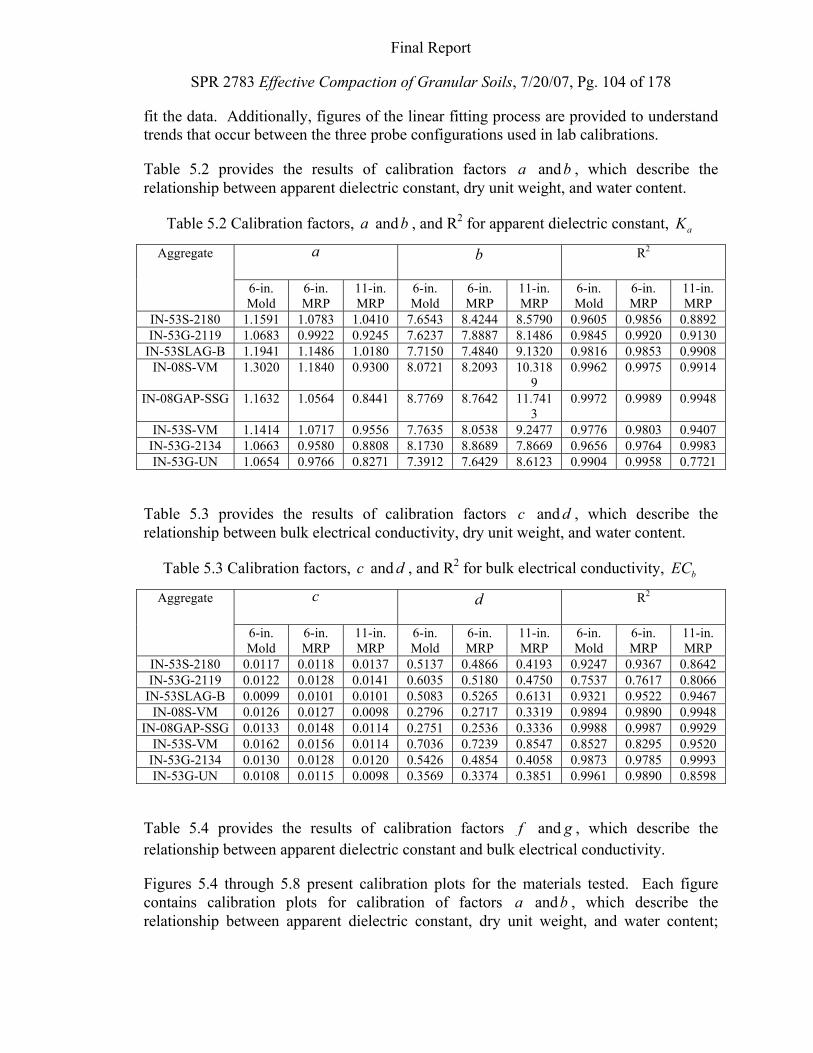
Final Report
SPR 2783 Effective Compaction of Granular Soils, 7/20/07, Pg. 104 of 178
fit the data. Additionally, figures of the linear fitting process are provided to understand trends that occur between the three probe configurations used in lab calibrations.
Table 5.2 provides the results of calibration factors a andb , which describe the relationship between apparent dielectric constant, dry unit weight, and water content.
Table 5.2 Calibration factors, a andb , and R2 for apparent dielectric constant, aK
Aggregate a b R2
6-in. Mold
6-in. MRP
11-in. MRP
6-in. Mold
6-in. MRP
11-in. MRP
6-in. Mold
6-in. MRP
11-in. MRP
IN-53S-2180 1.1591 1.0783 1.0410 7.6543 8.4244 8.5790 0.9605 0.9856 0.8892 IN-53G-2119 1.0683 0.9922 0.9245 7.6237 7.8887 8.1486 0.9845 0.9920 0.9130
IN-53SLAG-B 1.1941 1.1486 1.0180 7.7150 7.4840 9.1320 0.9816 0.9853 0.9908 IN-08S-VM 1.3020 1.1840 0.9300 8.0721 8.2093 10.318
9 0.9962 0.9975 0.9914
IN-08GAP-SSG 1.1632 1.0564 0.8441 8.7769 8.7642 11.7413
0.9972 0.9989 0.9948
IN-53S-VM 1.1414 1.0717 0.9556 7.7635 8.0538 9.2477 0.9776 0.9803 0.9407 IN-53G-2134 1.0663 0.9580 0.8808 8.1730 8.8689 7.8669 0.9656 0.9764 0.9983 IN-53G-UN 1.0654 0.9766 0.8271 7.3912 7.6429 8.6123 0.9904 0.9958 0.7721
Table 5.3 provides the results of calibration factors c and d , which describe the relationship between bulk electrical conductivity, dry unit weight, and water content.
Table 5.3 Calibration factors, c and d , and R2 for bulk electrical conductivity, bEC
Aggregate c d R2
6-in. Mold
6-in. MRP
11-in. MRP
6-in. Mold
6-in. MRP
11-in. MRP
6-in. Mold
6-in. MRP
11-in. MRP
IN-53S-2180 0.0117 0.0118 0.0137 0.5137 0.4866 0.4193 0.9247 0.9367 0.8642 IN-53G-2119 0.0122 0.0128 0.0141 0.6035 0.5180 0.4750 0.7537 0.7617 0.8066
IN-53SLAG-B 0.0099 0.0101 0.0101 0.5083 0.5265 0.6131 0.9321 0.9522 0.9467 IN-08S-VM 0.0126 0.0127 0.0098 0.2796 0.2717 0.3319 0.9894 0.9890 0.9948
IN-08GAP-SSG 0.0133 0.0148 0.0114 0.2751 0.2536 0.3336 0.9988 0.9987 0.9929 IN-53S-VM 0.0162 0.0156 0.0114 0.7036 0.7239 0.8547 0.8527 0.8295 0.9520
IN-53G-2134 0.0130 0.0128 0.0120 0.5426 0.4854 0.4058 0.9873 0.9785 0.9993 IN-53G-UN 0.0108 0.0115 0.0098 0.3569 0.3374 0.3851 0.9961 0.9890 0.8598
Table 5.4 provides the results of calibration factors f and g , which describe the relationship between apparent dielectric constant and bulk electrical conductivity.
Figures 5.4 through 5.8 present calibration plots for the materials tested. Each figure contains calibration plots for calibration of factors a andb , which describe the relationship between apparent dielectric constant, dry unit weight, and water content;
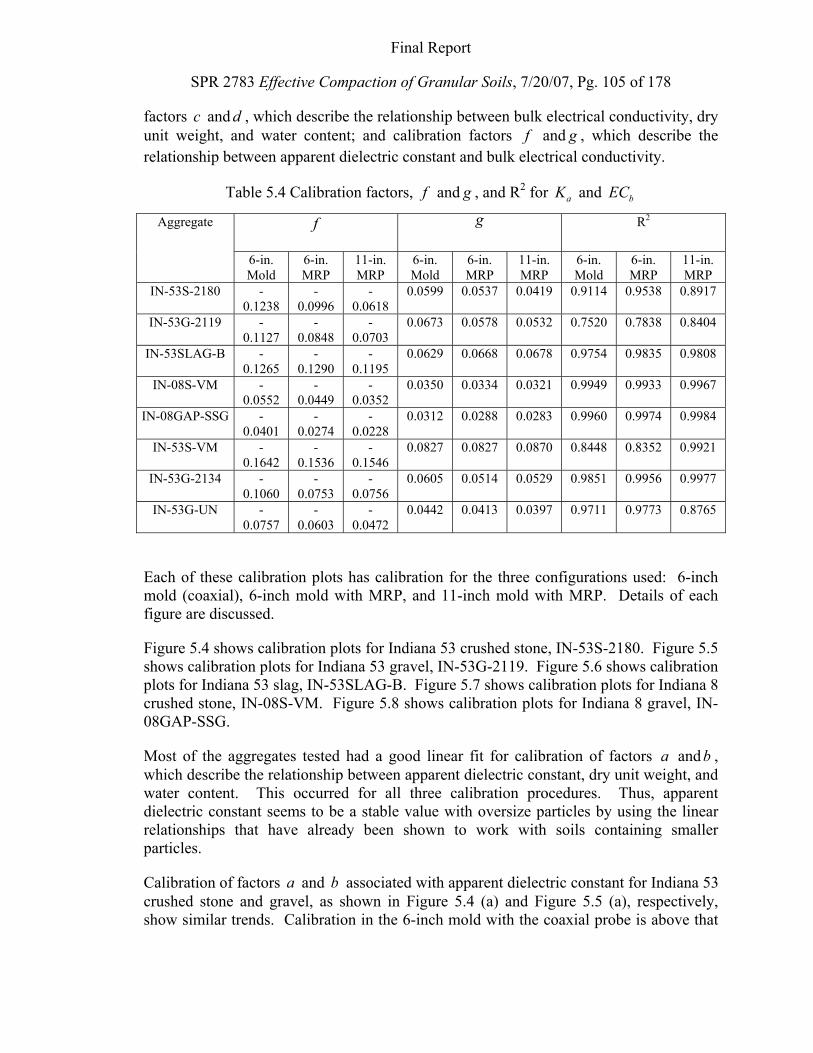
Final Report
SPR 2783 Effective Compaction of Granular Soils, 7/20/07, Pg. 105 of 178
factors c and d , which describe the relationship between bulk electrical conductivity, dry unit weight, and water content; and calibration factors f and g , which describe the relationship between apparent dielectric constant and bulk electrical conductivity.
Table 5.4 Calibration factors, f and g , and R2 for aK and bEC
Aggregate f g R2
6-in. Mold
6-in. MRP
11-in. MRP
6-in. Mold
6-in. MRP
11-in. MRP
6-in. Mold
6-in. MRP
11-in. MRP
IN-53S-2180 -0.1238
-0.0996
-0.0618
0.0599 0.0537 0.0419 0.9114 0.9538 0.8917
IN-53G-2119 -0.1127
-0.0848
-0.0703
0.0673 0.0578 0.0532 0.7520 0.7838 0.8404
IN-53SLAG-B -0.1265
-0.1290
-0.1195
0.0629 0.0668 0.0678 0.9754 0.9835 0.9808
IN-08S-VM -0.0552
-0.0449
-0.0352
0.0350 0.0334 0.0321 0.9949 0.9933 0.9967
IN-08GAP-SSG -0.0401
-0.0274
-0.0228
0.0312 0.0288 0.0283 0.9960 0.9974 0.9984
IN-53S-VM -0.1642
-0.1536
-0.1546
0.0827 0.0827 0.0870 0.8448 0.8352 0.9921
IN-53G-2134 -0.1060
-0.0753
-0.0756
0.0605 0.0514 0.0529 0.9851 0.9956 0.9977
IN-53G-UN -0.0757
-0.0603
-0.0472
0.0442 0.0413 0.0397 0.9711 0.9773 0.8765
Each of these calibration plots has calibration for the three configurations used: 6-inch mold (coaxial), 6-inch mold with MRP, and 11-inch mold with MRP. Details of each figure are discussed.
Figure 5.4 shows calibration plots for Indiana 53 crushed stone, IN-53S-2180. Figure 5.5 shows calibration plots for Indiana 53 gravel, IN-53G-2119. Figure 5.6 shows calibration plots for Indiana 53 slag, IN-53SLAG-B. Figure 5.7 shows calibration plots for Indiana 8 crushed stone, IN-08S-VM. Figure 5.8 shows calibration plots for Indiana 8 gravel, IN-08GAP-SSG.
Most of the aggregates tested had a good linear fit for calibration of factors a andb , which describe the relationship between apparent dielectric constant, dry unit weight, and water content. This occurred for all three calibration procedures. Thus, apparent dielectric constant seems to be a stable value with oversize particles by using the linear relationships that have already been shown to work with soils containing smaller particles.
Calibration of factors a and b associated with apparent dielectric constant for Indiana 53 crushed stone and gravel, as shown in Figure 5.4 (a) and Figure 5.5 (a), respectively, show similar trends. Calibration in the 6-inch mold with the coaxial probe is above that
Final Report
SPR 2783 Effective Compaction of Granular Soils, 7/20/07, Pg. 106 of 178
of calibration in the 6-inch mold with MRP, while the calibration in the 11-inch mold is the lowest. Slopes of all three calibrations are similar. Thus, b values are similar, while values of a change with calibration configuration. The reduction in a shows a trend in loosening of the compacted aggregate, as loosening causes a reduction in the apparent dielectric constant. Therefore, there is loosening when the outer spikes of the MRP are driven into the 6-inch mold. Following the same logic, the MRP test in the 11-inch mold causes the most loosening, although some contribution to the reduction in apparent dielectric constant may be due to effects on the electrical signal traveling through the oversize particles. Since the slope of all calibration lines is similar, the loosening effect appears to occur in a similar fashion over all water contents.
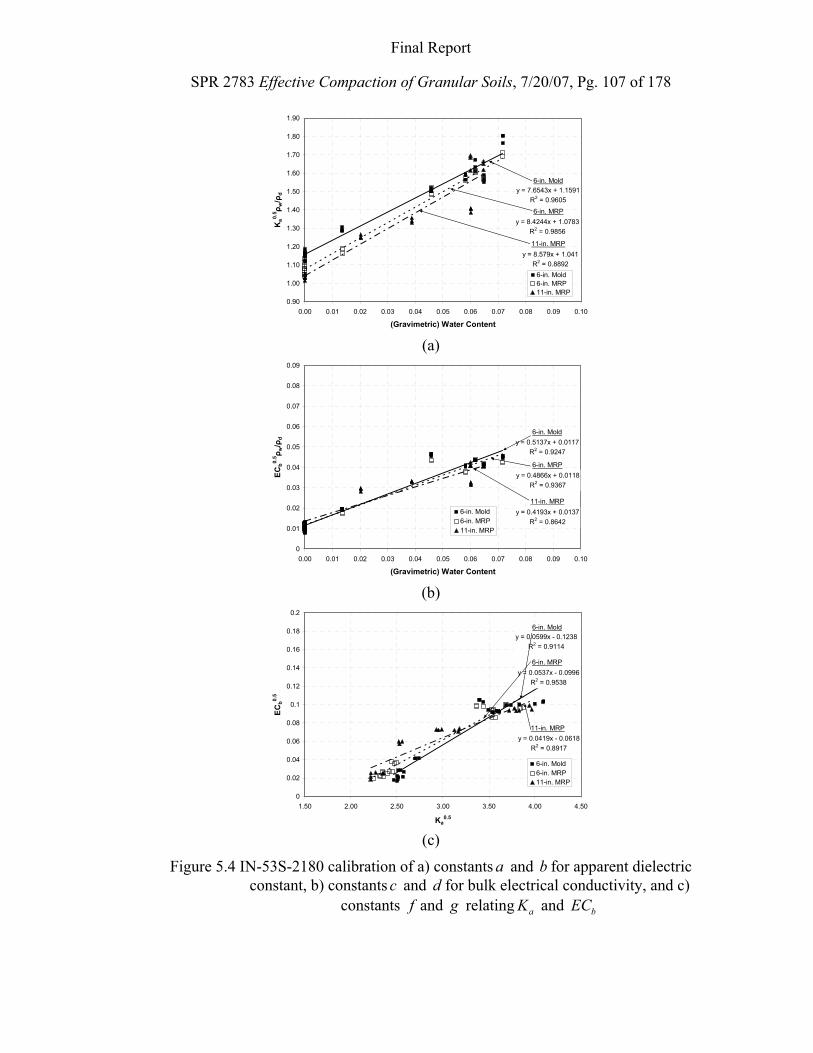
Final Report
SPR 2783 Effective Compaction of Granular Soils, 7/20/07, Pg. 107 of 178
y = 7.6543x + 1.1591R2 = 0.9605
y = 8.4244x + 1.0783R2 = 0.9856
y = 8.579x + 1.041R2 = 0.8892
0.90
1.00
1.10
1.20
1.30
1.40
1.50
1.60
1.70
1.80
1.90
0.00 0.01 0.02 0.03 0.04 0.05 0.06 0.07 0.08 0.09 0.10
(Gravimetric) Water Content
Ka0.
5 ρw/ρ
d6-in. Mold6-in. MRP11-in. MRP
6-in. Mold
6-in. MRP
11-in. MRP
(a)
y = 0.5137x + 0.0117R2 = 0.9247
y = 0.4866x + 0.0118R2 = 0.9367
y = 0.4193x + 0.0137R2 = 0.8642
0
0.01
0.02
0.03
0.04
0.05
0.06
0.07
0.08
0.09
0.00 0.01 0.02 0.03 0.04 0.05 0.06 0.07 0.08 0.09 0.10
(Gravimetric) Water Content
ECb0.
5 ρw/ρ
d
6-in. Mold6-in. MRP11-in. MRP
6-in. Mold
6-in. MRP
11-in. MRP
(b)
y = 0.0599x - 0.1238R2 = 0.9114
y = 0.0537x - 0.0996R2 = 0.9538
y = 0.0419x - 0.0618R2 = 0.8917
0
0.02
0.04
0.06
0.08
0.1
0.12
0.14
0.16
0.18
0.2
1.50 2.00 2.50 3.00 3.50 4.00 4.50
Ka0.5
ECb0.
5
6-in. Mold6-in. MRP11-in. MRP
6-in. Mold
6-in. MRP
11-in. MRP
(c)
Figure 5.4 IN-53S-2180 calibration of a) constants a and b for apparent dielectric constant, b) constants c and d for bulk electrical conductivity, and c)
constants f and g relating aK and bEC
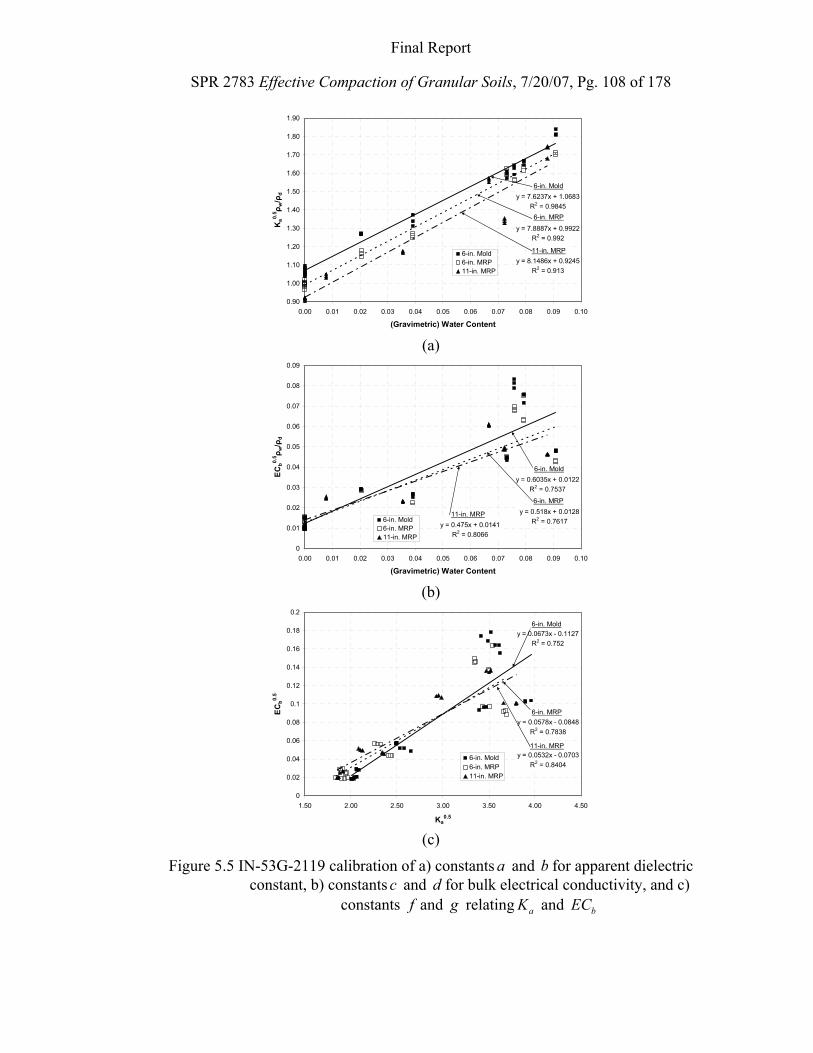
Final Report
SPR 2783 Effective Compaction of Granular Soils, 7/20/07, Pg. 108 of 178
y = 7.6237x + 1.0683R2 = 0.9845
y = 7.8887x + 0.9922R2 = 0.992
y = 8.1486x + 0.9245R2 = 0.913
0.90
1.00
1.10
1.20
1.30
1.40
1.50
1.60
1.70
1.80
1.90
0.00 0.01 0.02 0.03 0.04 0.05 0.06 0.07 0.08 0.09 0.10
(Gravimetric) Water Content
Ka0.
5 ρw/ρ
d
6-in. Mold6-in. MRP11-in. MRP
6-in. Mold
6-in. MRP
11-in. MRP
(a)
y = 0.6035x + 0.0122R2 = 0.7537
y = 0.518x + 0.0128R2 = 0.7617y = 0.475x + 0.0141
R2 = 0.8066
0
0.01
0.02
0.03
0.04
0.05
0.06
0.07
0.08
0.09
0.00 0.01 0.02 0.03 0.04 0.05 0.06 0.07 0.08 0.09 0.10
(Gravimetric) Water Content
ECb0.
5 ρw/ρ
d
6-in. Mold6-in. MRP11-in. MRP
6-in. Mold
6-in. MRP
11-in. MRP
(b)
y = 0.0673x - 0.1127R2 = 0.752
y = 0.0578x - 0.0848R2 = 0.7838
y = 0.0532x - 0.0703R2 = 0.8404
0
0.02
0.04
0.06
0.08
0.1
0.12
0.14
0.16
0.18
0.2
1.50 2.00 2.50 3.00 3.50 4.00 4.50
Ka0.5
ECb0.
5
6-in. Mold6-in. MRP11-in. MRP
6-in. Mold
6-in. MRP
11-in. MRP
(c)
Figure 5.5 IN-53G-2119 calibration of a) constants a and b for apparent dielectric constant, b) constants c and d for bulk electrical conductivity, and c)
constants f and g relating aK and bEC
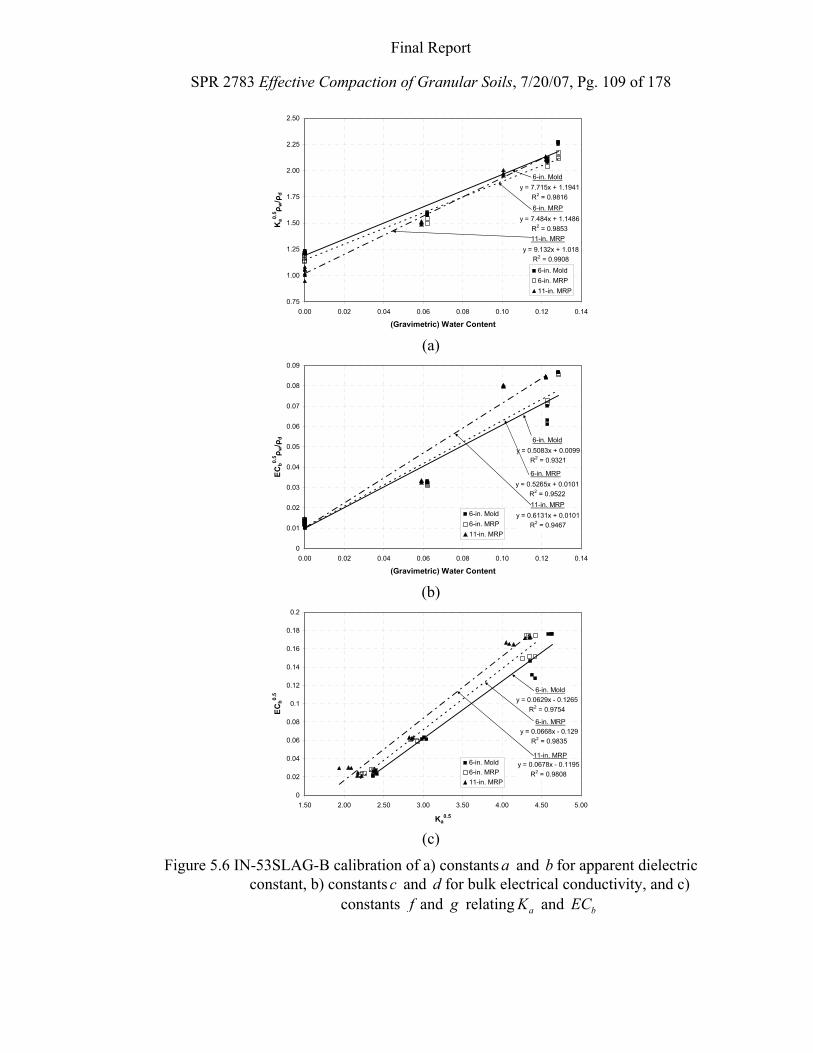
Final Report
SPR 2783 Effective Compaction of Granular Soils, 7/20/07, Pg. 109 of 178
y = 7.715x + 1.1941R2 = 0.9816
y = 7.484x + 1.1486R2 = 0.9853
y = 9.132x + 1.018R2 = 0.9908
0.75
1.00
1.25
1.50
1.75
2.00
2.25
2.50
0.00 0.02 0.04 0.06 0.08 0.10 0.12 0.14
(Gravimetric) Water Content
Ka0.
5 ρw/ρ
d6-in. Mold6-in. MRP11-in. MRP
6-in. Mold
6-in. MRP
11-in. MRP
(a)
y = 0.5083x + 0.0099R2 = 0.9321
y = 0.5265x + 0.0101R2 = 0.9522
y = 0.6131x + 0.0101R2 = 0.9467
0
0.01
0.02
0.03
0.04
0.05
0.06
0.07
0.08
0.09
0.00 0.02 0.04 0.06 0.08 0.10 0.12 0.14
(Gravimetric) Water Content
ECb0.
5 ρw/ρ
d
6-in. Mold6-in. MRP11-in. MRP
6-in. Mold
6-in. MRP
11-in. MRP
(b)
y = 0.0629x - 0.1265R2 = 0.9754
y = 0.0668x - 0.129R2 = 0.9835
y = 0.0678x - 0.1195R2 = 0.9808
0
0.02
0.04
0.06
0.08
0.1
0.12
0.14
0.16
0.18
0.2
1.50 2.00 2.50 3.00 3.50 4.00 4.50 5.00
Ka0.5
ECb0.
5
6-in. Mold6-in. MRP11-in. MRP
6-in. Mold
6-in. MRP
11-in. MRP
(c)
Figure 5.6 IN-53SLAG-B calibration of a) constants a and b for apparent dielectric constant, b) constants c and d for bulk electrical conductivity, and c)
constants f and g relating aK and bEC
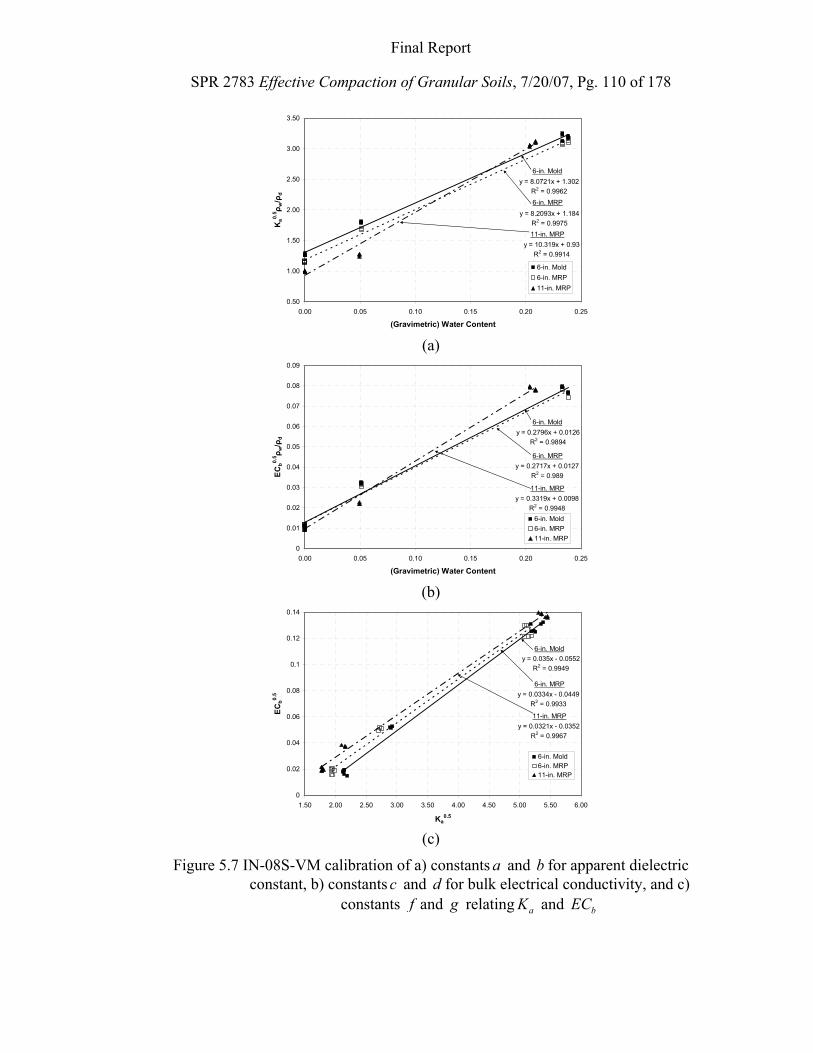
Final Report
SPR 2783 Effective Compaction of Granular Soils, 7/20/07, Pg. 110 of 178
y = 8.0721x + 1.302R2 = 0.9962
y = 8.2093x + 1.184R2 = 0.9975
y = 10.319x + 0.93R2 = 0.9914
0.50
1.00
1.50
2.00
2.50
3.00
3.50
0.00 0.05 0.10 0.15 0.20 0.25
(Gravimetric) Water Content
Ka0.
5 ρw/ρ
d
6-in. Mold6-in. MRP11-in. MRP
6-in. Mold
6-in. MRP
11-in. MRP
(a)
y = 0.2796x + 0.0126R2 = 0.9894
y = 0.2717x + 0.0127R2 = 0.989
y = 0.3319x + 0.0098R2 = 0.9948
0
0.01
0.02
0.03
0.04
0.05
0.06
0.07
0.08
0.09
0.00 0.05 0.10 0.15 0.20 0.25
(Gravimetric) Water Content
ECb0.
5 ρw/ρ
d
6-in. Mold6-in. MRP11-in. MRP
6-in. Mold
6-in. MRP
11-in. MRP
(b)
y = 0.035x - 0.0552R2 = 0.9949
y = 0.0334x - 0.0449R2 = 0.9933
y = 0.0321x - 0.0352R2 = 0.9967
0
0.02
0.04
0.06
0.08
0.1
0.12
0.14
1.50 2.00 2.50 3.00 3.50 4.00 4.50 5.00 5.50 6.00
Ka0.5
ECb0.
5
6-in. Mold6-in. MRP11-in. MRP
6-in. Mold
6-in. MRP
11-in. MRP
(c)
Figure 5.7 IN-08S-VM calibration of a) constants a and b for apparent dielectric constant, b) constants c and d for bulk electrical conductivity, and c)
constants f and g relating aK and bEC
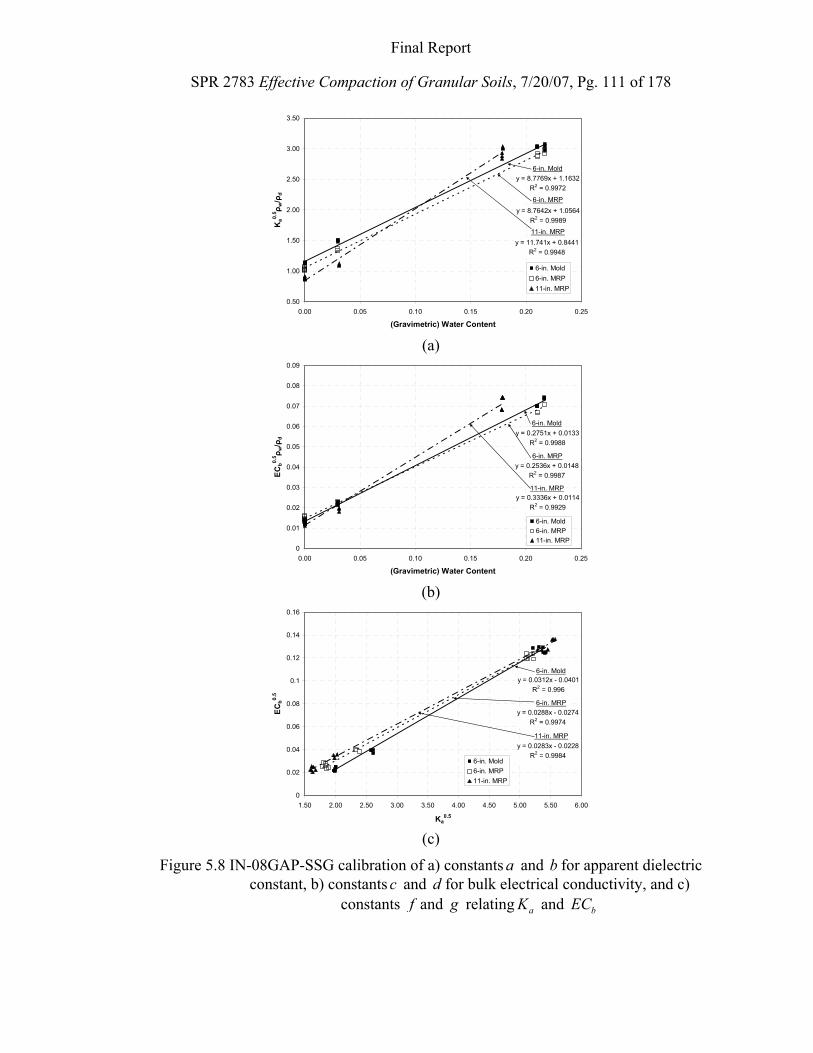
Final Report
SPR 2783 Effective Compaction of Granular Soils, 7/20/07, Pg. 111 of 178
y = 8.7769x + 1.1632R2 = 0.9972
y = 8.7642x + 1.0564R2 = 0.9989
y = 11.741x + 0.8441R2 = 0.9948
0.50
1.00
1.50
2.00
2.50
3.00
3.50
0.00 0.05 0.10 0.15 0.20 0.25
(Gravimetric) Water Content
Ka0.
5 ρw/ρ
d
6-in. Mold6-in. MRP11-in. MRP
6-in. Mold
6-in. MRP
11-in. MRP
(a)
y = 0.2751x + 0.0133R2 = 0.9988
y = 0.2536x + 0.0148R2 = 0.9987
y = 0.3336x + 0.0114R2 = 0.9929
0
0.01
0.02
0.03
0.04
0.05
0.06
0.07
0.08
0.09
0.00 0.05 0.10 0.15 0.20 0.25
(Gravimetric) Water Content
ECb0.
5 ρw/ρ
d
6-in. Mold6-in. MRP11-in. MRP
6-in. Mold
6-in. MRP
11-in. MRP
(b)
y = 0.0312x - 0.0401R2 = 0.996
y = 0.0288x - 0.0274R2 = 0.9974
y = 0.0283x - 0.0228R2 = 0.9984
0
0.02
0.04
0.06
0.08
0.1
0.12
0.14
0.16
1.50 2.00 2.50 3.00 3.50 4.00 4.50 5.00 5.50 6.00
Ka0.5
ECb0.
5
6-in. Mold6-in. MRP11-in. MRP
6-in. Mold
6-in. MRP
11-in. MRP
(c)
Figure 5.8 IN-08GAP-SSG calibration of a) constants a and b for apparent dielectric constant, b) constants c and d for bulk electrical conductivity, and c)
constants f and g relating aK and bEC
Final Report
SPR 2783 Effective Compaction of Granular Soils, 7/20/07, Pg. 112 of 178
Calibration of factors c and d associated with bulk electrical conductivity for Indiana 53 crushed stone and gravel, as shown in Figure 5.4 (b) and Figure 5.5 (b), respectively, show similar trends. Calibration configuration does not have an influence at oven-dry (zero water content), as all three configurations give similar values of c . This is most likely due to the fact conductivities are so low, and no other effects are present with no water present. However, as water contents increase, data becomes erratic, leaving no clear trend among the probe configurations.
Calibration of factors a andb associated with apparent dielectric constant for Indiana 8 crushed stone and gravel, as shown in Figure 5.7 (a) and Figure 5.8 (a), respectively, show similar trends. 6-inch mold (coaxial) calibration is above and parallel with that of the 6-inch mold with the MRP probe. Thus, values of b for these two configurations are similar and values of a decrease, respectively. This trend reflects that of the Indiana 53 gravel and crushed stone. The calibrations in the 11-inch mold with MRP configuration had the lowest values of a , while values of b were the greatest, causing it to cross the other two calibration lines. This trend is different from those of the Indiana 53 crushed stone and gravel, but all effects are due to the same reasoning, loosening of the compacted aggregate by insertion of spikes. Unlike the Indiana 53 aggregates, the Indiana 8 aggregates are free-draining. This has no effect in the 6-inch mold as the representative sample of the TDR is the entire mold, so even though some loosening occurs, there is no change in water content, and thus change in apparent dielectric constant is only due to loosening. However, in the 11-inch mold, loosening of the compacted aggregate results in an “apparent” increase water content within the TDR sampling volume, as free-draining allows the infiltration of the water. Thus, for Indiana 8 aggregates in the 11-inch mold with MRP, there was still a loosening effect, causing a decrease in apparent dielectric constant, but there was also an increase in apparent dielectric constant due to the additional water migrating into the volume where the probe was located.
Calibration of factors c and d associated with bulk electrical conductivity for Indiana 8 crushed stone and gravel, as shown in Figure 5.7 (b) and Figure 5.8 (b), respectively, show similar trends. Calibration configuration does not have an influence at oven-dry (zero water content), as all three configurations give similar factors of c , similar to the Indiana 53 aggregates. Unlike the Indiana 53 aggregates, bulk electrical conductivities appear to be stable with an increase in water content and show good linear correlations. This is most likely due to a reduction in torturosity, due to no fines content, and/or a reduction in the effects of pore water chemistry.
Final Report
SPR 2783 Effective Compaction of Granular Soils, 7/20/07, Pg. 113 of 178
CHAPTER 6. PILOT IMPLEMENTATION PROJECT
A pilot implementation project was implemented in order to determine the applicability of the Vibrating Hammer Method of Compaction, as discussed in detail in CHAPTER 2 and CHAPTER 3, for usage in the field. An INDOT project for the construction of a new access road to the Ivy Tech State College campus in Terre Haute, IN was chosen as the pilot project. This chapter discusses the objectives, location, and details of the project; preparation and conduction of compaction control and on-site testing; and the results.
6.1. Objectives
The objective of the pilot implementation project was to determine the feasibility of the Vibrating Hammer Method as a method of compaction control for aggregate base placement. The pilot project was necessary because of the uncertainty of how field compaction equipment would perform in achieving dry unit weights specified by the Vibrating Hammer Method because of the maximum dry unit weights and high water content ranges typically required by the Vibrating Hammer Method.
In addition to the implementation of the Vibrating Hammer Method of Compaction, the pilot project presented the opportunity to test in the field the application of time domain reflectometry (TDR) for compaction control of soils containing oversize particles. TDR tests were conducted in the field in conjunction with quality control testing performed by INDOT. TDR tests had no control on contractual obligations with the contractor.
6.2. Location and Information
The pilot project was INDOT’s Ivy Tech Access Road, Contract Number: R-28160, Project Number: 0257001. It is located in Terre Haute, IN along U.S. 41, approximately 4 miles south of Interstate 70, as shown in Figure 6.1. The project was for the construction of a new access road from Jessica Lane to the Ivy Tech State College campus.
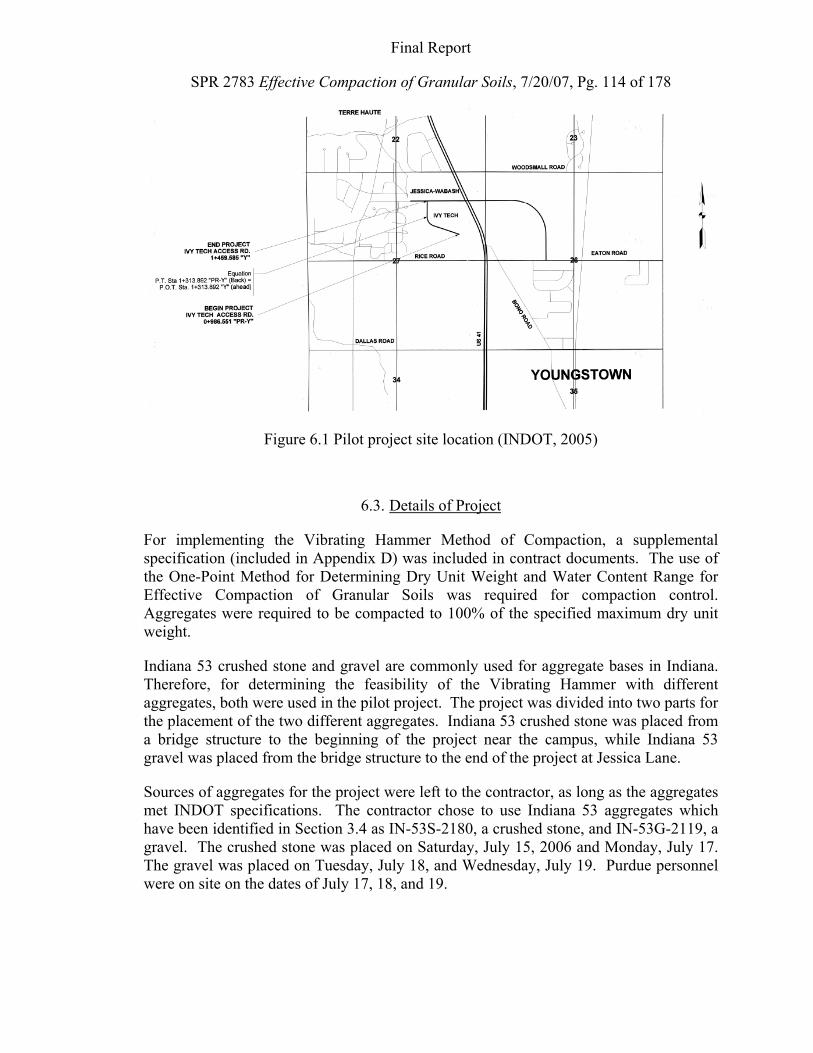
Final Report
SPR 2783 Effective Compaction of Granular Soils, 7/20/07, Pg. 114 of 178
Figure 6.1 Pilot project site location (INDOT, 2005)
6.3. Details of Project
For implementing the Vibrating Hammer Method of Compaction, a supplemental specification (included in Appendix D) was included in contract documents. The use of the One-Point Method for Determining Dry Unit Weight and Water Content Range for Effective Compaction of Granular Soils was required for compaction control. Aggregates were required to be compacted to 100% of the specified maximum dry unit weight.
Indiana 53 crushed stone and gravel are commonly used for aggregate bases in Indiana. Therefore, for determining the feasibility of the Vibrating Hammer with different aggregates, both were used in the pilot project. The project was divided into two parts for the placement of the two different aggregates. Indiana 53 crushed stone was placed from a bridge structure to the beginning of the project near the campus, while Indiana 53 gravel was placed from the bridge structure to the end of the project at Jessica Lane.
Sources of aggregates for the project were left to the contractor, as long as the aggregates met INDOT specifications. The contractor chose to use Indiana 53 aggregates which have been identified in Section 3.4 as IN-53S-2180, a crushed stone, and IN-53G-2119, a gravel. The crushed stone was placed on Saturday, July 15, 2006 and Monday, July 17. The gravel was placed on Tuesday, July 18, and Wednesday, July 19. Purdue personnel were on site on the dates of July 17, 18, and 19.
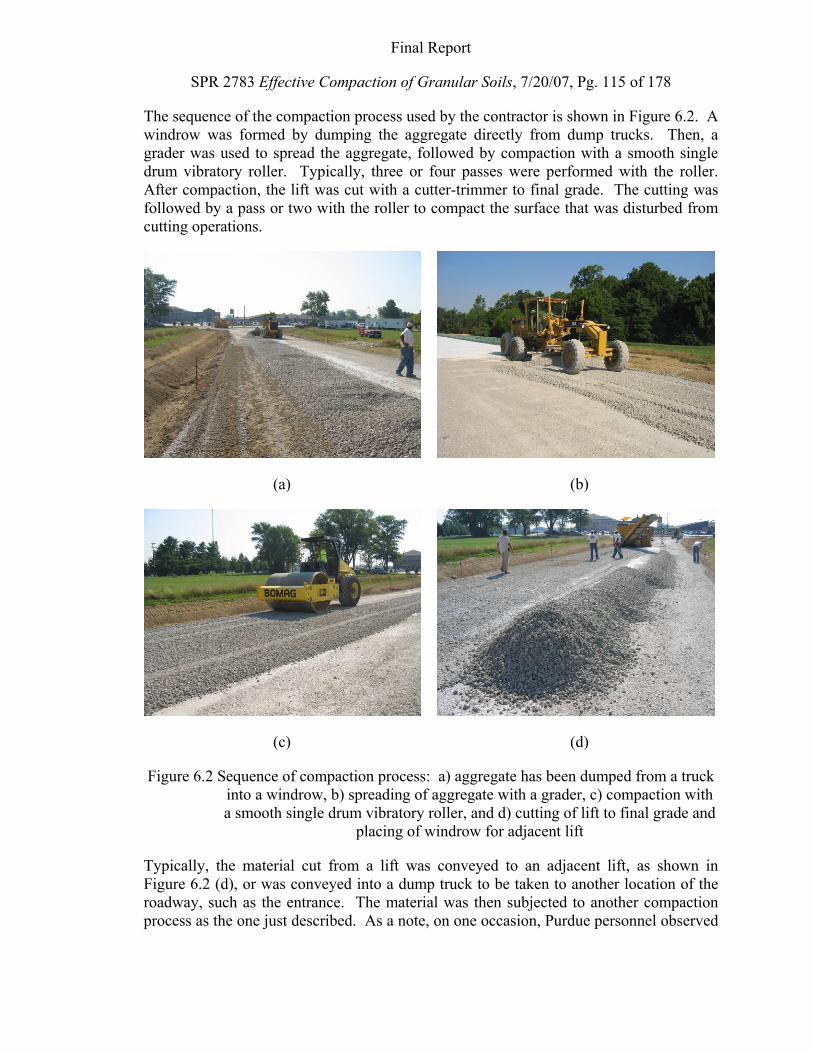
Final Report
SPR 2783 Effective Compaction of Granular Soils, 7/20/07, Pg. 115 of 178
The sequence of the compaction process used by the contractor is shown in Figure 6.2. A windrow was formed by dumping the aggregate directly from dump trucks. Then, a grader was used to spread the aggregate, followed by compaction with a smooth single drum vibratory roller. Typically, three or four passes were performed with the roller. After compaction, the lift was cut with a cutter-trimmer to final grade. The cutting was followed by a pass or two with the roller to compact the surface that was disturbed from cutting operations.
(a) (b)
(c) (d)
Figure 6.2 Sequence of compaction process: a) aggregate has been dumped from a truck into a windrow, b) spreading of aggregate with a grader, c) compaction with a smooth single drum vibratory roller, and d) cutting of lift to final grade and
placing of windrow for adjacent lift
Typically, the material cut from a lift was conveyed to an adjacent lift, as shown in Figure 6.2 (d), or was conveyed into a dump truck to be taken to another location of the roadway, such as the entrance. The material was then subjected to another compaction process as the one just described. As a note, on one occasion, Purdue personnel observed
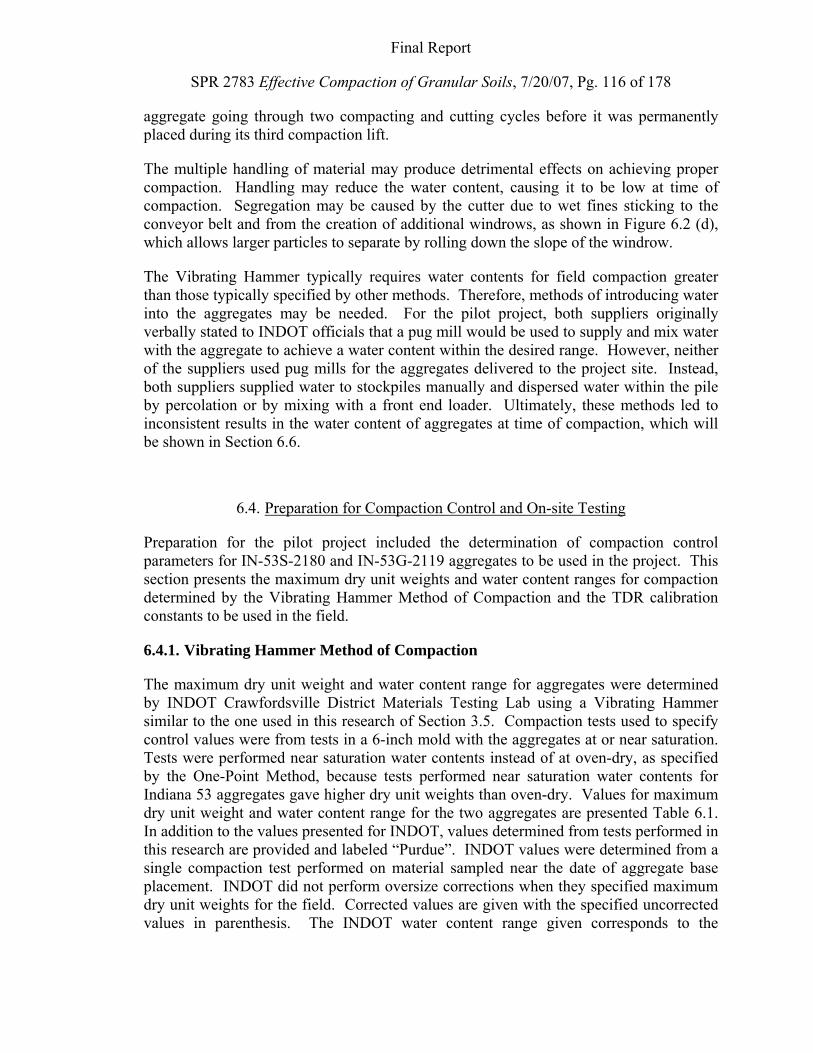
Final Report
SPR 2783 Effective Compaction of Granular Soils, 7/20/07, Pg. 116 of 178
aggregate going through two compacting and cutting cycles before it was permanently placed during its third compaction lift.
The multiple handling of material may produce detrimental effects on achieving proper compaction. Handling may reduce the water content, causing it to be low at time of compaction. Segregation may be caused by the cutter due to wet fines sticking to the conveyor belt and from the creation of additional windrows, as shown in Figure 6.2 (d), which allows larger particles to separate by rolling down the slope of the windrow.
The Vibrating Hammer typically requires water contents for field compaction greater than those typically specified by other methods. Therefore, methods of introducing water into the aggregates may be needed. For the pilot project, both suppliers originally verbally stated to INDOT officials that a pug mill would be used to supply and mix water with the aggregate to achieve a water content within the desired range. However, neither of the suppliers used pug mills for the aggregates delivered to the project site. Instead, both suppliers supplied water to stockpiles manually and dispersed water within the pile by percolation or by mixing with a front end loader. Ultimately, these methods led to inconsistent results in the water content of aggregates at time of compaction, which will be shown in Section 6.6.
6.4. Preparation for Compaction Control and On-site Testing
Preparation for the pilot project included the determination of compaction control parameters for IN-53S-2180 and IN-53G-2119 aggregates to be used in the project. This section presents the maximum dry unit weights and water content ranges for compaction determined by the Vibrating Hammer Method of Compaction and the TDR calibration constants to be used in the field.
6.4.1. Vibrating Hammer Method of Compaction
The maximum dry unit weight and water content range for aggregates were determined by INDOT Crawfordsville District Materials Testing Lab using a Vibrating Hammer similar to the one used in this research of Section 3.5. Compaction tests used to specify control values were from tests in a 6-inch mold with the aggregates at or near saturation. Tests were performed near saturation water contents instead of at oven-dry, as specified by the One-Point Method, because tests performed near saturation water contents for Indiana 53 aggregates gave higher dry unit weights than oven-dry. Values for maximum dry unit weight and water content range for the two aggregates are presented Table 6.1. In addition to the values presented for INDOT, values determined from tests performed in this research are provided and labeled “Purdue”. INDOT values were determined from a single compaction test performed on material sampled near the date of aggregate base placement. INDOT did not perform oversize corrections when they specified maximum dry unit weights for the field. Corrected values are given with the specified uncorrected values in parenthesis. The INDOT water content range given corresponds to the
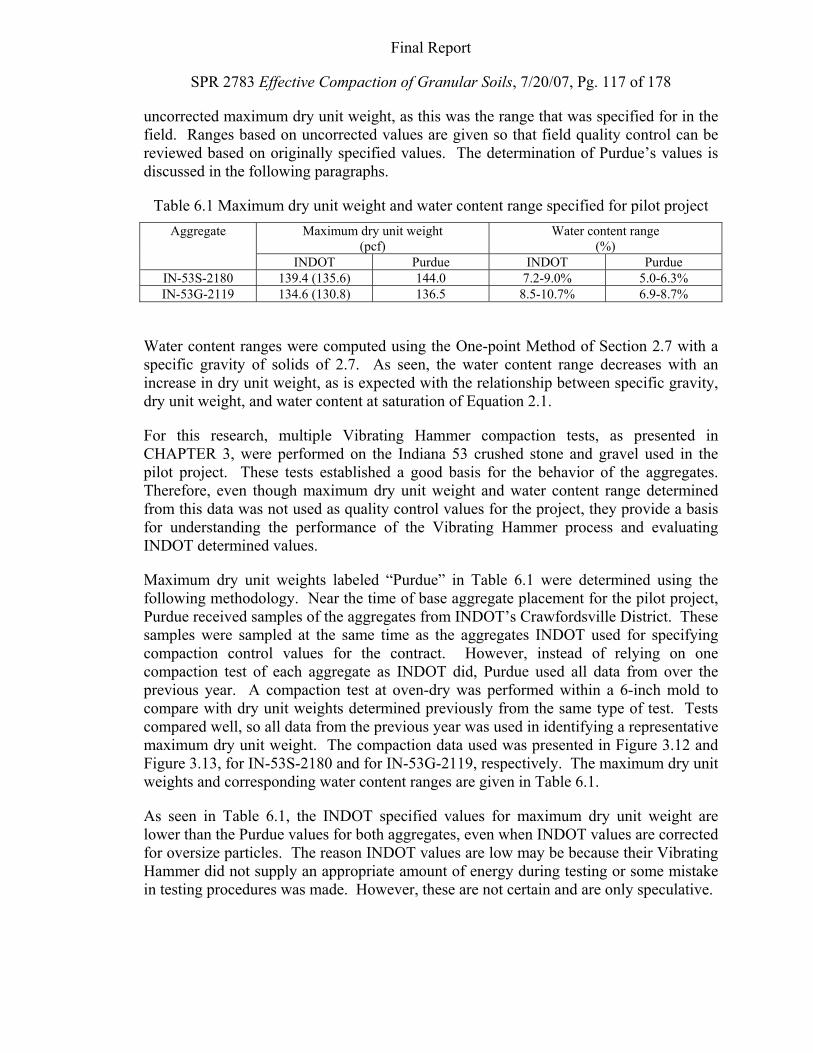
Final Report
SPR 2783 Effective Compaction of Granular Soils, 7/20/07, Pg. 117 of 178
uncorrected maximum dry unit weight, as this was the range that was specified for in the field. Ranges based on uncorrected values are given so that field quality control can be reviewed based on originally specified values. The determination of Purdue’s values is discussed in the following paragraphs.
Table 6.1 Maximum dry unit weight and water content range specified for pilot project Aggregate Maximum dry unit weight
(pcf) Water content range
(%) INDOT Purdue INDOT Purdue
IN-53S-2180 139.4 (135.6) 144.0 7.2-9.0% 5.0-6.3% IN-53G-2119 134.6 (130.8) 136.5 8.5-10.7% 6.9-8.7%
Water content ranges were computed using the One-point Method of Section 2.7 with a specific gravity of solids of 2.7. As seen, the water content range decreases with an increase in dry unit weight, as is expected with the relationship between specific gravity, dry unit weight, and water content at saturation of Equation 2.1.
For this research, multiple Vibrating Hammer compaction tests, as presented in CHAPTER 3, were performed on the Indiana 53 crushed stone and gravel used in the pilot project. These tests established a good basis for the behavior of the aggregates. Therefore, even though maximum dry unit weight and water content range determined from this data was not used as quality control values for the project, they provide a basis for understanding the performance of the Vibrating Hammer process and evaluating INDOT determined values.
Maximum dry unit weights labeled “Purdue” in Table 6.1 were determined using the following methodology. Near the time of base aggregate placement for the pilot project, Purdue received samples of the aggregates from INDOT’s Crawfordsville District. These samples were sampled at the same time as the aggregates INDOT used for specifying compaction control values for the contract. However, instead of relying on one compaction test of each aggregate as INDOT did, Purdue used all data from over the previous year. A compaction test at oven-dry was performed within a 6-inch mold to compare with dry unit weights determined previously from the same type of test. Tests compared well, so all data from the previous year was used in identifying a representative maximum dry unit weight. The compaction data used was presented in Figure 3.12 and Figure 3.13, for IN-53S-2180 and for IN-53G-2119, respectively. The maximum dry unit weights and corresponding water content ranges are given in Table 6.1.
As seen in Table 6.1, the INDOT specified values for maximum dry unit weight are lower than the Purdue values for both aggregates, even when INDOT values are corrected for oversize particles. The reason INDOT values are low may be because their Vibrating Hammer did not supply an appropriate amount of energy during testing or some mistake in testing procedures was made. However, these are not certain and are only speculative.
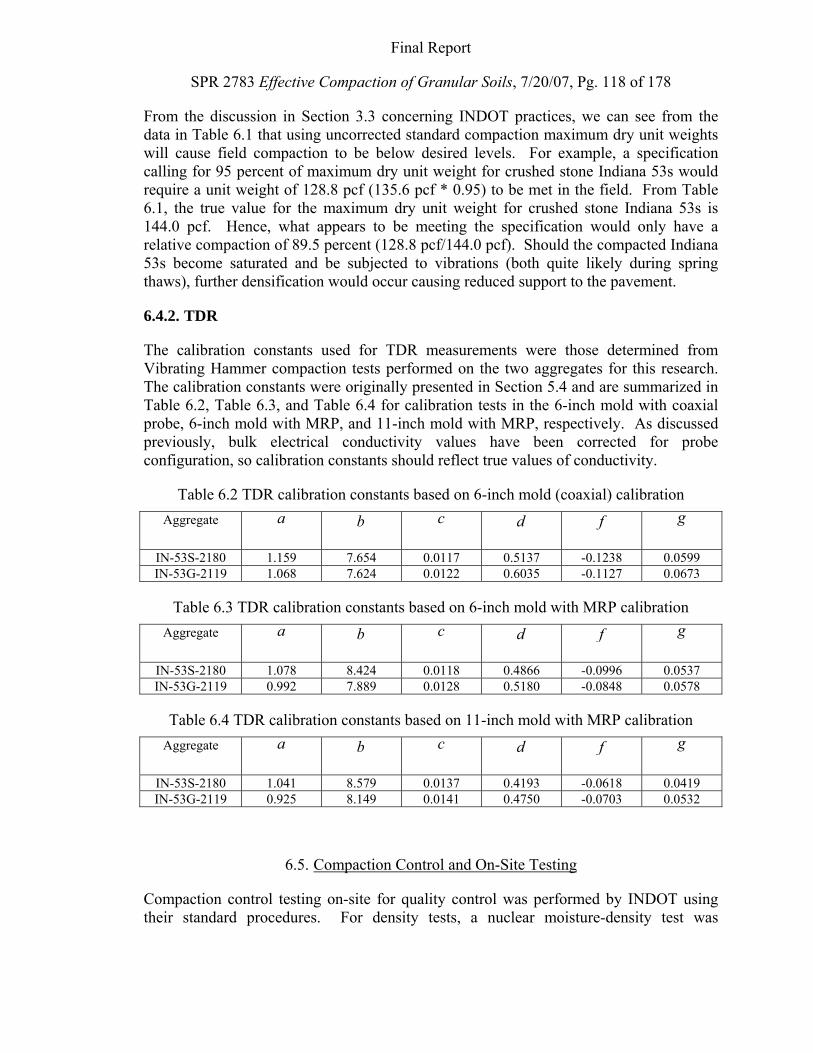
Final Report
SPR 2783 Effective Compaction of Granular Soils, 7/20/07, Pg. 118 of 178
From the discussion in Section 3.3 concerning INDOT practices, we can see from the data in Table 6.1 that using uncorrected standard compaction maximum dry unit weights will cause field compaction to be below desired levels. For example, a specification calling for 95 percent of maximum dry unit weight for crushed stone Indiana 53s would require a unit weight of 128.8 pcf (135.6 pcf * 0.95) to be met in the field. From Table 6.1, the true value for the maximum dry unit weight for crushed stone Indiana 53s is 144.0 pcf. Hence, what appears to be meeting the specification would only have a relative compaction of 89.5 percent (128.8 pcf/144.0 pcf). Should the compacted Indiana 53s become saturated and be subjected to vibrations (both quite likely during spring thaws), further densification would occur causing reduced support to the pavement.
6.4.2. TDR
The calibration constants used for TDR measurements were those determined from Vibrating Hammer compaction tests performed on the two aggregates for this research. The calibration constants were originally presented in Section 5.4 and are summarized in Table 6.2, Table 6.3, and Table 6.4 for calibration tests in the 6-inch mold with coaxial probe, 6-inch mold with MRP, and 11-inch mold with MRP, respectively. As discussed previously, bulk electrical conductivity values have been corrected for probe configuration, so calibration constants should reflect true values of conductivity.
Table 6.2 TDR calibration constants based on 6-inch mold (coaxial) calibration Aggregate a b c d f
g
IN-53S-2180 1.159 7.654 0.0117 0.5137 -0.1238 0.0599 IN-53G-2119 1.068 7.624 0.0122 0.6035 -0.1127 0.0673
Table 6.3 TDR calibration constants based on 6-inch mold with MRP calibration Aggregate a b c d f
g
IN-53S-2180 1.078 8.424 0.0118 0.4866 -0.0996 0.0537 IN-53G-2119 0.992 7.889 0.0128 0.5180 -0.0848 0.0578
Table 6.4 TDR calibration constants based on 11-inch mold with MRP calibration Aggregate a b c d f
g
IN-53S-2180 1.041 8.579 0.0137 0.4193 -0.0618 0.0419 IN-53G-2119 0.925 8.149 0.0141 0.4750 -0.0703 0.0532
6.5. Compaction Control and On-Site Testing
Compaction control testing on-site for quality control was performed by INDOT using their standard procedures. For density tests, a nuclear moisture-density test was
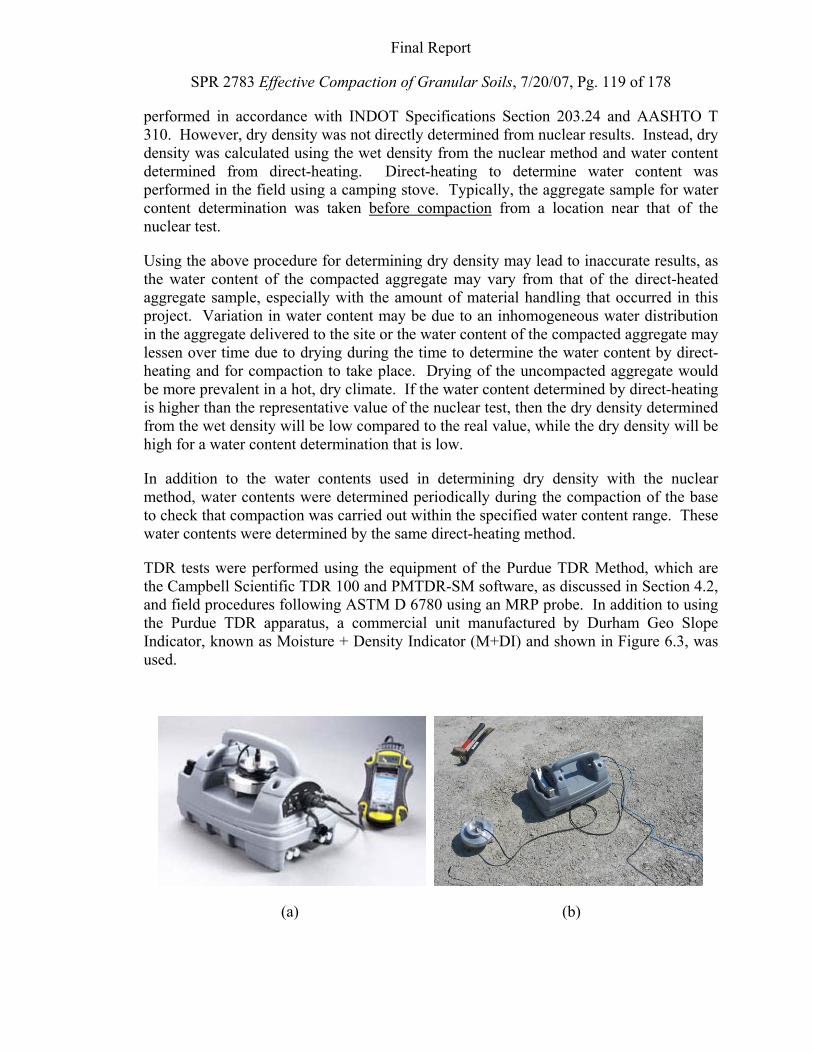
Final Report
SPR 2783 Effective Compaction of Granular Soils, 7/20/07, Pg. 119 of 178
performed in accordance with INDOT Specifications Section 203.24 and AASHTO T 310. However, dry density was not directly determined from nuclear results. Instead, dry density was calculated using the wet density from the nuclear method and water content determined from direct-heating. Direct-heating to determine water content was performed in the field using a camping stove. Typically, the aggregate sample for water content determination was taken before compaction from a location near that of the nuclear test.
Using the above procedure for determining dry density may lead to inaccurate results, as the water content of the compacted aggregate may vary from that of the direct-heated aggregate sample, especially with the amount of material handling that occurred in this project. Variation in water content may be due to an inhomogeneous water distribution in the aggregate delivered to the site or the water content of the compacted aggregate may lessen over time due to drying during the time to determine the water content by direct-heating and for compaction to take place. Drying of the uncompacted aggregate would be more prevalent in a hot, dry climate. If the water content determined by direct-heating is higher than the representative value of the nuclear test, then the dry density determined from the wet density will be low compared to the real value, while the dry density will be high for a water content determination that is low.
In addition to the water contents used in determining dry density with the nuclear method, water contents were determined periodically during the compaction of the base to check that compaction was carried out within the specified water content range. These water contents were determined by the same direct-heating method.
TDR tests were performed using the equipment of the Purdue TDR Method, which are the Campbell Scientific TDR 100 and PMTDR-SM software, as discussed in Section 4.2, and field procedures following ASTM D 6780 using an MRP probe. In addition to using the Purdue TDR apparatus, a commercial unit manufactured by Durham Geo Slope Indicator, known as Moisture + Density Indicator (M+DI) and shown in Figure 6.3, was used.
(a) (b)
Final Report
SPR 2783 Effective Compaction of Granular Soils, 7/20/07, Pg. 120 of 178
Figure 6.3 Moisture + Density Indicator (M+DI): a) a new unit (DGSI, 2005) and b) unit on pilot project site
Probe rods or spikes used for the MRP probe for both TDR apparatuses were those used in the lab, as described in Section 5.2.
In conjunction with some of the TDR tests performed, moisture contents were determined at the location with a sample taken from within the confines of the MRP probe, after performing the TDR test. The sample was weighed and dried for water content determination. Determining water content by this method provides a fairly accurate comparison value for the TDR test. TDR tests were not necessarily performed directly after compaction, so water contents should not be indicative of whether the material was compacted within the specified water content range, but comparable water contents from the dried sample and the TDR are still desirable.
6.6. Results and Discussion
The results of compaction control tests are presented here in two sections. The first section presents results of the performance of the Vibrating Hammer specification and the second presents TDR results.
6.6.1. Vibrating Hammer: Dry Unit Weight and Water Content
As part of compaction control, INDOT officials measured water contents at various locations during compaction to determine if compaction was occurring at the desired water content range. Figure 6.4 provides results for IN-53S-2180 and Figure 6.5 provides results for IN-53G-2119, with results being displayed by location or station number for the project site. Both figures include the water content ranges as defined by INDOT and Purdue, as given in Table 6.1, and dates for which the tests were performed.
Typically, water content tests were performed on aggregate samples taken from a windrow, spread aggregate just before compaction, or directly from a truck bed before dumping. Figure 6.4 shows that water content was low on the first day of Indiana 53 crushed stone placement. For the second day of placement water content was higher, and met desired water content for unofficial specifications based on Purdue’s Vibrating Hammer tests. Water contents specified by INDOT’s desired range were never achieved. However, the range specified by INDOT may be too high due to too low of a maximum dry unit weight.
Figure 6.5 shows that Indiana 53 gravel water contents followed a similar trend to that of crushed stone. The water content was low on the beginning of the first day, and then increased at the very end of the day. Most water contents for the first day were within Purdue’s range, but not within INDOT’s range. On the second day of Indiana 53 gravel
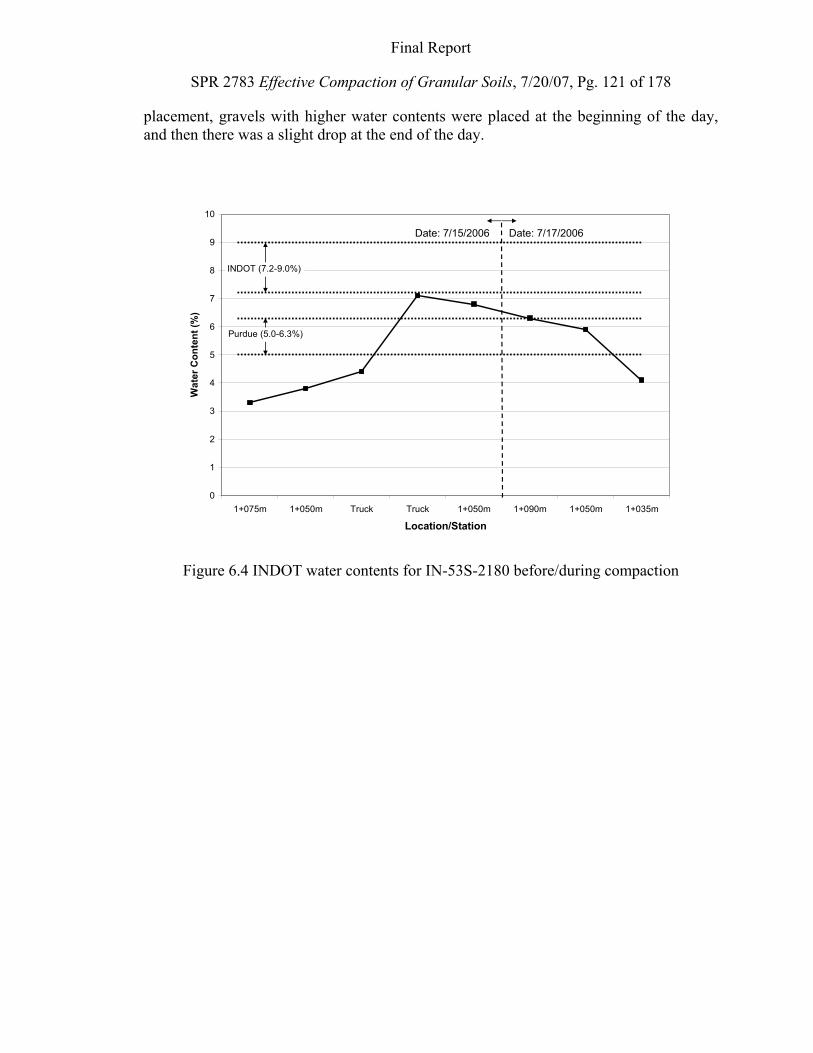
Final Report
SPR 2783 Effective Compaction of Granular Soils, 7/20/07, Pg. 121 of 178
placement, gravels with higher water contents were placed at the beginning of the day, and then there was a slight drop at the end of the day.
0
1
2
3
4
5
6
7
8
9
10
1+075m 1+050m Truck Truck 1+050m 1+090m 1+050m 1+035m
Location/Station
Wat
er C
onte
nt (%
)
Date: 7/15/2006 Date: 7/17/2006
INDOT (7.2-9.0%)
Purdue (5.0-6.3%)
Figure 6.4 INDOT water contents for IN-53S-2180 before/during compaction
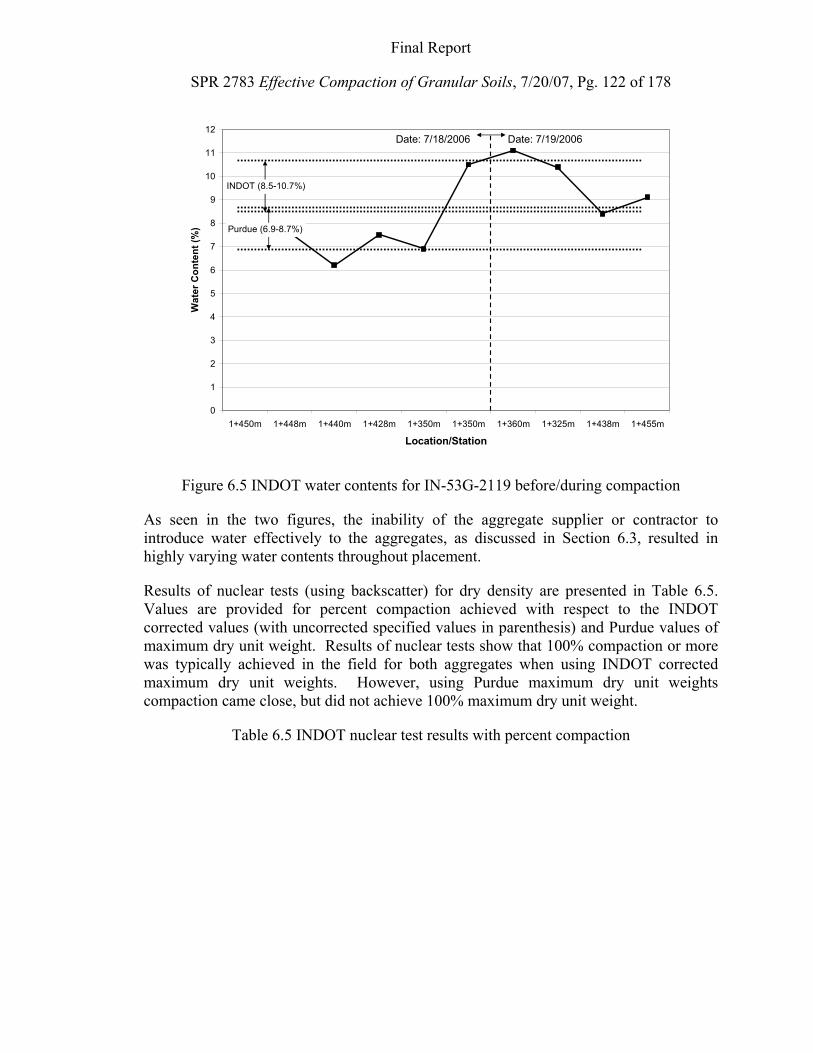
Final Report
SPR 2783 Effective Compaction of Granular Soils, 7/20/07, Pg. 122 of 178
0
1
2
3
4
5
6
7
8
9
10
11
12
1+450m 1+448m 1+440m 1+428m 1+350m 1+350m 1+360m 1+325m 1+438m 1+455m
Location/Station
Wat
er C
onte
nt (%
)
Date: 7/18/2006 Date: 7/19/2006
INDOT (8.5-10.7%)
Purdue (6.9-8.7%)
Figure 6.5 INDOT water contents for IN-53G-2119 before/during compaction
As seen in the two figures, the inability of the aggregate supplier or contractor to introduce water effectively to the aggregates, as discussed in Section 6.3, resulted in highly varying water contents throughout placement.
Results of nuclear tests (using backscatter) for dry density are presented in Table 6.5. Values are provided for percent compaction achieved with respect to the INDOT corrected values (with uncorrected specified values in parenthesis) and Purdue values of maximum dry unit weight. Results of nuclear tests show that 100% compaction or more was typically achieved in the field for both aggregates when using INDOT corrected maximum dry unit weights. However, using Purdue maximum dry unit weights compaction came close, but did not achieve 100% maximum dry unit weight.
Table 6.5 INDOT nuclear test results with percent compaction
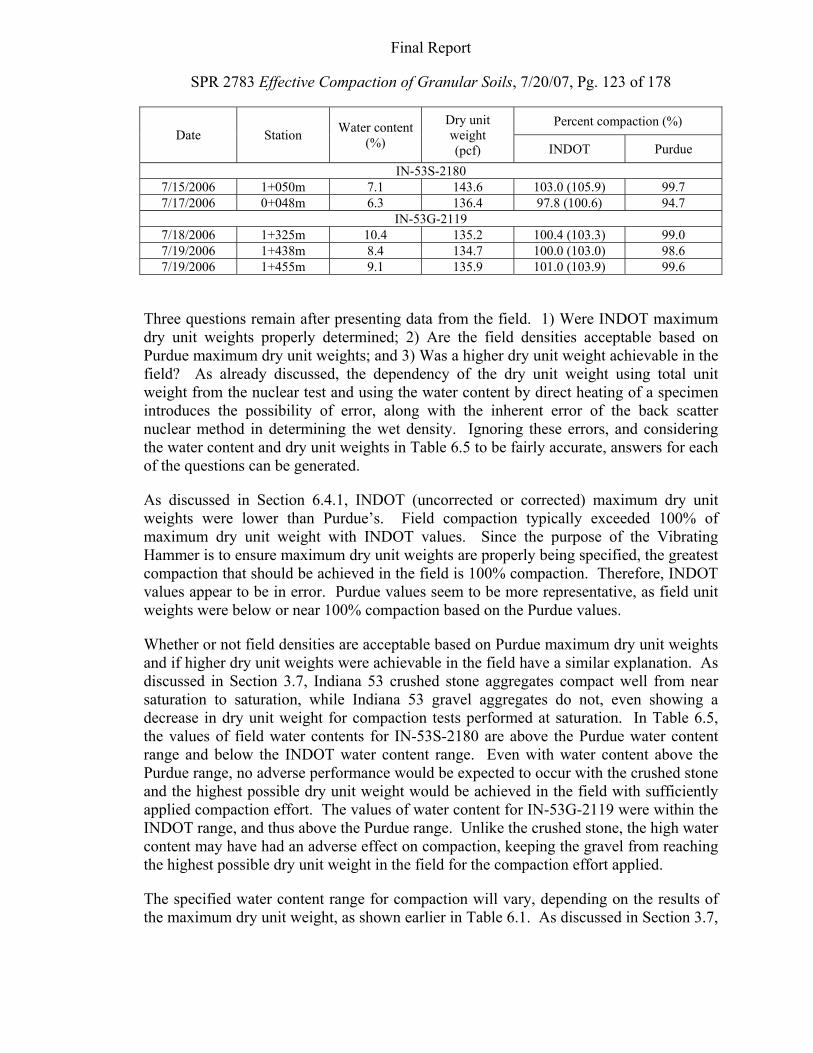
Final Report
SPR 2783 Effective Compaction of Granular Soils, 7/20/07, Pg. 123 of 178
Date Station Water content (%)
Dry unit weight (pcf)
Percent compaction (%)
INDOT Purdue
IN-53S-2180 7/15/2006 1+050m 7.1 143.6 103.0 (105.9) 99.7 7/17/2006 0+048m 6.3 136.4 97.8 (100.6) 94.7
IN-53G-2119 7/18/2006 1+325m 10.4 135.2 100.4 (103.3) 99.0 7/19/2006 1+438m 8.4 134.7 100.0 (103.0) 98.6 7/19/2006 1+455m 9.1 135.9 101.0 (103.9) 99.6
Three questions remain after presenting data from the field. 1) Were INDOT maximum dry unit weights properly determined; 2) Are the field densities acceptable based on Purdue maximum dry unit weights; and 3) Was a higher dry unit weight achievable in the field? As already discussed, the dependency of the dry unit weight using total unit weight from the nuclear test and using the water content by direct heating of a specimen introduces the possibility of error, along with the inherent error of the back scatter nuclear method in determining the wet density. Ignoring these errors, and considering the water content and dry unit weights in Table 6.5 to be fairly accurate, answers for each of the questions can be generated.
As discussed in Section 6.4.1, INDOT (uncorrected or corrected) maximum dry unit weights were lower than Purdue’s. Field compaction typically exceeded 100% of maximum dry unit weight with INDOT values. Since the purpose of the Vibrating Hammer is to ensure maximum dry unit weights are properly being specified, the greatest compaction that should be achieved in the field is 100% compaction. Therefore, INDOT values appear to be in error. Purdue values seem to be more representative, as field unit weights were below or near 100% compaction based on the Purdue values.
Whether or not field densities are acceptable based on Purdue maximum dry unit weights and if higher dry unit weights were achievable in the field have a similar explanation. As discussed in Section 3.7, Indiana 53 crushed stone aggregates compact well from near saturation to saturation, while Indiana 53 gravel aggregates do not, even showing a decrease in dry unit weight for compaction tests performed at saturation. In Table 6.5, the values of field water contents for IN-53S-2180 are above the Purdue water content range and below the INDOT water content range. Even with water content above the Purdue range, no adverse performance would be expected to occur with the crushed stone and the highest possible dry unit weight would be achieved in the field with sufficiently applied compaction effort. The values of water content for IN-53G-2119 were within the INDOT range, and thus above the Purdue range. Unlike the crushed stone, the high water content may have had an adverse effect on compaction, keeping the gravel from reaching the highest possible dry unit weight in the field for the compaction effort applied.
The specified water content range for compaction will vary, depending on the results of the maximum dry unit weight, as shown earlier in Table 6.1. As discussed in Section 3.7,
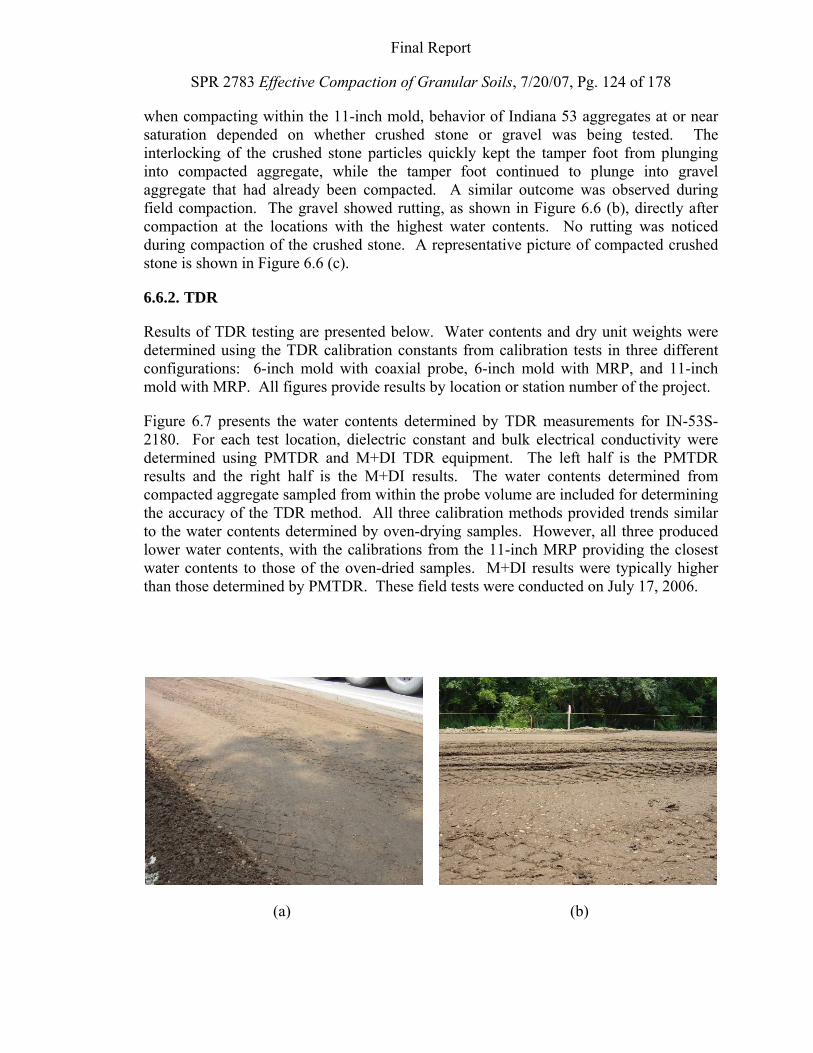
Final Report
SPR 2783 Effective Compaction of Granular Soils, 7/20/07, Pg. 124 of 178
when compacting within the 11-inch mold, behavior of Indiana 53 aggregates at or near saturation depended on whether crushed stone or gravel was being tested. The interlocking of the crushed stone particles quickly kept the tamper foot from plunging into compacted aggregate, while the tamper foot continued to plunge into gravel aggregate that had already been compacted. A similar outcome was observed during field compaction. The gravel showed rutting, as shown in Figure 6.6 (b), directly after compaction at the locations with the highest water contents. No rutting was noticed during compaction of the crushed stone. A representative picture of compacted crushed stone is shown in Figure 6.6 (c).
6.6.2. TDR
Results of TDR testing are presented below. Water contents and dry unit weights were determined using the TDR calibration constants from calibration tests in three different configurations: 6-inch mold with coaxial probe, 6-inch mold with MRP, and 11-inch mold with MRP. All figures provide results by location or station number of the project.
Figure 6.7 presents the water contents determined by TDR measurements for IN-53S-2180. For each test location, dielectric constant and bulk electrical conductivity were determined using PMTDR and M+DI TDR equipment. The left half is the PMTDR results and the right half is the M+DI results. The water contents determined from compacted aggregate sampled from within the probe volume are included for determining the accuracy of the TDR method. All three calibration methods provided trends similar to the water contents determined by oven-drying samples. However, all three produced lower water contents, with the calibrations from the 11-inch MRP providing the closest water contents to those of the oven-dried samples. M+DI results were typically higher than those determined by PMTDR. These field tests were conducted on July 17, 2006.
(a) (b)
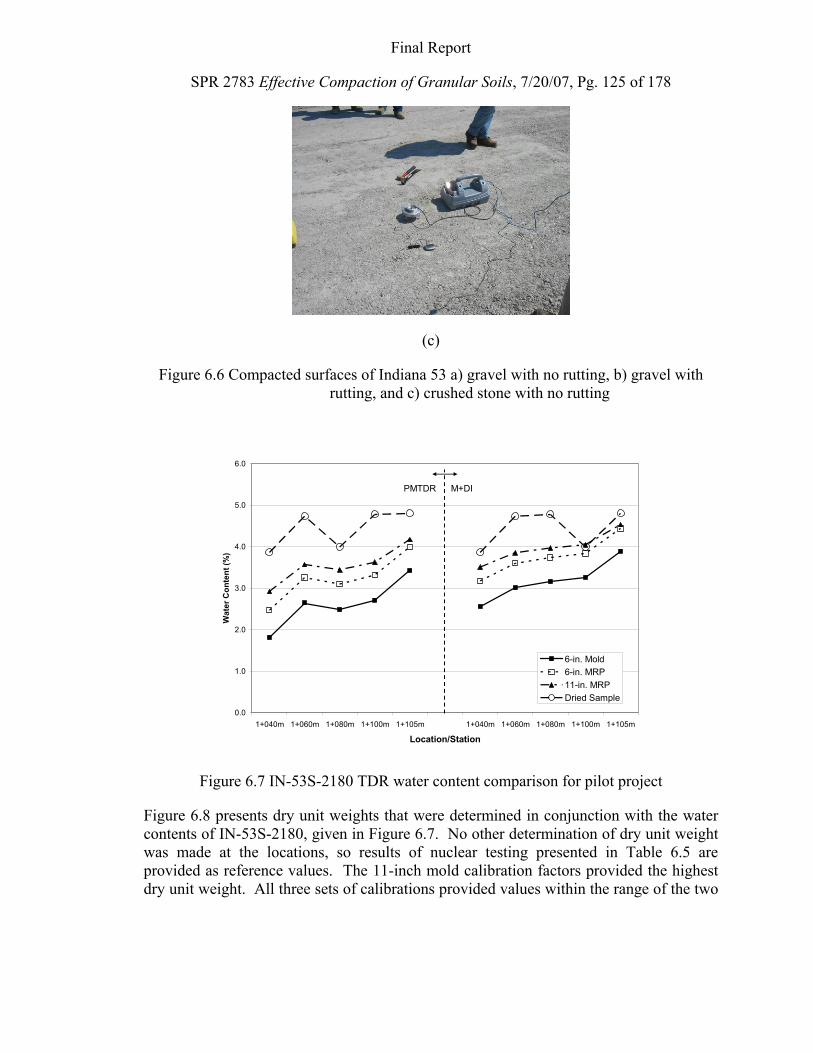
Final Report
SPR 2783 Effective Compaction of Granular Soils, 7/20/07, Pg. 125 of 178
(c)
Figure 6.6 Compacted surfaces of Indiana 53 a) gravel with no rutting, b) gravel with rutting, and c) crushed stone with no rutting
0.0
1.0
2.0
3.0
4.0
5.0
6.0
1+040m 1+060m 1+080m 1+100m 1+105m 1+040m 1+060m 1+080m 1+100m 1+105m
Location/Station
Wat
er C
onte
nt (%
)
6-in. Mold6-in. MRP11-in. MRPDried Sample
PMTDR M+DI
Figure 6.7 IN-53S-2180 TDR water content comparison for pilot project
Figure 6.8 presents dry unit weights that were determined in conjunction with the water contents of IN-53S-2180, given in Figure 6.7. No other determination of dry unit weight was made at the locations, so results of nuclear testing presented in Table 6.5 are provided as reference values. The 11-inch mold calibration factors provided the highest dry unit weight. All three sets of calibrations provided values within the range of the two
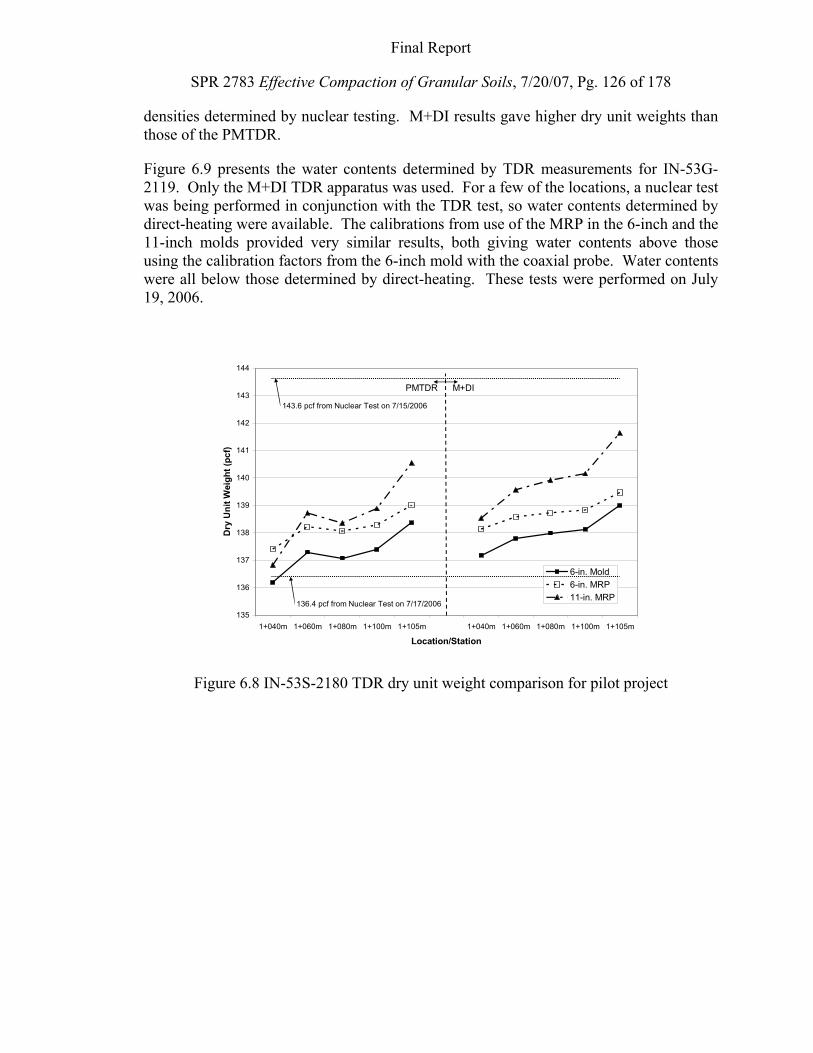
Final Report
SPR 2783 Effective Compaction of Granular Soils, 7/20/07, Pg. 126 of 178
densities determined by nuclear testing. M+DI results gave higher dry unit weights than those of the PMTDR.
Figure 6.9 presents the water contents determined by TDR measurements for IN-53G-2119. Only the M+DI TDR apparatus was used. For a few of the locations, a nuclear test was being performed in conjunction with the TDR test, so water contents determined by direct-heating were available. The calibrations from use of the MRP in the 6-inch and the 11-inch molds provided very similar results, both giving water contents above those using the calibration factors from the 6-inch mold with the coaxial probe. Water contents were all below those determined by direct-heating. These tests were performed on July 19, 2006.
135
136
137
138
139
140
141
142
143
144
1+040m 1+060m 1+080m 1+100m 1+105m 1+040m 1+060m 1+080m 1+100m 1+105m
Location/Station
Dry
Uni
t Wei
ght (
pcf)
6-in. Mold6-in. MRP11-in. MRP
PMTDR M+DI
143.6 pcf from Nuclear Test on 7/15/2006
136.4 pcf from Nuclear Test on 7/17/2006
Figure 6.8 IN-53S-2180 TDR dry unit weight comparison for pilot project
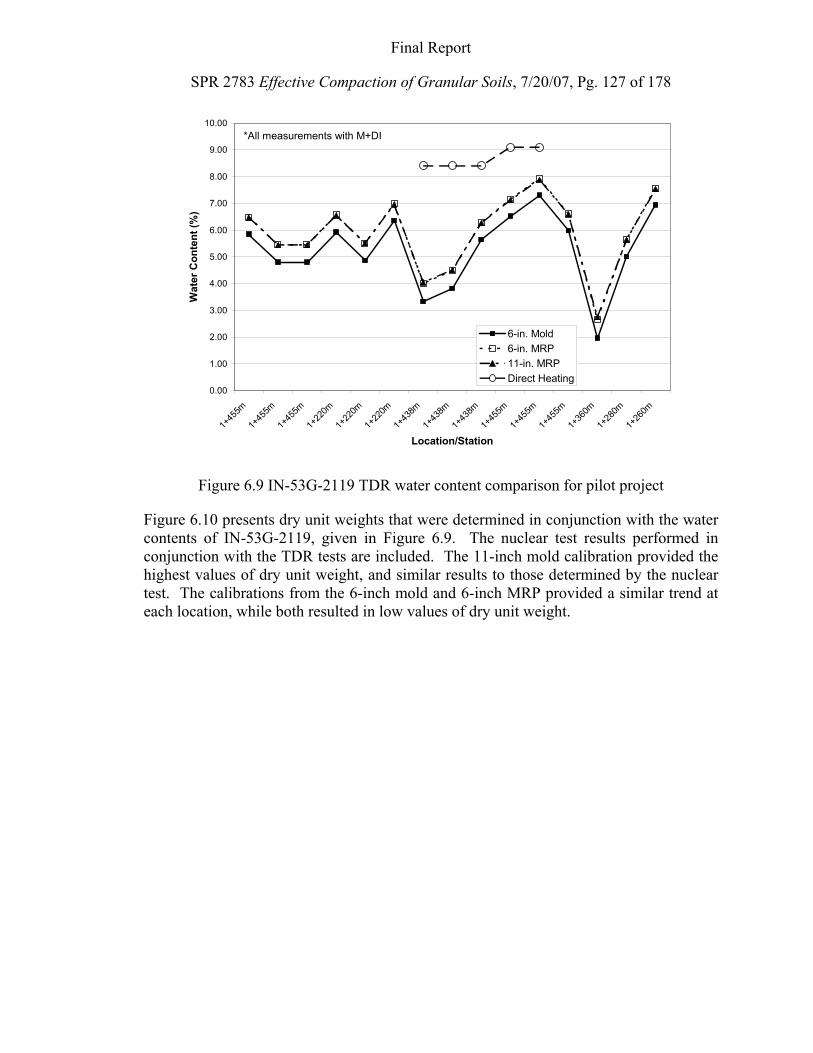
Final Report
SPR 2783 Effective Compaction of Granular Soils, 7/20/07, Pg. 127 of 178
0.00
1.00
2.00
3.00
4.00
5.00
6.00
7.00
8.00
9.00
10.00
1+45
5m
1+45
5m
1+45
5m
1+22
0m
1+22
0m
1+22
0m
1+43
8m
1+43
8m
1+43
8m
1+45
5m
1+45
5m
1+45
5m
1+36
0m
1+28
0m
1+26
0m
Location/Station
Wat
er C
onte
nt (%
)
6-in. Mold6-in. MRP11-in. MRPDirect Heating
*All measurements with M+DI
Figure 6.9 IN-53G-2119 TDR water content comparison for pilot project
Figure 6.10 presents dry unit weights that were determined in conjunction with the water contents of IN-53G-2119, given in Figure 6.9. The nuclear test results performed in conjunction with the TDR tests are included. The 11-inch mold calibration provided the highest values of dry unit weight, and similar results to those determined by the nuclear test. The calibrations from the 6-inch mold and 6-inch MRP provided a similar trend at each location, while both resulted in low values of dry unit weight.
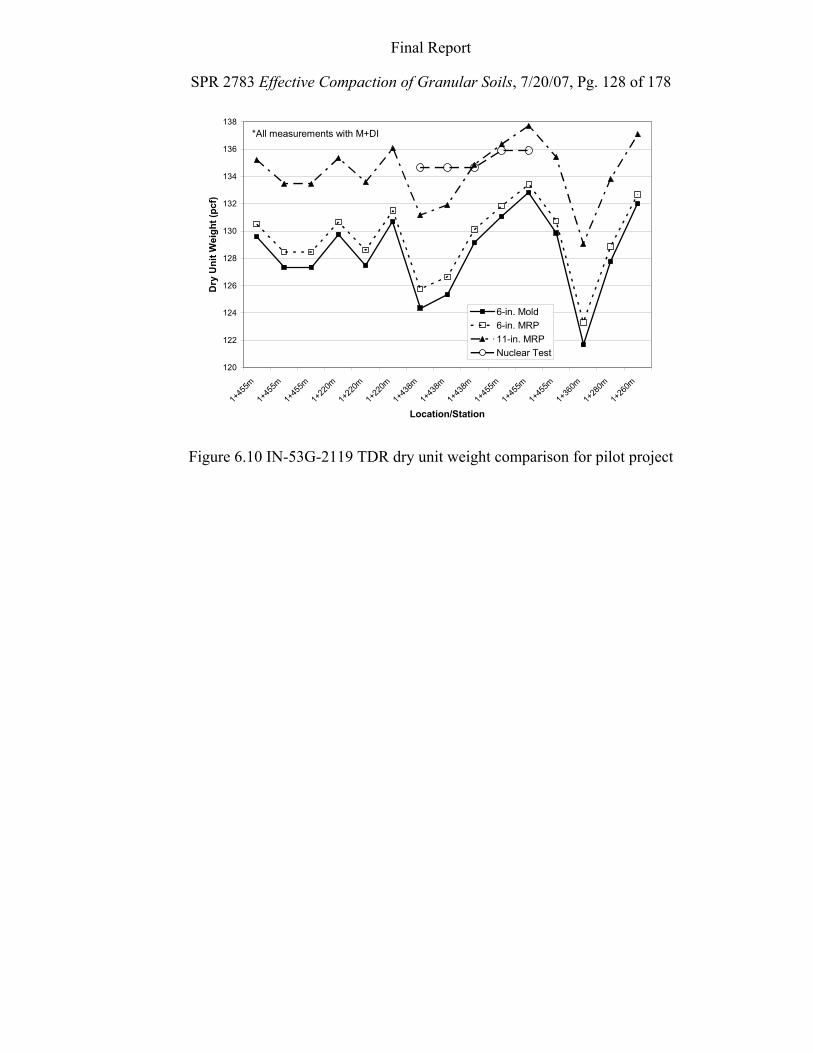
Final Report
SPR 2783 Effective Compaction of Granular Soils, 7/20/07, Pg. 128 of 178
120
122
124
126
128
130
132
134
136
138
1+45
5m
1+45
5m
1+45
5m
1+22
0m
1+22
0m
1+22
0m
1+43
8m
1+43
8m
1+43
8m
1+45
5m
1+45
5m
1+45
5m
1+36
0m
1+28
0m
1+26
0m
Location/Station
Dry
Uni
t Wei
ght (
pcf)
6-in. Mold6-in. MRP11-in. MRPNuclear Test
*All measurements with M+DI
Figure 6.10 IN-53G-2119 TDR dry unit weight comparison for pilot project
Final Report
SPR 2783 Effective Compaction of Granular Soils, 7/20/07, Pg. 129 of 178
CHAPTER 7. CONCLUSIONS AND RECOMMENDATIONS
7.1. Summary of Results and Conclusions
7.1.1. Vibrating Hammer
The Vibrating Hammer gives the same or higher maximum dry unit weight compared to Proctor tests for granular soils with any gradation, based on this research and that of Prochaska (2004). Additionally, the Vibrating Hammer provides a range of water contents for effective field compaction and takes less time to perform when using the 6-inch mold than Proctor tests.
Oversize corrections applied to Vibrating Hammer tests on scalped materials tested in a 6-inch mold compare well with tests in a 11-inch mold with no scalping. Based on past research and theory of oversize corrections, the correction method seems to work. Thus, the Vibrating Hammer test in the 6-inch mold can be used with materials containing oversize particles, up to 30% by mass.
Prochaska (2004) showed that for the granular soils he tested, maximum dry unit weights occurred at oven-dry conditions. Evans (2006) showed that for some coarse granular soils maximum dry unit weight may occur at or near saturation. Bulking occurred at intermediate water contents for both types of granular soils, which means that the maximum dry unit weights will occur for the materials at oven-dry or at or near saturation. Thus, when performing tests on granular soils whose compaction behavior has not been previously defined, two Vibrating Hammer tests should be performed, one on oven-dry material and a second one with water content near saturation.
A pilot implementation project showed that the Vibrating Hammer Method of Compaction is applicable to the placement of well-graded aggregate bases; as the performance of compaction equipment in the field was sufficient to achieve specified maximum dry unit weights. Recommendations for the range of water contents at the time of compaction provided by the Vibrating Hammer tests provides efficient compaction to specified dry densities assuming that the compaction equipment used provides a sufficient amount of energy.
Therefore, the Vibrating Hammer appears to be a better alternative than the Proctor and Vibrating Table tests for granular soils based on past research and this research.
7.1.2. Time Domain Reflectometry
Three different calibration procedures were carried out in the lab to understand the effects of oversize particles on determination of dry density and moisture content using TDR.
Final Report
SPR 2783 Effective Compaction of Granular Soils, 7/20/07, Pg. 130 of 178
Calibrations performed with the 11-inch mold with MRP and with un-scalped soil appear to be the best method for field applications. Use of the MRP configuration with the 6-inch mold causes additional disturbance caused by the confinement of the mold due to the driving of the additional three spikes near the mold wall. Also, both calibrations in the 6-inch mold may not reflect field applications because of the scalping of particles and there are no available corrections to the calibrations for scalping.
Field testing with TDR showed that field water contents were low for all three lab configuration calibrations. The reason for this is not understood at this time. Dry unit weights appear to be accurate compared with nuclear testing when using the calibrations from tests in the 11-inch mold with the MRP. Thus, TDR shows promise in determining maximum dry unit weights in the field for soils containing oversize particles.
7.2. Recommendations for Future Research (Further Study)
Implementation of an ASTM standard typically requires precision of the method to be determined. Therefore, an inter-laboratory or beta testing program should be designed and conducted for this. A program may consist of determining within-laboratory repeatability for a single-operator and between-laboratory reproducibility for multiple laboratories. These determinations can be done for performing a single test or three replicate tests for each soil.
Calibration for the TDR in the 11-inch mold provides the most accurate values for the field TDR tests. However, performing compaction tests in an 11-inch mold are more difficult due to the volume of material required, masses involved, and time to perform the test. Therefore, it would be beneficial to develop a method using a smaller mold to more accurately reflect the MRP probe configuration in the field. For example, a correction factor could be applied to calibrations performed in a 6-inch mold to account for oversize particles and disturbance.
7.3. Recommendations for Implementation
The current INDOT Specification (202.34 (b) 2) requires correction of densities from laboratory compaction tests to account for oversized particles, but does not provide guidance on how to make these corrections. (This specification is not being followed primarily because procedures for doing so are not specified. This finding may be the biggest reason why granular fills with oversized particles are under performing.) This INDOT Specification needs to be changed to include reference to AASHTO T 224 to provide the procedures for making adjustments to both density and optimum water content from laboratory compaction tests for soils with oversized particles.
Final Report
SPR 2783 Effective Compaction of Granular Soils, 7/20/07, Pg. 131 of 178
The ASTM Draft Standard includes a wet/saturated test along with the original oven-dry test. The Draft Standard is now in the final balloting process and is expected to become an ASTM Standard in late 2007 or early 2008. The Draft Standard includes testing in 6-inch and in 11-inch molds. It recommends that the 6-inch test be used, unless an 11-inch mold must be used due to soil gradation not meeting the conditions where scalping can be done and corrections applied for oversized particles. The recommendation is to adopt the Vibrating Hammer Method for laboratory determination of maximum dry density for granular materials where the amount (by mass) of non-plastic fines are less than 35 percent or the amount of plastic fines are less than 15 percent.
The final recommendation is to update specifications for compacting granular materials in the field to reflect the higher dry densities (more-correct maximum dry densities) and provide guidance that water contents of these materials must be near saturation values to provide sufficient lubrication for effective compaction. Otherwise, performance problems will continue to occur for compacted granular fills. An example for making the changes is given in Appendix D.
Final Report
SPR 2783 Effective Compaction of Granular Soils, 7/20/07, Pg. 132 of 178
ACKNOWLEDGMENTS
This work (Project: SPR 2783) was supported by the Joint Transportation Research Program administered by the Indiana Department of Transportation and Purdue University. The contents of this report reflect the views of the authors, who are responsible for the facts and the accuracy of the data presented herein, and do not necessarily reflect the official views or policies of the Federal Highway Administration and the Indiana Department of Transportation, nor do the contents constitute a standard, specification, or regulation.
The authors are grateful to the Federal Highway Administration/ Indiana Department of Transportation/ Joint Transportation Research Project for supporting this research. They appreciate the input of the Study Advisory Committee members: Daehyeon Kim (PA), Nayyar Zia Siddiqui, Kurt Sommer, Greg Pankow, and Scott Sipes all from INDOT; Lee Galivan (FHWA); Mark Behrens (The Schneider Corporation); and Junior Geiger (Geiger Development). The authors acknowledge the assistance provided by Jeff Farrar (USBR), Janet Lovell (Lab Manager), undergraduate assistants Andy King and Adam Sroka; Purdue’s Central Machine Shop; INDOT Crawfordsville District, especially Kurt Sommer and Mike Nelson; INDOT’s Ivy Tech Access Road Project personnel, especially John Carpenter and Larry Bennett; and Vulcan Materials in this research.
Final Report
SPR 2783 Effective Compaction of Granular Soils, 7/20/07, Pg. 133 of 178
LIST OF REFERENCES
AASHTO M 145-91 (2000). Standard Specification for Classification of Soils and Soil-Aggregate Mixtures for Highway Construction Purposes. Standard Specifications for Transportation Materials and Methods of Sampling and Testing, Part I: Specifications. Washington, D.C.: American Association of State Highway and Transportation Officials.
AASHTO M 231-95 (2002). Standard Specification for Weighing Devices Used in the Testing of Materials, American Association of State Highway and Transportation Officials.
AASHTO T 99-01 (2001). Standard Method of Test for Moisture-Density Relations of Soils Using a 2.5 kg (5.5-lb) Rammer and a 305-mm (12-in.) Drop. Standard Specifications for Transportation Materials and Methods of Sampling and Testing, Part II: Methods of Sampling and Testing. Washington, D.C.: American Association of State Highway and Transportation Officials.
AASHTO T 180-01 (2001). Standard Method of Test for Moisture-Density Relations of Soils Using a 4.54-kg (10-lb) Rammer and a 457-mm (18-in.) Drop. Standard Specifications for Transportation Materials and Methods of Sampling and Testing, Part II: Methods of Sampling and Testing. Washington, D.C.: American Association of State Highway and Transportation Officials.
AASHTO T 224-01 (2001). Standard Method of Test for Correction for Coarse Particles in the Soil Compaction Test. Standard Specifications for Transportation Materials and Methods of Sampling and Testing, Part II: Methods of Sampling and Testing. Washington, D.C.: American Association of State Highway and Transportation Officials.
AASHTO T 272-04 (2004). Standard Method of Test for Family of Curves—One Point Method. Standard Specifications for Transportation Materials and Methods of Sampling and Testing, Part II: Methods of Sampling and Testing. Washington, D.C.: American Association of State Highway and Transportation Officials.
AASHTO T 191-02. (2004). “Standard Method of Test for Density of Soil In-Place by the Sand-Cone Method.” Standard Specifications for Transportation Materials and Methods of Sampling and Testing, Part II: Methods of Sampling and Testing. Washington, D.C.: American Association of State Highway and Transportation Officials.
AASHTO T 310-06. (2006). “Standard Method of Test In-Place Density and Moisture Content of Soil and Soil-Aggregate by Nuclear Methods.” Standard Specifications for Transportation Materials and Methods of Sampling and Testing, Part II: Methods of Sampling and Testing. Washington, D.C.: American Association of State Highway and Transportation Officials.
Final Report
SPR 2783 Effective Compaction of Granular Soils, 7/20/07, Pg. 134 of 178
Anderegg, R., and Kaufmann, K. (2004). “Intelligent Compaction with Vibratory Rollers—revised Version”. 83rd TRB Annual Meeting, Washington, DC, January, 2004.
ASTM C 127-01 (2001). Standard Test Method for Density, Relative Density (Specific Gravity), and Absorption of Coarse Aggregate. Annual Book of ASTM Standards, Vol. 04.02. West Conshohocken, PA: ASTM International.
ASTM C 128-01 (2001). Standard Test Method for Density, Relative Density (Specific Gravity), and Absorption of Fine Aggregate. Annual Book of ASTM Standards, Vol. 04.02. West Conshohocken, PA: ASTM International.
ASTM C 136-01 (2001). Standard Test Method for Sieve Analysis of Fine and Coarse Aggregates. Annual Book of ASTM Standards, Vol. 04.02. West Conshohocken, PA: ASTM International.
ASTM C 702-98 (1998). Standard Practice for Reducing Samples of Aggregate to Testing Size. Annual Book of ASTM Standards, Vol. 04.02. West Conshohocken, PA: ASTM International.
ASTM C 778-02 (2002). Standard Specification for Standard Sand. Annual Book of ASTM Standards, Vol. 04.01. West Conshohocken, PA: ASTM International.
ASTM C 1435-99 (1999). Standard Practice for Molding Roller-Compacted Concrete in Cylinder Molds Using a Vibrating Hammer. Annual Book of ASTM Standards, Vol. 04.02. West Conshohocken, PA: ASTM International.
ASTM D 422-63 (1963). Standard Test Method for Particle-Size Analysis of Soils. Annual Book of ASTM Standards, Vol. 04.08. West Conshohocken, PA: ASTM International.
ASTM D 653 – 05 (2006). Standard Terminology Relating to Soil, Rock, and Contained Fluids, Annual Book of ASTM Standards, Vol. 04.08. West Conshohocken, PA: ASTM International.
ASTM D 698-00a (2000). Standard Test Methods for Laboratory Compaction Characteristics of Soil Using Standard Effort (12,400 ft-lbf/ft3 (600 kN-m/m3)). Annual Book of ASTM Standards, Vol. 04.08. West Conshohocken, PA: ASTM International.
ASTM D 854-02 (2002). Standard Test Methods for Specific Gravity of Soil Solids by Water Pycnometer. Annual Book of ASTM Standards, Vol. 04.08. West Conshohocken, PA: ASTM International.
ASTM D 1140-00 (2000). Standard Test Methods for Amount of Material in Soils Finer Than the No. 200 (75-�m) Sieve. Annual Book of ASTM Standards, Vol. 04.08. West Conshohocken, PA: ASTM International.
Final Report
SPR 2783 Effective Compaction of Granular Soils, 7/20/07, Pg. 135 of 178
ASTM D 1556-00 (2000). Standard Test Method for Density and Unit Weight of Soil in Place by the Sand-Cone Method. Annual Book of ASTM Standards, Vol. 04.08. West Conshohocken, PA: ASTM International.
ASTM D 1557-00 (2000). Standard Test Methods for Laboratory Compaction Characteristics of Soil Using Modified Effort (56,000 ft-lbf/ft3 (2,700 kN-m/m3)). Annual Book of ASTM Standards, Vol. 04.08. West Conshohocken, PA: ASTM International.
ASTM D 1559-75 (1975). Standard Test Method for Resistance to Plastic Flow of Bituminous Mixtures Using Marshall Apparatus-(Discontinued 1985; No Replacement). Annual Book of ASTM Standards, Vol. 04.08. West Conshohocken, PA: ASTM International.
ASTM D 2167-94 (1998). Standard Test Method for Density and Unit Weight of Soil in Place by the Rubber Balloon Method. Annual Book of ASTM Standards, Vol. 04.08. West Conshohocken, PA: ASTM International.
ASTM D 2216-98 (1998). Standard Test Method for Laboratory Determination of Water (Moisture) Content of Soil and Rock by Mass. Annual Book of ASTM Standards, Vol. 04.08. West Conshohocken, PA: ASTM International.
ASTM D 2487-00 (2000). Standard Practice for Classification of Soils for Engineering Purposes (Unified Soil Classification System). Annual Book of ASTM Standards, Vol. 04.08. West Conshohocken, PA: ASTM International.
ASTM D 2488-00 (2000). Standard Practice for Description and Identification of Soils (Visual-Manual Procedure). Annual Book of ASTM Standards, Vol. 04.08. West Conshohocken, PA: ASTM International.
ASTM D 2922-01 (2001). Standard Test Methods for Density of Soil and Soil-Aggregate in Place by Nuclear Methods (Shallow Depth). Annual Book of ASTM Standards, Vol. 04.08. West Conshohocken, PA: ASTM International.
ASTM D 3017-01 (2001). Standard Test Method for Water Content of Soil and Rock in Place by Nuclear Methods (Shallow Depth). Annual Book of ASTM Standards, Vol. 04.08. West Conshohocken, PA: ASTM International.
ASTM D 4253-00 (2000). Standard Test Methods for Maximum Index Density and Unit Weight of Soils Using a Vibratory Table. Annual Book of ASTM Standards, Vol. 04.08. West Conshohocken, PA: ASTM International.
ASTM D 4254-00 (2000). Standard Test Methods for Minimum Index Density and Unit Weight of Soils and Calculation of Relative Density. Annual Book of ASTM Standards, Vol. 04.08. West Conshohocken, PA: ASTM International.
Final Report
SPR 2783 Effective Compaction of Granular Soils, 7/20/07, Pg. 136 of 178
ASTM D 4318-00 (2000). Standard Test Methods for Liquid Limit, Plastic Limit, and Plasticity Index of Soils. Annual Book of ASTM Standards, Vol. 04.08. West Conshohocken, PA: ASTM International.
ASTM D 4718-87 (1987). Standard Practice for Correction of Unit Weight and Water Content for Soils Containing Oversized Particles. Annual Book of ASTM Standards, Vol. 04.08. West Conshohocken, PA: ASTM International.
ASTM D 4944-98 (1998). Standard Test Method for Field Determination of Water (Moisture) Content of Soil by the Calcium Carbide Gas Pressure Tester Method. Annual Book of ASTM Standards, Vol. 04.08. West Conshohocken, PA: ASTM International.
ASTM D 6780-02 (2005). Standard Test Method for Water Content and Density of Soil in Place by Time Domain Reflectometry (TDR). Annual Book of ASTM Standards, Vol. 04.09. West Conshohocken, PA: ASTM International.
ASTM D 6951-03 (2003). Standard Test Method for Use of the Dynamic Cone Penetrometer in Shallow Pavement Applications. Annual Book of ASTM Standards, Vol. 04.09. West Conshohocken, PA: ASTM International.
Benavidez, A.A., and Young, R.A. (n.d. a). “Comparison of Vibratory Compaction Methods Used to Determine Maximum Index Dry Unit Weight of Cohesionless Soil Containing ¾-inch Maximum Size Particles”. Unpublished manuscript. Earth Sciences and Research Laboratory, Technical Service Center, Bureau of Reclamation, Denver, CO.
Benavidez, A.A., and Young, R.A. (n.d. b). “Development of a Method to Verify Suitable Performance of Vibratory Hammers Used in USBR 5535”. Unpublished manuscript. Earth Sciences and Research Laboratory, Technical Service Center, Bureau of Reclamation, Denver, CO.
Benavidez, A.A., and Young, R.A. (n.d. c). “Development of a USBR Vibratory Compaction Method to Determine Maximum Index Dry Unit Weight of Cohesionless Soil Containing 3-inch Maximum Size Particles”. Unpublished manuscript. Earth Sciences and Research Laboratory, Technical Service Center, Bureau of Reclamation, Denver, CO.
Benavidez, A.A., and Young, R.A. (n.d. d). “USBR Study to Evaluate Effect of Vibration Method on Maximum Index Dry Unit Weight of Cohesionless Soil”. Unpublished manuscript. Earth Sciences and Research Laboratory, Technical Service Center, Bureau of Reclamation, Denver, CO.
Bergeson, K., Jahren, C., Wermager, M., and White, D. (1998). “Embankment Quality Phase I Report”. Iowa DOT Project TR-402, CTRE Management Project 97-8. Ames: Iowa State University.
Final Report
SPR 2783 Effective Compaction of Granular Soils, 7/20/07, Pg. 137 of 178
Bosch (2002/2003). Power Tools and Accessories Catalog.
Brand, E.W. (1973). “Some Observations on the Control of Density by Vibration”. In E.T. Selig and R.S. Ladd (Eds.), Evaluation of Relative Density and its Role in Geotechnical Projects Involving Cohesionless Soils: ASTM Special Technical Publication No. 523, pp. 121-132. Philadelphia: American Society for Testing and Materials.
BS 1377:1975 Test 14 (1975). Determination of the dry density/moisture content relationship of granular soil (vibrating hammer method). BS 1377-4: Methods of test for soil for civil engineering purposes. Compaction-related tests. London: British Standards Institution.
BS 1924:1975 Test 2 (1975). Determination of the dry density/moisture content relationship of stabilized granular soil (vibrating hammer method). BS 1924-2: Stabilized materials for civil engineering purposes. Methods of test for cement-stabilized and lime-stabilized materials. London: British Standards Institution.
BS 5835: Part 1: 1980 (1980). Compactibility test for graded aggregates. BS 5835: Recommendations for Testing of aggregates. London: British Standards Institution.
Burmister, D.M. (1965). “Environmental Factors in Soil Compaction”. In Compaction of Soils: ASTM Special Publication No. 377, pp. 47-66. Philadelphia: American Society for Testing and Materials.
Cumberledge, G., and Cominsky, R.J. (1973). “Maximum Density Determination of Subbase Materials”. In E.T. Selig and R.S. Ladd (Eds.), Evaluation of Relative Density and its Role in Geotechnical Projects Involving Cohesionless Soils: ASTM Special Technical Publication No. 523, pp. 141-155. Philadelphia: American Society for Testing and Materials.
D’Appolonia, D.J., Whitman, R.V., and D’Appolonia, E. (1969). “Sand Compaction with Vibratory Rollers,” Journal of the Soil Mechanics and Foundations Division, Vol. 95, No. 1, pp. 263-284.
Das, B.M. (2002). “Principles of Geotechnical Engineering.” Fifth Edition. Brooks/Cole, Pacific Grove, California.
Day, R.W. (1989). “Relative Compaction of Fill Having Oversize Particles,” Journal of Geotechnical Engineering, Vol. 115 , No. 10, pp. 1487-1491.
Day, R.W. (1995). “Case Study of Settlement of Gravelly Sand Backfill,” Journal of Performance of Constructed Facilities, Vol. 9, No. 3, pp. 184-193.
Dickin, E.A. (1973). “Influence of Grain Shape and Size upon the Limiting Porosities of Sands”. In E.T. Selig and R.S. Ladd (Eds.), Evaluation of Relative Density and its Role
Final Report
SPR 2783 Effective Compaction of Granular Soils, 7/20/07, Pg. 138 of 178
in Geotechnical Projects Involving Cohesionless Soils: ASTM Special Technical Publication No. 523, pp. 113-120. Philadelphia: American Society for Testing and Materials.
Dallinger, T.E., (2006) “Geometric and temperature effects on time domain reflectometry measurements in soils.” Thesis in partial fulfillment of the requirements for the degree of Masters of Science in Civil Engineering, Purdue University, West Lafayette, Indiana, December.
Durham Geo Slope Indicator (DGSI). (2005). “Moisture + Density Indicator (M+DI) [Brochure].” Durham Geo Slope Indicator, USA.
Drnevich, V. P., Yu, X., Lovell, J., and Tishmack, J. K. (2001). “Temperature effects on dielectric constant determined by Time Domain Reflectometry.’’ TDR 2001: Innovative applications of TDR technology, Infrastructure Technology Institute. Northwestern University, Evanston, Illinois.
Evans, A.C., (2006) “Compaction control of large-sized granular soils/aggregates: the vibrating hammer method of compaction and time domain reflectometry.” Thesis in partial fulfillment of the requirements for the degree of Masters of Science in Civil Engineering, Purdue University, West Lafayette, Indiana, December, 196 p.
Feng, W. (1999). “Simulation of time domain reflectometry based on soil dielectric properties.” Dissertation in partial fulfillment of the requirements for the degree of Doctor of Philosophy, Purdue University, West Lafayette, Indiana, May.
Forssblad, L. (1980). “Compaction meter on vibrating rollers for improved compaction control”. Proceedings from International conference on compaction, Volume 1, Paris, April 1980, pp. 541-546.
Forssblad, L. (1981). Vibratory Soil and Rock Fill Compaction. Solna, Sweden: Dynapac Maskin AB.
Garga, V.K., and Madureira, C.J. (1985). “Compaction Characteristics of River Terrace Gravel,” Journal of Geotechnical Engineering, Vol. 111, No. 8, pp. 987-1007.
Giese, K. and Tiemann, R. (1975). “Determination of the complex permittivity from thin-sample time domain reflectometry: Improved analysis of the step response waveform.” Advanced Molecular Relaxation Processes, 7, p. 45-49.
Gordon, B.B., Hammond, W.D., and Miller, R.K. (1965). “Effect of Rock Content on Compaction Characteristics of Clayey Gravel”. In Compaction of Soils: ASTM Special Publication No. 377, pp. 31-46. Philadelphia: American Society for Testing and Materials.
Final Report
SPR 2783 Effective Compaction of Granular Soils, 7/20/07, Pg. 139 of 178
Hansbo, S., and Pramborg, B. (1980). “Compaction control”. Proceedings from International conference on compaction, Volume 1, Paris, April 1980, pp. 559-564.
Head, K.H. (1980). Manual of Soil Laboratory Testing Volume 1: Soil Classification and Compaction Tests. London: Pentech Press.
Hilf, J.W. (1991). “Compacted Fill”. In H.-Y. Fang (Ed.), Foundation Engineering Handbook, 2nd Edition, pp. 249-316. New York: Van Nostrand Reinhold.
Holtz, R.D., and Kovacs, W.D. (1981). An Introduction to Geotechnical Engineering, Chapter 5: Compaction, pp. 109-165. Englewood Cliffs, NJ: Prentice Hall, Inc.
Holtz, W.G. (1973). “The Relative Density Approach—Uses, Testing Requirements, Reliability, and Shortcomings”. In E.T. Selig and R.S. Ladd (Eds.), Evaluation of Relative Density and its Role in Geotechnical Projects Involving Cohesionless Soils: ASTM Special Technical Publication No. 523, pp. 5-17. Philadelphia: American Society for Testing and Materials.
Holtz, W.G., and Lowitz, C.A. (1958). “Compaction Characteristics of Gravelly Soils”. In Conference on Soils for Engineering Purposes: ASTM Special Technical Publication No. 232, pp. 67-101. Philadelphia: American Society for Testing and Materials.
Holubec, I., and D’Appolonia, E. (1973). “Effect of Particle Shape on the Engineering Properties of Granular Soils”. In E.T. Selig and R.S. Ladd (Eds.), Evaluation of Relative Density and its Role in Geotechnical Projects Involving Cohesionless Soils: ASTM Special Technical Publication No. 523, pp. 304-318. Philadelphia: American Society for Testing and Materials.
Indiana Department of Transportation (INDOT). (1999). “Standard Specifications.” HTTP://WWW.IN.GOV/DOT/DIV/CONTRACTS/STANDARDS/BOOK/MAR05/MAR.HTM
Indiana Department of Transportation (INDOT). (2006a). “Standard Specifications.” HTTP://WWW.IN.GOV/DOT/DIV/CONTRACTS/STANDARDS/BOOK/SEP07/2-2008.PDF
Indiana Department of Transportation (INDOT) (2006b). “Standard Specifications.” HTTP://WWW.STATE.IN.US/DOT/DIV/TESTING/MANUALS/AGGREGATE/CHAPTER_02.PDF
Indiana Department of Transportation (INDOT) (2005), “Road Plans: Ivy Tech Access Road Project.”
Johnson, A.I. (1965). “Discussion of Research on Vibratory Maximum Density Test for Cohesionless Soils”. In Compaction of Soils: ASTM Special Publication No. 377, pp. 22-23. Philadelphia: American Society for Testing and Materials.
Johnson, A.I., and Morris, D.A. (1973). “Vibratory Compaction in the Laboratory of Granular Materials in Long Columns”. In E.T. Selig and R.S. Ladd (Eds.), Evaluation of Relative Density and its Role in Geotechnical Projects Involving Cohesionless Soils:
Final Report
SPR 2783 Effective Compaction of Granular Soils, 7/20/07, Pg. 140 of 178
ASTM Special Technical Publication No. 523, pp. 171-181. Philadelphia: American Society for Testing and Materials.
Kaufman, L.P, Strickland, E.A., and Benavidez, A.A. (1979). “Suggested Method for the Calibration of Vibrating Tables for Maximum Index Density Testing,” Geotechnical Testing Journal, Vol. 2, No. 2, pp. 152-157.
Kloubert, H.-J. (2004). “Intelligent VARIOCONTROL rollers with integrated quality control system for soil compaction: principle, measurement, applications”. 83rd TRB Annual Meeting, Washington, DC, January, 2004.
Kraus, J.D. (1984). “Electromagnetics.” Third Edition. McGraw Hill, Inc.
Krizek, R.J., and Fernandez, J.I. (1971). “Vibratory Densification of Damp Clayey Sands,” Journal of the Soil Mechanics and Foundations Division, Vol. 97, No. 8, pp. 1069-1079.
Lade, P.V., Liggio, C.D. Jr., and Yamamuro, J.A. (1998). “Effects of Non-Plastic Fines on Minimum and Maximum Void Ratios of Sand,” Geotechnical Testing Journal, Vol. 21, No. 4, pp. 336-347.
Lin, C. (1999, August). “Time domain reflectometry for soil properties.” Dissertation in partial fulfillment of the requirements for the degree of Doctor of Philosophy, Purdue University, West Lafayette, Indiana.
Lin, C.P., Tang, S.H., and Chung, C.C. (2006). “Development of TDR penetrometer through theoretical and laboratory investigations: 1. Measurement of soil dielectric permittivity.” Geotechnical Testing Journal, 29(4).
Maddison, L. (1944). “Laboratory Tests on the Effect of Stone Content on the Compaction of Soil Mortar,” Roads and Road Construction, Vol. 22, No. 254, pp. 37-40.
Marek, C.R. (1977). “Compaction of Graded Aggregate Bases and Subbases,” Transportation Engineering Journal, Vol. 103, No. 1, pp. 103-113.
Matheson, G.M. (1986). “Relationship between Compacted Rockfill Density and Gradation,” Journal of Geotechnical Engineering, Vol. 112, No. 12, pp. 1119-1124.
Matheson, G.M., and Parent, W.F. (1989). “Construction and Performance of Two Large Rockfill Embankments,” Journal of Geotechnical Engineering, Vol. 115, No. 12, pp. 1699-1716.
McCook, D.K. (1996). “Correlations Between Simple Field Test and Relative Density-Test Values,” Journal of Geotechnical Engineering, Vol. 122, No. 10, pp. 860-862.
Final Report
SPR 2783 Effective Compaction of Granular Soils, 7/20/07, Pg. 141 of 178
Miller, R.K. (1965). “Discussion of Research on Vibratory Maximum Density Test for Cohesionless Soils”. In Compaction of Soils: ASTM Special Publication No. 377, pp. 23-29. Philadelphia: American Society for Testing and Materials.
Mitchell, J.K., and Soga, K. (2005). “Fundamentals of Soil Behavior.” Third Edition. John Wiley & Sons, Inc., Hoboken, New Jersey.
Noorany, I. (1990). “Variability in Compaction Control,” Journal of Geotechnical Engineering, Vol. 116, No. 7, pp. 1132-1136.
OSHA. (2006). “Regulation 29 CFR 1910.95.” http://www.osha.gov, December
Parsons, A.W. (1992). “Compaction of soils and granular materials: A review of research performed at the transport research laboratory.” HMSO, London.
Pettibone, H.C., and Hardin, J. (1965). “Research on Vibratory Maximum Density Test for Cohesionless Soils”. In Compaction of Soils: ASTM Special Publication No. 377, pp. 3-19. Philadelphia: American Society for Testing and Materials.
Pike, D.C. (1972). “Compactability of graded aggregates. 1. Standard laboratory tests”. Department of the Environment, TRRL Laboratory Report LR 447. Transport and Road Research Laboratory, Crowthorne, Berkshire.
Ping, W.V, Leonard, M., and Yang, Z. (2003a). “Laboratory Simulation of Field Compaction Characteristics (Phase I): Final Report for the Florida Department of Transportation”. FSU Project No. 6120-549-39. Tallahassee: Florida State University.
Ping, W.V, Leonard, M., and Yang, Z. (2003b). “Evaluation of Laboratory Compaction Techniques for Simulating Field Soil Compaction (Phase II): Final Report for the Florida Department of Transportation”. FSU Project No. 6120-549-39. Tallahassee: Florida State University
Prochaska, A.B. (2004) “An alternative method for effective compaction control of granular soils.” Thesis in partial fulfillment of the requirements for the degree of Masters of Science in Civil Engineering, Purdue University, West Lafayette, Indiana, August.
Proctor, R.R. (1933a). “Fundamental Principles of Soil Compaction,” Engineering News-Record, Vol. 111, No. 9, pp. 245-248.
Proctor, R.R. (1933b). “Description of Field and Laboratory Methods,” Engineering News-Record, Vol. 111, No. 10, pp. 286-289.
Ramo, S., Whinnery, J.R., and Van Duzer, T. (1965). “Fields and Waves in Communication Electronics.” John Wiley & Sons, Inc., New York.
Final Report
SPR 2783 Effective Compaction of Granular Soils, 7/20/07, Pg. 142 of 178
Ray, P.N., and Chapman, T.G. (1954). “The British Standard Compaction Test for Soils: A Study of Some Factors Affecting the Test Results,” Geotechnique, Vol. 4, No. 4, pp. 169-177.
Rizkallah, V., and Hellweg, V. (1980). “Compaction of non cohesive soils by watering”. Proceedings from International conference on compaction, Volume 1, Paris, April 1980, pp. 357-361.
Roberts, F.L. (1976). “An Evaluation of a Proposed Test Method for Determining the Maximum Dry Density of Dense Graded Aggregate,” Journal of Testing and Evaluation, Vol. 4, No. 5, pp. 303-312.
Robinson, D., Jones, S., Wraith, J., Or, D., and Friedman, S. (2003). “A review of advances in dielectric and electrical conductivity measurement in soils using time domain reflectometry.” Vadose Zone Journal, 2, p. 444-475.
Sandström, Å.J., and Pettersson, C.B. (2004). “Intelligent Systems for QA/QC in soil compaction”. 83rd TRB Annual Meeting, Washington, DC, January, 2004.
Santamarina, J.C. (2001). “Soils and Waves.” John Willey & Sons, Ltd.
Selig, E.T. (1963). “Effect of Vibration on Density of Sand”. Proceedings of the Second Panamerican Conference on Soil Mechanics and Foundation Engineering, São Paulo, Brazil, July 1963, pp.129-143.
Selig, E.T., and Ladd, R.S. (1973). “Evaluation of Relative Density Measurements and Applications”. In E.T. Selig and R.S. Ladd (Eds.), Evaluation of Relative Density and its Role in Geotechnical Projects Involving Cohesionless Soils: ASTM Special Technical Publication No. 523, pp. 487-504. Philadelphia: American Society for Testing and Materials.
Siddiqui, S.I., and Drnevich, V.P. (1995). “A new method of measuring density and moisture content of soil using technique of time domain reflectometry.” Rep. No.: FHWA/IN/JTRP-95/9, Joint Transportation Research Program, Indiana Department of Transportation, Purdue University, West Lafayette, Indiana.
Siddiqui, S.I., Drnevich, V.P., and Deschamps, R.J. (2000). “Time domain reflectometry development for use in geotechnical engineering.” Geotechnical Testing Journal, 23(1), p. 9-20.
Silver, M.L., and Seed, H.B. (1971). “Volume Changes in Sands During Cyclic Loading,” Journal of the Soil Mechanics and Foundations Division, Vol. 97, No. 9, pp. 1171-1182.
Sipes, S. (2003). Personal interview with Scott Sipes, INDOT Engineer, on June 25.
Final Report
SPR 2783 Effective Compaction of Granular Soils, 7/20/07, Pg. 143 of 178
Spanovich, M. (1965). “Discussion of Research on Vibratory Maximum Density Test for Cohesionless Soils”. In Compaction of Soils: ASTM Special Publication No. 377, p. 20. Philadelphia: American Society for Testing and Materials.
Tavenas, F.A. (1973). “Difficulties in the Use of Relative Density as a Soil Parameter”. In E.T. Selig and R.S. Ladd (Eds.), Evaluation of Relative Density and its Role in Geotechnical Projects Involving Cohesionless Soils: ASTM Special Technical Publication No. 523, pp. 478-483. Philadelphia: American Society for Testing and Materials.
Tavenas, F.A., Ladd, R.S., and La Rochelle, P. (1973). “Accuracy of Relative Density Measurements: Results of a Comparative Test Program”. In E.T. Selig and R.S. Ladd (Eds.), Evaluation of Relative Density and its Role in Geotechnical Projects Involving Cohesionless Soils: ASTM Special Technical Publication No. 523, pp. 18-60. Philadelphia: American Society for Testing and Materials.
Tiedemann, D.A. (1973). “Variability of Laboratory Relative Density Test Results”. In E.T. Selig and R.S. Ladd (Eds.), Evaluation of Relative Density and its Role in Geotechnical Projects Involving Cohesionless Soils: ASTM Special Technical Publication No. 523, pp. 61-73. Philadelphia: American Society for Testing and Materials.
Thurner, H., and Sandström, Å. (1980). “A new device for instant compaction control”. Proceedings from International conference on compaction, Volume 1, Paris, April 1980, pp. 611-614.
Topp, G.C., Davis J.L. and Annan, A.P. (1980). “Electromagnetic determination of soil water content: Measurements in coaxial transmission lines.” Water Resource Research, 6(3), 574-582.
Townsend, F.C. (1973). “Comparisons of Vibrated Density and Standard Compaction Tests on Sands with Varying Amounts of Fines”. In E.T. Selig and R.S. Ladd (Eds.), Evaluation of Relative Density and its Role in Geotechnical Projects Involving Cohesionless Soils: ASTM Special Technical Publication No. 523, pp. 348-363. Philadelphia: American Society for Testing and Materials.
USACE (1995). “US Army Corps of Engineers EM 1110-2-1911: Construction Control for Earth and Rock-Fill Dams”, September 30.
USBR (1990). U.S. Bureau of Reclamation Earth Manual, Part 1, Third Edition. Denver, CO: United States Government Printing Office.
USBR 5500-89 (1989). Performing Laboratory Compaction of Soils—5.5-lbm Rammer and 18-in Drop. Bureau of Reclamation Earth Manual, Part 2, Third Edition (1990).
Final Report
SPR 2783 Effective Compaction of Granular Soils, 7/20/07, Pg. 144 of 178
USBR 5535-94, DRAFT (1994). Procedure for Determining the Maximum Index Unit Weight of Cohesionless Soils using a Vibratory Hammer. Unpublished manuscript.
von Hippel, A.R. (1954). “Dielectrics and Waves.” John Wiley & Sons, Inc.
Weast, R.C. (1988). “Handbook of Chemistry and Physics.” CRC Press, Boca Raton, Florida, 1988.
Walsh, K.D., Houston, W.N., and Houston, S.L. (1997). “Design Implications of Current Compaction Specification Design Practices,” Journal of Construction Engineering and Management, Vol. 123, No. 4, pp. 363-370.
White, D., Bergeson, K., Jahren, C., and Wermager, M. (1999). “Embankment Quality Phase II Final Report”. Iowa DOT Project TR-401, CTRE Management Project 97-8. Ames: Iowa State University.
White, D.J., Bergeson, K.L., and Jahren, C.T. (2002). “Embankment Quality Phase III Final Report”. Iowa DOT Project TR-401, CTRE Management Project 97-8. Ames: Iowa State University.
www.bomag.com. Bomag Americas.
www.cat.com. Caterpillar.
www.dynapac.com. Dynapac.
www.osha.gov. U.S. Department of Labor Occupational Safety and Health Administration.
www.perimeterbobcat.com. Perimeter Bobcat (Ingersoll-Rand).
www.qcqa.com. Construction Materials Technology Network.
www.wackergroup.com. Wacker construction equipment.
Youd, T.L. (1973). “Factors Controlling Maximum and Minimum Densities of Sands”. In E.T. Selig and R.S. Ladd (Eds.), Evaluation of Relative Density and its Role in Geotechnical Projects Involving Cohesionless Soils: ASTM Special Technical Publication No. 523, pp. 98-112. Philadelphia: American Society for Testing and Materials.
Yu, X. (2003). “Influence of material properties and environmental conditions on electromagnetic wave propagation in soils.” Dissertation in partial fulfillment of the requirements for the degree of Doctor of Philosophy, Purdue University, West Lafayette, Indiana.
Final Report
SPR 2783 Effective Compaction of Granular Soils, 7/20/07, Pg. 145 of 178
Yu, X. and Drnevich, V.P. (2004). “Soil water content and dry density by time domain reflectometry.” Journal of Geotechnical and Geoenvironmental Engineering, 130(9), p. 922-934.
Zambrano Narvaez, C.E., (2006) “Soil type identification using electromagnetics.” Thesis in partial fulfillment of the requirements for the degree of Masters of Science in Civil Engineering, Purdue University, West Lafayette, Indiana, May.
Zambrano, C.E., Drnevich, V.P., and Bourdeau, P. (2006) “ADVANCED COMPACTION QUALITY CONTROL,” Final Report FHWA/IN/JTRP-2006/10, SPR 2928, Joint Transportation Research Program, Purdue University, 100 p.
Zegelin, S.J., White, I., and Jenkins, D.R.. (1989). “Improved field probes for soil water content and electrical conductivity measurement using time domain reflectometry.” Water Resources Research, 25, p. 2367-2376.
Ziegler, E.J. (1948). “Effect of materials retained on the No. 4 sieve on the compaction test of soil.” Proceedings, Highway Research Board, 28, p. 409-414.

Final Report
SPR 2783 Effective Compaction of Granular Soils, 7/20/07, Pg. 146 of 178
APPENDICES
Final Report
SPR 2783 Effective Compaction of Granular Soils, 7/20/07, Pg. 147 of 178
Appendix A. Draft ASTM Standard for Vibrating Hammer
(Version balloted in ASTM Committee D 18 and D 18.03 in June 2007)
Final Report
SPR 2783 Effective Compaction of Granular Soils, 7/20/07, Pg. 148 of 178
Standard Test Methods for Determination of Maximum Dry Unit Weight and Water Content Range for Effective Compaction of Granular Soils Using a Vibrating Hammer1
This standard is issued under the fixed designation X XXXX; the number immediately following the designation indicates the year of original adoption or, in the case of revision, the year of last revision. A number in parentheses indicates the year of last reapproval. A superscript epsilon (ε) indicates an editorial change since the last revision or reapproval.
1. Scope 1.1 These test methods cover the determination of the maximum dry unit weight and
water content range for effective compaction of granular soils. A vibrating hammer is used to impart a surcharge and compactive effort to the soil specimen.
1.2 These test methods apply to soils with up to 35 %, by dry mass, passing a No. 200 (75-μm) sieve if the portion passing the No. 40 (425-μm) sieve is nonplastic.
1.3 These test methods apply to soils with up to 15 %, by dry mass, passing a No. 200 (75-μm) sieve if the portion passing the No. 40 (425-μm) sieve exhibits plastic behavior.
1.4 These test methods apply to soils in which 100 %, by dry mass, passes the 2-in. (50-mm) sieve.
1.5 These test methods apply only to soils (materials) that have 30 % or less, by dry mass of their particles retained on the ¾-in. (19.0 mm) sieve. NOTE —For relationships between unit weights and water contents of soils with 30 % or less, by dry mass, of material retained on the 3⁄4-in. (19.0-mm) sieve to unit weights and water contents of the fraction passing the 3⁄4-in. (19.0-mm) sieve, see Practice D 4718.
1.6 These test methods will typically produce a higher maximum dry density/unit weight for the soils specified in 1.2 and 1.3 than that obtained by impact compaction in which a well-defined moisture-density relationship is not apparent. However, for some soils containing more than 15 % fines, the use of impact compaction (Test Methods D 698 or D 1557) may be useful in evaluating what is an appropriate maximum index density/unit weight.
1.7 Two alternative test methods are provided, with the variation being in mold size. The method used shall be as indicated in the specification for the material being tested. If no method is specified, the choice should be based on the maximum particle size of the material.
1.7.1 Method A: 1.7.1.1 Mold—6-in. (152.4-mm) diameter.
1 This test method is under the jurisdiction of ASTM Committee D18.03 and is the direct responsibility of Subcommittee. Current edition approved XXX. XX, XXXX. Published XX XXXX.
Final Report
SPR 2783 Effective Compaction of Granular Soils, 7/20/07, Pg. 149 of 178
1.7.1.2 Material—Passing ¾-in. (19.0-mm) sieve and consistent with the requirements of 1.2 and 1.3.
1.7.1.3 Layers—Three. 1.7.1.4 Time of Compaction per layer—60 seconds +/ 5 seconds. 1.7.2 Method B: 1.7.2.1 Mold—11-in. (279.4-mm) diameter 1.7.2.2 Material—Passing 2-in. (50-mm) sieve and consistent with the requirements
of 1.2 and 1.3. 1.7.2.3 Layers—Three. 1.7.2.4 Time of Compaction per layer—52 seconds +/- 5 seconds at each of 8
locations. NOTE —Method A (with the correction procedure of D 4718, if appropriate), has been shown (reference thesis or paper) to provide consistent results with Method B. Therefore, for ease of operations, it is highly recommended to use Method A, unless Method B is required due to soil gradations not meeting D 4718.
NOTE —Results have been found to vary slightly when a material is tested at the same compaction effort in different size molds.
1.7.3 Either method, A or B, can be performed with the material in an oven-dried or wet/saturated state, whichever provides the maximum dry unit weight.
1.8 If the test specimen contains more than 5 % by mass of oversize fraction (coarse fraction) and the material will not be included in the test, corrections must be made to the unit weight and water content of the test specimen or to the appropriate field in-place density test specimen using Practice D 4718.
1.9 This test method causes a minimal amount of degradation (particle breakdown) of the soil. When degradation occurs, typically there is an increase in the maximum unit weight obtained, and comparable test results may not be obtained when different size molds are used to test a given soil. For soils where degradation is suspected, a sieve analysis of the specimen should be performed before and after the compaction test to determine the amount of degradation.
1.10 Units—The values stated in either SI units or inch-pound units are to be regarded separately as standard. The values stated in each system may not be exact equivalents; therefore, each system shall be used independently of the other. Combining values from the two systems may result in non-conformance with the standard.
1.11 The vibrating hammer test method may be performed in the field or in the laboratory.
1.12 This standard does not purport to address all of the safety concerns, if any, associated with its use. It is the responsibility of the user of this standard to establish appropriate safety and health practices and to determine the applicability of regulatory limitations prior to use.
Final Report
SPR 2783 Effective Compaction of Granular Soils, 7/20/07, Pg. 150 of 178
2. Referenced Documents 2.1 ASTM Standards: C 127 Test method for Specific Gravity and Absorption of Coarse Aggregate C 136 Method for Sieve Analysis of Fine and Coarse Aggregate C 778 Standard Specification for Standard Sand D 422 Test Method for Particle-Size Analysis of Soils D 653 Terminology Relating to Soil, Rock and Contained Fluids D 698 Test Methods for Laboratory Compaction Characteristics of Soil Using
Standard Effort (12,400 ft-lbf/ft3 (600 kN-m/m3)) D 854 Test Methods for Specific Gravity of Soil Solids by Water Pycnometer D 1140 Test Methods for Amount of Material in Soils Finer Than the No. 200 (75- μm) Sieve
D 1557 Test Methods for Laboratory Compaction Characteristics of Soil Using Modified Effort (56,000 ft-lbf/ft3 (2,700 kN-m/m3))
D 2216 Test Method for Laboratory Determination of Water (Moisture) Content of Soil and Rock by Mass
D 2487 Practice for Classification of Soils for Engineering Purposes (Unified Soil Classification System)
D 2488 Practice for Description and Identification of Soils (Visual-Manual Procedure)
D 3282 Practice for Classification of Soils and Soil-Aggregate Mixtures for Highway Construction Purposes
D 3740 Practice for Minimum Requirements for Agencies Engaged in the Testing and/or Inspection of Soil and Rock as Used in Engineering Design and Construction
D 4220 Practices for Preserving and Transporting Soil Samples D 4253 Test Methods for Maximum Index Density and Unit Weight of Soils Using a
Vibratory Table D 4254 Test Methods for Minimum Index Density and Unit Weight of Soils and
Calculation of Relative Density D 4318 Test Method for Liquid Limit, Plastic Limit, and Plasticity Index of Soils D 4718 Practice for Correction of Unit Weight and Water Content for Soils
Containing Oversize Particles D 4753 Specification for Evaluating, Selecting, and Specifying Balances and Scales
for Use in Testing Soil, Rock, and Related Construction Materials D 6026 Practice for Using Significant Digits in Geotechnical Data E 11 Specification for Wire-Cloth Sieves for Testing Purposes E 145 Specification for Gravity-Convection and Forced-Ventilation Ovens E 177 Practice for Use of the Terms Precision and Bias in ASTM Test Methods
Final Report
SPR 2783 Effective Compaction of Granular Soils, 7/20/07, Pg. 151 of 178
E 691 Practice for Conducting an Interlaboratory Study to Determine the Precision of a Test Method
IEEE/ASTM SI 10 Standard for Use of the International System of Units (SI): the Modern Metric System
3. Terminology 3.1 Definitions: 3.1.1 For definitions of terms used in this test method, refer to Terminology D 653. 3.2 Definitions of Terms Specific to This Standard: 3.2.1 granular soil, n—any soil with less than 35 %, by dry mass, passing the No. 200
(75-μm) sieve. 3.2.2 nonplastic, adj—description for a soil sample when any one of the liquid limit,
plastic limit, or plasticity index can not be determined. 3.2.3 plastic, adj—description for a soil sample when the liquid limit, plastic limit,
and plasticity index can all be determined. 3.2.4 water content range for effective compaction, n—the range of water contents,
expressed as a percentage, bounded by 80 % of wZAV and wZAV. 3.2.5 zero air voids water content, wZAV, n—the water content, expressed as a
percentage, that corresponds to saturation at the maximum dry unit weight. 3.2.6 oversize fraction (coarse fraction), Pc (%)- the portion of total sample not used
in performing the compaction test; it is the portion of total sample retained the ¾-in. (19.0-mm) sieve.
3.2.7 test fraction (finer fraction), Pf (%)- the portion of total sample used in performing the compaction test; it is the portion of total sample passing the ¾-in. (19.0-mm) sieve. 4. Summary of Test Method
4.1 The maximum dry unit weight and water content range for effective compaction of a given free-draining soil is determined using either an oven-dried or wet/saturated soil. Soil is placed in three layers into a mold of given dimensions. Each layer is compacted for a given amount of time by a vibrating hammer that applies vibration and surcharge to the soil. The dry unit weight is calculated by dividing the oven-dried weight of the densified soil by the volume of the mold containing the soil. The water content range for effective compaction is determined from the maximum dry unit weight and the specific gravity of solids. 5. Significance and Use
5.1 For many cohesionless, free-draining soils, the maximum dry unit weight is one of the key components in evaluating the state of compactness of a given soil mass that is either naturally occurring or is constructed (fill).
5.2 Soil placed as an engineered fill is compacted to a dense state to obtain satisfactory engineering properties such as shear strength, compressibility, and/or permeability. Also, foundation soils are often compacted to improve their engineering properties. Laboratory compaction tests provide the basis for determining the percent
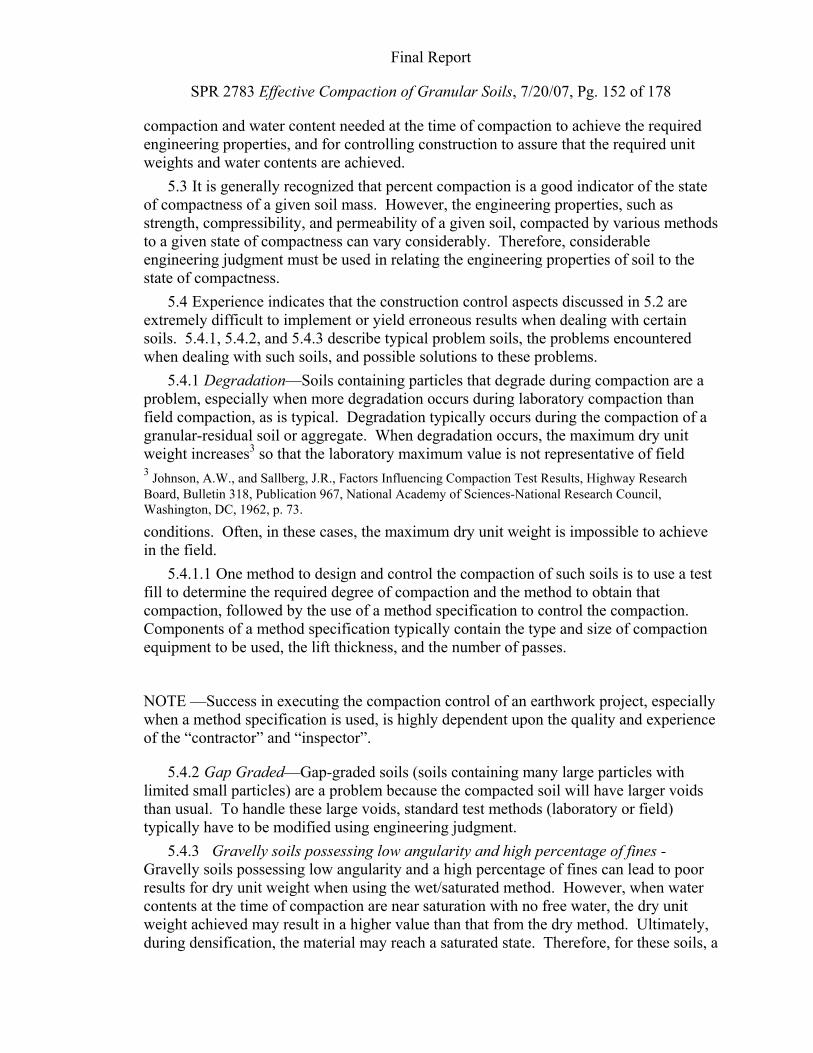
Final Report
SPR 2783 Effective Compaction of Granular Soils, 7/20/07, Pg. 152 of 178
compaction and water content needed at the time of compaction to achieve the required engineering properties, and for controlling construction to assure that the required unit weights and water contents are achieved.
5.3 It is generally recognized that percent compaction is a good indicator of the state of compactness of a given soil mass. However, the engineering properties, such as strength, compressibility, and permeability of a given soil, compacted by various methods to a given state of compactness can vary considerably. Therefore, considerable engineering judgment must be used in relating the engineering properties of soil to the state of compactness.
5.4 Experience indicates that the construction control aspects discussed in 5.2 are extremely difficult to implement or yield erroneous results when dealing with certain soils. 5.4.1, 5.4.2, and 5.4.3 describe typical problem soils, the problems encountered when dealing with such soils, and possible solutions to these problems.
5.4.1 Degradation—Soils containing particles that degrade during compaction are a problem, especially when more degradation occurs during laboratory compaction than field compaction, as is typical. Degradation typically occurs during the compaction of a granular-residual soil or aggregate. When degradation occurs, the maximum dry unit weight increases3 so that the laboratory maximum value is not representative of field 3 Johnson, A.W., and Sallberg, J.R., Factors Influencing Compaction Test Results, Highway Research Board, Bulletin 318, Publication 967, National Academy of Sciences-National Research Council, Washington, DC, 1962, p. 73.
conditions. Often, in these cases, the maximum dry unit weight is impossible to achieve in the field.
5.4.1.1 One method to design and control the compaction of such soils is to use a test fill to determine the required degree of compaction and the method to obtain that compaction, followed by the use of a method specification to control the compaction. Components of a method specification typically contain the type and size of compaction equipment to be used, the lift thickness, and the number of passes.
NOTE —Success in executing the compaction control of an earthwork project, especially when a method specification is used, is highly dependent upon the quality and experience of the “contractor” and “inspector”.
5.4.2 Gap Graded—Gap-graded soils (soils containing many large particles with limited small particles) are a problem because the compacted soil will have larger voids than usual. To handle these large voids, standard test methods (laboratory or field) typically have to be modified using engineering judgment.
5.4.3 Gravelly soils possessing low angularity and high percentage of fines - Gravelly soils possessing low angularity and a high percentage of fines can lead to poor results for dry unit weight when using the wet/saturated method. However, when water contents at the time of compaction are near saturation with no free water, the dry unit weight achieved may result in a higher value than that from the dry method. Ultimately, during densification, the material may reach a saturated state. Therefore, for these soils, a
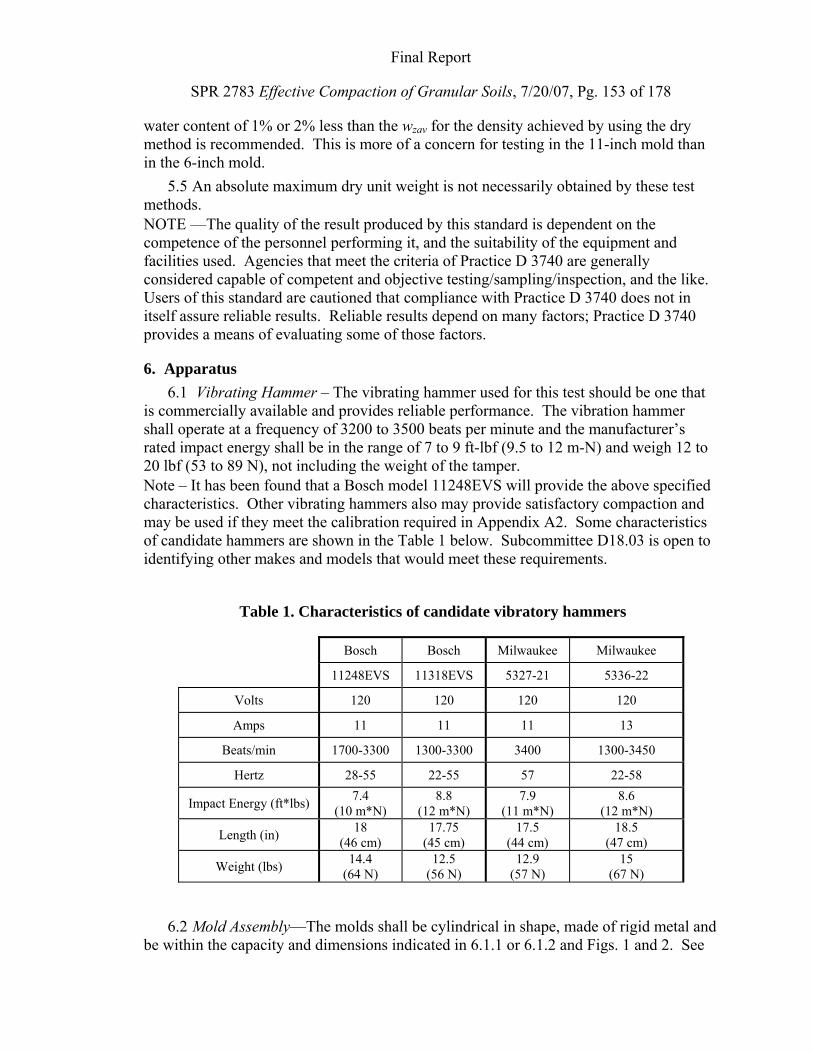
Final Report
SPR 2783 Effective Compaction of Granular Soils, 7/20/07, Pg. 153 of 178
water content of 1% or 2% less than the wzav for the density achieved by using the dry method is recommended. This is more of a concern for testing in the 11-inch mold than in the 6-inch mold.
5.5 An absolute maximum dry unit weight is not necessarily obtained by these test methods. NOTE —The quality of the result produced by this standard is dependent on the competence of the personnel performing it, and the suitability of the equipment and facilities used. Agencies that meet the criteria of Practice D 3740 are generally considered capable of competent and objective testing/sampling/inspection, and the like. Users of this standard are cautioned that compliance with Practice D 3740 does not in itself assure reliable results. Reliable results depend on many factors; Practice D 3740 provides a means of evaluating some of those factors.
6. Apparatus 6.1 Vibrating Hammer – The vibrating hammer used for this test should be one that
is commercially available and provides reliable performance. The vibration hammer shall operate at a frequency of 3200 to 3500 beats per minute and the manufacturer’s rated impact energy shall be in the range of 7 to 9 ft-lbf (9.5 to 12 m-N) and weigh 12 to 20 lbf (53 to 89 N), not including the weight of the tamper. Note – It has been found that a Bosch model 11248EVS will provide the above specified characteristics. Other vibrating hammers also may provide satisfactory compaction and may be used if they meet the calibration required in Appendix A2. Some characteristics of candidate hammers are shown in the Table 1 below. Subcommittee D18.03 is open to identifying other makes and models that would meet these requirements.
Table 1. Characteristics of candidate vibratory hammers
Bosch Bosch Milwaukee Milwaukee
11248EVS 11318EVS 5327-21 5336-22
Volts 120 120 120 120
Amps 11 11 11 13
Beats/min 1700-3300 1300-3300 3400 1300-3450
Hertz 28-55 22-55 57 22-58
Impact Energy (ft*lbs) 7.4 (10 m*N)
8.8 (12 m*N)
7.9 (11 m*N)
8.6 (12 m*N)
Length (in) 18 (46 cm)
17.75 (45 cm)
17.5 (44 cm)
18.5 (47 cm)
Weight (lbs) 14.4 (64 N)
12.5 (56 N)
12.9 (57 N)
15 (67 N)
6.2 Mold Assembly—The molds shall be cylindrical in shape, made of rigid metal and be within the capacity and dimensions indicated in 6.1.1 or 6.1.2 and Figs. 1 and 2. See
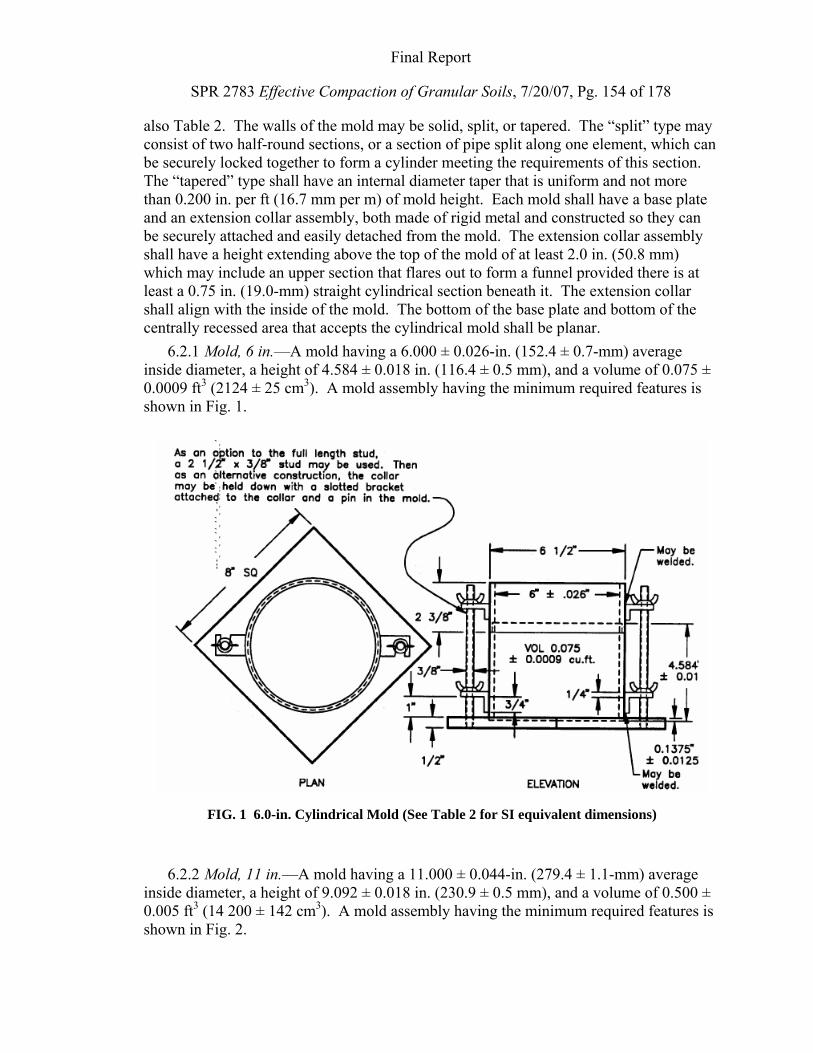
Final Report
SPR 2783 Effective Compaction of Granular Soils, 7/20/07, Pg. 154 of 178
also Table 2. The walls of the mold may be solid, split, or tapered. The “split” type may consist of two half-round sections, or a section of pipe split along one element, which can be securely locked together to form a cylinder meeting the requirements of this section. The “tapered” type shall have an internal diameter taper that is uniform and not more than 0.200 in. per ft (16.7 mm per m) of mold height. Each mold shall have a base plate and an extension collar assembly, both made of rigid metal and constructed so they can be securely attached and easily detached from the mold. The extension collar assembly shall have a height extending above the top of the mold of at least 2.0 in. (50.8 mm) which may include an upper section that flares out to form a funnel provided there is at least a 0.75 in. (19.0-mm) straight cylindrical section beneath it. The extension collar shall align with the inside of the mold. The bottom of the base plate and bottom of the centrally recessed area that accepts the cylindrical mold shall be planar.
6.2.1 Mold, 6 in.—A mold having a 6.000 ± 0.026-in. (152.4 ± 0.7-mm) average inside diameter, a height of 4.584 ± 0.018 in. (116.4 ± 0.5 mm), and a volume of 0.075 ± 0.0009 ft3 (2124 ± 25 cm3). A mold assembly having the minimum required features is shown in Fig. 1.
6.2.2 Mold, 11 in.—A mold having a 11.000 ± 0.044-in. (279.4 ± 1.1-mm) average
inside diameter, a height of 9.092 ± 0.018 in. (230.9 ± 0.5 mm), and a volume of 0.500 ± 0.005 ft3 (14 200 ± 142 cm3). A mold assembly having the minimum required features is shown in Fig. 2.
FIG. 1 6.0-in. Cylindrical Mold (See Table 2 for SI equivalent dimensions)
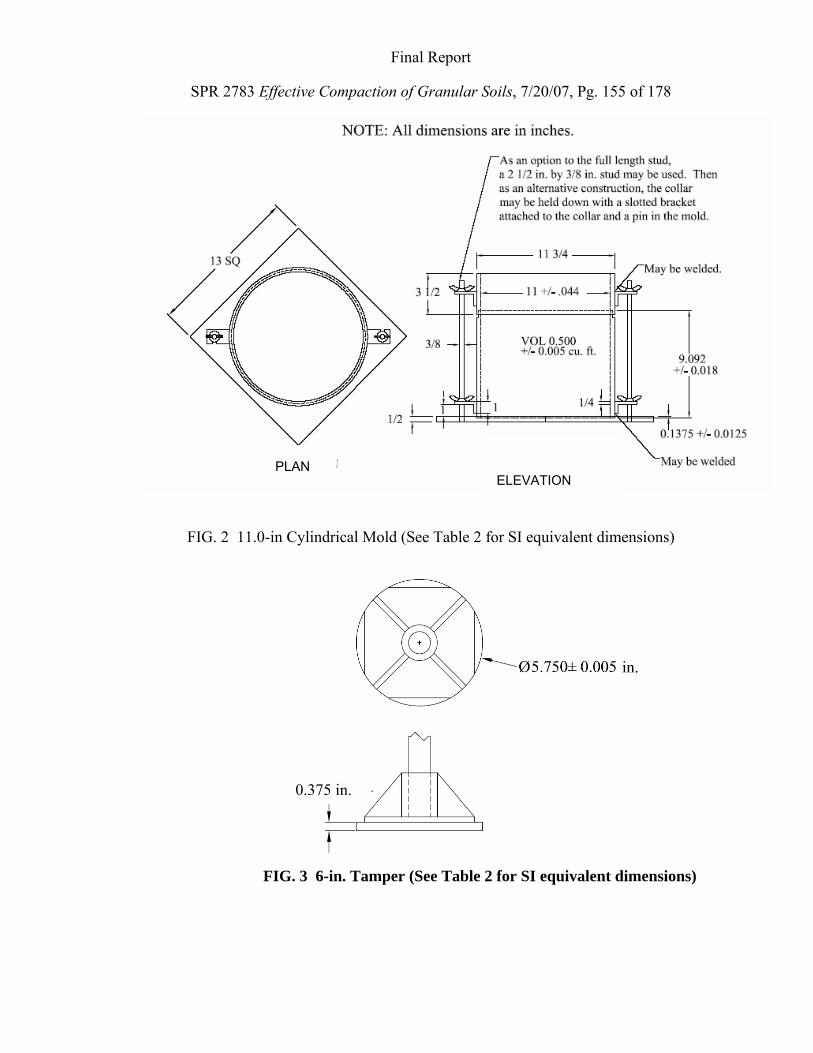
Final Report
SPR 2783 Effective Compaction of Granular Soils, 7/20/07, Pg. 155 of 178
FIG. 2 11.0-in Cylindrical Mold (See Table 2 for SI equivalent dimensions)
PLAN
ELEVATION
0.375 in.
FIG. 3 6-in. Tamper (See Table 2 for SI equivalent dimensions)
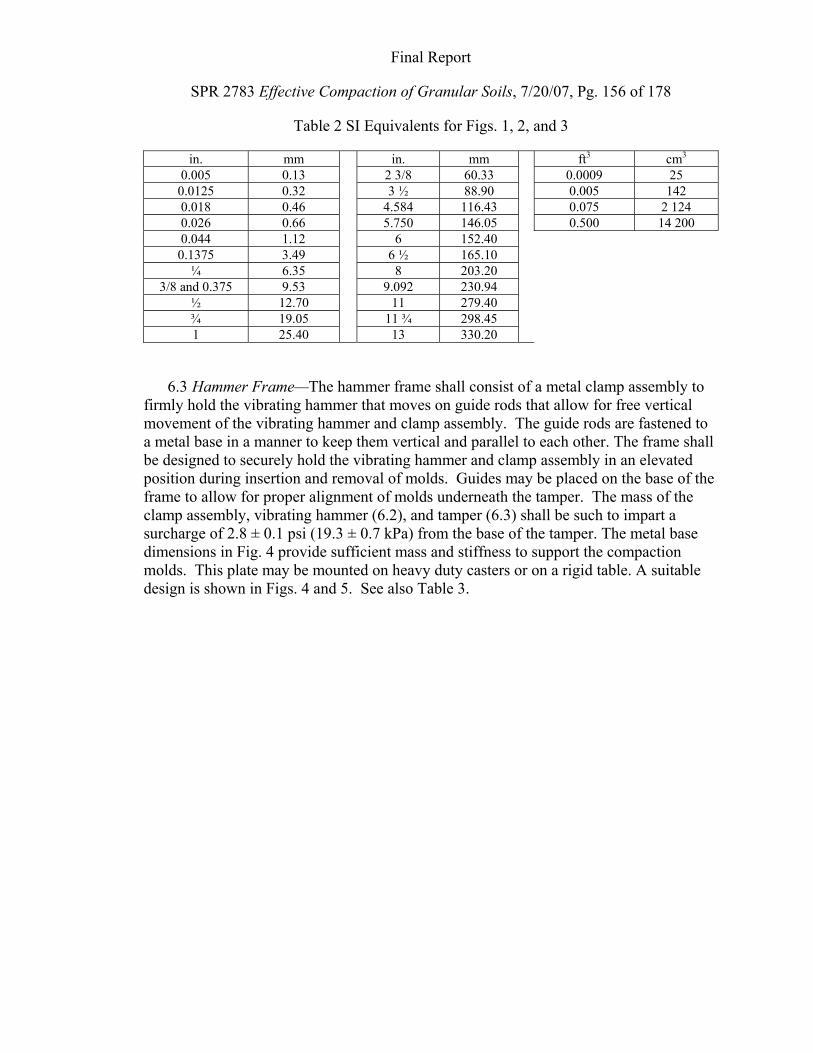
Final Report
SPR 2783 Effective Compaction of Granular Soils, 7/20/07, Pg. 156 of 178
Table 2 SI Equivalents for Figs. 1, 2, and 3
in. mm in. mm ft3 cm3 0.005 0.13 2 3/8 60.33 0.0009 25 0.0125 0.32 3 ½ 88.90 0.005 142 0.018 0.46 4.584 116.43 0.075 2 124 0.026 0.66 5.750 146.05 0.500 14 200 0.044 1.12 6 152.40 0.1375 3.49 6 ½ 165.10
¼ 6.35 8 203.20 3/8 and 0.375 9.53 9.092 230.94
½ 12.70 11 279.40 ¾ 19.05 11 ¾ 298.45 1 25.40 13 330.20
6.3 Hammer Frame—The hammer frame shall consist of a metal clamp assembly to firmly hold the vibrating hammer that moves on guide rods that allow for free vertical movement of the vibrating hammer and clamp assembly. The guide rods are fastened to a metal base in a manner to keep them vertical and parallel to each other. The frame shall be designed to securely hold the vibrating hammer and clamp assembly in an elevated position during insertion and removal of molds. Guides may be placed on the base of the frame to allow for proper alignment of molds underneath the tamper. The mass of the clamp assembly, vibrating hammer (6.2), and tamper (6.3) shall be such to impart a surcharge of 2.8 ± 0.1 psi (19.3 ± 0.7 kPa) from the base of the tamper. The metal base dimensions in Fig. 4 provide sufficient mass and stiffness to support the compaction molds. This plate may be mounted on heavy duty casters or on a rigid table. A suitable design is shown in Figs. 4 and 5. See also Table 3.
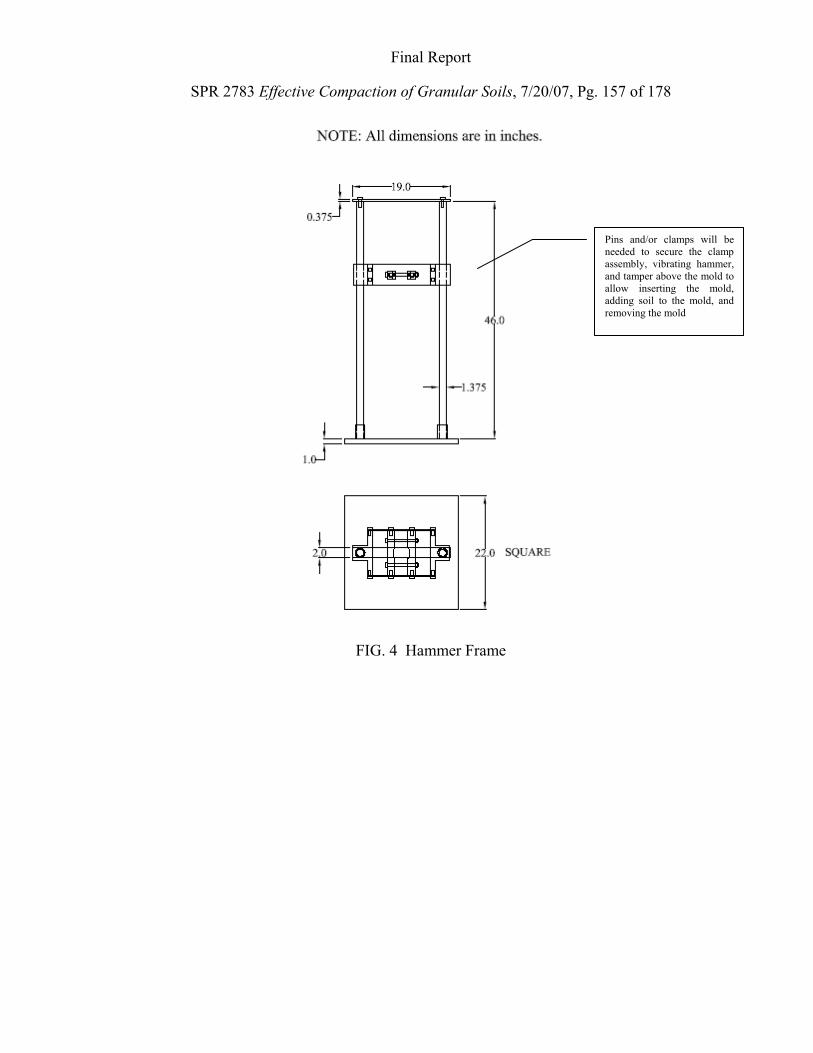
Final Report
SPR 2783 Effective Compaction of Granular Soils, 7/20/07, Pg. 157 of 178
FIG. 4 Hammer Frame
Pins and/or clamps will be needed to secure the clamp assembly, vibrating hammer, and tamper above the mold to allow inserting the mold, adding soil to the mold, and removing the mold
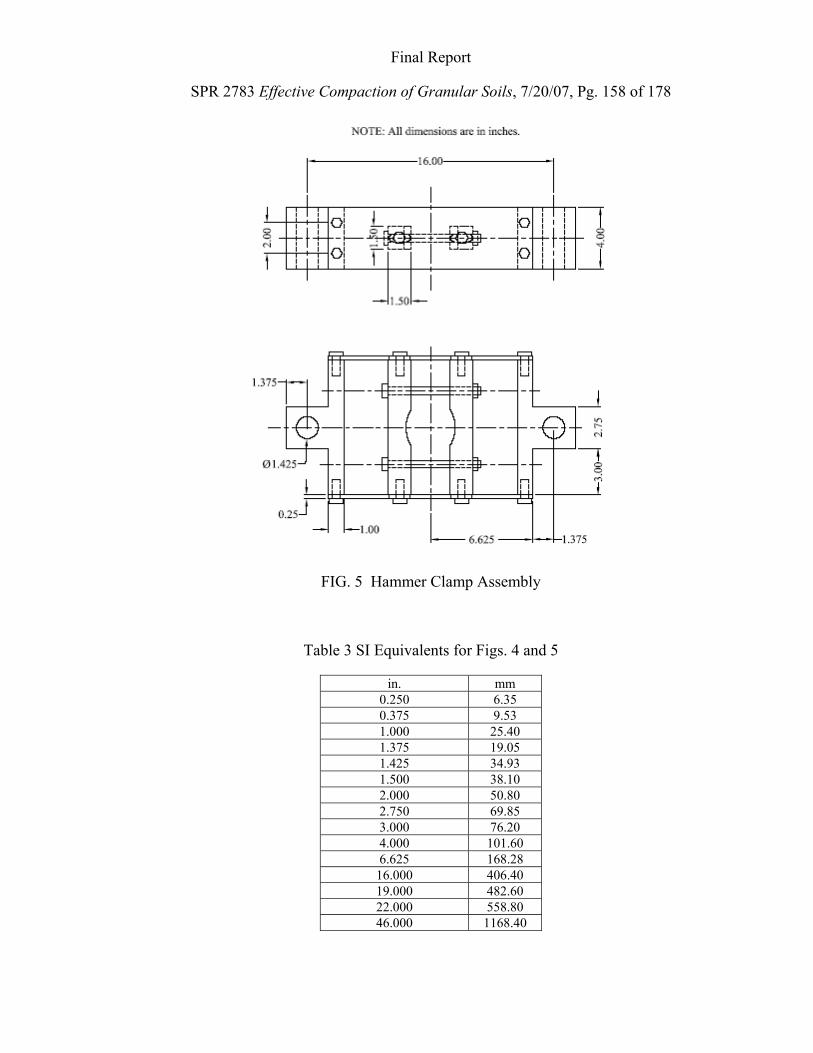
Final Report
SPR 2783 Effective Compaction of Granular Soils, 7/20/07, Pg. 158 of 178
FIG. 5 Hammer Clamp Assembly
Table 3 SI Equivalents for Figs. 4 and 5
in. mm 0.250 6.35 0.375 9.53 1.000 25.40 1.375 19.05 1.425 34.93 1.500 38.10 2.000 50.80 2.750 69.85 3.000 76.20 4.000 101.60 6.625 168.28 16.000 406.40 19.000 482.60 22.000 558.80 46.000 1168.40
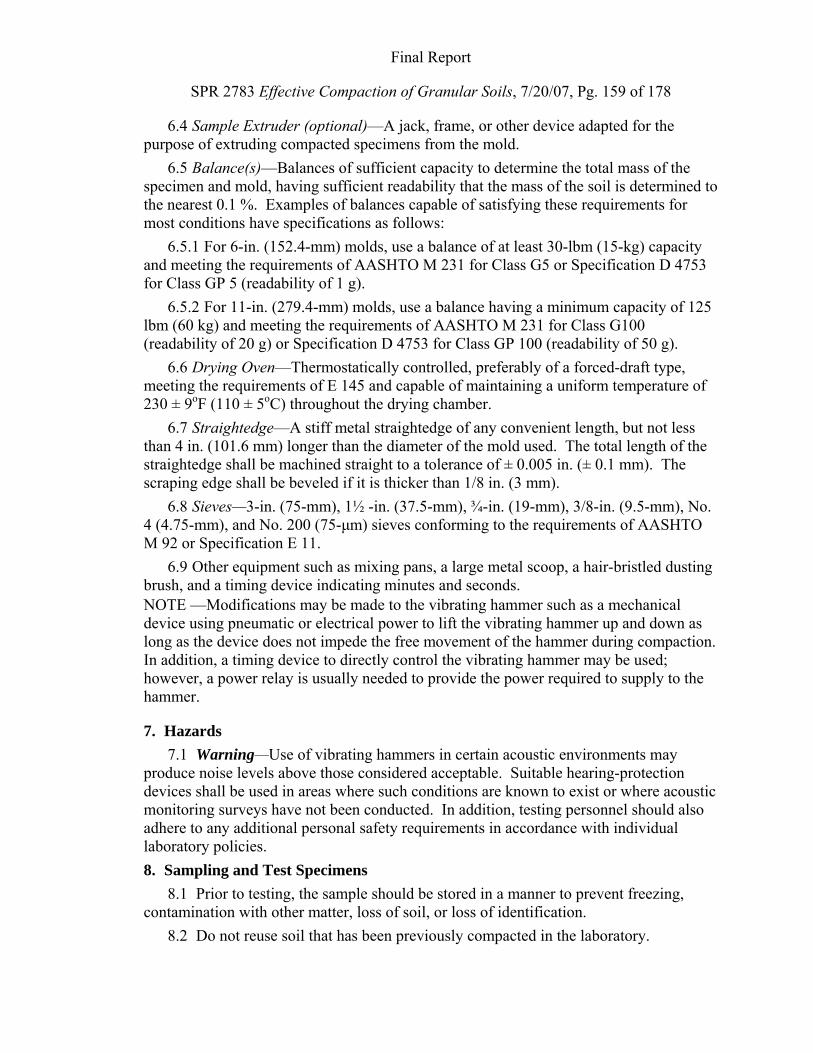
Final Report
SPR 2783 Effective Compaction of Granular Soils, 7/20/07, Pg. 159 of 178
6.4 Sample Extruder (optional)—A jack, frame, or other device adapted for the purpose of extruding compacted specimens from the mold.
6.5 Balance(s)—Balances of sufficient capacity to determine the total mass of the specimen and mold, having sufficient readability that the mass of the soil is determined to the nearest 0.1 %. Examples of balances capable of satisfying these requirements for most conditions have specifications as follows:
6.5.1 For 6-in. (152.4-mm) molds, use a balance of at least 30-lbm (15-kg) capacity and meeting the requirements of AASHTO M 231 for Class G5 or Specification D 4753 for Class GP 5 (readability of 1 g).
6.5.2 For 11-in. (279.4-mm) molds, use a balance having a minimum capacity of 125 lbm (60 kg) and meeting the requirements of AASHTO M 231 for Class G100 (readability of 20 g) or Specification D 4753 for Class GP 100 (readability of 50 g).
6.6 Drying Oven—Thermostatically controlled, preferably of a forced-draft type, meeting the requirements of E 145 and capable of maintaining a uniform temperature of 230 ± 9oF (110 ± 5oC) throughout the drying chamber.
6.7 Straightedge—A stiff metal straightedge of any convenient length, but not less than 4 in. (101.6 mm) longer than the diameter of the mold used. The total length of the straightedge shall be machined straight to a tolerance of ± 0.005 in. (± 0.1 mm). The scraping edge shall be beveled if it is thicker than 1/8 in. (3 mm).
6.8 Sieves—3-in. (75-mm), 1½ -in. (37.5-mm), ¾-in. (19-mm), 3/8-in. (9.5-mm), No. 4 (4.75-mm), and No. 200 (75-μm) sieves conforming to the requirements of AASHTO M 92 or Specification E 11.
6.9 Other equipment such as mixing pans, a large metal scoop, a hair-bristled dusting brush, and a timing device indicating minutes and seconds. NOTE —Modifications may be made to the vibrating hammer such as a mechanical device using pneumatic or electrical power to lift the vibrating hammer up and down as long as the device does not impede the free movement of the hammer during compaction. In addition, a timing device to directly control the vibrating hammer may be used; however, a power relay is usually needed to provide the power required to supply to the hammer.
7. Hazards 7.1 Warning—Use of vibrating hammers in certain acoustic environments may
produce noise levels above those considered acceptable. Suitable hearing-protection devices shall be used in areas where such conditions are known to exist or where acoustic monitoring surveys have not been conducted. In addition, testing personnel should also adhere to any additional personal safety requirements in accordance with individual laboratory policies. 8. Sampling and Test Specimens
8.1 Prior to testing, the sample should be stored in a manner to prevent freezing, contamination with other matter, loss of soil, or loss of identification.
8.2 Do not reuse soil that has been previously compacted in the laboratory.
Final Report
SPR 2783 Effective Compaction of Granular Soils, 7/20/07, Pg. 160 of 178
8.3 The required dry specimen mass is approximately 15 lbm (7 kg) for Method A and 100 lbm (45 kg) for Method B. Therefore, the field sample should have a moist mass of at least 20 lbm (9 kg) for Method A and 125 lbm (57 kg) for Method B.
8.4 Select a representative specimen of soil that meets the requirements of 8.3, using a splitter, riffle, or other method such as quartering.
8.5 If the dry method is being performed, dry the specimen in the drying oven, maintained at 230 ± 9oF (110 ± 5oC), to a constant mass. It is often desirable to obtain the water content of the field sample. If this is the case, determine the water content in accordance with Test Method D 2216.
8.5.1 After drying, thoroughly break up the weakly cemented aggregations, avoiding the reduction of the natural size of the particles. 9. Preparation of Apparatus
9.1 Select the proper compaction mold in accordance with the Method (A or B) being used. Determine and record the mass of the mold and base plate. Assemble the mold, base plate, and extension collar. Check the alignment of the inner wall of the mold and mold extension collar.
9.2 Check that the vibrating hammer and the hammer frame are in good working condition and that parts are not loose or worn. Make any necessary service adjustments or repairs. If service adjustments or repairs are made to the vibrating hammer, the hammer must be recalibrated.
9.3 Insert the tamper foot into the chuck of the vibrating hammer and ensure a good connection.
9.4 If the vibrating hammer has variable settings, ensure that it is set to hammer mode (not rotating hammer mode) and is set at the highest operating frequency. The frequency must be within that specified in Section 6.1. 10. Calibration
10.1 Perform calibrations before initial use, after repairs or other occurrences that might affect the test results, at intervals not exceeding 500 test specimens, or annually, whichever occurs first, for the following apparatus:
10.1.1 Balance—Evaluate in accordance with AASHTO M 231 or Specification D 4753.
10.1.2 Molds—Determine the volume as described in Annex A1. 10.2 Vibrating Hammer—Verify that appropriate energy is applied to the soil as
described in Annex A2. 11. Procedure
11.1 Mix the specimen to provide an even distribution of particle sizes and water content (for the wet/saturated method) with as little segregation as possible. The wet/saturated method may be conducted on either oven-dried soil to which sufficient water is added or, if preferred, on wet soil from the field. If water is added to dry soil, allow a minimum soaking period of about ½ h. The amount of water added should be
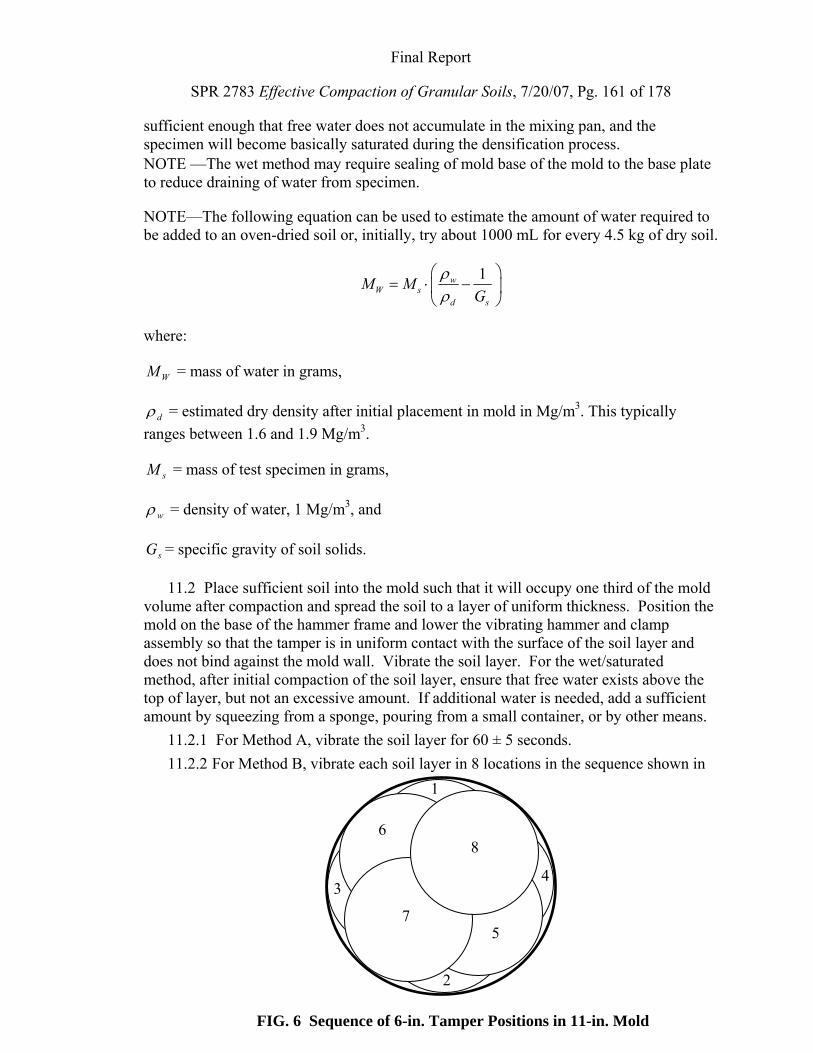
Final Report
SPR 2783 Effective Compaction of Granular Soils, 7/20/07, Pg. 161 of 178
sufficient enough that free water does not accumulate in the mixing pan, and the specimen will become basically saturated during the densification process. NOTE —The wet method may require sealing of mold base of the mold to the base plate to reduce draining of water from specimen.
NOTE—The following equation can be used to estimate the amount of water required to be added to an oven-dried soil or, initially, try about 1000 mL for every 4.5 kg of dry soil.
1wW s
d s
M MG
ρρ
⎛ ⎞= ⋅ −⎜ ⎟
⎝ ⎠
where:
WM = mass of water in grams,
dρ = estimated dry density after initial placement in mold in Mg/m3. This typically ranges between 1.6 and 1.9 Mg/m3.
sM = mass of test specimen in grams,
wρ = density of water, 1 Mg/m3, and
sG = specific gravity of soil solids.
11.2 Place sufficient soil into the mold such that it will occupy one third of the mold volume after compaction and spread the soil to a layer of uniform thickness. Position the mold on the base of the hammer frame and lower the vibrating hammer and clamp assembly so that the tamper is in uniform contact with the surface of the soil layer and does not bind against the mold wall. Vibrate the soil layer. For the wet/saturated method, after initial compaction of the soil layer, ensure that free water exists above the top of layer, but not an excessive amount. If additional water is needed, add a sufficient amount by squeezing from a sponge, pouring from a small container, or by other means.
11.2.1 For Method A, vibrate the soil layer for 60 ± 5 seconds. 11.2.2 For Method B, vibrate each soil layer in 8 locations in the sequence shown in
1
5
6
4
2
7
3
8
FIG. 6 Sequence of 6-in. Tamper Positions in 11-in. Mold
Final Report
SPR 2783 Effective Compaction of Granular Soils, 7/20/07, Pg. 162 of 178
Fig. 6 with vibration for 52 ± 5 seconds at each location.
11.3 Raise the vibrating hammer and clamp assembly and secure it in its elevated position. Scarify the surface of the compacted soil to ensure a good bond between soil layers.
11.4 Repeat 11.2 and 11.3 for the second and third soil layers, except that the surface of the third layer shall not be scarified.
11.5 Following compaction of the third layer, remove the collar from the mold. Verify that the surface of the compacted soil is above the top of the mold, but is not higher than 0.375 in. (10 mm) above the top of the mold. The specimen shall be discarded if the surface of the third layer extends more than 0.375 in. (10 mm) above the top of the mold or if any point on the surface is below the top of the mold.
11.6 Carefully trim the compacted specimen even with the top of the mold by means of the straightedge scraped across the top of the mold.
11.6.1 If large soil particles do not allow for a plane surface to be achieved at the top of the mold, fill in any holes in the top surface with unused or trimmed soil from the specimen, press in with the fingers, and again scrape the straightedge across the top of the mold.
11.6.2 Alternative to 11.6.1, an accurate specimen volume may be obtained by using the fingers to equate the volume of voids below the surface of the mold with the volume of compacted particles that protrude above the surface of the mold.
11.6.3 Use of a straightedge and/or the fingers may result in disturbance to the top of the specimen when large particles exist near the surface. It may be desirable to manually use a tamper or other object to return the surface material to a compacted state so that its relative position to the top of the mold can be properly observed.
11.7 For the oven-dried method, determine and record the mass of the specimen, mold, and base plate. For the wet/saturated method, if a determination of the specimen water content is desired, determine and record the mass of the soil, mold and base plate. Carefully remove the entire wet specimen from the mold, placing it in a pan of known mass for oven drying. Wash all particles clinging to the inside of the mold and base plate into the pan. Dry the specimen in a drying oven, maintained at 110 ± 5°C to a constant mass (Test Method D 2216). Determine and record its oven-dried mass, using a balance meeting the requirements of 6.6.
11.8 Steps 11.1 through 11.7 should be repeated on new specimens until the results of the tests for either the dry method or the wet/saturated method agree within 2% of the values for each method. 12. Calculation
12.1 Calculate the dry density of the soil as follows: s
dMV
ρ = (1)
where:
Final Report
SPR 2783 Effective Compaction of Granular Soils, 7/20/07, Pg. 163 of 178
ρd = dry density of compacted specimen, lbm/ft3 (kg/m3)
sM = mass of the tested-dry soil (either from dry or wet/saturated method), lbm (kg), and
V = volume of compaction mold, ft3 (m3) (see Annex A1).
12.2 Calculate the dry unit weight of the soil as follows: γd in lbf/ft3 = ρd in lbm/ft3 (2)
or
γd in kN/m3 = 9.807 ρd in kg/m3 (3)
12.2.1 If more than 5% by weight of oversize material was removed from the sample, calculate the corrected dry unit weight of the total material using Practice D 4718.
12.2.2 The maximum dry unit weight is the larger of the two values obtained from the dry method and the wet/saturated method. When replicate tests are performed, average values for the dry method and average values for the wet/saturated method may be used in this determination.
12.3 Calculate wZAV (See 3.2.5) as follows:
max
1 *100%( )
wZAV
d s
wG
γγ
⎛ ⎞= −⎜ ⎟⎝ ⎠
(4)
where:
γw = unit weight of water, 62.32 lbf/ft3 (9.789 kN/m3) at 68oF (20oC)
Gs = specific gravity of soil solids.
NOTE —Specific gravity of soil solids may be estimated for the test specimen on the basis of test data from other samples of the same soil classification and source. Otherwise, a specific gravity test (Test Method D 854) is necessary.
12.4 Determine the water content range for effective compaction. The maximum value of this range is wZAV and the minimum value is 80% of wZAV.
12.4.1 As an alternative to 12.3 and 12.4, the water content range for effective compaction may be determined from Table 4:
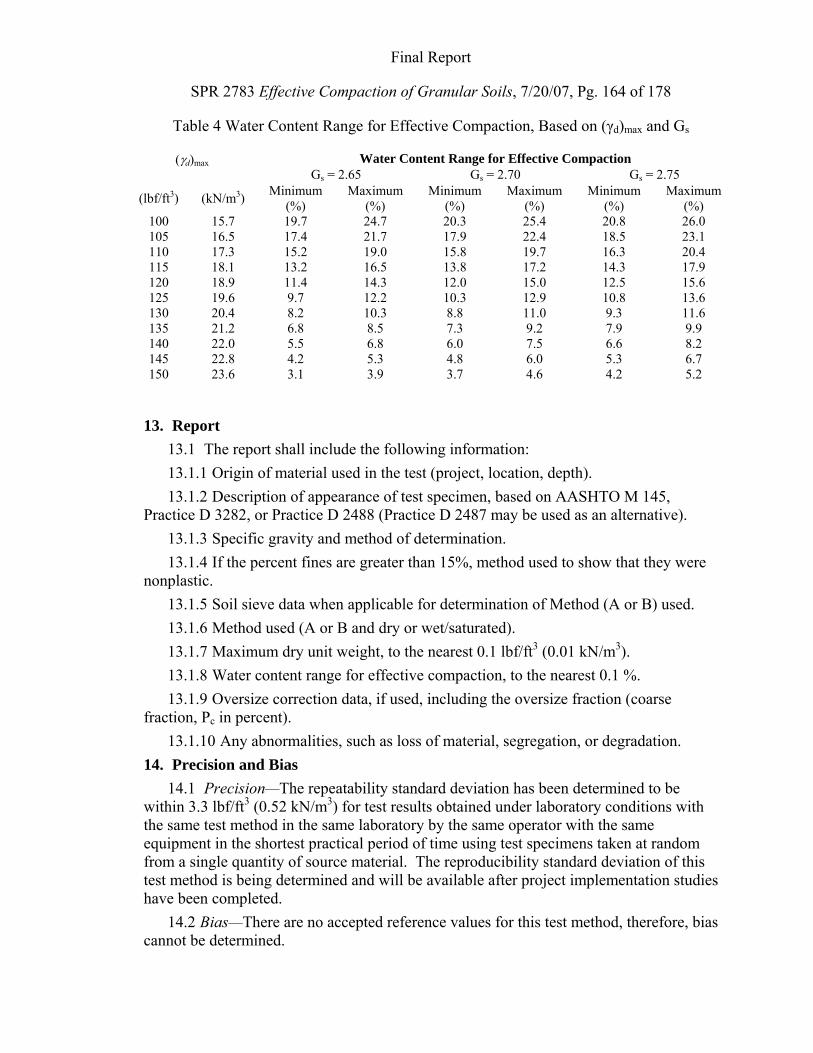
Final Report
SPR 2783 Effective Compaction of Granular Soils, 7/20/07, Pg. 164 of 178
Table 4 Water Content Range for Effective Compaction, Based on (γd)max and Gs
(γd)max Water Content Range for Effective Compaction Gs = 2.65 Gs = 2.70 Gs = 2.75
(lbf/ft3) (kN/m3) Minimum (%)
Maximum (%)
Minimum (%)
Maximum (%)
Minimum (%)
Maximum (%)
100 15.7 19.7 24.7 20.3 25.4 20.8 26.0 105 16.5 17.4 21.7 17.9 22.4 18.5 23.1 110 17.3 15.2 19.0 15.8 19.7 16.3 20.4 115 18.1 13.2 16.5 13.8 17.2 14.3 17.9 120 18.9 11.4 14.3 12.0 15.0 12.5 15.6 125 19.6 9.7 12.2 10.3 12.9 10.8 13.6 130 20.4 8.2 10.3 8.8 11.0 9.3 11.6 135 21.2 6.8 8.5 7.3 9.2 7.9 9.9 140 22.0 5.5 6.8 6.0 7.5 6.6 8.2 145 22.8 4.2 5.3 4.8 6.0 5.3 6.7 150 23.6 3.1 3.9 3.7 4.6 4.2 5.2
13. Report 13.1 The report shall include the following information: 13.1.1 Origin of material used in the test (project, location, depth). 13.1.2 Description of appearance of test specimen, based on AASHTO M 145,
Practice D 3282, or Practice D 2488 (Practice D 2487 may be used as an alternative). 13.1.3 Specific gravity and method of determination. 13.1.4 If the percent fines are greater than 15%, method used to show that they were
nonplastic. 13.1.5 Soil sieve data when applicable for determination of Method (A or B) used. 13.1.6 Method used (A or B and dry or wet/saturated). 13.1.7 Maximum dry unit weight, to the nearest 0.1 lbf/ft3 (0.01 kN/m3). 13.1.8 Water content range for effective compaction, to the nearest 0.1 %. 13.1.9 Oversize correction data, if used, including the oversize fraction (coarse
fraction, Pc in percent). 13.1.10 Any abnormalities, such as loss of material, segregation, or degradation.
14. Precision and Bias 14.1 Precision—The repeatability standard deviation has been determined to be
within 3.3 lbf/ft3 (0.52 kN/m3) for test results obtained under laboratory conditions with the same test method in the same laboratory by the same operator with the same equipment in the shortest practical period of time using test specimens taken at random from a single quantity of source material. The reproducibility standard deviation of this test method is being determined and will be available after project implementation studies have been completed.
14.2 Bias—There are no accepted reference values for this test method, therefore, bias cannot be determined.

Final Report
SPR 2783 Effective Compaction of Granular Soils, 7/20/07, Pg. 165 of 178
15. Keywords
15.1 vibrating hammer; granular soil; soil compaction; density; unit weight; water content
Final Report
SPR 2783 Effective Compaction of Granular Soils, 7/20/07, Pg. 166 of 178
ANNEX
(Mandatory Information)
A1. VOLUME OF COMPACTION MOLD
A1.1 Scope A1.1.1 This annex describes the procedure for determining the volume of a
compaction mold. A1.1.2 The volume is determined by a water-filled method and checked by a linear-
measurement method. A1.2 Apparatus
A1.2.1 In addition to the apparatus listed in Section 6 the following items are required:
A1.2.1.1 Vernier or Dial Caliper—having a measuring range of at least 0 to 12 in. (0 to 300 mm) and readable to at least 0.001 in. (0.02 mm).
A1.2.1.2 Inside Micrometer—having a measuring range of at least 2 to 12 in. (50 to 300 mm) and readable to at least 0.001 in. (0.02 mm).
A1.2.1.3 Plastic or Glass Plates—A plastic or glass plate approximately 13 in. square by ¼ in. thick (330 by 330 mm by 6 mm).
A1.2.1.4 Thermometric device—A thermometric device with a range covering 64 oF to 80 oF (18 oC to 26 oC), with a readability of 0.1oC (0.2oF),
A1.2.1.5 Stopcock grease or similar sealant. A1.2.1.5.1 Miscellaneous equipment—Bulb syringe, towels, etc.
A1.3 Precautions A1.3.1 Perform this method in an area isolated from drafts or extreme temperature
fluctuations. A1.4 Procedure
A1.4.1 Water-Filling Method: A1.4.1.1 Lightly grease the bottom of the compaction mold. Place the greased mold
onto the base plate and secure with the locking studs. Lightly grease the top of the mold. Be careful not to get grease on the inside of the mold.
A1.4.1.2 Determine the mass of the greased mold, base plate, and the plastic or glass plate to be used on top of the mold to the nearest 0.01 lbm (1 g) and record.
A1.4.1.3 Place the mold and the base plate on a firm, level surface and fill the mold with water to slightly above its rim.
A1.4.1.4 Slide the plastic or glass plate over the top surface of the mold so that the mold remains completely filled with water and air bubbles are not entrapped. Add or remove water as necessary with a bulb syringe.
A1.4.1.5 Completely dry any excess water from the outside of the mold and plates.
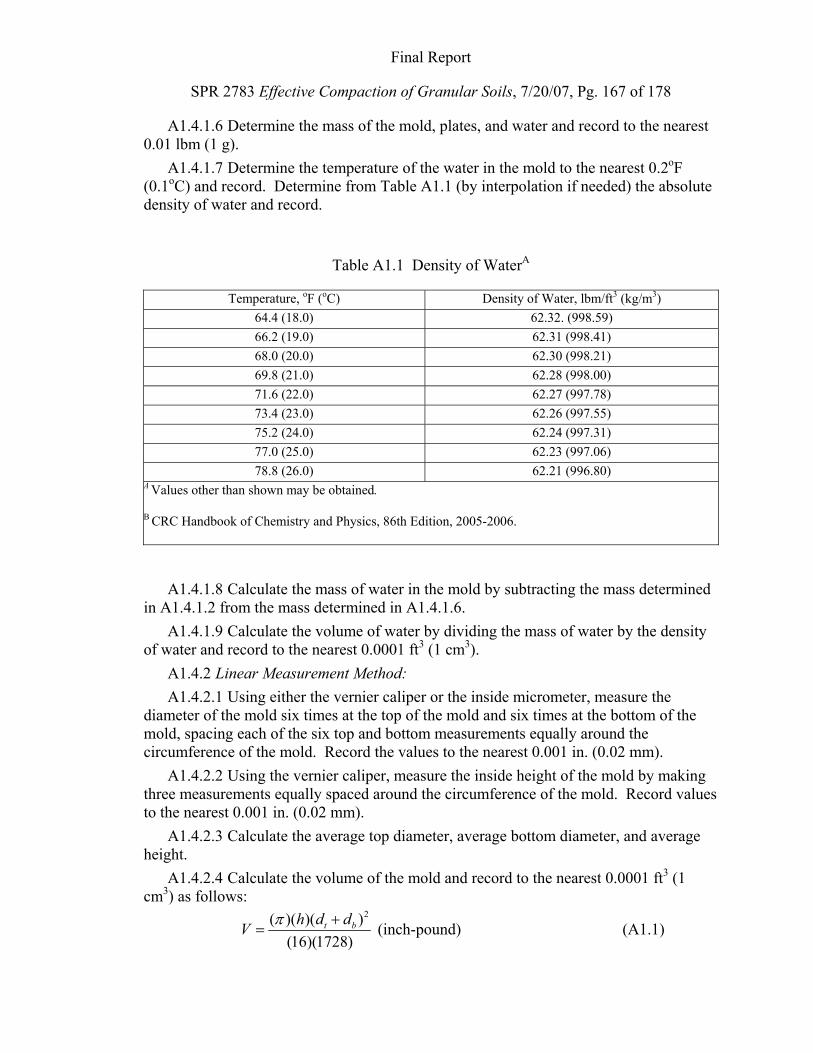
Final Report
SPR 2783 Effective Compaction of Granular Soils, 7/20/07, Pg. 167 of 178
A1.4.1.6 Determine the mass of the mold, plates, and water and record to the nearest 0.01 lbm (1 g).
A1.4.1.7 Determine the temperature of the water in the mold to the nearest 0.2oF (0.1oC) and record. Determine from Table A1.1 (by interpolation if needed) the absolute density of water and record.
Table A1.1 Density of WaterA
Temperature, oF (oC) Density of Water, lbm/ft3 (kg/m3) 64.4 (18.0) 62.32. (998.59) 66.2 (19.0) 62.31 (998.41) 68.0 (20.0) 62.30 (998.21) 69.8 (21.0) 62.28 (998.00) 71.6 (22.0) 62.27 (997.78) 73.4 (23.0) 62.26 (997.55) 75.2 (24.0) 62.24 (997.31) 77.0 (25.0) 62.23 (997.06) 78.8 (26.0) 62.21 (996.80)
A Values other than shown may be obtained.
B CRC Handbook of Chemistry and Physics, 86th Edition, 2005-2006.
A1.4.1.8 Calculate the mass of water in the mold by subtracting the mass determined in A1.4.1.2 from the mass determined in A1.4.1.6.
A1.4.1.9 Calculate the volume of water by dividing the mass of water by the density of water and record to the nearest 0.0001 ft3 (1 cm3).
A1.4.2 Linear Measurement Method: A1.4.2.1 Using either the vernier caliper or the inside micrometer, measure the
diameter of the mold six times at the top of the mold and six times at the bottom of the mold, spacing each of the six top and bottom measurements equally around the circumference of the mold. Record the values to the nearest 0.001 in. (0.02 mm).
A1.4.2.2 Using the vernier caliper, measure the inside height of the mold by making three measurements equally spaced around the circumference of the mold. Record values to the nearest 0.001 in. (0.02 mm).
A1.4.2.3 Calculate the average top diameter, average bottom diameter, and average height.
A1.4.2.4 Calculate the volume of the mold and record to the nearest 0.0001 ft3 (1 cm3) as follows:
2( )( )( )
(16)(1728)t bh d dV π +
= (inch-pound) (A1.1)
Final Report
SPR 2783 Effective Compaction of Granular Soils, 7/20/07, Pg. 168 of 178
2( )( )( )
(16)(1000)t bh d dV π +
= (SI) (A1.2)
where:
V = volume of mold, ft3 (cm3)
h = average height, in. (mm)
dt = average top diameter, in. (mm)
db = average bottom diameter, in. (mm)
1/1728 = constant to convert in3 to ft3, and
1/1000 = constant to convert mm3 to cm3.
A1.5 Comparison of Results A1.5.1 The volume obtained by either method should be within the volume tolerance
requirements of 6.2.1 and 6.2.2. A1.5.2 The difference between the two methods should not exceed 0.5 % of the
nominal volume of the mold. A1.5.3 Repeat the determination of volume if criteria in both A1.5.1 and A1.5.2 are
not met. A1.5.4 Failure to obtain satisfactory agreement between the two methods, even after
several trials, is an indication that the mold is badly deformed and shall be replaced. A1.5.5 Use the volume of the mold determined using the water-filling method as the
assigned volume value for calculating the dry density (see 12.1).
Final Report
SPR 2783 Effective Compaction of Granular Soils, 7/20/07, Pg. 169 of 178
ANNEX
(Mandatory Information)
A2. ENERGY OF VIBRATING HAMMER
A2.1 Scope
A2.1.1 This annex describes the procedure for determining if a vibrating hammer has sufficient energy to conform to this standard.
A2.1.2 A sample of standard sand is compacted following the standard procedure; the energy of the vibrating hammer is sufficient if a specified dry unit weight is achieved
A2.2 Apparatus
A2.2.1 The apparatus used is identical to that found in Section 6.
A2.3 Precautions
A2.3.1 The precautions found in Section 7 apply to this annex.
A2.4 Procedure
A2.4.1 The standard sand tested shall conform to the requirements for 20-30 Sand, as found in Standard C 778.
A2.4.2 Prepare the sand sample as described in Section 8.
A2.4.3 Prepare the apparatus as described in Section 9.
A2.4.4 Compact the standard sand following the procedures of Method A in Section 11.
A2.5 Calculation
A2.5.1 Determine the dry unit weight obtained as described in Section 12.
A2.6 Acceptance
A2.6.1 The energy of the vibrating hammer is sufficient if the calculated dry unit weight meets or exceeds 110.0 lbf/ft3 (17.29 kN/m3)

Final Report
SPR 2783 Effective Compaction of Granular Soils, 7/20/07, Pg. 170 of 178
Appendix B. Vibrating Hammer Additional Tests and Result
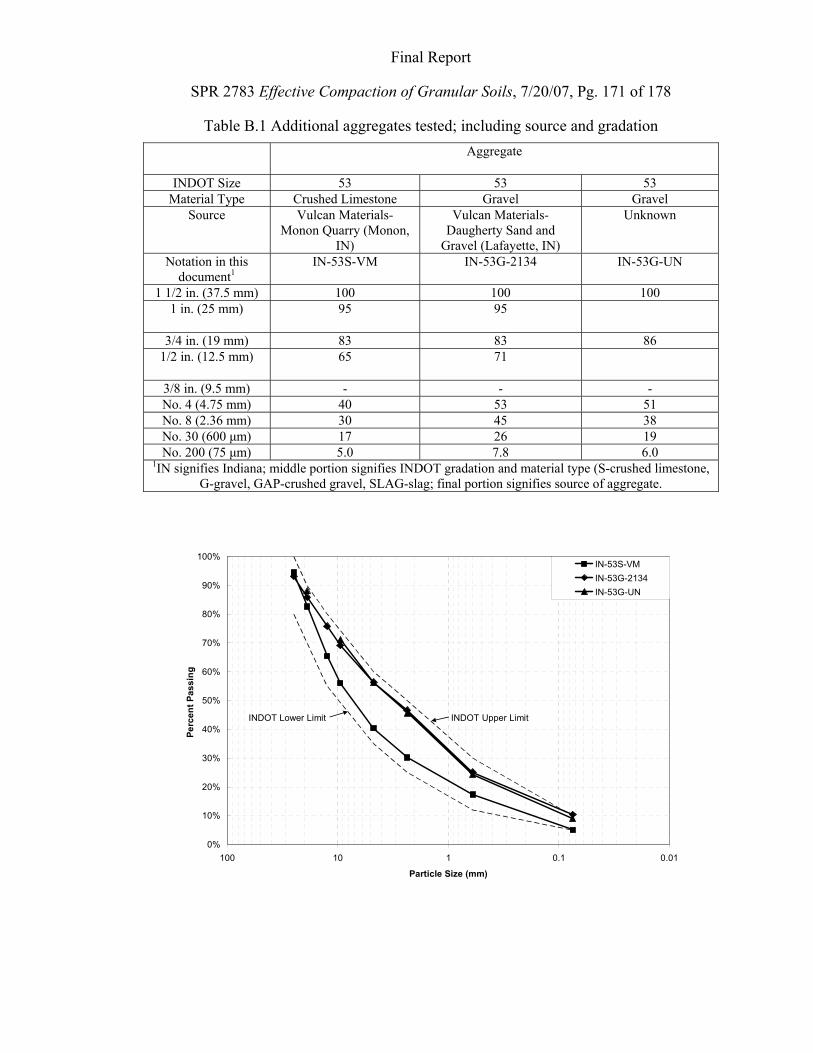
Final Report
SPR 2783 Effective Compaction of Granular Soils, 7/20/07, Pg. 171 of 178
Table B.1 Additional aggregates tested; including source and gradation Aggregate
INDOT Size 53 53 53 Material Type Crushed Limestone Gravel Gravel
Source Vulcan Materials- Monon Quarry (Monon,
IN)
Vulcan Materials- Daugherty Sand and
Gravel (Lafayette, IN)
Unknown
Notation in this document1
IN-53S-VM IN-53G-2134 IN-53G-UN
1 1/2 in. (37.5 mm) 100 100 100 1 in. (25 mm) 95 95
3/4 in. (19 mm) 83 83 86 1/2 in. (12.5 mm) 65 71
3/8 in. (9.5 mm) - - - No. 4 (4.75 mm) 40 53 51 No. 8 (2.36 mm) 30 45 38 No. 30 (600 μm) 17 26 19 No. 200 (75 μm) 5.0 7.8 6.0
1IN signifies Indiana; middle portion signifies INDOT gradation and material type (S-crushed limestone, G-gravel, GAP-crushed gravel, SLAG-slag; final portion signifies source of aggregate.
0%
10%
20%
30%
40%
50%
60%
70%
80%
90%
100%
0.010.1110100
Particle Size (mm)
Perc
ent P
assi
ng
IN-53S-VMIN-53G-2134IN-53G-UN
INDOT Upper LimitINDOT Lower Limit

Final Report
SPR 2783 Effective Compaction of Granular Soils, 7/20/07, Pg. 172 of 178
Figure B.1 Particle size distribution of Indiana 53 coarse aggregates; additional aggregates tested
120
125
130
135
140
145
150
0 2 4 6 8 10
Water Content (%)
Dry
Uni
t Wei
ght (
pcf)
6-in. Mold
6-in. Mold (Corrected)11-in. Mold
ZAV line (Gs)
Saturated tests
Figure B.2 IN-53S-VM compaction results

Final Report
SPR 2783 Effective Compaction of Granular Soils, 7/20/07, Pg. 173 of 178
120
125
130
135
140
145
150
0 1 2 3 4 5 6 7 8 9 10
Water Content (%)
Dry
Uni
t Wei
ght (
pcf)
6-in. Mold
6-in. Mold (Corrected)11-in. Mold
ZAV line (Gs)
No saturated tests
Figure B.3 IN-53G-2134 compaction results
120
125
130
135
140
145
150
0 1 2 3 4 5 6 7 8 9 10
Water Content (%)
Dry
Uni
t Wei
ght (
pcf)
6-in. Mold
6-in. Mold (Corrected)11-in. Mold
ZAV line (Gs) Saturated test
Figure B.4 IN-53G-UN compaction results

Final Report
SPR 2783 Effective Compaction of Granular Soils, 7/20/07, Pg. 174 of 178
Appendix C. Noise Reducing Enclosure for Vibrating Hammer
This appendix contains a detailed discussion on the design and performance characteristics of the noise reducing enclosure for the Vibrating Hammer, developed as part of this research.
In developing the noise reduction closure for the vibrating hammer, commercially available enclosures were first considered. Commercial enclosures were deemed too expensive and possibly not durable and portable enough. The decision was made to build a custom enclosure. Professor Robert Bernhard, a specialist in acoustic noise at the Herrick Labs in the School of Mechanical Engineering at of Purdue University was contacted to determine how best to design such an enclosure. He recommended that the enclosure be made of a heavy material with a noise reducing lining material fastened to the interior.
With the recommended information, a noise reduction enclosure was designed to be portable and allow easy access to the Vibrating Hammer, including being able to roll it in and out. Enclosure was created using ¾-inch plywood and two-by-four lumber for framing. Lumber used was treated, as there was a possibility of outdoor exposure. The height of the enclosure was designed to give ample room for operation of the Vibrating Hammer with 11-inch mold extensions and mechanical lift. The enclosure was designed to be square and give sufficient room for testing. The completed enclosure is shown in Figure C.1.

Final Report
SPR 2783 Effective Compaction of Granular Soils, 7/20/07, Pg. 175 of 178
(a) (b)
Figure C.1 Noise reducing enclosure for Vibrating Hammer: a) closed and b) one side opened
The enclosure consists of four side panels and a top panel. Side panels are held together by hinges and pin connections, both having removable pins that allow assembling and disassembling for portability. Two panels are meant to be stationary, being held together by three rigid connections that are equally spaced vertically. These rigid connections are formed using 2x4 lumber by drilling holes and installing pins through them, as shown in Error! Reference source not found.C.2 (a). To create a rigid connection, two holes were drilled at each location. Large eye bolts are used as pins for these connections. Each of the other two panels is designed to open and close, creating access in the enclosure at a corner, giving a wide opening, rather than using just using one side of the enclosure as a door. These panels attach to one of the two stationary panels by hinges, as shown in Error! Reference source not found.C.2 (b). The pins of these hinges were created from eye bolts, with the eye being reshaped for inserting and removing them. Opposite the hinge end is a small caster, allowing an easy movement of the panels.
Acoustical foam used was Illbruck Prospec 1-inch flat foam with polyurethane coating. The foam contained a pressure sensitive adhesive backing and was attached directly to the plywood of the enclosure on all four sides.

Final Report
SPR 2783 Effective Compaction of Granular Soils, 7/20/07, Pg. 176 of 178
(a) (b)
Figure C.2 Noise reducing enclosure for Vibrating Hammer: a) rigid connection with removable pins and b) hinge with removable pin but are such to create a square enclosure. Both movable panels have a gap at the bottom to allow motion. A rubber flap provided by an overhead door seal was used to fill the gap. One panel is wider than the other to provide an overlap, allowing for the panels to be latched shut.

Final Report
SPR 2783 Effective Compaction of Granular Soils, 7/20/07, Pg. 177 of 178
Appendix D. Pilot Implementation Project Supplement Specification

Final Report
SPR 2783 Effective Compaction of Granular Soils, 7/20/07, Pg. 178 of 178


