A Study of Evaporation Heat Transfer Coefficient Correlations at Low Heat and Mass Fluxes for Pure Refrigerants and Refrigerant Mixtures M. K. Smith, J. P. Wattelet, and T. A. Newell ACRCTR-32 For additional information: Air Conditioning and Refrigeration Center University of Illinois Mechanical & Industrial Engineering Dept. 1206 West Green Street Urbana, IL 61801 (217) 333-3115 January 1993 Prepared as part of ACRC Project 01 Refrigerant-Side Evaporation and Condensation Studies 1. C. Chato, Principal Investigator
Transcript
A Study of Evaporation Heat Transfer Coefficient Correlations at Low Heat
and Mass Fluxes for Pure Refrigerants and Refrigerant Mixtures
M. K. Smith, J. P. Wattelet, and T. A. Newell
ACRCTR-32
For additional information:
Air Conditioning and Refrigeration Center University of Illinois Mechanical & Industrial Engineering Dept. 1206 West Green Street Urbana, IL 61801
(217) 333-3115
January 1993
Prepared as part of ACRC Project 01 Refrigerant-Side Evaporation and Condensation Studies
1. C. Chato, Principal Investigator
The Air Conditioning and Refrigeration Center was founded in 1988 with a grant from the estate of Richard W. Kritzer, the founder of Peerless of America Inc. A State of Illinois Technology Challenge Grant helped build the laboratory facilities. The ACRC receives continuing support from the Richard W. Kritzer Endowment and the National Science Foundation. Thefollowing organizations have also become sponsors of the Center.
Acustar Division of Chrysler Allied-Signal, Inc. Amana Refrigeration, Inc. Bergstrom Manufacturing Co. Caterpillar, Inc. E. I. du Pont de Nemours & Co. Electric Power Research Institute Ford Motor Company General Electric Company Harrison Division of GM ICI Americas, Inc. Johnson Controls, Inc. Modine Manufacturing Co. Peerless of America, Inc. Environmental Protection Agency U. S. Anny CERL Whirlpool Corporation
For additional information:
Air Conditioning & Refrigeration Center Mechanical & Industrial Engineering Dept. University of Illinois 1206 West Green Street Urbana IL 61801
2173333115
A Study of Evaporation Heat Transfer Coefficient Correlations at Low Heat mid Mass Fluxes for Pure Refrigerants and Refrigerant Mixtures
• M. K. Smith, 1. Wattelet and T. A. Newell DepL ofMech. Eng •• University ofDlinois. 1206 W. Green SL. Urbana, n. 61821
Abstract
An average R12 refrigerant correlation has been developed for the mass flux range of 25-100
kg/m2-s and the heat flux range of 2-10 kW/m2. Refrigerant mixtures of 80% R22/lO% R141b and 65% R22/35% R123 have also been tested over asjrniJar range of conditions. Mixture heat transfer
coefficients have been detennined and correlations for each mixture pair are presented. The R221R141b
average correlation may have a strong dependence on changes in surface tension. The heat transfer coefficient of R22JR141b compares well with that of R12. The heat transfer coefficient of R22/R123
severely under performs R12.
Nomenclature G2D We=-Bo - Boiling n1UDbec • ap.
Bo=l Gila Symbols
C -Celsius Bond - Bond number
~ - specific heal of liquid (JIks-K) - tube inside diameter (m)
Bond = g(P. - py )D2 = We. g -lICCeleraaion of gravity (m/s2) G - mua nux ('qJrn2-a)
a Fr. h - heal tnmsfe:r coefficient (W/m2-K) Fr - Froude mUllber of liquid ii - average heat tnmsfe:r coefficient (DOt quality
G2 dependent) (W/m2_K)
Fr=- hi - heat tnmsfe:r coefficient of the liquid from
• p.2gD Dittus-Boelter cmrelation (w/m2-K) [1]
K - Pierre boiling nmnber
h - 0023 k. Re 0.8Pr 0.4 ,4x·i
K= 11 .-. D··
len·g hlo - heal tnmsfe:r coefficient of the liquid only - Prandd number of liquid
&om Diaus-Boe1ter correlation (W/m2-K) [1]
Pr - . c,. J.1. k .- h - 0 023--L Re 0.8 Pr 0.4 k. 10-· D 10 I
Ret - Reyuolds number of liquid ilg -latent heal of vaporization (kJ1ks) Jq - thermal conductivity of liquid (W /m-K)
Re _ GD(I-x) )en -length ofheat exchmge:r (m) .- q - heal flux (kW/m2) J.1. UIUC - Univemity of Dlinois at UJbaDa-Champaign
Relo - Reynolds number of liquid only x -quality Greet Symbols
GD Ax - change in quality across heal exchmge:r Re .. =- 111 - viIc:osity of liquid ('qJrn-I)
J.1. PI _ density of liquid ('qJrn3) Wei - Weber number of liquid
Pv _ density of vapor ('qJrn3)
(J - surface tension of liquid (N/m)
Introduction .. •
Many refrigerant correlations are developed from data taken at mass and heat fluxes greater than
100 kg/m2s and 10 kW/m2, respectively. The dominate flow regime, at these conditions, is annular with
nucleate boiling generally present at low qualities. These flow conditions typify those found in window
air conditioners and heat pumps. Examining conditions relevant to domestic refrigerator-freezer
evaporators where mass fluxes are below 60 kg/mls and heat fluxes are less than 2.5 kW/rrll is the
primary goal of this study. In this range, the flow is predominately wavy/stratified. A second goal of
this paper is a discussion of non-azeotropic refrigerant mixture evaporation heat transfer coefficients.
Two mixtures have been studied under conditions found in domestic refrigerator-freezer evaporators.
A new average R12 correlation, based on data from the University of Dlinois at Urbana
Champaign (UlUC R12) evaporation test facility, has been developed for low heat flux and mass flux
conditions: The heat transfer coefficients were obtained from a horizontal, single-tube evaporation test
setup. The correlation is a function of the heat transfer coefficient of the liquid only, hlot and the boiling
number, Bo. hlo is calculated from the familiar Dittus-Boelter correlation [1]. The ccmelation gives an
average versus a local value of the heat transfer coefficient; therefore, the quality does not appear in the
correlation.
A discussion of this new correlation and existing correlations over a range of heat and mass
fluxes is presented. The correlations of Jung and" Radermacher [2], Kandlikar [3], Pierre [4] and Shah
[5] were considered for comparison with the UIUC R12 correlation. Pierre's correlation and Shah's
correlation are compared directly because they overlap with the range of interest.
The second part of the worlc presents results obtained from non-azeottopic refrigerant
evaporation experiments. A domestic refrigerator-freezer evaporator test facility has been used for this
work. The urnc R12 correlation is used to obtain air-side heat transfer coefficients as a function of air
velocity for two sizes of refrigerator evaporators in the test facility. The test facility consisted of a
refrigerant loop loaded with R12 and two well-insulated evaporator compartments. Controlled
conditions were maintained in each compartment and careful measurements of temperatures and mass
flow rates permitted an energy balance to be performed on each compartment. Knowledge of the overall
energy balance and the refrigerant heat transfer coefficient, from the UIUC R12 correlation, allowed
direct calculation of an average air-side heat transfer coefficient. Tests were run over a systematic range
of air flow rates.
Once evaporator air-side performance was characterized, the test loop was loaded with the
refrigerant mixtures 65% R22/35% R123 and 80% R2212O% R141b. Knowledge of the overall energy
balance and the air-side heat transfer coefficient from the evaporator tests allowed direct calculation of
refrigerant heat transfer coefficients for a wide range of operating conditions. The heat transfer
coefficient values obtained were fit to an appropriate correlation form. Several possible fits were
explored. The final correlation forms for each mixture combination, 65% R221R123 and 80%
R221R141b, are presented. A comparison of the mixture correlations and the UIUC R12 correlation was
2
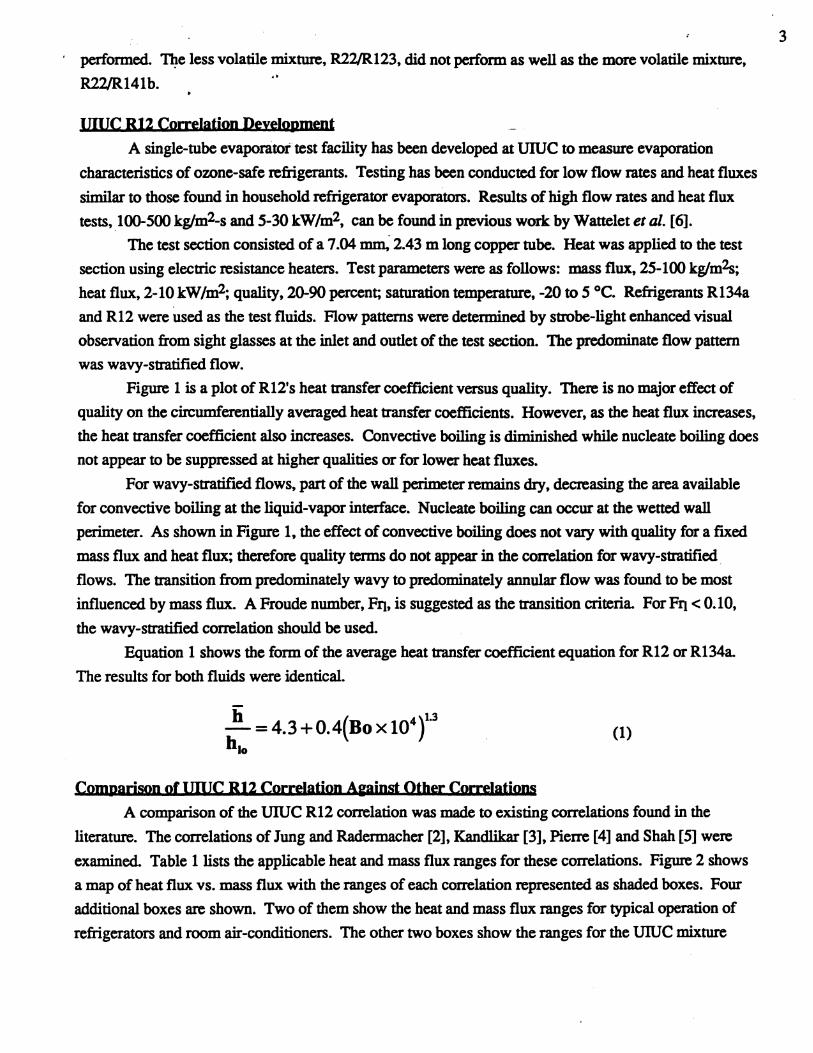
performed. ~e less volatile mixture, R221R123, did not perform as well as the more volatile mixrure,
R22/R141b. "
UIUC B12 Correlation DeyelQpmeut
A single-tube evaporator test facility has been developed at UIUC to measure evaporation
characteristics of ozone-safe refrigerants. Testing has been conducted for low flow rates and heat fluxes
similar to those found in household refrigerator evaporators. Results of high flow rates and heat flux
tests,l00-500 kg/m2-s and 5-30 kW/m2, can be found in previous work: by Wattelet et al. [6].
The test section consisted of a 7.04 ~ 2.43 m long copper tube. Heat was applied to the test
section using electric resistance heaters. Test parameters were as follows: mass flux, 25-100 kg/m2s;
and R12 were used as the test fluids. Flow patterns were determined by strobe-light enhanced visual
observation from sight glasses at the inlet and outlet of the test section. The predominate flow pattern
was wavy-stratified flow.
Figure 1 is a plot of R12's heat transfer coefficient versus quality. There is no major effect of
quality on the circumferentially averaged heat transfer coefficients. However, as the heat flux increases,
the heat transfer coefficient also increases. Convective boiling is diminished while nucleate boiling does
not appear to be suppressed at higher qualities or for lower heat fluxes.
For wavy-stratified flows, part of the wall perimeter remains dry, decreasing the area available
for convective boiling at the liquid-vapor interface. Nucleate boiling can occur at the wetted wall
perimeter. As shown in Figure I, the effect of convective boiling does not vary with quality for a fixed
mass flux and heat flux; therefore quality terms do not appear in the correlation for wavy-stratified
flows. The transition from predominately wavy to predominately annular flow was found to be most
influenced by mass flux. A Froude number, FIl, is suggested as the transition criteria. For Fq < 0.10,
the wavy-stratified correlation should be used.
Equation 1 shows the form of the average heat transfer coefficient equation for R12 or RI34a.
The results for both fluids were identical.
b (4)U -=4.3+0.4 BoxlO b lo
(1)
Comparison of lilllC B12 Correlation Apinst Other Correlations
A comparison of the UIUC R12 correlation was made to existing correlations found in the
literature. The correlations of Jung and Radermacher [2], Kandlikar [3], Pierre [4] and Shah [5] were
examined. Table 1 lists the applicable heat and mass flux ranges for these correlations. Figure 2 shows
a map of heat flux vs. mass flux with the ranges of each correlation represented as shaded boxes. Four
additional boxes are shown. Two of them show the heat and mass flux ranges for typical operation of
refrigerators and room air-conditioners. The other two boxes show the ranges for the UIUC mixture
3
correlations and will be discussed in a later section. Jung's range is typical of heat pumps.
Of the fopr correlations, Jung, Kandlikar, Pierre and Shah, only Pierre's and Shah's correlations
overlap the UIUC R12 correlation. Both correlations were developed with tubes 50 percent or larger in
diameter than is typically used f~ domestic refrigerator-evaporators. Pierre's correlation, Equation 2, is
an average correlation developed specifically for R12 and covers the entire range of the UIUC
correlation.
h = O. 00097 ~ Re lo KO.s D .
K is a boiling number defined by Pierre.
(2)
Shah's correlation is a generalized local correlation. For this correlation, data was gathered from
nineteen independent experimental studies which covered eight different fluids. In addition, Jung's and
Kandlikar's correlations are general correlations. To be accurately compared to the UIUC R12 average
correlation, Shah's correlation was numerically integrated, as shown in Equation 3, over the quality
range of 0.1 to 0.9 to obtain an average heat transfer coefficient.
(3)
Shah's correlation will not be presented here. If interested, please check reference [5].
Looking again at Figure 2, the ranges of Pierre's and Shah's correlations are large, encompassing
at least a part of the operating ranges of refrigerators, room air conditioners and heat pumps. It would be
expected that these correlations would not be as accurate as a correlation specifically targeted for one of
these ranges. There is a flow regime transition from the low mass flux refrigerator operating range to the
high mass flux heat pump operating range of stratified/wavy to annular flow. Even within a specific
range there can be large differences in Bo number and thus the possible onset of nucleate boiling at the
wetted tube wall. On the chart, Bo number increases up and to the left and decreases down and to the
right.
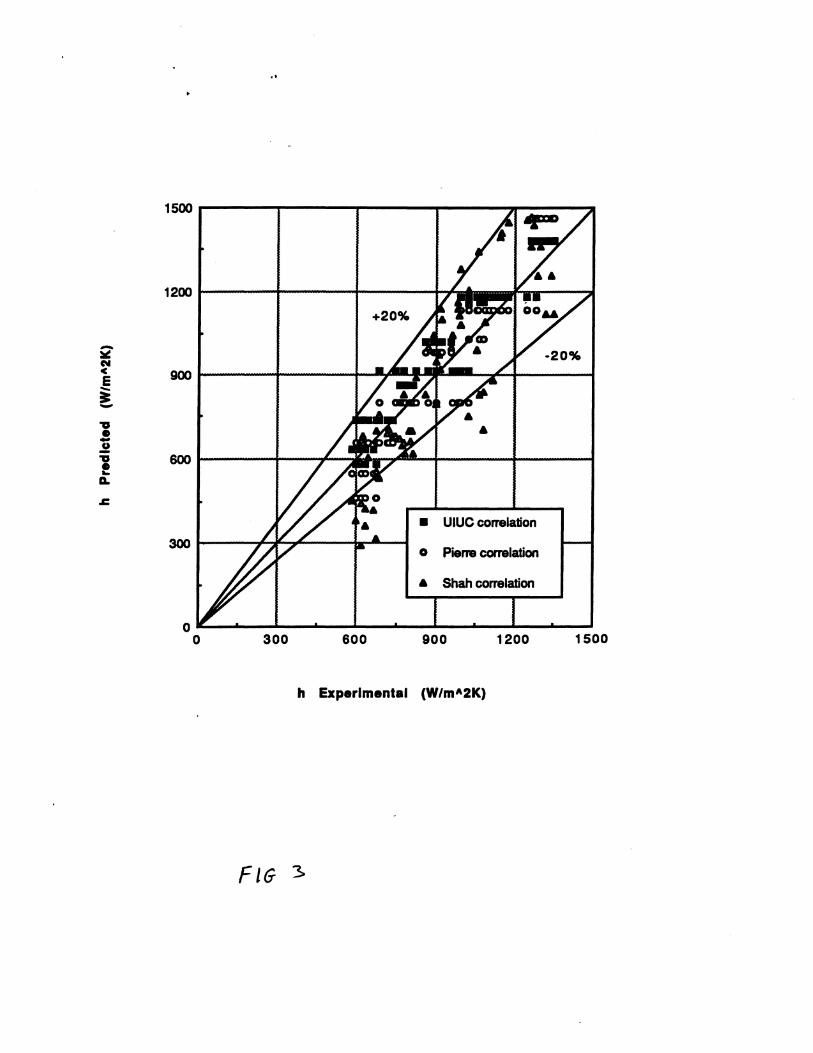
Figure 3 is a graph showing a comparison of the UIUC R12, Pierre's R12 correlation, and Shah's
correlation with UlliC experimental heat transfer coefficients. The mass flux and heat flux range over
which the comparison was performed was that of the UIUC R12 correlation, G = 25 - 100 kg/m2-s and q
= 2 - 10 kW/m2. The saturation temperature was -10 degrees C. The three lines on the graph are the
+20%, 0% and -20% error bounds.
All three correlations predict R12 heat transfer coeeficients with reasonable accuracy over the
entire range of realtively low heat flux/mass flow conditions. Shah's correlation shows somewhat
broader scatter with deviations greater than 20 percent at the lower heat transfer coefficient range,
however, given the relatively broad range of data used to derived the correlation, it is generally within
acceptable accuracy. The tendency of Pierre's and Shah's correlations to underpredict transfer
coefficients at the low end may be due to lack of nucleate boiling effects in their correlations.
4
.. •
Use of muc B12 Correlation to Determine Air-side Characteristics of Evaporators
A heat exchanger such as an evaporator can be characterized by its UA value. Knowing the
inlet/outlet air and refrigerant teinperatures and the evaporator load, the UA value can be calculated
from:
UA= Q where LMTD= AT1-ATa LMTD In(AT2 /AT1)
(4)
Neglecting the small tube resistance, an alternate expression for UA can be written:
I I I -= + (5) UA hairA. h,.,A,.,
With the knowledge of the evaporator geometry, the UA value and hree, an average air-side heat ttansfer
coefficient can be calculated.
Two evaporators, an eight pass and a four pass evaporator, were constructed at the U of I
(University of Illinois) and simultaneously tested. The eight pass evaporator ttansferred heat in the
quality range of approximately 0.0 to 0.5 and the four pass evaporator transferred heat in the quality
range of approximately 0.5 to 1.0. With separate heat exchangers, the effect of quality change and heat
flux could be independently studied.
The tests were canied out in an evaporator test facility with its own independent refrigeration
loop. The evaporators were placed in well insulated compartments of known thermal properties. R12
was loaded into the refrigeration loop and a series of tests were performed for various air velocities and
refrigerant conditions. (The well insulated compartments were actually a refrigerator mock up built out
of foam board. The walls are four inches thick with an approximate R value of 28. The dimensions of
the compartments are similar to those of an 18 cubic foot refrigerator.)
Using the UIUC RI2 correlation, the air side heat transfer coefficients were calculated from
Equation S. Figure 4 shows a plot of the air-side heat ttansfer coefficient of the four and eight pass
evaporator over a wide range of air velocities. The four pass evaporator has greater air-side heat transfer
coefficients over the tested velocity range than the eight pass evaporator. The difference is due to partial
blockage of the air flow over subsequent tubes by the first few tubes.
Calculation of Mixture Heat Tnnster Coemdent and CorreIatjon Developmept
Two sets of mixture tests were performed. The first set was with the mixture 80% R22/20%
R141b and the second set was with the mixture 65% R22/3S% R123. Figure 2 shows the mass and heat
flux ranges over which both of the sets of tests were performed. The R221R141b tests were over a larger
range of heat fluxes, whereas the R221R123 tests were over a larger range of mass fluxes.
The loop was run at a variety of refrigerant conditions and air velocities. With knowledge of the
air-side heat transfer coefficient and the physical dimensions of the heat exchanger, the refrigerant heat
5
transfer coefficients were able to be calculated from Equation 5. After the runs were complete, an "
attempt to correlate the data was made. Figure 5 and 6 show the plots of the COITelated heat transfer
coefficient plotted against the measured heat transfer coefficient with +20%, 0% and -20% error lines.
For Figure 5, the R22/R141b plot, the data points show a fair amount of scatter. Figure 6, the R22/R123
plot, shows trends in the data at low heat transfer coefficient values. The slope of the trends is horizontal
indicating that variation of the heat transfer coefficient has been compromised by the exclusion of an
important variable such as quality.
Several correlation forms were tried similar to the previous COITelations referred to in this paper.
The average correlations for R22/R141b and R22/R123 are shown in Equations 6 and 7, respectively.
b/hlo =exp(-16.617)Bond6,lBoo,7 (6)
b/hlo = exp( -3. 723)Bond1,4Boo.1 (7)
The correlations contain two non-dimensional numbers. The Bo number is present to account for
the change in the heat transfer coefficient with heat flux. The Bo number dependence for R22/R141b is
much greater than for the R22/R123 mixture. The R22/R141b mixture is 80% R22, whereas the
R22/R123 mixture is only 65% R22. R22 is the volatile component of both mixtures; therefore the
greater dependency on Bo number is associated with more volatile mixture, R22/R141b. (Note: The
R22/R141b mixture was also tested over a wider range of heat flux.)
The Bond number was found to be the best non-dimensional number to used on the basis of trial
and error. These mixtures exhibit slightly higher values of smface tension compared to R12.
R22JR123's surface tension is 1.5% greater and R22/R141b's smface tension is 7.7% greater than R12 at
an evaporating temperature of -10 degrees C. Since the major component of the mixtures is R22, the
mixtures have a larger capacity than R12. The runs were performed on a equal load basis; consequently,
the mass fluxes for the mixtures were less than R12. Reduced mass flux and greater values of smface
tension could lead to wave suppression on the refrigerant vapor/liquid interface. This wave suppression
could have impact on the convective evaporation component of the heat transfer coefficient The strong
dependence of R22/R141b on Bond number is due to its higher smface tension.
Looking closely at Figures 5 and 6, the fit is not especially good. One could argue that the use of
an average heat transfer coefficient correlation is not appropriate if the mixture is characterized by a
large temperature glide. (The temperature glide is the amount the saturation temperature changes across
the saturation dome.) Large differences in property values cannot be accounted for with an average
correlation. A second attempt was made to fit the data with a correlation form that was quality
dependent in an effort to capture the property change due to the temperature glide. Instead of hlo
appearing in the correlation, hI appears to account for the quality dependence. The local correlations for
R22/R141b and R22/R123 are shown in Equations 8 and 9, respectively.
h = exp(16.14)h.o.41Fr2,4We-1.9BoO,28 (8)
(9)
6
The W~ and Fr number dependence come from the Bond number dependence in Equations 6 and 7. The ratio of the We n11IDb& to the Fr number is essentially the Bond number. Greater correlation . dependence is on the Bo number for the R221R141b mixture.
Figures 7 and 8 are plots_of the measured vs. correlated heat transfer coefficient values. Error
lines of +20%,0% and -20% are drawn on the plots. For the R221R141b mixture, Figure 7, not much
improvement can be seen between the average and local correlation. The scatter pattern remains unchanged implying that the change in transfer coefficient value is essentially independent of quality. The R221R123 plot, Figure 8, shows significant improvement in the area which had the horizontal trends
discussed earlier in this section. When quality was introduced back into the correlation, data that was
previously horizontal, lines up with the 0% error line. This indicates that the R22/R123 mixture is
dependent on quality and that a local correlation is best.
Comparison of Mjxture Correlations to tbe JUnc B12 Coudation
Figure 9 shows a comparison of the average mixture correlations with the UIUC R12 correlation.
The comparison was done over a heat and mass flux range that was common to all three fluids (check
Figure 2). The R22114lb mixture performs well against R12. Unfortunately, R22/R123 significantly under performs R12.
As pointed out earlier, the R22/R123 mixture is only 65% R22. It is less volatile than the R221R14lb mixture, which is 80% R22. At these relatively low values of heat flux, nucleate boiling is
further suppressed for the R22/R123. Mass diffusion effects lower the superheat at the wetted wall. The more volatile component R22 is driven away from the wall region leaving an enriched mixture of the
higher boiling point R123 near the wall, thus lowering the effective amount of superheat.
Conclusions
Heat transfer effects for some pure refrigerants and refrigerant mixtures have been examined in a
range of heat fluxes and mass flow rates that are representative of domestic refrigerator-freezers. Typical refrigerator mass fluxes are 60 kg/m2-s or less and typical heat fluxes are 2.5 kW/m2 or less. An
average correlation for R12 and Rl34a has been presented for a mass flux range of 25-100 kg/m2-s and a
heat flux range of 2-10 kW/m2. This correlation is valuable as a design tool for the domestic
refrigeration industry. Examination of two non-azeotropic mixnires shows that heat transfer characteristics may have
significantly different characteristics. The less volatile mixture. R22/R123. has a quality dependence
and its heat transfer coefficient severely under performs that of R12, whereas the more volatile mixture.
R221R14lb. does not have a significant quality dependence and its heat transfer coefficient compares
well with that of R12.
7
Note t o.
• Since the mixture properties used for the development of the correlation are calculated and not
measured, there is uncertainty in these values. The aVailability of measured physical property for
mixtures is very limited; therefore, the liquid physical properties were calculated from mixture rules and
the g~us physical properties were calculated from the theory of corresponding states for gases as
presented by Jung and Radermacher. [7]
Note 2
The mixture data was gathered in a indirect manner. Typical correlations are created from data
taken from a horizontal tube evaporation test stand, as was the case for the UIUC R12 correlation presented in the first section. The mixture data was gathered from a real multi-pass evaporator operating
under real refrigerator conditions. Flow patterns in a real evapmator, as opposed to a horizontal tube,
are quite different. Observations made of a glass evaporator at UIUC [8] have documented that flow
transitions do occur at the return bends in the evaporator. For stratified flow, transitions to annular flow
occur immediately after the return bends and persists for about l/lOth the tube length. These flow
transitions will have an effect on the correlation form.
AckpQwledcmenu
Bob Hendricks at the United States Environmental Protection Agency and the Air Conditioning and
Refrigeration Center at the University of Dlinois Department of Mechanical and Industrial Engineering.
References
1 Dittus, F. W., and L. M. K. Boelter. University of California Publications on Engineering, VoL 2,
p. 443, Berlceley, 1930.
2 Jung, D.S. and R. Radermacher, "Prediction of Heat Transfer Coefficients of Various
Refrigerants During Evaporation", ASHRAE Transactions, V. 97, Pt. 2. 3 Kandlikar, S.G., "A General Correlation for Saturated Two-Phase Boiling Heat Transfer Inside
Horizontal and Vertical Tubes", Journal of Heat Transfer, VoL 112, February 1990, pp. 219-228.
4 Pierre, B., "The Coefficient of Heat Transfer for Boiling Freon-12 in Horizontal Tubes". Heating
and Air Treatment Engineer, December, 1956, pp. 302-310.
5 Shah, M.M., "Chart Correlation for Saturated Boiling Heat Transfer: Equations and Further
Study", ASHRAE Transactions, VoL 88. Part 1, pp. 185-196.
6 Wattelet, J., J. M. Saiz Jabanio, J. C. Chato. J. S. Panek and A. L. Souza, ''Experimental
Evaluation of Convective Boiling of Refrigerants HFC-134a and CFC-12", 28th National Heat Transfer
Conference of the ASME, Two-Phase Flow and Heat Transfer, 1992, Vol HID-Vol 197, pp. 121-127.
7 Jung. D. and R. Radermacher. "Transport Properties and Surface Tension of Pure and Mixed
Refrigerants". ASHRAE Transactions, V. 97, Pt. 1.
8 Barnhart, J., "A n Experimental Investigation of Flow Patterns and Liquid Entrainment in a
8
Horizontal Tube Evaporator", Ph.D. Thesis, Department of Mechanical Engineering, University of
lllinois, December, 1992 . . List of Fiawres
Figure 1. Heat transfer coefficient versus quality for wavy-stratified flow during flow boiling. Mass