2824 IEEE TRANSACTIONS ON BIOMEDICAL ENGINEERING, VOL. 60, NO. 10, OCTOBER 2013
A Study of Evoked Potentials From Ear-EEGPreben Kidmose∗, Senior Member, IEEE, David Looney, Member, IEEE, Michael Ungstrup, Member, IEEE,
Mike Lind Rank, Member, IEEE, and Danilo P. Mandic, Fellow, IEEE
Abstract—A method for brain monitoring based on measuringthe electroencephalogram (EEG) from electrodes placed in-the-ear(ear-EEG) was recently proposed. The objective of this study is tofurther characterize the ear-EEG and perform a rigorous compar-ison against conventional on-scalp EEG. This is achieved for bothauditory and visual evoked responses, over steady-state and tran-sient paradigms, and across a population of subjects. The respec-tive steady-state responses are evaluated in terms of signal-to-noiseratio and statistical significance, while the qualitative analysis ofthe transient responses is performed by considering grand aver-aged event-related potential (ERP) waveforms. The outcomes ofthis study demonstrate conclusively that the ear-EEG signals, interms of the signal-to-noise ratio, are on par with conventionalEEG recorded from electrodes placed over the temporal region.
E LECTROENCEPHALOGRAPHY (EEG) refers to therecording of electrical signals which represent aggregated
electrical activity from a large number of temporally and spa-tially aligned neurons of the brain. The EEG signals typicallyoriginate from the cortex, but may also arise from the brainstemor from the cranial nerves. Within the clinical domain, EEG is awell-established and valuable tool for the diagnosis of e.g., neu-rological disorders, tumors, strokes, and brain death [1]. EEG isalso extensively used within neurophysiology, cognitive neuro-science, cognitive psychology, and brain–computer interfacing(BCI) [2].
The characteristics of EEG signals depends on the locationof the electrodes, the state of the brain, and the stimulationof the brain e.g. through the peripheral nervous system or theoptic nerve/retina. An auditory stimulus, for instance, will in-duce modulated patterns into the EEG, and the changes in theEEG from the otherwise spontaneous EEG are termed auditoryevoked potentials (EPs) [3].
Despite the clinical value of EEG, several issues limit its usebeyond the clinical environment. To this end, a considerable
Manuscript received December 21, 2012; revised February 11, 2013 and May22, 2013; accepted May 22, 2013. Date of publication May 29, 2013; date ofcurrent version September 14, 2013. Asterisk indicates corresponding author.
∗P. Kidmose is with the Department of Engineering, Aarhus University,Aarhus DK-8000, Denmark (e-mail: [email protected]).
D. Looney and D. P. Mandic are the with the Department of Electrical andElectronic Engineering, Imperial College, London SW7 2BT, U.K. (e-mail:[email protected]; [email protected]).
Digital Object Identifier 10.1109/TBME.2013.2264956
effort went into the development of ambulatory and wearableEEG systems [4]. These allow for recording outside the clin-ical environment, but are largely inadequate for everyday use.This is both because of their limited ability to integrate intodaily activities, requirement for a skilled assistant, and the factthat the ambulatory systems, like the conventional systems, stillhave clearly visible electrodes and leads from the electrodesto the recording device. Despite some advances in addressingthese issues, on-scalp systems inevitably require a means forstable attachment (cap, headset, and/or adhesive), making therecording process uncomfortable, obtrusive, and stigmatizing.
Recently, we introduced a novel EEG recording approachcalled ear-EEG [5]–[7], whereby the signal is recorded fromelectrodes embedded on a personalized earpiece placed in theear canal. Independently, a similar method was proposed in [8],where a more generic type of earpiece was disclosed. Whereasthe ear-EEG method based on the individualized earpiece hasbeen prototyped and validated, we are not aware of any resultspublished from the method disclosed in [8].
Compared with existing on-scalp systems, the ear-EEG plat-form has several attractive properties [7]: discreet—not clearlyvisible or stigmatizing, unobtrusive—comfortable to wear andimpeding the user as little as possible, and user-friendly—can beoperated and attached by the user. In this way, ear-EEG exhibitsa high degree of comfort and excellent long term wearabilityat the expense of a reduced number of electrodes and thus acompromise in recording quality. However, there are a numberof applications, clinical and nonclinical, for which a small num-ber of electrodes are sufficient, and for which a fully wearablerecording platform is prerequisite.
So far ear-EEG has only been explored in proof-of-conceptstudies for a limited number of subjects [6]. Our aim is to furthercharacterize the ear-EEG and compare it to conventional on-scalp EEG across a population of subjects. This is achievedthrough studies for both auditory and visual EPs, and for bothsteady state and transient responses.
II. EAR-EEG RECORDING METHOD AND SETUP
The basis of EEG is that a large number of spatially alignedneurons have coherent electrical activity. The dendrite currentof the neurons causes a corresponding extracellular current thatgives rise to electrical potentials in the tissue. These potentialsare observable on the scalp surface and also on the surface of theear canal. The feasibility of the ear-EEG concept is illustratedthrough a model of the propagation of the electrical potentialfrom a spatially aligned and temporally synchronized group ofneurons (approximated by a dipole) shown in Fig. 1.
The ear-EEG concept is illustrated in Fig. 2; electrodes madeof silver (Ag) are embedded on a personalized earpiece placed
KIDMOSE et al.: STUDY OF EVOKED POTENTIALS FROM EAR-EEG 2825
Fig. 1. Principle of the propagation of brain electrical potential to the scalpand ear canal from a population of neurons in the temporal region of the brain.The aggregated dendritic current from a large population of cortical neuronshas been modeled as dipoles. The dipole on the left is radial (correspondingto neurons located on a gyrus), whereas the dipole on the right is tangential(corresponding to a dipole in a sulcus). Details: The simulation is 2-D. The headwas modeled as a circle with radius 85 mm; the ear canals have height of 10 mm,and depth of 26 mm. The head was modeled as a homogeneous mass of tissuewith conductivity 0.32 S/m corresponding to the conductivity of physiologicalsaline. The dipole had an electric potential of −80 mV, corresponding to atypical cell membrane potential. The dimension of the dipole was 1 × 1 mm.The contour lines represent equipotentials with 50 μV between each line.
Fig. 2. Earpiece with embedded electrodes (relative to the ear canal).
in the outer ear. The earpieces in our study are produced usingthe same manufacturing processes as is standard for customizedhearing aid earplugs: 1) taking a wax-impression of the outerear; 2) obtaining a digitized 3-D model by scanning the im-pression in a 3-D laser-scanner; 3) modeling the earpiece in aCAD program; and 4) manufacturing of the earpiece using a 3-D printer (additive manufacturing technology). Electrodes aremounted on the outer surface of the earpiece and connected byleads to a connector embedded in the earpiece.
The earpieces are hollow, with a φ3 mm through-hole inthe longitudinal direction for sound to propagate unimpededto the eardrum. On each earpiece are placed four electrodes,and for all the recordings reported in this paper the electrodepositions were ExA, ExB, ExE, and ExH for both x=L and x=R(see the labelling scheme in Appendix A). The electrode areaswere approximately 20 mm2 ; an example of an earpiece withelectrodes is shown in Fig. 3(b) and (c).
For all the ear-EEG recordings, the electrode ExH was usedas reference electrode, ExA was used as ground (common mode
Fig. 3. Ear-EEG: Views of earplug for the right ear. (a) Right ear earplugmarked with labels. (b) Earplug, electrodes ERA, ERB, and ERH are visible.(c) Opposite view to (b). Connector and electrode ERE are visible. (d) Earplugwith the connector attached. (e) Right ear with the earplug in place. (f) Rightside view of the measurement setup.
feedback), and the EEG signals were recorded from ExB andExE relative to ExH. A distinguishing feature of our ear-EEGsystem is that the recordings are truly in-the-ear measurements;that is, all the electrodes, including the reference and groundelectrodes, are placed within the ear, and are galvanically in-sulated from any of the electrode on the subject (e.g., scalpelectrodes and electrodes in the opposite ear). Fig. 3(e) and (f)shows the experimental setup used, that allows for a simultane-ous recording of ear-EEG and standard on-scalp EEG.
On-scalp EEG was recorded from eight electrodes (10–20electrode system, electrode positions: T7, Tp7, Tp9, T8, Tp8,Tp10, Oz, and Pz) relative to the right ear lobe (reference)and the Cz electrode as ground (common mode feedback). Therecording amplifier was the g.USBamp by g.tec, which allowssimultaneous and independent (different ground and referenceconfigurations) recordings of groups of EEG channels.
Before the recordings, the concha and the ear canals werecleaned with ethanol, and the skin was prepared with abrasivegel. Conductive gel was applied to the electrodes, the earpieceswere put in place, and electrode impedances were tested toensure that their values were below 5 kΩ.
III. EVOKED POTENTIALS: METHODS AND STIMULI
The amplitudes of EP are in general much lower than the am-plitude of the spontaneous EEG, making it necessary to averageover multiple trials in order to reveal the ERPs. However, sinceERP waveforms typically last for several hundreds of millisec-onds, the data segments used for the averaging often containERPs from previous stimuli. As a consequence, the averagedwaveform will deviate from the true underlying ERP waveform,and this distortion may be significant even for rather long inter-stimulus intervals. A way to reduce this distortion is to apply arandom interstimulus interval (jittered timing) which effectively
2826 IEEE TRANSACTIONS ON BIOMEDICAL ENGINEERING, VOL. 60, NO. 10, OCTOBER 2013
filters out the high frequency components from the underlyingtrue ERP waveform. As the range of the random interstimulusinterval is increased, the lower frequency aliasing componentsfrom the averaged waveform are reduced, see e.g., [9] for moredetail.
Instead of trying to reduce the distortion caused by averaging,we can actively utilize this phenomenon by applying stimuliat a high and constant rate. The response will consequentlychange from an intricate, broadband transient response and intoa steady-state response. The steady-state response is a periodicwaveform comprised of complex exponentials at the stimulusrepetition frequency and its multiples, and it can therefore bedescribed as an amplitude and phase component at the stimulusrepetition frequency and its multiples (i.e., a Fourier series).Since the steady-state response is frequency specific, it is easyto assess the significance of the response, but this comes at thecost of imprecise temporal information because of the inherentphase uncertainty.
For the analysis of the steady-state responses, the EEG signalswere bandpass filtered to the frequency interval 1–100 Hz, anda notch filter at the first, second, and third harmonics of the50 Hz power line frequency was applied. The evoked responsewas estimated by averaging 256 nonoverlapping segments of 1s in duration. Along with the evoked response, the noise signalwas estimated by altering the sign of the data in every othersegment of the averaging, thereby eliminating the deterministic(evoked) part of the signal. For every doubling of the numberof segments in the averaging the signal-to-noise ratio (SNR)increases by 3 dB; thus, the averaging performed here results inan increase in the SNR of 24 dB relative to no averaging. Forthe analysis of the transient responses, the EEG signals werebandpass filtered to the frequency interval 1–20 Hz, and a notchfilter at the first, second, and third harmonics of the 50 Hz powerline frequency was applied. The evoked response was estimatedby splitting up the signal in 256 nonoverlapping segments of 1 sin duration, removing the 26 segments with the highest standarddeviation, and averaging the remaining 230 segments.
A. Auditory Steady-State Response
Auditory steady-state responses (ASSR) were first reportedin [10], and have since been extensively studied, primarily asan objective assessment of the hearing threshold level [11].The ASSRs can be evoked by different types of stimuli, typi-cally amplitude modulated narrow- or broad-band signals [3].The sound stimulus used to induce the ASSR in our study wasamplitude-modulated white Gaussian noise, with both 40 and80 Hz amplitude modulation (SPL 69.4 dB RMS rel. 20 μPa).EEG was recorded simultaneously from eight on-scalp and fourear-EEG electrodes, and for eight different subjects.
B. Steady-State Visual Evoked Potential
The steady-state visual evoked potentials (SSVEP) have beenconsidered in many areas, from the investigation of the humanvisual system in early behavioral studies [12], through objectivethreshold studies based on EEG recordings [13], to pathologi-cal studies in, e.g., Alzheimer and Parkinson patients [14]. The
human visual system can perceive modulation in light intensityat frequencies up to approximately 75 Hz (strongly dependenton light intensity), and it is most sensitive in the region around10 Hz [12]. The SSVEP is typically induced by either am-plitude modulated or flashing light, and the EEG signals aretypically recorded from occipital and parietal region electrodes.The SSVEP in our study was induced by flashing light with fre-quencies of 10, 15, and 20 Hz and at a 50% duty cycle. The EEGwas recorded using the same setup as described in the previoussections and over six subjects.
C. Transient Auditory Evoked Potential
The auditory evoked P1 − N1 − P2 complex is an ERPevoked by a sound stimulus and is attributed to the process-ing within in or near the auditory cortex [3]. The presence ofauditory ERPs indicates that the stimulus has been detected atthe level of the auditory cortex, but does not in general provideinformation regarding cognitive discrimination.
The sound cue (event) used for the P1 − N1 − P2 complexrecordings was a 1 kHz sinusoid of duration 200 ms, with anattack and release time of 10 ms. The interstimulus interval wasrandomly chosen in between 1.7 and 2.3 s. The presentation ofthe sound stimulus and the EEG recording setup was the sameas in the previous sections.
D. Transient Visual Evoked Potential
The visual evoked potential (VEP) from pattern onset is at-tributed to processing in the primary visual cortex, and theseonset responses can be observed from many locations acrossthe scalp [15]. To explore VEP from ear-EEG recordings, weused the same EEG recording setup as in the previous studiesand the same light stimulation source as for the SSVEP study.Each stimulus had duration of 5 ms with a random interstimulusinterval uniformly distributed between 300 and 500 ms; the VEPwaveform was obtained by averaging 500 ms nonoverlappingsegments.
E. Stimuli
The auditory stimuli were presented binaurally using head-phones, the setup was gain calibrated at 1 kHz, and all stimuliwere presented with maximum amplitude corresponding to asound pressure level (SPL) of 80 dB relative to 20 μPa. Theheadphones were Beyerdynamic DT 770 PRO (250 Ω) drivenby a ESI Dua Fire soundcard; the audio setup was calibratedusing a Bruel&Kjær Head and Torso Simulator, Type 4128C,equipped with IEC 711 ear couplers. All sound stimuli weregenerated digitally with 24 bit resolution and at 44.1 kHz sam-pling rate. The visual stimuli were presented by an array of 3 ×3 white 5 mm LEDs at a distance of approximately 25 cm fromthe subject.
IV. RESULTS
In the following, we provide a comprehensive quantitative andqualitative characterization of the ear-EEG and a comparativeanalysis against conventional on-scalp EEG by considering both
KIDMOSE et al.: STUDY OF EVOKED POTENTIALS FROM EAR-EEG 2827
Fig. 4. Grand average power spectrum of the auditory steady-state responseevoked by white Gaussian noise amplitude-modulated with a 40 Hz sinusoid.The thin lines denote the power spectra of the eight subjects. (a) ASSR for theleft temporal lobe, electrode TP9. (b) ASSR for the left ear, electrode ELB.
transient and steady-state characteristics of auditory and visualEPs.
A. Auditory Steady-State Response
For steady-state responses it is natural to consider the powerspectrum, i.e., the squared absolute value of the Fourier trans-form of the time-domain waveform. Fig. 4 shows the powerspectra for the ASSR with 40 Hz modulation (amplitudes rela-tive to 1 μV, frequency resolution 1 Hz); the top panel shows theresults for the scalp electrode (Tp9), and the bottom panel forthe ear electrode (ELB). The bold lines denote the grand aver-age of the ASSR and the noise estimate, while the thin lines arethe ASSRs of the 8 subjects. The first and the second harmoniccomponent (of the modulation frequency) are prominen in bothspectra; for the Tp9 electrode the SNR at the first harmonic com-ponent was approximately 20 dB, whereas for the ELB electrodethe SNR was approximately 35 dB. It is observed that for theear-EEG the overall signal level is 15–20 dB lower comparedto the on-scalp recording. However, as the SNR increased rel-ative to the scalp electrodes we conclude that the lower signalamplitudes of the ear electrodes did not compromised the signalquality. The lower signal amplitudes of ear-EEG are largely dueto significantly shorter electrode distances compared to conven-
Fig. 5. Left panel: Signal to noise ratio of the first harmonic component ofthe ASSR for eight different subjects and for two different stimulus frequencies(40 and 80 Hz). Right panel: Grand average SNR over the eight subjects.
tional on-scalp recordings, which is supported by the simulationin Fig. 1, but may also be affected by a thicker bone structurebetween the brain and the surface of the ear canal compared tothe bone structure between the brain and the surface of the scalpwhere conventional electrodes are placed, as shown in Fig. 2.
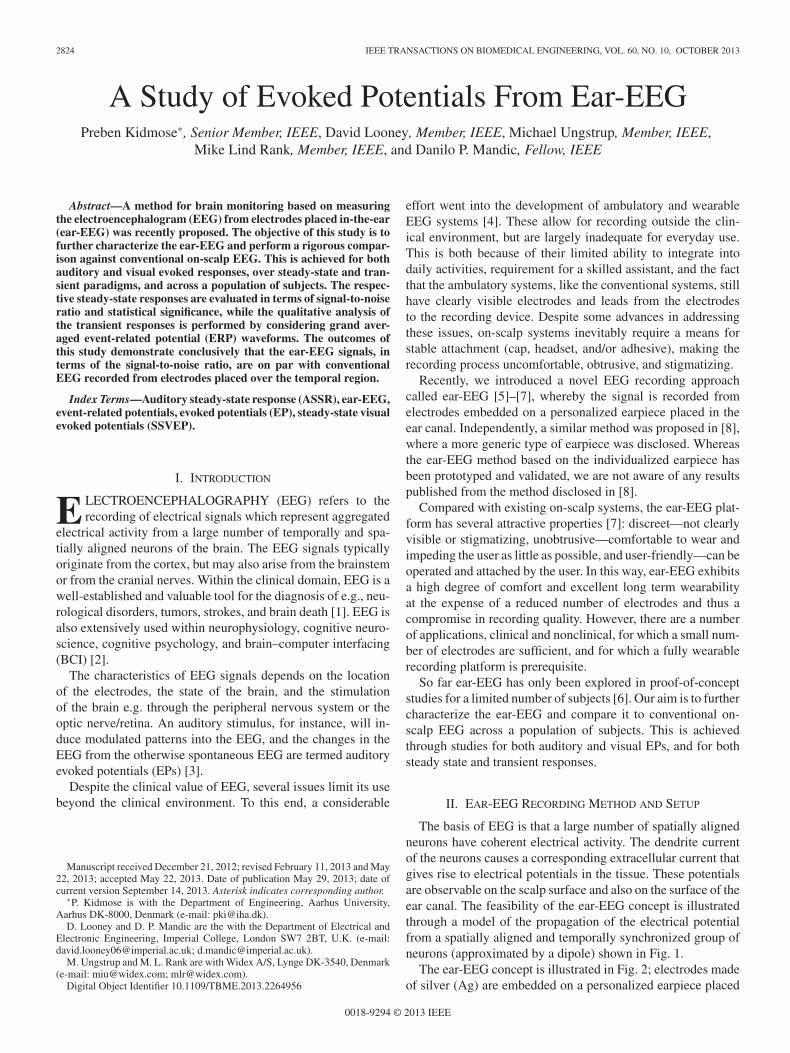
The left panel of Fig. 5 shows the SNR for the first harmoniccomponent obtained for 8 subjects, 12 electrode positions, and 2modulation frequencies (40 and 80 Hz); the right panel shows thegrand average SNR for the first harmonic component (averagingover subjects). It is observed that there are significant variationsin the SNR across subjects, but for a given subject the on-scalpand ear electrodes have similar performances; i.e., high SNRs inthe on-scalp electrodes are typically matched by high SNRs inthe in-the-ear electrodes, and vice versa. Table I shows the meanvalues of the SNR for the on-scalp EEG and the ear-EEG andalso the grand average SNR over both subjects and electrodes.It is observed that the mean SNRs were largest for the earrecordings in 9 out of 16 subjects, and the grand average SNRswere also largest for the ear electrodes for both modulationfrequencies.
For rigour, we also calculated the statistical significance ofthe first-order component as a one-tailed t-test, where the nullhypothesis was that the mean of the noise is equal to the meanvalue of the signal. The mean values were obtained by sub-dividing the 256 segments considered into 16 × 16 segments,averaging over 16 segments, and calculating the mean and thestandard deviation for both the signal and the noise from 16 ofthese averages. The (p-1)-values of this statistical significanceanalysis are shown in Fig. 6. For three out of the eight subjects(LJ, HT, and MJ) the statistical significance was lower for theear electrodes, while for the remaining five subjects the signifi-cance for the ear electrodes was comparable to that of the scalpelectrodes.
B. Steady-State Visual Evoked Potential
The SSVEP can be observed from many locations along thescalp and, as shown next, this also includes the temporal re-gion electrode (Tp9) and the in-the-ear electrodes (ELB). Fig. 7shows the power spectra for the 10 Hz SSVEP experimentfor three different electrode positions: parietal lobe (Pz) [seeFig. 7(a)], temporal lobe (Tp9) [see Fig. 7(b)], and in-the-ear
2828 IEEE TRANSACTIONS ON BIOMEDICAL ENGINEERING, VOL. 60, NO. 10, OCTOBER 2013
TABLE IAVERAGE SNR ([dB]) FOR THE SCALP- AND EAR-ELECTRODES OF THE FIRST HARMONIC COMPONENT OF THE ASSR STUDY
Fig. 6. Statistical significance of the first harmonic component of the ASSRstudy over eight different subjects and two different stimuli (95% significancelevel).
(ELB) [see Fig. 7(c)]. The bold lines show the grand averageof the SSVEP and the noise estimates, while the thin lines arethe SSVEPs for the six subjects. In the grand average SSVEPpower spectra the harmonics of the modulation frequency areclearly visible in all electrode positions. The Pz recordings hada grand average SNR at the first harmonic component of ap-proximately 30 dB, and for the Tp9 and ELB recordings thisdecreased to approximately 17 and 10 dB respectively. Thus,for the SSVEP experiments the signal quality was lower for theear electrodes compared to the scalp electrodes. As was the casefor the ASSR study, the ELB recording had a noise floor that wasapproximately 20 dB lower than that of the scalp recordings.
Similarly to the ASSR study, the estimated SNR of the firstharmonic component of the SSVEP for all electrodes and allsubjects, together with grand averages, are summarized in Fig. 8.Consistent with the previous analysis, the ear-EEG recordingsin general had a lower SNR compared to the scalp electrodes,however a statistical significance analysis, similar to that for theASSR study in Fig. 6, showed that the SSVEP were significantfor all the subjects.
C. Transient Auditory Evoked Potential
Examples of AEP waveforms recorded from a Tp9 and anELB are shown in Fig. 9. The bold lines show the grand aver-aged waveform, and the gray lines the EPs for subjects: PK, LJand MJ. Consistent with the findings for the ASSR and SSVEPstudies, the amplitudes of the ear-recording were approximately10 times lower (corresponding to − 20 dB) compared to theon-scalp recording. It is observed that the ear-EEG waveform isvery similar to the on-scalp EEG waveform, thus demonstratingthe feasibility of obtaining transient responses from ear-EEG
Fig. 7. Grand average power spectra for the 10 Hz SSVEP experiment.(a) SSVEP for the parietal lobe, electrode Pz. (b) SSVEP for the left temporallobe, electrode Tp9. (c) SSVEP for the left ear, electrode ELB.
recordings. We have also found that the SNR (i.e. the ratio be-tween the amplitude of the waveform and the standard deviation)was smaller for the ear-EEG recording compared to the on-scalp
KIDMOSE et al.: STUDY OF EVOKED POTENTIALS FROM EAR-EEG 2829
Fig. 8. Left panel: SNR [dB] of the first harmonic component of the SSVEPstudy over six different subjects and three different stimulus frequencies. Rightpanel: Grand average SNR over the six subjects for the three different stimulusfrequencies.
Fig. 9. Auditory evoked potential induced by a 1 kHz tone cue of duration200 ms with an attack and release time of 10 ms. Stimuli were presented at thesame time in the left and right ear, and the inter-stimulus-interval was randomlyselected within the range 1.7 to 2.3 s. The figure shows the EPs for electrodepositions Tp9 and ELB; bold lines show the grand average, and gray lines theEPs for subject PK, LJ, and MJ.
EEG recording; this is primarily due to amplifier noise, ratherthan an inherent characteristic of the ear-EEG (amplifier noisewas measured using a balanced resistor triangle with 4320 Ωresistors, showing 0.47 μV/
√Hz).
D. Transient Visual Evoked Potential
Fig. 10 shows examples of VEP waveforms recorded fromthe occipital region (Oz), Tp9, and ELB. The bold lines showthe grand averaged waveforms, and the gray lines the EPs forsubjects: PK, LJ and MJ. Consistent with the above findings, theamplitude of the ear-EEG recording was approximately 20 dBlower compared to on-scalp recordings. However, it is importantto notice that a waveform similar to the on-scalp EEG can beobserved from the ear-EEG, thus demonstrating the feasibilityear-EEG based VEP. As for the transient AEP, the SNR waslower for ear-EEG recordings compared to on-scalp EEG.
V. CONCLUSION
This study has addressed the feasibility of the novel ear-EEGrecording method through a comprehensive validation against
Fig. 10. Visual evoked potentials induced by a high intensity white LED array,with stimulus duration of 5 ms and an interstimulus interval randomly selectedbetween 300 and 500 ms. The figure shows the EP for electrode positions Oz,Tp9 and ELB. The bold lines show the grand average, while the gray lines arethe EPs for subjects: PK, LJ and MJ.
conventional on-scalp EEG. This has been achieved over fourdifferent event-related potentials (ERP) and across a group of6–8 subjects. The ERPs considered were: ASSR, SSVEP, anauditory evoked P1 − N1 − P2 complex, and a visual evokedonset response. It has been observed that the signal level in theear-EEG in general is approximately 20 dB lower in amplitudecompared to the conventional EEG. However, for steady-stateresponses, despite the lower signal levels, the signal to noise ra-tio, and thus the signal quality, is in general maintained. For tran-sient responses, the ear-EEG waveforms resembled the wave-forms observed from the temporal lobe electrodes; the transientresponses obtained from ear-EEG had lower SNR comparedto conventional on-scalp EEG which is attributed to amplifiernoise rather than an inherent characteristic of ear-EEG. A com-prehensive statistical significance validation of ear-EEG, com-bined with its unique advantages (noninvasive, unobtrusive, userfriendly, and discreet), has established the basis for the use ofear-EEG in applications in which limited spatial resolution issufficient and continuous monitoring is a prerequisite.
APPENDIX A
LABELLING SCHEME FOR NAMING EAR-EEG ELECTRODES
The in-the-ear electrodes are denoted by Exy where x ∈{L, R} denotes electrodes in the left and right ear, respectively,and y denotes the electrode position in the ear. In each ear, wedefine 12 electrode positions, denoted by letters from A to L, thatis y ∈ {A, B, . . . , L}. The letters A, B, and C denote electrode
2830 IEEE TRANSACTIONS ON BIOMEDICAL ENGINEERING, VOL. 60, NO. 10, OCTOBER 2013
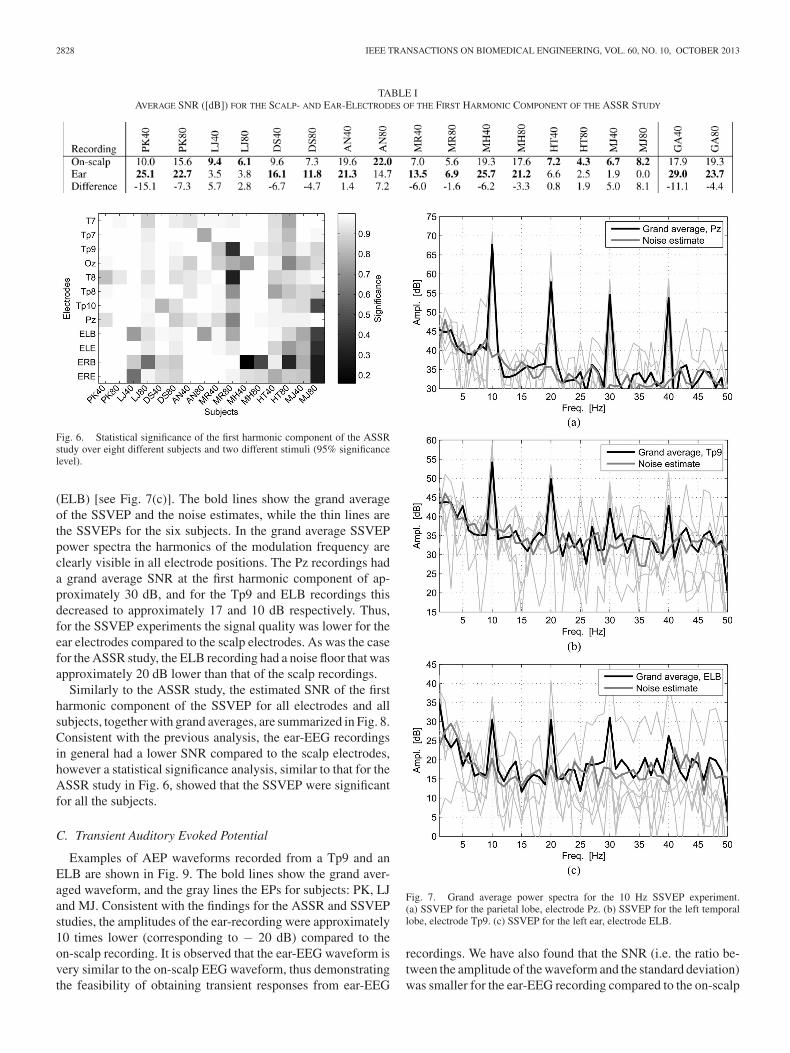
Fig. 11. Ear electrode labelling scheme for the left ear. (Left) Sketch of the exterior part of the ear, showing the four regions corresponding to the electrode labelsA through D. (Center) Cross-sectional sketch of the outer ear in the axial plane, the drawing cut is indicated by a dashed line in the left figure, electrode positionsB, G, and K are indicated. (Right) Cross-sectional view of the ear canal (sagital plane) showing the electrode labels in the ear canal. The electrodes are labelledbased on the direction relative to the vertical axis, and not based on the depth in the ear canal.
positions in the concha part of the ear; the letter D denotes theear lobe electrode, and the letters E through L denote electrodepositions in the ear canal. The labelling scheme is illustrated inFig. 11 for the left ear, the same labelling scheme applies to theright ear. For instance, electrode ERB is an electrode placed inthe concha region of the right ear. Fig. 3(a) shows a photo of ablank earpiece with the electrode positions indicated. The elec-trodes in the ear canal are located before the bony part of the earcanal (see also Fig. 2), and the electrode position is defined bythe direction (angle) of the electrode relative to the vertical axis.The vertical axis is defined as perpendicular to the plane definedby the Oz, FPz, and T7/T8 electrode positions (as defined bythe 10–20 electrode position system).
REFERENCES
[1] M. J. Aminoff, Electrodiagnosis in Clinical Neurology, 5th ed. U.K.:Elsevier, 2005.
[2] J. Wolpaw, N. Birbaumer, W. Heetderks, D. McFarland, P. Peckham,G. Schalk, E. Donchin, L. Quatrano, C. Robinson, and T. Vaughan, “Brain-computer interface technology: A review of the first international meet-ing,” IEEE Trans. Rehabil. Eng., vol. 8, no. 2, pp. 164–173, Jun. 2000.
[3] R. F. Burkard, M. Don, and J. J. Eggermont, Auditory Evoked Poten-tial: Basic Principles and Clinical Application. Baltimore, MD, USA:Williams & Wilkins, 2007.
[4] A. Casson, D. Yates, S. Smith, J. Duncan, and E. Rodriguez-Villegas,“Wearable electroencephalography,” IEEE Eng. Med. Biol. Mag., vol. 29,no. 3, pp. 44–56, May/Jun. 2010.
[5] D. Looney, C. Park, P. Kidmose, M. L. Rank, M. Ungstrup, K. Rosenkranz,and D. P. Mandic, “An in-the-ear platform for recording electroencephalo-gram,” in Proc. Int. Conf. IEEE Eng. Med. Biol. Soc., 2011, pp. 6682–6885.
[6] P. Kidmose, D. Looney, and D. P. Mandic, “Auditory evoked responsesfrom Ear-EEG recordings,” in Proc. Int. Conf. IEEE Eng. Med. Biol. Soc.,2012, pp. 586–589.
[7] D. Looney, P. Kidmose, C. Park, M. Ungstrup, M. Rank, K. Rosenkranz,and D. Mandic, “The in-the-ear recording concept,” IEEE Pulse, vol. 3,no. 6, pp. 32–42, Nov./Dec. 2012.
[8] R. J. Fischer, J. Ferraro, P. Lal, and H. Lusted, “Apparatus and methodfor the measurement and monitoring of bioelectric signal patterns,” PatentApplication. Pub. No.: US 2007/0112277, Filed Oct. 16, 2006.
[9] M. G. Woldorff, “Distortion of ERP averages due to overlap from tempo-rally adjacent ERPs: Analysis and correction,” Psychophysiology, vol. 30,pp. 98–119, 1993.
[10] R. Galambos, S. Makeig, and P. J. Talmachoff, “A 40-Hz auditory potentialrecorded from the human scalp,” Proc. Natl. Acad. Sci. USA, vol. 78, no. 4,pp. 2643–2647, 1981.
[11] B. Cone-Wesson, R. C. Dowell, D. Tomlin, G. Rance, and W. J. Ming,“The auditory steady-state response: Comparisons with the auditory brain-stem response,” J. Amer. Acad. Audiol., vol. 13, no. 4, pp. 173–187, 2002.
[12] H. D. L. Dzn, “Research into the dynamic nature of the human fovea-cortex systems with intermittent and modulated light. I. Attenuation char-
acteristics with white and colored light,” J. Opt. Soc. Amer., vol. 48, no. 11,pp. 777–784, 1958.
[13] L. H. Van der Tweel and H. F. E. Verduyn Lunel, “Human visual responsesto sinusoidally modulated light,” Electroencephalogr. Clin. Neurophysiol.,vol. 18, pp. 587–598, 1965.
[14] F. Vialatte, M. Maurice, J. Dauwels, and A. Cichocki, “Steady-state visu-ally evoked potentials: Focus on essential paradigms and future perspec-tives,” Progr. Neurobiol., vol. 90, no. 4, pp. 418–438, 2010.
[15] F. D. Russo, A. Martinez, M. I. Sereno, S. Pitzalis, and S. A. Hillyard,“Cortical sources of the early components of the visual evoked potential,”Human Brain Mapp., vol. 15, pp. 95–111, 2001.
Preben Kidmose (SM’12) received the M.Sc. degree in engineering in 1998,and the Ph.D. degree in signal processing in 2001 from the Technical Universityof Denmark, Lyngby, Denmark.
He is currently a Professor (Ingeniørdocent) in biomedical engineering withthe Department of Engineering, Aarhus University, Aarhus, Denmark. His re-search interest include signal processing in medical devices, audio signal pro-cessing, machine learning, medical instrumentation, and biomedical systemengineering/design.
David Looney (M’08) received the B.Eng. degree in electronic engineeringfrom University College Dublin, Dublin, Ireland, and the Ph.D. degree in signalprocessing from Imperial College, London, U.K., in 2011.
He is currently a Research Associate in the Communications and Sig-nal Processing Group, Department of Electrical and Electronic Engineering,Imperial College, London. His research interests are in the areas of data fu-sion, time-frequency analysis, matrix factorization, and wearable solutions forhealth-monitoring.
Michael Ungstrup (M’09) received the M.Sc. degree in electrical engineeringfrom the Technical University of Denmark in 1998.
He is currently with Widex A/S, Denmark. His research interest include signalprocessing and machine learning for audio applications and communication.
Mike Lind Rank (M’95) received the M.Sc. degree in electrical engineering in1994, and the Ph.D. in control theory in 1998 from the Technical University ofDenmark, Lyngby, Denmark.
He is currently with Widex A/S, Lynge, Denmark. His research interestsinclude signal processing and machine learning for audio applications andcommunication.
Danilo P. Mandic (F’13) received the M.Eng degree in electronic engineeringand the M.Sc degree in signal processing from the University of Banjaluka,Yugoslavia, in 1987 and 1992, respectively, and the Ph.D degree in signalprocessing from Imperial College London, U.K., in 1999.
He is a Professor in signal processing at Imperial College, London, U.K. Hisresearch areas include nonlinear multidimensional adaptive modeling, systemidentification and prediction, one- and multi-dimensional adaptive denoising,blind source separation and extraction, brain signal processing, sensor fusion,and signal modality characterization. His publication includes two researchmonographs, two edited books, and more than 200 publications on signal andimage processing.


![Habituation of laser-evoked potentials by migraine phase ... · PDF fileHabituation of laser-evoked potentials by ... fibromyalgia [26] and cardiac syndrome X ... evoked magnetic fields,](https://static.documents.pub/doc/80x56/5a89cc0c7f8b9a7f398b6264/habituation-of-laser-evoked-potentials-by-migraine-phase-of-laser-evoked-potentials.jpg)


