and FC is saturated soil density and fines content , respectively pref is effective confinement pressure reference
c and are soil cohesion and internal friction angle, respectively max is peak shear strain
k is permeability coefficient Liq is liquefaction parameter
Vs(ave) is the average shear wave velocity of soil layer c1 and c2 are contractive parameter
Ko is lateral earth pressure at rest d1 and d2 dilative parameter
www.eng.chula.ac.th
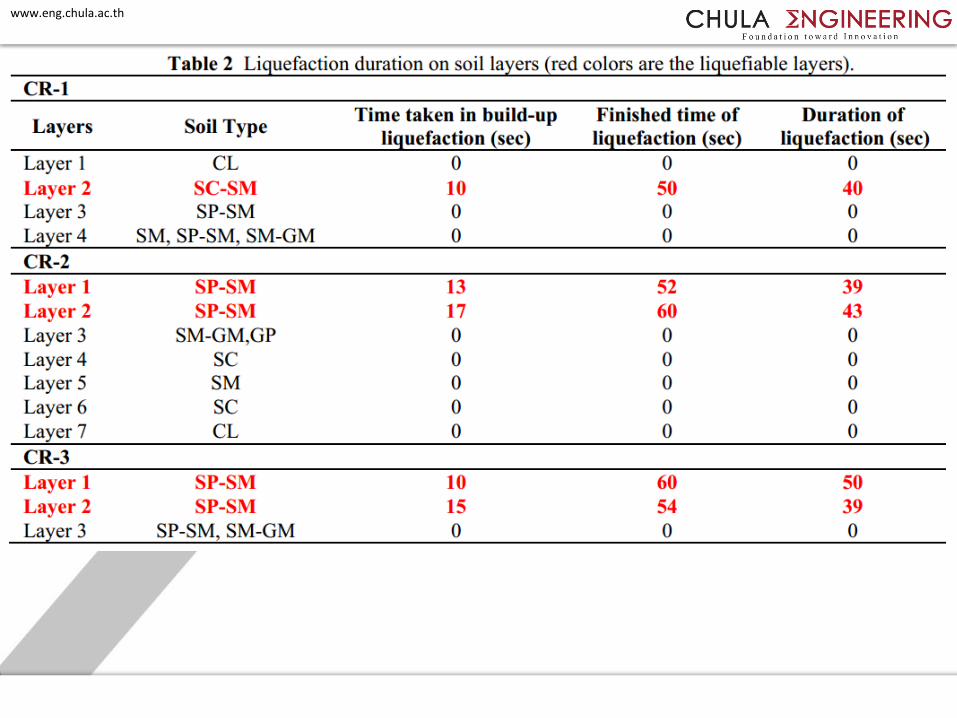
“First and second layers vulnerable to undergo liquefaction”
Liqufaction Resistance for SP-SM and SC-SM Layers in Chiang Rai
0.0
0.1
0.2
0.3
0.4
0.5
1 10 100
Cy
cli
c S
tress
Rati
o
N (cycles)
Liquefaction resistance curve (Laboratory Test)
CR-1 (SC-SM Sand Layer 1) (Calculated)
CR-1 (SP-SM Sand Layer 2) (Calculated)
CR-2 (SP-SM Sand Layer 1) (Calculated)
CR-2 (SP-SM Sand Layer 2) (Calculated)
CR-3 (SP-SM Sand Layer 1) (Calculated)
CR-3(SP-SM Sand Layer 2) (Calculated)
www.eng.chula.ac.th
-30
-20
-10
0
0 100 200 300 400
Dep
th (
m)
Pressure (kPa)
Maximum excess pore water
pressure during the excitation
Initial vertical effective stress
of soil
Pore water pressure 10s after
the completion of excitation
-30
-20
-10
0
0 1 2 3 4 5
Dep
th (
m)
Settlement due to liquefaction (cm)
CR-1
Result and Discussion
www.eng.chula.ac.th
-2
-1
0
1
2
-1.0 -0.5 0.0 0.5 1.0
Sh
ear
Str
ess
(kP
a)
Shear Strain (%)
0
2
4
6
8
10
0 10 20 30 40 50 60
Pre
ssu
re (
kP
a)
Time (s)
Excess Pore Water Pressure
Initial Effective Stress
-6
-4
-2
0
2
4
6
0 2 4 6 8
Sh
ear
Str
ess
(kP
a)
Effective Confinement Pressure (kPa)
Soil behaviour at CR-1 (SC-SM Layer) (3.5 m)
'
1
uu
v
u
r
r
u
'
v
G
www.eng.chula.ac.th
-30
-20
-10
0
0 100 200 300 400
Dep
th (
m)
Pressure (kPa)
Maximum excess pore water
pressure during excitation
Initial vertical effective stress of
soil
Pore water pressure 10s after the
completion of excitation
-30
-20
-10
0
0 1 2 3 4 5
Dep
th (
m)
Settlement due to liquefaction (cm)
CR-2
www.eng.chula.ac.th
0
10
20
30
40
0 10 20 30 40 50 60
Pre
ssu
re (
kP
a)
Time (s)
Excess Pore Water Pressure
Initial Effective Stress
-6
-4
-2
0
2
4
6
-0.8 -0.4 0.0 0.4 0.8
Sh
ear
Str
ess
(kP
a)
Shear Strain (%)
-10
-6
-2
2
6
10
0 5 10 15 20 25 30
Sh
ear
Str
ess
(kP
a)
Effective Confinement Pressure (kPa)
Soil behaviour at CR-2 (SP-SM Layer) (4.5 m)
www.eng.chula.ac.th
0
20
40
60
80
100
0 10 20 30 40 50 60
Pre
ssu
re (
kP
a)
Time (s)
Excess Pore Water Pressure
Initial Effective Stress-15
-10
-5
0
5
10
15
-0.6 -0.4 -0.2 0.0 0.2 0.4 0.6
Sh
ear
Str
ess
(kP
a)
Shear Strain (%)
-20
-10
0
10
20
0 15 30 45 60 75 90
Sh
ear
Str
ess
(kP
a)
Effective Confinement Pressure (kPa)
Soil behaviour at CR-2 (SP-SM Layer) (12.75 m)
www.eng.chula.ac.th
-30
-20
-10
0
0 100 200 300 400
Dep
th (
m)
Pressure (kPa)
Maximum excess pore water
pressure during the excitation
Initial vertical effective stress of
soil
Pore water pressure 10s after the
completion of excitation
-30
-20
-10
0
0 1 2 3 4 5
Dep
th (
m)
Settlement due to liquefaction (cm)
CR-3
www.eng.chula.ac.th
0
2
4
6
8
10
12
0 10 20 30 40 50 60
Pre
ssu
re (
kP
a)
Time (s)
Excess Pore Water Pressure
Initial Effective Stress
-2
-1
0
1
2
-0.8 -0.4 0.0 0.4 0.8
Sh
ear
Str
ess
(kP
a)
Shear Strain (%)
-6
-4
-2
0
2
4
6
0 2 4 6 8 10
Sh
ear
Str
ess
(kP
a)
Effective Confinement Pressure (kPa)
Soil behaviour at CR-3 (SP-SM Layer) (1.5 m)
www.eng.chula.ac.th
0
20
40
60
80
0 10 20 30 40 50 60
Pre
ssu
re (
kP
a)
Time (s)
Excess Pore Water Pressure
Initial Effective Stress
-20
-10
0
10
20
-1.0 -0.5 0.0 0.5 1.0
Sh
ear
Str
ess
(kP
a)
Shear Strain (%)
-40
-20
0
20
40
0 15 30 45 60
Sh
ear
Str
ess
(kP
a)
Effective Confinement Pressure (kPa)
Soil behaviour at CR-3 (SP-SM Layer) (12 m)
www.eng.chula.ac.th
0.0
0.2
0.4
0.6
0.8
1.0
1.2
CR-1 CR-2 CR-3
Ex
cess
Po
re W
ate
r P
ress
ure
Ra
tio
(r u
ma
x)
Sites
0.0
0.2
0.4
0.6
0.8
1.0
1.2
CR-1 CR-2 CR-3
Ex
cess
Po
re W
ate
r P
ress
ure
Ra
tio
(r u
min
)
Sites
During the excitation
10 s after the completion of the excitation
www.eng.chula.ac.th
www.eng.chula.ac.th
%100mesh totalof
for mesh of Percentage
N
rNr u
u
layers sand ofPercentageHtotalimpact
Hru
www.eng.chula.ac.th
Concluding remarks• Loose sandy soils with low soil resistance and shallow ground water
level were found
• Settlement due to liquefaction is about 1.8 to 4 cm at ground surface
• The first and second sand layers was possibly impacted significant
effect of liquefaction
• The pore pressure after exitation was not easily drained (almost no
significant different ru before and after excitation)
• The attention to the possibility of stronger earthquake in the future
(the impacted depth might be possibly deeper)
• The countermeasure effort to shallow foundation should be
performed to minimise the impact of liquefaction
www.eng.chula.ac.th
Acknowlegement• Assoc. Prof. Dr. Suttisak Soralump from Dept of Civil Engineering,
Kasertsart University for the relevant data and valuable suggestion
• AUN/SEED-net (JICA) for the financial support
• This work was performed under JASTIP (Japan ASEAN Science TechnologyInnovation Platform)
Published Papers
• Mase L.Z., Likitlersuang, S., Tobita, T., 2016, Liqufaction Potential in ChiangRai Province Northern Thailand due to the Tarlay Earthquake 2011.Proceeding of the 30th JSCE symp on Earthquake Engineering, 17-19October 2016, Kanazawa, Japan
• Mase L.Z., Likitlersuang S., Tobita T., 2017, One-dimensional Analysis ofLiquefaction Potential: A case study in Chiang Rai Province, NorthernThailand, Journal of JSCE. Ser A1 (Structural Engineering/EarthquakeEngineering) Vol. 73. No 4. pp. I_135-I_147.
www.eng.chula.ac.th
References on this presentation
• Elgamal A, Yang Z, Lu J. : Cyclic 1D : A computer program of seismic ground response, Department
of Structural Engineering, University of California, San Diego, La Jolla. California, USA Report No.
SSRP-06/05, 2006.
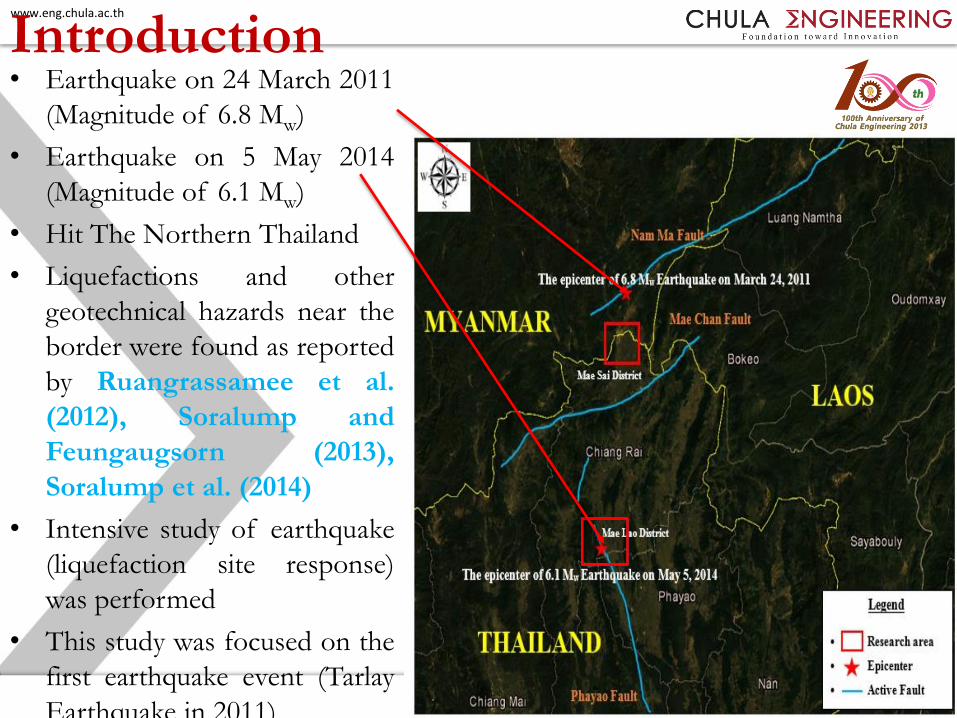
• Ruangrassamee A, Ornthammarat T, and Lukkunaprasit P. : Damage due to 24 March 2011 M6.8
Tarlay Earthquake in Northern Thailand, Proceeding of 15th World Conference of Earthquake Engineering
(WCEE), Lisboa, Portugal, 2012.
• Soralump S, Feungaugsorn J. : Probabilistic analysis of liquefaction potential “the first eyewitness case
in Thailand, Proceeding of 18th National Convention of Civil Engineering (NCCE), Chiang Mai, Thailand,
2013.
• Soralump, S., Feungausorn, J., Yangsanphu S., Jinagooliwat, M., Thongthamchart, C., Isaronarit R.,
2014, Impact of Chiang Rai Earthquake from Geotechnical Perspectives, EIT-JSCE Joint Symp on
Human Resource Development for Disaster-Resilient Countries, 25-26 August, Bangkok, Thailand
• Tanapalungkorn W, Teachavorasinskun S. : Liquefaction susceptibility due to earthquake in Northern
Parts of Thailand, Proceeding of the 20th National Convention of Civil Engineering (NCCE), Chonburi,
Thailand, 2015.
• Thai Meteorological Department, 2015, Earthquake Event Data on 24 March 2011, Thai
Meteorological Department, Bangkok, Thailand
• Parra E. : Numerical modeling of liquefaction and lateral ground deformation including cyclic mobility
and dilation response in soil system, PhD Thesis, Department of Civil Engineering, Rensselaer