TRANSMITTANCE (X) lO0 90 70 6O 50 4O 30 20 10 0 550 400 450 SO0 550 600 650 ?00 WAVELENGTH (nm) FIG. 13. Output of the spectrum by the plotter module. The spectral data drawn is the same as that given by the display module shown in Fig. 11. constructed, and the performance of the system was examined through the measurement of the typical stand- ard sample for absorption spectroscopy. ACKNOWLEDGMENT This research was supported by the Grant-in-Aid {br Scientific Research from the Ministry of Education, Science and Culture. The authors are grateful to Dr. S. Kawata in our laboratory for his valuable discussion and assistance in completion of this work. 1. T. Anf~ilt and D. Jagner, Anal. Chem. 47, 759 (1975). 2. J. D. Defreese, K. M. Walczak, and H. V. Malmstadt, Anal. Chem. 50, 2042 (1978). 3. S. Minami, Optica Acta 26, 1035 (1979). 4. R. E. Dessy, Anal. Chem. 49, ll00A {1977). 5. Special Issue, Proc. IEEE 64, No. 6 (1976). 6. "IEEE Standard Digital Interface for Programmable Instrumentation", (The IEEE Inc., New York, 1978). 7. A. Savitzky and M. J. E. Golay, Anal. Chem. 36, 1627 (1964). A Study of Measurement Interference in the Optoacoustic Detection of by Argon-Ion Laser Excitation ALAN FRIED Center for Analytical Chemistry, National Bureau of Standards, Washington, DC 20234 Optoacoustic measurements of NO2 excited by an Ar + laser were performed in the presence of NO, N2, H20, and 02 matrix gases. Identical sensitivities were measured in all matrix gases except 02 where energy transfer from NO2 to the metastable O2(1~g) state resulted in a dramatic decrease in sensitivity. Index Headings: Optoacoustic detection of NO2; NO2 measure- ment interference; Energy transfer. INTRODUCTION Nitrogen dioxide (NO2) is a molecule of major impor- tance in the chemistry of the atmosphere. As with all molecules of atmospheric interest, there has been an ongoing quest for development of ever more sensitive and selective detection methods for studies in both the ambient environment and the laboratory. Over the past 10 years a number of laboratory studies of NO2 have been reported utilizing sensitive optoacoustic detection techniques. Such studies include the work of Kreuzer et al.1 using an IR laser; Harshbarger and Robin, 2 using an incoherent excitation source; and the studies using visible laser sources reported by Angus et al., 3 Claspy et al., 4 Terhune and Anderson, 5 and Fried and Stedman. 6 Very recently, Fried and Hodgeson7 used optoacoustic detection for measuring NO2 concentrations produced in the gas-phase titration of nitric oxide (NO) with ozone (03) in accordance with the bimolecular reaction NO (excess) + 03 ~ NO2 + 02. (1) The 488.0-nm line from an argon-ion laser, one of many Received 1March 1982. 562 Volume 36, Number 5, 1982 argon-ion lines in fortuitous coincidence with pressure- broadened lines of NO2, was used as the excitation source. Since NO is transparent at this wavelength, NO2 can be measured directly without an interfering response from NO, in contrast to traditional chemiluminescent mea- surements. Despite this discrimination toward NO, op- toacoustic detection of NO2 at 488.0 nm, and for that matter throughout the entire visible, suffers from a lack of information regarding potential interferences. The present investigation, which was carried out over the course of the gas-phase titration experiments, presents the results of a preliminary study to assess measurement interference in optoacoustic detection of NO2 at 488.0 nm. The focal point, at least in this initial study, was directed toward NO2 measurement interference by the major species present in the gas-phase titration experi- ments; NO, 03, 02, N~, and H20 vapor, a common air cylinder contaminant typically measured between 10 ppm (by volume} and 40 ppm. In this study, two types of interferences were considered: (1) interference by direct absorption of the 488.0-nm laser line, and (2) interference by energy transfer to metastable states of the matrix gas with a concomitant loss in optoacoustic response. In the case of O~, only interference by direct laser absorption was studied, because of complications that would arise from reaction of NO2 with O3 forming NO3. I. EXPERIMENTAL The NO2 optoacoustic cell and calibration system is shown in Fig. 1. A stainless steel cell, 15 cm long, 0.8 cm id, with 0.1 cm inlet and outlet tubes, continuously sam- pled gas at flow rates around 50 cm 3 min-' and at pres- sures slightly below 1 atm, typically around 80 kPa (600 APPLIED SPECTROSCOPY
Transcript
TRANSMITTANCE (X) lO0
90
70 6O 50 4O 30 20 10 0
550 400 450 SO0 550 600 650 ?00
WAVELENGTH (nm)
FIG. 13. Output of the spectrum by the plotter module. The spectral data drawn is the same as that given by the display module shown in Fig. 11.
constructed, and the performance of the system was examined through the measurement of the typical stand- ard sample for absorption spectroscopy.
ACKNOWLEDGMENT
This research was supported by the Grant-in-Aid {br Scientific Research from the Ministry of Education, Science and Culture.
The authors are grateful to Dr. S. Kawata in our laboratory for his valuable discussion and assistance in completion of this work.
1. T. Anf~ilt and D. Jagner, Anal. Chem. 47, 759 (1975). 2. J. D. Defreese, K. M. Walczak, and H. V. Malmstadt, Anal. Chem. 50, 2042
(1978). 3. S. Minami, Optica Acta 26, 1035 (1979). 4. R. E. Dessy, Anal. Chem. 49, ll00A {1977). 5. Special Issue, Proc. IEEE 64, No. 6 (1976). 6. "IEEE Standard Digital Interface for Programmable Instrumentation", (The
IEEE Inc., New York, 1978). 7. A. Savitzky and M. J. E. Golay, Anal. Chem. 36, 1627 (1964).
A Study of Measurement Interference in the Optoacoustic Detection of by Argon-Ion Laser Excitation
ALAN FRIED Center for Analytical Chemistry, National Bureau of Standards, Washington, DC 20234
Optoacoust i c m e a s u r e m e n t s o f NO2 exc i ted b y an A r + l a s e r w e r e performed in the presence of NO, N2, H20, a n d 02 m a t r i x gases . Ident ical sens i t iv i t i e s were m e a s u r e d in all matr ix g a s e s e xc ep t 02 w h e r e e n e r g y t r a n s f e r f r o m NO2 to the m e t a s t a b l e O2(1~g) state resu l ted in a dramat ic decrease in sens i t iv i ty .
Index Headings: Optoacoust i c de tec t ion of NO2; NO2 m e a s u r e - m e n t interference; E n e r g y t r a n s f e r .
INTRODUCTION
Nitrogen dioxide (NO2) is a molecule of major impor- tance in the chemistry of the atmosphere. As with all molecules of atmospheric interest, there has been an ongoing quest for development of ever more sensitive and selective detection methods for studies in both the ambient environment and the laboratory. Over the past 10 years a number of laboratory studies of NO2 have been reported utilizing sensitive optoacoustic detection techniques. Such studies include the work of Kreuzer et al.1 using an IR laser; Harshbarger and Robin, 2 using an incoherent excitation source; and the studies using visible laser sources reported by Angus et al. , 3 Claspy et al. , 4 Terhune and Anderson, 5 and Fried and Stedman. 6
Very recently, Fried and Hodgeson 7 used optoacoustic detection for measuring NO2 concentrations produced in the gas-phase titration of nitric oxide (NO) with ozone (03) in accordance with the bimolecular reaction
NO (excess) + 03 ~ NO2 + 02. (1)
The 488.0-nm line from an argon-ion laser, one of many
Received 1March 1982.
562 Volume 36, Number 5, 1982
argon-ion lines in fortuitous coincidence with pressure- broadened lines of NO2, was used as the excitation source. Since NO is transparent at this wavelength, NO2 can be measured directly without an interfering response from NO, in contrast to traditional chemiluminescent mea- surements. Despite this discrimination toward NO, op- toacoustic detection of NO2 at 488.0 nm, and for that matter throughout the entire visible, suffers from a lack of information regarding potential interferences. The present investigation, which was carried out over the course of the gas-phase titration experiments, presents the results of a preliminary study to assess measurement interference in optoacoustic detection of NO2 at 488.0 nm. The focal point, at least in this initial study, was directed toward NO2 measurement interference by the major species present in the gas-phase titration experi- ments; NO, 03, 02, N~, and H20 vapor, a common air cylinder contaminant typically measured between 10 ppm (by volume} and 40 ppm. In this study, two types of interferences were considered: (1) interference by direct absorption of the 488.0-nm laser line, and (2) interference by energy transfer to metastable states of the matrix gas with a concomitant loss in optoacoustic response. In the case of O~, only interference by direct laser absorption was studied, because of complications that would arise from reaction of NO2 with O3 forming NO3.
I. E X P E R I M E N T A L
The NO2 optoacoustic cell and calibration system is shown in Fig. 1. A stainless steel cell, 15 cm long, 0.8 cm id, with 0.1 cm inlet and outlet tubes, continuously sam- pled gas at flow rates around 50 cm 3 min-' and at pres- sures slightly below 1 atm, typically around 80 kPa (600
APPLIED SPECTROSCOPY
PRESSURE GUAGE
__~>~? MICROPHONE
PUMP ~-- 9
ND ~ ~ oPTOACOUSTIC CELL
FILTERS I I LASER POWER
~MONITORING PHOTODIODE
NO2 PERMEATION ,.L SHUT OFF
PERMEATION ~ VALVE DILUENT ~ CAL.SYSTEM GAS
FOCUSING
C H O P P E R ~
• ~ VENT
FLOW CALIBRATION GLASS MIXING
CHAMBER
/ MASS FLOW I - CONTROLLER
FLOW CALIBRATION Fro. 1. Optoacoustic detection and cal ibrat ion system.
Ar + LASER
DILUENT GAS
TO~T). Known NO2 concentrations were generated in this study by passing permeation diluent gas at a flow rate, fp, over a calibrated NO2 permeation tube held at con- stant temperature by a permeation calibration system as shown in Fig. 1. The mixture of N02 permeant and diluent gas was passed into a glass mixing chamber where it was subsequently diluted with a second diluent gas flow, fD. This two-stage dilution made it possible to change independently the composition of the inert matrix gas and the NO~ concentration, the value of which could be varied by changing the total flow fr, + fD. Calibrated mixtures of NO2 flowing through the optoacoustic cell were irradiated by the 488.0-nm line from an argon-ion laser, directed along the cell axis and chopped at 250 Hz. Optoacoustic signals were detected by an electret micro- phone, amplified, processed by an electronic filter used in the bandpass mode, and demodulated by a lock-in amplifier referenced to the chopping frequency.
II. RESULTS AND DISCUSSION
Interference by direct absorption of the laser was stud- ied by flowing each of the gases of interest directly into the optoacoustic cell bypassing the permeation calibra- tion system. Base line signals measured in this manner for pure N2, pure 02, a 50-ppm NO/N2 mixture, and for H20 vapor concentrations ranging from 20 ppm up to an estimated concentration of 0.3% were all found to be identical. Ozone additions up to I ppm resulted in a slight increase in the optoacoustic signal base line response at the threshold of the NO2 detection limit, approximately 5 ppb at a S/N = 1. This signal increase, however, was found to be independent of O.~ concentration and may therefore be associated with NO2 generated from back- ground levels (approximately 6 ppb) of NO. This is consistent with the fact that the O~ absorption cross section at 488.0 nm is - 8 × 10 -2e cm 2 molecule-i, s'~ a factor of 3 × 10 -~ smaller than the NO2 absorption cross section, 2.5 × 10 -'9 cm 2 molecule-'. '° Based on these numbers, an O.~ concentration of 1 ppm would therefore generate an optoacoustic signal equivalent to that pro- duced by 3 ppb of NO2, and thus should not be detected given our present detection limit.
1.00
90
80
,.~ .70
8 .60
0
50
d (E .40
.50
20
HO
RESPONSE IN PURE N 2
O~---RESPONSE tN PURE 0 2
RESPONSE IN N 2 AND 17% 02
500 I000
FIG. 2. Relative optoacoustic response as a function of NO2 concentra- tion in three different matrix gases.
Interference by energy transfer was studied by direct- ing the matrix gas of interest over the permeation tube into the optoacoustic cell and recording the resulting NO2 response. The NO2 optoacoustic response in pure N2 and in the 50-ppm NO/N2 mixture were found to be identical. The response in pure 02, however, was mark- edly lower by 34.5%. Displayed in Fig. 2 are results from subsequent optoacoustic measurements of NO2 in the 500- to 1200-ppb concentration range in three different matrix gases: pure N2, a mixture of 17% 02 in N2, and pure 02. The decreased response caused by 02 is inde-
APPLIED S P E C T R O S C O P Y 5 6 3
pendent of NO2 concentration over this range, and in fact, from additional measurements is independent of NO2 concentration up to 36 ppm. The decreased re- sponse, however, is clearly dependent on the Oe concen- tration, as further shown in Fig. 3. The sensitivity ratio, obtained by dividing the measured NO2 sensitivity, [(sig- nal - base line)/NO2 conc.], in OjN2 mixtures by the corresponding sensitivity in pure N2, is plotted as a function of percent 02. As can be seen, this ratio is unequivocally dependent on the O2 composition, having a pronounced slope at low O2 concentrations and reaching a limiting value of 0.655 at high concentrations. This O2 effect could be reduced by adding H20 vapor to the O2 diluent flow. A partial signal recovery was observed on adding H20 vapor in the 100- to 200-ppm concentration range. Higher concentrations around 0.3% resulted in complete signal recovery. These results are only prelim- inary and more studies are clearly needed in order to quantify the effect of H20. Such behavior, however, is no doubt related to the fact that H20 vapor, as is well known, is an effective quenching partner. In the case of quenching electronically excited NO2 (NO2*) H20 vapor has been found to be ~6 times more effective than either 02 or N2. H
One interpretation of these observations is that H20 vapor effectively competes with processes which in the presence of O2 short circuit the mechanism responsible for generation of heat, namely NO2* + M --~ NO2 + M. One such process consistent with the observations above is that of energy transfer. In such a mechanism, energy is transferred from NO2* to the metastable O2(~hg) elec- tronic state of O2 in accordance with
NO2* + O2(3Eg) ---> NO2 + O2(~hg). (2)
The ~hg state of O2 is extremely long lived, having a radiative lifetime of approximately 45 min, and based on a quenching rate constant of 2.2 x 10 -'s cm3.mol-l.s -~ at the 02 pressures used in this study (600 Torr), '2' '~ the collisional relaxation lifetime is on the order of 23 msec. Since the chopping period used in the present study was much shorter than this, Fz~0 Hz, the energy thus trans- ferred to Oz('hg) would be effectively trapped, thereby reducing the total amount of energy degrading to heat during the "on" period of each chopper cycle and hence the optoacoustic response. Such a mechanism of energy
S(N 2 ,02 )
] I I I I 1.O
9 o \ t ~
.80 t-l.t ~
S I N 2) .70 - ~ t ~
"60 t
.50
. 4 o I I I 0 10 20 30
I I I I
I L I I 40 50 60 70
VOLUME PERCENT O2
I I 80 90 100
Fro. 3. The ratio of sensitivity measured in O2/N~ mixtures to that in pure N2 is plotted as a function of 02 concentration at a fixed NO2 concentration around 1150 ppb. Refer to test for sensitivity calculations.
564 Volume 36, Number 5, 1982
transfer and subsequent loss in optoacoustic response has in fact been previously reported. Harshbarger and Robin TM observed a dramatic decrease in I2 optoacoustic response in the presence of 02 at the onset of I2 dissocia- tion resulting from near-resonant energy transfer from iodine atoms to the metastable lag electronic state of 02. It is interesting to note that Harshbarger and Robin ~4 qualitatively describe an optoacoustic signal dependence on 02 similar in shape to that shown in Fig. 3 of the present study. Such a mechanism of energy transfer is further supported by the studies of Frankiewicz and Berry TM and Jones and Bayes. ''~ These researchers have independently confirmed that NO2 on excitation through- out the visible undergoes such a transfer of energy.
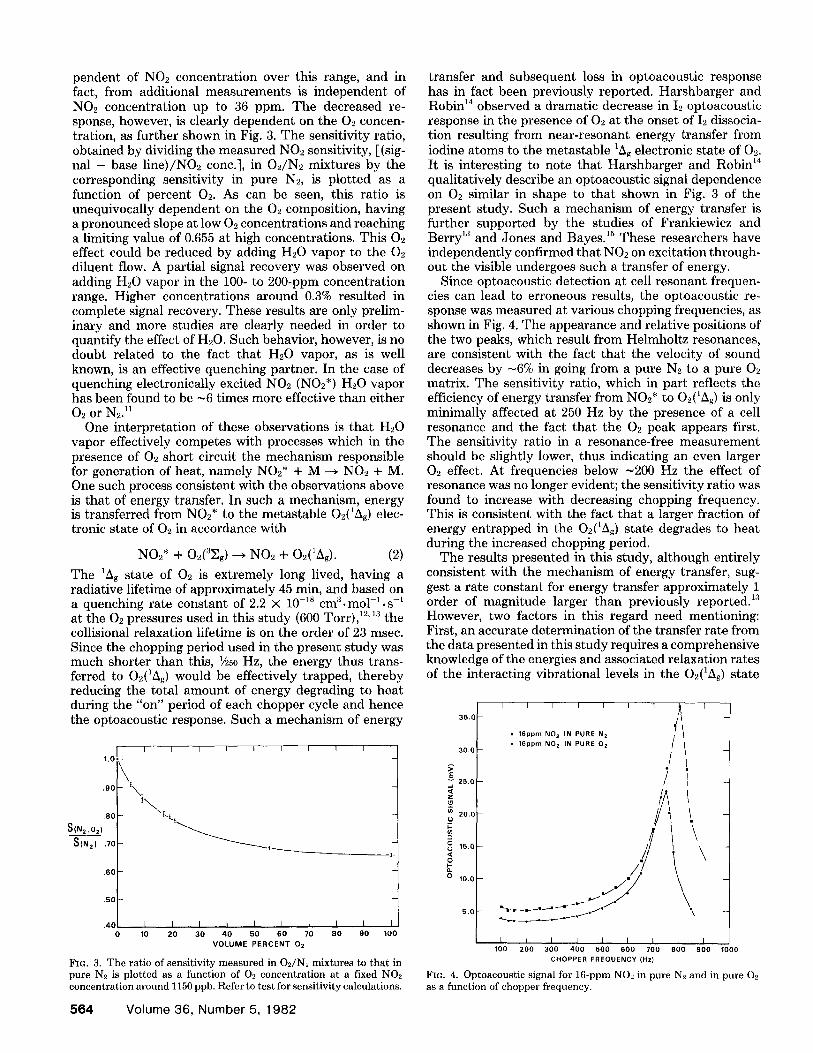
Since optoacoustic detection at cell resonant frequen- cies can lead to erroneous results, the optoacoustic re- sponse was measured at various chopping frequencies, as shown in Fig. 4. The appearance and relative positions of the two peaks, which result from Helmholtz resonances, are consistent with the fact that the velocity of sound decreases by ~6% in going from a pure N2 to a pure 02 matrix. The sensitivity ratio, which in part reflects the efficiency of energy transfer from NO2* to O~('h~) is only minimally affected at 250 Hz by the presence of a cell resonance and the fact that the 02 peak appears first. The sensitivity ratio in a resonance-free measurement should be slightly lower, thus indicating an even larger 02 effect. At frequencies below -200 Hz the effect of resonance was no longer evident; the sensitivity ratio was found to increase with decreasing chopping frequency. This is consistent with the fact that a larger fraction of energy entrapped in the O2(~hg) state degrades to heat during the increased chopping period.
The results presented in this study, although entirely consistent with the mechanism of energy transfer, sug- gest a rate constant for energy transfer approximately 1 order of magnitude larger than previously reported. 13 However, two factors in this regard need mentioning: First, an accurate determination of the transfer rate from the data presented in this study requires a comprehensive knowledge of the energies and associated relaxation rates of the interacting vibrational levels in the O2(1Ag) state
I I I I I I I ~ I 35.0 /
• 16ppm NO 2 IN PURE N z / • 16pprn NO z IN PURE O z [
30.0
~ 2s.c /
u~ 20.1
,4 \ 8 • o 10,0
5.0 \
I I I I I I L [ I 100 200 300 400 500 600 700 800 900 1000
CHOPPER FREQUENCY (Hz)
Fro. 4. Optoacoustic signal for 16-ppm NO2 in pure N2 and in pure 02 as a function of chopper frequency.
involved in the transfer process, a luxury not presently available. Second, the validity of comparing these results with previous studies is open to question. In a molecule such as NO2, which exhibits extensive perturbations be- tween energy levels, the efficiency of energy transfer would be strongly dependent on the specific energy levels populated. Because of widely differing conditions of total pressure, NOJO2 ratios, and excitation bandwidth, an enhanced energy transfer rate may not be totally out of the question, particularly if the levels involved in the present study are nearly resonant in energy. The inter- pretation is further complicated by the fact that 488.0- nm laser excitation populates at least two different ex- cited electronic states of NO2, 2B~, and ~B2.'" These states, as observed by Haaks, '6 give rise to vastly different fluorescent features and quenching rate constants de- pending on the total pressure. Clearly, a more compre- hensive understanding of the mechanism that is opera- tive in the present study must await further investigation.
III. CONCLUSIONS
The results presented in this preliminary investigation significantly impact optoacoustic measurements of NO~ carried out at 488.0 nm and perhaps at other visible wavelengths. The determination of NO2 concentration from such measurements, both in the laboratory and in the atmosphere, would be in error unless precautions are taken to ensure that the matrix gases are of similar composition in the measurement and calibration phases,
as was the case in the gas-phase titration measurements carried out concurrent with this study. Small differences in 02 content, however, as might be expected from dif- ferent air cylinders, would cause a negligibly small effect. As shown in Fig. 3, Oe contents around 20% and differing by as much as 2%, would give rise to identical optoacous- tic measurements within experimental error limits.
ACKNOWLEDGMENTS
The author wishes to acknowledge Dr. James Elkins at the National Bureau of Standards for his GC analysis of the various gases used in this experiment. Acknowledgment is also given to Drs. Robert Hampson, Michael Kurylo, Allan Laufer, and Walter Braun also on the staff at the National Bureau of Standards for their many helpful discussions.
1. L. B. Kreuzer, N, D. Kenyon, and C. K. N. Patel, Science 177, 347 {1972). 2. W. R. Harshbarger and M. B. Robin, Accounts Chem. Res. 6, 329 {1973). 3. A. M. Angus, E. E. Marinero, and M. J. Colles, Opt. Commun. 14, 223 (1975). 4. P. C. Claspy, C. Ha, and Y. H. Pao, Appl. Opt. 16, 2972 (1977). 5. R. W. Terhnne and J. E. Andel~son, Opt. Lett. 1, 70 (1977). 6. A. Fried and D. H. Stedman, "Laser Optoacoustic Detection of NO., in a Flow
System" presented at the Pittsburgh Conference on Analytical Chemistry and Applied Spectroscopy, Cleveland, OH, March 1979.
7. A. Fried and J. Hodgeson, J. Anal. Chem. 54, 278 (1982). 8. M. Griggs, J. Chem. Phys. 49, 857 {1968). 9. E. C. Y. Inn and Y. Tanaka, J. Opt. Soc. Am. 43, 870 (1953).
10. K. Sakura and H. P. Broida, J. Chem. Phys. 50, 2404 (1969). 11. G. H. Myers, D. M. Silver, and F. Kaufman, J. Chem. Phys. 44, 718 (1966). 12. R. F. Hampson, "Chemical Kinetic and Photochemical Data Sheets for
Atmospheric Reactions," Department of Transportation Report No. FAA- EE-80-17, April 1980.
13. T. C. Frankiewicz and R. S. Berry, J. Chem. Phys. 58, 1787 (1973). 14. W. R. Harshbarger and M. B. Robin, Chem. Phys. LetL 21,462 (1973). 15. I. T. N. ,]ones and K. D. Bayes, J. Chem. Phys. 59, 3119 0973). 16. D. Haaks, "Quenching of NO~(~B,) and ('~B~)", in Laser-Induced Processes in
Molecules, K. L. Kompa and S. D. Smith, eds. (Springer-Verlag, New York, 1979}, p 352.
Effects of Laser Linewidth on the Coherent Ant i -Stokes Raman Spectroscopy Spectral Profile
HARUHIKO KATAOKA, SHIRO MAEDA, and CHIAKI HIROSE Research Laboratory of Resources Utilization, Tokyo Institute of Technology, 4259 Nagatsuta-cho, Midori-ku, Yokohama, 227 Japan
The e x p r e s s i o n for the in tens i ty in coherent ant i -S tokes R a m a n s p e c t r o s c o p y (CARS) w a s der ived for s c a n n i n g CARS by t a k i n g into account the l i n e w i d t h s and phase re lat ion of the t w o laser beams, and s imula t ion p r o c e d u r e s su i ted for pract ica l appl ica- t ions w e r e deve loped . The CARS spectra o f p - x y l e n e and N2 gas were observed , and the resu l t s w e r e compared w i t h the s imu- lat ion curves based on two e x t r e m e cases o f the s ta t i s t i ca l proper ty of the laser source. It w a s s h o w n that the ef fect o f laser l inewid th b e c o m e s r e m a r k a b l e w h e n the R a m a n l i n e w i d t h is comparable to or smal ler than the laser l inewidth , and that the degree of coherence a m o n g the f requency c o m p o n e n t s within the laser l inewidth is an impor tant factor in d e t e r m i n i n g the spectra l profile. Index Headings:CARS profile; Coherent ant i -S tokes Raman spectra l profi le; Laser w id th and CARS profile.
INTRODUCTION
Coherent anti-Stokes Raman spectroscopy (CARS) is
Received 13 Ju ly 1981; revision received 5 October 1981.
Volume 36, Number 5, 1982
now well recognized to be a powerful analytical tool for gaseous systems in spectroscopically hostile environ- ments, such as combustion and electric discharge, by virtue of its high conversion efficiency and coherent natureJ -3 There has been considerable interest in the measurement of temperature from the CARS spectral profile, where the temperature is determined so that the theoretical calculation may give the best fit to the ob- served profile. Because of the nonlinear and coherent character of the CARS process, the spectral profile is influenced in a complicated manner by the optical and statistical properties of the laser beams used to drive the process, so that it is essential for accurate temperature measurement to incorporate those factors properly into the simulation procedure. The effect of finite spectral width of laser beams has been considered by Roh et al. , 4 Yuratich, ~ and Perkins and LewisP St. Peters 7 and Dutta s have also discussed the effect of phase and amplitude fluctuations of laser. It seems, however, that further investigations of this problem are still required to put the method into practice, as the mathematical results in