A study of performance on tests from the CANTABbattery sensitive to frontal lobe dysfunction in a largesample of normal volunteers: Implications for theoriesof executive functioning and cognitive aging
TREVOR W. ROBBINS,1 MERLE JAMES,2 ADRIAN M. OWEN,3 BARBARA J. SAHAKIAN,3
ANDREW D. LAWRENCE,1 LYNN MCINNES,4 and PATRICK M.A. RABBITT5
1Department of Experimental Psychology, University of Cambridge, Cambridge, U.K.2Department of Psychology, National Hospital for Neurology and Neurosurgery, London, U.K.3Department of Psychiatry, University of Cambridge, Cambridge, U.K.4Northeast Age Research, Department of Psychology, The University of Newcastle-upon-Tyne, Newcastle, U.K.5Age and Cognitive Performance Research Centre, University of Manchester, Manchester, U.K.
(Received May 12, 1997;Revised December 24, 1997;Accepted January 30, 1998)
Abstract
Several tests from the CANTAB neuropsychological test battery previously shown to be sensitive to frontal lobedysfunction were administered to a large group of normal volunteers (N 5 341) ranging in age from 21 to 79 years.The main tests included a computerized form of the Tower of London test of planning, a self-ordered spatialworking memory task, and a test of attentional set formation and shifting. A computerized form of the Corsi spatialspan task was also given. Age-related graded declines in performance were seen, sometimes in a discontinuousmanner, especially for the attentional set shifting task (at the extradimensional shift stage). Patterns of deficitsreminiscent of frontal lobe or basal ganglia damage were observed in the oldest age group (74–79). However,overall the data were only partially consistent with the hypothesis that frontal lobe functions are the most sensitiveto effects of aging. Factor analyses showed that performance in the executive tests was not simply related to ameasure of fluid intelligence, and their performance had a factor loading structure distinct from that for theCANTAB tests of visual memory and learning previously administered to the same sample. Finally, only limitedsupport was found for the hypothesis that cognitive aging depends on slowed information processing.(JINS, 1998,4, 474–490.)
Keywords: Executive function, Prefrontal cortex, Aging, Set-shifting, Working memory, Planning
INTRODUCTION
There is currently much interest in the definition and mea-surement of executive functioning both in normal individ-uals and in patients with brain damage, particularly those inwhom there is frontal lobe or closed head injury (Burgess,1997; Tranel et al., 1994). The term “executive function-ing” refers to those processes by which an individual opti-mizes his performance in multicomponent tasks. Thesedifferent processes include the ability to respond flexibly
and appropriately in altered circumstances, efficient sched-uling of behavior and attentional resources, as well as thesuppression of inappropriate responding, the use of strat-egies to enhance mnemonic function, and the formulationof new plans of action.
A number of neuropsychological tests have been devel-oped to measure frontal lobe dysfunction, such as the Wis-consin Card Sorting Test (Milner, 1963), the FAS andcategory tests of verbal fluency (Benton & Hamsher, 1976),the Stroop test (Vendrell et al., 1995), and the test of cog-nitive estimates (Shallice & Evans, 1978). These tap vari-ous aspects of executive functioning, although it is importantto realize that executive and frontal lobe functions are notsynonymous. A major difficulty, however, is the hetero-geneity of frontal lobe impairments and executive forms
Reprint requests to: Trevor W. Robbins, Department of ExperimentalPsychology, University of Cambridge, Downing St., Cambridge, CB2 3EB,U.K. E-mail: [email protected]
of dysfunction. Consequently, novel means of testing andmeasuring such functions are constantly being devised andevaluated.
The CANTAB (Cambridge Neuropsychological Test Au-tomated Battery) was originally devised for the assessmentof cognitive function in elderly and dementing subjects (Rob-bins et al., 1994). It is a battery of computerized tests ad-ministered with the aid of a touch-sensitive screen. The mainguiding principles have been to use some tests that can berelated to the extensive neuropsychological literature in an-imals and to employ tests that can be broken down into theircognitive components in order to define more readily whichfunctions are impaired and which are spared. The batteryhas now been used quite extensively in the testing of pa-tients with Alzheimer’s disease and other forms of demen-tia (Sahakian et al., 1988, 1990; Sahgal et al., 1991,1992),patients with basal ganglia disorders such as Parkinson’sdisease (Downes et al., 1989; Owen et al., 1992, 1993), Kor-sakoff’s syndrome (Joyce & Robbins, 1991), depression(Abas et al., 1990; Beats et al., 1996), schizophrenia (El-liott et al., 1995), HIV-positive patients (Sahakian et al.,1995), and children with minimal learning disabilities or au-tism (Hughes et al., 1994). The tests have also been vali-dated in neurosurgical patients with excisions of the temporalor frontal lobes and amygdalohippocampectomy (Owenet al., 1995). Results from these studies have confirmed thatsome of the tests are sensitive to temporal lobe damage andothers to frontal lobe damage.
A detailed study of some of the tests from the visual mem-ory battery of CANTAB was made on a large population ofelderly volunteers, for the purposes of standardization (Rob-bins et al., 1994). This study showed that, whereas perfor-mance on some of the tests showed a gradual and continuousdecline with age, performance on other tests showed signif-icant decline within particular age ranges. A factor analysisof data from almost 800 participants provided a solution withfour main factors, which were tentatively associated withvisual memory and learning, speed of processing, executivefunctioning, and perception. However, relatively few of thetests employed are sensitive to frontal lobe dysfunction orhave obvious executive components. For example, theCANTAB test of self-ordered, spatial working memory hasbeen shown to be sensitive to frontal lobe damage in humanpatients, but this impairment depends in part on the formu-lation of an effective strategy for carrying out this self-ordered memory task (Owen et al., 1990, 1996c). The studydid not include an assessment of strategy in this large el-derly sample. Furthermore, two other prominent tests sen-sitive to frontal lobe damage were not included in thisanalysis: a computerized form of the Tower of London testof planning (Owen et al., 1990; Shallice, 1982), which al-lows measurement of both the speed and latency to solvethe test problems, and a test of attentional set formation andshifting, modeled after the Wisconsin Card Sorting Test butsimplified and presented in a graded format suitable for thetesting of experimental animals (Dias et al., 1996; Robertset al., 1988).
A main purpose of the present study is to report data froma large population of normal, healthy older people on thethree tests sensitive to frontal lobe dysfunction: self-ordered,spatial working memory; the Tower of London; and atten-tional set formation and set shifting. We were able to test alarge sample of individuals between the ages of 55 and 79years, together with a sample of participants younger than55 years of age. The majority of the older sample had alsoreceived testing with the CANTAB Visual Memory battery,which includes tests of recognition memory and visuospa-tial learning (Robbins et al., 1994). Thus, it was possible toperform a factor analysis which examined the factor struc-ture of the entire CANTAB battery as well as to establishthe factor structure of the tests with executive components.Both of these analyses are important. First it is necessary totest the hypothesis that certain functions, probably medi-ated by specialized regions of the posterior neocortex, arecorrelated to only a minor extent with performance on testswith large executive components. Second, it is important todefine possible interrelationships among the various as-pects of executive functioning, potentially in order to relatedifferent aspects of executive functioning to different re-gions of the prefrontal cortex (Robbins, 1996; West, 1996).There is already some evidence from psychometric and func-tional neuroimaging perspectives that some of the CANTABtests of executive function are closely interrelated (Owenet al., 1996a, 1996b; Robbins, 1996).
Ancillary aims of the study were to examine the relation-ship between test performance, age, and intelligence. Thedata could be analyzed within the context of one theory ofcognitive aging—that speed of information-processing un-derlies all age-related declines in cognitive function (Salt-house, 1985, 1996)—by using one set of variables from theCANTAB battery to provide indices of speed of processing(reaction times) (Nettelbeck & Rabbitt, 1992).
As it has recently been suggested that tests of executivefunction require high levels of fluid intelligence (Duncanet al., 1995), we also used a factor analytic method to ex-amine the relationship between performance on this batteryand scores on the AH 4 2 (Heim, 1968), a set of tests ofvisuospatial reasoning that requires fluid intelligence. Thisanalysis enabled us to determine to what extent the sensi-tivity of some of these tests to frontal lobe dysfunction couldbe predicted from their loading forg (or general intelligence).
METHOD
Research participants
Participants were drawn from a sample of 341 normal healthyvolunteers, aged 21 to 79 years. Those over 50 were drawnfrom the North East Age Research panel based in Newcastle-upon-Tyne. Participants younger than 55 were drawn froma variety of sources in the Cambridgeshire area. Details oftheir numbers by age, sex, and verbal IQ (as estimated bythe NART; Nelson, 1982) are shown in Table 1 in terms of
Frontal functions and aging 475
5-year age bands or “quincades.” It was not possible to ob-tain data on all tests or variables from all participants; there-fore, the precise numbers of participants used for eachdependent variable are indicated throughout the text. Thefull sample was used unless otherwise indicated. For the par-ticipants older than 50, it was possible to obtain scores on atest of visuospatial fluid intelligence, AH 4 2 (Heim, 1968;see Nettelbeck & Rabbitt, 1992), as well as the NationalAdult Reading Test, which can be used to estimate verbalIQ (Nelson, 1982).
Equipment and Procedure
The main tests were taken from the Cambridge Neuropsy-chological Test Automated Battery (CANTAB). This seriesof computerized tasks was run on an Acorn BBC Master128 microcomputer with a high resolution Microvitec (Brad-ford, U.K.) 12-inch VDU and a Microvitec Touchtec 501touch sensitive screen. Participants sat at a comfortableheight approximately 0.5 m from the monitor. It was ex-plained that they would have to respond to stimuli by touch-ing the screen. They were introduced to the apparatus byway of a motor screening task in which they were asked torespond to a series of flashing crosses on the screen by plac-ing the index finger of their preferred hand on the centerpoint of each cross as soon as possible after it appeared. Allvolunteers passed this introductory screening task and werethen given the following test batteries over two visits withina few weeks of one another. On the first visit they com-pleted the tests of spatial span, spatial working memory, andthe Tower of London from the CANTAB Planning and Work-ing Memory battery and the attentional set shifting para-digm from the CANTAB Attentional battery. On the second
visit they did the CANTAB Visual Memory battery as de-scribed previously (Robbins et al., 1994), including tests ofpattern recognition memory, spatial recognition memory, si-multaneous and delayed matching to sample and a test ofvisuospatial paired associate learning. They also completeda matching to sample, visual search test from the CANTABAttentional battery, also previously described (Robbinset al., 1994). Data from the tests completed on the secondvisit have already been published using this sample (Rob-bins et al., 1994), but were also used here to compare withtests sensitive to frontal lobe damage.
Spatial short-term span
This computerized version of the Corsi Block Tapping task(Milner, 1971) was used to determine the ability of partici-pants to remember a sequence of squares highlighted on thescreen. Precise details are provided in Owen et al. (1990).After each successful trial, the number of boxes changingin the next sequence was increased by one to a maximum ofnine boxes. After an incorrect attempt at any particular level,an alternative sequence of the same length was presented.This continued until the participant had failed three consec-utive trials at any one level. The spatial short term memoryspan was calculated as the highest level at which the par-ticipant had successfully recalled at least one sequence ofboxes.
Spatial working memory task
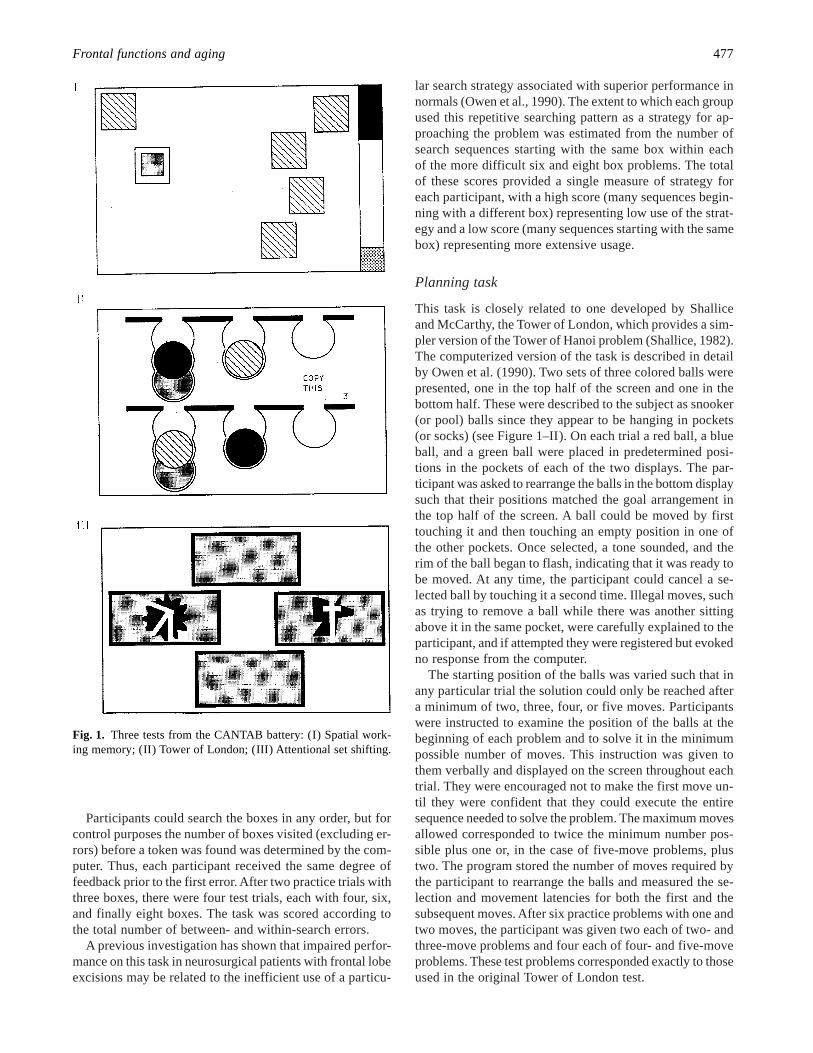
The rationale for this task and its implementation has beendescribed previously in some detail (Owen et al., 1990). Theparticipant was required to search through a number of col-ored 3-cm boxes presented on the screen by touching eachone in order to “open it” and thus revealing its contents (seeFigure 1–I). The goal was to collect blue tokens hidden in-side the boxes and, once found, to use them to fill an emptycolumn at the side of the screen. The participants were in-structed that at any one time there would be a single tokenhidden inside one of the boxes. Their task was to searchuntil they found it, at which point the next token would behidden. The key instruction was that, once a blue token hadbeen found within a particular box, that box would not beused again to hide a token for that particular trial. Sinceevery box was used once, the total number of blue tokens tobe found on each trial corresponded to the number of boxeson the screen. In order to analyze performance, it is conve-nient to consider each sequence of responses that termi-nates in finding a token as a “search.” Two main types ofsearch error are possible. First, a participant may return toopen a box in which a blue counter has already been foundin a previous search (a between-search error). Second, a par-ticipant may return to a box already opened in the samesearch sequence (a within-search error). It is of course pos-sible for an error to be counted under both categories, andsuch examples were counted under both categories (they gen-erally form a small proportion of the total errors).
Participants could search the boxes in any order, but forcontrol purposes the number of boxes visited (excluding er-rors) before a token was found was determined by the com-puter. Thus, each participant received the same degree offeedback prior to the first error. After two practice trials withthree boxes, there were four test trials, each with four, six,and finally eight boxes. The task was scored according tothe total number of between- and within-search errors.
A previous investigation has shown that impaired perfor-mance on this task in neurosurgical patients with frontal lobeexcisions may be related to the inefficient use of a particu-
lar search strategy associated with superior performance innormals (Owen et al., 1990). The extent to which each groupused this repetitive searching pattern as a strategy for ap-proaching the problem was estimated from the number ofsearch sequences starting with the same box within eachof the more difficult six and eight box problems. The totalof these scores provided a single measure of strategy foreach participant, with a high score (many sequences begin-ning with a different box) representing low use of the strat-egy and a low score (many sequences starting with the samebox) representing more extensive usage.
Planning task
This task is closely related to one developed by Shalliceand McCarthy, the Tower of London, which provides a sim-pler version of the Tower of Hanoi problem (Shallice, 1982).The computerized version of the task is described in detailby Owen et al. (1990). Two sets of three colored balls werepresented, one in the top half of the screen and one in thebottom half. These were described to the subject as snooker(or pool) balls since they appear to be hanging in pockets(or socks) (see Figure 1–II). On each trial a red ball, a blueball, and a green ball were placed in predetermined posi-tions in the pockets of each of the two displays. The par-ticipant was asked to rearrange the balls in the bottom displaysuch that their positions matched the goal arrangement inthe top half of the screen. A ball could be moved by firsttouching it and then touching an empty position in one ofthe other pockets. Once selected, a tone sounded, and therim of the ball began to flash, indicating that it was ready tobe moved. At any time, the participant could cancel a se-lected ball by touching it a second time. Illegal moves, suchas trying to remove a ball while there was another sittingabove it in the same pocket, were carefully explained to theparticipant, and if attempted they were registered but evokedno response from the computer.
The starting position of the balls was varied such that inany particular trial the solution could only be reached aftera minimum of two, three, four, or five moves. Participantswere instructed to examine the position of the balls at thebeginning of each problem and to solve it in the minimumpossible number of moves. This instruction was given tothem verbally and displayed on the screen throughout eachtrial. They were encouraged not to make the first move un-til they were confident that they could execute the entiresequence needed to solve the problem. The maximum movesallowed corresponded to twice the minimum number pos-sible plus one or, in the case of five-move problems, plustwo. The program stored the number of moves required bythe participant to rearrange the balls and measured the se-lection and movement latencies for both the first and thesubsequent moves. After six practice problems with one andtwo moves, the participant was given two each of two- andthree-move problems and four each of four- and five-moveproblems. These test problems corresponded exactly to thoseused in the original Tower of London test.
Fig. 1. Three tests from the CANTAB battery: (I) Spatial work-ing memory; (II) Tower of London; (III) Attentional set shifting.
Frontal functions and aging 477
For each test problem a yoked control condition was em-ployed to provide baseline measures of the times taken toinitiate and execute single movements defined as motor ini-tiation and execution times. On each trial of this control con-dition, the participant was required to follow a sequence ofsingle moves executed by the computer in the top half ofthe screen by moving the corresponding ball in the lowerarrangement. Thus, initially the two arrangements differedby just one ball. Once the subject had made the appropriatemove, the top arrangement changed again so that the par-ticipant had to make another single move. The test was yokedto the main test in the sense that in each trial the movementof the balls was an exact replication of those moved by theparticipant in the corresponding test trial. The measure-ment of selection and execution latencies in this control con-dition provided baseline estimates of motor initiation andexecution times.
Test trials and yoked control trials were arranged in fourblocks of six problems each. The first six test trials weregiven (two problems at each of two, three, and four moves),followed by their corresponding yoked control trials. Thenthe remaining six test problems were presented (two at fourmoves and four at five moves), followed by their yoked con-trol trials. Between each block change there were two prac-tice trials to ensure that the requirements of the current setof tasks had been fully understood.
Accuracy of performance.Across the 12 test prob-lems, the main measure was the proportion of problemssolved in the minimum number of moves specified (“per-fect solutions”).
Latency measures of performance.Baseline measuresof motor initiation and motor execution times were ex-tracted from the 12 yoked control trials. In all cases, laten-cies were recorded in hundredths of seconds and convertedto seconds for the purpose of presentation. The motor ini-tiation time was the mean time between the onset of eachproblem and the completion of the first move (i.e., a correcttouch of the required ball). The motor execution time wasthe time between touching the first ball and completing thesequence of single moves that comprise the whole problem.Since these control problems were yoked to the test prob-lems, the total execution time was divided by the number ofmoves to provide an estimate of the average movement timeper move.
The motor initiation and execution times were used toderive estimates of planning or “thinking” time in the maintask. Two separate estimates were calculated. In each prob-lem, the initial thinking time was the time between the pre-sentation of the problem and the first touch minus thecorresponding latency to make the same response on theyoked control task (i.e., subtracting motor initiation time).The subsequent thinking time was the time between the se-lection of the first ball and the completion of the problemminus the total motor execution time summed over all moveswhen made separately, from the corresponding control prob-lem. Since this measure clearly varied with problem length,
subsequent thinking time scores were divided by the num-ber of moves to give an estimate of the average thinkingtime per move. In this way, pure estimates of initial and sub-sequent thinking times were derived, unconfounded by mo-tor initiation or execution times.
Attentional set formation and shifting
This includes a series of visual discrimination tasks (seeDownes et al., 1989). The test set-up and stimuli were shownto the participants. Four rectangular boxes—to the top andbottom and to the right and left of center—appeared on thescreen. Two of these contained the test stimuli, but the boxesused changed from trial to trial. Participants were instructedin the following way:
Now you can see two patterns. One of the patterns is correct.You must point to the one you think is correct. There is a ruleyou can follow to make sure you make the correct choice eachtime. The computer will be keeping track of how well you aredoing and when it is clear that you know the rule the computerwill change it, but this will not happen very often. To begin with,there is nothing on the screen to tell you which of the two pat-terns is correct, so your first choice will be a simple guess. How-ever, the computer will give a message after each attempt to tellyou whether you are right or wrong. You can start now.
The test then proceeded through a number of stages, eachwith a different contingency, up to a maximum of nine (seeFigure 1–III). For each, continuation to the next stage wasdependent on a criterion of six successive correct discrim-inations being reached. If criterion was not reached at thefiftieth trial of a stage, the test was discontinued, and theparticipant did not proceed to the following stage. The or-der of discrimination was fixed so that the EDS always fol-lowed the IDS. However, previous work has established thatcomparable effects are found when the alternative orderingis used (Roberts et al., 1988). More detailed rationales forthe exact design of the test can be found in previously pub-lished articles (Downes et al., 1989; Roberts et al., 1988).
To begin with, participants were given a simple simulta-neous discrimination in which the stimuli varied along onlyone of the two dimensions for deriving the stimuli. Thesedimensions were purple-filled shapes or white lines. Thestarting dimension was balanced across participants andgroups. Feedback for responses was in the form of the wordscorrect and wrong, presented respectively in green and redlettering above the middle two boxes.
Following the initial simple discrimination (SD), the re-maining eight stages were as follows. For the second stage(SDR), the discriminanda remained the same, but the pre-viously incorrect choice became the correct one and viceversa (i.e., the contingencies were reversed). At the thirdstage (C-D), the second dimension was introduced with oneexemplar of each dimension paired together to form a com-pound stimulus in two of the response boxes. To succeed, aparticipant had to continue to respond to the correct exem-plar of the previous stage. For this and all subsequent stages,exemplars of the different dimensions were paired in a
478 T.W. Robbins et al.
pseudorandom fashion so that all four possible compoundstimuli were used, with the constraint that runs of no morethan three trials with the same pairings were allowed. Thestimuli for the fourth stage (CD) and subsequent stages werealso compounds, but the two exemplars from the differentdimensions were superimposed, with the white line alwaysin the foreground. The contingencies were again unchangedfrom those for the previous two stages. A reversal then oc-curred at the fifth stage (CDR). New exemplars for bothdimensions were introduced at the sixth stage, the intradi-mensional shift (IDS), but the relevant dimension (i.e., shapesor lines) was unchanged from Stage 1. This was followedby a further reversal at the seventh stage (IDR). For the pen-ultimate stage, the extradimensional shift (EDS), new ex-emplars were again introduced, but success at this pointdepended on the participant shifting response set to the ex-emplars of the previously irrelevant dimension. Finally, con-tingencies were reversed to the previously incorrect exemplarof the new dimension (EDR). One of the measures of per-formance on this task was the stage successfully attained.Another was the number of errors made summed over thestages up to but not including the EDS stage (Total errors2EDS). This provides a measure of set formation and main-tenance. A specific measure of set shifting is provided bythe errors made at the EDS stage. For participants failingthe test at earlier stages, 25 errors was substituted for theirscore.
Statistical analysis
Most of the dependent variables described above were sub-jected to one-way analysis of variance (ANOVA), with agegroup as a factor, using the SPSS package (Norusis, 1990).Following the finding of a significant effect of age group,pair-wise comparisons between means were made using theNewman–Keuls test. In the case of repeated measures de-signs (e.g., the Tower of London test), multivariate analysisof variance (MANOVA; SPSS) was used, and the two fac-tors were age group and difficulty. For the attentional setshifting task, the numbers of participants succeeding andfailing to reach criterion at each of the nine stages of thetest were cast into contingency tables and analyzed using alikelihood ratio analysis (Kullback, 1968; Robbins, 1977)which allows the use of small cell frequencies, the resultingstatistic, 2i, being distributed as chi squared. In order to com-pute the relationship between the strategy score on the spa-tial working memory task and the main index of memoryperformance, the between-search errors score, Pearson’s cor-relation coefficient,r, was used.
The data for the main variables reported in this articlewere subjected to factor analysis. The method employed wasa varimax rotation with Kaiser normalization (SPSS). Ascomplete data sets were not obtained for all participants,the method of pair-wise comparisons was employed (Noru-sis, 1990, p. B46), which uses all of the available data in theanalysis. However, separate analyses using the sample withthe complete data set (N 5 101) gave qualitatively similar
results, providing evidence for the consistency of the factorstructure obtained. An additional factor analysis was usedin order to relate the data from the tests used in this study todata obtained using other tests of memory and perception(see above for descriptions) previously reported for the samepopulation (Robbins et al., 1994). Finally, we also con-structed an intercorrelation matrix for participants with com-plete data on a slightly smaller subset of cognitive tests(N 5 215) for Pearson’sr and also computed partial corre-lations where appropriate (see Results).
RESULTS
Attentional Set Shifting
Figure 2 shows the proportion of participants from each ofthe five age groups reaching criterion at each stage of theattentional set shifting paradigm. Likelihood ratio analysisof the numbers of participants passing or failing all stagesof the test indicated a significant age group difference[x 2(5)5 20.25,p , .01], whichpost-hoccontrasts showedto be wholly attributable to the differences between the youn-gest and oldest age groups and the rest [x 2(1)5 10.20,p ,.01; andx 2(1)5 11.60,p , .01, respectively]. Further anal-
Fig. 2. Proportion of participants passing the criterion (606 cor-rect) for each stage of the attentional set shifting paradigm (fullsample, see Table 1). Abbreviations: SD5 simple discrimination;SR5 simple reversal; C-D5 compound discrimination, with sep-arated elements; CD5 compound discrimination, superimposedelements (see Figure 1C); CDR5 compound discrimination re-versal; IDS5 intradimensional shift; IDR5 intradimensional re-versal; EDS5 extradimensional shift; EDR5 extradimensionalshift reversal.
Frontal functions and aging 479
ysis was undertaken to determine which stage of the testmost distinguished these groups from the rest. For this pur-pose, we considered the performance of participants up toand including the IDS stage and those participants only at-tempting the EDS stage. This showed no significant differ-ences in the former case [x 2(4) 5 4.34,p . .05], but thepattern of results was similar at the EDS stage to that for thetest as a whole; that is, both the youngest [x 2(1) 5 13.24,p , .001] and the oldest [x 2(1) 5 9.00,p , .01) differedsignificantly from the rest, combined.
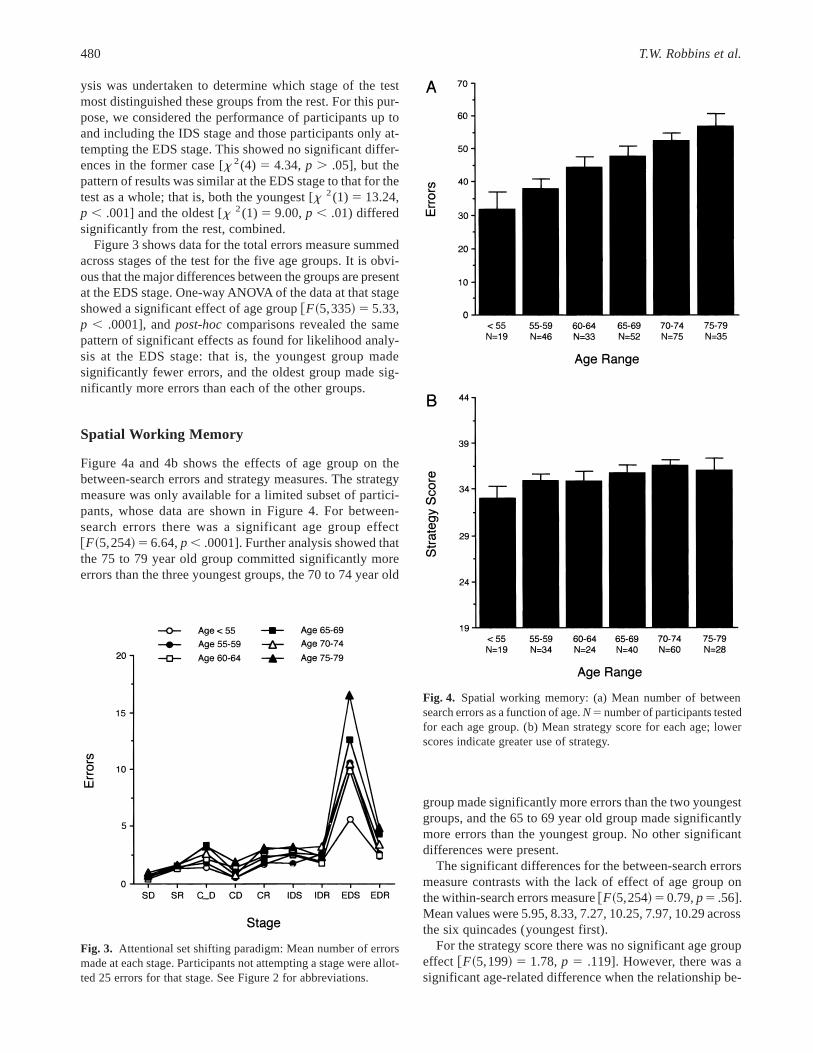
Figure 3 shows data for the total errors measure summedacross stages of the test for the five age groups. It is obvi-ous that the major differences between the groups are presentat the EDS stage. One-way ANOVA of the data at that stageshowed a significant effect of age group@F~5,335! 5 5.33,p , .0001], andpost-hoccomparisons revealed the samepattern of significant effects as found for likelihood analy-sis at the EDS stage: that is, the youngest group madesignificantly fewer errors, and the oldest group made sig-nificantly more errors than each of the other groups.
Spatial Working Memory
Figure 4a and 4b shows the effects of age group on thebetween-search errors and strategy measures. The strategymeasure was only available for a limited subset of partici-pants, whose data are shown in Figure 4. For between-search errors there was a significant age group effect@F~5,254! 5 6.64,p , .0001]. Further analysis showed thatthe 75 to 79 year old group committed significantly moreerrors than the three youngest groups, the 70 to 74 year old
group made significantly more errors than the two youngestgroups, and the 65 to 69 year old group made significantlymore errors than the youngest group. No other significantdifferences were present.
The significant differences for the between-search errorsmeasure contrasts with the lack of effect of age group onthe within-search errors measure@F~5,254! 5 0.79,p5 .56].Mean values were 5.95, 8.33, 7.27, 10.25, 7.97, 10.29 acrossthe six quincades (youngest first).
For the strategy score there was no significant age groupeffect @F~5,199! 5 1.78,p 5 .119]. However, there was asignificant age-related difference when the relationship be-
Fig. 3. Attentional set shifting paradigm: Mean number of errorsmade at each stage. Participants not attempting a stage were allot-ted 25 errors for that stage. See Figure 2 for abbreviations.
Fig. 4. Spatial working memory: (a) Mean number of betweensearch errors as a function of age.N5number of participants testedfor each age group. (b) Mean strategy score for each age; lowerscores indicate greater use of strategy.
480 T.W. Robbins et al.
tween the between-search error score and the strategy scorewas computed using Pearson’s correlation coefficientr. Fig-ure 5 shows that there were highly significant correlationsbetween these two measures (confirming previous findingsfor a much smaller sample; Owen et al., 1990) for all agegroups, except the eldest (75–79), even though strategyscores were not available for all participants and were quitelow in certain cases. The failure of the eldest age group toshow a significant relationship is unlikely to have been dueto the small sample size (N 5 28), as the youngest groupshowed a significant value for Pearson’sr with an evensmallerN (5 19).
Spatial Span
Figure 6a shows that spatial span held relatively constantacross quincades at about the level of 5. Nevertheless therewas a significant decline over age groups@F~5,210! 5 3.23,p 5 .008]. However, the Newman–Keuls procedure failedto find significant differences among subgroups.
Tower of London Planning Task
Figure 6b shows that the number of problems solved in theminimum number of moves did not decline greatly in over-all terms (from 8.1012 [youngest group] to 6.8012), but de-clined significantly across age group@F~5,209! 5 2.78,p5.019]. Further analysis showed that the two youngest groupssolved significantly more problems than did the oldest group.
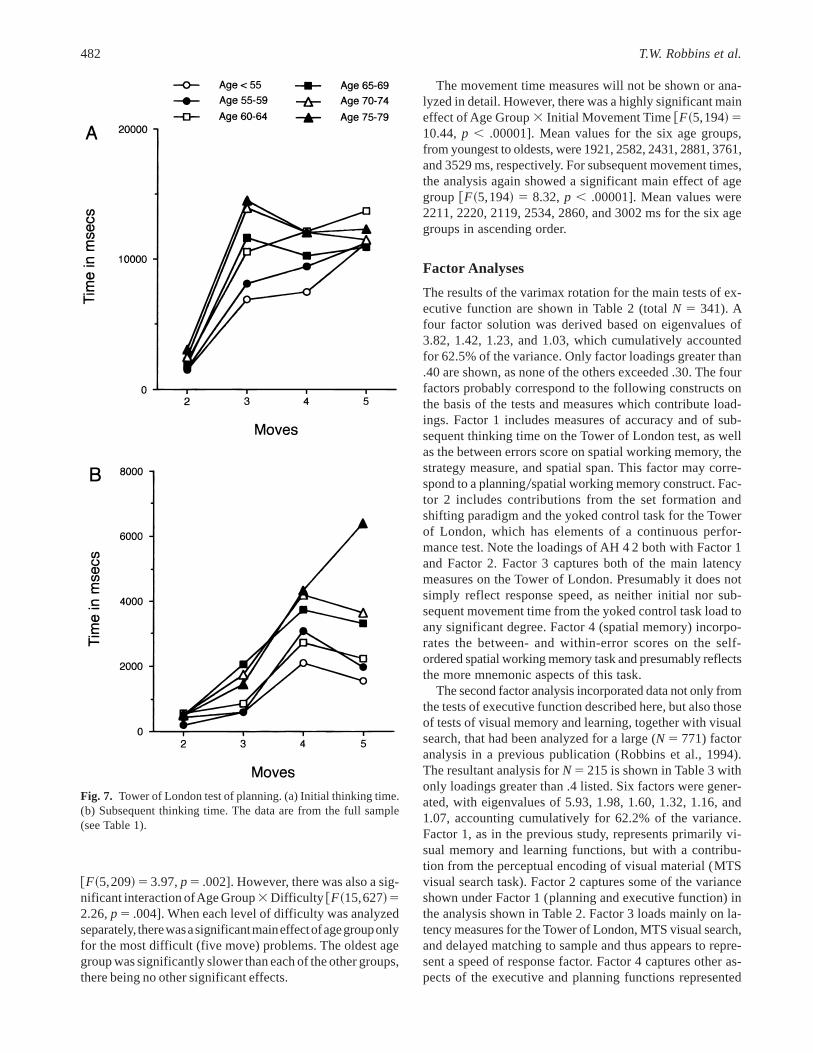
For the latency measures, Figure 7a shows that initialthinking time varied both by age group and by problem dif-ficulty. The ANOVA revealed a significant main effect of
age group@F~5,209! 5 2.63,p 5 .025]. There was also asignificant interaction between age groups and difficulty@F~15,627! 5 1.73,p5 .041]. When each level of difficultywas analyzed separately in order to determine simple maineffects of groups, significant effects were found only forthree move problems@F~5,2095 5.83,p , .001].Post-hoctests applied at this stage confirmed that the oldest (75–79)age group had significantly longer latencies than the threeyoungest groups, and that the 70 to 74 age group was sig-nificantly slower than the two youngest groups, no othersignificant differences being evident.
The subsequent thinking time measure is shown in Fig-ure 7b. Again there was a significant main effect of age group
Fig. 5. Spatial working memory: Relationship between strategyscore and memory performance (61 8 box stage) for each agegroup, as measured by Pearson’s correlation coefficientr. ** p ,.01, *p , .05.
Fig. 6. (a) Maximum spatial span score as a function of age. (b)Tower of London test of planning, minimum-move solutions. Thedata are from the full sample (see Table 1).
Frontal functions and aging 481
@F~5,209! 5 3.97,p5 .002]. However, there was also a sig-nificant interaction ofAge Group3 Difficulty @F~15,627!52.26,p5 .004]. When each level of difficulty was analyzedseparately, therewasasignificantmaineffectofagegrouponlyfor the most difficult (five move) problems. The oldest agegroup was significantly slower than each of the other groups,there being no other significant effects.
The movement time measures will not be shown or ana-lyzed in detail. However, there was a highly significant maineffect of Age Group3 Initial Movement Time@F~5,194! 510.44,p , .00001]. Mean values for the six age groups,from youngest to oldests, were 1921, 2582, 2431, 2881, 3761,and 3529 ms, respectively. For subsequent movement times,the analysis again showed a significant main effect of agegroup @F~5,194! 5 8.32,p , .00001]. Mean values were2211, 2220, 2119, 2534, 2860, and 3002 ms for the six agegroups in ascending order.
Factor Analyses
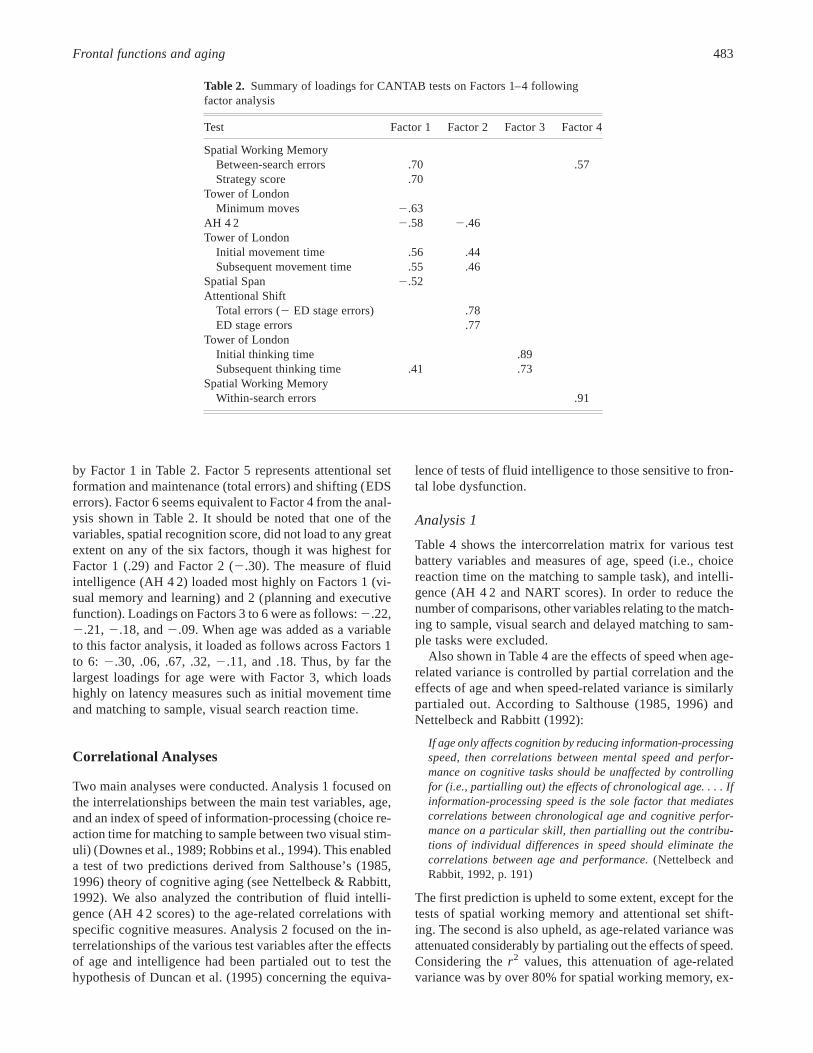
The results of the varimax rotation for the main tests of ex-ecutive function are shown in Table 2 (totalN 5 341). Afour factor solution was derived based on eigenvalues of3.82, 1.42, 1.23, and 1.03, which cumulatively accountedfor 62.5% of the variance. Only factor loadings greater than.40 are shown, as none of the others exceeded .30. The fourfactors probably correspond to the following constructs onthe basis of the tests and measures which contribute load-ings. Factor 1 includes measures of accuracy and of sub-sequent thinking time on the Tower of London test, as wellas the between errors score on spatial working memory, thestrategy measure, and spatial span. This factor may corre-spond to a planning0spatial working memory construct. Fac-tor 2 includes contributions from the set formation andshifting paradigm and the yoked control task for the Towerof London, which has elements of a continuous perfor-mance test. Note the loadings of AH 4 2 both with Factor 1and Factor 2. Factor 3 captures both of the main latencymeasures on the Tower of London. Presumably it does notsimply reflect response speed, as neither initial nor sub-sequent movement time from the yoked control task load toany significant degree. Factor 4 (spatial memory) incorpo-rates the between- and within-error scores on the self-ordered spatial working memory task and presumably reflectsthe more mnemonic aspects of this task.
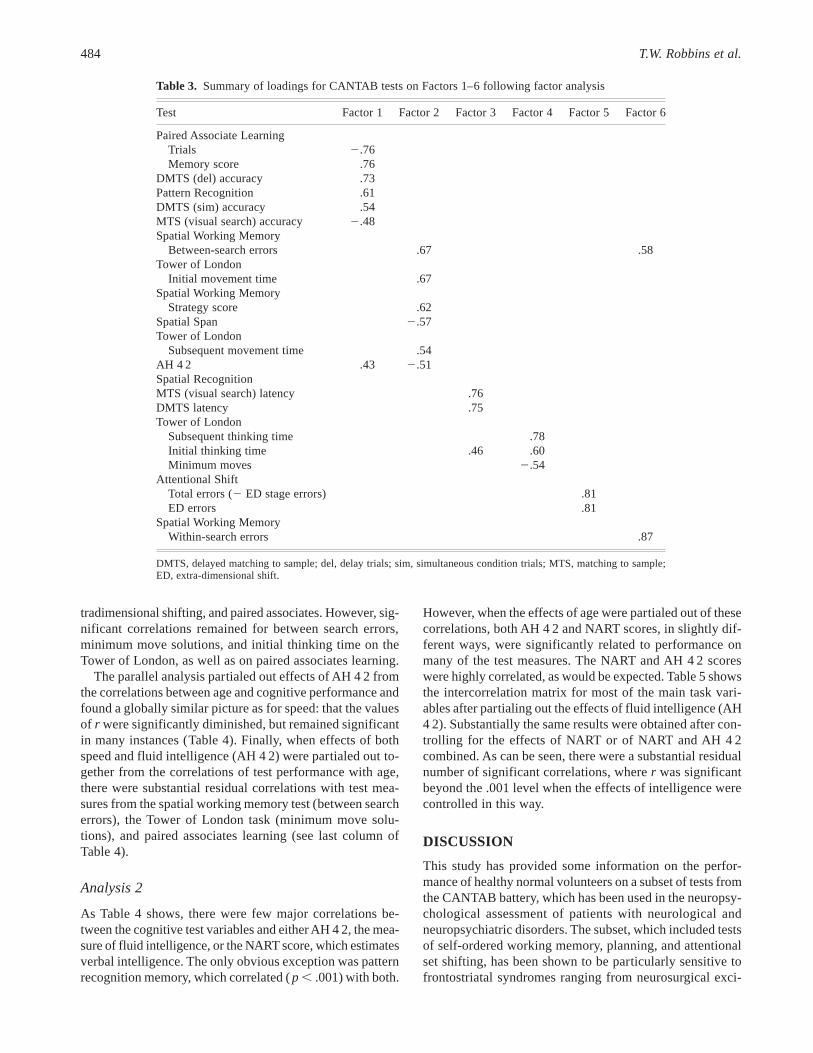
The second factor analysis incorporated data not only fromthe tests of executive function described here, but also thoseof tests of visual memory and learning, together with visualsearch, that had been analyzed for a large (N 5 771) factoranalysis in a previous publication (Robbins et al., 1994).The resultant analysis forN5 215 is shown in Table 3 withonly loadings greater than .4 listed. Six factors were gener-ated, with eigenvalues of 5.93, 1.98, 1.60, 1.32, 1.16, and1.07, accounting cumulatively for 62.2% of the variance.Factor 1, as in the previous study, represents primarily vi-sual memory and learning functions, but with a contribu-tion from the perceptual encoding of visual material (MTSvisual search task). Factor 2 captures some of the varianceshown under Factor 1 (planning and executive function) inthe analysis shown in Table 2. Factor 3 loads mainly on la-tency measures for the Tower of London, MTS visual search,and delayed matching to sample and thus appears to repre-sent a speed of response factor. Factor 4 captures other as-pects of the executive and planning functions represented
Fig. 7. Tower of London test of planning. (a) Initial thinking time.(b) Subsequent thinking time. The data are from the full sample(see Table 1).
482 T.W. Robbins et al.
by Factor 1 in Table 2. Factor 5 represents attentional setformation and maintenance (total errors) and shifting (EDSerrors). Factor 6 seems equivalent to Factor 4 from the anal-ysis shown in Table 2. It should be noted that one of thevariables, spatial recognition score, did not load to any greatextent on any of the six factors, though it was highest forFactor 1 (.29) and Factor 2 (2.30). The measure of fluidintelligence (AH 4 2) loaded most highly on Factors 1 (vi-sual memory and learning) and 2 (planning and executivefunction). Loadings on Factors 3 to 6 were as follows:2.22,2.21, 2.18, and2.09. When age was added as a variableto this factor analysis, it loaded as follows across Factors 1to 6: 2.30, .06, .67, .32,2.11, and .18. Thus, by far thelargest loadings for age were with Factor 3, which loadshighly on latency measures such as initial movement timeand matching to sample, visual search reaction time.
Correlational Analyses
Two main analyses were conducted. Analysis 1 focused onthe interrelationships between the main test variables, age,and an index of speed of information-processing (choice re-action time for matching to sample between two visual stim-uli) (Downes et al., 1989; Robbins et al., 1994). This enableda test of two predictions derived from Salthouse’s (1985,1996) theory of cognitive aging (see Nettelbeck & Rabbitt,1992). We also analyzed the contribution of fluid intelli-gence (AH 4 2 scores) to the age-related correlations withspecific cognitive measures. Analysis 2 focused on the in-terrelationships of the various test variables after the effectsof age and intelligence had been partialed out to test thehypothesis of Duncan et al. (1995) concerning the equiva-
lence of tests of fluid intelligence to those sensitive to fron-tal lobe dysfunction.
Analysis 1
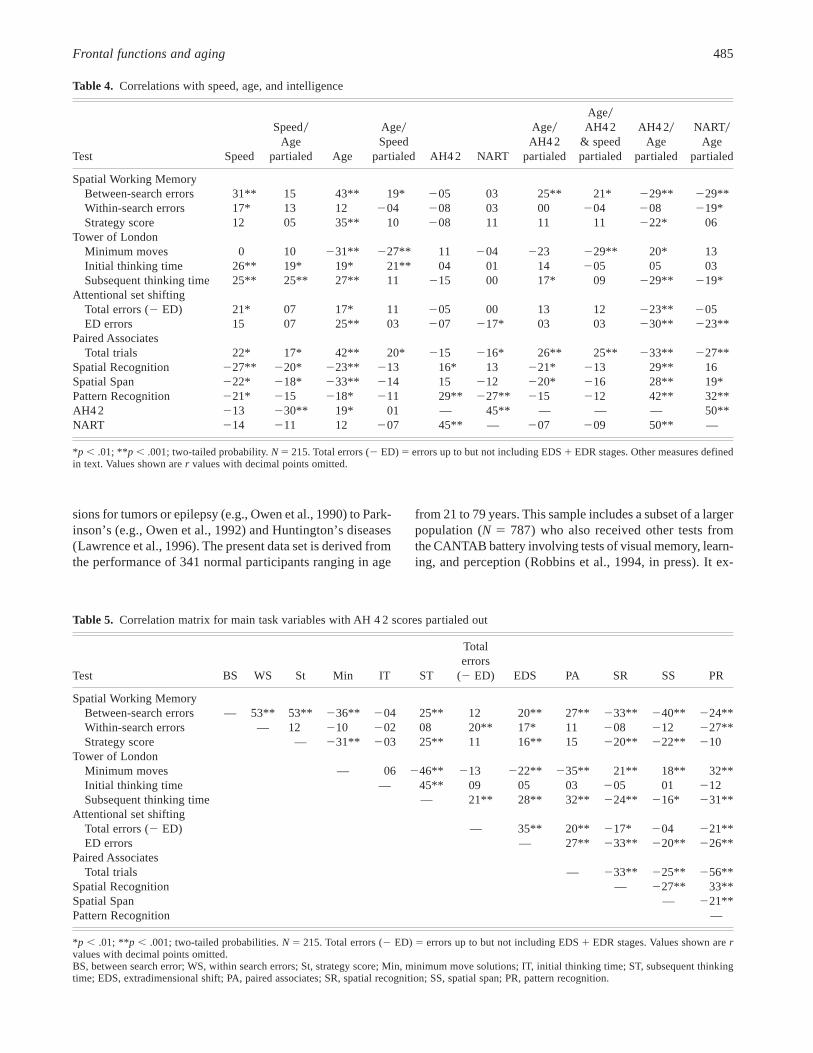
Table 4 shows the intercorrelation matrix for various testbattery variables and measures of age, speed (i.e., choicereaction time on the matching to sample task), and intelli-gence (AH 4 2 and NART scores). In order to reduce thenumber of comparisons, other variables relating to the match-ing to sample, visual search and delayed matching to sam-ple tasks were excluded.
Also shown in Table 4 are the effects of speed when age-related variance is controlled by partial correlation and theeffects of age and when speed-related variance is similarlypartialed out. According to Salthouse (1985, 1996) andNettelbeck and Rabbitt (1992):
If age only affects cognition by reducing information-processingspeed, then correlations between mental speed and perfor-mance on cognitive tasks should be unaffected by controllingfor (i.e., partialling out) the effects of chronological age. . . . Ifinformation-processing speed is the sole factor that mediatescorrelations between chronological age and cognitive perfor-mance on a particular skill, then partialling out the contribu-tions of individual differences in speed should eliminate thecorrelations between age and performance.(Nettelbeck andRabbit, 1992, p. 191)
The first prediction is upheld to some extent, except for thetests of spatial working memory and attentional set shift-ing. The second is also upheld, as age-related variance wasattenuated considerably by partialing out the effects of speed.Considering ther2 values, this attenuation of age-relatedvariance was by over 80% for spatial working memory, ex-
Table 2. Summary of loadings for CANTAB tests on Factors 1–4 followingfactor analysis
Test Factor 1 Factor 2 Factor 3 Factor 4
Spatial Working MemoryBetween-search errors .70 .57Strategy score .70
Tower of LondonMinimum moves 2.63
AH 4 2 2.58 2.46Tower of London
Initial movement time .56 .44Subsequent movement time .55 .46
Spatial Span 2.52Attentional Shift
Total errors (2 ED stage errors) .78ED stage errors .77
Tower of LondonInitial thinking time .89Subsequent thinking time .41 .73
Spatial Working MemoryWithin-search errors .91
Frontal functions and aging 483
tradimensional shifting, and paired associates. However, sig-nificant correlations remained for between search errors,minimum move solutions, and initial thinking time on theTower of London, as well as on paired associates learning.
The parallel analysis partialed out effects of AH 4 2 fromthe correlations between age and cognitive performance andfound a globally similar picture as for speed: that the valuesof r were significantly diminished, but remained significantin many instances (Table 4). Finally, when effects of bothspeed and fluid intelligence (AH 4 2) were partialed out to-gether from the correlations of test performance with age,there were substantial residual correlations with test mea-sures from the spatial working memory test (between searcherrors), the Tower of London task (minimum move solu-tions), and paired associates learning (see last column ofTable 4).
Analysis 2
As Table 4 shows, there were few major correlations be-tween the cognitive test variables and either AH 4 2, the mea-sure of fluid intelligence, or the NART score, which estimatesverbal intelligence. The only obvious exception was patternrecognition memory, which correlated (p , .001) with both.
However, when the effects of age were partialed out of thesecorrelations, both AH 4 2 and NART scores, in slightly dif-ferent ways, were significantly related to performance onmany of the test measures. The NART and AH 4 2 scoreswere highly correlated, as would be expected. Table 5 showsthe intercorrelation matrix for most of the main task vari-ables after partialing out the effects of fluid intelligence (AH4 2). Substantially the same results were obtained after con-trolling for the effects of NART or of NART and AH 4 2combined. As can be seen, there were a substantial residualnumber of significant correlations, wherer was significantbeyond the .001 level when the effects of intelligence werecontrolled in this way.
DISCUSSION
This study has provided some information on the perfor-mance of healthy normal volunteers on a subset of tests fromthe CANTAB battery, which has been used in the neuropsy-chological assessment of patients with neurological andneuropsychiatric disorders. The subset, which included testsof self-ordered working memory, planning, and attentionalset shifting, has been shown to be particularly sensitive tofrontostriatal syndromes ranging from neurosurgical exci-
Table 3. Summary of loadings for CANTAB tests on Factors 1–6 following factor analysis
Strategy score .62Spatial Span 2.57Tower of London
Subsequent movement time .54AH 4 2 .43 2.51Spatial RecognitionMTS (visual search) latency .76DMTS latency .75Tower of London
Subsequent thinking time .78Initial thinking time .46 .60Minimum moves 2.54
Attentional ShiftTotal errors (2 ED stage errors) .81ED errors .81
Spatial Working MemoryWithin-search errors .87
DMTS, delayed matching to sample; del, delay trials; sim, simultaneous condition trials; MTS, matching to sample;ED, extra-dimensional shift.
484 T.W. Robbins et al.
sions for tumors or epilepsy (e.g., Owen et al., 1990) to Park-inson’s (e.g., Owen et al., 1992) and Huntington’s diseases(Lawrence et al., 1996). The present data set is derived fromthe performance of 341 normal participants ranging in age
from 21 to 79 years. This sample includes a subset of a largerpopulation (N 5 787) who also received other tests fromthe CANTAB battery involving tests of visual memory, learn-ing, and perception (Robbins et al., 1994, in press). It ex-
Table 4. Correlations with speed, age, and intelligence
*p , .01; **p , .001; two-tailed probability.N 5 215. Total errors (2 ED) 5 errors up to but not including EDS1 EDR stages. Other measures definedin text. Values shown arer values with decimal points omitted.
Table 5. Correlation matrix for main task variables with AH 4 2 scores partialed out
*p , .01; **p , .001; two-tailed probabilities.N 5 215. Total errors (2 ED) 5 errors up to but not including EDS1 EDR stages. Values shown arervalues with decimal points omitted.BS, between search error; WS, within search errors; St, strategy score; Min, minimum move solutions; IT, initial thinking time; ST, subsequent thinkingtime; EDS, extradimensional shift; PA, paired associates; SR, spatial recognition; SS, spatial span; PR, pattern recognition.
Frontal functions and aging 485
tends that study by presenting data from the tests of executivefunction (in the case of the spatial working memory test,in considerably more detail than in the earlier study) andconsiders the structural relationship of these tests to theCANTAB battery as a whole.
The results also address two main questions. First, whethertests sensitive to frontal lobe and basal ganglia dysfunctionare especially sensitive to the effects of aging, as compared,for example, to tests in the CANTAB battery such as pat-tern recognition, which are more sensitive to damage of thetemporal lobes (cf. West, 1996). Second, whether any rela-tionship between particular tests of executive function andage can be attributed to general factors, such as information-processing speed (Nettelbeck & Rabbitt, 1992; Salthouse,1985, 1996) or fluid intelligence (Duncan et al., 1995).
Sensitivity of Cognitive Tests to Aging
Considering first the performance of the young group (,55 age group)versusthe other groups, the largest differ-ences were found on the test of attentional set shifting, spe-cifically at the extradimensional shift stage. This greatlymodified analogue of the WCST significantly differenti-ated the under 55 group from the 55 to 59 subgroup, and itis noteworthy that it has been shown previously to be par-ticularly sensitive to basal ganglia dysfunction (Downeset al., 1989; Lawrence et al., 1996; Owen & Robbins, 1993)and excisions of the frontal, though not temporal, lobe (Owenet al., 1991). The data also accord very well with analogousanalyses reported by Daigneault et al. (1992) for the rela-tively early decline in performance on the WCST in normalindividuals age 50 to 59 years. By contrast, there were nosignificant differences between the youngest group and theother age groups on tests of spatial span, spatial workingmemory, or spatial planning, as indexed by the Tower ofLondon test. The latter two tests have been found sensitiveto frontal lobe damage in a group study (Owen et al., 1990),as well as basal ganglia damage, although in qualitativelydifferent ways from the effects of frontal lobe excisions(Owen & Robbins, 1993). In a previous comparison of thelarger population (N5 787), subsuming the present partici-pants (Robbins et al., 1994, 1996), we found with the aid ofthe greater statistical power afforded by the larger samplethat there was a significant difference between the under 55and the 55 to 59 subgroups on the spatial working memorytest and also for two of the other tests from the present bat-tery (paired associates learning and delayed matching to sam-ple). The spatial working memory test is susceptible todamage to the temporal, as well as the frontal, lobes, al-though the deficits are milder and are not related to impair-ments in the use of strategy for temporal patients (Owenet al., 1995, 1996c). The earlier declines in performance onthe spatial working memory test in this study were also notclearly related to impaired use of strategy. An analogous re-sult has been reported by Daigneault et al. (1992) using thePetrides and Milner (1982) self-ordered memory task. More-over, while the paired associates task is also sensitive to both
forms of neurosurgical excision, the delayed matching tosample test is much more sensitive to temporal lobe thanfrontal lobe damage (Owen et al., 1995). Thus, it would bedifficult to claim that frontal functions are the only onessusceptible to decline in 55 year old normal individuals, al-though the present extradimensional shift deficit indicatesthat aspects of cognitive flexibility are already compro-mised by late middle age.
Some aspects of performance (e.g., spatial span; mini-mum move solutions on the Tower of London) held up re-markably well in the eldest (75–79) group, but other aspectsresembled the performance of individuals with frontal lobedamage. On the attentional set shifting test, there was a trendfor some of the participants from this group to fail on theearlier stages preceding the critical intradimensional and ex-tradimensional shift stages (Figure 2), but this failed to reachsignificance. The 75 to 79 age group, however, made sig-nificantly more errors than did the 70 to 74 year group atthe critical extradimensional shift stage, suggesting that thistest was especially sensitive to age-related decline. This isalso consistent with evidence of prefrontal alterations in afunctional activation study in the elderly of Wisconsin CardSort performance (Esposito et al., 1995).
This apparently selective decline in performance in themost elderly group was also evident in two other executivemeasures from the tests sensitive to frontal lobe dysfunc-tion. Thus, on the spatial working memory test this groupselectively lost the benefit for overall performance nor-mally provided by the use of a defined strategy (Figure 5).Specifically, although they showed the same tendency to em-ploy the strategy as for younger groups, the normally highcorrelation with memory performance, as measured bybetween-search errors was lost. This could be interpreted asa failure to implement strategy to the same degree as nor-mal. There was also a significant, selective lengthening inthe subsequent thinking time measure of the Tower of Lon-don Test of planning relative to all other age groups, whichis normally seen in patients with frontal lobe damage andinterpreted to reflect the greater need in this group to mon-itor and correct incompletely formulated plans (Owenet al., 1990). These signs of frontal lobe dysfunction mayreflect impairments in the executive monitoring of perfor-mance of relatively late onset in the normal elderly popu-lation. The analysis would, of course, be strengthened byevidence from repeated testing of the sample in a longitu-dinal design, which would avoid possible cohort effects; thisis planned in further work.
Relation to “Speed of Processing”
The results do not support a strong version of Salthouse’s(1985, 1996) theory of cognitive aging that age-related de-clines in performance can be reduced to a single underlyingdeficit in speed of information-processing. Specific tests ofthis hypothesis were made by considering the relationshipsbetween measures of speed of information-processing, age,and test performance. Consistent with Salthouse’s hypoth-
486 T.W. Robbins et al.
esis, partialing out the effects of age (Table 4) failed to re-move existing correlations between speed of processing andcertain CANTAB test measures. Moreover, controlling forthe effects of speed (Table 4) significantly reduced age-related variance in virtually all of the computerized test mea-sures. However, some of the data were inconsistent with astrong version of the Salthouse hypothesis. Specifically, con-trolling for age did render nonsignificant the correlationsbetween speed and either spatial working memory or atten-tional set-shifting performance, suggesting that varianceassociated with information-processing rate was not primar-ily associated with these tests. In addition, significant re-sidual correlations were evident for spatial working memory,certain measures of Tower of London performance, andpaired associates learning after partialing out the effects ofspeed by itself or in conjunction with a measure of fluidintelligence (AH 4 2). Thus, the relationship of age to per-formance on these tests was also not wholly secondary tochanges in information-processing rate. The persistent re-lationship between age and the test of visuospatial pairedassociates learning is consistent with data reported by Nettel-beck and Rabbitt (1992) and by Nettelbeck et al. (1996),even though they employed somewhat different indices ofspeed of information-processing. Our results are also com-patible with those reported by Rabbitt and Maylor (1991)and Baddeley (1996), which also suggest that certain exec-utive functions may be related to age, over and above anyrelationships with speed of processing and IQ.
Some caveats are, however, in order. A study by Roz-nowski (1993) made it clear that the assumption of linearrelationships between speed of processing and cognitive per-formance in the predictions of the Nettelbeck and Rabbitt(1992) study may not always hold, especially when perfor-mance reaches asymptotic levels. The second problem is thepossible lack of purity of some of the measures, for exam-ple, of speed of processing, fluid intelligence, and indeedchronological age itself (which may better be determinedby an hitherto undiscovered index of biological aging).Nevertheless, the apparent consistency of findings acrossdifferent tests and measures of speed of processing isencouraging.
Relevance to Neural Theories of Aging
With its emphasis on the rate of information-processing,Salthouse’s theory is relevant to the neuropsychologicalconcept of subcortical (or frontosubcortical) dementia(Cummings, 1986) and appears to be consistent with theburgeoning evidence for accelerated aging in frontostriatalstructures (see West, 1996). However, while some of ourpsychological evidence is consistent with this biological per-spective, we have no specific evidence to support the hy-pothesis that aging selectively implicates subcortical orfrontosubcortical circuitry. Thus, of the other tests for whichmarked declines in performance occur in the most elderlyof the two age groups (Robbins et al., 1994), the delayedmatching to sample test is particularly sensitive to tempo-
ral, but not frontal, lobe damage, and the paired associatestask is sensitive to damage to both the temporal and the fron-tal lobes, as well as the basal ganglia (Owen et al., 1993,1995).
Overall, our findings are compatible with the results ofstudies using a variety of neuroimaging modalities that agingis especially associated with structural, metabolic, and neuro-chemical changes in regions of the prefrontal cortex (Pan-tano et al., 1984; Riege et al., 1985; Waldemar et al., 1991),the striatum (Murphy et al., 1992; Riege et al., 1985; Rinneet al., 1993; Sawle et al., 1990; van Dyck et al., 1995), andalso the temporal lobes (Arrigada et al., 1992; Loessneret al., 1995; Pantano et al., 1984; Price et al., 1991). Thisposition is not very different from that reached by West(1996), after a comprehensive review of the available neuro-biological evidence.
Relationship of Executive Test PerformanceTo General (Fluid) Intelligence
An important part of the present report is the principal com-ponent analyses relating different aspects of performanceon the three tests of executive function to one another, to ameasure of fluid intelligence (performance on the AH 4 2intelligence test), and to performance on other tests fromthe CANTAB battery. A solution was found for the tests sen-sitive to frontal lobe dysfunction, suggesting that at leastfour factors are necessary to account for individual differ-ences in performance. The first factor, which captured load-ings from both the Tower of London task and the test of selfordered spatial working memory, confirm the finding fromneuropsychological and functional neuroimaging studies thatthese tests have many common cognitive requirements(Owen et al., 1996a,b; Robbins, 1996). However, there weredifferences between the two tests on certain measures. Thus,some of the variance associated with the latency measuresloaded with the test of attentional set shifting and some(initial and subsequent thinking time) on a separate factor.This confirmed the impression, also gained from both neuro-psychological and neuroimaging studies (Owen et al.,1996b), that the Tower of London test has several cognitivecomponents.
The measures of strategy and performance accuracy(between-search errors) for the spatial working memory testwere closely related, as expected from previous studies(Owen et al., 1991). However, they also covaried with theminimum moves accuracy measure of the Tower of Londontest of planning, confirming that this factor loads highly onstrategic aspects of executive function. Some of the mem-ory requirements on the spatial working memory test itselfloaded separately (Factor 4), as would be expected of a testhaving separable mnemonic and executive components(Owen et al., 1996c; Robbins, 1996).
Performance on the test of attentional set shifting loadedmainly on an independent factor (Factor 2), only covaryingwith the measures of movement time. The relationship be-tween these seemingly very different variables may have
Frontal functions and aging 487
been observed because the movement-time measures pre-sumably index, to some degree, the speed of processing pro-cesses that do seem to account for much of the age-relatedperformance on the attentional set shifting test (Table 4).Nevertheless, it is striking that the test of attentional set shift-ing segregates so completely from the others in this battery.Consideration of the relationships with the overall CANTABbattery (Table 3) shows a similar independence from othertests. In a related analysis (Robbins et al., 1997), we foundthat the Hayling test of frontal lobe functioning (Burgess &Shallice, 1996a) is also independent from the present testsof executive function based on a factor analysis of patientsperforming tests in addition to the CANTAB battery. Thisanalysis showed that the traditional tests of frontal lobe func-tioning, such as cognitive estimates and verbal fluency, weremore related to the CANTAB Visual Memory tests than toany of the tests sensitive to frontal lobe dysfunction. How-ever, the Brixton test of spatial anticipation, a spatial setformation and shifting task (Burgess & Shallice, 1996b),did load with accuracy measures from the Tower of Londonprobably because of the contribution of such set shifting func-tions to efficient problem solving (Robbins et al., 1997).
These patterns of intercorrelations of measures, from ex-ecutive and nonexecutive tests, which show some cluster-ing but also considerable independence among the differentexecutive test measures, are not dissimilar to the observa-tions of other investigators who employed different batter-ies (Baddeley, 1996; Burgess, in press; Lehto, 1996). Forexample, the EDS errors score correlated with Tower of Lon-don performance to a lesser extent than did pattern recog-nition performance and also loaded on measures other thanthose related to planning on the factor analyses shown inTables 2 and 3. On the other hand, spatial working memoryscores were quite closely related to Tower of London per-formance. Overall, these patterns support the conclusion thatexecutive functions are diverse, being probably governedby different psychological, as well as neural, structures—an“executive committee” rather than an “homunculus,” as Bad-deley (1996) put it. Their common dependence on the in-tegrity of frontal lobe functioning does not contradict thisconclusion, as the prefrontal cortex itself is an extensive andheterogeneous anatomical structure, with specific connec-tions to many other brain structures, both cortical and sub-cortical (Pandya & Yeterian, 1995; see Robbins, 1996).
This heterogeneity is gradually being related to discreteand different aspects of executive function using evidenceof selective lesions of different parts of the prefrontal cor-tex in monkeys (Dias et al., 1996); evidence of differentstages of memory processing mediated by different por-tions of the prefrontal cortex based on findings from func-tional neuroimaging studies (Owen et al., 1996a; Petrides,1989, 1996); and evidence of lateralization of prefrontal cor-tical function in humans (Shallice et al., 1994; Tulvinget al., 1994).
The hypothesis that executive processes can be distin-guished from processes that may depend on dedicated pos-terior cortical “modules” is also supported by other aspects
of the factor analyses conducted here. Thus, the measure offluid intelligence, AH 4 2 performance, loaded on both theplanning0spatial working-memory factor and the atten-tional set shifting factor, but was not related uniquely to ei-ther. When the entire battery was analyzed, the AH 4 2variable also showed considerable loadings on the factor tap-ping visual memory and learning (Factor 1, Table 3), againconfirming its utility as an index of general intelligence butfurther showing the distinctive nature of some of the mea-sures of the executive test battery. This is substantiated bythe demonstration that, when considered separately, perfor-mance on the AH4 2 correlated significantly with a test in-sensitive to frontal lobe damage, pattern recognition, andalso paired associates learning. However, as Table 4 makesclear, when the effect of age is partialed out of the relation-ship between performance on the computerized tests andthe NART and AH 4 2 scores, both of the latter are signifi-cantly related to a number of the measures, consistent withthe factor analyses discussed above.
Overall, this study has provided detailed information froma large sample of normal volunteers on a battery of neuro-psychological tests that has already been shown to be use-ful in the assessment of brain damaged and psychiatricpatients. The data support evidence from other neuro-psychological and neuroimaging studies of the specificityof some of these tests in measuring different aspects ofexecutive function and also contribute to cognitive theoriesof aging by providing an important neuropsychologicalperspective.
ACKNOWLEDGMENTS
The work was supported by a Programme Grant from the WellcomeTrust to T.W. Robbins, B.J. Everett, A.C. Roberts, B.J. Sahakian,and by the Nuffield Foundation. We thank C. Brennard, J. Hunter,J. Iddon, M. Robson, and J. Swain for assistance and for the vol-unteers taking part. We also thank C. van Dyck for discussion.A.D.L. held an MRC Studentship.
REFERENCES
Abas, M.A., Sahakian, B.J., & Levy, R. (1990). Neuropsycholog-ical deficits and CT scan changes in elderly depressives.Psy-chological Medicine, 20, 507–520.
Arrigada, P.V., Marzloff, B.A., & Hyman, B.T. (1992). Distribu-tion of Alzheimer-type pathologic changes in nondemented el-derly individuals matches the pattern in Alzheimer’s disease.Neurology, 42, 1681–1688.
Baddeley, A.D. (1996). Exploring the central executive.QuarterlyJournal of Experimental Psychology, 49A, 5–28.
Beats, B.C., Sahakian, B.J., & Levy, R. (1996). Cognitive perfor-mance in tests sensitive to frontal lobe dysfunction in the el-derly depressed.Psychological Medicine, 26, 591–603.
Benton, A.L. & Hamsher, K. deS. (1976).Multilingual aphasiaexamination. Iowa City: University of Iowa.
Burgess, P.W. (1997). Theory and methodology in executive func-tion research. In P. Rabbitt (Ed.),Methodology of frontal andexecutive functions, (pp. 81–111). Hove: Psychology Press.
488 T.W. Robbins et al.
Burgess, P.W. & Shallice, T. (1996a). Response suppression, ini-tiative and strategy use following frontal lobe lesions.Neuro-psychologia, 34, 263–272.
Burgess, P.W. & Shallice, T. (1996b). Bizarre responses, rule de-tection and frontal lobe lesions.Cortex, 32, 241–259.
Cummings, J.L. (1986). Subcortical dementia: Neuropsychology,neuropsychiatry and pathophysiology.British Journal of Psy-chiatry, 149, 682–697.
Daigneault S., Braun, C.M.J., & Whitaker, H. (1992). Early effectsof normal aging on perseverative and non-perseverative pre-frontal measures.Developmental Neuropsychology, 8, 99–114.
Dias, R., Roberts, A., & Robbins, TW. (1996). Dissociation in pre-frontal cortex of affective and attentional shifts.Nature, 380,69–72.
Downes, J.J., Roberts, A.C., Sahakian, B.J., Evenden, J.L., & Rob-bins, T.W. (1989). Impaired extra-dimensional shift perfor-mance in medicated and unmedicated Parkinson’s disease:Evidence for a specific attentional dysfunction.Neuropsychol-ogia, 27, 1329–1344.
Elliott, R., McKenna, P.J., Robbins, T.W., & Sahakian, B.J. (1995).Neuropsychological evidence for fronto-striatal dysfunction inschizophrenia.Psychological Medicine, 25, 619–630.
Esposito, G., Kirkby, B.S., Van-Horn, J.D., Weinberger, D.R., &Berman, K.F. (1995). Different pathophysiological mecha-nisms of altered Wisconsin card sort performance in schizo-phrenics and elderly normal subjects.Society for NeuroscienceAbstracts, 297, 16.
Heim, A. (1968).The AH-4 IQ Test. Slough, NFER-Nelson.Hughes, C., Russell, J., & Robbins, T.W. (1994). Evidence for ex-
ecutive dysfunction in autism.Neuropsychologia, 32, 477–492.
Joyce, E.M. & Robbins, T.W. (1991). Frontal lobe function in Kor-sakoff and non-korsakoff alcoholics: Planning and spatial work-ing memory.Neuropsychologia, 29, 709–723.
Kullback, S. (1968).Information theory and statistics. New York:Dover.
Lawrence, A.D., Sahakian, B.J., Hodges, J.R., Rosser, A.E., Lange,K.W., & Robbins, T.W. (1996). Executive and mnemonic func-tions in early Huntington’s disease.Brain, 119, 1633–1645.
Lehto, J. (1996). Are executive function tests dependent on work-ing memory capacity?Quarterly Journal of Experimental Psy-chology, 49A, 29–50.
Loessner, A., Alavi, A., Lewandrowski, K.-U., Mozeley, D., Souder,E., & Gur, R.E. (1995). Regional cerebral function determinedby FDG–PET in healthly volunteers: Normal patterns andchanges with age.Journal of Nuclear Medicine, 36, 1141–1149.
Milner, B. (1963). Effects of different brain lesions on card sort-ing: The role of the frontal lobes.Archives of Neurology, 9,100–110.
Milner, B. (1971). Interhemispheric differences in the localisationof psychological processes in man.British Medical Bulletin,27, 272–277.
Murphy, D.G.M., DeCarli, C., Schapiro, M.B., Rapoport, S.I., &Horwitz, B. (1992). Age-related differences in volumes of sub-cortical nuclei, brain matter, and cerebrospinal fluid in healthymen as measured with magnetic resonance imaging.Archivesof Neurology, 49, 839–844.
Nelson, H.E. (1982).National Adult Reading Test (NART) test man-ual. Windsor: NFER-Nelson.
Nettelbeck, T. & Rabbitt, P.M.A. (1992). Aging, cognitive perfor-mance and mental speed.Intelligence, 16, 189–205.
Nettelbeck, T., Rabbitt, P.M.A., Wilson, C., & Batt, R. (1996). Un-coupling learning from initial recall: The relationship betweenspeed and memory deficits in old age.British Journal of Psy-chology, 87, 593–607.
T.W. (1990). Planning and spatial working memory followingfrontal lobe lesions in man.Neuropsychologia, 28, 1021–1034.
Owen, A.M., Beksinska, M., James, M., Leigh, P.N., Summers,B.A., Quinn, N.P., Sahakian, B.J., & Robbins, T.W. (1993). Vi-suospatial memory deficits at different stages of Parkinson’sdisease.Neuropsychologia, 31, 627–644.
Owen, A.M., Doyon, J., Petrides, M., & Evans, A.C. (1996b). Plan-ning and spatial working memory: A positron emission tomog-raphy study in humans.European Journal of Neuroscience, 8,353–364.
Owen, A.M., Evans, A.C., & Petrides, M. (1996a). Evidence for atwo-stage model of spatial working memory processing withinthe lateral frontal cortex: A positron emission tomography study.Cerebral Cortex, 6, 31–38.
Owen, A.M., James, M., Leigh, P.H., Summers, B.A., Marsden,C.D., Quinn, N.P., Lange, K.W., & Robbins, T.W. (1992).Fronto-striatal cognitive deficits at different stages of Parkin-son’s disease.Brain, 115, 1727–1751.
Owen, A.M., Morris, R.G., Sahakian, B.J., Polkey, C.E., & Rob-bins, T.W. (1996c). Double dissociations of memory and exec-utive functions in working memory task following frontal lobeexcision, temporal lobe excisions or amygdala-hippocam-pectomy in man.Brain, 119, 1597–1615.
Owen, A.M. & Robbins, T.W. (1993). Comparative neuropsychol-ogy of parkinsonian syndromes. In P. Wolters & E. Ch. Scheltens(Eds.),Mental dysfunction in Parkinson’s disease(pp. 221–242).Amsterdam: Vrieje University Press.
Owen, A.M., Roberts, A.C., Polkey, C.E., Sahakian, B.J., & Rob-bins, T.W. (1991). Extra-dimensional versus intradimensionalset shifting performance following frontal lobe excision, tem-poral lobe excision or amygdalo-hippocampectomy in man.Neuropsychologia, 29, 993–1006.
Owen, A.M., Sahakian, B.J., Semple, J., Polkey, C.E., & Robbins,T.W. (1995). Visuospatial short term recognition memory andlearning after temporal lobe excisions, frontal lobe excisionsor amygdala-hippocampectomy in man.Neuropsychologia, 33,1–24.
Pandya, D.P. & Yeterian, E.H. (1995). Morphological correlationsof human and monkey frontal lobe. In A.E. Damasio, H. Dam-asio, & Y. Christen (Eds.),Neurobiology of human decision-making(pp. 13–46). New York: Springer.
Pantano, P., Baron, J.-C., Lebrun-Grandié, P., Duquesnoy, N.,Bousser, M-G., & Comar, D. (1984). Regional cerebral bloodflow and oxygen consumption in human aging.Stroke, 15, 635–641.
Petrides, M. (1989). Frontal lobes and memory. In F. Boller & J.Grafman (Eds.),Handbook of neuropsychology(Vol. 3, pp. 75–90). Amsterdam: Elsevier.
Petrides, M. (1996). Specialized system for the processing of mne-monic information within the primate prefrontal cortex. Pro-ceedings of the Royal Society of London B, 351, 1455–1462.
Petrides, M. & Milner, B. (1982). Deficits on subject-ordered tasksafter frontal- and temporal lobe lesions in man.Neuropsychol-ogia, 20, 249–262.
Frontal functions and aging 489
Price, J.L., Davies, P.B., Morris, J.C., & White, D.L. (1991). Thedistribution of tangles, plaques, and related immunohistochem-ical markers in healthy aging and Alzheimer’s disease.Neuro-biology of Aging, 12, 295–312.
Rabbitt, P.M.A. & Maylor, E. (1991). Investigating models of hu-man performance.British Journal of Psychology, 82, 259–290.
Riege W.H., Metter, E.J., Kuhl, D.E., & Phelps, M.E. (1985). Brainglucose metabolism and memory functions: Age decrease infactor scores.Journal of Gerontology, 40, 459–467.
Rinne, J.O., Hietala, J., Ruotsalainen, U., Sako, E., Laihinen, A.,Nagren, K., Lehikoinen, P., Oikonen, V., & Syvalahti, E. (1993).Decrease in human striatal dopamine D2 receptor density withage: A PET study with [11C] raclopride.Journal of CerebralBlood Flow Metabolism, 13, 310–314.
Robbins, T.W. (1977). A critique of the methods available for themeasurement of locomotor activity. In L.L. Iversen, S.D. Iversen,& S.H. Snyder (Eds.),Handbook of psychopharmacology(Vol.7, pp. 37–82). New York: Plenum.
Robbins, T.W. (1996). Dissociating executive functions of the pre-frontal cortex.Philosophical Transactions of the Royal Societyof London B, 351, 1463–1471.
Robbins, T.W., James, M., Owen, A., Sahakian, B.J., McInnes, L.,& Rabbitt, P.M. (1994). Cambridge Neuropsychological TestAutomated Battery (CANTAB): A factor analytic study of alarge sample of normal elderly volunteers.Dementia, 5, 266–281.
Robbins, T.W., James, M., Owen, A.M., Sahakian, B.J., McInnes,L., & Rabbitt, P. (1997). A neural systems approach to the cog-nitive psychology of ageing using the CANTAB battery. In P.Rabbitt (Ed.),Methodology of frontal and executive function(pp. 215–235). Hove: Erlbaum.
Roberts, A., Everitt, B.J., & Robbins, T.W. (1988). Extra- and intra-dimensional shifts in man and marmoset.Quarterly Journal ofExperimental Psychology, 40B, 321–342.
Roznowski, M. (1993). Measures of cognitive processes: The sta-bility of other psychometric and measurement properties.In-telligence, 17, 361–388.
Sahakian, B.J., Downes, J.J., Roberts, A.C., Philpot, M., Levy, R.,& Robbins, T.W. (1990). Preserved attentional function and im-paired mnemonic function in dementia of the Alzheimer type.Neuropsychologia, 28, 1197–1213.
Sahakian, B.J., Elliott, R., Low, N., Mehta, M., Clark, R.T., &Pozniak, A.L. (1995). Neuropsychological deficits in tests ofexecutive function in asymptomatic and symptomatic HIV-1seropositive men.Psychological Medicine, 25, 1233–1246.
Sahakian, B.J., Morris, R.G., Evenden, J.L., Heald, A., Levy, R.,Philpot, M., & Robbins, T.W. (1988). A comparative study ofvisuo-spatial memory and learning in Alzheimer-type demen-tia and Parkinson’s disease.Brain, 111, 695–718.
Sahgal, A., Sahakian, B.J., Robbins, T.W., Wright, C., Lloyd, S.,
Cook, J.H., McKeith, I., Disley, J.C.A., Eagger, S., Bodding-ton, S., & Edwardson, J.A. (1991). Detection of memory andlearning deficits in Alzheimer’s disease using the CambridgeNeuropsychological Test Automated Battery.Dementia, 2, 150–158.
Sahgal, A., Lloyd, S., Wray, C.J., Gallaway, P.H., Robbins, T.W.,Sahakian, B.J., McKeith, I.G., Cook, J.H., Disley, J.C.A., &Edwardson, J.A. (1992). Does visuospatial memory in Alz-heimer’s disease depend on the severity of the disorder?Inter-national Journal of Geriatric Psychiatry, 7, 427–436.
Salthouse, T.L (1985).Theoretical perspectives on cognitive aging.Hillsdale, NJ: Erlbaum.
Salthouse, T.L. (1996). Constraints on theories of cognitive aging.Psychonomic Bulletin & Review, 3, 287–299.
Sawle, G.V., Colebatch, J.G., Shah, A., Brooks, D.J., Marsden, C.D.,& Frackowiak, R.J.S. (1990). Striatal function in normal aging—implications for Parkinson’s disease.Annals of Neurology, 28,799–804.
Shallice, T. (1982). Specific impairments of planning. Philosoph-ical Transactions of the Royal Society of London B, 298, 199–209.
Shallice, T. & Evans, M.E. (1978). The involvement of the frontallobe in cognitive estimation.Cortex, 14, 294–303.
Shallice, T., Fletcher, P., Frith, C.D., Grasby, P., Frackowiak, R.S.J.,& Dolan, R. (1994). Brain regions associated with acquisitionand retrieval of verbal episodic memory.Nature, 368, 633–635.
Tranel, D., Anderson, S.W., & Benton, A. (1994). Development ofthe concept of “executive function” and its relationships to thefrontal lobes. In F. Boller & J. Grafman (Eds.),Handbook ofneuropsychology(Vol. 9, pp. 125–148). Amsterdam: Elsevier.
Tulving, E., Kapur, S., Markowitsch, H., Craik, F.I.M., Habib, S.,& Houle, S. (1994). Hemispheric coding0retrieval asymmetryin episodic memory: Positron emission tomography findings.Proceedings of the National Academy of Sciences U.S.A., 91,2012–2025.
van Dyck, C.H., Seibyl, J.P., Malison, R.T., Laruelle, M., Wallace,E., Zoghbi, S.S., Zea-Ponce, Y., Baldwin, R.M., Charney, D.S.,Hoffer, P.B., & Innis, R.B. (1995). Age-related decline in stri-atal dopamine transporter binding with iodine-123-b-CITSPECT.Journal of Nuclear Medicine, 36, 1175–1181.
Vendrell, P., Junqué, C., Pujol, J., Angles Jurado, M.A., Molet, J.,& Grafman, J. (1995). The role of prefrontal regions in the Strooptask.Neuropsychologia, 33, 341–352.
Waldemar, G., Hasselbalch, S.G., Anderson, A.R., Delecluse, F.,Petersen, P., Johnsen, A., & Paulson, O.B. (1991).99mTc-d,l-HMPAO and SPECT of the brain in normal aging.Journal ofCerebral Blood Flow and Metabolism, 11, 508–521.
West, R.L. (1996). An application of prefrontal cortex functiontheory to cognitive aging.Psychological Bulletin, 120, 272–292.