1 r . - .C. . 3 445b 0323278 5 0 R N L-2304 Health and Safety P,, Y A STUDY OF THE DISTRIBUTION AND EXCRETION OF URANIUM IN MAN i L AN INTERIM REPORT S, R. Bernard E, G, Struxness OAK RIDGE NATIONAL LABORATORY UNION CARBIDE NUCLEAR COMPANY m OPERATED BY A Division of Union Carbide and Carbon Corporation POST OFFICE BOX X OAK RIDGE, TENNESSEE UNCLASSIFIED
Transcript
1 r . - . C . .
3 445b 0323278 5 0 R N L-2304
Health and Safety P,, Y
A STUDY OF THE DISTRIBUTION AND
EXCRETION OF URANIUM IN M A N
i
L
A N INTERIM REPORT
S, R. Bernard E, G, Struxness
OAK RIDGE NATIONAL LABORATORY
UNION CARBIDE NUCLEAR COMPANY
m
OPERATED BY
A Division of Union Carbide and Carbon Corporation
POST OFFICE BOX X OAK R I D G E , T E N N E S S E E
UNCLASSIFIED
i
c
UEJCLASSlFIED
Contract No. W-7405-eng-26
ORNL Report No. 2304
A STUDY OF TEE DISTRIBUTION AND EXCFETION OF URANIUM I N MAR
AN INTERIM REPORT
Report Written By: S , R. Bernard and E. G. Struxness
Work Done By: S. R. Bernard W:E. Lot2 B, R. Fish J. C. Gallimore B. L. Harless J. R. Muir C. S. Banks M. B. Edwards , -
G. W. Royster, Jr. N. L. Gillum __ ~
G. J. Dcdson
i MARTIN MARIETTAENERGY SVSYEMS LIERARIFI Date Issued
i i 3 4456 0 3 2 3 2 7 8 5 ,
Operated By I - I OAK RIDGE NATIONAL LABORATORY
UNION CARBIDE NUCLEAR COMPANY A Division of Union Carbide and Carbon Corporation
Post Office Box X Oak Ridge, Tennessee
UNCLASSIFIED
UNCLASSlFIED -ii- ORNL - 23 04 Health and Safety TID-4500 (13th ea.)
INTERNAL DISTRIBUTION
1. C. E. Center 2. Biology Library .3. Health Physics Library
% -5 . Central Research Library 6. Reactor Experimental
F
Engineering Library 7-26 Laboratory Records Department
27. Laboratory Records, ORNL R.C, 28. A. M. Weinberg 29. L. '8. Emlet (K-25) 30. J. P. Murray (Y-12) 31. J. A. Swartout 32. E. H. Taylor 33. E. D. Shipley 34. K. Z. Morgan 35. M. L. Nelson 36. W. H. Jordan 37. S. J. Cromer 38. C. P. K e i m 39- J. H. Frye, Jr. 40. G. E. Boyd 41. R. S. Livingston 42. S. C. Lind 43. F. Lo Culler 44. A. H. Snel l 45. A. Hollaender
46. M. T. Kelley 47. T. A. Lincoln 48. A. S. Householder 49. C. S. Harrill 50. C. E o Winters 51. D. W. Cardwell 52. J. A. Lane 53. E. E. Anderson 54. D. D. Cowen 55. R. A. Charpie 56. C. E. Cl i f ford 57. M. J. Skinner 58. R. R. Dickison 59. L. H. Barker 60. K. A. Fowler 61. L. C. Emerson 62. J. C. Hart 63. W. E. Lotz
64-76. S. R. Bernard 77. B. R. Fish 78. G. W. Royster, Jr. 79. J. R. Muir 80. M. B. Edwards 81. E. G. Struxness 82. ORNL - Y-12 Technical Library,
Document Reference Section
EXTERNAL DISTRIBUTION
83. R. F. Bacher, California I n s t i t u t e of Technology 84, Division of Research and Development, AEC, OR0 85. A, P. Huber, Union Carbide Nuclear Company (K-25 Plant) 86. R. G. Jordan, Union Carbide Nuclear Company ( C - 3 1 Plant) 87. Go A. Strasser, Union Carbide Nuclear Company (Y-12 Plant) 88. W. C. Moore, Union Carbide Nuclear Company (Y-12 Plan t ) 89. W. L. Richardson, Union Carbide Nuclear Company (K-25 Plan t ) 90. G. H. Dykes, Union Carbide Nuclear Company (K-25 Plan t ) 91. E. C. Cain, Union Carbide Nuclear Company (C-31 Plant ) 92. W. A. Pf'eiler, Union Carbide Nuclear Company (Y-12 Plant) 93. H. F. Henry, Union Carbide Nuclear Company (K-25 Plan t ) 94. C. R. Sullivan, Jr., Union Carbide Nuclear Company (Y-12 Plan t ) 95. Joseph Lyon, Union Carbide Nuclear Company (K-25 Plant) 96. Neal Ward, Union Carbide Nuclear Company (C-31 Plant) 97. R. C. Baker, Union Carbide Nuclear Company (C-31 Plant )
UNCLASSIFIED -iii-
98. D. L. Stoddard, Union Carbide Nuclear Company (K-25 Plant) 99. A. L. Becher, Union Carbide Nuclear Company (K-25 Plant) 100. A. D. Kammer, University of Rochester \ i
101. C. E. Dunham, Atomic Energy Commission, Washington 102. W. D. Claw, Atomic Energy Commission, Washington 103. C. S. Shoup, Atomic Energy Commission, Oak Ridge
\
104-675. Given distribution as shown in TID-4500 (13th ea.) under Health and Safety category (100 copies - OTS) . i
c
UNCLASSIFIED
y
-1-
INTRODUCTION
I
1.1 Purpose of this Report
This report fulfills two purposes. It defines the problems with which
this project is concerned q d tells of the progress made in the investigation
of these problems.
1.2 Statement of the Problem
The problem is concerned with the long-term radiological effect that en-
riched uranium may have upon production employees who have inhaled dusts, mists
and fumes of uranium in the processing and fabrication of this material. It
has been found that a certain number of these production employees have enriched
uranium stored in their bodies. These findings are based on extensive studies
1 - 7. of the air they breathe and analyses of their excreta - urine and feces Samples of airborne uranium taken in the vicinity of their work show that variable
concentrations exist. Also, it has been found that the median particle size of -
these aerosols are in the range bf likely penetration and retention in the lung.
Samples of urine reveal high and variable concentrations of uranium and, when the
employee is reassigned to work in other than uranium processing areas, these con-
centrations will drop to about one-half in a period of one month; from then on they
decrease more slowly over longer periods of time 8 All these data point to the
conclusion that enriched uranium is stored in the bodies of these employees and
is being slowly eliminated.
There is a possibility that long-term biological effects may occur since
enriched uranium is radioactive and long-term storage of radioactive substances
-2-
i n the body is known t o produce serious and deleterious e f fec ts . The severi ty
of these e f fec ts depends upon the absorbed radiation dose i n the organs and
t issues .
forewarn of the e f fec ts of radiation overexposure. Only the biological e f fec t
There are no sensi t ive biological indicators yet which can serve t o
reveals i t s e l f and tha t , unfortunately, does not appear u n t i l it is too l a t e t o
do anything about it.
This 'effect may be said t o be a shortening of l i f e span brought about by
a l te ra t ions i n the normal metabolic processes induced by radiation. The a l t e r a -
t ions i n metabolic processes are not understood; f o r tha t matter, nei ther a re
the fundamental mechanisms i n normal metabolic processes. It i s believed by
some investigators that an adequate understanding of these processes is needed
before an adequate explanation of these a l te ra t ions can be made . 9
Figure 1 i l l u s t r a t e s some of the a l t e r ed metabolic processes. Here, radium
was the source of radiation. T h i s material gained entrance by ingestion in to the
body of two watch-dial painters.. Both have died; one, 12 years after the beginning
of employment and the other, 17 years later.
years.
Their ages at death were 32 and 48
Similar occurrences have been found among other radium workers.
The above ef fec ts can be reproduced i n the laboratory by having small animals
ingest o r inhale radium and other radioactive materials.
demonstrated the f ac t t ha t a l te red metabolic processes become more pronounced i f
the t o t a l absorbed t i s sue dose increases. Since the t o t a l absorbed t i s sue dose i s
Such experiments have
a physical index of the biological e f fec t , it i s c l ea r t ha t t h i s must be measured
and limited i n order t o prevent a reoccurrence of the experience i n the radium
industry .
.- .
- 3-
A preliminary estimate of the t o t a l absorbed t i s sue dose in a few Y-12
employees has been made.
uranium excreted, then determining the corresponding absorbed t i s sue dose.
Some uncertainty ex is t s i n the method of converting cumulative uranium in to
uni ts of in te rna l radiation exposure. Also, th; extraneous contamination of
This was accomplished by cumulating the amount of
urine samples ra ises the estimate of in te rna l exposure.
the dis t r ibut ion and excretion of uieanium is needed t o validate t h i s method of
More information on
estimating in te rna l radiation dose.
urine samples tha t are known t o be f ree of contamination from external sources.
Moreover, e f fo r t s must be made t o col lect
1.3 History of the Project
An arrangement between the Y:-12 Health Physics Department and the
Department of Neurosurgery at
with the assistance of Doctor
.. the U n ive rs it y of Roches t e s . of both groups and encouraged
., .-.. Massachusetts General Hospital w a s established
Harold C. Hodge of the Atomic Energy Project at
Doctor Hodge was familiar with the a c t i v i t i e s
the formation of a joint undertaking t o obtain
informat ion bearing on the above problem. A f t e r preliminary discussions
between r@presentatives ‘of the Y - 1 2 Health Physics Department and Doctor
W i l l i a m H. Sweet of Massachusetts General Hospital, a f i n a l agreement w a s
reached at a meeting called by Y-12 Management.
Management, Y - 1 2 Health Physics Department, ORNL Bealth Physics Division,
Representatives of Y-12
Massachusetts General Hospital, and the AEC Division of Biology and Medicine
were present a t the meeting.
-4 -
It was agreed tha t the Y-12 Health Physics Department would prepare
inject ion solutions and perform the ana ly t ica l work associated with t h i s joint
e f for t . Massachusetts General Hospital agreed t o select the patients, perform
the injections, and care f o r the pat ients during the period of study. A prelimi-
nary estimate of the number of pat ients t o be injected w a s made without much
deliberation. It was decided that six post-operative pat ients would receive
various doses of uranyl n i t r a t e hexahydrate, two pre-operative pa t ien ts would
receive the highest possible dose of uranyl n i t r a t e hexahydrate, and tha t a
similar scheme would be followed with ingections of uranium tetrachlor ide.
The obdect of the post-operative studies w a s t o determine the permissible
intravenous administration dose''. The pre-operative inject ions were t o provide
information on uptake of uranium i n tumorous t issue.
d i rec t in te res t t o Doctor Sweet i n his investigations of uranium as a f iss ionable
material useful i n the neutron capture therapy of brain tumors.
These objectives were of
P
Health Physics
in t e re s t s would be served by obtaining the data on d is t r ibu t ion and excretion
of uranium i n these patients.
N o f inanc ia l arrangements were made t o cover the specif ic costs of t h i s
cooperative project.
General Hospital within the framework of an ex is t ing contract and the cost of
The expenses at Boston were t o be borne by Massachusetts
preparing in jec t ion solutions and analyzing t i s sues and body f l u i d s was t o be
considered as an in tegra l par t of the Y-12 Health Physics program.
About a year a f t e r th i s cooperative arrangement w a s established, Y-12
Management requested Laboratory Management t o assume administrative and technical
responsibil i ty f o r t h i s project.
and technicians of the Y-12 Health Physics Department assigned t o t h i s project w e r e
t ransferred t o the €Iealth Physics Division of Oak Ridge National Laboratory.
Consequently, i n April, 1954, the health physicis ts
-5-
Y-12 Management, however, recognizing its in t e re s t i n t h i s research, consented
t o provide f inanc ia l support u n t i l such time as the uranium study w a s completed,
or u n t i l other arrangements were made. This arrangement has continued t o the
present.
The first pat ient w a s injected l a t e i n 1953. Since that time t en addi t ional
pat ients have been injected i n accordance with the or ig ina l plan, All expired
.
and many samples (biopsy and autopsy) have been collected and analyzed.
report covers t he r e su l t s of t he first eight post-operative administrations
Pat ients I through V I received intravenous i n Sections of hexavalent uranium (U(V1))
Pat ients VI1 and VI11 were administered te t rava len t uranium (U(1V)).
were injected under the care and supervision of Doctor W i l l i a m H. Sweet at the
Massachusetts General and Veterans Administration Hospitals i n Boston, A l l samples
(control and experimental) were pre-digested i n Boston and shipped t o Oak Ridge
f o r f i n a l analysis.
This
These pat ients
1.4 Objectives of the Project
T h i s project , inappropriately named "Project Boston" because of i t s associ-
1) t o a t ion w i t h in terested co-workers i n Boston, has the following objectives:
obtain human data on the d is t r ibu t ion and excretion of enriched uranium; 2) t o
determine by experimentation w i t h dogs, rats, and mice more precise data on the
deposition and di.stribution that a re impossible t o obtain from human studies;
3 ) t o determine the MPC (Maximum Permissible Concentration) value of enriched
uranium f o r NBS Handbook 52; and 4) t o develop a method f o r evaluating urinary
excretion i n terms of i t s d is t r ibu t ion i n the human body,
These objectives a re d i rec t ly concerned with the problem of hhman exposure
t o enriched uranium i n production plants where this material is handled,
these objectives a re reached, management should consider the poss ib i l i t y of ex-
tending t h i s study t o plutonium, thorium, and the c r i t i c a l f i s s i o n products,
When
-6-
METHODS AM) EXPERIIIIENTAL WORK
2,1 Selection and Care of Patients
The eight pa t ien ts selected f o r t h i s study were i n the terminal phase of severe i r revers ib le cen t r a l nervous system disease. Virtually a l l had bra in tumors of a inost nalignant type. The ages of t h e pa t ien ts were 26, 31, 34, 39, 47, 56, 60 and 63 years, and, aside from the cent ra l nervous system disease, they were i n qenerally good physical condition without de f in i t e evidence of other pathological processes.
A t the time of in jec t ion a l l but pa t ien ts 111 and V I 1 were i n coma and receiving the usual hospi ta l care consisting of frequent turning, skin care, gas t r i c tube feedings, catheter drainage and frequent t racheal suction, t he pa t ien ts had tracehotoniies ,,
Three of
The pa t ien ts who d i d not terminate during t h e two t o three week period following inject ion were t ransferred t o a nursing home where they could s t i l l be closely observed,
2 e 2 Administration' of Uranium
Preparation of' Eexava1en.t Injection Solution. Pure uranium oxide (U 0 ) 3 s was converted t o n i t r a t e (UO2(l10 by dissolving the oxide i n an excess of n i t r i c acid and evaporating t o drynesz e 3'!$!e resul t ing n i t r a t e c rys t a l s were dissolved i n d i s t i l l e d water and twice evaporated t o dryness t o eliminate f i n a l t r aces of n i t r i c acid. The crystals were then dissolved and di luted t o volume w i t h d i E t i l l e d water. The solution was assayed at t h i s point colorimetrically and by alpha counto desired quantity of n i t r a t e was then removed, placed i n a rubber sealed container and autoclaved f o r steri l i ty. autoclaved, Equal volumes of each were combined shor t ly before the beginning of each study an& the desired quantity removed f o r inject ion. were given at a pH of from 5.5 t o 6,0, Except i n the case of pat ient I, a l l in- jec t ion solutions were s imi la r ly prepared, I n t h i s case the uranium n i t r a t e was ' !
placed i n physiological s a l ine and adjusted t o the proper pH with sodium hydroxide and hydrochloric acid,
The
A 0,4 W sodium ace ta te solution w a s prepared and
All administrations
Preparation of Tetravalent Injection Solution. A spec ia l procedure was required t o prepare the te t ravalent uranium inject ion solut ion because of i t s i n s t a b i l i t y over an extended period, hexavalext u ran im i n the presence of oxygen,
Tetravalent uranium w i l l slowly oxidize t o
A 2 02, b o t t l e was washed, dried, degassed under partial vacuum, flushed with dry argon, and weighed, from the Stab19 Isotopes Division, were placed i n the b o t t l e , weighed. t o obtain the weight of t h e crystals after which it w a s sealed with a rubber seal, degassed t o remove oxygen from the in t e r s t i ce s ' of the crystals, and
\
Pure u ran im tetrachlor ide (ucl4) c rys ta l s , obtained The b o t t l e was then
fur ther flushed with dry argon,
-7-
A buf fer solut ion of 0,2 M ace t ic acid and 0 0 2 M sodium acetate a t a pH of 4.7 w a s prepared i n a f l a sk and refluxed f o r 24 hours. was complete and dwing cooling, the f l a s k was flushed with dry argon,, portion of the buffer solution was t ransferred t o another 2 o z o b o t t l e previously t reated t o remove oxygen. f o r s t e r i l i t y . Both bot t les , one containing UC14 c rys ta l s under argon atmosphere and the other containing the special ly prepared acetate buffer, were transported t o Boston by courier.
A f t e r refluxing A
The bottle‘was sealed with a rubber seal and autoclaved
Immediately p r io r t o injection, a measured volume of buffer solut ion w a s withdrawn in to a syringe and injected through the rubber seal in to the b o t t l e containing t h e Ucl4 c rys ta l s , Following gentle shaking of the b o t t l e and the syringe, t he c rys t a l s dissolved. Then a measured volume of the inject ion solution was withdrawn i n t o the syringe.
In jec t ion Procedureo The uranium was injected intravenously i n a l l t he pat ients , The procedure consisted of f i rs t s t a r t i n g zn’ intravenous normal sa l ine i n an antecubi ta l vein. extravasation, the uranium solut ion w a s injected over a period of 10 t o 1 5 seconds through t h e rubber intravenous tubing, I n the f i rs t pat ient t h i s w a s done through a metal 3-way stopcock, However, a small amount of the solut ion w a s l o s t because of leakage from the stopcock. In the second pat ient a glass _?-way stopcock was employed, but during the inject ion the glass s ide arm broke resu l t ing i n t h e loss of a small, but s ignif icant , amount of t h e solution, were made 3y inser t ing the syringe needle in to the rubber I , V , tubing, I n a l l cases the syringe was i r r iga t ed 4 o r 5 times with sa l ine from the I .V , b o t t l e pr ior t o i t s removal from the tubing,
After careful i’nspection t o preclude any poss ib i l i t y of
Thereafter, t he inject ions
Following t h e injection, the syring employed i n the administration w a s used t o del iver a rep l ica te volume of the inject ion solut ion t o a f lask f o r quantitative analysis , This procedure accounted f o r any volume er rors as a r e su l t of inaccurate markings on the syringe,
2.3 Collection of Specimens
Blood specimens of 1 t o 3 mil l i l i ters were taken by phlebotomy i n the arm not used f o r the uranium inject ion, specimens were taken; then at 12 hour intervals f o r several weeks, then a t 24 hour in te rva ls and, following t ransfer from the hospital , at 1 t o 3 week in t e r - vals unt I1 expirat ion,,
During the f i rs t 24 hours, hourly
For the determination of i n i t i a l bone uptake several bone biopsies were taken from the an ter ior t i b i a employing a 1/2 inch trephine through a small skin incision e
The ur ine samples were collected from indwelling catheters , During t h e first 24 hours they were collected at hourly intervals , o r more frequently if the output w a s great; thereaf te r a t 12 hour in te rva ls f o r 2 t o 4 weeks and f i n a l l y 12 hour samples at 1 t o 4 week intervals ,
,
All f e c a l specimens were collected during the time the pat ient remained I Z
under close observation i n the hospital.
During the period of collection of samples f o r uranium analysis numerous blood and urine specimens were taken f o r measurement pertinent t o indices of chemical toxici ty .
2,4 Preparation and Analysis of Specimens
Urine, Three 20 m i l l i l i t e r aliquots were removed from each specimen, when possible, and 20 m i l l i l i t e r s of concentrated n i t r i c acid were added t o each aliquot, These solutions were reduced t o dryness on a steam bath and shipped t o the Oak Ridge National. Laboratory f o r analysis.
Upon a r r i v a l a t the Laboratory 20 m i l l i l i t e r s of a hydrochloric-nitric acid solutictn ( l :3 proportions) were added t o each specimen b o t t l e and allowed t o stand u n t i l a l l the residue w a s i n solution. The resul t ing solution was careful ly rinsed w i t h 0.1 N n i t r i c a c i d in to a 100 m i l l i l i t e r beaker and evaporated t o dryness. This acid digestion was repeated f ive o r more times u n t i l a white residue resulted a t dryness, A f i n a l digestion w i t h 20 ml of n i t r i c acid f o r chloride destruction w a s carried out.
Following evaporation, the residue w a s dissolved i n 0,1 N n i t r i c acid Tr ip l ica te aliquots were removed from each vd;lumetric and di luted t o volume.
d i lu t ion f o r electrodeposition of the uranium and subsequent alpha counting, 11
Electrodeposition and alpha counting procedure is given beloy.:
1. Place cleaned s i lve r disc i n ce l l , assemble, and p ipe t te 20 m l of the proper oxalate-salt base solution in to the ce l l . The cell then shodd stand f ive minutes t o check f o r leaks, the c e l l EJAould be reassembled and checked again.
If leaks occur,
2, Pipet te the desired saaple aliquot i n to the c e l l , If the solution appears yellow or yellow-green, adjust t o blue o r blue-green w i t h ammonium hydsoxide
3a Add d i s t i l l e d water t o c e l l t o give t o t a l volume of 65 ml.
4. Connect c e l l t o power supply, turn on, and adjust the current
When the temperature reached 95' C, adjust t he current t o main-
t o 2 amperes,
5. t a i n 9 5 O f 2 O C and electrodeposit f o r one hour,
6. A t the end of one hour, disassemble the c e l l , dry s i l v e r disc (b lo t t ing only) and place i n marked envelope f o r counting room.
-9- Blood.
urine w i t h the exception of the f i n a l n i t r i c acid digestion. the sample w a s removed from the steam bath. The small quantity of acid and residue remaining was disssolved i n 20 milliliters of d i s t i l l e d water and t r i p - l i c a t e a l iquots were removed f o r electrodeposit ion and subsequent alpha counting.
The blood specimens were prepared i n the same manner as the A t near dryness,
Soft Tissue Specimens of Less than 2 G r a m s Wet Weight. Soft t i s sue specimens (biopsy or autopsy) were weighed and muffled i n platinum crucibles at 6000 C f o r 24 hours. The ash was dissolved i n 0.1 M n i t r i c acid and the e n t i r e volume analyzed by electrodeposit ion and alpha counting.
Feces, Bone, and Tissue Specimens Greater than 2 G r a m s Wet Weight. specimens were wet weighed and muffled i n platinum crucibles a t 6000 C f o r approximately 24 hours. bone t o insure complete organic destruction. The resu l t ing ash was weighed and analyzed f o r uranium using the aluminum ni t ra te-diethyl e ther extract ion procedure w i t h subsequent evaporation i n a s t a in l e s s s t e e l planchet f o r alpha counting12.
A l l
Additional time was required f o r several specimens of
RESULTS
3.1 Biopsy Findings
Blood - Uranium leaves the circulat ing blood stream rapidly. A log x log
graph (Figure 2) of blood measurements shows tha t within s i x minutes the blood v
contains only 0.007 per cent of the injected uranium per m l , of blood, a three-fold
reduction i n concentration i f 5,000 cc of blood are assumed. Assuming that
uranium penetrates the cap i l l a r i e s immediately a f t e r inject ion t o gain entry i n t o
5,000 cc of ex t race l lu la r f l u i d (ECF) space, and the concentration i n ECF equi l i -
brates w i t h t h a t i n blood (plasma), then the percent of injected dose/ml x lo4 m l
i s a measure of the concentration i n the body f l u i d spaces. The measured con-
centrations i n blood describe smooth curves during the first f i v e t o ten hours
a f t e r inject ion, but f luc tua te l a t e r , as the concentrations decrease t o low levels .
A c loser examination of these data reveals more f luc tura t ion at shorter in te rva ls
a f t e r in jec t ion when low doses a re administered (pa t ien ts I, I1 and.111) then when
high doses a re administered (pa t ien ts I V , V, V I , V I 1 and VIII).
more c lear ly shown i n Figure 3.
This point is
-10-
Bone - Uranium deposite i n bone short ly a f t e r injection. Biopsy samples - of bone taken at one-half hour following in jec t ion contained 7.6 per cent of
the injected dose per 7,000 grams of bone. In Table I, the percent of injected
dose per 7,000 grams of bone (biopsy samples) a r e l i s t e d f o r each pat ient . The
averages range from 0.5 t o 9.1 per cent.
administered U C l 4 , show the lowest (0.8) average deposit of uranium i n bone.
Pat ients V I 1 and V I I I , who were
Urine Excretion - There is a rapid clearance of uranium i n t o urine,
depending upon the valence and the mass of uranium injected.
the percent of injected dose accumulated i n ur ine i n the first 24-hours.
Table I1 shows
Note
Pat ients I - V I excrete an average of 69 per cent of the injected uranium while
Pat ients V I 1 and V I I I excrete only 18.5 per cent., A log x log graph of the
excretion r a t e s appears i n Figure 4.
hour correlates , i n the first four hours, w i t h the mass of uranium injected.
Excretion r a t e s rise t o a maximum a t h 3 1/2 hours when the l a rge r doses of
U(V1) and U(1V) a re injected.
V I , V I 1 and VIII) , less d i s t i n c t f o r the intermediate doses (15 mgms - IV and V ) ,
and not apparent f o r low doses ( 4 mgms - I, 11, and 111).
been achieved the leve ls of U(V1) begin t o decline and follow a l i n e a r path,
Some variat ion occurs, occasional high and low samples accompanying the decline.
The percent of injected dose excreted per 4
This r i s e i s d i s t i n c t for the high doses (50 mgms -
After the m a x i m u m has
It i s in te res t ing t o note that tfhese changes i n excretion r a t e s do not cor re la te
with blood levels .
Tetravalent uranium excretion rates , a f t e r they reach the m a x i q m , begin
t o follow the power function l a w . A t 200 hours, they depart from the power
function and decl ine more slowly. A t 400 hours the pa t te rn again seems t o follow
the power function.
.’ -11-
Uranium Excretion i n Feces - Negligible f rac t ions of t he injected doses
are excreted i n feces. T h i s can be seen i n Table 111, where the percent of
injected dose per sample of feces a re l i s t e d . Figure 5 presents a graph of the
counts per minute per gram of f e c a l ash, p lo t ted as a function of t i m e f o r
Pat ients V I 1 and V I I I . Note tha t the counts/minute/gram from Patient V I 1 r i s e s
t o a maximum; i n the case of Pat ient V I I I , it is d i f f i c u l t t o t e l l whether a
maximum w a s achieved.
with time.
However, the counts per minute per gram of ash decreases
3.2 Autopsy Findings
The percent of injected uranium found i n autopsy t i s sues a r e summarized i n
Table I V . Bones and reticule-endothelial t i s sues , l i v e r and spleen, contain
the heavier deposits of U(1V) while bones and kidneys contain the major deposits
of U(V1). The deposition of uranium i n other t i s sues appears t o be n i l . *:
Deposition i n Bone - Different samples of bone r e f l ec t d i f fe ren t con-
centrations as seen i n Table V. The samples of femur are lowest i n concentration,
while the vascular bone, rib, is highest i n the ear ly stages a f t e r inject ion and
the skull concentration i s highest at la te r stages.
the uranium concentrations i n a longitudinal plane sectioned from the dis ta l
end of the femur.
Figure 6 i s a diagram of
The section, approximately one-fourth inch thick, was cut i n to
smaller sections and each sect ion analyzed f o r uranium.
section a re the concentrations i n counts per minute per gram.
The numbers i n each
I n general, the
concentrations decrease i n the d i rec t ion of the shaf t .
-12-
Figure 7, a graph of a l l individual bone samples from Patien-s I, 11, 111,
V and V I reveals a wide spread i n concentrations.
logarithmic mean concentrations, appearing i n Table I V , a re the best s t a t i s t i c a l
measure f o r these samples.
It i s believed tha t the
Deposition i n Kidney - A typical gross autoradiogram of the kidney,
Figure 8, shows uranium dis t r ibuted non-uniformly and concentrated primarily i n
the co r t i ca l structures.
section from Patient V I , i l l u s t r a t e s i n de ta i l , a typ ica l s i t e of deposition.
Here, the uranium is deposited within or upon ep i the l i a l c e l l s of a proximal
Figure 9, a microscopic autoradiogram of a kidney
convoluted tubule.
Deposition in Normal and Tumorous Brain Tissue - The concentrations of
uranium found i n tumorous brain (expressed as percent of injected dose per
thousand grams) a re higher than i n normal bra in t i s sue (Table V I ) .
3.3 Biological H a l f - L i f e i n Bone and Kidney . .
It is important t o know whether o r not the-current value f o r the biological
ha l f - l i f e of uranium i n bone (300 days) is l e s s
would indicate. It is found that the 300 day value i s quite acceptable. In
(or greater) than these data
Figure 10, a semi-log graph of the percent of dose of U(V1) i n bone is plot ted
with three other curves., Curve 1, obtained by the usual l e a s t square procedure,
has a ha l f - l i f e of 200’days.
th i s manner:
graph paper as shown i n Figure 11;
single exponential term and compute the bone ha l f - l i fe of each patient; and
3) plot each pa t ien t ’s bone ha l f - l i f e as a function of expiration t i m e .
Curve 2, which gives a b e t t e r f i t , was obtained i n
1). Plot the bone biopsy and bone autopsy data on semi-log
2) f i t each plot by l e a s t squares w i t h a
Since
-13-
the l a t t e r increases i n proportion t o t4I5 (Figure 12), these data can be
represented by the equation
leas t squares, the values of C and X can be calculated.
) = ~ e x p ( h t 1/5) and, by * C exp (
Curve 3 is the best
single exponential representation of the bone data because integration from
t = 0 t o t = 70 years yields the area beneath it which i s ident ical t o the area
( i n the same in te rva l )
Since the percent
from the deposition i n
beneath curve 2.
of injected dose deposited i n the kidney i s not different
bone then i ts best single exponential representation would
also be curve 3.
of ten greater than the presently accepted value.
Thus, the biological ha l f - l i fe fo r kidney is 300 days, a fac tor
3.4 Chemical Toxicity Findings
An investigation of the chemical e f fec ts of uranium upon the kidney tubules
was carried out by Doctor A. J. Luessenhop, e t al., of the Massachusetts General
Hospital and the resu l t s of th i s study are summarized b r i e f l y below.
The parlous c l in i ca l state of these pat ients w a s said t o make the interpre-
t a t ion d i f f i c u l t . However, some def ini t ive evidence w a s accumulated which showed
tha t a minimal dose t o produce a nephrotoxic syndrome w a s 0.1 mgm of U(V1) per
kilogram of body w e i g h t . A general survey of these c l in i ca l findings is presented
i n Table V I I .
catalase and protein excretion, a well known sensi t ive test f o r the toxic e f fec t
The evidence fo r tubular damage manifests i t s e l f i n urinary
12 on the kidney tubules
ce l lu la r casts i n the urine and, even though it is f a i n t l y suggested, the
. Other evidence f o r the e f fec t is the appearance of
interference with the renal capacity f o r reabsorption of Ea and C 1 and the secre-
t ion of K. The pathological studies did not reveal any detectable change i n the
tubules.
-14 -
3.5 Bes t .F i t t ing Equatiolrs
Body and Organ Burdens - A di rec t measure of body burden w a s not made.
However, the best estimate is believed t o be the average of the t o t a l percent
of injected dose found i n autopsy t i s sues and 100 per cent minus percent of
injected dose excreted i n urine.
0.60 t-l12, w a s obtained by minimizing the weighted square residuals of the
body burden estimates where the weights were taken t o be inversely proportional
t o the variances,
i n kidney and bones appears i n Figure 13.
The best f i t t i n g power function equation
A plot of‘ this equation together w i t h the body and organ burden
The equation f o r organ burden i n kidney is 0,20 t-’12, and it is the same
as the organ burden i n bone.
average of the r a t i o of the burden i n the organ t o the burden i n the body, as
given by 0.60 t-’12* The lowest r a t i o w a s re jected from each calculation.,
This equation w a s determined by computing the
Urinary Excretion - The best f i t t i n g parer function equation f o r the
excretion rates of Pat ients I - V I is 34,3 $/hr t’3/2 (t i n un i t s of hours)
(Figure 4). Excretion rates measured i n the first 10 hours were omitted from
the least squares f i t . The best f i t t i n g equation f o r each pat ient’s r a t e measure-
ments is shown i n Figure 14,
10 hours were omitted.
power function., Also, the parameters fo r the equation have a considerable range -
H e r e , too, the excretion measurements of the first
These excretion ra tes are approximated closely by the
exponents ,range from 2.31 t o 1-36 while the coeff ic ients range from 381.3 $/hr t o
22.9 %/hre
-15-
3.6 Kinetic Studies of Distribution and Excretion
A simple mathematical analysis of the dynamic process of U(V1) dist r ibut ion
and excretion i s possible w i t h the l i nea r model shown i n Figure 15. T h i s model
12 i s based on small animal d is t r ibu t ion and excretion data found i n the l i t e r a t u r e . It permits.an estimate of the amounts of uranium i n deposition s i t e s as a function
of time. The procedure f o r i t s application is t o f i t the excretion data with
three exponential terms and t o determine the parameters of the dis t r ibut ion.
Figure 16 shows the r e su l t s of i t s application t o the d is t r ibu t ion and
excretion of one of the Boston patients13. Two curves band the excretion measure-
ments t o include the e r ror i n estimating the parameters. When these s e t s of
parameters a re inanipulated as dictated by the l i nea r model, the percent of injected
dose may be estimated f o r the organs, Figure 17. Note tha t the model underestimates
the percent of injected dose i n the kidneys, but tha t it estimates bone and blood
content reasonably well.
The model.is being modified presently t o give a closer approximation of
these experimental resul ts .
by incorporating a mechanism t o simulate the formation of diffusible and non-
d i f fus ib le complexes i n the blood and including a pathway from kidney back t o
blood t o simulate resorption i n the tubules.
It appears that b e t t e r agreement w i l l be obtained
These modifications a re under
14 study .
-16 -
DISCUSSION
4 ,1 Evaluation .of Maximum Permi i b l e Concentration i n the Body,- A i r and Urine.
The autopsy findings conf im- the present MPC values re-commended by the
National Committee on Radiological Protection and the International Commission
on Radiation Protection.
rather than bone, the over-all change i n q (the MPC i n the body) is not
Although the data show kidney as the c r i t i c a l organ \
signif icant , q, calculated on the basis of these data, is -02 pc, which differs
from the present value, 0.04 pc, by a fac tor of 2.
usual equation and f 2 w a s set equal t o l/3 (see Table IV and Figure 13) .
q was calculated w i t h the
The current MPC), (= 1 x pc/cc) applicable t o the case of exposure
t o soluble uranium compounds i n a i r is low by a fac tor of two when compared
w i t h the MPC), calculated on the basis of these data,
l a w and the exponential l a w were used t o make the calculation
Both the parer function
5 x q = 1.7 x 10 -11 pc/cc
fa/ JT6 d?'(t - ) -1/2 0
where q = .02.pc7 f 2 = l/3, T = 300 days, fa = (.25 + fl)f2 = ,025, f 2 = .ll,
fa = .25 and t = 7" = 2,6 x 10 f 4 days (70 years).
.-
-I+
The Maximum Permissible Excretion l eve l MPC), computed w i t h the power
function differs from that calculated w i t h the exponential l a w by a fac tor
of ten:
-.693 t = 2 x 10 7 fa MPC), (1 - ,f ) = 1 x pc/day (22 d/m/day)
-4 = 2 x lo7 f a / M P C ) , (1 - .6 t-ll2) = 1 x 10 pc/day (222 d/m/day)
The current WC), (70 d/m/day) is l/3 the higher value and three times the lower
value.
- -_-.. . .+- 4.2 Estimating Body Burden from Urinary Excretion Data
Instantaneous Body Burden (Injection Dose) - As described previously, ,
inject ion solution repl icates weye collected following administration. These
repl icates were analyzed i n a manner ident ica l w i t h the analysis of urine and
blood specimens.
Injection incidents i n Patients I and I1 prevented administration of the
predetermined dose, Therefore, it w a s necessary t o estimate the inject ion dose.
This was accomplished i n the following manner: The excretion curves of Patients
I11 and I V were plotted; the first par t of each curve, being l inear , w a s f i t t e d
w i t h an exponential term; t h i s single component, when integrated, represented
.54348 and .53476 of the measured dose, respectively. The same procedure was
followed with the excretion curves of Patients I and 11. Dividing the area under
t h e i r curves by the average of the values from Patients I11 and IV, .53908, it
was possible t o estimate t h e i r inject ion "dose.
i
..'
This method of estimating inject ion doses can be applied t o prac t ica l
problems of i ndus t r i a l exposure. Only a f e w excretion measurements immediately
following the exposure incident are required. In equation form, the estimated
inject ion dose is given by
A s an example, Figure 18 shows the estimated inject ion doses of s i x Rochester
pat ients made i n t h i s manner. The poorest estimate, an e r ro r of 58 per cent,
is shown i n the case of the sixth Rochester patient. This e r ro r can be reduced
t o 26 per cent if the f irst urinary excretion measurement is eliminated from the
calculation,
The method cannot be applied accurately t o the excretion data of Boston
Patients V and V I because of the e f fec t of dose upon the shape of the excretion
curve.
method y$elds an overestimate of the inject ion dose.
When the excretion rates exhibit a tendency t o rise t o a maximum the
The reasons f o r t h i s are
not understood.
Body Burden as a Function of Time - An untenable estimate of body burden
is given when a,material balance (amount in body = amount injected - amount excreted)
i s employed i n conjunction with the power function equation.
not tenable because of an er ror i n the measured excretion rates, o r i n the power
Such an estimate i s
function, or i n both. This i s shown i n Table V I 1 1 where the percent of dose
excreted a t i n f i n i t y w a s calculated by integrating the power function from
. .-19-
t = 24 hours t o t = 00. and adding the percent excreted i n the first day. This
calculation was)performed with both the Rochester and Boston data f o r purposes
of comparison.
a t i n f in i ty and the percent accumulated i n the urine a t the time of the last
sample.
t h i s finding.
There is no essent ia l difference between the percent excreted
Studies of the best f i t t i n g power function are under way t o elucidate
Part of the d i f f i cu l ty i n applying the power function t o the excretion data
stems from the f ac t t ha t excretion is not measured.over a long enough period,
i.e., the best f i t t i n g power function is inadequate when applied t o short term
experiments. This argument may not be important when the data a re examined from
another viewpoint. Figure 19 presents a graph of excretion rate i n f rac t ion of
injected dose excreted per hour plot ted as a function of 1 - f rac t ion of injected
dose excreted i n urine. The excretion curve of the th i rd Boston pat ient is a
straight l i n e while the curves of a l l other pat ients bear resemblance t o asymptotic:
functions. The s t ra ight l i n e i s evidence tha t the power function l a w is obeyed,
proof of which comes from eliminating the time variable from the equation for body
burden, (q = at'b) and i ts derivative, which is the negative excretion rate ,
d d d t = -abt-(' -t 'I. This yields
a non-linear d i f f e ren t i a l equation.
be a l i nea r function if the power l a w is obeyed.
A plot of log ( -dq/dt) versus log q should
Since there were no independent
measures of the body burden and since 1 - f rac t ion of injected dose excreted i n
urine may be i n error, it cannot be concluded tha t the asymptotic curves mean
tha t the power l a w w a s not obeyed.
-20-
A b e t t e r method f o r estimating body burden from urinary excretion is
suggested by these considerations. A graph of body burden versus excretion
rate is shown i n Figure 20, The s t ra ight l i n e has the equation
( - dq/dt) = + .056 q3/r2
where I is the inject ion dose. Actually the equation is f o r mere convenience.
The application of th i s graph t o the prac t ica l problem does not depend on any
l a w f o r retention and excretion, With data from,additional patients, t h i s graph
can be improved.
40 3
the
due
Estimating Cumulative In te rna l Radiation Exposure from Routine Urinary Excretion Measurements
Current estimates of cumulative in te rna l radiation exposure are based on .(
lung as the c r i t i c a l organ because the predominant exposures i n Y-12 are
t o airbonre, insoluble urhnium compounds e There are, however, occasional
inhalation exposures t o high levels of soluble compounds which give r i s e t o
perturbed excretion levels , I n these cases, the pat tern of excretion resembles
tha t of continuous 'administration upon which is superimposed the excretion of
a single injection.
Figure 21 presents a typ ica l case. This worker was exposed t o a high airborne
concentration of a soluble uranium compound,
in te rna l radiation exposure should be based on the kidney as the c r i t i c a l organ
Here, the estimate of cumulative
rather than the lung,
the soluble compound i n the lmzg and the MPC f o r a continuous soluble exposure
i s 70 d/min/day,
If it is assumed $hat there is no appreciable hold-up of
then the cumulative dose can be estimated as follows:
-21-
1) Determine I, the inject ion dose, by one of the following methods:
(a) Multiply the amount excreted i n the first 24 hours a f t e r exposure by l/O,7; 3/2 or (b) use the method discussed i n section 4.2; o r use the equation I = (-uO.3)t
where -4 is the measured excretion r a t e i n uni t s of d/m/day o r mrem/day and t i s
the time ( i n days) at which the measurement was made.
4 2 2) Determine q, the body burden i n the equation, q = .6 I t . 3) Integrate these values f o r q u n t i l the steady state is reached and
include these values in to the cumulated unperturbed exposure record. Cumulated
unperturbed exposure represents the contribution t o the dose resul t ing from
continuous absorption i n the blood stream. It must be remembered that t h i s
method applies only t o the case of a single exposure.
Another fac tor which a f f ec t s the estimate of cumulative in te rna l dose i s that
Extraneous contamination can be introduced in- , of contaminated urine specimens.
advertently by the employee o r by the laboratory analyst.
w i l l help t o minimize th i s problem:
The following suggestions
1) Analyze the urine immediately after voiding by a di rec t method.
2) Analyze specimens i n uncontaminated laboratories.
3) Avoid cross-contamination,
An immediate analyqis is possible w i t h a well type dip c o u n t e ~ ? - ~ , but i t s
l i m i t of sens i t iv i ty is about ten times the ME), . Therefore, t h i s instrument
could be used t o "screen" the samples. Employees voiding uranium concentrations
detectable with t h i s counter should be required t o submit additional samples f o r
immediate analysis. After the levels drop t o the l i m i t of s ens i t i v i ty of this
instrument the employee could again submit samples at the regular frequency.
\
-22-
The highly contaminated samples should be analyzed separately from the low
l eve l samples thereby reducing the poss ib i l i ty of cross contamination.
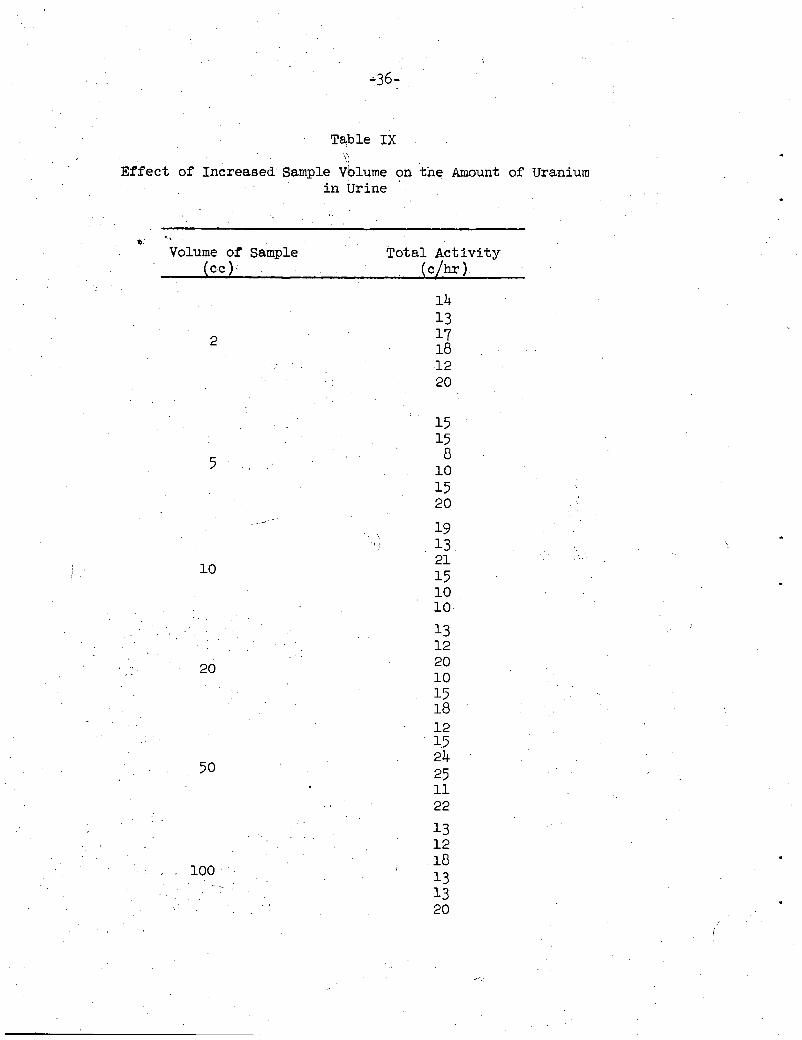
Methods f o r analyzing larger volumes of urine a re under development t o
improve the precision and t o lower the l i m i t of sens i t iv i ty .
e lectroplat ing method, one of the unattractive features is the r e l a t ive ly high
contamination potential . This is shown i n Table IX. Note tha t , as the volume
of blank urine increases, the amount of a c t i v i t y i n the blank samples remains
In the exis t ing
constant.
4.4 Comparison with Other Data
Small Animals - The resu l t s of t h i s study of human d is t r ibu t ion and 12, 16
excretion can be compared with the r e su l t s of small animal experiments * *
The notable differences are:
I. Storage of U(V1) i n the kidney of small animals w a s found t o be insignif icant i n comparison t o storage i n the bone. f o r uranium i n the kidney of rats is -6 days. a 70 year period, the biological half-l ife is approximately 300 days.
The biological half-life I n these humans, averaged over
2. humans is slower. as two hours. clearance.
The disappearance of U ( V 1 ) and U(1V) f romthe blood stream of In studies w i t h rats, 99 per cent disappears i n as l i t t l e
These human data reveal that 20 hours are required f o r blood
3. In the case of rats, 2/3 of the injected uranium is excreted in the
It should be noted, however, that the rate of excretion urine i n 24 hours. On the average, 70 per cent i s excreted by these pa t ien ts i n the same period. depends on the t o t a l mass of injected uranium. For example, 50 per cent of t he injected dose w a s excreted i n the first 24 hours when 50 mgms were injected;a84 per cent was excreted i n the first 24 hours following the administration of 4 mgms.
s ignif icant quant i t ies (-40 per cent) of the injected dose i n feces. 4. Small animals, when injected with te t ravalent salts of uranium, excrete
Humans excrete negligible amounts v ia the G.I. t r a c t .
...
-23 -
Rochester Patients - In general, there w a s very l i t t l e , if anyt difference
exhibited i n the urinary excretion of the Rochester T h i s is
surprising i n view of the fac t that their c l in i ca l states were different , None
of the Rochester pat ients had maladies comparable i n severi ty t o the terminal 7
Boston patients. There was a slight difference i n experimental technique with
respect to: (a) sample collection (Rochester pat ients voided at natural times
whereas Boston pat ients were catheterized); and (b) level of inject ion dose
(Rochester pat ients were administered smaller (0.4 - 4 mgms) doses of
The urinary excretion findings were similar i n these respects: a ) The
differed s l igh t ly from that of -1.8
best f i t t i n g power function, 57.2 $/hr t
the Boston patients, viz., 34-3 $/hr t-lo5; b ) the amount of uranium excreted
i n the first 24 hours w a s essent ia l ly the same, 76 per cent compared w i t h
69 per cent (Table VIII); and c ) the percent of injected dose excreted at
in f in i ty was the same, 79 per cent compared w i t h 85 per cent (Table VIII).
The f eca l excretion of uranium i n the Rochester subjects w a s negligible.
This i s i n good agreement with the Boston patients.
Some subtle differences a re indicated i n Figure 19. The Rochester
Curves a re not as different from each other as are the Boston patient curves,
In addition, the Rochester excretion ra tes i n i t i a t e at higher values (Figure 21)
than the Boston pat ients (Figure 3) .
-24-
4,5 Future Work
The work is not complete. To evaluate the indus t r ia l inhalation
exposure t o enriched uranium more adequately, the future work should include
the following studies:
1) Additional’patients: More pat ients are needed t o improve the
va l id i ty of the findings on the eight pat ients reported.
2). The Influence of Mass of Injected Dose upon the Blood Disappearance
and Excretion Rate: It is important t o know what the e f fec ts are at l o w levels ,
i e ee , can the d is t r ibu t ion be altered, the disappearance from blood hastened.
3 )
4)
Excret ion Resulting from Multiple Inject ions.
Excretion Following Inhalation of Soluble and Insoluble Uranium
Compounds. Studies of excretion following inhalation of metal fumes w i t h
dogs are under way. These studies a re needed i n the case of humans as w e l l .
\
t
-25-
SUMMARY AND CONCLUSIONS
Human data on the dis t r ibut ion and excretion of enriched uranium, the
product of a cooperative study by the Department of Neurosurgery, Massachusetts
General Hospital, and the Health Physics Division, Oak Ridge National Laboratory,
are presented. These data are evaluated f o r information w i t h which t o determine
the in te rna l radiation hazards of long-stored, enriched uranium i n production
workers.
s i x were injected w i t h U02(N03)2 6 ~ ~ 0 , and two w i t h U C l 4 .
Eight terminal brain tumor pat ients were administered uranium compounds,
Measurements were
made of the uranium excretion i n urine and feces, the disappearance of uranium
from blood, the dis t r ibut ion of uranium i n bone (biopsy and autopsy), and i n
many samples of' t i ssue.
The findings i n this investigation were:
1) The c r i t i c a l organ f o r radiation damage is the kidney rather than bone. i
The kidney burden w a s found t o be the same as that of bone and the biological
ha l f - l i fe i n bone, 300 days, w a s found t o be the same as that of the kidney,
2) The measured excretion rates f o r urine i n Boston pat ients (a) can be
approximated w i t h a best f i t t i n g power function and (b) are s l igh t ly different
from the excretion rates of pat ients injected at the University of Rochester.
3) An improved method f o r estimating body burden and cumulative in te rna l
radiation dose from urinary excretion is applied t o the case of workers exposed
t o high airborne levels of soluble uranium compounds.
minimize errors i n t h i s estimate.
Suggestions a re made t o
4) The Maximum Permissible Concentrations i n the body, i n air, and i n urine
calculated with these data differed, by no more than a fac tor of 3, with the
currently recommended values for exposure t o soluble compounds of uranium.
8, Bernard, S. R. and E. G. Struxness. "Some Post Exposure Studies on U r i n a r y Uranium", Abstracts of Health Physics Conference, Idaho Falls, Idaho, 1952,
9. Aub, J . C . , e t a l . "The Late Effects of In te rna l ly Deposited Radioactive Iklaterials i n Man". Medicine, Vol. 31, No. 3, p. 221, Sept. 1952.
10. Stmmess , E.G., A. J. T,uessenhopj S.R. Bernard) J , C . Gall5more. Distribution and ExcretFon of Hexavalent Uranium i n Man." Internat ional Conference on the Peaceful Uses of Atesmic Energy, August 8-20, 1955, Geneva, Switzerland.
"The
11. Roys-ter, G.W, "Electrodeposition of Uranium frotn Urine," In manuscript 6
12. Voegtlin, Carl and H. C. Hodge. Fharmacology and Toxicology of Uranium Corflpmnds ., McGratr-Bill ,Co e , New York, 1949
13. Health Physics Division Semiannual Eeport, January 31, 1955, omn-1860,
14, Fiealth Physics Division Seiniannual Report, July 31, 1956, 03NL-2151,
1 5 e H u r s t , W.M. "Monitoring of L iqJ ids f o r Radioactivity." Feb, 26, 1952, 0 ~ - 1 1 5 5 a
16, lJeumari, X. F. "Urinary Uranium as a Measure of Exposure Razard." University of Rochester Report, UR-82.
17. Baase%t, S . ET., et als. Intravcnous Administration. 11, Studies on Zuman Subjects." UR-37,,
"T1he Excretion of Hexavalent Uranium Following
. .
-27-
Table I
Uranium Content of Bone Biopsy Samples i n Percent of Injected Dose per 7,000 G r a m s
Per Cent of Injected Dose per Standard Man Organ o r Tissue for Six Terminal Brain Tumor Patients
Pat ients I, V I , 11, V and I11 Injected with U02(N03)2 e 6 ~ ~ 0 Patient V I 1 1 Injected with U C l 4
Patient Number I V I I1 V I11 v111
Sample Organ o r Tissue Amount Expirat ion Time (days )
( g > 2.5 18 74 139 566 21
Bone 7,000 Kidney 300 Muscle 30, ooo
taneous t i s sue 6,100 Fat 10,000 Red Marrow 1,500 Blood 5,400 Stomach 250 Small in tes t ine 1,100 Liver 1,700 Brain 1,500 Lungs 1,000 Heart 300 Spleen 300 Urinary Bladder 150 Pancreas 70 Testes 40 Thyroid Gland 20 Prostate Gland 20 Adrenal Gland 20 Miscellaneous t i s sues 390
Patient Clinical Findings I I / / / / / / / . / / / / / / I t / / . / / t
Fluid Balance
I1
I
no def ini te e f fec t Inmediate increase post inject ion
r
I11
Fluctuated i n accordance with urine output
IV Y
"
Elev. post No change in j ec t ion
I11 Urine
NonlProf it Nltroge Toxicity Tests. Y / / /
Cat 81-as e Protein
Specific gravity PH
~~
C 1 clearnace Urea " No def in i te decrease below control values Endogenous Creatin-
ine clearance
Abnormal Numbers
Casts
Glucose-Ketone Bodies
Fluctuated
i
.
Patient Number+
B I
R I
B I1
R I1
B I11
R I11
B I V
R I V
B V
R V
B V I
R V I
Averages
-
B
R
Table V I 1 1
Percent of Injected Dose Excreted at In f in i ty f o r Rochester and Boston Patients
B e s t F i t t i n g Percent of Injected Power F’unction Dose Excreted 1st Day
-2.31 383.6 $/hr t
144.0 $/hr t -2.15
-1.56 49.9 %/hr t
22.9 %/hr t -1.35
-2.50 423-0 $/hr t
-1.80
-1.81 39.5 %/hr t
117.3 $/hr t
238.0 $/hr t-2009
-1.58 73.9 $/hr t
33.2 %/hr t
3792.0 $/hr t-3‘22
-1.36
-2.23 96.2 $/hr t
59.4 Q 82.3
78.0
84.7
83.8
69.2
77.2
66.6
66.5
75.3
49-1
77.6
113.5 %/hr t 69.0 -2.2 788.7 %/hr t
Percent of Injected Dose Excreted L a s t Sample
69 % 86
92
87
98
72
85
72
85
75
63
91
82
81
Percent of Injected’ Dose Excreted at I n f i n i t y
63.9 %
85.5
92.8
87.1
104.9
73.1
88.1
73.4
86.6
77.8
72.. 0
77.8
84.7
79.2
* The pref ix B and R correspond t o Boston and Rochester patients, respectively. ** Rochester pa t ien ts d id not expire, hence the times l i s t e d correspond t o the period of the experiment.
rime of Expiration*
2.5 d
1 4 1
74
142
566
214
136
404
139
94
18
334
hrs
d
hrs
d
hrs
d
hrs
d
hrs
d
hrs
I w vl
I
-36-
i . ’
Table I X c
Effect of Increased Sample Volume on the Amount of Uranium i n Urine
b * ’
Volume of Sample Total Activity
2
5
. _-
l o
20
50
100 -
. ,
14 1 3 17 18 12 20
15 1-5 8 10 1 5 20
19 13 21 1 5 10 10
13 12 20 10 15 18 12 1 5 24 25 11 22
13 12 18
’ 13 13 20 . .
i
e 8 .
Case 9. Photograph taken after death (1945) showing large fungating and ulcerating osteogenic sarcoma arising in left tibia.
C e 19. (1936) This Picture shows the large tumor of
.
UNCLASSIFIED PHOTO 19976
I 0 v I
he mandible. There i s ulceiation of the lower p&t of the tumor mass. Reprinted from the Journal of Industrial Hygiene and Toxicology with permission of the pub1 ishers.
Case 25. Right hand (March, 1950). This roentgenogram shows marked extension of the lesion of the 2nd metacarpal bone. The entire shaft of the bone i s now involved and the cystic nature of the new bone i s more distinct.
FIGURE 1
fl kI 0.0
I .o 0 .oo I
0. I
-38- Photo -26542 UNCLASSIFIED
. . ' . . . a . . 9 . . . . . . . . . . I E.. . I 1 , * a . n .