Pro-Poor Livestock Policy Initiative A Study of the Role of Livestock in Poverty Reduction Strategy Papers Roger Blench, Robert Chapman and Tom Slaymaker A Living from Livestock PPLPI Working Paper No. 1 Pro-Poor Livestock Policy Initiative A Living from Livestock PPLPI Working Paper No. 1 A Study of the Role of Livestock in Poverty Reduction Strategy Papers Roger Blench, Robert Chapman and Tom Slaymaker
Transcript
Pro-PoorLivestockPolicyInitiative
A Study of the Role of Livestock inPoverty Reduction Strategy Papers
Roger Blench, Robert Chapman and Tom Slaymaker
A Living fromLivestock PPLPI Working Paper No. 1
Pro-PoorLivestockPolicyInitiative
A Living fromLivestock PPLPI Working Paper No. 1
A Study of the Role of Livestock inPoverty Reduction Strategy Papers
Roger Blench, Robert Chapman and Tom Slaymaker
i
PREFACE
This is the first of a series of “Working Papers” prepared by the Pro-Poor Livestock Policy Initiative. The purpose of this series is to review issues affecting livestock development in relation to poverty alleviation.
The livestock sector plays a vital role in the economies of many developing countries. It provides food, or more specifically animal protein in human diets, income, employment and possibly foreign exchange. For low income producers, livestock also serve as a store of wealth, provide draught power and organic fertiliser for crop production and a means of transport. Consumption of livestock and livestock products in the developing countries, though starting from a low base, is growing rapidly.
The current document examines how livestock features in the Poverty Reduction Strategy Papers (PRSPs) prepared by Heavily Indebted Poor Countries as they seek concessional lending from the World Bank and IMF. Although the nature and demands upon livestock differ greatly between countries embarking on the PRSP process, all fail to make a strong, coherent case for support to this sector. The underlying reason for this is that the PRSP process is guided by national ministries that fail to recognize or understand the opportunities that livestock present for reducing poverty. This Working Paper concludes with recommendations for improving the PRSP process so that the interests and priorities of the poor are better represented.
It is hoped that the paper stimulates discussion and any feedback would be gratefully received by the author and the Livestock Information and Policy Branch of the Animal and Production and Health Division of FAO.
DISCLAIMER
The designations employed and the presentation of material in this publication do not imply the expression of any opinion whatsoever on the part of the Food and Agriculture Organization of the United Nations concerning the legal status of any country, territory or any area or of its authorities, or concerning the delimitation of its frontiers or boundaries. Opinions expressed in this publication are those of the authors alone and do not imply any opinion whatsoever on the part of FAO.
Preface....................................................................................................... i Acronyms....................................................................................................iii Tables .......................................................................................................iv Figures ......................................................................................................iv Executive Summary........................................................................................ 1 1. Introduction............................................................................................. 3 2. General Analysis of PRSPs – Methodology ........................................................... 5 3. General Analysis of PRSPs - Results .................................................................. 9
3.1 Participation in the PRSP Process................................................................9 3.2 The Contr ibution of Agr iculture to GDP and Employment ................................... 10 3.3 Livestock in the PRSPs.......................................................................... 12 3.4 The Joint Staff Assessments ................................................................... 13
FAO Food and agriculture Organization of the United Nations
FDI Foreign direct investment
FSR Farming systems research
GDP Gross domestic product
HIPC Heavily Indebted Poor Countries
IFAD International Fund for Agricultural Development
IFI International Financial Institution
ILCA International Livestock Centre for Africa
ILRI International Livestock Research Institute
IMF International Monetary Fund
INE Instituto Nacional Estatistico (National Statistics Institute, Mozambique)
JSA Joint Staff Assessment
LPDP Lao Peoples Development Party
MADER Ministry of Agriculture and Rural Development
NHDR Niger Human Development Report
ODI Overseas Development Institute
PPP Purchasing power parity
PRSPs Poverty Reduction Strategy Papers
PRGF Poverty Reduction and Growth Facility
PROAGRI Agricultural Sector Public Expenditure Programme
SIP Sector investment programme
LUs Livestock Units
UNDP United Nations development Programme
UNICEF United Nations Children’s Fund
UNFPA United Nations
USAID United States Agency for International Development
UXO Unexploded ordnance
WFP World Food Programme
iv
TABLES Table 1: PRSPs - status and significance of livestock within them .......................................5 Table 2: Human population, contr ibution of agr iculture and livestock to GDP and employment and
rating of livestock in PRSP .................................................................... 10 Table 3: Niger country data(1990/2000 comparison) ................................................... 14 Table 4: Niger agr icultural data(1990/2000 comparison)............................................... 16 Table 5: Niger livestock populations ..................................................................... 16 Table 6: Ethiopia country data (1990/2000 comparison) ............................................... 20 Table 7: Ethiopia agr icultural data (1993/2000 comparison)........................................... 21 Table 8: Ethiopian livestock populations ................................................................ 21 Table 9: Mozambique agr icultural data (1990/2000 comparison) ...................................... 28 Table 10: Mozambique livestock populations............................................................ 30 Table 11: Lao country data (1990/2000 comparison) ................................................... 35 Table 12: Lao agr icultural data (1990/2000 comparison) .............................................. 36 Table 13. Lao livestock populations...................................................................... 37 Table 14: Pakistan Country data (1990/2000 comparison) ............................................. 42 Table 15: Pakistan agr icultural data (1990/2000 comparison) ......................................... 43 Table 16: Pakistan: livestock populations ............................................................... 44
FIGURES
Figure 1: Status of the PRSP process....................................................................... 9 Figure 2: Significance attr ibuted to livestock in PRSPs..................................................13
1
EXECUTIVE SUMMARY
The Animal Production and Health Division and the Pro-Poor Livestock Policy Facility of FAO requested ODI to evaluate references to livestock in the available PRSP documentation. Five case studies examining the role of livestock in the overall economy would explore the value of the PRSPs in more detail. Primarily, this involved downloading and searching the documentation for countries entering the HIPC process. Although sixty-one are recorded as entering the process, documents that can be evaluated are available for only forty-nine countries. These documents were then studied to determine the overall importance allocated to livestock.
The major questions were:
Are the documents based on a realistic and comprehensive understanding of the economy of the nation-state in question?
Do they correctly identify the local and specific causes of poverty?
If so, do the strategies proposed address these specific issues as well as broad structural elements?
A qualitative livestock PRSP rating based on the statements about livestock included in the PRSP was developed and tabulated against variables such as the proportion of people deriving an income from agriculture, the proportion of GDP from livestock or the dynamics of the livestock sector. Regrettably, no consistent connection could be found between the likely importance of livestock for a given economy and the significance attributed to it in the PRSP. For example, some pastoral countries, where livestock is the mainstay of the subsistence of the majority of the population, such as Niger or Tajikistan, only refer to livestock in passing. Evidence from both the documents and from discussions with participants in the PRSP process argue strongly that the underlying reason for this is lack of representation the overall leadership style exerted by the ministries of finance in the PRSP process.
The broad conclusions drawn from the in-depth study of five countries were as follows:
that livestock is generally under-represented in the PRSP process and output documents
that greater attention is given to commercial operations than to the species and structures relevant to the poor
that virtually all recommendations are of extreme generality (‘veterinary services should be improved’) and are thus unlikely to lead to improved outcomes
that in many instances the format of the PRSP process will not lead to realistic descriptions of the situation of livestock producers
that despite the apparently participatory and consultative nature of the process the recommendations are mostly central and top-down suggesting that local opinion may be sought but is usually not incorporated into final documents
that the Joint Staff Assessment (JSA) procedure does not lead to any increased representation of livestock
Executive Summary
2
In terms of recommendations, the situation can be summarised as follows:
1. Livestock is given a low profile as part of a broader inadequacy in the discussion of natural resource issues. If this profile is to be raised then representation should be made in conjunction with other sectors and other agencies to the IMF and World Bank, preferably with the support of selected ministries in HIPC countries
2. The profile of livestock should be based on a detailed empirical analysis of recent data and should reflect livestock issues relevant to the poor rather than those thought to be the source of economic growth
3. The resources and advocacy of NGOs and similar groups should be drawn upon to provide a solid factual basis for the recommended changes
If FAO, or indeed any other body, wishes to make revisions to PRSPs, then it should certainly be in conjunction with other sectors. It would be ineffective to upgrade the livestock analysis and leave forestry and fisheries untouched. Obviously it can be most effective where only an I-PRSP has been published since there is more room for alteration and correction. Nonetheless, PRSPs are supposed to be ‘living’ documents and there is surely a case for well-argued changes to be inserted in the text of any posted document.
3
1. INTRODUCTION
The World Bank and International Monetary Fund (IMF) originally endorsed the preparation and implementation of Poverty Reduction Strategy Papers (PRSPs) by borrower countries seeking to benefit from the enhanced HIPC (Highly Indebted Poor Countries) Initiative:
“[This] enhanced framework for poverty reduction […] seeks to ensure a ‘robust link’ between debt relief and poverty reduction by making HIPC debt relief an integral part of broader efforts to implement outcome-oriented poverty reduction strategies using all available resources”
(World Bank website, 22 September 1999).
The PRSP model, although originally conceived in the context of the HIPC debt relief initiative, is now the centrepiece for policy dialogue in all countries receiving concessional lending flows from the World Bank and IMF. The IMF’s facility for poor countries (formerly known as the Enhanced Structural Adjustment Facility) has been renamed the Poverty Reduction and Growth Facility. The PRSP has replaced the ‘Policy Framework Paper’ as the overarching document. This outlines the policy directions and resource allocation frameworks for IMF and Bank lending in countries eligible for concessional assistance. It comes in two parts: the paper itself, drafted and owned by Government, to their own preferred format; and the Bank/Fund assessment of it, which accompanies the paper when it is presented to the Boards of the International Financing Institutions (IFIs). Governments are expected to prepare the PRSP through a process which consults widely, in order to reinforce ownership within and beyond the Government. The process covers a three-year time-frame, but with annual review and update. It should also be clear that the process is linked to indebtedness; many small, developing countries, especially in the Pacific are not included simply because they are not highly indebted. Countries with chronic political instability, such as Somalia or Liberia, are similarly excluded.
The PRSP was conceived as a more effective means for donors to interact with recipient countries in order to stimulate effective poverty reduction. Though it is an initiative of the IFIs, the objective is to encourage a process by which Government takes charge of its poverty reduction strategy, attempting to prioritise the most effective policy interventions and make the best use of all resources (domestic and external) in pursuit of the objective of poverty reduction. In order to fulfil these aspirations, the PRSP process would need to provide real progress in overcoming some of the major constraints to achieving sustained poverty reduction in poor countries, including problems in the donor relationship.
The financial benefits to any country that completes the PRSP process are considerable and, as a consequence, a large number of indebted countries have already prepared an interim PRSP (I-PRSP). The requirement that the national government consult widely has been something of a blockage in many countries and it is clear that this process has had widely variable effectiveness. Numerous consultants have written papers questioning the ‘ownership’ of PRSPs and clearly a valuable sub-industry has been generated. PRSPs tend to be written to a formula and therefore resemble one another. Some questions therefore emerge:
Are the documents based on a realistic and comprehensive understanding of the economy of the nation-state in question?
1. Introduction
4
Do they correctly identify the local and specific causes of poverty?
If so, do the strategies proposed address these specific issues as well as broad structural elements?
In the light of this, it is therefore useful to ask how accurately the PRSPs reflect sectoral interests. Evidence from both the documents and from discussions with participants in the PRSP process show that overall leadership of the PRSP process is taken by ministries of finance. The documents themselves are intended to be prepared by a participatory process, involving stakeholder workshops and constellations of satellite committees. However, the drafts are all too often prepared by a few individuals and then amended in the light of the comments received. But there is no very structured process to ensure that specific sectors are represented. Indeed the absence of a representative of a particular sector, through chance or purposeful omission, may lead to that sector being significantly underplayed in the final document.
The other side to this, however, is that there is no pressure coming from either external donors or the lending agencies to ensure that natural resources issues are dealt with realistically. Broadly speaking, funding for all types of natural resource projects declined significantly in the 1990s and there is no sign of a reversal of the trend. The so-called ‘Washington consensus’ focuses on growth-led development, urban issues and economic remedies, a world-view very much reflected in the PRSPs.
Nevertheless, livestock remain important and will probably grow further in importance in their role of supplying protein to the megacities of the future. But this can sometimes act to obscure the place of livestock in poor households.
Approximately one-quarter of the global poor, of whom 2.8 billion live on less than US$2 per day, are livestock keepers. More specifically, of the 407 million persons who are classified as farmers in rain-fed zones, 135 million are pastoralists, and a further 156 million keep livestock in landless systems (LID 1999). In many developing countries, livestock are one of the few means available to the poor for generating capital assets. Livestock products are also an important nutritional resource, and through gift-giving animals may act as a means of gaining social approbation and acceptance. One study in Kenya demonstrated that poor households are almost always involved in a wide array of livelihood activities, and that the poorer the household, the greater the economic and social importance of livestock. (Heffernan and Misturelli, 2000). There is thus every argument for ensuring that livestock is effectively represented in PRSP documents.
5
2. GENERAL ANALYSIS OF PRSPS - METHODOLOGY
The complete list of countries in principle entering into the PRSP process was taken from the World Bank website. This listed 61 countries in December 2002. The documents themselves were downloaded from the IMF website. Only PRSPs and I-PRSPs were considered; preliminary reports or drafts were not analysed as these are as yet incomplete. Some countries that at the time of this study had prepared I-PRSPs may have since produced full PRSPs.
The coverage of livestock was then ranked as follows:
0 Not mentioned (10 countries)
1 Mentioned (17 countries)
2 Discussed briefly (1 to 2 paragraphs) (11 countries)
3 Discussed more fully and strategy outlined with some budgeting (7 countries)
4 Discussed in detail, systematic strategy, appropriate budgeting (4 countries)
5 Detailed strategy, budget, and poverty reduction impact (0 countries)
Table 1 shows all the countries listed, the ranking assigned to them and a summary of references to livestock in the text.
Table 1: PRSPs - status and significance of livestock within them
Country D J R Content of livestock references
1. Angola -
2. Albania P + 3 Strategic importance of livestock recognised and target for increased production set. Need to consolidate production in large farms and develop more intensive production methods. Broad level budgeting for the sector included in action p lans.
3. Armenia I + 1 Mentioned once in the Appendix 1: Policy Matr ix Table.
4. Azerbaijan I + 1 Passing reference to animal husbandry in the document and attachment on policy measures.
5. Bangladesh -
6. Benin I 0 No mention
7. Bolivia P + 2 Livestock mentioned in four paragraphs although only br iefly discusses the need to invest more in the sector. The importance of diversifying out of the sector for households is also mentioned.
8. Bosnia and Herzegovina
I 3 A livestock action p lan is outlined and the strategic importance of the livestock sector is discussed in some detai l. Targets for production, marketing and sector development are highlighted and budgeted as pr ior ity programmes.
9. Burkina Faso P 3 A livestock action p lan is outlined and the strategic importance of the livestock sector is discussed in some detai l. Targets for production, marketing and sector development are highlighted and budgeted as pr ior ity programmes.
10. Burundi -
2. General analys is of PRSPs - Methodology
6
Country D J R Content of livestock references
11. Cambodia I + 2 Livestock is discussed br iefly as part of the Strategic Framework for agr icultural production. The importance of livestock for economic growth is also recognised and pr iority areas such as the development of backyard production, feed processing and large animal production are highlighted. The potential of livestock development to alleviate rural poverty is recognised.
12. Cameroon I 1 Mentioned br iefly.
13. Cape Verde I + 1 Mentioned once.
14. CAR I 1 Mentioned once.
15. Chad I 1 Mentioned in main text and policy matr ix.
16. Comoros -
17. Congo -
18. Cote d’Ivoire I + 2 Livestock is often referred to in general terms, included in many ‘wish list’ type statements. Participatory processes included workshops at var ious places around the country and the importance of developing the livestock sector locally is frequently raised.
19. Djibouti I + 2 Importance of livestock recognised and discussed br iefly. Potential for economic development of the livestock exports is highlighted.
20. Dem. Republic Congo
I + 1 Livestock br iefly mentioned in the general context of agr iculture.
21. East Timor -
22. Er itrea -
23. Ethiopia I + 3 Livestock is discussed at some length mainly with reference to the livestock strategy 1999-2004.
24. Gambia P + 1 Importance of agr iculture (including livestock) stressed but livestock issues not specifically addressed.
25. Georgia I + 0 No mention
26. Ghana I 2 Livestock is discussed but no consistent policy.
27. Guinea P + 4 Importance of rural sector for economic growth recognised. Livestock identified as a pr iority sub-sector. Pr ior ity objectives and actions outlined and budgeted with targets/indicators.
28. Guinea-Bissau I 0 No mention
29. Guyana P 0 No mention
30. Honduras P + 1 Importance of agr iculture & livestock production noted but no specific mention of strategy regarding livestock.
31. Indonesia -
32. Kenya I + 1 Single paragraph referr ing to livestock production in semi-ar id areas, envisages improved meat processing and animal health. No recognition of the important role played by pastoralism in Kenyan economy.
33. Kyrgyz I 1 Paragraph 61 refers to improved wool certification and support to sheep breeders’ associations. p. 57 passing reference to pr ivatisation of state farms.
2. General analys is of PRSPs - Methodology
7
Country D J R Content of livestock references
34. Lao PDR I + 3 Livestock referred to throughout report and defined as ‘pr imary indicator of wealth’. Livestock disease, improved livestock production and training of livestock extension offices all considered high pr ior ity. Livestock seen as profitable replacement for opium production. But no concrete strategy.
35. Lesotho I + 1 Livestock only referred to in passing comments, as a block to boys attending school and the need for improved production. No strategy or analysis.
36. Macedonia I 0 No mention
37. Madagascar I 1 Two passing references, to pasture degradation and the necessity to combat livestock theft. This in a country where cattle outnumber people.
38. Malawi P + 2 Livestock considered important to subsistence (p. 44). Livestock considered important for the food secur ity of the poor (p. 88) and animal production programmes to be encouraged. Livestock allotted significant role in Action Plan (Annex 1 p.135). Increased access to animal health and animal traction assigned pr ior ity.
39. Mali I 1 Livestock is mentioned in passing.
40. Mauritania P + 4 Livestock is discussed in some detai l. The importance of livestock for poverty reduction is highlighted and a broad strategy with pr iority actions is outlined. Livestock features in the budgeted pr iority programme tables and macroeconomic framework. Targets for the livestock sector are also clear ly outlined.
41. Moldova I 0 No mention
42. Mongolia I + 2 Livestock is widely mentioned and discussed in the context of the current problems. Only br iefly mentions strategic approaches to the management of the sector and poverty reduction impact.
43. Mozambique P + 4 Role and importance of livestock for poverty reduction recognised and understood. Strategy includes detai led livestock related components, pr ior ity actions, targets and indicators but no budgetary breakdown.
44. Nepal -
45. Nicaragua P + 2 Importance of livestock noted. Policy actions in support of broad-based economic growth include reference to livestock.
46. Niger P + 2 Although livestock is mentioned and its strategic importance is alluded to no overall strategy is outlined
47. Pakistan I + 2 Livestock referred to as the pr incipal safety-net in ar id areas and the loss of stock in droughts as a major factor in food secur ity. Improved livestock production would alleviate poverty (p. 12). No reference to any action or strategy to respond to this perception.
48. Rwanda P + 4 Agr iculture and livestock considered the ‘engine of growth’. Massive losses of livestock following the 1994 genocide. Livestock, via manure, essential to soi l fertility with no access to fertiliser. Intensifying livestock is a high pr ior ity programme action. Strategies to improve livestock production are given in paragraph 127. Support to be given to mi lk marketing and credit to producers. Livestock head tax to be abolished.
2. General analys is of PRSPs - Methodology
8
Country D J R Content of livestock references
49. Sao Tome & Pr incipe
I 0 No mention
50. Senegal I 0 No significant mention
51. Sierra Leone I 0 No significant mention
52. Sr i Lanka - +
53. Tajikistan I 0 No mention
54. Tanzania P 1 Livestock conceptualised entirely in terms of milk production. Livestock seen as important in alleviating rural poverty but no mention of strategy.
55. Togo -
56. Uganda P + 1 Restocking seen as crucial to increasing rural assets of the poor. No other significant mentions and no strategy for implementation.
57. Uzbekistan -
58. Vietnam P + 2 Importance of livestock noted and key issues identified.
59. Yemen P + 3 Role and importance of livestock identified. Livestock components included in agr icultural sector budgeting.
60. Yugoslavia I + 1 Farm restocking is a stated aim of government policy in Montenegro but no detai ls as to how this is to be achieved.
61 Zambia P + 3 Livestock highlighted as a pr ior ity area of Agr icultural Sector Investment Programmes. Budget includes livestock support services, research and development and targets/indicators.
D = Country document: P = PRSP; I = Interim – PRSP; J = Joint Staff Assessment:: + = document found; R = ranking
Angola, Bangladesh, Burundi, Congo, Comoros, East Timor, Eritrea, Indonesia, Sri Lanka, Togo, and Uzbekistan have no documentation. Yugoslavia does not appear on the World Bank listing but an I-PRSP is found on the IMF Website.
9
3. GENERAL ANALYSIS OF PRSPS - RESULTS
3.1 Participation in the PRSP Process
The total number of countries in theory eligible for HIPC status is 61 However, of these, 12 do not seem to have entered the PRSP process. The documents submitted by those 49 countries who have are highly variable in length and quality, varying between twenty and several hundred pages. Relatively few seem to have been written in the language of the country in question and then translated, which suggests strongly that external consultants have been heavily involved in the process. PRSPs are very strong on the rhetoric of participation and country ownership but sub-national priorities are reflected in relatively few cases. The broad sectoral priorities outlined in the majority of the PRSPs appear largely inadequate in their analyses of the specific socio-economic situation in the country in question.
Figure 1 shows the different stages of the PRSP process, contrasting those countries with a completed PRSP and those with an interim document. It should be emphasised that the situation is very dynamic, with new documents being regularly posted on the IMF website.
Figure 1: Status of the PRSP process in December 2002
0.0
10.0
20.0
30.0
40.0
50.0
60.0
No document I-PRSP PRSP
Document Status
Perc
enta
ge
n = 61
3. General Analysis of PRSPs - Results
10
3.2 The Contribution of Agriculture to GDP and Employment
Generally speaking, livestock production is increasing worldwide, as shown in Table 2. The exceptions are Central Asian countries such as Armenia, Azerbaijan, Georgia, Kyrgyz, Moldova etc. and some African countries, notably Burundi, Djibouti, Lesotho and Madagascar. Almost certainly the reason for the substantial declines in almost all Central Asian countries is decollectivisation. The reversion to more traditional open range systems has been accompanied by de-intensification as well as a related deterioration of statistical systems which makes the figures more difficult to interpret. Civil disorder explains Burundi, but it is hard to explain other countries, such as Angola, where a civil war has apparently simultaneously led to very significant increases in livestock production. It would interesting to know if declines in Lesotho and Madagascar are related to the overgrazing of grassy uplands. Similar phenomena are becoming very apparent in Nigeria. Table 2 shows the GDP of PRSP countries and the percentage of GDP drawn from agriculture and livestock, a percentage which is slowly decreasing. The countries identified for case studies are shown in bold.
Table 2: Human population, contribution of agriculture and livestock to GDP and employment and rating of livestock in PRSP (2000)
Country Human
Population ('000)
% Pop.1 in Agriculture
% GDP Agriculture
% GDP Livestock
Livestock Production
Index*2
Livestock PRSP rating
Albania 3,134 48 51 32 - 3
Angola 13,134 72 6 3 136 -
Armenia 3,787 13 25 13 65 1
Azerbaijan 8,041 27 19 9 77 1
Bangladesh 137,439 56 25 4 136 -
Benin 6,272 54 38 4 124 0
Bolivia 8,329 44 22 10 135 2
Bosnia Herzegovina 3,977 5 12 5 - 3
Burkina Faso 11,535 92 35 12 136 3
Burundi 6,356 90 51 4 76 -
Cambodia 13,104 70 37 10 150 2
Cameroon 14,876 59 44 11 120 1
Cape Verde 427 23 12 8 175 1
CAR 3,717 73 55 24 134 1
Chad 7,885 75 39 15 114 1
Comoros 706 74 41 6 105 -
Congo 3,018 41 5 1 131 -
1 Economically active population 2 1889-91 = 100
3. General Analysis of PRSPs - Results
11
Country Human
Population ('000)
% Pop.3 in Agriculture
% GDP Agriculture
% GDP Livestock
Livestock Production
Index*4
Livestock PRSP rating
Cote d’Ivoire 16,013 49 29 2 128 2
Djibouti 632 79 4 3 85 2
DRC 50,948 63 - - 102 1
East Timor 737 82 - - 108 -
Er itrea 3,659 78 - - 108 -
Ethiopia 62,908 82 52 18 117 3
Gambia 1,303 79 38 5 117 1
Georgia 5,262 20 32 17 84 0
Ghana 19,306 57 35 3 102 2
Guinea 8,154 84 24 3 140 4
Guinea-Bissau 1,199 83 59 14 121 0
Guyana 761 18 - - 188 0
Honduras 6,417 32 18 8 135 1
Indonesia 212,092 48 17 2 126 -
Kenya 30,669 75 20 11 107 1
Kazakhstan 4,921 26 39 22 81 1
Lao PDR 5,279 76 53 10 155 3
Lesotho 2,035 38 17 8 89 1
Macedonia 2,034 13 12 3 85 0
Madagascar 15,970 74 35 14 99 1
Malawi 11,308 83 42 4 113 2
Mali 11,351 81 46 21 123 1
Mauritania 2,665 53 22 19 100 4
Moldova 4,295 23 28 9 35 0
Mongolia 2,533 24 33 32 88 2
Mozambique 18,292 81 24 5 104 4
Nepal 23,043 93 40 11 124 -
Nicaragua 5,071 20 32 14 117 2
Niger 10,832 88 39 15 121 2
Pakistan 141,256 47 26 12 152 2
Rwanda 7,609 90 44 5 112 4
Senegal 9,421 74 18 6 138 0
Sierra Leone 4,405 62 47 10 109 0
Sr i Lanka 18,924 46 20 3 134 -
3 Economically active population 4 1889-91 = 100
3. General Analysis of PRSPs - Results
12
Country Human
Population ('000)
% Pop.5 in Agriculture
% GDP Agriculture
% GDP Livestock
Livestock Production
Index*6
Livestock PRSP rating
Sao Tome and Pr incipe 138 64 20 2 152 0
Tajikistan 6,087 34 19 6 39 0
Tanzania 35,119 80 45 15 119 1
Togo 4,527 60 38 5 129 -
Uganda 23,300 80 42 8 120 1
Uzbekistan 24,881 28 35 15 119 -
Vietnam 78,137 67 24 5 165 2
Yemen 18,349 51 15 7 139 3
Yugoslavia 10,552 20 - - 102 1
Zambia 10,421 69 27 11 118 3
Source: FAOSTAT (2002); World Bank (2002) World Development Indicators on CD-ROM
3.3 Livestock in the PRSPs
It is important to emphasise that many of the poorer countries depend on livestock to a considerable extent, an extent that is hardly reflected in the PRSP documents. It is clear that agriculture is not a very good proxy for livestock; a country such as Niger with limited agriculture will have a much greater proportion of agriculture coming from livestock than, for example, Laos. There is absolutely no connection between the importance of livestock for a given economy and the significance attributed to it in the PRSP. Pastoral countries, where livestock is the mainstay of the subsistence of the majority of the population, such as Niger or Tajikistan, only refer to livestock in passing. Some countries, such as Macedonia, completely ignore it. Although the table assigns a potential grading 0-5 in assessing the role of livestock in PRSPs in fact no single country attains grade 5, which is full consideration of the role of livestock and adequate strategies for addressing its significance for poverty alleviation. The countries that come closest to meeting this target are probably Mozambique and Mauritania, which refer to the importance of livestock throughout and in particular seem to grasp its role in securing livelihoods.
5 Economically active population 6 1889-91 = 100
3. General Analysis of PRSPs - Results
13
Figure 2 shows the rankings assigned in Table 1 to the individual countries with existing documents.
3. General Analysis of PRSPs - Results
14
Figure 2: Significance attributed to livestock in PRSPs
It is clear this is an unsatisfactory and unrealistic result that ignores the importance of livestock in the lives of millions of poor people, and the potential that livestock has for reducing poverty.
3.4 The Joint Staff Assessments
The Joint Staff Assessment (JSA) is the ongoing review process conducted by the World Bank and the IMF of the PRSPs. The JSAs are posted on the Web, and their existence is noted in Table 1. However, in no case are there more than passing references to livestock and certainly no pressure to consider livestock issues in greater depth.
0
5
10
15
20
25
30
35
0 1 2 3 4 5
Grade
Perc
enta
gen = 61
15
4. DETAILED COUNTRY CASE STUDIES
4.1 Niger
4.1.1 Background
Economic situation: Niger, a former French colony, gained independence in 1960. Its surface area is 1,267,000 km2 but only 125, 200 km2 is considered arable. Niger, landlocked and situated on the southern edge of the Sahara is one of the poorest countries in the world. The economy is based largely on subsistence crops, livestock, and some of the world's largest uranium deposits. Drought cycles, desertification, a 3.4% population growth rate and the drop in world demand for uranium have undercut an already marginal economy. The persistent uranium price slump has brought lower revenues for Niger's uranium sector, although uranium still provides 72% of national export proceeds. Traditional subsistence farming, herding, small trading, and informal markets dominate an economy that generates few formal sector jobs.
Table 3: Niger country data (1990/2000 comparison)
1990 2000
Human Population 7,731,000 10,832,000
Crude birth rate (per 1,000) 55.5 50.6
PPP GDP/capita 738.0 746.0
Human Development Index1 - 0.277
FDI % of GDP 0 0.8
Aid % of Govt. Expenditure - -
Sources:1UNDP World Development Report (2002) World Bank (2002) World Development Indicators on CD-ROM
The country is usually divided into four ecological zones; the Sahara, the arid central region, the Sahel (with a rainfall of 200-500 mm.) and the Sudanian (with a rainfall of 600-800 mm.). Niger's agricultural and livestock sectors are the mainstay of all but 18 percent of the population. Fifteen percent of Niger's GDP is generated by livestock production (camels, goats, sheep and cattle), supporting 29 percent of the population. The 15 percent of Niger's land that is arable is found mainly along its southern border with Nigeria. Rainfall varies and when insufficient, Niger has difficulty feeding its population and must rely on grain purchases and food aid to meet food requirements.
Of Niger's exports, foreign exchange earnings from livestock, although impossible to quantify, are second only to those from uranium. Actual exports far exceed official statistics, which can omit large herds of animals informally crossing into Nigeria. Some hides and skins are exported and some are transformed into handicrafts. The January 1994 CFA franc devaluation contributed to an annual average economic growth of 3.5 percent throughout the mid-1990s. The economy stagnated due to a sharp reduction in foreign aid in 1999, which gradually resumed in 2000. Reflecting the importance of the agricultural sector, the return of good rains in 2001 was the primary factor underlying a projected growth of 4.5 percent for 2001.
In recent years, the Government of Niger promulgated revisions to the investment code (1997 and 2000), petroleum code (1992), and mining code (1993), all with attractive terms for investors. The present government actively seeks foreign private investment and considers it key to restoring economic growth and development. With
4. Detailed country cas e s tudies
16
the assistance of the United Nations Development Program (UNDP), it has undertaken a concerted effort to revitalise the private sector.
In January 2000, Niger's newly elected government inherited serious financial and economic problems including a virtually empty treasury, past-due salaries and scholarship payments, increased debt, reduced revenue performance, and lower public investment. In December 2000, Niger qualified for enhanced debt relief under the International Monetary Fund programme for Highly Indebted Poor Countries and concluded an agreement with the Fund on a Poverty Reduction and Growth Facility (PRGF). In addition to strengthening the budgetary process and public finances, the new government has pursued economic reform with the privatisation of water distribution and telecommunications and the implementation of a flexible petroleum product pricing structure tied to world market prices. Further privatisations of public enterprises are in progress. In its effort to consolidate macroeconomic stability under the PRGF, the government is also taking action to reduce corruption and, as the result of a participatory process encompassing civil society, has devised a Poverty Reduction Strategy Plan that focuses on improving health, primary education, rural infrastructure, and judicial reform.
The household consumption survey conducted in 1990 and 1993 under the PADEM1 shows that of the 8,299,600 residents of the country at that time, 5,269,300 people (two-thirds) are living below the poverty line and 2,824,800, or one-third are below the extreme poverty threshold. Poverty is more severe in rural areas than in the cities. No survey of this kind has been conducted since 1993, but it would appear that the situation has deteriorated sharply since then. Data on mother and child health show the extent of extreme poverty in which the people of Niger are living. Successive Human Development Reports (NHDR) have measured poverty in terms of the Human Poverty Index (HPI)3. For Niger that index stood at 64.3 percent in 1997, 66.7 percent in 1998 and 62.2 percent in 1999.
The most important donors in Niger are France, the European Union, the World Bank, the IMF and other United Nations agencies (UNDP, UNICEF, FAO, WFP, and UNFPA). Other principal donors include the United States, Belgium, Germany, Switzerland, Canada, and Saudi Arabia. While USAID does not have an office in Niger, the United States is a major donor, contributing nearly $10 million each year to Niger’s development. The U.S. is also a major partner in policy coordination in such areas as food security and HIV/AIDS. The importance of external support for Niger's development is demonstrated by the fact that about 45 percent of the government's 2002 budget, including 80 percent of its capital budget, derives from donor resources.
Agriculture: Two-thirds of Niger is desert and agriculture is concentrated in the Sudanian region where irrigated production is possible. Even so, irrigated production covers less than 5 percent of the total cultivated area. The principal crops are sorghum, millet, cowpea and some rice, maize and cassava. Cotton and groundnuts are significant cash crops, although production has declined markedly since the 1970s. Cowpeas and onions are grown for commercial export, as are small quantities of garlic, peppers, potatoes, and wheat. Niger is highly dependent on rainfall, which varies considerably year on year and it is frequently both forced to import cereal staples and to request food aid. Although the rains in 2000 were poor, those in 2001 were plentiful and well distributed. Millet, sorghum, and cassava are Niger's principal rainfed subsistence crops. Since the devaluation of the CFA franc, locally produced irrigated rice, though expensive, has been cheaper than imported rice. This has encouraged production.
4. Detailed country cas e s tudies
17
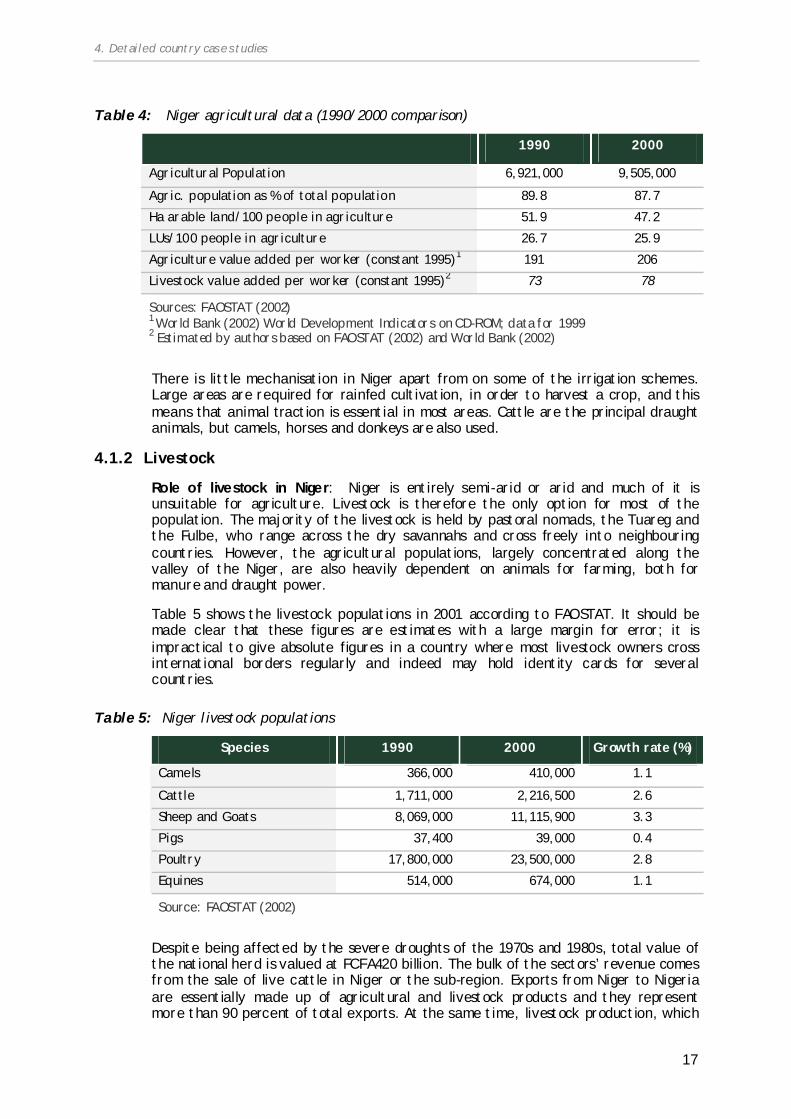
Table 4: Niger agricultural data (1990/2000 comparison)
1990 2000
Agricultural Population 6,921,000 9,505,000
Agr ic. population as % of total population 89.8 87.7
Ha arable land/100 people in agr iculture 51.9 47.2
LUs/100 people in agr iculture 26.7 25.9
Agr iculture value added per worker (constant 1995)1 191 206
Livestock value added per worker (constant 1995)2 73 78
Sources: FAOSTAT (2002) 1 World Bank (2002) World Development Indicators on CD-ROM; data for 1999 2 Estimated by authors based on FAOSTAT (2002) and World Bank (2002)
There is little mechanisation in Niger apart from on some of the irrigation schemes. Large areas are required for rainfed cultivation, in order to harvest a crop, and this means that animal traction is essential in most areas. Cattle are the principal draught animals, but camels, horses and donkeys are also used.
4.1.2 Livestock
Role of livestock in Niger: Niger is entirely semi-arid or arid and much of it is unsuitable for agriculture. Livestock is therefore the only option for most of the population. The majority of the livestock is held by pastoral nomads, the Tuareg and the Fulbe, who range across the dry savannahs and cross freely into neighbouring countries. However, the agricultural populations, largely concentrated along the valley of the Niger, are also heavily dependent on animals for farming, both for manure and draught power.
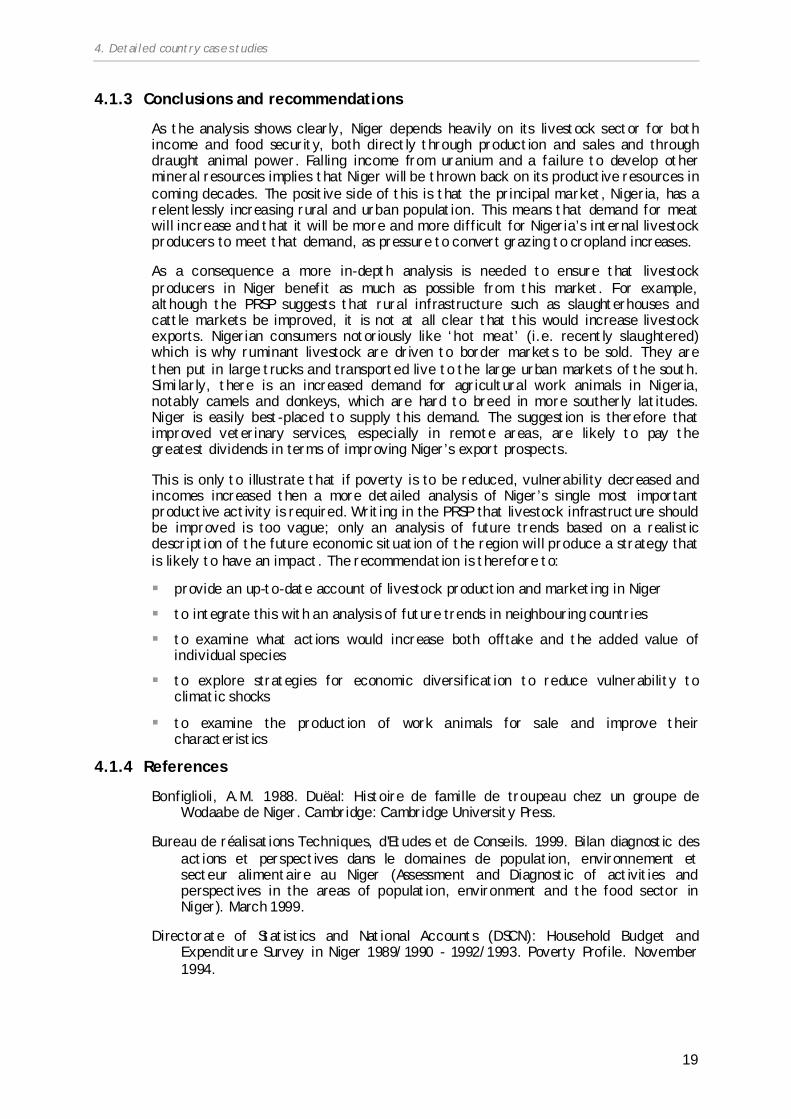
Table 5 shows the livestock populations in 2001 according to FAOSTAT. It should be made clear that these figures are estimates with a large margin for error; it is impractical to give absolute figures in a country where most livestock owners cross international borders regularly and indeed may hold identity cards for several countries.
Table 5: Niger livestock populations
Species 1990 2000 Growth rate (%)
Camels 366,000 410,000 1.1
Cattle 1,711,000 2,216,500 2.6
Sheep and Goats 8,069,000 11,115,900 3.3
Pigs 37,400 39,000 0.4
Poultry 17,800,000 23,500,000 2.8
Equines 514,000 674,000 1.1
Source: FAOSTAT (2002)
Despite being affected by the severe droughts of the 1970s and 1980s, total value of the national herd is valued at FCFA420 billion. The bulk of the sectors’ revenue comes from the sale of live cattle in Niger or the sub-region. Exports from Niger to Nigeria are essentially made up of agricultural and livestock products and they represent more than 90 percent of total exports. At the same time, livestock production, which
4. Detailed country cas e s tudies
18
accounted for more than 35 percent of agricultural GDP has been declining at nearly 2 percent a year.
From 1990 to 1999, key exports to Nigeria have averaged the following growth rates in volume: cattle (3.7 percent); goats and poultry (0.3 percent), camels (12 percent); raw hide and skin and leather (6.0 percent); cowpeas (-6.3 percent) and onions (-6.0 percent). The determinant factor of cattle exports to Nigeria is the under-populated Sahelian zone in northern Niger, a comparative advantage over a similar ecological zone in Nigeria where high population density constrains livestock development.
Livestock in the PRSP: Niger completed a full PRSP in January 2002. The PRSP document recognises the importance of livestock in the economy. Generally speaking, household surveys show that the principal sources of household income in Niger are the sale of farm produce and animals, other income generating activities, migrants' remittances and the sale of livestock by-products (PRSP p. 20).
Livestock are mentioned throughout the document as of major importance in Niger’s export market and the significance of cross-border sales to Nigeria is several times underlined. The reliance on livestock in a zone liable to climatic shocks is mentioned several times. Actions in support of livestock development come under the heading Agro-sylvo-pastoral development and food security. These are principally:
developing better procurement systems for equipment and inputs needed in agriculture, forestry, livestock production and veterinary medicine;
These do not really address the vulnerability of livestock producers who are subject to increasing climatic shocks nor do they explore how enterprises can be diversified to reduce reliance on single products.
Livestock development: The Government of Niger published its Framework Paper for the Rehabilitation of the Livestock Industry in Niger (Document cadre pour la relance du secteur de l’élevage au Niger) in 2001 as a basis for future livestock policy. This document calls for improved infrastructure, better veterinary services and so on. However, the issues for livestock producers in Niger are structural rather than technical; for example ensuring that herds have enough pasture and water, and reach markets in saleable condition.
The pastoral nomads of Niger depend on the pasture resources of many neighbouring countries, notably Nigeria and Chad. Every year, many herds migrate southwards to take advantage of the extended rains further south. But demographic growth in Nigeria and the expansion of cultivation along river basins is creating a significant reduction in pasture resources and access to cattle-watering points is gradually being reduced. The other consequence is a much elevated incidence of conflict with farmers. The government of Niger will need to take action in consort with the Nigerian government to resolve these issues before they escalate further.
Water is a significant constraint for livestock producers throughout the region. The lowest water supply coverage rates for people and livestock are to be found in the central zone, namely the farming and herding region. The major problems with this sub-sector are in the harnessing of water resources and the use of pastureland, poor distribution of waterworks, overgrazing near major pumping stations, and socio-economic problems, such as ownership of waterworks and conflicts between herders and farmers.
4. Detailed country cas e s tudies
19
4.1.3 Conclusions and recommendations
As the analysis shows clearly, Niger depends heavily on its livestock sector for both income and food security, both directly through production and sales and through draught animal power. Falling income from uranium and a failure to develop other mineral resources implies that Niger will be thrown back on its productive resources in coming decades. The positive side of this is that the principal market, Nigeria, has a relentlessly increasing rural and urban population. This means that demand for meat will increase and that it will be more and more difficult for Nigeria’s internal livestock producers to meet that demand, as pressure to convert grazing to cropland increases.
As a consequence a more in-depth analysis is needed to ensure that livestock producers in Niger benefit as much as possible from this market. For example, although the PRSP suggests that rural infrastructure such as slaughterhouses and cattle markets be improved, it is not at all clear that this would increase livestock exports. Nigerian consumers notoriously like ‘hot meat’ (i.e. recently slaughtered) which is why ruminant livestock are driven to border markets to be sold. They are then put in large trucks and transported live to the large urban markets of the south. Similarly, there is an increased demand for agricultural work animals in Nigeria, notably camels and donkeys, which are hard to breed in more southerly latitudes. Niger is easily best-placed to supply this demand. The suggestion is therefore that improved veterinary services, especially in remote areas, are likely to pay the greatest dividends in terms of improving Niger’s export prospects.
This is only to illustrate that if poverty is to be reduced, vulnerability decreased and incomes increased then a more detailed analysis of Niger’s single most important productive activity is required. Writing in the PRSP that livestock infrastructure should be improved is too vague; only an analysis of future trends based on a realistic description of the future economic situation of the region will produce a strategy that is likely to have an impact. The recommendation is therefore to:
provide an up-to-date account of livestock production and marketing in Niger
to integrate this with an analysis of future trends in neighbouring countries
to examine what actions would increase both offtake and the added value of individual species
to explore strategies for economic diversification to reduce vulnerability to climatic shocks
to examine the production of work animals for sale and improve their characteristics
4.1.4 References
Bonfiglioli, A.M. 1988. Duëal: Histoire de famille de troupeau chez un groupe de Wodaabe de Niger. Cambridge: Cambridge University Press.
Bureau de réalisations Techniques, d'Etudes et de Conseils. 1999. Bilan diagnostic des actions et perspectives dans le domaines de population, environnement et secteur alimentaire au Niger (Assessment and Diagnostic of activities and perspectives in the areas of population, environment and the food sector in Niger). March 1999.
Directorate of Statistics and National Accounts (DSCN): Household Budget and Expenditure Survey in Niger 1989/1990 - 1992/1993. Poverty Profile. November 1994.
4. Detailed country cas e s tudies
20
Gouvernement du Niger, UNDP, World Bank: Rural Sector: Public Expenditure Review for the period 1991-1998. September 2000;
Hülsebusch, C. & E. Schlecht 2000. The livestock sector of Niger. Stuttgart: Ulrich Grauer.
Ministry of Agriculture and Livestock 1997: Atlas du secteur agricole au Niger (Niger's Agriculture Sector Atlas). Niamey.
Ministry of Agriculture and Livestock 1999. Stratégie de croissance agricole durable (A Sustainable Agriculture Growth Strategy). Niamey.
Oxby, C. 1986. Women and the allocation of herding labour in a pastoral society (Southern Kel Ferwan Twareg, Niger). In : Le Fils et Le Neveu. Jeux et enjeux de la parenté touarégue, Publié sous la direction de S. Bernus, P. Bonte, L. Brock, H. Claudot, Chapter 5, 99-127. Cambridge: Cambridge University Press.
Swift, J.J. ed. 1984. Pastoral development in Central Niger. Final Report of the Niger Range and Livestock Project, Niger. Niamey.
Wilson, R.T., Wagenaar, K. and Louis, S. 1984. Animal production. In: Pastoral development in central Niger. Final report of the Niger Range and Livestock project to the Government of the Republic of Niger. J.J. Swift. ed. 69-144. Niamey: USAID.
World Bank (1994). Niger Poverty Assessment, Working Paper No. 1. « Eléments pour un profil de pauvreté »(Elements of a Poverty profile). Population and Human Resources Division, West Central Africa Department, Africa Region. The World Bank, Washington DC.
World Bank (1996). Niger Poverty Assessment : A Resilient People in a Harsh Environment. Population and Human Resources Division, West Central Africa Department, Africa Region. The World Bank, Washington DC.
World Bank (1997). « Country Assistance Strategy of the World Bank Group for the Republic of Niger », Country Department 13, Africa Region. The World Bank, Washington DC.
4.1.5 Websites
http://www.state.gov/r/pa/ei/bgn/5474.htm
http://www.uncdf.org/projects/eval/ner87c04.html
4.2 Ethiopia
4.2.1 Background
History: Ethiopia was a highly centralised monarchy until the early 1970s, when the Emperor was removed and control fell into the hands of the revolutionary Marxist regime, the Derg. Continuing insurrection in the regions and a decade of warfare in the 1980s resulted in extreme running down of national resources and infrastructure as well as isolation from the major donors. The fall of the Derg in 1991 has been followed by a decade of increasing stability and reform under the Federal Democratic Republic of Ethiopia. The border war with Eritrea in 1998-9 was marked by a suspension of aid by some donors. In addition, continuing insecurity in southern Sudan
has had the effect of making Ethiopia’s western borders unsafe for civilian populations.
Table 6: Ethiopia country data (1990/2000 comparison)
1990 2000
Human Population 51,180,000 64,298,000
Crude birth rate (per 1,000) 50.5 43.8
PPP GDP/capita 486.0 668.0
Human Development Index1 - 0.327
FDI % of GDP 0.2 0.8
Aid % of Govt. Expenditure 43.5 -
Sources: 1UNDP World Development Report (2002) World Bank (2002) World Development Indicators on CD-ROM
Continuing insecurity has conjoined with a troubling demographic situation to create a country permanently on the edge of food security crises, with a severely degraded environment. With a population of more than 67 million projected for 2002 (CSA 1999) and a land area of 1,127,000 km2, Ethiopia has a very high average population density (59 inhabitants/km2) in relation to most other countries in Sub-Saharan Africa. Ethiopia is one of the poorest countries in the world (ranked 171 out of 174) (UNDP 2000) reflecting its low per capita income, and a deteriorating food security situation. Average food supply per day and per capita is between 1,600 and 1,700 calories, only 70 percent of estimated requirements (World Bank 1999).
Ethiopia is a high mountainous plateau surrounded by arid and semi-arid rangelands, occupied principally by pastoral nomads who range freely across international borders. Arid and semi-arid pastoral areas make up approximately 60 percent of Ethiopia's land area. Although rainfall is high in much of the elevated region, sometimes permitting two cropping seasons a year, overpopulation and occasional failures of the rains have created a situation where the necessary continuing investment in soil and water conservation measures has not been undertaken. Hence even slight variations in precipitation can have extreme impacts on food security.
Agriculture: Land is the basic agricultural resource on which Ethiopian society presently depends for the production of food, clothing, energy and housing. Out of the 112.3 million hectares total land area, about 56 percent is regarded to be suitable for cultivation. However, only 14.8 percent of the total land is presently under cultivation for the production of annual and perennial crops.
Although the national economy is primarily agrarian, agriculture as a share of GDP has fallen from about 65 percent in 1960 to around 50 percent in 1997 (World Bank 2000b). Nevertheless, agriculture accounts for 80 percent of total employment, implying very low returns to labour. Moreover, increases in agricultural production have consistently failed to keep pace with population growth. High rates of labour absorption in agriculture, low growth rates in land productivity and stagnant labour productivity only increase demand for arable land. As land reserves in the Ethiopian highlands are extremely scarce, prospects for ecological sustainability and economic viability of current agricultural practices are poor (UNDP 1997). Besides supplying most domestic food requirements, agriculture provides raw materials for secondary industries and accounts for about 85 percent of exports.
4. Detailed country cas e s tudies
22
Table 7: Ethiopia agricultural data (1993/2000 comparison)
1993 2000
Agricultural Population 44,458,000 51,835,000
Agr ic. Population as % of total population 85.1 82.4
Ha arable land/100 people in agr iculture 22.5 19.3
LUs/100 people in agr iculture 43.0 42.9
Agr iculture value added per worker (constant 1995)1 142.6 139.2
Livestock value added per worker (constant 1995)2 57.3 50.9
Sources: FAOSTAT (2002) 1 World Bank (2002) World Development Indicators on CD-ROM; data for 1999 2 Estimated by authors based on FAOSTAT (2002) and World Bank (2002)
On the basis of altitude, temperature and rainfall, there are three main production zones in the country, namely, the high potential cereal zone, the low potential cereal zone and the high potential perennial zone. The highlands comprise the high potential cereal and perennial zones that constitute 36.3 percent of the total land area and support 88 percent of the human and 70 percent of the livestock population. The low potential cereal zone is in the lowlands. These constitute about 63.7 percent of the total land area of the country and support 12 percent of the human and 30 percent of the livestock population.
Until recently, the development of irrigation schemes has been minimal. The combination of land degradation and lack of adequate rainfall in some years have often caused crop failures. To stabilise and boost agricultural production, irrigated agriculture should be expanded. The lowlands of the country, with their large flat and fertile land, hold great potential for the development of large scale irrigation schemes. The potential gross irrigable area is estimated to be 3.5 million hectares but only 5 percent of this potential is used.
4.2.2 Livestock Role of livestock in Ethiopia: Livestock are an important component of nearly all farming systems in Ethiopia and provide draught power, milk, meat, manure, hides, skins and other products. The size and diversity of Ethiopia's major agro-ecological zones render it suitable for the support of large numbers and classes of livestock. The livestock population of Ethiopia is the largest in Africa and ranks ninth in the world. Livestock is found throughout the country, with the greatest concentration in the highlands, where more than 90 percent of domestic animals are located. The livestock sub-sector accounts for about 30 percent of the agricultural GDP and about 18 percent of the total GDP. Hides and skins are major foreign exchange earners, second only to coffee. The livestock sub-sector provides annual per capita consumption of about 23.9 kg of milk, 10 kg of meat and 40 eggs. Per capita meat consumption is high by developing countries' standards, an estimated thirteen kilograms annually. According to a 1987 estimate, beef accounted for about 50 percent of all meat consumption, followed by mutton and lamb (19 percent), poultry (15 percent), and goat (14 percent). Table 9 shows the 2001 livestock populations as reported in FAOSTAT.
4. Detailed country cas e s tudies
23
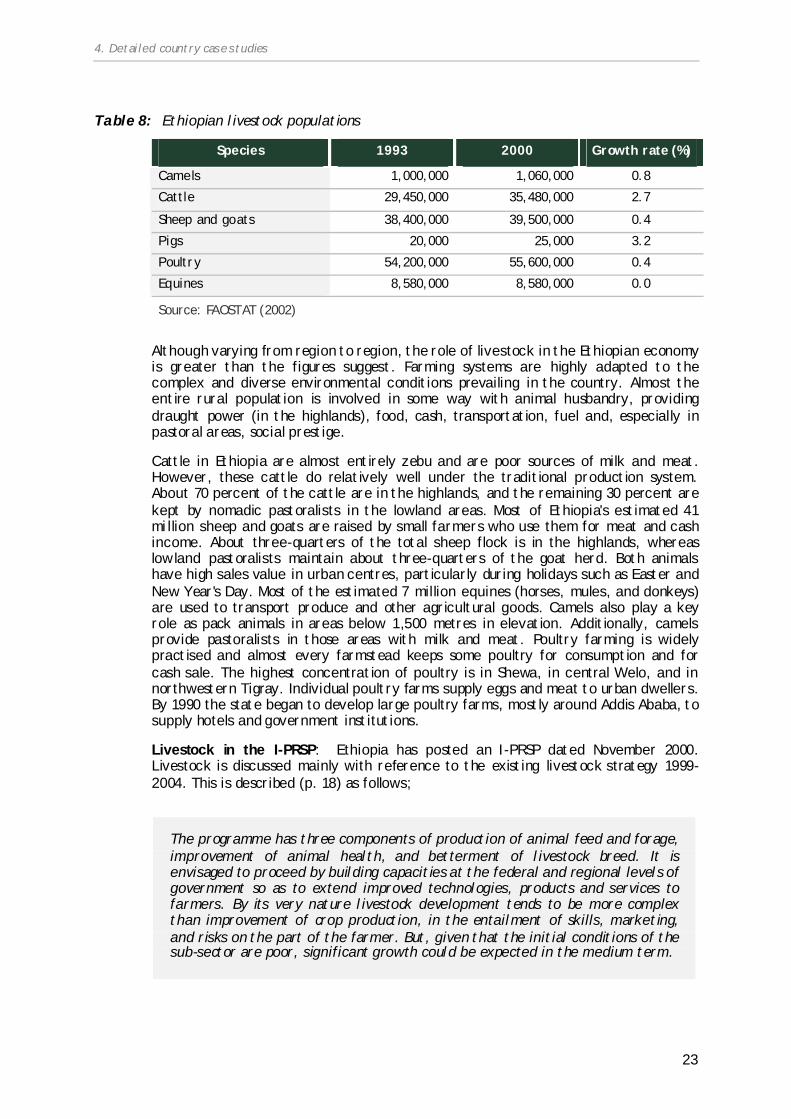
Table 8: Ethiopian livestock populations
Species 1993 2000 Growth rate (%)
Camels 1,000,000 1,060,000 0.8
Cattle 29,450,000 35,480,000 2.7
Sheep and goats 38,400,000 39,500,000 0.4
Pigs 20,000 25,000 3.2
Poultry 54,200,000 55,600,000 0.4
Equines 8,580,000 8,580,000 0.0
Source: FAOSTAT (2002)
Although varying from region to region, the role of livestock in the Ethiopian economy is greater than the figures suggest. Farming systems are highly adapted to the complex and diverse environmental conditions prevailing in the country. Almost the entire rural population is involved in some way with animal husbandry, providing draught power (in the highlands), food, cash, transportation, fuel and, especially in pastoral areas, social prestige.
Cattle in Ethiopia are almost entirely zebu and are poor sources of milk and meat. However, these cattle do relatively well under the traditional production system. About 70 percent of the cattle are in the highlands, and the remaining 30 percent are kept by nomadic pastoralists in the lowland areas. Most of Ethiopia's estimated 41 million sheep and goats are raised by small farmers who use them for meat and cash income. About three-quarters of the total sheep flock is in the highlands, whereas lowland pastoralists maintain about three-quarters of the goat herd. Both animals have high sales value in urban centres, particularly during holidays such as Easter and New Year's Day. Most of the estimated 7 million equines (horses, mules, and donkeys) are used to transport produce and other agricultural goods. Camels also play a key role as pack animals in areas below 1,500 metres in elevation. Additionally, camels provide pastoralists in those areas with milk and meat. Poultry farming is widely practised and almost every farmstead keeps some poultry for consumption and for cash sale. The highest concentration of poultry is in Shewa, in central Welo, and in northwestern Tigray. Individual poultry farms supply eggs and meat to urban dwellers. By 1990 the state began to develop large poultry farms, mostly around Addis Ababa, to supply hotels and government institutions.
Livestock in the I-PRSP: Ethiopia has posted an I-PRSP dated November 2000. Livestock is discussed mainly with reference to the existing livestock strategy 1999-2004. This is described (p. 18) as follows;
The programme has three components of production of animal feed and forage, improvement of animal health, and betterment of livestock breed. It is envisaged to proceed by building capacities at the federal and regional levels of government so as to extend improved technologies, products and services to farmers. By its very nature livestock development tends to be more complex than improvement of crop production, in the entailment of skills, marketing, and risks on the part of the farmer. But, given that the initial conditions of the sub-sector are poor, significant growth could be expected in the medium term.
4. Detailed country cas e s tudies
24
The importance of livestock in the economy is recognised, but there is little in the way of concrete description of its role and nothing to explain why future livestock development strategies will succeed where those in place at present clearly have not. In particular, the I-PRSP does not consider:
the role of food-aid and the long-term problems to which it is linked.
likely climatic futures for Ethiopia and their impact on pastoral production in the rangelands
the competition between agriculture and livestock grazing taking place in many regions of the highlands
Constraints to livestock production: Ethiopia has great potential for increased livestock production, both for local use and for export. However, expansion is constrained by inadequate nutrition, disease, a lack of support services such as extension services, insufficient data with which to plan improved services, and inadequate information on how to improve animal breeding, marketing, and processing. The high concentration of animals in the highlands, together with the fact that cattle are often kept for status, reduces the economic potential of Ethiopian livestock.
A number of economically important livestock diseases occur in Ethiopia. Animal health problems remain a major constraint, by limiting the improvement of production of the indigenous stock, restricting the introduction of more productive animals and new technology and constraining the country from entering the high priced foreign market. Among the diseases, those transmitted by insect vectors constitute one of the major constraints to the livestock industry. Apart from the trypanosomoses, these include babesiosis (B. bigemina); anaplasmosis (A . marginale); cowdriosis (Cowdria ruminantium) and theileriosis (T. mutans; T. velifera; T. orientalis) and tick-associated dermatophilosis. Furthermore, the country is continuously threatened from the neighbouring countries by these diseases and the vector tick species Rhipicephalus appendiculatus and Hyalomma anatolicum anatolicum.
Meat and milk yields are low and losses high, especially among calves and young stock. Contagious diseases and parasitic infections are major causes of death, factors that are exacerbated by malnutrition and starvation. Recurring drought takes a heavy toll on the animal population, although it is difficult to determine the extent of losses. Practically all animals are range-fed and during the rainy seasons, water and grass are generally plentiful, but with the onset of the dry season, forage is generally insufficient to keep animals nourished and able to resist disease.
Drought has the unfortunate effect of stimulating ethnic conflict as pastoralists compete for scarce fodder resources. In the north eastern Afar region nomadic Afaris are prevented from reaching grazing pastures because of long-standing conflicts with the ethnic Issa, Kereyu and Ittu groups. These conflicts have forced Afari pastoralists to change their usual migration patterns and they are now being denied access to traditional water points, as well as grazing areas for their livestock. Afari herdsmen have fled along with their surviving animals to the neighbouring states of Amhara, Oromia and Tigray.
Livestock development in Ethiopia: Unlike many African countries, the profile of livestock in Ethiopia is well-researched. For many years the International Livestock Centre for Africa (ILCA) was based in Addis Ababa, before it was amalgamated with ILRAD to form ILRI (International Livestock Research Institute) and transferred to Nairobi. Many interventions, such as the one-ox plough and the ox-drawn scoop were first tried out in Ethiopia and many studies undertaken of its various livestock systems. Regrettably, these interventions were never adopted and the long-term studies did not result in enhanced food security in the regions where they were conducted. Indeed, Ethiopia may well be a good example of the problems of quasi-
4. Detailed country cas e s tudies
25
academic sector-oriented research in livestock. Without a good appreciation of the socio-economic matrix in which livestock are embedded and a realistic understanding of national policy processes, no amount of on-station or quasi-on-farm research will produce sustainable results.
Livestock development has a long history in Ethiopia. Both the imperial and the Marxist governments tried to improve livestock production by instituting programmes such as free vaccination, well-digging, construction of feeder roads, and improvement of pastureland, largely through international organizations such as the World Bank and the African Development Bank. The Mengistu regime also opened veterinary stations at Bahir Dar, Buno Bedele, and Debre Zeit to provide treatment and vaccination services. The long-term development strategy, Agriculture-Development-Led-Industrialisation (ADLI) was adopted in 1994/95-1996/97 to bring about structural transformation of the economy, in which the relative weight of agriculture, industry and services would change significantly towards the latter two. ADLI revolves around productivity improvements in smallholder agriculture and industrialisation based on utilisation of domestic raw materials with labour-intensive technology. The contribution of agriculture to economic development is two-pronged. On the one hand, it supplies commodities to domestic food markets, domestic industries and for exports, and on the other, it will expand the market for industrial outputs.
A long-running expectation of typical livestock development is the clearance of tsetse in lowland areas and thus the creation of a more favourable environment for high-input/output production. To this end there have been programmes of this type since at least the 1960s and they are still continuing today. It seems uncertain as to whether tsetse clearance is really sustainable especially in the light of both civil insecurity and the other problems of maintaining high-input breeds (water, fodder etc.) in such an inaccessible area. Box 1 describes another approach, a USAID project to improve livestock marketing in the lowlands.
Box 1: Improving the livelihood of pastoralists in the Southern Tier area
USAID is funding a project to improve the livelihood of pastoralists in the Southern Tier area. The harsh environment, combined with ineffective social and political coordination, frequently results in conflict over control of available land and water. FY 2002 resources will be used to develop a livestock price information database. Market data will be collected, processed and transmitted to district level livestock marketing authorities. The database will increase the marketing efficiency of primarily the pastoralists and small "bush" traders who depend on up-to-date price information to assist them in determining the amount of herd off-take, the sex and age of off-take, and the most favourable market for selling animals. Secondary clients include the larger livestock traders at the cross-border markets and the terminal markets in the urban areas in Ethiopia, as well as researchers, policymakers and those who will use the database to inform the Famine Early Warning System. The database will be designed to be compatible with the needs of Ministry of Agriculture, Disaster Prevention and Preparedness Commission, Famine Early Warning System, livestock institutes and non-governmental organizations.
Of all the countries considered in the case studies, Ethiopia has by far the most intractable food security problems long-term. In the highlands, extreme demographic pressure is linked to soil degradation and thus difficulties in meeting the fodder needs of working animals. In the rangelands, a combination of civil insecurity, confused policy on borehole digging, food-aid and persistent, though largely predictable, low rainfall has meant that increased livestock mortality and recurrent famine have created humanitarian emergencies year after year. The situation in Ethiopia is sufficiently grave for analyses of exactly who the poor are, or exactly where they are located to be largely irrelevant; long-term policies based on reliable descriptive accounts leading to more thoughtful investment are required.
These issues are not squarely faced in the I-PRSP, which effectively suggests that present policies be simply continued. The evidence is that these have largely failed, especially in lowland communities, where drought is a way of life and civil insecurity on all international borders a major disincentive to investment in any type of improved production.
A few points emerge clearly from the analysis:
Policies for livestock and indeed for the agricultural sector as a whole in Ethiopia cannot be considered in isolation from food aid and other NGO activity. Food-aid has had a key role in maintaining populations in the lowlands which are not sustainable in periods of low precipitation. Similarly, government must take control of borehole insertion; remote boreholes typically generate ephemeral and thus precarious pasture resources.
Livestock policies in Ethiopia have been largely oriented towards commercial production, although this is irrelevant to the great majority of the population who only access larger animals for work. Investment should concentrate on improving veterinary care and feed of work animals, including camels, mules and horses, species typically little-considered in the design of development projects.
Livestock policies have also been developed in isolation from agriculture, although the importance of work animals suggests that the two are best treated as an integrated system, at least in the highlands. Issues of agricultural production and food security will only be resolved with the introduction of more intensive production systems, notably through soil and water conservation. These in turn would add value to existing livestock holdings.
Policies towards pastoral producers can only be developed in conjunction with other nation-states in the Horn of Africa. Rangelands are a regional problem and require a regional plan; whether it be water, animal health or pasture management. The present situation means that lack of development, disease or insecurity in one country causes pastoralists to flow across borders, creating unplanned pressure on the resources of another country.
If long-term famine cycles are to be halted pastoralists must have viable subsistence herds, which probably requires encouraging households with non-viable herds to leave the rangelands system. Although this will be politically problematic it is nonetheless essential. Pastoralists should also be encouraged to revert to camels in the more arid regions.
4. Detailed country cas e s tudies
27
4.2.4 References
Carr, C.J. 1977. Pastoralism in crisis, the Dasanetch and their Ethiopian lands. Department of Geography, Research Paper, 180. Chicago: University of Chicago.
Central Statistics Authority (2000). Land Utilisation (Private Peasant Holdings). Vol. IV. Statistical Bulletin 227. Addis Abeba
Central Statistics Authority (2001) Ethiopia Demographic and Health Survey 2000. Addis Ababa, May.
Gamaledinn, M. 1993. The Decline of Afar Pastoralism. In: Conflict and the Decline of Pastoralism in the Horn of Africa. Markakis, J. ed. 45-62. Basingstoke: Macmillan Press Ltd.
Helland, J. 1980. Five essays on the study of pastoralists and the development of pastoralism. Bergen: University of Bergen.
Helland, J. 1997. Development interventions and pastoral dynamics in Southern Ethiopia. In: Pastoralists, ethnicity and the state in Ethiopia. Hogg, R. ed. London: Haan.
Hogg, R. 1997b. ed. Pastoralists, ethnicity and the state in Ethiopia. London: Haan
Huntingford, C.W.B. 1955. The Galla of Ethiopia. London: International Africa Institute.
Institute of Development Research, September 1999. Socio-economic Survey in Nine Weredas in Debub Wello and Misrak Gojjam Zones. ANRS/Sida Cooperation in Rural Development. Addis Ababa University. IDR.
McCann, J. 1987. From poverty to famine in Northeast Ethiopia: a rural history, 1900-1935. Philadelphia: University of Pennsylvania Press.
Ministry of Economic Development and Co-operation, 1999. The Poverty Situation in Ethiopia, Addis Abeba
MOA 1995. Department of Land Use Study and Administration, Land Use Systems and Soil Conditions of Ethiopia, Addis Ababa, June
Perner, C. 1993. The Reward of Life is Death: Warfare and the Anyuak of the Ethiopian-Sudanese Border. Nomadic Peoples, 32:39-54.
Pratt, D.J., Le Gall, F. and De Haan, C. 1997. Investing in pastoralism: sustainable natural resource use in arid Africa and the Middle East. Washington, D.C. World Bank. World Bank Technical Paper no. 365.
Toulmin, C. 1987. Drought and the farming sector: Loss of animals and post-drought rehabilitation. Development Policy Review, 5, 2:125-148.
Toulmin, C. 1995. Tracking through drought: options for destocking and restocking. In: Living with uncertainty: new directions in pastoral development in Africa. I. Scoones (ed.) 95-115. London: Intermediate Technology Publications.
Turton, D. 1991. Movement, warfare and ethnicity in the lower Omo Valley. In: Herders, warriors and traders: Pastoralism in Africa. Galaty, J.G. and P. Bonte eds. 145-170. Boulder: Westview Press.
4. Detailed country cas e s tudies
28
Van Brabant, K. 1994. Cycles of Relief and Rehabilitation in Eastern Ethiopia: 1973–93. ODI Relief and Rehabilitation Network Paper 4. 21–46. London: Overseas Development Institute.
Wood, A. P. 1976. Farmers’ responses to drought in Ethiopia. In: Hussein, A.M. (ed.) Drought and Famine in Ethiopia, African Environment Special report 2. 67-88. London: International African Institute.
World Bank (2000b), Ethiopia: Transitions in a Poor Economy. Washington, D.C, June, 2000
World Bank, 1999, Ethiopia: Poverty and Policies for the New Millennium. Report No. 19804-ET, Washington D.C, October.
Recent history: Mozambique, originally a Portuguese colony, was abruptly given independence in 1975, after a long war of liberation led by FRELIMO. However, civil war soon developed with the South-African supported Renamo movement beginning attacks on basic infrastructure from 1982. This lasted for about a decade during which natural resources and wildlife were extensively destroyed or eliminated and many regions of the country mined. A ceasefire with Renamo was finally signed in October 1992, so Mozambique has had just about a decade of peace to recover. However, long-term damage to infrastructure, as well as climatic disasters have made this a slow process. Nonetheless, Mozambique has been the recipient of extensive foreign aid and indeed its GNP has increased steadily over the last decade.
Mozambique is relatively large and the human population low compared with its immediate neighbour Malawi, for example. Its demography has made it highly suitable for the establishment of Conservation Areas and tourism is beginning to contribute significantly to GNP. However, much of the country is low-lying and it is crossed transversely by several large rivers running out of central Africa which has meant that it is frequently the victim of flooding, notably of the Limpopo.
The large size of the country and the low population density make it difficult to invest in infrastructure, such as roads and rail, to link the north to the south. Connections tend to be better with neighbouring South Africa and indeed this is the major axis for the flow of goods and services. The Mozambican agricultural sector, like other sectors of the economy, is going through a process of rapid change, broadly related to the transition from war to peace, from a centrally planned to a market economy and from a one-party state to multi-party democracy.
The ranking of provinces according to their performance in terms of the Human Development Index (HDI) indicates the lowest figures for Zambezia, Nampula and Cabo
Delgado. The poor performance of these three provinces is repeated in terms of the other indicators that make up the HDI, namely life expectancy, levels of schooling, and GDP per capita. These provinces also suffer from the highest rates of human poverty. Maputo province and Maputo city, on the other hand, have the best results.
Table 9: Mozambique country data (1990/2000 comparison)
1990 2000
Human Population 14,151,000 17,691,000
Crude birth rate (per 1,000) 45.2 40.3
PPP GDP/capita 521.0 854.0
Human Development Index1 - 0.322
FDI % of GDP 0.4 3.7
Aid % of Govt. Expenditure - -
Sources:1UNDP World Development Report (2002) World Bank (2002) World Development Indicators on CD-ROM
Agriculture: Mozambique has some 36 million hectares of arable land, of which only an estimated 9 million hectares is currently in productive use. The wide diversity of soil types and the diverse climatic conditions in the country are suitable for a large variety of crops. Although only a small percentage of Mozambique's 35 million hectares of arable land is cultivated, agriculture is the backbone of the Mozambican economy, employing more than 80 percent of the workforce and contributing around 24 percent of the GDP. Mozambique holds a comparative advantage in some highly valuable crops. The main exports are copra, cashew nuts, sugar cane, cotton and tea. Other crops such as sisal and tobacco also have potential for exports. Most of the agriculture in Mozambique is non-irrigated, but with a network of over 60 rivers there is potential for irrigation schemes (estimated at 3.3 million hectares). Mozambique is one of the few countries in the southern African region that still has unclaimed land.
Table 10: Mozambique agricultural data (1990/2000 comparison)
1990 2000
Agricultural Population 10,723,000 13,911,000
Agr ic. Population as % of total population 78.5 76.1
Ha arable land/100 people in agr iculture 32.1 28.1
LUs/100 people in agr iculture 9.3 7.4
Agr iculture value added per worker (constant 1995 USD)1 123.8 138.1
Livestock value added per worker (constant 1995 USD)2 27 27
Sources: FAOSTAT (2002) 1 World Bank (2002) World Development Indicators on CD-ROM; data for 1999 2 Estimated by authors based on FAOSTAT (2002) and World Bank (2002)
During much of the last 15 years, Mozambique's agriculture sector has been seriously disrupted by civil war and drought. In periods of stability, 80-90 percent of the working population was engaged in agriculture. In the late 1960s, about 80 percent of all exports were of agricultural origin. Most of the unused cultivable agricultural land is in the central and northern provinces.
4. Detailed country cas e s tudies
30
As part of Mozambique's traditional socialist legacy, land is owned by the state. The state in turn leases parcels of land to individuals and companies for up to 50 years, with an option to renew. The system is designed to protect smallholder agriculture, and allow time to settle land disputes. However, the leasehold system has impeded economic growth since land cannot be used as collateral to finance investment. Although a politically sensitive issue, the state ownership of land has avoided land disputes experienced by neighbouring countries, although it is not uncommon for squatters to occasionally occupy unused land. The widespread dislocation of the Mozambican population during the war, along with the problem of land contaminated with land mines, has meant that many outstanding issues of land tenure, allocation and usage for resettling populations have still to be resolved. This has had an important impact on the potential for commercial sector investment in the agricultural sector, where access to suitable land and security of tenure is of primary concern.
A National Agricultural and Livestock Census was carried out by the Mozambican statistics Institute (INE) between September 2000 and March 2001. President Joaquim Chissano noted that the census showed very clearly how Mozambican agriculture "is based on the use of rudimentary production technologies. We must find ways of balancing new technologies with the rudimentary ones, improving the latter in a sustainable fashion which takes into consideration the preservation of the environment".
There are 3,064,715 farms - and 99.7 percent of these (3,054,106) are classified as "small farms". The total area under cultivation in 2000 was 3,925,324 hectares - 95.2 percent of this area (3,736,619 hectares) was accounted for by the small farms. The average size of a Mozambican farm is 1.28 hectares. For small farms, the average is 1.22 hectares, for medium farms 6.65 hectares, and for large farms (of which there are only 429 in the entire country) 282 hectares. Only 3.9 percent of farms (both of farms as a whole and of small farms) use irrigation, while 4.5 percent (again, both of all farms, and of small farms) use chemical fertiliser. 11 percent of all farms and 10.8 percent of small farms use animal traction, while 7.2 percent of all farms, but only 2.7 percent of small farms use pesticides. In 2000, 80.3 percent (3,152,034 hectares) of cultivated land was occupied with basic food crops. By far the most important of these were maize (40.2 percent) and cassava (20.2 percent).
4.3.2 Livestock
Role of livestock in Mozambique: The great majority of livestock in Mozambique is produced by smallholders, usually at subsistence level. The smallholder sector accounts for 85 percent of cattle, 98 percent of sheep, goats and pigs and almost all poultry in the country. Commercial livestock in Mozambique is very limited, holding only about 15 percent of cattle and 2 percent of small ruminants and pigs. Commercial livestock, however, is the major producer of milk. Traditional free range poultry account for about 30 percent of all production. Poultry production is an important source of income for rural populations for it is easy to handle, does not require much space, is affordable by low-income earners and has high investment returns. The major constraint to poultry production is Newcastle Disease.
Livestock production following the war, however, is very underdeveloped, with Mozambique currently importing much of its present requirements, particularly in poultry and pig production, and in the supply of feedstock to these industries. In the last years there has been a move away from centrally planned state intervention in agricultural management, pricing and marketing, towards a system of market allocation of agricultural resources, liberalised pricing policies and privatisation of state assets (including state farms and parastatals).
Estimated livestock populations for Mozambique (Table 11) differ widely when the results of the INE (Instituto Nacional Estatistico) and FAOSTAT are compared
4. Detailed country cas e s tudies
31
Table 11: Mozambique livestock populations
Species 1990 2000 Growth rate (%)
Cattle 1,380,000 1,320,000 -0.4
Sheep and Goats 506,000 517,000 0.2
Pigs 170,000 180,000 0.6
Poultry 22,650,000 28,670,000 2.4
Equines 20,000 23,000 1.4
Source: FAOSTAT (2002); Figures from INE for 2001 are cattle (722,199), goats (5,000,000), Pigs (2,400,000), chickens (22,600,000) and ducks (4,100,000)
Curiously no figures for buffalo are available, although Mozambique is one of the very few African countries to adopt water-buffalo for agricultural work on any scale.
Mozambique has potentially very good climatic and land conditions for the development of livestock activities. The cattle population in Mozambique just before independence was approximately 1.4 million head, and after plummeting to its lowest level of 200,000 in 1993, there has been a gradual increase. During the fifteen-year civil war, much of the livestock infrastructure (dip tanks, watering points, development stations, quarantine stations etc) were partially or totally destroyed.
The availability of good land and grazing suitable for cattle and other livestock farming activities should see significant growth in this sector in the future. The present stocks of cattle are concentrated in the south of the country, mainly in Maputo province, and in the north eastern part of Tete province. The household sector holds around 75 percent of the cattle stock, the other 25 percent being divided between private and State businesses. Small livestock are mostly concentrated in the north of the country, although they are significant in all the provinces except Niassa and Zambezia. The production of milk, meat, eggs and animal by-products are areas of prime concern in the development of a strategy for producers. The government is promoting the establishment of joint ventures with private investors in the poultry sector.
Livestock in the PRSP: Mozambique finalised its PRSP in April 2001. The PRSP highlights the role and importance of livestock for poverty reduction. Indeed possession of livestock is given the highest ranking in terms of assessing an individual’s wealth. The strategy includes detailed livestock related components, priority actions, targets and indicators but no budgetary breakdown. The main statement of the PRSP on livestock is contained in one of the ‘eight basic principles’ (p. 63);
Promote increased productivity in agriculture and animal husbandry and higher monetary income of rural households.
As the PRSP notes (p. 64), the basic principles of IFAD-supported Agricultural Sector Public Expenditure Programme- PROAGRI and the main objectives of SETSAN (the Technical Directorate for Food Security) identify four key strategic objectives based on the contribution of agriculture to poverty reduction:
(1) Raise the productive capacity and productivity of agriculture, forestry and animal husbandry in the family sector and the private sector using labour-intensive technologies, and sustainable management of natural resources.
4. Detailed country cas e s tudies
32
(2) Guarantee rights of access to land and reduce the bureaucracy associated with land registration.
(3) Promote the marketing of agricultural and livestock products, and facilitate the marketing of surpluses and access to markets (for factors of production as well as credit).
(4) Reduce the vulnerability of households and chronic food insecurity.
However, it should be remarked that livestock is not mentioned in PARPA (Mozambique’s M & E process) (p. 114) and only cash crops are included. Livestock numbers are treated as an indicator of poverty reduction although there are clearly methodological problems in a country with emerging wealth stratification. Finally, in the Action Plan (Annex p. 7) the activities are all essentially veterinary, rehabilitating laboratories, vaccinating against Newcastle Disease and refurbishing dipping tanks.
Livestock production constraints: Constraints to livestock development are both technical and institutional. The technical constraints include low and erratic rainfall, floods and drought, poor quality soils, difficult access (due to land mines), low level of irrigation development, poor crop management, weak input support services, high transportation costs, limited storage and processing capacity. The institutional constraints include poorly developed markets, lack of market information, lack of credit facilities, weak farmer organisations, and poor input supply systems due to poor communications and rural infrastructure.
Disease outbreaks have been a major constraint on the livestock subsector in Mozambique. The main diseases include Newcastle Disease, African swine fever, ticks and tick-borne diseases and trypanosomosis. The government has in the past endeavoured to control diseases through vaccination and dipping. The delivery of effective and efficient services to the livestock subsector is, however, constrained by budget limitations, the shortage of skilled animal health staff, limited institutional capacity for research and inadequate information on which to base animal health and disease-control programmes.
Although Mozambique’s agricultural research strategy identifies high-priority research areas that could increase livestock production and household income, it does not reflect an understanding of livestock production systems and their interrelationships with other agricultural production systems.
Livestock development: The agricultural sector in Mozambique is supported by a large number of overseas donors and NGOs, mostly operating on a bilateral project basis and mostly in smallholder agricultural development. The Ministry of Agriculture and Rural Development is responsible for the overall co-ordination of food security, land tenure, agricultural extension and integrated rural development programmes. Many of these projects are supported by international donors and technical assistance organisations, such as WFP, FAO, UNDP, IFAD and the European Union. All of these organisations are currently reviewing their support to the Mozambican agricultural sector with a view to reorienting their strategies away from food emergency/ relief programmes towards development/ production oriented programmes.
Bilateral and multilateral donors and NGOs are active in the sector, providing technical and financial support to agricultural development. An estimated 90 percent of the agricultural development budget is donor funded. Some of the main challenges facing the livestock sector are:
Much basic infrastructure serving the sector, including irrigation schemes, storage facilities, dip-tanks, abattoirs and veterinary services have been negatively affected during the war years. A major task is the rehabilitation of existing infrastructure and the construction of new facilities. This is the primary objective of the sector investment programme (SIP), but also gives rise to opportunities for
4. Detailed country cas e s tudies
33
private investment in construction/rehabilitation of agricultural infrastructure and provision of agricultural related services;
Mozambique's animal stocks have been heavily depleted (for example, cattle stocks fell from an estimated 1,400,000 in 1970 to 200,000 in 1993). Animal restocking programmes for the family and commercial farming sectors are a priority for the government. Mozambique has large areas of natural pasture suitable for cattle, despite the widespread occurrence of tsetse fly.
The existing linkages and relationship between smallholder agriculture (which involves approximately 85 percent of the Mozambican population) and commercial agriculture is not well defined. This is particularly true in the case of land allocation, where the potential for land disputes is an important issue that requires a solution. A land commission (Commissao de Terras) has been set up within the Ministry to tackle this and other land issues;
Commercial sector production is highly concentrated, with a small number of (mainly government/private sector joint venture) companies dominating production and wholesale distribution of Mozambique's main cash and export crops. Further investment is thus being encouraged in order to make these sectors more competitive and eliminate existing monopolistic practices;
The principal factors inhibiting the effective delivery of livestock services to smallholders in Mozambique include governmental budgetary limitations, public-sector domination of the delivery of veterinary services and inputs and poor management. A comprehensive strategy and programme has been elaborated for developing the agricultural sector, namely the IFAD-supported Agricultural Sector Public Expenditure Programme- PROAGRI, which began in January 1999. PROAGRI represents the totality of the agricultural sector public expenditure managed by the Ministry of Agriculture and Rural Development (MADER). The overall goal of PROAGRI is to help secure an appropriate enabling edifice for sustainable and equitable growth in the agricultural sector so as to reduce poverty and improve household food security, while protecting the physical and social environment. Its objective, in combination with other initiatives, is to create the conditions needed for sustainable and equitable growth in agriculture, forestry and livestock, contributing to poverty reduction and greater food security, while protecting the physical and social environment. With a five-year timeframe, the principal objective of PROAGRI is to: Create improved institutional mechanisms to finance and provide agricultural, forestry and animal husbandry services to the family sector, as well as the capacity to provide efficiently and effectively the essential public goods functions of the Ministry of Agriculture and Rural Development.
Since 2000, the restructuring of PROAGRI has gradually been taking place. PROAGRI was also considered inadequate in its treatment of economic, social and environmental criteria. An IFAD programme therefore set out to strengthen livestock research by supporting the collection of detailed baseline information and needs analysis through participatory and consultative processes and farming systems research (FSR) methodologies. The main goals were as follows:
To establish improved management and control strategies within the administration and management departments of the National Directorate of Livestock.
To form a unified extension system (UES) from the existing extension service of the National Directorate of Rural Extension and to provide international and national technical assistance to plan extension activities, formulate guidelines and build training capacity.
To support the introduction of the UES in the four pilot provinces of Gaza, Manica, Tete and Nampula through the provision of technical assistance, transport and the training of field staff in extension methodologies, planning and monitoring. Staff
4. Detailed country cas e s tudies
34
were to be assigned from the provincial livestock services to assist extension teams.
To support the development of community-based livestock services and demonstration projects through the establishment of a community development fund. The programme was to provide international technical assistance to prepare guidelines and procedures for the promotion of community-based self-help projects, farmers' groups and gender-related activities.
To provide support to conduct a study of the contribution of the livestock sector to poverty alleviation.
To establish zonal farming systems research (FSR) teams and a national FSR team and provide training and funds to enable the FSR teams to perform effective investigations into agricultural and livestock practices, with the participation of farmers. The programme also intended to strengthen the livestock research capability of two FSR teams in order to facilitate the collection of baseline information on production systems and disease.
To appoint an international specialist in FSR to advise and facilitate the establishment, planning, implementation and evaluation of participatory research and development using FSR methodologies and approaches.
Within animal health, the main goals are as follows:
To establish an Epidemiological Data Collection and Management Unit (EU) within the National Directorate of Livestock and to provide support facilities. Following the 2000 review, EU activities were refocused, so that the EU would address constraints relating to small ruminants and poultry, in addition to large ruminants. The programme was to support the EU in performing studies of rabies, Newcastle Disease, foot and mouth disease, brucellosis and tuberculosis and to provide vaccines, chemicals, sprays and drugs for disease control. Acaricides would be purchased from private local sources under a cost-recovery programme.
To support the free vaccination programme for the control of anthrax, blackquarter and foot and mouth disease and the provision of vaccines, a cold chain for vaccine distribution and storage and trypanocidal drugs.
To support the Newcastle Disease vaccination development programme through the provision of training, equipment, an egg-production flock and embryonated eggs. International and national technical assistance was to be supplied in poultry husbandry and the costs and benefits of vaccine production. The programme was also to assist in the development of extension material related to vaccination and poultry production and the establishment and training of village vaccinators.
To support the Institute of Veterinary Research in conducting research aimed at the control and surveillance of tick-borne, reproductive and poultry diseases. Activities would include epidemiological studies and monitoring, improvements in acaricide testing and assessment of tick resistance to acaricides.
To support training and the provision of technical advice on local disease control and eradication techniques.
To enhance the veterinary inspection of animals and animal products for human consumption.
To facilitate legal reform and the liberalisation of veterinary services through the recruitment of a legal consultant in animal health and in veterinary pharmaceuticals to prepare suitable legislation applicable to the livestock sector.
A Competitive Agricultural Research Grant Office was established within the National Agricultural Research Council to manage the research fund. The fund has supported four research activities concerning the impact of productivity factors on livestock
4. Detailed country cas e s tudies
35
management, helminthoses in small ruminants, African swine fever and brucella melitensis.
4.3.3 Conclusions and recommendations
Compared with the other countries considered in this study, Mozambique has more detailed documentation of livestock systems and a better analysis of its significance for poorer households. Mozambique had an emerging commercial sector prior to the liberation and civil wars but this has hardly begun rebuilding because of the damage to infrastructure and uncertain investment climate. Mozambique does not suffer from the problems of extreme pressure on land resources that characterise Ethiopia and Pakistan, nor is it affected by drought to the same extent (indeed flooding is a common problem). However, government agricultural policy as a whole is focussed more on cash crops than stock and more on the perceived ‘commercial’ cattle than the species actually held by poor people, namely goats and pigs. At the same time, animal health appears to be the focus of action under both externally funded development projects and in the government ministry. In particular, the Botswana model appears to be very influential, upgrading animal health to export to developed economies, while other strategies, such as integrating livestock production with wildlife conservation or developing local processing industries for pigs and chicken seem to be unconsidered. The dairy industry may be of importance to a limited number of urban consumers, but since most of the population is lactase-intolerant, it provides only a limited basis for national investment.
Despite the conclusion that ‘there is an increasing need to focus on small livestock, which are owned by a high proportion of the rural population’ (IFAD) the major re-orientation of policy this implies has yet to be undertaken. Mozambique has a significant number of working animals, especially draught-oxen, yet these are nowhere mentioned in the PRSP. The tools and data for the re-analysis of livestock data in the light of poverty priorities are available within the Mozambique government’s own statistical database and the political climate is almost certainly favourable. It seems that potential exists for undertaking a detailed strategy re-orientation if poverty is to be alleviated through livestock or indeed other natural resource interventions.
4.3.4 References
Cramer, C. and Pontara, N. (1997) Rural Poverty and Poverty Alleviation in Mozambique: What’s missing from the debate? Working Paper Series No. 68. Department of Economics. School of Oriental and African Studies, University of London.
Diesen, A. van (1999) Aid to Mozambique: an end to dependence? An assessment of the quality of aid to Mozambique, with special reference to British and EC aid for health and education.
Economist Intelligence Unit Country Profile. 2000. Mozambique. 1999-2000.
Ferraz, B. and Munslow, B. (1999) Sustainable development in Mozambique. Micoa in association with James Currey, Oxford.
IFAD. Formulation Report on the Family Sector Livestock Development Programme, June 1996. Rome: IFAD.
UNDP Human Development Report 1999.
United Nations Office for Project Services, Supervision Mission Report, April/May 1999.
Recent history: Laos, although a kingdom with an ancient history, was a French colony until 1953, when it became a constitutional monarchy. A guerrilla movement, the Pathet Lao, took over in 1960 and Laos became involved in the disorder and warfare related to American involvement in Việt Nam. The country is presently ruled by the Lao People’s Revolutionary Party (LPRP). For many years, Laos was effectively closed to outsiders and it has only begun to open up to both external investment and tourism in the 1990s. Laos has a major problem with UXO (unexploded ordnance) which remains a deterrent to farming in many areas and reduces potential income from tourism. GDP figures (I-PRSP p. 19) show that the share of agriculture in overall GDP has declined since 1992, services have remained static and industry has grown a little.
Table 12: Lao country data (1990/2000 comparison)
1990 2000
Human Population 4,033,000 5,279,000
Crude birth rate (per 1,000) 45.2 36.6
PPP GDP/capita 900.0 1,575.0
Human Development Index1 - 0.485
FDI % of GDP 0.7 4.2
Aid % of Govt. Expenditure - -
Sources:1UNDP World Development Report (2002) World Bank (2002) World Development Indicators on CD-ROM
Laos is landlocked; 80 percent of the country is mountainous and around only 3% is cultivated. The population is relatively low for such a large country and a combination of inaccessibility, the slow opening up to foreign investment and UXO has meant that Laos is one of the poorest countries in Asia. Laos has the highest degree of ethnolinguistic diversity in Asia (Chazée 1999) and a strong dichotomy exists between the densely-settled, lowland populations growing paddy rice and the more scattered mountain people still largely dependent on slash and burn agriculture. Laos is a major producer of opium, and given the poverty of most its population and the difficulties of marketing conventional crops, this will continue to be a significant livelihood option, despite strong pressure from external donors to switch to substitutes.
Agriculture: The agricultural sector can be characterised as an extensive, low input, low output system. Irrigation is still rare, double cropping equally scarce, and land quality overall is highly variable (World Bank 1995b:iv). Access to resources is
accordingly still relatively equally distributed with each family owning some 1.4 hectares of cultivable land on average. The range of land ownership is modest, with the lowest quintile of income distribution owning 1.29 hectares on average and the richest quintile only 1.72 hectares. Access to land does not seem to vary significantly with a household’s position on the income distribution scale (World Bank 1995b:45) The great majority of the rural population (96 percent) either possesses or has free access to land, but the average amount of land available to rural households is small and frequently of poor quality, particularly in the uplands. About three-quarters of the population only have access to dry land, 6 percent only cultivate irrigated land, and 13 percent cultivate dry and irrigated land. The interaction between access to land, land tenure regime and the conditions of land use will thus remain crucial to livelihoods (World Bank 1995b:45). The major determinant of poverty is the degree of self-sufficiency in rice production and the primary indicator of wealth is livestock ownership. A shortage of labour or cash for investing in land improvements are major causes of rural poverty.
Table 13: Lao agricultural data (1990/2000 comparison)
1990 2000
Agricultural Population 3,229,000 4,037,000
Agr ic. Population as % of total population 78.2 76.5
Ha arable land/100 people in agr iculture 24.7 21.7
TLUs/100 people in agr iculture 43.3 39.4
Agr iculture value added per worker (constant 1995)1 487.6 594.8
Livestock value added per worker (constant 1995)2 79 113.0
Sources: FAOSTAT (2002) 1 World Bank (2002) World Development Indicators on CD-ROM; data for 1999 2 Estimated by authors based on FAOSTAT (2002) and World Bank (2002)
In comparison with Vietnam, overall land distribution is relatively skewed at the bottom and the top end of the income distribution. There are significant regional variations in Laos with land distribution being most equitable in the north and least equitable in the middle of the country (World Bank 1995b:46 f). The relative availability of irrigation land, forests and wet lands marks the principal conditions of land use and of income generation in rural areas. There is private ownership for irrigated land, either individually or within the family, state ownership with plantations and communal property with pastures and forests, the access to which is no longer institutionally regulated (Groppo et al. 1995, Kirk 1994). Population growth, market integration and sectoral change are already leading to scarcity of land to varying degrees in various regions and accordingly exert pressure on existing land tenure regulations. Conditions of land use are rapidly changing reflecting population growth, internal migration, the substitution of forest use by farming, the destruction of farm land and forests, a loss in soil quality due to the Vietnam War, and the build-up of new market production structures in the former subsistence-oriented agriculture.
Access to agricultural land and forest lands of varying quality and differing land use patterns are unevenly distributed throughout the country and determine locally specific, flexible adaptive land tenure regulations. For the central and southern regions these are endowed with plains along the Mekong and other rivers which are irrigable and have fertile soils. The pressure on the land is already strongly noticeable (Groppo et al. 1995). Population densities of up to 350 inhabitants/km2 are not uncommon. In contrast, the northern region is very mountainous with nearly no irrigable land (World Bank 1995a:9). This has led to its economic isolation from the rest of the country due to extremely poor transport links.
4. Detailed country cas e s tudies
38
The low productivity of Lao PDR agriculture is suggested by the absence of any clear relationship between land type (irrigated, dry land, both) and household income. Only land size shows such a relationship, indicating that a typical Lao family would be better off with more land (World Bank 1995b:iv). Thus the most frequently cited farming problems are a regionally specific absolute shortage of land and an insufficient quality of land. Lao peasants themselves would prefer to extend or to improve their land to increase income; there is very little trend towards intensification through mechanisation or fertiliser.
Indications of the accelerated process of change in land use are seen in Xieng Khouang Province. For example, the opening up of new areas for irrigated cropping accompanied by a local scarcity of water as a result of the endangering of catchment areas through logging and shortened rotation periods for shifting cultivation. Declining soil fertility is reducing crop yields and creating greater weed competition. Further indicators are reduced forest cover caused by new settlements and the conversion of forests into farming fields, or a greater amount of time for gathering forest products on the basis of customary rights (Hirsch et al. 1994:4).
4.4.2 Livestock
Role of livestock in Laos: Laos has no pastoral zones. Livestock are kept principally for work and consumption/sale. Possession of buffaloes and pigs in particular are key indicators of wealth in rural communities. Pigs play an important role in the ritual cycle of many mountain peoples, while buffalo are essential to ploughing in the swampy lowlands. Apart from oxen and buffalo, horses continue a to play a role in transporting both goods and people to roadside locations.
Table 14 shows the livestock populations for Laos recorded in FAOSTAT. Sisouphanthong & Taillard (2000: 84-85) present a series of maps showing the geographical distribution of the principal species.
Table 14: Lao: livestock populations
Species 1990 2000 Growth rate (%)
Cattle 841,900 1,100,000 2.7
Buffaloes 1,071,757 1,028,000
Sheep and Goats 139,410 216,500 4.5
Pigs 1,372,100 1,425,000 0.4
Poultry 8,301,000 14,815,000 6.0
Equines 44,000 29,000 -4.1
Source: FAOSTAT (2002)
Although not listed in FAOSTAT, Laos is the last country in the region to have substantial numbers of working elephants, used mainly in logging (Sisouphanthong & Taillard 2000). They are, however, decreasing in use as in Thailand, where machinery has completely replaced them.
Draught animal power is still very important throughout the country. The application of draught animals and tractors is already increasing in peri-urban areas, market access is improving and profitable cash crop production is possible.
Poultry are important to household economy but there is almost no large-scale poultry production of the type that has become prevalent in neighbouring Thailand.
Livestock in the I-PRSP: Laos has an I-PRSP dated March 2001. Livestock are referred to throughout the report and defined as ‘primary indicators of wealth’ and a ‘high
4. Detailed country cas e s tudies
39
priority’ (p. 28). Livestock disease, improved livestock production and training of livestock extension offices are all considered a high priority (p. 40). Unlike many PRSPs, the strong emphasis on animal health and improved productivity suggests strongly both that there was genuine community consultation and that the responses are reflected in the document posted. However, the I-PRSP does not clearly distinguish between strategies for working animals; where the potential result is improved agricultural productivity and species that can be raised to generate income. From the point of view of government, livestock is seen as profitable replacement for opium production (p. 46), although the economics of this are not spelt out.
The investment priorities section of the I-PRSP has little or nothing to say about livestock, despite its relatively high profile in the report. The main disappointment is that under ‘strategies and measures’, it is suggested that a ‘diversified’ agricultural production system be developed, presumably through the expanded network of extension workers. Surprisingly, there is no focus on veterinary care, despite the priority accorded to animal health in the consultations and nothing about how markets to neighbouring countries could be expanded and facilitated. The I-PRSP also has nothing to say about Lao PDR’s considerable wildlife resources, although Laos is well-known among conservation bodies for both its stretches of uninhabited forest and its residual populations of species that have been virtually eliminated elsewhere in SE Asia (Duckworth et al. 1999).
Constraints on livestock development: Animal health is clearly the primary concern of small livestock producers in Laos, but a more troubling constraint is appearing on the horizon. The rate of land conversion is increasing with the market economy in Laos, especially in the vicinity of towns. Farm land is being sold to town dwellers, a phenomenon hitherto unknown in Laos. In the centre and south of the country there have been cases where village chiefs have sold community reserves, such as pasture, to outsiders (Groppo et al. 1995). This is more common where the land is near the road and has a high market value. Not only does this cause conflict within the village between those who support and those who oppose the sale, but it also disrupts livestock production. Pasture is becoming more scarce at a time when demand for livestock production and for draught animals is increasing (Groppo et al., 1995:22). This could lead to a serious decline in livestock keeping and a reduction in food resources. On the other hand, some farmers will intensify livestock keeping in view of higher income expectations using fodder cultivation on private land, by planting trees and shrubs, delivering fodder and offering a contribution to agro-forestry use. The dissemination of appropriate agricultural technology is therefore important.
Livestock development: Agricultural intensification will be based in future on rice crops and livestock production through an introduction of improved rice varieties, the use of fertilizers, double cropping in irrigated areas and manure or supplementary feeding of livestock (World Bank 1995a:19f). For this to happen, appropriate technical packages still have to be identified for the various agro-ecological zones. The gradual opening-up of the country has permitted the inception of some livestock projects.
The EC is presently supporting a project based in the Department of Livestock and Fisheries entitled Strengthening of Livestock Services and Extension Activities. Its focus is nationwide, with extension activities in Luang Prabang and Luang Namtha and it is due to continue to 2004. The general objective of the project is to enhance smallholders' financial autonomy and capacity of initiative by improving their income from livestock rearing. The specific objectives are:
to strengthen veterinary services and the extension network at all levels for an efficient and sustainable delivery of animal health and production services, and thereby,
to reduce disease incidence, improve management practice and increase livestock productivity.
4. Detailed country cas e s tudies
40
The immediate beneficiaries should be the livestock and extension services; the ultimate beneficiaries are the farmers, particularly smallholders, whose income and assets it is intended to secure. Project components include: legislative programme, information systems, laboratory services, extension and field services, regional and sub-regional co-operation, information and communication, management, monitoring & evaluation.
Sida/SAREC (the Swedish aid agency and the associated research body) supports a regional network on sustainable agriculture in South East Asia entitled Research cooperation for livestock-based sustainable farming systems in the lower Mekong basin. Participating institutions are the countries in the Lower Mekong Basin (Laos, Vietnam, Cambodia and Thailand). The core activities are research, research training, and exchange and dissemination of information. Sida also supports a Natural Resources Management Programme in Laos itself.
4.4.3 Conclusions and recommendations
Laos is in a situation rather analogous to Niger, as a relatively sparsely populated country with urbanised and more densely inhabited neighbours, notably Việt Nam and Thailand. These countries represent potentially very large markets for both stock on the hoof and processed livestock products. At present, Laos is making little use of this, probably due to a lack of meat processing facilities and a more advanced zoo-sanitary regime as well as a government that is only sporadically oriented towards external markets. Given this situation, the priorities are clear in terms of a poverty-oriented approach to livestock development;
Establishment of clearer tenurial regime in relation to land so that grazing and forest land is not converted to agriculture except as part of an overall land allocation plan
Improvement of animal health programmes oriented towards both export species and work animals
Survey potential internal and external markets for livestock and livestock products and facilitate internal movement of stock
Explore the potential for integrating certain types of livestock production with Conservation Areas aimed at wildlife and tourism
Laos is not yet under the demographic pressure that is affecting its neighbours and it should be able to take advantage of this to benefit the rural poor through agriculture, livestock, forestry and fisheries with a significant policy re-orientation.
4. Detailed country cas e s tudies
41
4.4.4 References
Bass, Stephen & Elaine Morrison (1994): Shifting Cultivation in Thailand, Laos and Vietnam. Regional Overview and Policy Recommendation, (IIED Forestry and Land Use Series, No. 2), London.
Bouderbala, Négib & Mohammed Ali Mekouar (1992): La Législation Foncière et Forestière au Laos, (rapport intérimaire), FAO, Rome.
Chazée, Laurent 1999. The peoples of Laos: rural and ethnic diversities. Bangkok: White Lotus.
Claridge, G.F. (compiler) (1995): An Inventory of Wetlands of the Lao PDR, (IUCN, UNEP), Thailand.
Department of Forestry, Lao PDR (1995a): Programme Document for Lao-Swedish Forestry Programme, Phase IV 1995-1999, (Draft), Vientiane.
Duckworth, J.W., Salter, R.E. & K. Khounboline 1999. Wildlife in Lao PDR: 1999 Status report. Vientiane: IUCN/WCS/CPAWM.
Gaston, Graham (1995a): Land Tenure, Use Rights and Titling of Agricultural and Forestry Land, Report 1: General Findings (NAWACOP, CPAWM/DoF), Vientiane.
Gaston, Graham (1995b): Land Tenure, Use Rights and Titling of Agricultural and Forestry Land, Report 2: Specific Suggestions (NAWACOP, CPAWM/DoF), Vientiane.
Groppo, Paolo et al. (1995): Politique de Régularisation Foncière pour une Agriculture Durable en RDP Lao, (PNUD, FAO), Rome.
Groppo, Paolo et al. (1996): Land Regularization Policy for Sustainable Agriculture in the Lao PDR, (UNDP, FAO), Rome.
Hansen, Peter Kurt & Houmchitsavath Sodarak (1995): Environment, socio-economic conditions and land-use in Thong Khang Sub-district, northern Laos, Luang Prabang.
Hirsch, Phil, Phanvilay K. & K. Tubtim (1994): Resource Management in Nam Ngum Watershed, Lao PDR, Vientiane.
Jones, P.R. (1995): Participatory Land Use Management Planning, (Interim Report, Lao-Swedish Forestry Programme 1991-1995), Vientiane.
Kirk, Michael 1996. Land Tenure Development and Divestiture in Lao P.D.R. Eschborn: GTZ.
Kuhnen, Frithjof (1996): Synthesis of Current State and Trends in Land Tenure and Land Policy in Asia. Experiences and Recommendations for Development Cooperation, (GTZ-Report), Eschborn.
Lao PDR (1994): Public Investment Program 1994-2000, (Putline), Vientiane.
Lao PDR (1995d): Order on Customary Rights and the Use of Forest Resources, Explanatory Attachment, Vientiane.
Lao PDR/GTZ (1994): Nam Ngum Watershed Conservation Project (NAWACOP), Preparation / Appraisal Mission, Main Report, Eschborn.
Nanni, Marcella (1992): La Législation des Eaux au Laos, (FAO), Rome.
4. Detailed country cas e s tudies
42
PDRC Project (1995): Status of Natural Resource Management in the Nam Ngum Basin, Vientiane.
Pham, Chi Do (ed.) (1994): Economic Development in Lao P.D.R.: Horizon 2000, Vientiane.
Schneider, Linda & Mostafa El-Erian (1994): Legal and Regulatory Framework: Recent Developments and Prospects, in: Pham, Chi Do (ed.). pp.107-112.
Sisouphanthong, B. & C. Taillard 2000. Atlas of Laos. Chiang Mai: Silkworm Books.
World Bank (1994): Lao People’s Democratic Republic Country Economic Memorandum, Washington, D.C.
World Bank (1995a): Lao PDR Agricultural Sector Memorandum. An Agricultural Sector Strategy. Washington, D.C..
World Bank (1995b): Lao PDR Social Development Assessment and Strategy. Washington, D.C.
Recent history: Pakistan is a low-income country with promising growth but its transition to a middle-income nation is held back by chronic problems including rapidly rising population, sizeable government deficits, heavy dependence on foreign aid, large military expenditures, and recurrent governmental instability. Recurrent flare-ups in the border conflict with India have ensured that high levels of military expenditure are continuing. Table 15 summarises salient features of Pakistan.
Analysis of poverty by socio-economic groups, focusing on key demographic and economic characteristics, suggests the following:
Poverty in Pakistan has remained fairly stable during the 1990s, from 29.3 percent in 1993-94 to 32.2 percent in 1998-99.
Poverty is considerably greater than urban areas. Poverty also varies significantly between provinces. NWFP has the highest rural as well as urban poverty followed by Punjab. Balochistan data for 1998-99 shows relatively low poverty; however, in other years, poverty in Balochistan is as high as in NWFP.
Households with a large number of children and single earning member are more likely to be poor and more than one-third of poor households are headed by elderly people who are dependent on transfer incomes, such as pensions and other forms of social support.
Poverty is (relatively) higher when heads of households are unskilled.
Education is the most important factor that distinguishes the poor from the non-poor. The percentage of literate household heads is 27 in poor households while for non-poor households it is 52.
The poor are also characterised by relatively low access to health related infrastructure such as sanitation.
On average the poor own only 0.27 acres per capita whereas the non-poor own 0.84 acres of cultivable land per capita In addition the poor are less able to diversify their agricultural production and are thus more susceptible to economic shocks.
The Human Development Index (HDI) rank of Pakistan is 119th of 146 countries, indicating low life expectancy at birth, low educational attainment and low income. The Gender-Related Development Index (GDI) rank of Pakistan is 120th of 146 countries. This illustrates that the human development gap is further aggravated by substantial gender disparities.
Table 15: Pakistan Country data (1990/2000 comparison)
1990 1999
Human Population 107,975,056 138,080,000
Crude birth rate (per 1,000) 41.4 33.8
PPP GDP/capita 1,394.0 1,928.0
Human Development Index1 - 0.499
FDI % of GDP 0.6 0.5
Aid % of Govt. Expenditure 12.7 5.2
Sources:1UNDP World Development Report (2002) World Bank (2002) World Development Indicators on CD-ROM
Agriculture: Although agriculture contributes a declining percentage of GDP it remains the single most important focus of employment especially for the poor. High levels of foreign aid may well imply that much urban enterprise is unsustainable. There is every reason to focus on crops and livestock in the alleviation of poverty and reduction of vulnerability.
Although about 48 million hectares or 60 percent of the land, consisting mostly of deserts, mountain slopes, and urban settlements is classified as unusable for forestry or agriculture, much of this does support livestock activity as rangeland. Thus, estimates of grazing land vary widely between 10 percent and 70 percent of the total area. A broad interpretation, for example, categorises almost all of arid Balochistan as rangeland for foraging livestock. Government officials listed only 3 million hectares, largely in the north, as forested in 1992. About 21.9 million hectares were cultivated in 1992. Around 70 percent of the cropped area was in Punjab, followed by perhaps 20 percent in Sindh, less than 10 percent in the North-West Frontier Province, and only 1 percent in Balochistan.
Since independence, the area of cultivated land has increased by more than one-third. This expansion is largely the result of expansion in irrigation. Substantial amounts of farmland have been lost to urbanisation and waterlogging, but losses are more than compensated for by additions of new land. In the early 1990s, many irrigation projects were begun in order to increase the area of cultivated land.
4. Detailed country cas e s tudies
44
Table 16: Pakistan agricultural data (1990/2000 comparison)
1990 1999
Agricultural Population 60,910,000 71,868,000
Agr ic. Population as % of total population 55.5 50.9
Ha arable land/100 people in agr iculture 33.6 29.6
TLUs/100 people in agr iculture 40.2 43.2
Agr iculture value added per worker (constant 1995)1 529.3 629.1
Livestock value added per worker (constant 1995)2 230 299
Sources: FAOSTAT (2002) 1 World Bank (2002) World Development Indicators on CD-ROM; data for 1999 2 Estimated by authors based on FAOSTAT (2002) and World Bank (2002)
The sparse rainfall over most of the country makes about 80 percent of cropping dependent on irrigation. Fewer than 4 million hectares of land, largely in northern Punjab and the North-West Frontier Province, are totally dependent on rainfall. An additional 2 million hectares of land are under non-irrigated cropping, such as plantings on floodplains as the water recedes. Non-irrigated farming generally gives low yields, and although the technology exists to boost production substantially, it is expensive to use and not always readily available.
Demographic growth and the family system that splits smallholdings between heirs has forced the contraction of mean size of landholdings and much grazing land for stock has disappeared. This has acted as a major brake on the diffusion of new technologies of farms as households have neither the capital nor the land to invest in improvements.
4.5.2 Livestock
Role of livestock in Pakistan: Livestock production in Pakistan can be divided between the large areas of rangelands, which are almost entirely the preserve of pastoral nomads and the highland and plains areas suitable for agriculture where livestock are kept as investment and for work. Livestock provides the only draught power available to most farmers as well as food, fuel, manure, wool, and hides. Livestock contributes about 26.4 percent of all the value of agricultural production (Mumtaz, 1993). Poultry, sheep and goats are very important to rural women for they are often the only source of income fully under their control (ESCAP, 1996).
There are about 5.2 million draught animals in the country. The principal draught animals are camels, donkeys, horses and mules. Cow and buffalo bullocks also provide traction power on farm and roads. Camels, donkeys and mules are the main pack animals. Horses are usually used for riding and traction power. Traditionally, livestock have been kept for draught and most of the meat and milk produced was consumed by the owner and his family.
Women make a considerable contribution to livestock production and this contribution is more visible than their work in crop production. Women involved in caring and rearing of livestock and poultry, carry out a wide range of tasks such as making feed concentrates, feeding, collecting fodder, grazing, cleaning animals and their sheds, making dung cakes, collecting manure for organic fertilizer, as well as milking, processing and marketing of animal products (making ghee, selling eggs, etc.) (ESCAP, 1997). In Pakistan, women are responsible for 60 percent to 80 percent of the feeding and milking of cattle (ESCAP, 1996). Women in Sindh and Punjab spend from one-fifth to a quarter of their daily working hours in livestock-related activities (Anwar and Bilquees, 1976; Freedman and Wai, 1988; Quadri and Jahan, 1982). Dairy production is
4. Detailed country cas e s tudies
45
very important for women in most provinces except Balochistan where the climate is not favourable to dairy cattle raising. With the exception of a few large cities, all fresh milk consumed in Pakistan is based on small domestic production run and managed by women (Paton, 1986).
Most rural families rear 3 to 5 buffaloes and cattle for milk production and try to meet their domestic demand. Some people sell their extra produce to neighbouring families. Due to the improvement of infrastructure and market roads, about 30 percent of smallholders are now producing milk for sale in the market. The development of urban or peri-urban commercial dairy farms is relatively recent; each dairy farm has 20 or more buffaloes and cows. Large commercial dairy herds range from 100-500 buffaloes and cattle.
In arid regions, sheep, goats, cattle and camels are kept for milk production, draught power and transport. The cattle are reared in some base areas where water and grazing facilities are usually available. Sheep, goats and camels are kept in either nomadic system or transhumant system. Nomadic flocks keep on moving constantly in search of grazing. Grazing is generally free of cost but in winter, when natural vegetation is scarce, livestock owners may need to buy feed from other sources or sell their animals. The price of sheep and goats in winter is therefore slightly lower than in the rainy season.
Table 17: Pakistan livestock populations
Species 1990 2000 Growth rate (%)
Camels 1,035,000 800,000 -2.5
Cattle 17,677,008 22,004,000 2.2
Buffaloes 17,373,008 22,669,000 2.7
Sheep and goats 61,144,000 71,500,000 1.6
Poultry 81,808,000 153,500,000 6.5
Equines 3,860,000 4,300,000 1.1
Source: FAOSTAT (2000)
Despite substantial increases in livestock production in the 1980s, the country faces shortages because of the limited amount of feed and grazing areas. In the 1980s, the government increased the size of cross-breeding programmes and took other measures to increase productivity, but production still fell short of demand. Commercial chicken farming is an exception because production using modern methods has expanded rapidly since the 1960s. Although many farmers raise some poultry, the commercial chicken farms account for most of the increased availability of eggs and poultry.
Livestock in the PRSP: Pakistan has posted an I-PRSP dated November 2001. Early in the document it is stated that improved livestock production would alleviate poverty (p. 12). Livestock is referred to as the principal safety-net in arid areas and the loss of stock in droughts as a major factor in food security, especially in Balochistan.
4. Detailed country cas e s tudies
46
Livestock raised by a large segment of the population, was actually the principal safety net in Balochistan. In times of exogenous shocks, as during the recent drought, livestock was the first line of defense to sustain households. The drought had wiped out around half of the livestock population in the province; therefore the government was focusing on programs for the renewal of this important instrument of poverty reduction. It was highlighted that drought had also resulted in the loss of precious water resources, as continued use led to low water tables in many parts of the province and depleted vegetation for livestock grazing (p. 15).
Surprisingly, livestock is not referred to again and does not appear in the matrix of policy measures. It is quite unclear what measures government considers necessary in view of the importance assigned to livestock and its specific importance in the household economy of poor families.
Constraints on livestock production: Prolonged drought in parts of Pakistan has decimated livestock and severely affected fruit and rainfed cereal production, according to a recent report issued by FAO and the World Food Programme (WFP). Hardest hit are Balochistan, and parts of Sindh and Punjab provinces, already in their third consecutive year of drought. Livestock numbers in some districts have been reduced by up to 60 percent of their 1999 levels. The report estimates that 349 000 drought-affected people -- including farmers who lost the bulk of their fruit trees, pastoralists and landless rural households -- will require emergency assistance until the next harvest.
The livestock sector plays an extremely important role in the country's economy, providing the main source of household income for many. In addition, animals play a crucial role in household food security, providing essential nutritional needs through meat and milk, particularly in remote pastoral areas with little or no access to alternative food sources. Large livestock losses, therefore, have a profound impact on household food security. Disease is a major source of production losses every year. However, rural livestock producers only give attention to fatal diseases and ignore less serious disease problems.
4.5.3 Conclusions and recommendations
Pakistan’s I-PRSP represents an unfortunate example of an analysis that simply ignores the opportunity to develop a rational strategy in relation to livestock, and indeed to almost all aspects of rural development, despite its apparent importance. It is clear that the ministry responsible has failed to make adequate representation as part of the consultative process. It is to be hoped that before the PRSP is issued this can be remedied. The key issues appear to be:
Collection of credible statistics relating to the numbers and distribution of different livestock species and their associated production systems
Analysis of the relationship between these production systems and strata of poverty
Elaboration of a credible strategy to overcome the principal constraints on improved livestock productivity
Development of a natural disasters response that will leave the rangeland areas with a sustainable production system.
4. Detailed country cas e s tudies
47
As in Ethiopia, the greatest problem in Pakistan is the massive demographic increase in rural areas that is reducing landholdings without corresponding intensification and other strategies to increase output. Soil exhaustion and erosion mean that households face a capital barrier in both introducing soil and water conservation or even purchasing fertiliser. This in turn makes the economics of draught animals and tractorisation problematic.
In the extensive rangeland areas, similar pressure on the land has led to droughts having much greater impact than previously. Boreholes in remote areas, scarce pasture and political insecurity have made it difficult for pastoral nomads to undertake their traditional migrations when there is a shortage of rainfall. Unless the PRSP addresses these issues much more directly, there is every reason to think the cycle of crisis will simply be exacerbated rather than alleviated.
Ahmad, S.I. 1983. Animal energy use in Pakistan Agriculture Progressive Farming, 3(3). 18-21.
Anonymous. -----. Buffalo Meat Production, U.S. Feed Grains Council, 1400 K St., N.W., Suite 1200. Washington, D.C 20005. USA.
Doni, A.H. 1974. The role of the nomadic tribes in Pakistan. In: Role of the Nomadic peoples in Central Asian civilisations. [No named ed.] 111-114. Paris: UNESCO.
Economic Survey. 2000-2001. Government of Pakistan, Finance Div. Economic Advisor's Wing, Islamabad.
FAO. 2002. Production Year Book. Rome, Italy.
Umrani, A.P. 1993. Animal Production in Pakistan, Asian Livestock, 18(7):73-76.
Gopalakrishnan, C.A. and G.M.M. Lal. 1985. Livestock and poultry enterprises for rural development, Vika-Publishing House Pvt. Ltd., 5-Ansari Road, New Delhi-110002, India.
Isani, G.B. and M.N. Baloch. 1996. Sheep and Goat Breeds of Pakistan. Press Corporation of Pakistan, Project Div. PO Box 3183, Karachi-75400.
Husnain, H.U. 1985. Sheep and goats in Pakistan. FAO Animal Health and Production Paper, 56. Rome: FAO.
Manig, W. ed. 1991. Stability and changes in rural institutions in North Pakistan. Institute of Rural Development, University of Göttingen. Aachen: Alano Verlag.
Manig, W. ed. 1992. Rural institutional development and its impact in Northwest-Pakistan. Institute of Rural Development, University of Göttingen. Aachen: Alano Verlag.
Quraishi, M.A.A., Khan, G.S. and M.S. Yaqoob. 1993. Range Management in Pakistan, Kazi Publications, 121-Zulqarnain Chambers, Ganpat Road, Lahore.
Younas, M. 1997. Rangelands and Animal Production. Constraints and Options. Desertification Control Bulletin. UNEP, Nairobi, Kenya. 31:30-36.
Some broad conclusions can be drawn from the in-depth study of the five countries reviewed.
livestock is generally under-represented in the PRSP process and output documents
greater attention is given to commercial operations than to the livestock species and structures relevant to the poor
the JSA procedure does not lead to any increased representation of livestock in PRSPs
where recommendations are made, all are of extreme generality (‘veterinary services should be improved’) and are thus unlikely to lead to improved outcomes relating to key issues
the current format of the PRSP process will not lead to realistic descriptions of the situation of livestock producers
despite the apparently participatory and consultative nature of the process the recommendations are always central and top-down suggesting that local opinion may be sought but is usually not incorporated into final documents
There appear also to be methodological problems with the assessment of the relationship between livestock holdings and the targeting of poverty. Livestock are seen as an indicator of household wealth in many countries (especially Ethiopia, Niger and Laos). It may simply be that the wealthy accumulate more stock, leaving the poorer strata in the same situation as before. This would increase the absolute national herd without making any impact on poverty alleviation.
In almost all the countries analysed, the share of GDP attributed to agriculture has been slowly falling during the 1990s, while the share of services and industry are static or rising. At the same time, the contribution of foreign aid to the overall budget is also increasing. This might be thought to support the ‘Washington consensus’ which, simplistically, holds that agriculture is on the way out and that concentration should be on the urban areas. But all the countries studied remain predominantly rural and what survey data exists does suggest that poverty is markedly concentrated in rural areas. Generally speaking, countries such as Ethiopia and Pakistan, with very dense populations, also have the most severe incidence of poverty because farmers simply cannot access sufficient land to feed their households. If poverty alleviation is the goal, then the focus on agriculture/livestock/forestry should be increased; assuming that the problems of rural areas will solve themselves would not seem to have any empirical basis.
It is not part of the brief of PRSPs to analyse erroneous past strategies, but when the same responses are adopted that have appeared almost endlessly in previous reports it is reasonable to consider why they should lead to different outcomes this time. In
addition, it is unclear what the relationship is between the gathering of national agricultural data and the recommendations for action. For example, in Mozambique, the government has undertaken a very significant national agricultural survey and produced a valuable compendium of data on rural areas. This surely could be the basis for the design of an innovative livestock and agriculture policy that was more directly targeted towards the smallholder. For example, the government’s own data shows how important pigs and goats are in rural production systems; yet the action plan is oriented towards cattle and poultry.
Going through the Natural Resources sections of the PRSPs other major gaps in data and its interpretation are apparent. For example, fisheries is even more under-represented than livestock; Mozambique, a country with one of the richest coastal fishing grounds in the world, barely mentions the topic. Wildlife is hardly dealt with in any PRSP, despite its importance as a revenue earner in Mozambique, Laos and Ethiopia. In many ways, therefore, an extremely old-fashioned view is being promulgated, namely that natural resources are essentially agriculture and that the integrated approach to environment that has been gradually adopted by research and donor institutions since the 1970s has no place in the calculations of economists.
50
RECOMMENDATIONS
The task that emerges very clearly both from the overall study and the case studies is to give livestock a higher profile in the PRSPs. Even the data presented there often show that livestock has greater importance in the economy than the responses outlined in the PRSP would appear to suggest. The situation can be summarised as follows;
1. Livestock is given a low profile as part of a broader inadequacy in the discussion of natural resource issues
2. If this profile is to be raised then representations should be in conjunction with other sectors
3. The profile of livestock should be based on a detailed empirical analysis of recent data and should reflect livestock issues relevant to the poor rather than those thought to be the source of economic growth
4. The recommendations should grow from the data and not be based on those of previous reports or older, now discredited, strategies
Any revisions to PRSPs should be in conjunction with other sectors. It would be ineffective to upgrade the livestock analysis and leave forestry and fisheries untouched. Obviously it can be most effective where only an I-PRSP has been published since there is more room for alteration and correction. Nonetheless, PRSPs are supposed to be ‘living’ documents and there is surely a case for well-argued changes to be inserted in the text of any posted document.
How can such change be effected? Since previous attempts by ministries of finance have fallen short of the data and interpretation required and deserved by the livestock sector, in future finance ministries should collaborate more closely with animal production specialists as well as with specialists from other agricultural subsectors. This in turn can only realistically be achieved through pressure from external agencies such as the IMF and the World Bank. Obviously, changing the nature of the JSA is important; but more important is to ensure that the actual structure whereby documents are created is transformed. A formal approach to the World Bank and IMF, preferably coordinated with other sectors, but also with other agencies such as IFAD, is the only possible strategy. This would have greater force if the relevant ministries in HIPC countries were to back such an approach. One strategy therefore would be to prepare a draft and take it around to selected countries, both those where livestock has been ignored and those where it has been relatively well represented, such as Mauritania, Albania and Yemen. If support could be gained in this area it would undoubtedly be more influential in Washington.
Advocacy groups and NGOs have played an important role in providing critical input to the PRSP process. They have tended to make points similar to those made here, that the focus on growth, rather than on the poor and their livelihoods, is a reflection of the Washington agenda and ignores priorities that grow out of a detailed understanding of conditions on the ground. Few NGOs, however, have focused particularly on natural resources issues with the exception of the environment. Nonetheless, their commitment makes them appropriate partners to excavate appropriate data when building a case for a more comprehensive understanding of the economies of PRSP countries and thus a more considered response. FAO could then provide background documentation to dovetail with the style of the PRSP documents, including financial and economic data as well as descriptive material.
If the PRSP documents are to provide the major framework for donor activity in the coming years then it would seem to be particularly important to reflect a broader
Recommendations
51
range of stakeholders rather than simply the economists’ growth-oriented approach. Bilateral donors who have shown an interest in other approaches should have a common interest with FAO in developing a structured revision of the PRSP documents.
52
REFERENCES
Heffernan C. 2000. The socio-economic impact of restocking destitute pastoralists: A case study from Kenya. PhD thesis, The University of Reading, Reading, UK.
Heffernan C. and Misturelli F. 2000. The delivery of veterinary services to the poor: Preliminary findings from Kenya. Report for DFID’s (Department for International Development) Animal Health Programme (AHP). VEERU (Veterinary Epidemiology and Economics Research Unit), The University of Reading, Reading, UK. 81 pp.
Heffernan C. and Sidahmed A. 1998. The delivery of veterinary services to the rural poor: A framework for analysis. Invited paper at the DSA Conference: Provision of Livestock Services, 12 June 1998, University of Reading, Reading, UK. 19 pp.
LID (Livestock In Development). 1999. Livestock in poverty-focused development. LID, Crewkerne. 95 pp.
World Bank. 2001. World development report 2000/2001: Attacking poverty. Oxford University Press, New York, USA. 335 pp.