International Journal of Advanced Technology in Engineering and Science www.ijates.com Volume No.02, Special Issue No. 01, September 2014 ISSN (online): 2348 – 7550 446 | Page A STUDY ON ACOUSTIC PROPERTIES OF POLYESTER AND HOLLOW POLYESTER NON WOVEN FABRICS Dr. R. Prathiba Devi Department of Apparel and Fashion Design, PSG College of Technology, India ABSTRACT Sound absorbing materials absorb most of the sound energy striking them and reflect very little. Therefore, sound-absorbing materials have been found to be very useful for the control of noise. They are used in variety of locations like close to source of noise in various paths and sometimes close to receiver. Porous sound absorbing materials have evolved into the advanced material over the year. Non-woven, as it’s a web structure can absorb more sound waves than other fabric structure. Non-woven produced from hollow polyester fibers blended with solid polyester fibers which are to be tested for sound reduction property. In this study, the effects of physical parameters on sound reduction properties of nonwoven fabrics were investigated. The samples including 50% solid polyester and 50% hollow polyester resulted in the best sound reduction in the mid-to-high frequency ranges. The increase in the amount of fiber per unit area resulted in an increase in sound reduction of the material. Keywords: Hollow Polyester, Non Woven, Polyester, Sound Reduction Property. 1. INTRODUCTION Today much importance is given to the acoustical environment. Noise control and its principles play an important role in creating an acoustically pleasing environment. This can be achieved when the intensity of sound is brought down to a level that is not harmful to human ears. [1] Noise is a major cause of industrial fatigue, irritation, reduced productivity and occupational accidents. Continuous exposure of 90dB or above is dangerous to hearing. Installation of noise absorbent barriers (made from wood and textiles) between the source and the subjects is one of the main methods of noise control. [2] Measurement techniques used to characterize the sound absorptive properties of a material are reverberant field method, impedance tube method and steady state method. Noise absorbent textile materials especially nonwoven structures or recycled materials have low production costs, low specific gravity and are aesthetically appealing. Acoustic insulation and absorption properties of nonwoven fabrics depend on fiber geometry and fiber arrangement within the fabric structure. [3] Materials that reduce the acoustic energy of a sound wave as the wave passes through it by the phenomenon of absorption are called sound absorptive materials. They are commonly used to soften the acoustic environment of a closed volume by reducing the amplitude of the reflected waves. Absorptive materials are generally resistive in nature, either fibrous, porous or in rather special cases reactive resonators. [4] Classic examples of resistive materials are non-woven, fibrous glass, mineral wools, felt and foams porous materials used for noise control are generally categorized as fibrous medium or porous foam. Fibrous media usually consists of glass, rock wool or polyester fibers and hollow polyesters have high acoustic absorption. Sometimes fire resistant fibers are also
Transcript
International Journal of Advanced Technology in Engineering and Science www.ijates.com
Volume No.02, Special Issue No. 01, September 2014 ISSN (online): 2348 – 7550
446 | P a g e
A STUDY ON ACOUSTIC PROPERTIES OF POLYESTER
AND HOLLOW POLYESTER NON WOVEN FABRICS
Dr. R. Prathiba Devi
Department of Apparel and Fashion Design, PSG College of Technology, India
ABSTRACT
Sound absorbing materials absorb most of the sound energy striking them and reflect very little. Therefore,
sound-absorbing materials have been found to be very useful for the control of noise. They are used in variety of
locations like close to source of noise in various paths and sometimes close to receiver. Porous sound absorbing
materials have evolved into the advanced material over the year. Non-woven, as it’s a web structure can absorb
more sound waves than other fabric structure. Non-woven produced from hollow polyester fibers blended with
solid polyester fibers which are to be tested for sound reduction property. In this study, the effects of physical
parameters on sound reduction properties of nonwoven fabrics were investigated. The samples including 50%
solid polyester and 50% hollow polyester resulted in the best sound reduction in the mid-to-high frequency
ranges. The increase in the amount of fiber per unit area resulted in an increase in sound reduction of the
material.
Keywords: Hollow Polyester, Non Woven, Polyester, Sound Reduction Property.
1. INTRODUCTION
Today much importance is given to the acoustical environment. Noise control and its principles play an
important role in creating an acoustically pleasing environment. This can be achieved when the intensity of
sound is brought down to a level that is not harmful to human ears. [1] Noise is a major cause of industrial
fatigue, irritation, reduced productivity and occupational accidents. Continuous exposure of 90dB or above is
dangerous to hearing. Installation of noise absorbent barriers (made from wood and textiles) between the source
and the subjects is one of the main methods of noise control. [2] Measurement techniques used to characterize
the sound absorptive properties of a material are reverberant field method, impedance tube method and steady
state method. Noise absorbent textile materials especially nonwoven structures or recycled materials have low
production costs, low specific gravity and are aesthetically appealing. Acoustic insulation and absorption
properties of nonwoven fabrics depend on fiber geometry and fiber arrangement within the fabric structure. [3]
Materials that reduce the acoustic energy of a sound wave as the wave passes through it by the phenomenon of
absorption are called sound absorptive materials. They are commonly used to soften the acoustic environment of
a closed volume by reducing the amplitude of the reflected waves. Absorptive materials are generally resistive
in nature, either fibrous, porous or in rather special cases reactive resonators. [4] Classic examples of resistive
materials are non-woven, fibrous glass, mineral wools, felt and foams porous materials used for noise control
are generally categorized as fibrous medium or porous foam. Fibrous media usually consists of glass, rock wool
or polyester fibers and hollow polyesters have high acoustic absorption. Sometimes fire resistant fibers are also
International Journal of Advanced Technology in Engineering and Science www.ijates.com
Volume No.02, Special Issue No. 01, September 2014 ISSN (online): 2348 – 7550
447 | P a g e
used in making acoustical products. [5] An absorber, when packed by a barrier, reduces the energy in a sound
wave by converting the mechanical motion of the air particles into low grade heat. This action prevents a
buildup of sound in enclosed spaces and reduces the strength of reflected noise. [4]
In this study the non woven fabrics were produced with spun lace technology, in future it can also be produced
with thermal bonding and melt blown technology. Hollow polyester/ polyester have shown good sound
absorption properties so that they can be used for different applications like draperies, ear muff, etc., with any
kind of sound absorption chemical treatment also. [6]
2. MATERIALS AND METHODS
2.1 Materials
Solid polyester fibers and hollow polyester fibers are used for preparation of spun lace non-woven fabrics. A
study also showed that fine denier fibers ranging from 1.5 to 6 denier per filament (dpf) perform better
acoustically than coarse denier fibers. [7] Polyester fibers are blended with hollow polyester in 2:2, 3:1 ratios
and 100% polyester with different GSM. Physical properties of the fibers are shown in Table 1.
Table.1 Physical properties of the fibers
Fiber Count Staple length
Solid polyester 6 denier 64 mm
Hollow polyester 6 denier 64 mm
2.2 Methods
The sourced and procured solid polyester and hollow polyester fibers were blended in three different ratios, to
produce non- woven fabric by spun lace technology suitable for acoustic end use. The basic parameters like
GSM, thickness and air permeability tests were analyzed for the non-woven fabrics and the sound reduction
properties of non - woven fabric were also analyzed using sound reduction tester apparatus.
2.2.1 Fabric weight (GSM)
Fabric sample of 5 cm X 5 cm was taken and weighed (w). The weight (w) is used to calculate GSM using the
formula,
GSM= (w * 25) / 10000
2.2.2 Fabric Thickness
The thickness of the fabric is measured using the standard TS 7128 EN ISO 5084. A piece of fabric is placed on
the reference plate of the instrument ensuring that there are no creases in the fabric. While placing the fabric it
should not be subjected to any stretch. The pressure foot is gradually brought down and after allowing it to rest
on the fabric for 30 sec, the gauge reading is taken.
International Journal of Advanced Technology in Engineering and Science www.ijates.com
Volume No.02, Special Issue No. 01, September 2014 ISSN (online): 2348 – 7550
448 | P a g e
2.2.3 Air permeability
The fabric transport property most sensitive to fabric structure is air permeability, defined as the volume flow
rate per unit area of a fabric when there is a specified pressure differential across two faces of the fabric. Air
permeability of the samples were measured based on the standard TS 391 EN ISO 9237 method, using FX 3300
air permeability tester. The measurements performed at a constant pressure drop of 100 Pa (20 cm2 test area).
All the tests were performed under standard atmospheric conditions (20ºC, 65 %RH).
2.2.4 Thermal Conductivity
There are number of possibilities to measure thermal conductivity. The most commonly used methods are
Searle’s method and Lee’s disc method, for good and bad conductors of heat respectively, each of them being
suitable for a limited range of materials, depending on the thermal properties and the medium temperature. In
this study Lee’s disc method is used to determine the thermal conductivity of a bad conductor, e.g. Glass. The
formula used for the calculation is
Where,
m - Mass of the Lee’s disc = 870 x 10-3
kg
s – Specific heat capacity = 370 J Kg-1
K-1
d – Thickness of the sample (m)
r – Radius of the Lee’s disc (m2)
θ₁– steam chamber temperature (°C)
θ₂ – metal chamber temperature (°C)
2.2.5 Evaluation of sound insulation
Measurement techniques used to characterize the sound absorptive properties of a material are: a) Reverberant
Field Methods and b) Impedance Tube Methods. [8]A simple testing apparatus has been set up to measure the
permeability of sound through a spun laced non - woven fabric. It consists of sound insulating box made of thick
cardboard sheet with removable top lid. Inside one vertical wall of this box a sound source and decibel meter is
fixed. On the other side (to adjust the distance between sound source and receiver) of the vertical wall a decibel
meter is fixed opposite to the sound generator to measure the sound intensity. In between these two decibel
meters the sliding arrangement is kept to fix the sample vertically.
International Journal of Advanced Technology in Engineering and Science www.ijates.com
Volume No.02, Special Issue No. 01, September 2014 ISSN (online): 2348 – 7550
449 | P a g e
Fig. 1 Schematic view of the experimental set-up
The sound of particular decibel is created by the control panel. The source decibel and recipient decibel
have been measured by two decibel meters S and R respectively without and with fabric sample. The reduction
responsible for fabric which is expressed in the measure of sound insulation can be calculated as given below
dBF = (Decibel Reduction with Sample) - (Decibel Reduction without Sample)
dBF = (dBS-dBR)ws - (dBS-dBR)wos
Where, dBF - sound reduction responsible for fabric; dBS - sound intensity at source; dBR - sound intensity at
receiver; WS- with sample; WOS-without sample. The samples were tested applying the above procedure
and results were obtained.
3 RESULTS AND DISCUSSION
3.1 Non woven fabrics GSM
Table 2. GSM of the non woven fabrics
Fiber Proportion
GSM of the non woven fabrics
82 GSM 52 GSM
100% Polyester Sample A Sample A1
25/75 (Hollow
Polyester/Polyester) Sample B Sample B1
50/50 (Hollow
Polyester/Polyester) Sample C Sample C1
Based on the GSM, the samples with 82 GSM were named as A, B, C for 100% polyester, 25/75 (Hollow
Polyester/Polyester), 50/50 (Hollow Polyester/Polyester) respectively and the samples with 52 GSM were
named as A1, B1, C1 for 100% polyester, 25/75 (Hollow Polyester/Polyester), 50/50 (Hollow
Polyester/Polyester) respectively.
International Journal of Advanced Technology in Engineering and Science www.ijates.com
Volume No.02, Special Issue No. 01, September 2014 ISSN (online): 2348 – 7550
450 | P a g e
3.2 Fabric Thickness
Table 3. Fabric Thickness of the non woven fabrics
Sample Name Thickness (mm)
A 0.54
A1 0.46
B 0.58
B1 0.49
C 0.76
C1 0.57
The thickness of the non-woven samples measured using thickness gauge was given in Table 3. Numerous
studies that dealt with sound absorption in porous materials have concluded that low frequency sound absorption
has direct relationship with thickness.[9] It is observed that the samples with higher GSM (A, B, C) showed
higher thickness than the samples A1, B1, C1. Thicker the material better the sound absorption values.
3.3 Air Permeability & Thermal Conductivity
Table 4. Air Permeability & Thermal Conductivity of the non woven fabrics
Sample Name Air Permeability
(cm3/cm
2/s)
Thermal Conductivity
(Wm-1
K-1
)
A 249.1 0.02
A1 1245.1 0.01
B 415.6 0.14
B1 1239 0.06
C 311.38 0.02
C1 1245.1 0.01
Table 4 shows the air permeability and thermal conductivity of the non-woven samples. The samples A1, B1,
C1 shows higher air permeability rate than the samples A, B, C which shows comparatively lesser air
permeability. Also fibers interlocking in non-woven are the frictional elements that provide resistance to
acoustic wave motion. [10]This is also due to density of fibers being high in samples with higher GSM which
reduces air transfer rate. The thermal conductivity co-efficient of the non-woven fabric samples A, B, C, A1,
B1, C1 are 67%, 70%, 50%, 33%, 30% and 50% respectively. 100% polyester fabrics and fabrics with higher
GSM show higher thermal conductivity. Also Samples C, C1 which has equal percentage of polyester and
hollow polyester fibers showed same percentage of thermal conductivity.
International Journal of Advanced Technology in Engineering and Science www.ijates.com
Volume No.02, Special Issue No. 01, September 2014 ISSN (online): 2348 – 7550
451 | P a g e
3.4 Evaluation of sound insulation
3.4.1. Sound insulation of Sample A
Fig. 2 Sound absorption of sample A at 25 cm distance
Fig. 3 Sound absorption of sample A at 50 cm distance
Fig. 4 Sound absorption of sample A at 75 cm distance
Fig. 2, 3, 4 shows the sound absorption property of sample A (100% polyester) non-woven fabric with 82gsm,
which is evaluated with the frequency of 400 to 4000 Hz at a distance of 25cm, 50 cm, 75 cm respectively. The
fabric was evaluated up to 6 layers; it is inferred that the sound reduction increased with increase in layers of
fabric at a maximum frequency of 4000 Hz.
International Journal of Advanced Technology in Engineering and Science www.ijates.com
Volume No.02, Special Issue No. 01, September 2014 ISSN (online): 2348 – 7550
452 | P a g e
3.4.2. Sound insulation of Sample A1
Fig. 5 Sound absorption of sample A1 at 25 cm distance
Fig. 6 Sound absorption of sample A1 at 50 cm distance
Fig. 7 Sound absorption of sample A1 at 75 cm distance
Fig. 5, 6, 7 shows the sound absorption property of sample A1 (100% polyester) non-woven fabric with 52gsm,
which is evaluated with the frequency of 400 to 4000 Hz at a distance of 25cm, 50 cm, 75 cm respectively. The
International Journal of Advanced Technology in Engineering and Science www.ijates.com
Volume No.02, Special Issue No. 01, September 2014 ISSN (online): 2348 – 7550
453 | P a g e
fabric was evaluated up to 6 layers; it is inferred that the sound reduction increased with increase in layers of
fabric at a maximum frequency of 4000 Hz.
3.4.3. Sound insulation of Sample B
Fig. 8 Sound absorption of sample B at 25 cm distance
Fig. 9 Sound absorption of sample B at 50 cm distance
Fig. 10 Sound absorption of sample B at 75 cm distance
International Journal of Advanced Technology in Engineering and Science www.ijates.com
Volume No.02, Special Issue No. 01, September 2014 ISSN (online): 2348 – 7550
454 | P a g e
Fig. 8, 9, 10 shows the sound absorption property of sample B (25/75 Hollow Polyester/Polyester) non-woven
fabric with 82gsm, which is evaluated with the frequency of 400 to 4000 Hz at a distance of 25cm, 50 cm, 75
cm respectively. The fabric was evaluated up to 6 layers; it is inferred that the sound reduction increased with
increase in layers of fabric at a maximum frequency of 4000 Hz.
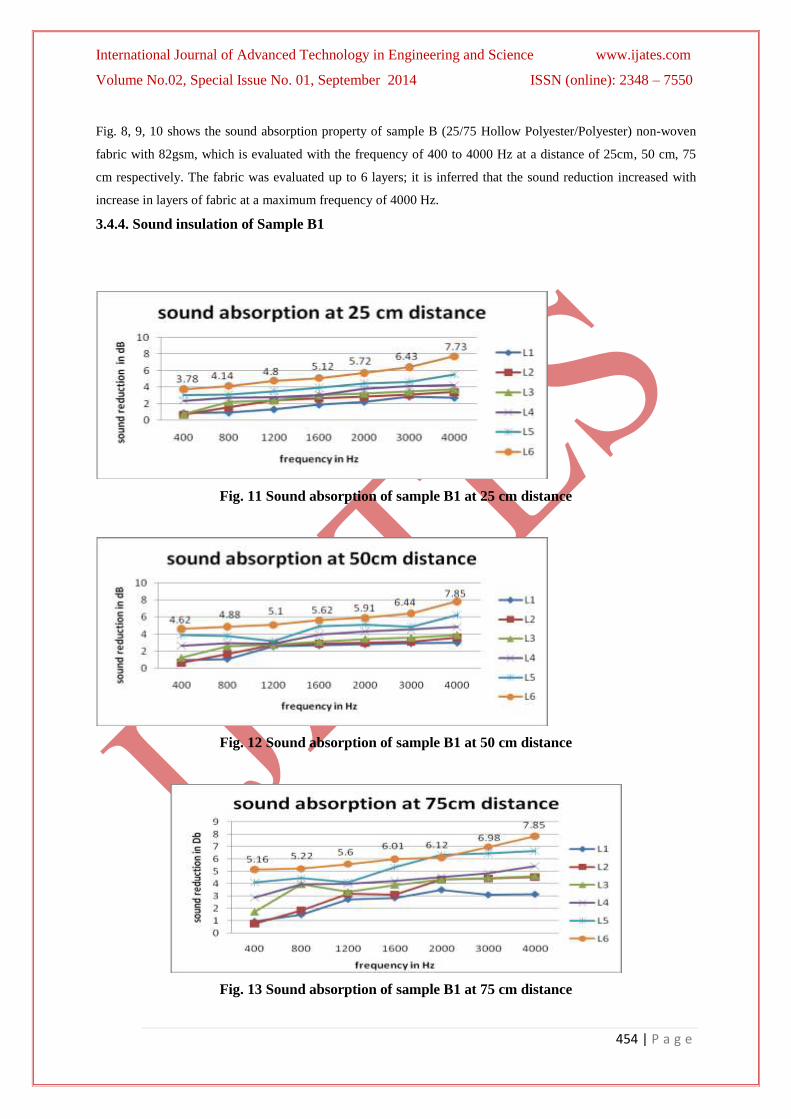
3.4.4. Sound insulation of Sample B1
Fig. 11 Sound absorption of sample B1 at 25 cm distance
Fig. 12 Sound absorption of sample B1 at 50 cm distance
Fig. 13 Sound absorption of sample B1 at 75 cm distance
International Journal of Advanced Technology in Engineering and Science www.ijates.com
Volume No.02, Special Issue No. 01, September 2014 ISSN (online): 2348 – 7550
455 | P a g e
Fig. 11, 12, 13 shows the sound absorption property of sample B1 (25/75 Hollow Polyester/Polyester) non-
woven fabric with 52gsm, which is evaluated with the frequency of 400 to 4000 Hz at a distance of 25cm, 50
cm, 75 cm respectively. The fabric was evaluated up to 6 layers; it is inferred that the sound reduction increased
with increase in layers of fabric at a maximum frequency of 4000 Hz.
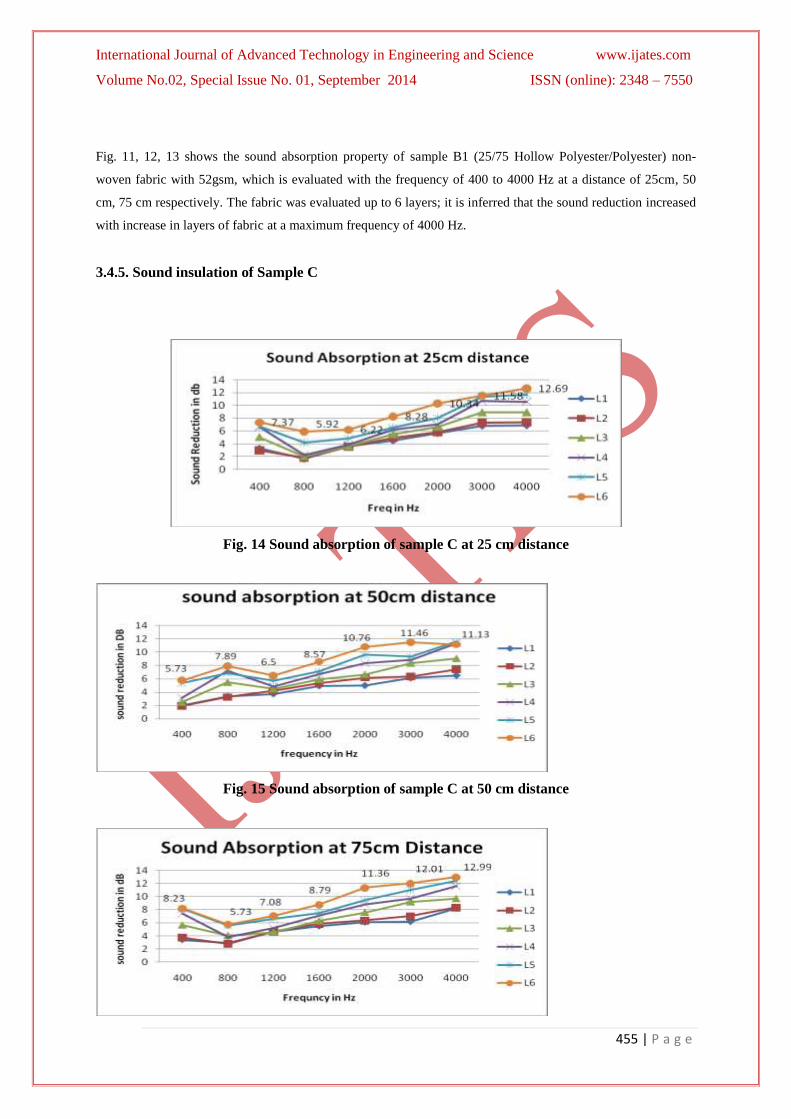
3.4.5. Sound insulation of Sample C
Fig. 14 Sound absorption of sample C at 25 cm distance
Fig. 15 Sound absorption of sample C at 50 cm distance
International Journal of Advanced Technology in Engineering and Science www.ijates.com
Volume No.02, Special Issue No. 01, September 2014 ISSN (online): 2348 – 7550
456 | P a g e
Fig. 16 Sound absorption of sample C at 75 cm distance
Fig. 14, 15, 16 shows the sound absorption property of sample C (50/50 Hollow Polyester/Polyester) non-woven
fabric with 82gsm, which is evaluated with the frequency of 400 to 4000 Hz at a distance of 25cm, 50 cm, 75
cm respectively. The fabric was evaluated up to 6 layers; it is inferred that the sound reduction increased with
increase in layers of fabric at a maximum frequency of 4000 Hz.
3.4.6. Sound insulation of Sample C1
Fig. 17 Sound absorption of sample C1 at 25 cm distance
Fig. 18 Sound absorption of sample C1 at 50 cm distance
International Journal of Advanced Technology in Engineering and Science www.ijates.com
Volume No.02, Special Issue No. 01, September 2014 ISSN (online): 2348 – 7550
457 | P a g e
Fig. 19 Sound absorption of sample C1 at 75 cm distance
Fig. 17, 18, 19 shows the sound absorption property of sample C1 (50/50 Hollow Polyester/Polyester) non-
woven fabric with 52gsm, which is evaluated with the frequency of 400 to 4000 Hz at a distance of 25cm, 50
cm, 75 cm respectively. The fabric was evaluated up to 6 layers; it is inferred that the sound reduction increased
with increase in layers of fabric at a maximum frequency of 4000 Hz.
3.4.7. Sound reduction based on GSM of the samples
Fig. 20 Sound reduction of samples (A, B, C) at 75 cm distance
Fig. 21 Sound reduction of samples (A1, B1, C1) at 75 cm distance
International Journal of Advanced Technology in Engineering and Science www.ijates.com
Volume No.02, Special Issue No. 01, September 2014 ISSN (online): 2348 – 7550
458 | P a g e
From the Fig. 20 and Fig. 21, it is clear that sample C, C1 (50/50 hollow polyester/solid polyester) with 6 layers
has the maximum sound absorption of 13dB and 11.5dB 4000Hz respectively, when compared with other
samples.
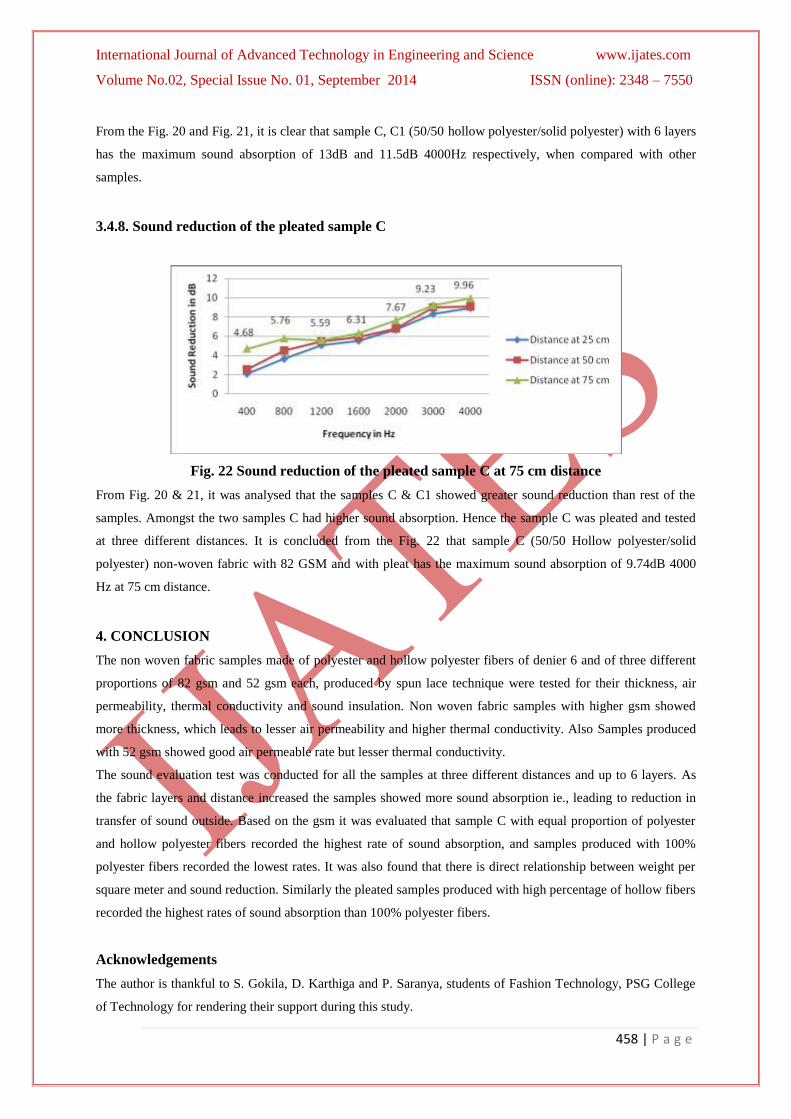
3.4.8. Sound reduction of the pleated sample C
Fig. 22 Sound reduction of the pleated sample C at 75 cm distance
From Fig. 20 & 21, it was analysed that the samples C & C1 showed greater sound reduction than rest of the
samples. Amongst the two samples C had higher sound absorption. Hence the sample C was pleated and tested
at three different distances. It is concluded from the Fig. 22 that sample C (50/50 Hollow polyester/solid
polyester) non-woven fabric with 82 GSM and with pleat has the maximum sound absorption of 9.74dB 4000
Hz at 75 cm distance.
4. CONCLUSION
The non woven fabric samples made of polyester and hollow polyester fibers of denier 6 and of three different
proportions of 82 gsm and 52 gsm each, produced by spun lace technique were tested for their thickness, air
permeability, thermal conductivity and sound insulation. Non woven fabric samples with higher gsm showed
more thickness, which leads to lesser air permeability and higher thermal conductivity. Also Samples produced
with 52 gsm showed good air permeable rate but lesser thermal conductivity.
The sound evaluation test was conducted for all the samples at three different distances and up to 6 layers. As
the fabric layers and distance increased the samples showed more sound absorption ie., leading to reduction in
transfer of sound outside. Based on the gsm it was evaluated that sample C with equal proportion of polyester
and hollow polyester fibers recorded the highest rate of sound absorption, and samples produced with 100%
polyester fibers recorded the lowest rates. It was also found that there is direct relationship between weight per
square meter and sound reduction. Similarly the pleated samples produced with high percentage of hollow fibers
recorded the highest rates of sound absorption than 100% polyester fibers.
Acknowledgements
The author is thankful to S. Gokila, D. Karthiga and P. Saranya, students of Fashion Technology, PSG College
of Technology for rendering their support during this study.
International Journal of Advanced Technology in Engineering and Science www.ijates.com
Volume No.02, Special Issue No. 01, September 2014 ISSN (online): 2348 – 7550
459 | P a g e
REFERENCES
[1] Hoda S. Seddeq, “Factors Influencing Acoustic Performance of Sound Absorptive Materials”, Australian
Journal of Basic and Applied Sciences, 3(4): 2009, 4610-4617.
[2] Beranek, L. Leo, “Noise Reduction Prepared for a Special Summer Program at MIT” McGraw-Hill, New
York, 1960.
[3] Bruce Fader, “Industrial Noise Control” Interscience publication, John Wiley and Sons, 1981.
[4] Lewis, H., Bell, “Industrial Noise Control Fundamentals and Applications”, 2nd
Edition, New York, 1994:
M. Dekker
[5] Claudio Braccesi and Andrea Bracciali, “Least Squares Estimation of main Properties of Sound Absorbing
Materials Through Acoustical Measurements” Applied Acoustics, 54(1): 1998, 59-70.
[6] Youn Eung Lee, Chang Whan Joo, “Sound Absorption Properties of Thermally Bonded Nonwovens Based
on Composing Fibers and Production Parameters”, Journal Of Applied Polymer Science, 92: 2004, 2295-
2302.
[7] Koikumi, T., N, Tsujiuchi and A Adachi, “The Development of Sound Absorbing materials Using Natural
Bamboo Fibers, High Performance” WIT Press, 2002.
[8] Takahashi, Y. T. Otsuru and R. Tomiku, ”In Situ Instruments of Surface Impedance and Absorption
Coefficients of Porous Materials Using Two Microphones and Ambient Noise, Applied Acoustics, 66:
2005, 845-865.
[9] Michael Coates and Marek Kierzkowski, “Acoustic Textiles – Lighter, Thinner and More Absorbent”,
Technical-Textiles-International, 2002.
[10] Mingzhang Ren and Finn Jacobsen, “A Method of Measuring the Dynamic Flow Resistance and Reactance
of Porous Materials”, Applied Acoustics, 39(4): 1993, 265-276.


![Untitled-2 [radekoncar.com.mk]radekoncar.com.mk/wp-content/uploads/2019/06/Elektricni-ormari-.pdf · PP2 polyester PW3 polyester PP3 polyester PW4 polyester PP4 polyester PW5 polyester](https://static.documents.pub/doc/80x56/5fc2e1f5b98d77452302c149/untitled-2-pp2-polyester-pw3-polyester-pp3-polyester-pw4-polyester-pp4-polyester.jpg)


