A STUDY ON ANALYSIS OF ABSENTEEISM IN CUMI A project report submitted to CENTRAL UNIVERSITY OF JAMMU in partial fulfilment of the requirements for the award of the degree of MASTER OF BUSINESS ADMINISTRATION- HUMAN RESOURCE MANAGEMENT Submitted by: Narinder Kumar Roll No:-1300715 Department of Human Resource Management & Organisational Behaviour Central University of Jammu, Jammu 1
Transcript
A STUDY ON ANALYSIS OF ABSENTEEISM IN CUMI
A project report submitted to CENTRAL UNIVERSITY OF JAMMU in partial fulfilment of the
requirements for the award of the degree of
MASTER OF BUSINESS ADMINISTRATION- HUMAN RESOURCE MANAGEMENT
Submitted by:
Narinder Kumar
Roll No:-1300715
Department of Human Resource Management & Organisational Behaviour
Central University of Jammu, Jammu
1
ACKNOWLEDGEMENT
Firstly I would like to express my immense gratitude towards our institution CENTRAL
UNIVERSITY OF JAMMU, which created a great platform to attain profound technical skills in
the field of MBA, thereby fulfilling our most cherished goal.
I would thank entire HR department of CUMI specially Mr S.INBARAJ, MANAGER HR, and
the employees in the HR department for guiding me and helping me in successful completion of
the project
I am very much thankful to my project coordinators MR. S.ESAKKIAPPAN and MR.YUVA
PRASAAD, DEPUTY MANAGERS HR for extending their cooperation in doing this project.
I convey my thanks to my faculty who helped me directly or indirectly in bringing this project
successfully.
Narinder Kumar
2
EXECUTIVE SUMMARY
Carborundum Universal Limited (“CUMI”), as a constituent of the Murugappa Group, is
committed to high standards of corporate governance in all its activities and processes. CUMI
looks at corporate governance as the cornerstone for sustained superior financial performance and
for serving all its stakeholders. Apart from drawing from the various legal provisions, the group
practices are continuously benchmarked with industry practices. The entire process begins with
the functioning of the Board of Directors, with leading professionals and experts serving as
independent directors and represented in various Board Committees. Systematic attempt is made
to ensure symmetry of information.
Key elements in corporate governance are transparency, internal controls, risk management,
internal/external communications and good standards of safety and health. The Board has
empowered responsible persons to its broad policies and guidelines and has set up adequate
review processes. CUMI’s business strategy is evolved from Domestic & Global market trends,
Economic Growth, Competitor Analysis and Customer Industries’ Growth Plan. HR strategy is
linked to business strategy and facilitates the organization to achieve the objective by building
people capabilities.
CUMI’s concern for people has been driving force for the growth of the organization over the last
5 decades. The sustained growth over the past several years attributed to the knowledge, skill of
the people and technology. HR has always been one of the focus points in the business strategy.
The HR strategy is carefully linked to the Vision, Mission and overall business strategy of the
Company.
Absenteeism is a common but serious problem in CUMI. The high rate of absenteeism is mainly
due to lack of commitment to work. Absenteeism results in dislocation of work, increase in labour
costs, reduction in productivity and causes an increase in indiscipline. Among all the abrasive
plants under CUMI, this Thiruvottiyur plant large percentage of absenteeism in the first quarter of
2014 i.e. from April to June. After a number of counselling sessions and show cause notices send
to the employees, the standard of absenteeism does not seem to improve which is really affecting
the productivity of this plant. Therefore employees and human resource professionals should be
3
concerned when absence suddenly increases and they are desperate now to take whatever steps are
necessary to alleviate the problem.
With this background, the proposed objective of the study is to find out the socio-economic
background of employees in the company along with finding out the reasons of absenteeism, so
that some suggestions will be given in order to help the company in reducing absenteeism rates.
4
TABLE OF CONTENTS---CHAPTER 1- INTRODUCTION PAGE NO.
1.1 Company Introduction 8
1.2Company Profile
8
1.3Joint Venture
9
1.4Subsidiaries of CUMI
10
1.5 CUMI Abrasives 12
1.6 HRM Practices of CUMI 14
1.7 Limitations of the study 16
CHAPTER 2- LITERATURE REVIEW 17
CHAPTER 3- RESEARCH METHODOLOGY
3.1 Identification of problem 20
3.2 Objectives of the study 20
3.3 Data source and data collection 20
3.4 Sample design 21
3.5 Relevance of the study 21
3.6 Scope of the study 21
CHAPTER 4- DATA ANALYSIS AND INTERPRETATION 23
CHAPTER 5- FINDINGS AND SUGGESTIONS
5.1 Findings 41
5.2 Suggestions 42
CHAPTER 6- CONCLUSION 45
BIBLIOGRAPHY & REFERENCES
ANNEXURE A
ANNEXURE B
ANNEXURE C
5
6
CHAPTER 1
INTRODUCTION
1.1 Company Introduction
Murugappa Group
Founded in 1900, the INR 225 Billion Murugappa Group is one of India's leading business
conglomerates. The Group has 28 businesses including eleven listed Companies traded in NSE &
BSE. Headquartered in Chennai, the major Companies of the Group include Carborundum
Universal Ltd., Cholamandalam Investment and Finance Company Ltd., Cholamandalam MS
General Insurance Company Ltd., Coromandel International Ltd., Coromandel Engineering
iv. Genuine sickness accounts for between half and two-thirds of absences from work
(Huczynski & Fitzpatrick, 1989).
v. Stress influences absenteeism (Hendrix et al., 1987; Ivancevich & Matteson, 1980). The
literature has suggested that over 70% of all job absenteeism is tied to stress-related illness
(Adams, 1987).
vi. Employees who are suffering from stress at work are less likely to be productive. The
three most common reasons for unscheduled absences are personal illness (33%), family
issues (24%), and personal needs (21%). Stress as a reason for absenteeism has increased
over 300 percent since 1995 (CCH Inc., 2002).
vii. Jacobson (1989) has investigated a direct relationship between monetary incentives and
work floor attendance.
viii. Nisam (2010) stated that stress among employees, health problems, loneliness at
workplace, non-cooperation of colleagues causes absenteeism at workplace.
18
ix. Absenteeism can fall under 3 broad categories: legal (such as public holidays), authorized
(such as approved holidays) and unauthorized (also referred to as casual absence).
Unauthorized absence is what most organizations strive to avoid and keep to a minimum.
CHAPTER 3
RESEARCH METHODOLOGY
19
3.1 Identification of problem
Absenteeism is a common but serious problem in CUMI. The high rate of absenteeism is mainly
due to lack of commitment to work and many other factors. Absenteeism results in dislocation of
work, increase in labour costs, reduction in productivity and causes an increase in indiscipline.
Among all the abrasive plants under CUMI, this Thiruvottiyur plant large percentage of
absenteeism in the first quarter of 2014 i.e. from April to June. Thus this project was done to find
out the reasons of absenteeism and to give suggestions for controlling it.
3.2 Objectives of the study
• To identify the socio-economic background of Carborundum Universal Limited
employees.
• To identify the consequences of absenteeism of employees from employee perspective.
• To identify the duration of leave taken by an employee in a month and the reason of
absenteeism from work
• To provide suggestions to reduce absenteeism in the organization.
3.3 Data source and data collection
This study involves collection of both primary and secondary data.
Primary data 1. Information through questionnaire method
2. By going through the official records of the
20
employees
3. Counselling, on the basis of questions
predetermined by both the management and the
researcher, covering different fields of
absenteeism.
Secondary data 1. Through company officials regarding
company policies and procedures
2. Through settlement booklet (settlement
between the management and the workers)
3. Through official website of the company
3.4 Sample design
This study is concerned with the employees’ absenteeism in Carborundum Universal Madras
India (CUMI) at Thiruvottiyur plant, Chennai. Hence the employees of CUMI at Chennai
premises are taken as the population. However the sample has been selected on the basis of
following two conditions:
• The respondent should be an employee of Chennai plant.
• Must be a chronic unauthorized absentee in the company.
Sample respondents have been taken by looking into the attendance records, of the past 6 months,
of the employees and then through sorting in the descending order, a sample of top 41 absentees
has been taken.
3.5 Relevance of the study
• The study attempts to identify the frequency of leave taken by the employees.
• This study would help the management to formulate policies by which absenteeism
could be reduced and production could be increased.
21
• This study can also help the management in reducing the cost of labour by taking
frequent actions against the employees who come under the category of unauthorized
absenteeism.
3.6 Scope of the study
• There are so many variables of absenteeism but in this study only few of them have been
covered like health, family and other issues, alcoholism etc.
• The scope of this study is limited only to the employees of this plant and is not universal
because the time was less and the sources were limited.
22
CHAPTER 4
DATA ANALYSIS AND
INTERPRETATION
23
•
Data processing has been done through tables in the excel sheets, and representation of data
has been done through graph sheets and pie charts, for easy understanding.
,
Interpretation
Absenteeism during the first quarter of 2014 was very high during May
(8.76%) but later on during June it falls down little bit to 6.19%. This is
an overall absenteeism of non management staff and it is calculated using
the absence rate method as shown in the Annexure B.
TABLE 1 Total absenteeism of the organization
Overall Absenteeism Apr-14 May-14 Jun-14
TVT 5.41% 8.76% 6.19%
0
1
2
3
4
5
6
7
8
9
10
Absenteeism Apr-14 May-14 Jun-14MONTH
Absenteeism% (overall)
Chart 1
24
TABLE 2Age of the Respondents
Age group No of employees%
25-40 1741.46
41-55 2356.10
Above 55 12.44
Total 41100.0
Chart 2
Interpretation
Majority of the employees (56.10%) belong to the age group of 41-55 years, followed by
(41.46%) employees in the age group of 25-40 years and remaining 2.44% of employees are in the
age group of above 55 years.
25
Table 3 Module wise absenteeism records
Field No. of employees %
MOD 1 13 31.71
MOD 2 16 39.02
MOD 3 3 7.32
MOD 4 7 17.07
MOD 5 2 4.88
MOD 6 0 0
Total 41 100.0
Chart 3
Interpretation `
26
Majority (39.02%) of the absenting employees are from module 2, followed by module 1
(31.71%), then module 4 (17.71%), then module 3 (7.32%), then module 5 (4.88%) and there is
no absenteeism case from module 6.
Table 4Experience of the respondents
Experience No of employees %5-10Y 6 14.63
11-15 Y 12 29.2716-20Y 18 43.9021-25 Y 3 7.32
Above 25 Y 2 4.88Total 41 100.0
Chart 4
27
Interpretation
Majority (43.90%) of the employees are having 16-20 years of experience, 29.27% of the
employees are having 11-15 years of experience, 14.63% of the employees are having 5-10 years
of experience, 7.32% of employees are having 21-25 years of experience and rest 4.88% of
employees are having above 25 years of experience.
28
Table 5Leave taken per month
Range (leave/month on average) No of leave/month(average) %<=5 11 26.83
>5&<=10 20 48.78
>10&<=15 7 17.07
>15&<=20 2 4.88
>20&<=25 1 2.44
Total 41 100.0
Chart 5
Interpretation
29
Majority (48.78%) of employees have taken 6-10 days of leave in a month, 26.83% of employees
have taken less than or equal to5 days of leave in a month, 17.07% of employees have taken 11-15
days of leave in a month, 4.88% of employees have taken 16-20 days of leave in a month and
2.44% of employees have taken 21-25 days of leave in a month.
30
Table 6Educational Qualification of employees
Educational Qualification Frequency %SSLC 15 36.58
Plus two 5 12.19ITI/Diploma 18 43.90
Under graduation 3 7.32Total 41 100.0
Chart 6
Interpretation
Majority (43.90%) of employees are diploma holders, 36.58% of employees have educational
qualification up to SSLC, 12.92%of employees have educational qualification up to Plus two and
7.32% of employees have educational qualification up to graduation.ITI/Diploma
31
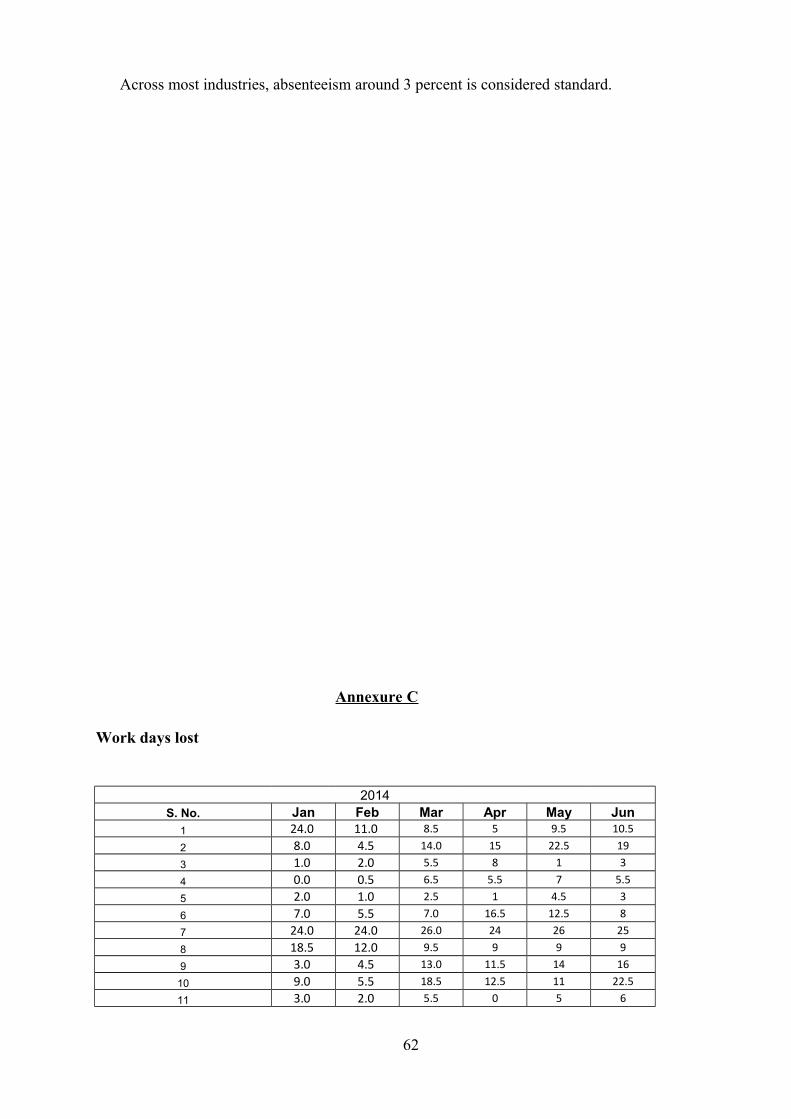
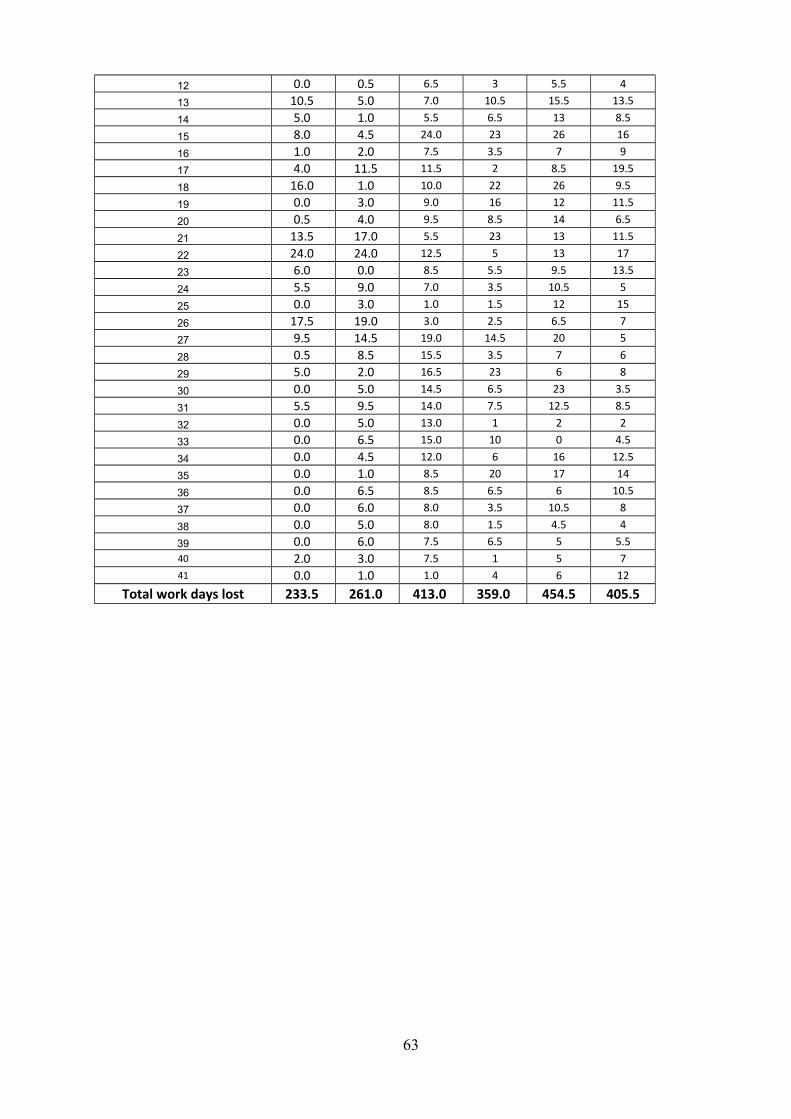
Table 7No of work days lost from Jan to June 2014 (due to sample
employees)Month Total no of work days lostJan-14 233.5Feb-14 261Mar-14 413Apr-14 359May-14 454.5Jun-14 405.5
Chart 7
Interpretation
Maximum number of workdays (454.4) is lost during May 2014, 413 work days are lost during
March 2014, 405.5 work days are lost during June 2014, 359 work days are lost during April
2014, 2610work days are lost during February 2014 and 233.5 work days are lost during January
2014. These work days losses are associated only with the sample employees. These work days
are taken from Annexure C.
Table 8 Marital Status Marital status Frequency %Married 39 95Unmarried 2 5Total 41 100.0
Chart 8
32
Interpretation
Majority (95%) of the employees are married and only 5% of them are unmarried.
33
Chart 9
Interpretation
34
Table 9 Action of company
Company action Frequency %Counselling 28 68Notice without counselling 13 32Total 41 100.0
Majority (68%) of the employees have undergone counselling and most of them are not chronic
absentee and 32% of employees have not been counselled because of their chronic unauthorized
absenteeism. However enquiry against these employees occurs and necessary actions have been
taken against them, depending upon their previous attendance records.
Chart 10
35
Table 10Action against those who are not counselled
Action Frequency %Job rotation 1 8Show cause notice, enquiry under progress 5 38Enquiry completed, finally suspended 1 8Warning letter 6 46Total 13 100.0
Interpretation
Majority (46%) of the employees (who are not counselled) have been given a final warning letter
to improve their attendance, otherwise their unauthorized leave will be considered as LOP (loss of
pay), show cause notice has been sent to 38% of the employees to give reason for their
absenteeism (the enquiry is still under progress), 8% of the employees are suspended after
completion of enquiry and remaining 8% have undergone job rotation.
Table 11 Employees issues for absenteeism
Cases for absenteeism Frequency %Health problem cases 9 32Family problem cases 3 11Other cases 6 21Both health and family cases 2 7Both family and other cases 1 4Both health and other cases 5 18All the three cases 2 7 Total 28 100.0
36
Chart 11
Interpretation
Total health problem cases = 18, percentage = (18/28)*100 = 64.4%
Total family problem cases = 8, percentage = (8/28)*100 = 28.6%
Total other cases = 14, percentage = (14/28)*100 = 50%
Total cases = 40, percentage = (40/28)*100 = 143%
Here “28” is the actual no. of respondents. This percentage (total =143%) is more than the one
which is shown in the above table. This is because some of the employees have more than one
case for their absenteeism, which, later on, in the interpretation are treated separately. Majority
(64.4%) of the cases are related to the health issues and 28.8% cases are related to the family
issues.
Table 12 Health issue of the respondents
Health issues Frequency %Back pain 6 = 6/18*100=33.33
Majority (33.33%) of the employees are suffering from back pain, 27.78% of employees are
suffering from high/low blood pressure, the tally of employees, suffering from neck pain, shoulder
pain and chest pain, is up to 16.67% each, 11.11% of employees are suffering from viral fever and
remaining employees are suffering from stomach pain, jaundice and weight loss, in equal ratio i.e.
5.56%. However the total percentage comes out to be 139%. This is because of the fact that some
of the respondents have more than one health issues and each health issue is treated separately.
For example: if a respondent suffers from 3 separate health issues, then he is included 3 times in
the above table, once against each issue.
Table 13 Family issues of respondents
Family issue Frequency %
38
Family's health issue 4 50Family functions 2 25Daughter school admission 1 12.5Family dispute(property issue) 1 12.5Total family issues 8 100.0Total family cases 8 (base) 100.0
Chart 13
Interpretation
Majority (50%) of the respondents have to take care of their ill family members, 25% of them are
busy in their family functions and rest of the respondents have given, family disputes and
daughter school admission, as the reasons for their absenteeism, in equal ratio i.e. 12.5%
39
Table 14 Other issues of respondents
other cases frequency %Alcoholism 3 21
Accident 4 29Far away from native place 3 21
Borrowed money 4 29Total other issues 14 100.0Total other cases 14 (base) 100.0
Chart 14
Interpretation
40
Majority (29%) of the respondents have met with accident (1 internal and 3 external) and same
ratio is for the cases of money borrowings in the form of loan, 21% of the respondents have given
habitual alcoholism as the reason for their absenteeism and the remaining 21% are far away from
their native place (family) and thus remain absent sometimes, to go and meet them.
Table 15 Income source of respondents
Income source Frequency %No other income source 21 75other income source 7 25Total 28 100
Chart 15
Interpretation
Majority (75%) of the respondents have no other income source other than this job but 25% of
them have other income sources like shop, agricultural land, sons well settled etc.
41
Table 16 Effects of absenteeism
Effects of absenteeism Frequency %No work no pay (LOP) 3 11Delay or loss of production 8 28.5Reduced quality in performance 8 28.5No growth / no promotions 6 21all of the above 3 11Total 28 100
Chart 16
42
Interpretation
Majority (57%) of the employees, in equal ratio (i.e. 28.5%) think that reduced quality of the
performance and loss of the production are the major effects of absenteeism, 21% of the
employees think that no growth no promotion will be the effect of absenteeism,11% of the
respondents think that no work no play (LOP) is the effect of absenteeism and the remaining 11%
think that all the above reasons will be the effect of absenteeism.
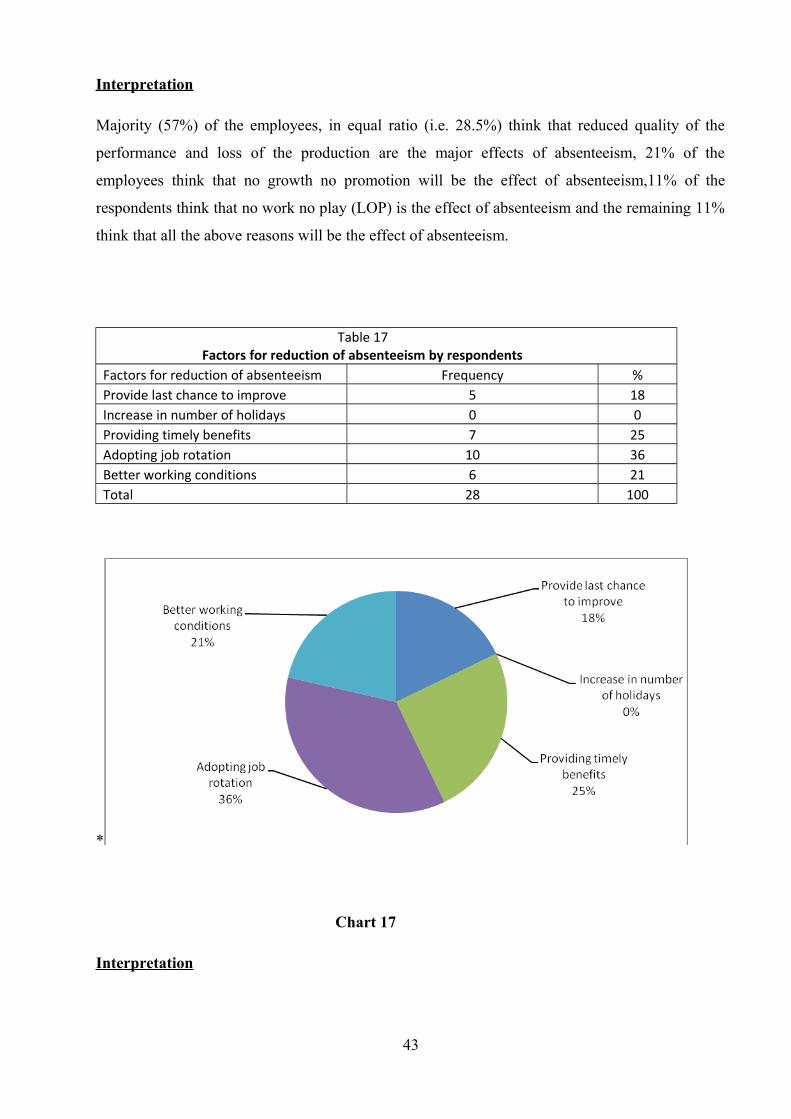
Table 17 Factors for reduction of absenteeism by respondentsFactors for reduction of absenteeism Frequency %Provide last chance to improve 5 18Increase in number of holidays 0 0Providing timely benefits 7 25Adopting job rotation 10 36Better working conditions 6 21Total 28 100
*
Chart 17
Interpretation
43
Majority 36% of the employees are demanding for job rotation, 25% of respondents are
demanding for timely benefits, 21% of the employees are demanding for better working
conditions, 18% of the employees are demanding for the last chance to improve their absenteeism
and no respondent has demanded for increase in the number of holidays.
CHAPTER 5
FINDINGS & SUGGESTIONS
44
5.1 Findings
1. The socio-economic background of Carborundum Universal Limited employees.
• Majority (56.10%) of the respondents, who are unauthorized absentees, belong to the age group 41-55 years
• Majority (39.02%) of the absenting employees are from module 2.
• Majority (43.90%) of the absenting respondents are having 16-20 years of experience.
• Majority (75%) of the respondents have no other income source.
2. The duration of leave taken by an employee in a month and the reason of absenteeism
from work
• Majority (48.78%) of employees have taken 6-10 days of leave, on an average, in a month.
• Majority (68%) of the employees have undergone counselling and most of them are not
chronic absentee and 32% of employees have not been counselled because of their chronic
unauthorized absenteeism.
• Out of total 28 cases:
Total health problem cases = 18, percentage = (18/28)*100 = 64.4%
Total family problem cases = 8, percentage = (8/28)*100 = 28.6%
Total other cases = 14, percentage = (14/28)*100 = 50%
• Majority (33.33%) of the respondents, among the health issue cases, are suffering from
back pain due to very physical work.
45
• Majority (50%) of the respondents, among the family issues cases, have to take care of
their ill family members,
• Majority (29%) of the respondents have met with accident (1 internal and 3 external) and
same ratio is for the cases of money borrowings in the form of loan.
3. The consequences of absenteeism of employees and how to reduce absenteeism, from
employee perspective.
• Majority (57%) of the employees, in equal ratio (i.e. 28.5%) think that reduced quality of
the performance and loss of the production are the major effects of absenteeism.
• Majority 36% of the employees are demanding for job rotation, 25% demanding for timely
benefits, 21% of the employees are demanding for better working conditions, 18% of the
employees are demanding for the last chance to improve their absenteeism.
46
5.2 SUGGESTIONS
1 There must be some grievance box for the employees so that they can put in their issues in
written form, which they have from the management that is resulting into the absenteeism.`
2 There must be free and easy communication between the worker and the employer, the
worker is comfortable enough to speak and discuss his/her issues that are resulting into the
absenteeism.
3 Since absenteeism is a major problem in CUMI now a days and is affecting the production
level of CUMI so, a separate panel should be formed to tackle the problem of
absenteeism and try to resolve the issues of the employees because management has a lot of
burden at CUMI, so might be they are not able to give proper time to the absenteeism related
issues of the employees and thus can offer the show cause notice.
4 The working conditions in some of the modules of CUMI plant are not satisfactory, there
is a lack of cold water facility which is the basic need of the worker while working under
very hot and humid conditions, the arrangement of the exhaust fans is also not proper in some
of the modules etc.
5 Job rotation is equally important because sometimes the workers might find their job not
interesting or they might feel bored because of doing same kind of work for longer times. So
its important for the organisation to go for job rotation as per the capability of the person.
Like from module 1 to module 6.Module 6 carries least absenteeism.
6 To provide the medical facility within the office premises free of cost and make it
compulsory that every worker has to come for regular check up in the office during the illness
so that the management keep an eye on the condition of the worker and no worker
7 Attendance award every year in the form of cash.
8 As far as the family related issues are concerned if a worker is working far away from his
family then management might make some transfers of the workers to some other
franchises or business of CUMI in a place which might be closest to the native place of
that employee.
9 In order to motivate workers, timely incentives, on the basis of their performance, must
be provided, especially to the casual and the contractual workers. This can be done annually.
47
10 If some person is becoming absent continuously because of his bad habits like alcoholism, to
spend time with wrong people (friends) etc then some counselling should be provided to these
employees and rehabilitation process should be arranged for them free of cost which might help
them in overcoming these habits.
11 On the basis of its observation regarding the capability of the employees the management can
put some additional and important responsibility on the shoulders of the capable and
responsible workers which can motivate them to come regularly and perform their duties.
12 Instead of providing the employees with additional holidays the company can organize one
small get together function in which all the members of all organisations should be invited
irrespective of their status in the organisation, in order to convince them about their importance in
the organisation which can motivate them to be regular.
13 Safety measures are also important for an employee while working in a manufacturing plant
otherwise an employee will have the fear of getting injured or even loss of life and thus he
remains absent from help.
14 Other facilities to improve the working conditions like proper drinking water, proper
ventilation, well required machinery (sometimes the burden of excessive manual work will also
compel the employee to remain absent thus to improve his efficiency, its important to provide
required machinery), proper dirt collection facilities etc should be provided.
15 Salaries of the employees should be revised properly because most of the workers will go
dual employment to earn more money because the money, they are earning might not be sufficient
enough to fulfil their basic needs and thus remain absent from the job. So the management of
CUMI in its next agreement has to provide sufficient salary to the employees so that they do not
go for dual job.
16 Appointment of Welfare/Labour officer.
17 Voluntary retirement scheme can be helpful because most of the responding absentees
belong to the age group of 41-55 years and are not fit for physical work because of health issues.
So the company can relieve them by using the scheme, and then recruit some fresh talent.
18 For those who are suffering from high/low BP problems are advised to go for some yoga
sessions because most of them are under a lot of stress due to high work load. So a suggestion was
48
given to make sure that such employees can work only for regular hours and they should not be
called upon for work during night shifts for proper stress management.
19 Some of them are suffering from back pain also because of the nature of their work. So they
must be shifted to some other module where so much of physical work is not required, for a
change so that they can get some time to relieve themselves from back pains.
20 Another suggestion given was that the management, during their new settlement with the
workers, for the next four years, can focus on increasing the allowances, which are directly or
indirectly related to the attendance. Whatever the increment, they will agree to give to the
employees; a major part of it must be included in the allowances related to the attendance. It will
help the management to convince the workers for coming regularly otherwise; they will lose the
major chunk of their increments, due to absenteeism.
21 The company has a policy that if an employee comes for at least 1 day in a month he is eligible
to get entire HRA, so it’s necessary to change this policy in order to reduce the absenteeism,
thereby increasing the number of presence days for giving HRA to the employees or by
giving HRA for daily attendance.
22 Counselling should be done in front of a panel that includes employees from management
side in order to make the counselling more healthy and effective.
49
CHAPTER 6
CONCLUSION
50
Absenteeism is a common but serious problem in CUMI. In the past few years, the rate of
absenteeism increase had put a check on the productivity of the company and increase the cost of
labour. Despite of the various initiatives taken and serious actions against the chronic absentees,
still the problem of absenteeism is not overcome yet. Thus, in order to help the management in
reducing absenteeism this study was conducted. The various reasons for absenteeism are found
out which include health problem, family problem, alcoholism, accidents etc. Some suggestions
have been given with respect to various reasons of absenteeism in order to help management to
reduce absenteeism and thus increase the productivity of the organization.
51
BIBLIOGRAPHY & REFERENCES
52
Bibliography
• C.R.Kothari, Research Methodology: Methods and Techniques, Second Edition, UBS
Publishers Distributors.
• Jon M. Werner, John H. Jackson, Human Resource Development, Seventh Edition,
Published by Cengage Learning India Private Limited.
• Mirza S Saiyadian, Human Resource Management, Fourth Edition Published by Tata Mc
Graw Hill Education Private Limited.
• Gary Dessler, Biju Varkkey, Human Resource Management, Eleventh Edition, Published
by Dorling Kindersley Private Limited, Licensees of Pearson Education in South Africa.