Academy of Accounting and Financial Studies Journal Volume 24, Special Issue 1, 2020 1 1528-2635-SI-1-24-1-635 A STUDY ON AWARENESS OF GST FILING AMONG RETAIL BUSINESS IN HYDERABAD CITY IN TELANGANA A. Kotishwar, CMR College of Engineering & Technology ABSTRACT The Indian government tax reforms brought forward the new tax regime with the implementation of GST in the year of 2017. The present study made an attempt to know the retailer’s perspective on the effectiveness of GST implementation. The study has collected the primary data from the retailers who are filling the monthly GST. The study has adopted the convenient sampling methodology for the collection of primary data with the framed questionnaire. The study examined the retailers’ perception on GST effectiveness, Awareness and problems. The study applied the discriminant analysis for the examination of perception and found that the perception is high with the GST enhance the simple, easy and transparent tax. The SEM has been framed for the retailers’ awareness level on the effectiveness on GST and result reveals that the Revenue Growth improvement after the implementation of GST has been observed. The retailers are experiencing the day to day activities in updating the GST while filling it. Keywords: Taxation, Goods and Services Tax (GST), Retail, Perception, System, Satisfaction. JEL Codes: C380, H200, H250. INTRODUCTION Goods and Services Tax (GST) is an indirect tax (or consumption tax) used in India for the purchase of goods and services. It is a complex, multi-stage, destination-based tax system, having absorbed almost all indirect taxes, with the exception of a few state taxes. Multi-stage as it is, the GST is applied at all levels of the manufacturing process, which is supposed to be refunded to all stakeholders at different points of growth rather than to the final buyer, and is imposed as a destination-based tax from the point of sale and not from the point of origin, as was the case for previous taxes. Goods and services are grouped into five different tax slabs–1%, 5%, 12%, 18% and 28%–for tax collection. However, natural products, alcoholic drinks and electricity are not paid under the GST and are then levied separately by the governments of the individual States as per the previous tax regime. There is a special rate of 0.25 per cent on rough and semi- precious stones and 3 per cent on gold. However, suspension at 22 per cent or above 28 per cent GST refers to a few goods such as aerated drinks, luxury cars and tobacco products. Pre- GST, for most goods, the statutory tax rate was around 26.5 per cent, post-GST, with most goods expected to fall within 18 per cent of the tax range. The tax came into effect as of 1 July 2017 through the implementation by the Government of India of the One Hundred First Amendment to the Constitution of India. The GST replaced the multiple existing taxes levied by central and state governments. India started the tax system in 1980, after independence India had encountered several problems due to the complexity of the indirect tax mechanism; GST was a major move in the Indian economy, as some of the difficulties identified in the current GST framework have
Transcript
Academy of Accounting and Financial Studies Journal Volume 24, Special Issue 1, 2020
1 1528-2635-SI-1-24-1-635
A STUDY ON AWARENESS OF GST FILING AMONG
RETAIL BUSINESS IN HYDERABAD CITY IN
TELANGANA
A. Kotishwar, CMR College of Engineering & Technology
ABSTRACT
The Indian government tax reforms brought forward the new tax regime with the
implementation of GST in the year of 2017. The present study made an attempt to know the
retailer’s perspective on the effectiveness of GST implementation. The study has collected the
primary data from the retailers who are filling the monthly GST. The study has adopted the
convenient sampling methodology for the collection of primary data with the framed
questionnaire. The study examined the retailers’ perception on GST effectiveness, Awareness
and problems. The study applied the discriminant analysis for the examination of perception
and found that the perception is high with the GST enhance the simple, easy and transparent
tax. The SEM has been framed for the retailers’ awareness level on the effectiveness on GST
and result reveals that the Revenue Growth improvement after the implementation of GST has
been observed. The retailers are experiencing the day to day activities in updating the GST
while filling it.
Keywords: Taxation, Goods and Services Tax (GST), Retail, Perception, System,
Satisfaction.
JEL Codes: C380, H200, H250.
INTRODUCTION
Goods and Services Tax (GST) is an indirect tax (or consumption tax) used in India
for the purchase of goods and services. It is a complex, multi-stage, destination-based tax
system, having absorbed almost all indirect taxes, with the exception of a few state taxes.
Multi-stage as it is, the GST is applied at all levels of the manufacturing process, which is
supposed to be refunded to all stakeholders at different points of growth rather than to the
final buyer, and is imposed as a destination-based tax from the point of sale and not from the
point of origin, as was the case for previous taxes.
Goods and services are grouped into five different tax slabs–1%, 5%, 12%, 18% and
28%–for tax collection. However, natural products, alcoholic drinks and electricity are not
paid under the GST and are then levied separately by the governments of the individual States
as per the previous tax regime. There is a special rate of 0.25 per cent on rough and semi-
precious stones and 3 per cent on gold. However, suspension at 22 per cent or above 28 per
cent GST refers to a few goods such as aerated drinks, luxury cars and tobacco products. Pre-
GST, for most goods, the statutory tax rate was around 26.5 per cent, post-GST, with most
goods expected to fall within 18 per cent of the tax range.
The tax came into effect as of 1 July 2017 through the implementation by the
Government of India of the One Hundred First Amendment to the Constitution of India. The
GST replaced the multiple existing taxes levied by central and state governments.
India started the tax system in 1980, after independence India had encountered several
problems due to the complexity of the indirect tax mechanism; GST was a major move in the
Indian economy, as some of the difficulties identified in the current GST framework have
Academy of Accounting and Financial Studies Journal Volume 24, Special Issue 1, 2020
2 1528-2635-SI-1-24-1-635
been overcome. Because GST eliminated all indirect taxes, the single tax was streamlined.
Small businesses pay a lot of indirect taxes, including GST, Service Tax, Sales Tax, Loans
and Luxury Taxes. By eliminating all indirect taxation, the Goods and Services Tax (GST)
will act as a much-needed stimulus to economic growth in India. The cascading tax effect will
also be wiped out. With the implementation of GST, business facilities within India as well
as across borders will be increased. The implementation of the GST is of dual nature, i.e. the
central GST levied by the state-owned center and the state GST. When GST is implemented,
all other indirect taxes are discontinued and now there is only one GST tax under the strict
control of the central government. This system helps to eliminate tax-based thefts and makes
the tax system much more transparent.
Taxes Subsumed
The single GST subsumed several taxes and levies, which included central excise
duty, services tax, additional customs duty, surcharges, state-level value added tax and
Octroi. Other levies which were applicable on inter-state transportation of goods have also
been done away with in GST regime. GST is levied on all transactions such as sale, transfer,
purchase, barter, lease, or import of goods and/or services.
India has followed a dual model of GST, implying that taxation is controlled by both
the Union and the governments of the Member States. The central government and the state
GST (SGST) levies on transactions made by the state governments with the central GST
(CGST) within a single state. Integrated GST (IGST) is levied by the central government for
interstate transactions and goods or services imported. GST is a tax based on consumption /
destination, which means that taxes are paid to the State in which the goods or services are
sold, not to the State in which they were made. The IGST complicates the collection of taxes
on state governments by preventing them from collecting taxes directly from the central
government. Under the previous system, only a state would have to deal with a single
government to collect tax revenue.
HSN code
Since 1971, India has been a member of the World Customs Organization (WCO).
Originally, 6-digit HSN codes were used to classify Customs and Central Excise
commodities. Customs and Central Excise also introduced two extra digits to render the codes
more precise, culminating in an 8-digit designation. HSN codes are designed to make GST
systemic and globally accepted.
HSN codes remove the need to upload a detailed description of the product. As GST
returns are automated, this will save time and make filing easier.
If the turnover of the company in the previous financial year was up to INR 15 million,
the HSN code was not mentioned when the goods were delivered on invoices. If the company
has a turnover of more than INR 15 million but up to INR 50 million, the first two digits of
HSN code must be indicated when the goods are supplied on invoices. If the turnover exceeds
INR 50 million, the first four digits of the HSN code will be indicated on the invoice.
GST Council
The GST Council is the governing body of the GST with 33 members, 2 of whom are
members of the Centre and 31 of whom are citizens of 28 States and 3 Union legal territories.
The Council shall comprise the following members (a) Union Finance Ministers (as
Chairperson) (b) Union revenue or finance ministers (as Member States) (c) investment or tax
ministers or other ministers appointed by each Government State (as Member States). The
Academy of Accounting and Financial Studies Journal Volume 24, Special Issue 1, 2020
3 1528-2635-SI-1-24-1-635
GST Council is an apex member committee designed to amend, reconcile or obtain any
legislation or regulation based on the goods and services tax context in India. The Council is
led by Nirmala Sitharaman, Union Finance Minister, who is backed by all Indian finance
ministers. The GST Council shall be responsible for any change in the rate of goods and
services in India or for any revision or enactment of the rule.
Goods and Services Tax Network (GSTN)
Infosys Technologies develops GSTN software and NIC maintains an information
technology network providing computing resources. The Goods and Services Tax Network
(GSTN) is a non-profit organization set up to create a comprehensive network, available from
a single source (portal) to clients, governments and taxpayers. The platform is open to tax
authorities to trace all purchases, although taxpayers have the ability to link to their tax
returns.
Need of the Study
The Goods and services Tax System, or the revolutionary tax system, took more than
a decade of intense debate to come to fruition and finally came into existence two years earlier.
This system was introduced to reduce the tax burden on producers and to encourage growth
through increased production. Although the tax structure has tried to solve major tax issues in
India, there are many challenges to the reform. For this reason, the present study sought to
inform retailers of the perspective on the effectiveness of the implementation of the GST.
REVIEW OF LITERATURE
Ahmad et al. (2016). this study attempted to find out what level of awareness and
perception to GST taxpayers in Malaysia. The study only consists 256 civil servants of the
secondary school teachers in the area Kuala Kangsar, Perak. Data collected using
questionnaires. The results found that the level of awareness was moderate and the majority
of respondents give a high negative perception to the impact of GST. This eventually causes
the majority of respondents did not accept the implementation of GST in Malaysia
Nayyar & Singh, (2018). This study highlighted the background of the taxation
system, the GST concept along with significant working, comparison of Indian GST taxation
system rates with other world economies, and also presented in-depth coverage regarding
advantages to various sectors of the Indian economy after levising GST and outlined some
challenges of GST implementation.
Shukla & Singh (2018). the study sought to empirically analyze the performance of
companies after one year of GST implementation. Probability sampling was used to get the
relevant sample. A total of 192 BSE listed companies were taken for analysis. Financial
parameters (total assets, profit, and market capitalization for FY2017 and FY 2018) and
demographic variables (size and experience of companies) were used to analyze the impact
of GST roll out. The results indicated that among all three financial parameters, only total
assets were significantly different from the pre GST time (FY2017). Further analysis
highlighted that age and size of the company also affected the equation and were found
significant in influencing the performance of companies after GST implementation. Detailed
analysis and results were subsequently discussed in this paper. The study brought forth new
insights on effect of new indirect tax regime on financial performance of the companies in
order to fill the research gap. The results of the study will be useful for policy makers,
strategists, and managers to cope up with the challenges posed by GST.
Academy of Accounting and Financial Studies Journal Volume 24, Special Issue 1, 2020
4 1528-2635-SI-1-24-1-635
Uppal et al. (2019) Small Business People (SBP) were the group with the most impact
on changes due to GST. An attempt has been made in this paper to examine the understanding
and expectations of SBPs with respect to GST. How far the government has been able to learn
SBPs about GST, too. In particular, we are focusing on the perception of the SBPs on the new
tax system and its application. The results show that initially there was a low level of
understanding, but as time progressed, the level of awareness of GST among SBPs increased.
Not all SBPs regarded the GST process as fairly simple or easy to grasp. However, it has been
noted that most SBPs have made efforts to get to know the new tax regime from the very
beginning, i.e. when the GST bill was passed Most SBPs have stated that they rely on
accounting software to keep their GST transactions properly registered.
Vaid et al. (2020). study was conducted with an aim to empirically identify the benefits
of GST, as perceived by taxpayers, not only in theory, but practically as well, and recognize
the impact of these benefits on taxpayers’ satisfaction. Data were collected from respondents
of Raipur city with the help of a questionnaire. Factor analysis and path analysis were
employed for the purpose of the study. The major benefits identified were Elimination of
Multiple Taxes, Lesser Tax Evasion, and Satisfaction & Convenience. Path analysis was used
to identify the impact of these benefits, where Satisfaction & Convenience was treated as a
dependent variable and Elimination of Multiple Taxes and Lesser Tax Evasion were
considered as independent variables. Based on the results and findings, it was concluded that
Elimination of Multiple Taxes and Lesser Tax Evasion had a significant impact on
satisfaction. This paper helped identify the areas where the taxpayers were satisfied with the
implementation of GST and felt benefited because of it.
RESEARCH GAP
The studies have been conducted by few authors on various aspects of GST as it is a
new concept in Indian economy and research found the research gap where the work on
Awareness of GST Filing and implementation among Retailers in Hyderabad city.
Objectives of the Study
1. To examine the perception of the retailers on the effectiveness of GST system.
2. To study the awareness level retailers on the GST system.
3. To identify the problems and suggests the measures for the effective implementation of GST.
Hypotheses of the Study
Null Hypothesis (H0): There is no difference of perceptions of the Retailers on the GST effectiveness.
Alternate Hypothesis (H1): There is difference of perceptions of the Retailers on the GST effectiveness.
Null Hypothesis (H0): There is no Awareness of the Retailers on the Implementation of GST.
Alternate Hypothesis (H1): There is Awareness of the Retailers on the Implementation of GST.
Scope of the Study
The present study has been emphasized on the effectiveness of the GST among the
Retailers located in Hyderabad city in Telangana state. The study focused on the three vital
areas i.e., Retailers Perception, Awareness Level and Their problems and measure for the
effective implementation.
Research Methodology
Academy of Accounting and Financial Studies Journal Volume 24, Special Issue 1, 2020
5 1528-2635-SI-1-24-1-635
The present study has considered the primary data for the examination of framed
objective. The study applied the convenient sampling method where the sample size is 120
and from that 100 responses of Business Retailers in Hyderabad city are considered. The study
applied below statistical tools
T Test (Perception)
Discriminant Analysis (Perception)
Structural Equation model (Awareness)
Exploratory Factor Analysis (problems)
DATA ANALYSIS
Section I: Examine the perception of the retailers on the effectiveness of GST system.
The objective focuses on evaluating the perception of the Retailers towards
effectiveness of the GST system and the objective is divided into two sections, the first section
contains the tables of frequencies and chi-square whereas second section contains the
statistical analysis using the tool named T test and Discriminant Analysis and the hypothesis
are as follows.
Hypothesis
Null Hypothesis (H0): There is no difference of perceptions of the Retailers on the GST effectiveness.
Alternate Hypothesis (H1): There is a difference of perceptions of the Retailers on the GST effectiveness.
Table 1
FREQUENCY DISTRIBUTION
Perception with respect to GST effectiveness
Strongly
Disagree
Disagree Neutral Agree Strongly
Agree
Total %
Q1 Count 6 57 17 19 1 100
% of Total 6.00% 57.00% 17.00% 19.00% 1.00% 100%
Q2 Count 1 44 14 37 4 100
% of Total 1.00% 44.00% 14.00% 37.00% 4.00% 100%
Q3 Count 5 26 13 43 13 100
% of Total 5.00% 26.00% 13.00% 43.00% 13.00% 100%
Q4 Count 2 28 19 43 8 100
% of Total 2.00% 28.00% 19.00% 43.00% 8.00% 100%
Q5 Count 6 27 19 42 6 100
% of Total 6.00% 27.00% 19.00% 42.00% 6.00% 100%
Q6 Count 3 29 18 44 6 100
% of Total 3.00% 29.00% 18.00% 44.00% 6.00% 100%
Q7 Count 5 28 20 38 9 100
% of Total 5.00% 28.00% 20.00% 38.00% 9.00% 100%
Q8 Count 3 33 9 44 11 100
% of Total 3.00% 33.00% 9.00% 44.00% 11.00% 100%
Q9 Count 3 30 9 44 14 100
% of Total 3.00% 30.00% 9.00% 44.00% 14.00% 100%
Total of count 3.777778 33.55556 15.33333 39.33333 8 100
% of count 3.78% 33.56% 15.33% 39.33% 8.00% 100.00%
Source: Primary data through questionnaire
The above Table 1 depicts about the perception of the retailer with respect to GST
effectiveness. It explains that respondents highly responded as disagree with 57% for GST
help your business to boost the sales, followed by 44% of respondents disagree on GST may
Academy of Accounting and Financial Studies Journal Volume 24, Special Issue 1, 2020
6 1528-2635-SI-1-24-1-635
increase the easiness in procurement of goods from other states, where as 43% agreed on GST
will reduce your tax liability, and 43% of respondents show agree ness on Implementation of
GST resulted in rise in prices of goods and services. Study shows that 42% of respondents
agree with GST has made tax structure and administration more complex, and 44% agreed
with GST has enhanced and strengthened the existing tax system, 38% agreed on GST has
increased the compliance costs, 44% agreed on GST will improve revenue growth due to wide
coverage of goods and services, and similarly 44% agreed on GST will result in simple, easy
and transparent tax. Hence, maximum retailers agreed with the perception attributes on GST
effectiveness.
Table 2
CHI-SQUARE
Effectiveness Age Education
Type of
Retailer
No. of yrs in
Business
Annual
income
GST help your business to
boost the sales
Chi-Square 28.5 25.12 25.15 26.56 30.06
Df 16 12 12 12 16
Sign 0.012 0.032 0.042 0.042 0.032
Critical value 26.3 21.03 21.03 21.03 26.3
GST may increase the
easiness in procurement of
goods from other states
Chi-Square 30.03 26.56 28.25 26.25 30.09
Df 16 12 12 12 16
Sign 0.015 0.028 0.045 0.029 0.045
Critical value 26.3 21.03 21.03 21.03 26.3
GST will reduce your tax
liability
Chi-Square 32.67 28.05 26.65 24.65 32.58
Df 16 12 12 12 16
Sign 0.025 0.012 0.035 0.042 0.045
Critical value 26.3 21.03 21.03 21.03 26.3
Implementation of GST
has resulted in rise in
prices of goods and
services
Chi-Square 35.67 28.56 24.64 25.65 30.25
Df 16 12 12 12 16
Sign 0.025 0.045 0.032 0.041 0.035
Critical value 26.3 21.03 21.03 21.03 26.3
GST has made tax
structure and
administration more
complex
Chi-Square 28.64 26.58 26.03 25.56 32.03
Df 16 12 12 12 16
Sign 0.036 0.015 0.035 0.047 0.041
Critical value 26.3 21.03 21.03 21.03 26.3
GST has enhanced and
strengthened the existing
tax system
Chi-Square 32.56 23.45 24.56 25.65 34.67
Df 16 12 12 12 16
Sign 0.025 0.036 0.016 0.045 0.048
Critical value 26.3 21.03 21.03 21.03 26.3
GST has increased the
compliance costs
Chi-Square 29.56 17.67 19.54 26.65 32.54
Df 16 12 12 12 16
Sign 0.049 0.035 0.045 0.015 0.035
Critical value 26.3 21.03 21.03 21.03 26.3
GST will improve revenue
growth due to wide
coverage of goods and
services
Chi-Square 29.45 28.45 26.56 29.25 35.56
Df 16 12 12 12 16
Sign 0.035 0.026 0.019 0.049 0.048
Critical value 26.3 21.03 21.03 21.03 26.3
GST will result in simple,
easy and transparent tax
Chi-Square 28.25 26.03 28.65 30.25 28.56
Df 16 12 12 12 16
Sign 0.041 0.075 0.049 0.045 0.048
Critical value 26.3 21.03 21.03 21.03 26.3
Source: Primary data through questionnaire
The above Table 2 infers the demographic factor association with perception attributes
regarding GST implementation towards retailers. Result indicates the demographic factor
“Age”, all the perception attributes are GST help your business to boost the sales, GST may
Academy of Accounting and Financial Studies Journal Volume 24, Special Issue 1, 2020
7 1528-2635-SI-1-24-1-635
increase the easiness in procurement of goods from other states, GST will reduce your tax
liability, Implementation of GST has resulted in rise in prices of goods and services, GST has
made tax structure and administration more complex, GST has enhanced and strengthened the
existing tax system, GST has increased the compliance costs, GST will improve revenue
growth due to wide coverage of goods and services, GST will result in simple , easy and
transparent tax. Chi-square calculated value seems to be greater than critical value (26.3 at
df:16) which signifies that there is an association of demographic factor “age” with these
perception attributes. The p-value of these factors have been observed to be statistically
significant at 5% level which indicates that null hypothesis has been rejected and alternative
hypothesis has been accepted i.e., there is an association of demographic factor “age” with
perception attributes.
Synonymously, it illustrates the demographic factor association with perception
attributes regarding GST implementation towards retailers. Result indicates the demographic
factor “Education”, all the perception attributes are GST help your business to boost the sales,
GST may increase the easiness in procurement of goods from other states, GST will reduce
your tax liability, Implementation of GST has resulted in rise in prices of goods and services,
GST has made tax structure and administration more complex, GST has enhanced and
strengthened the existing tax system, GST has increased the compliance costs, GST will
improve revenue growth due to wide coverage of goods and services, GST will result in
simple , easy and transparent tax. Chi-square calculated value seems to be greater than critical
value (21.03 at df:12) which signifies that there is an association of demographic factor
“Education” with these perception attributes. The p-value of these factors have been observed
to be statistically significant at 5% level which indicates that null hypothesis has been rejected
and alternative hypothesis has been accepted i.e., there is an association of demographic factor
“Education” with perception attributes.
Similarly, it shows the demographic factor association with perception attributes
regarding GST implementation towards retailers. Result indicates the demographic factor
“Type of Retailer”, all the perception attributes are GST help your business to boost the sales,
GST may increase the easiness in procurement of goods from other states, GST will reduce
your tax liability, Implementation of GST has resulted in rise in prices of goods and services,
GST has made tax structure and administration more complex, GST has enhanced and
strengthened the existing tax system, GST has increased the compliance costs, GST will
improve revenue growth due to wide coverage of goods and services, GST will result in
simple , easy and transparent tax. Chi-square calculated value seems to be greater than critical
value (21.03 at df:12) which signifies that there is an association of demographic factor “Type
of Retailer” with these perception attributes. The p-value of these factors have been observed
to be statistically significant at 5% level which indicates that null hypothesis has been rejected
and alternative hypothesis has been accepted i.e., there is an association of demographic factor
“Type of Retailer” with perception attributes.
Correspondingly, it illustrates the demographic factor association with perception
attributes regarding GST implementation towards retailers. Result indicates the demographic
factor “No. of years in business”, all the perception attributes are GST help your business to
boost the sales, GST may increase the easiness in procurement of goods from other states,
GST will reduce your tax liability, Implementation of GST has resulted in rise in prices of
goods and services, GST has made tax structure and administration more complex, GST has
enhanced and strengthened the existing tax system, GST has increased the compliance costs,
GST will improve revenue growth due to wide coverage of goods and services, GST will
result in simple , easy and transparent tax. Chi-square calculated value seems to be greater
than critical value (21.03 at df:12) which signifies that there is an association of demographic
factor “No. of years in Business” with these perception attributes. The p-value of these factors
Academy of Accounting and Financial Studies Journal Volume 24, Special Issue 1, 2020
8 1528-2635-SI-1-24-1-635
have been observed to be statistically significant at 5% level which indicates that null
hypothesis has been rejected and alternative hypothesis has been accepted i.e., there is an
association of demographic factor “No. of years in Business” with perception attributes.
Similarly, it depicts the demographic factor association with perception attributes
regarding GST implementation towards retailers. Result indicates the demographic factor
“Annual income”, all the perception attributes are GST help your business to boost the sales,
GST may increase the easiness in procurement of goods from other states, GST will reduce
your tax liability, Implementation of GST has resulted in rise in prices of goods and services,
GST has made tax structure and administration more complex, GST has enhanced and
strengthened the existing tax system, GST has increased the compliance costs, GST will
improve revenue growth due to wide coverage of goods and services, GST will result in
simple , easy and transparent tax. Chi-square calculated value seems to be greater than critical
value (26.3 at df:16) which signifies that there is an association of demographic factor
“Annual income” with these perception attributes. The p-value of these factors have been
observed to be statistically significant at 5% level which indicates that null hypothesis has
been rejected and alternative hypothesis has been accepted i.e., there is an association of
demographic factor “Annual income” with perception attributes.
SECTION II
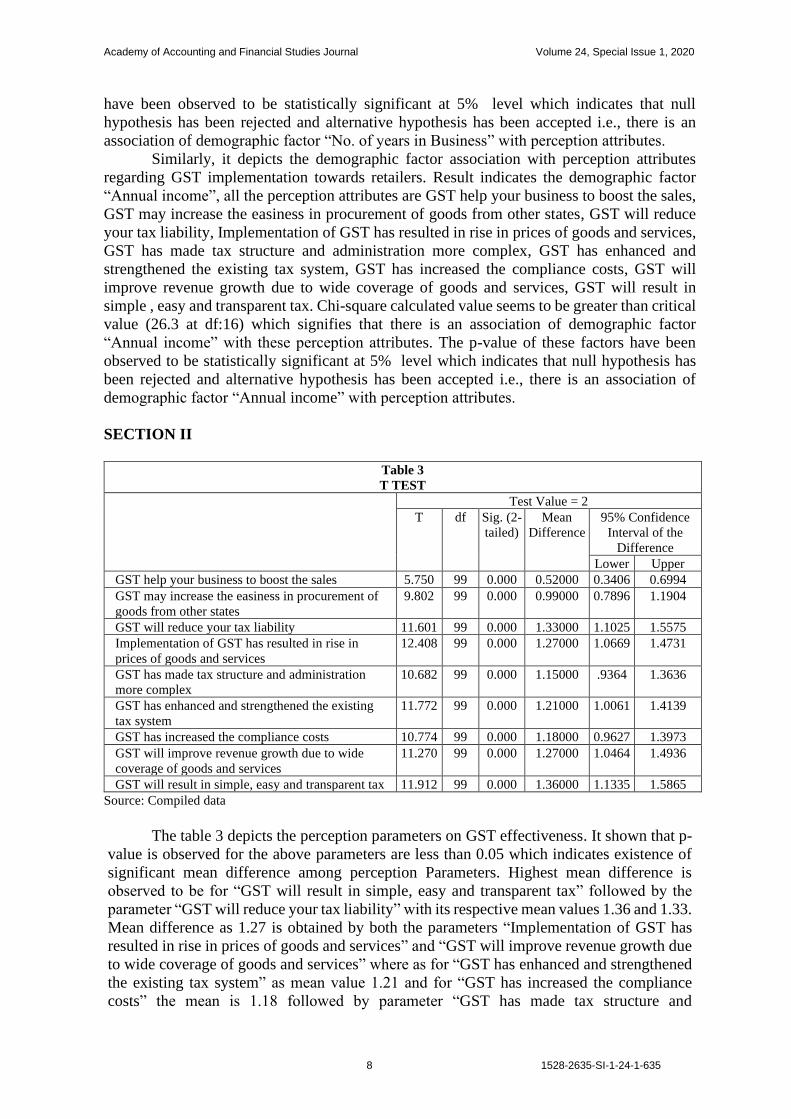
Table 3
T TEST
Test Value = 2
T df Sig. (2-
tailed)
Mean
Difference
95% Confidence
Interval of the
Difference
Lower Upper
GST help your business to boost the sales 5.750 99 0.000 0.52000 0.3406 0.6994
GST may increase the easiness in procurement of
goods from other states
9.802 99 0.000 0.99000 0.7896 1.1904
GST will reduce your tax liability 11.601 99 0.000 1.33000 1.1025 1.5575
Implementation of GST has resulted in rise in
prices of goods and services
12.408 99 0.000 1.27000 1.0669 1.4731
GST has made tax structure and administration
more complex
10.682 99 0.000 1.15000 .9364 1.3636
GST has enhanced and strengthened the existing
tax system
11.772 99 0.000 1.21000 1.0061 1.4139
GST has increased the compliance costs 10.774 99 0.000 1.18000 0.9627 1.3973
GST will improve revenue growth due to wide
coverage of goods and services
11.270 99 0.000 1.27000 1.0464 1.4936
GST will result in simple, easy and transparent tax 11.912 99 0.000 1.36000 1.1335 1.5865
Source: Compiled data
The table 3 depicts the perception parameters on GST effectiveness. It shown that p-
value is observed for the above parameters are less than 0.05 which indicates existence of
significant mean difference among perception Parameters. Highest mean difference is
observed to be for “GST will result in simple, easy and transparent tax” followed by the
parameter “GST will reduce your tax liability” with its respective mean values 1.36 and 1.33.
Mean difference as 1.27 is obtained by both the parameters “Implementation of GST has
resulted in rise in prices of goods and services” and “GST will improve revenue growth due
to wide coverage of goods and services” where as for “GST has enhanced and strengthened
the existing tax system” as mean value 1.21 and for “GST has increased the compliance
costs” the mean is 1.18 followed by parameter “GST has made tax structure and
Academy of Accounting and Financial Studies Journal Volume 24, Special Issue 1, 2020
9 1528-2635-SI-1-24-1-635
administration more complex” with mean as 1.15 . The least mean difference of 0.99 has
shown for parameter “GST may increase the easiness in procurement of goods from other
states” followed by mean value 0.52 for the parameter “GST help your business to boost the
sales”. Therefore, concluded that existence of significant mean difference in each parameters
of perception on GST effectiveness which indicates Rejection of Null hypothesis and
acceptance of alternative hypothesis.
Table 4
SUMMARY OF CANONICAL DISCRIMINANT FUNCTIONS
Eigenvalues
Function Eigenvalue % of Variance Cumulative % Canonical Correlation
1 1.341a 53.6 53.6 0.604
2 1.168a 26.5 80.1 0.780
3 1.104a 16.3 96.4 0.707
4 1.023a 3.6 100.0 .649
a. First 4 canonical discriminant functions were used in the analysis.
Source: Compiled data
The Table 4 concludes the canonical discriminant function which has been applied on
the perception of retailers on GST implementation and filing. The eigen values are observed
to be above 1 in first four functions. The canonical relations for the four functions are observed
to be strong (i. e, > 0.6), thus the model for the discriminant function on perception of retailers
is observed to be fit.
Table 5
MODEL FITNESS OF WILKS LAMBDA FOR RETAILERS PERCEPTION
Test of Function(s) Wilks' Lambda Chi-square df Sig.
1 through 4 0.565 52.444 36 0.038
2 through 4 0.758 25.469 24 0.031
3 through 4 0.886 11.155 14 0.042
4 0.978 2.069 6 0.013
Source: Compiled data
The Table 5 of the wilks Lambda test has been applied on the perception on GST to
identify the preference level of the factors among the retailers. The wilks Lambda coefficients
indicated that the all the 4 functions were fallen near to the 1. Hence it stated that the factors
which were considered to examine the preference level among the Retailers are observed to
be fit for the discriminant model application as their p value is found to be significant (< 0.05).
Table 6
GST PERCEPTION LEVEL OF RETAILERS
Perception Attribute Discriminant Score
GST may increase the easiness in procurement of goods from other states -0.554*
GST has increased the compliance costs 0.428*
GST has enhanced and strengthened the existing tax system 0.565*
GST help your business to boost the sales 0.581*
GST will improve revenue growth due to wide coverage of goods and services 0.554*
GST will reduce your tax liability 0.522*
Implementation of GST has resulted in rise in prices of goods and services 0.285*
GST will result in simple , easy and transparent tax 0.700*
GST has made tax structure and administration more complex 0.337*
Source: Compiled data
Academy of Accounting and Financial Studies Journal Volume 24, Special Issue 1, 2020
10 1528-2635-SI-1-24-1-635
The table 6 reveals that the millennial perception level on the GST implementation
towards retailers. The study has adopted the discriminant analysis to identify the total
discriminant score on the perception attributes. The probability is found to be significant (i.e.,
< 0.05) for all the attributes of perception. The highest discriminant score is found for GST
will result in simple, easy and transparent tax (0.700) followed by GST help your business to
boost the sales (0.581) and for GST has enhanced and strengthened the existing tax system
(0.565). 0.554 score is observed for GST will improve revenue growth due to wide coverage
of goods and services followed by 0.522 for GST will reduce your tax liability and 0.428 for
GST has increased the compliance costs. Discriminant score for GST has made tax structure
and administration more complex is 0.337 and Implementation of GST has resulted in rise in
prices of goods and services has 0.285 and the least score is found as -0.554 for GST may
increase the easiness in procurement of goods from other states attribute.
Study the Awareness Level of Retailers on the GST System
The objective spotlights on knowing the awareness level of the retailers on various
factors of the GST and the objective is split into two sections, in first section the frequency
distribution tables and chi-square tables are involved where as in second section the statistical
tool named Structural Equation model is involved. The hypothesis considered for the
objective are
Null Hypothesis (H0): There is no Awareness of the Retailers on the Implementation of GST
Alternate Hypothesis (H1): There is Awareness of the Retailers on the Implementation of GST
SECTION I
Table 7
FREQUENCY DISTRIBUTION
Awareness with respect to GST system Not at all
aware
Slightly
Aware
Moderately
Aware
Very
Aware
Extremely
Aware
Total %
Q1 Count 7 47 13 31 2 100
% of Total 7.00% 47.00% 13.00% 31.00% 2.00% 100%
Q2 Count 2 30 17 34 17 100
% of Total 2.00% 30.00% 17.00% 34.00% 17.00% 100%
Q3 Count 2 32 22 37 7 100
% of Total 2.00% 32.00% 22.00% 37.00% 7.00% 100%
Q4 Count 5 28 14 43 8 98
% of Total 5.10% 28.60% 14.30% 43.90% 8.20% 100%
Q5 Count 1 24 19 51 5 100
% of Total 1.00% 24.00% 19.00% 51.00% 5.00% 100%
Q6 Count 2 21 15 50 12 100
% of Total 2.00% 21.00% 15.00% 50.00% 12.00% 100%
Q7 Count 2 32 13 43 10 100
% of Total 2.00% 32.00% 13.00% 43.00% 10.00% 100%
Q8 Count 4 34 16 41 5 100
% of Total 4.00% 34.00% 16.00% 41.00% 5.00% 100%
Q9 Count 3 22 12 50 13 100
% of Total 3.00% 22.00% 12.00% 50.00% 13.00% 100%
Q10 Count 2 20 15 48 15 100
% of Total 2.00% 20.00% 15.00% 48.00% 15.00% 100%
Total of count 4.81818 28.4545 16.2727 41 10.6364 92.8182
% of count 3% 29% 16% 43% 9% 100%
Source: Compiled data
Academy of Accounting and Financial Studies Journal Volume 24, Special Issue 1, 2020
11 1528-2635-SI-1-24-1-635
The above table depicts about the perception of the retailer with respect to GST
effectiveness. It synchronizes that 47% of retailers Slightly aware about Uniformity of rates,
followed by 34% of retailers were very Aware about the statement GST improves the revenue
growth to the state and country, where as 37% of retailers were very Aware about GST
reduces material cost and comparing with the sales tax, and 43.9% of retailers as well were
very aware of that the GST checks the tax evasion periodically at different stages of Purchase
of goods and service. It depicts that retailers were very aware about GST will assist in better
conformity and revenue resilience with 51%, and 50% of retailers were very aware about the
service tax structure increases the overall cost for Consumers, similarly 43% of retailers as
well were very aware about GST improve accounting procedures, and 50% of retailers were
also very aware that GST will evade the cascading effect in Indirect tax regime, and 48% of
retailers were also very aware that GST is simple, transparent and easy tax structure, GST
increase tax collections due to wide coverage of goods and service. Therefore, most of the
retailers are very aware of the attributes considered for awareness.
Table 8
CHI-SQUARE
Uniformity of rates Chi-Square 29.36 25.65 24.15 23.08 32.54
Df 16 12 12 12 16
sign 0.047 0.028 0.037 0.021 0.017
Critical value 26.3 21.03 21.03 21.03 26.3
GST improves the revenue
growth to the state and
country
Chi-Square 35.68 26.9 22.45 25.56 30.25
Df 16 12 12 12 16
sign 0.019 0.027 0.038 0.018 0.027
Critical value 26.3 21.03 21.03 21.03 26.3
GST reduces material cost
and comparing with the
sales tax
Chi-Square 34.15 24.15 23.45 26.85 35.28
Df 16 12 12 12 16
sign 0.038 0.047 0.019 0.045 0.027
Critical value 26.3 21.03 21.03 21.03 26.3
GST checks the tax evasion
periodically at different
stages of Purchase of goods
and service
Chi-Square 29.08 22.03 26.57 24.15 36.59
Df 16 12 12 12 16
sign 0.029 0.045 0.038 0.049 0.038
Critical value 26.3 21.03 21.03 21.03 26.3
GST will assist in better
conformity and revenue
resilence
Chi-Square 29.68 22.06 26.35 24.85 36.62
Df 16 12 12 12 16
sign 0.027 0.036 0.047 0.035 0.028
Critical value 26.3 21.03 21.03 21.03 26.3
The service tax structure
increases the overall cost for
Consumers
Chi-Square 34.09 23.65 24.15 26.35 29.38
Df 16 12 12 12 16
sign 0.028 0.045 0.029 0.047 0.038
Critical value 26.3 21.03 21.03 21.03 26.3
GST improve accounting
procedures.
Chi-Square 31.21 25.36 22.08 23.18 29.61
Df 16 12 12 12 16
sign 0.048 0.019 0.027 0.048 0.038
Critical value 26.3 21.03 21.03 21.03 26.3
GST will evade the
cascading effect in Indirect
tax regime.
Chi-Square 27.36 22.09 24.01 23.24 32.28
Df 16 12 12 12 16
sign 0.038 0.048 0.018 0.028 0.019
Critical value 26.3 21.03 21.03 21.03 26.3
GST is simple, transparent
and easy tax structure
Chi-Square 34.01 25.13 23.07 21.95 29.68
Df 16 12 12 12 16
sign 0.028 0.037 0.047 0.049 0.028
Critical value 26.3 21.03 21.03 21.03 26.3
Chi-Square 35.03 22.35 23.09 23.21 29.05
Academy of Accounting and Financial Studies Journal Volume 24, Special Issue 1, 2020
12 1528-2635-SI-1-24-1-635
GST increase tax collections
due to wide coverage of
goods and service.
Df 16 12 12 12 16
sign 0.035 0.045 0.048 0.029 0.028
Critical value 26.3 21.03 21.03 21.03 26.3
Df 16 12 12 12 16
sign 0.046 0.048 0.029 0.018 0.045
Critical value 26.3 21.03 21.03 21.03 26.3
Source: Compiled data
The Table 8 depicts about the demographic factors association with the awareness
attributes on the criteria “Age” where it explains about the Uniformity of rates, GST improves
the revenue growth to the state and country, GST reduces material cost and comparing with
the sales tax, GST checks the tax evasion periodically at different stages of Purchase of goods
and service, GST will assist in better conformity and revenue resilence, The service tax
structure increases the overall cost for Consumers, GST improve accounting procedures, GST
will evade the cascading effect in Indirect tax regime, GST is simple, transparent and easy tax
structure, GST increase tax collections due to wide coverage of goods and service. Here the
results shows that the Chi-square calculated value seems to be greater than critical value(26.3
at df:16) that specifies that there is a significance of demographic factor “Age” with the
awareness attributes .The P-value of these factors have been observed to be statistically
significant at 5%level which indicates that null hypothesis has been rejected and alternative
hypothesis has been accepted i.e, there is an association between demographic factor “age”
with the Awareness attributes.
Similarly, it represents about the demographic factors association with the awareness
attributes on the criteria “Education” where it explains about the Uniformity of rates, GST
improves the revenue growth to the state and country, GST reduces material cost and
comparing with the sales tax, GST checks the tax evasion periodically at different stages of
Purchase of goods and service, GST will assist in better conformity and revenue resilence,
The service tax structure increases the overall cost for Consumers, GST improve accounting
procedures, GST will evade the cascading effect in Indirect tax regime, GST is simple,
transparent and easy tax structure, GST increase tax collections due to wide coverage of goods
and service. Here the results shows that the Chi-square calculated value seems to be greater
than critical value(21.03 at df:12) that specifies that there is a significance of demographic
factor “Education” with the awareness attributes .The P-value of these factors have been
observed to be statistically significant at 5%level which indicates that null hypothesis has
been rejected and alternative hypothesis has been accepted i.e, there is an association between
demographic factor “Education” with the Awareness attributes.
Synonymously, it illustrates about the demographic factors association with the
awareness attributes on the criteria “Type of Retailer” where it explains about the Uniformity
of rates, GST improves the revenue growth to the state and country, GST reduces material
cost and comparing with the sales tax, GST checks the tax evasion periodically at different
stages of Purchase of goods and service, GST will assist in better conformity and revenue
resilence, The service tax structure increases the overall cost for Consumers, GST improve
accounting procedures, GST will evade the cascading effect in Indirect tax regime, GST is
simple, transparent and easy tax structure, GST increase tax collections due to wide coverage
of goods and service. Here the results shows that the Chi-square calculated value seems to be
greater than critical value(21.03 at df:12) that specifies that there is a significance of
demographic factor “Type of Retailer” with the awareness attributes .The P-value of these
factors have been observed to be statistically significant at 5% level which indicates that null
hypothesis has been rejected and alternative hypothesis has been accepted i.e, there is an
association between demographic factor “type of Retailer” with the Awareness attributes.
Academy of Accounting and Financial Studies Journal Volume 24, Special Issue 1, 2020
13 1528-2635-SI-1-24-1-635
Correspondingly, it infers about the demographic factors association with the
awareness attributes on the criteria “No. of years in Business” where it explains about the
Uniformity of rates, GST improves the revenue growth to the state and country, GST reduces
material cost and comparing with the sales tax, GST checks the tax evasion periodically at
different stages of Purchase of goods and service, GST will assist in better conformity and
revenue resilence, The service tax structure increases the overall cost for Consumers, GST
improve accounting procedures, GST will evade the cascading effect in Indirect tax regime,
GST is simple, transparent and easy tax structure, GST increase tax collections due to wide
coverage of goods and service. Here the results shows that the Chi-square calculated value
seems to be greater than critical value(21.03 at df:12) that specifies that there is a significance
of demographic factor “No. of years in Business” with the awareness attributes .The P-value
of these factors have been observed to be statistically significant at 5% level which indicates
that null hypothesis has been rejected and alternative hypothesis has been accepted i.e, there
is an association between demographic factor “No. of years in Business” with the Awareness
attributes.
Similarly, it depicts about the demographic factors association with the awareness
attributes on the criteria “Annual income” where it explains about the Uniformity of rates,
GST improves the revenue growth to the state and country, GST reduces material cost and
comparing with the sales tax, GST checks the tax evasion periodically at different stages of
Purchase of goods and service, GST will assist in better conformity and revenue resilence,
The service tax structure increases the overall cost for Consumers, GST improve accounting
procedures, GST will evade the cascading effect in Indirect tax regime, GST is simple,
transparent and easy tax structure, GST increase tax collections due to wide coverage of goods
and service. Here the results shows that the Chi-square calculated value seems to be greater
than critical value(26.3 at df:16) that specifies that there is a significance of demographic
factor “Annual income” with the awareness attributes .The P-value of these factors have been
observed to be statistically significant at 5%level which indicates that null hypothesis has
been rejected and alternative hypothesis has been accepted i.e, there is an association between
demographic factor “Annual income” with the Awareness attributes
SECTION II
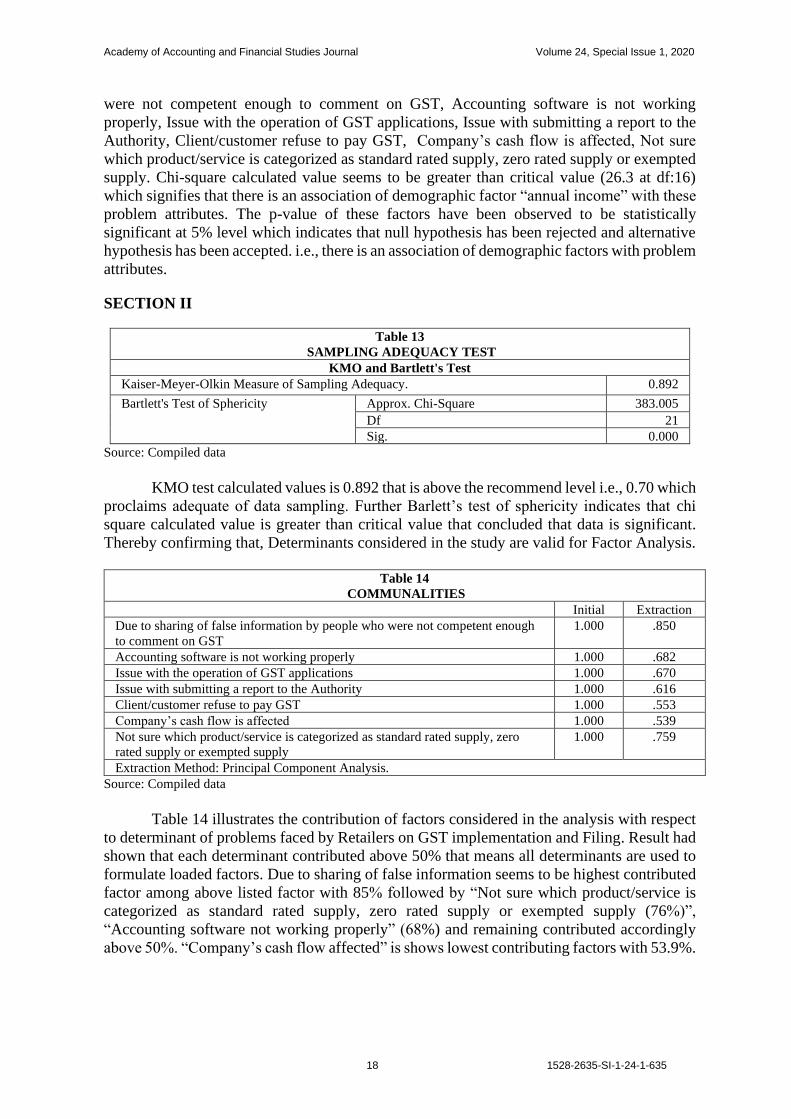
Table 9
MODEL FITNESS TABLE
Model NPAR CMIN DF P CMIN/DF
Default model 30 57.946 35 0.009 1.656
Saturated model 65 0.000 0
Independence model 10 139.612 55 0.000 2.538
Source: Compiled data
The Table 9 illustrates the fitness of the model at various stages. The probability for
the model is observed to be less than 0.05 which signifies that present model is fit to test the
awareness and may apply the structured equation model.
Academy of Accounting and Financial Studies Journal Volume 24, Special Issue 1, 2020
14 1528-2635-SI-1-24-1-635
GRAPH 1
STRUCTURAL EQUATION MODEL
GRAPH 2
AWARENESS ATTRIBUTE
Table 10 depicts the awareness of Retailers on GST implementation and GST filing.
The result signifies the estimates values of Awareness factors on retailers. It found that
awareness impacted the higher on Awareness for Accounting software is not working
properly(2.061), zero rated supply or exempted supply(1.419), Issue with the operation of
Academy of Accounting and Financial Studies Journal Volume 24, Special Issue 1, 2020
15 1528-2635-SI-1-24-1-635
GST applications(1.188), Company’s cash flow is affected(1.069), Due to sharing of false
information by people who were not competent enough to comment on GST(1.000), and Not
sure which product/service is categorized as standard rated supply(0.146) has least awareness
on Retailers towards GST.
Table 10
RETAILERS ON GST IMPLEMENTATION AND GST FILING
Estimate S.E. C.R. P
Uniformity of rates <--- F1 1.000
GST improves the revenue growth to the state and
country
<--- F1 2.061 0.680 3.032 0.002
GST reduces material cost and comparing with the sales
tax
<--- F1 1.188 0.458 2.594 0.009
GST checks the tax evasion periodically at different
stages of Purchase of goods and service
<--- GST 0.804 0.395 2.037 0.042
GST will assist in better conformity and revenue
resilence
<--- GST 1.069 0.427 2.503 0.012
The service tax structure increases the overall cost for