Page 1
Available online at www.worldscientificnews.com
WSN 16 (2015) 95-115 EISSN 2392-2192
A Study on Educational Assessment of Secondary and Higher Secondary Teachers of Bangladesh
Golam Mohiuddin
Institute of Education, Research and Training (IERT), University of Chittagong, Chittagong, Bangladesh
E-mail address: [email protected]
ABSTRACT
Educational assessment can be a powerful mechanism in enhancing classroom instructions and
student performance. Its effectiveness relies on the beliefs and knowledge of those teachers who apply
it daily on a classroom. This study explored attitudes, competence, knowledge, and practices of
teachers about educational assessment. In this study participants were 80 in-service teachers teaching
various subject areas in secondary and higher secondary level selected from government and private
secondary schools and higher secondary colleges in Chittagong city. The study employed a descriptive
survey research design. Results revealed that although teachers held a favorable attitude towards and
perceived themselves as being competent in educational assessment, they demonstrated a low level of
knowledge in educational assessment. Teachers used a variety of assessments in the classroom,
primarily for assigning grades and motivating students to learn, with some variations by gender, grade
level, and subject area. Teaching load and teaching experience accounted for some of the variations in
teachers’ educational assessment practices. Implications for professional developments of teachers in
educational assessment as well as recommendations for future research were discussed in this study.
Keywords: attitudes; competence; knowledge; practices and educational assessment attitude
Page 2
World Scientific News 16 (2015) 95-115
-96-
1. INTRODUCTION
Educational assessment is an essential component of the teaching profession. It refers to
the process used in the classroom by the teacher to obtain information about students’
performances on assessment tasks, either as a group or individually, using a variety of
assessment methods, to determine the extent to which students are achieving the target
instructional outcomes. A sound educational assessment requires a clear conception of all
intended learning outcomes of the instruction and a variety of assessment procedures that are
relevant to the instruction, adequate to sample student performance, and fair to everyone. As
evident by classroom observations and reflective journals, results demonstrated that teachers
holding views about educational assessment aligning with constructivist and socio-cultural
views of learning tended to put a high emphasis on the alternative assessment strategies such
as group projects compared to traditional assessment practices such as multiple-choice tests.
Also, those teachers tended to interpret assessment results using a criterion referenced
approach rather than a norm referenced approach. However, teaching load and other school
responsibilities could cause conflicts between teachers’ assessment beliefs and practices, in
that the teachers do not always have time to enact all of the assessment practices that align
with their beliefs about educational assessment. Recent studies have also confirmed the
importance of attitude towards educational assessment, self-perceived competence in
educational assessment, assessment training, gender, and major when considering teachers'
educational assessment. Assessment is often divided into initial, formative, and summative,
objective assessment, subjective assessment, referencing assessment, formal and informal
assessment, and internal and external assessment categories for the purpose of considering
different objectives for assessment practices.
a) Initial assessment: Also referred to as pre-assessment or diagnostic assessment, initial
assessments are conducted prior to instruction or intervention to establish a baseline from
which individual student growth can be measured.
b) Formative assessment: Formative assessment is generally carried out throughout a
course or project. Formative assessment, also referred to as "educative assessment," is
used to aid learning. In an educational setting, formative assessment might be a teacher or
the learner, providing feedback on a student's work and would not necessarily be used for
grading purposes. Formative assessments can take the form of diagnostic, standardized
tests.
c) Summative assessment: Summative assessment is generally carried out at the end of a
course or project. In an educational setting, summative assessments are typically used to
assign students a course grade. Summative assessments are evaluative.
d) Objective assessment: Objective assessment is a form of questioning which has a single
correct answer. Objective question types include true/false answers, multiple choice, and
multiple-response and matching questions. Subjective questions include extended-
response questions and essays. Objective assessment is well suited to the increasingly
popular computerized or online assessment format.
Page 3
World Scientific News 16 (2015) 95-115
-97-
e) Subjective assessment: Subjective assessment is a form of questioning which may have
more than one correct answer (or more than one way of expressing the correct answer).
Some have argued that the distinction between objective and subjective assessments is
neither useful nor accurate because, in reality, there is no such thing as "objective"
assessment. In fact, all assessments are created with inherent biases built into decisions
about relevant subject matter and content, as well as cultural (class, ethnic, and gender)
biases. f) Referencing assessment: Test results can be compared against an established criterion, or
against the performance of other students, or against previous performance: Criterion-
referenced assessment, typically using a criterion-referenced test, as the name implies,
occurs when candidates are measured against defined (and objective) criteria. Criterion-
referenced assessment is often, but not always, used to establish a person's competence
(whether s/he can do something). The best known example of criterion-referenced
assessment is the driving test, when learner drivers are measured against a range of
explicit criteria. Norm-referenced assessment, typically using a norm-referenced test, is
not measured against defined criteria. This type of assessment is relative to the student
body undertaking the assessment. It is effectively a way of comparing students. The IQ
test is the best known example of norm-referenced assessment. Many entrance tests are
norm-referenced, permitting a fixed proportion of students to pass. This means that
standards may vary from year to year, depending on the quality of the cohort; criterion-
referenced assessment does not vary from year to year.
g) Informal and formal assessment: Assessment can be either formal or informal. Formal
assessment usually implies a written document, such as a test, quiz, or paper. A formal
assessment is given a numerical score or grade based on student performance, whereas an
informal assessment does not contribute to a student's final grade such as this copy and
pasted discussion question. An informal assessment usually occurs in a more casual
manner and may include observation, inventories, checklists, rating scales, rules,
performance and portfolio assessments, participation, peer and self-evaluation, and
discussion. h) Internal and external assessment: Internal assessment is set and marked by the school
(i.e. teachers). Students get the mark and feedback regarding the assessment. External
assessment is set by the governing body, and is marked by non-biased personnel. Some
external assessments give much more limited feedback in their marking. However, in tests
such as Australia's NAPLAN, the criterion addressed by students is given detailed
feedback in order for their teachers to address and compare the student's learning
achievements and also to plan for the future.
2. LITERATURE REVIEW
The American Federation of Teachers (AFT), the National Council on Measurement in
Education (NCME), and the National Education Association (NEA) (1990) have jointly
defined seven Standards for Teacher Competence in Educational Assessment of Students. The
Page 4
World Scientific News 16 (2015) 95-115
-98-
standards emphasized that teachers should competently be able to choose and develop
assessment methods appropriate for instructional decisions; administer, score, and interpret
results of externally produced and teacher-made assessment; use assessment results when
making educational decisions; develop valid grading procedures; communicate assessment
results to various audiences; and recognize unethical, illegal, and inappropriate methods and
uses of assessment.
Brookhart (2011) argues that the Standards for Teacher Competence in Educational
Assessment of Students do not consider current conceptions of formative assessment
knowledge and skills and teacher’s assessment literacy required to successfully work in the
standards-based assessment context. As such, she proposed a set of educational assessment
knowledge and skills for teachers in reference to formative assessment and standards-based
assessment systems. The set states that teachers should understand learning in the content area
they teach, be able to set and apply learning intentions congruent with both the content and
depth of the standards and curriculum goals, have strategies for communicating the
expectation of the learning intentions to students, understand the purposes and uses of the
various types of assessment and be able to use them, be skillful in analyzing assessment
methods, be skillful in providing effective meaningful feedback on student work, have the
ability to develop scoring schemes to quantify student performance for making informed
educational decisions, be skillful in administering external assessments and interpreting their
results for decisions making, be able to apply educational decisions made out from classroom
assessments, be able to communicate assessment information to students to motivate them to
learn, understand the legal and ethical issues in the classroom assessment practices.
Educational assessment can be a powerful tool in making improvements in educational
systems (Koh, 2011). Yet, its effectiveness depends on teachers’ attitudes, competence,
knowledge, and practices due to the continual interaction between these dimensions
(Calderhead, 1996). There is a need to fully understand teachers’ attitudes, competence,
knowledge, and practices about educational assessment. The present study aimed at
addressing this need. Teachers' Assessment Attitudes, Competence, Knowledge and Practices
Teachers are required to develop classroom assessment that aligns with practices
recommended by experts of educational assessment. Unfortunately, findings from past and
recent studies of classroom assessment practices have consistently expressed a concern about
the adequacy of teachers’ assessment practices (e.g., McMillan & Lawson, 2001; Zhang &
Burry-Stock, 2003).
These studies have showed that there are some contradictions between teachers’
practices and recommendations of educational assessment experts regarding issues of
classroom assessment. This lack of agreement between teachers’ practices and experts’
suggestions has been attributed to teachers’ knowledge and attitudes about educational
assessment (Mertler & Campbell, 2005; Siegel & Wissehr, 2011; Popham, 2006; Volante &
Fazio, 2007).
Several studies have examined teachers’ knowledge, attitudes, and practices about
educational assessment. For example, Plake and Impara (1992) surveyed assessment
knowledge of 555 in-service teachers in the United States using an instrument titled the
"Teacher Assessment Knowledge Questionnaire (TALQ)" consisting of 35 items based on the
"Standards for Teacher Competence in the Educational Assessment" (AFT, NCME, & NEA,
1990).
Page 5
World Scientific News 16 (2015) 95-115
-99-
The results indicated that the teachers were not well prepared to assess student learning
as revealed by the average score of 23 out of 35 items correct, and as such teachers'
assessment knowledge should deserve further recognition and investigation. In his discussion
of the assessment knowledge, Popham (2006) asserted the need for a continuous in-service
assessment training aligned with the classroom assessment realities. In a survey of assessment
knowledge of 69 teacher candidates, Volante and Fazio (2007) found that the self-described
levels of assessment knowledge remained relatively low for the candidates across the four
years of the teacher education program, and hence agreed with Popham's (2006) assertion
about the need for in-service assessment training to ensure an acceptable level of assessment
knowledge.
Along similar lines, Wolfe, Viger, Jarvinen, and Linkman (2007) proposed that teachers'
self-perceived competence in assessment should be a vital component in the professional
development of in-service teachers. As part of the educational assessment knowledge,
teachers are required to understand the legal and ethical issues in the educational assessment
practices (AFT, NCME, & NEA, 1990; Brookhart, 2011).
In a related study, Pope, Green, Johnson, and Mitchell (2009) examined perceptions of
103 teachers on the ethical issues related to the educational assessment of students. Results
indicated that the grading of students, standardized testing, and the assessment-related needs
of special populations of students were the most frequently reported areas placing teachers in
ethically difficult situations.
Pope et al. (2009) argued that ethics of assessment should be part of the professional
training of teachers in educational assessment. Confirming to Pope et al.’s (2009) argument,
Mertler (2009) examined the effectiveness of a two-week workshop on educational
assessment for seven in-service teachers. Results showed that teachers’ knowledge and skills
in educational assessment including the ability to determine unethical assessment practices
improved significantly after the workshop.
Ogan-Bekiroglu (2009) concluded that teachers’ knowledge and attitudes related to the
educational assessment should be taken into account when introducing reforms in the
educational systems. Using a case study, Lyon (2011) described the alignment of teacher’s
beliefs about educational assessment and their classroom assessment practices. Further, in a
study of 516 in-service teachers, Alkharusi (2011) found that in-service assessment training
and teaching experience correlated positively with educational assessment knowledge.
Similarly, when examining educational assessment knowledge of 259 pre-service teachers
who completed an educational assessment course, Alkharusi (2011b) found that male teachers
tended to have on average a higher level of educational assessment knowledge than female
teachers. In the above literature review, the present study is an attempt to examine the
significance of educational institutions in Bangladesh. It is expected that such a study would
be helpful for the development in education sector of Bangladesh.
3. OBJECTIVES OF THE STUDY
The main objective of the study is to know the present status of educational assessment
of secondary and higher secondary teachers of Bangladesh. The specific objectives of the
study are as follows:
Page 6
World Scientific News 16 (2015) 95-115
-100-
1) to know the current status of educational assessment of secondary and higher secondary
teachers of Bangladesh;
2) to know the teachers’ gender, teaching grade, teaching subject, pre-service assessment
training, in-service assessment training, teaching load, and teaching experiences relate to
their educational assessment;
3) to describe teachers’ attitude towards educational assessment;
4) to identify teachers’ perceptions of their competence in the educational assessment;
5) to review teachers’ knowledge about educational assessment;
6) to explain teachers’ practices in educational assessment;
7) to express teachers’ uses of classroom tests;
8) to show teachers’ attitudes toward classroom tests; and
9) to explore differences in the educational assessment of the teachers with respect to
teachers’ gender, teaching grade, teaching subject, pre-service assessment training, in-
service assessment training, teaching load, and teaching experience.
4. METHODOLOGY OF THE STUDY
The participants in this study were 80 in-service teachers (20 males and 60 females)
teaching grades (5-10) randomly selected from secondary school and higher secondary
colleges in Chittagong city. About 85% of the teacher resides in Chittagong city. The 16.5%
participants were teaching Bangla language, 19.2% English language, 14.6% Business
studies, 22.5% Mathematics, 12.5% Science and 14.7% Social science studies. The teaching
experience of the teachers ranged from 1 to 20 years with an average of 11.10 and a standard
deviation of 5.24. The self-reported teaching load of the participants ranged from 4 to 20
classes per week with an average of 15 and a standard deviation of 5. One hundred and fifty
teachers indicated that they have taken one course in educational assessment during their pre-
service preparation. Sixty five teachers indicated that they have taken at least one in-service
workshop training in the educational assessment whereas eighty five teachers indicated that
they did not take in-service workshop training in the educational assessment.
4. 1. Instrumentation
A self-report questionnaire of seven parts was used in this study. The first part was
about background and demographic data of the participants including gender, nationality,
current teaching class, teaching subject, teaching load, teaching experience, and pre-service
and in-service training in the educational assessment. The other six parts were about attitude
towards educational assessment, self-perceived competence in educational assessment,
knowledge in educational assessment, educational assessment practices, uses of classroom
tests, and attitude towards classroom tests. To establish content validity, the questionnaire was
given to an expert in the areas of educational measurement and psychology from the Institute
of Education, Research & Training (IERT) of University of Chittagong. He was asked to
judge the clarity of wording and the appropriateness of each item and its relevance to the
construct being measured. Their feedback was used for further refinement of the
questionnaire.
Page 7
World Scientific News 16 (2015) 95-115
-101-
4. 2. Attitude towards Educational Assessment
In attitude towards educational assessment responses were obtained on a 5-point Likert
scale ranging from 1 (strongly disagree) to 5 (strongly agree). Scoring of the negative items
was reversed so that a high score reflected a more positive attitude towards educational
assessment.
4. 3. Self-perceived Competence in Educational Assessment
This part of the questionnaire contained self-Confidence Scale in Educational
Measurement designed to assess teachers' perceptions of confidence in their abilities to
perform certain educational assessment tasks related to developing and administering
assessment methods; analyzing assessment results; developing and scoring performance
assessment; developing grading procedures; and communicating assessment results to various
audiences. Additional items related to recognizing ethics of assessment were added to the
questionnaire. Responses were obtained on a 5-point Likert scale ranging from 1 (very low
competence) to 5 (very high competence) with high scores reflecting a high level of
competence in educational assessment. An individual's self-perceived competence in each
area of the educational assessment was represented by an average rating score across all the
items in that area. Also, an overall individual's self-perceived competence in educational
assessment was represented by an average rating score across all the items. Internal
consistency reliability coefficient for the total scale scores was 0.93 as measured by
Cronbach's alpha.
4. 4. Knowledge in Educational Assessment
In this part assesses teachers' knowledge and understanding of the basic principles of the
educational assessment practices, terminology, development, and use of various classroom
assessment methods. All items followed a multiple-choice format with four options, one being
the correct answer.
4. 5. Educational Assessment Practices
This part of the questionnaire designed to assess teachers' frequent use of various
assessment practices related to traditional assessment methods; alternative assessment
methods; analysis of assessment results; assessment communication; assessment standards
and criteria; student-involved assessment; and non-achievement grading factors. Responses
were obtained on a 5-point Likert scale ranging from 1 (never) to 5 (all of the time) with high
scores reflecting more frequent use of the assessment described in the item. An individual's
frequent use of the assessment practice in a particular area was represented by an average
rating score across all the items in that area.
4. 6. Uses of Classroom Tests
The participant teachers were asked to indicate the extent to which they use results
obtained from classroom tests in addressing different areas of instructional decisions:
diagnose student weakness, group students for instructional purposes, plan for instruction,
assign grades, evaluate instruction, control student behavior, motivate students for learning,
Page 8
World Scientific News 16 (2015) 95-115
-102-
evaluate academic achievement, compare student performances with others, upgrade students
from one class to another.
4. 7. Attitude towards Classroom Tests
Six positively worded items and four negatively worded items were used to measure
teachers’ attitude towards classroom tests. Responses were obtained on a 5-point Likert scale
ranging from 1 (strongly disagree) to 5 (strongly agree). Scoring of the negative items was
reversed so that a high score reflected a more positive attitude towards classroom tests.
Permission was requested from head of the institutions to collect data from the teachers. The
participants were informed that a study is being conducted to investigate teachers’ assessment
attitudes, competence, knowledge, and practices. The teachers were also informed that they
were not obligated to participate in the study, and that if they wished, their responses would
remain anonymous and confidential. Those who wished to participate in the study were
provided a cover letter and the questionnaire along with brief instructions about the
information that was requested in the questionnaire, how to respond to the items, and where to
find directions that were also included both on the cover letter and the questionnaire. The
participants took on average one hour to complete the questionnaire.
5. SCOPE OF THE STUDY
This is a self-finance study. Considering the time and money factors, I have kept the
study limited to only two levels of education (i.e. secondary and higher secondary level of
education).
6. LIMITATIONS OF THE STUDY
It is not to deny that the paucity of time and resources at the disposal of the researchers
and constrains to access to data, only two levels (secondary and higher secondary) of
education have been selected for the study. As the study focuses on only one sector, that is
education, it might be helpful for the policy makers of the country to examine the gap in the
content and quality of disclosure in other sector. The study would have been more
representative if more samples (i.e. degree colleges and universities) could have been taken.
7. FINDINGS AND ANALYSIS
The data analysis was primarily descriptive using frequencies, percentages, means, and
standard deviations. Factorial analysis of variance (Factorial ANOVA) was used to examine
differences in teachers’ attitude towards and knowledge in educational assessment as well as
their attitude towards and uses of classroom tests with respect to teachers’ gender, teaching
class, teaching subject, pre-service training in assessment, and in-service training in
assessment. Multivariate analysis of variance (MANOVA) was used to examine differences in
teachers’ competence and practices in educational assessment with respect to teachers’
gender, teaching class, teaching subject, pre-service training in assessment, and in-service
Page 9
World Scientific News 16 (2015) 95-115
-103-
training in assessment. Post-hoc comparisons were conducted using Scheffe’s test. Pearson
product-moment correlation coefficients were computed to examine relationships of teachers’
teaching load and teaching experience to their assessment attitudes, competence, knowledge,
and practices.
7. 1. Attitude towards Educational Assessment
An analysis of teachers’ attitude towards educational assessment is presented in Table 1.
Overall, the teachers tended to have a positive attitude towards educational assessment (M =
3.0855, SD = 0.4165). The 51.25% of the teachers reported having positive and 12.50%
strongly positive attitude towards educational assessment. 32.50% reported being neutral in
their attitude towards educational assessment and 3.75% perceived themselves to have a
negative attitude towards educational assessment.
Table 1. Frequencies for teacher attitude towards educational assessment.
Scale Value Attitude f %
1.00-1.79 Strongly negative attitude 0 0.00
1.80-2.59 Negative attitude 3 3.75
2.60-3.39 Neutral 26 32.50
3.40-4.19 Positive 43 51.25
4.20-5.00 Strongly positive attitude 28 12.50
N 80 100.00
Table 2. Factorial ANOVA for the attitude towards educational assessment
Sources SS df MS F p-Value
Gender 0.1394 1 0.1394 0.7349 0.3009
Teaching class 0.8015 3 0.1606 0.8415 0.3621
Teaching subject 7.7265 3 1.5450 8.1149 0.0000
Pre-service training 0.3740 1 0.3740 1.9618 0.1113
In-service training 0.1113 1 0.1113 0.5856 0.3468
Error 24.4409 71 0.1615
Further analysis of teachers’ attitude towards educational assessment was conducted to
examine differences with respect to teachers’ gender, teaching class, teaching subject, pre-
service training in assessment, and in-service training in assessment using factorial ANOVA.
Table 2 summarizes results of the factorial ANOVA. There were no statistically significant
differences in the attitude towards educational assessment between the teachers with respect
Page 10
World Scientific News 16 (2015) 95-115
-104-
to their gender, teaching class, pre-service training in assessment, and in-service training in
assessment. However, there was a statistically significant difference in the attitude towards
educational assessment between the teachers with respect to their teaching subject (partial η2
= 0.231). Scheffe’s test indicated that teachers teaching English language and those teaching
Social science tended to have on average less favorable attitude towards educational
assessment than those teaching Bangla Language, Business Studies, and Mathematics.
Pearson product-moment correlation coefficients indicated no statistically significant
relationships of teaching load and teaching experience with attitude towards educational
assessment.
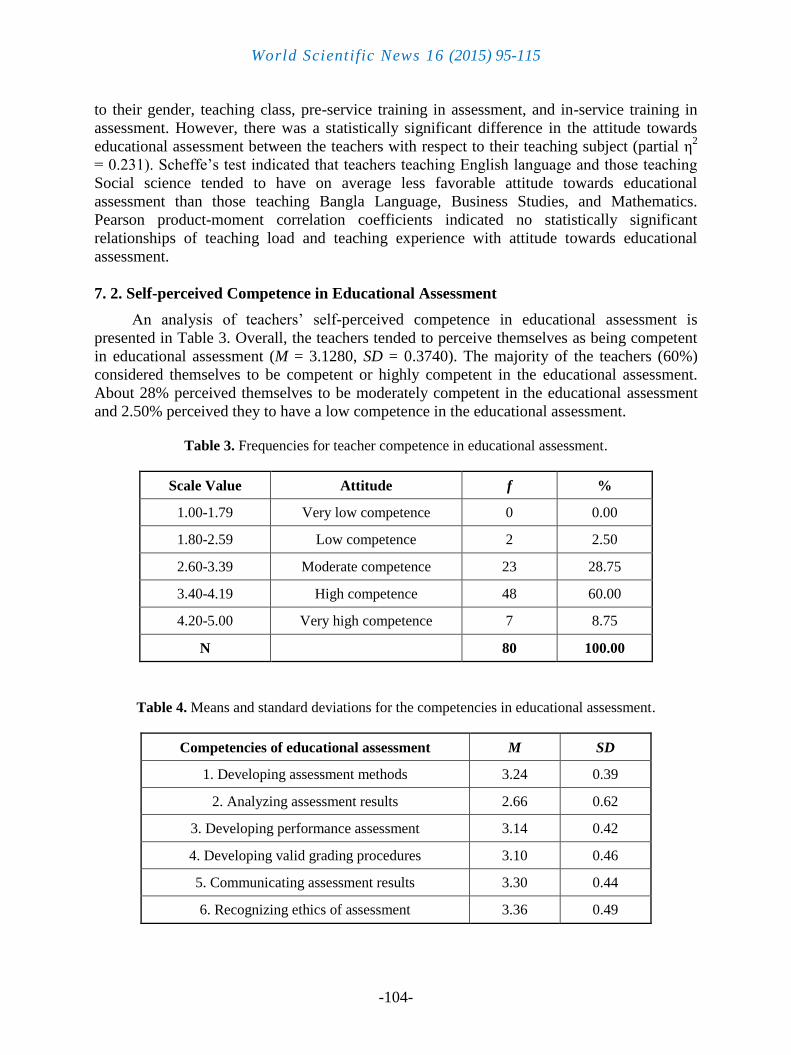
7. 2. Self-perceived Competence in Educational Assessment
An analysis of teachers’ self-perceived competence in educational assessment is
presented in Table 3. Overall, the teachers tended to perceive themselves as being competent
in educational assessment (M = 3.1280, SD = 0.3740). The majority of the teachers (60%)
considered themselves to be competent or highly competent in the educational assessment.
About 28% perceived themselves to be moderately competent in the educational assessment
and 2.50% perceived they to have a low competence in the educational assessment.
Table 3. Frequencies for teacher competence in educational assessment.
Scale Value Attitude f %
1.00-1.79 Very low competence 0 0.00
1.80-2.59 Low competence 2 2.50
2.60-3.39 Moderate competence 23 28.75
3.40-4.19 High competence 48 60.00
4.20-5.00 Very high competence 7 8.75
N 80 100.00
Table 4. Means and standard deviations for the competencies in educational assessment.
Competencies of educational assessment M SD
1. Developing assessment methods 3.24 0.39
2. Analyzing assessment results 2.66 0.62
3. Developing performance assessment 3.14 0.42
4. Developing valid grading procedures 3.10 0.46
5. Communicating assessment results 3.30 0.44
6. Recognizing ethics of assessment 3.36 0.49
Page 11
World Scientific News 16 (2015) 95-115
-105-
Table 4 displays means and standard deviations of the teachers’ responses regarding
their competence in the different areas of the educational assessment. As shown in Table 4,
although teachers perceived themselves to be competent in developing and administering
assessment methods, developing and scoring performance assessment, developing valid
grading procedures, communicating assessment results to various audiences, and recognizing
ethics of assessment; they tended to have on average a lower level of competence in analyzing
assessment results than other areas of the educational assessment.
Further analysis of teachers’ competence in the educational assessment was conducted
to examine differences with respect to teachers’ gender, teaching class, teaching subject, pre-
service training in assessment, and in-service training in assessment using MANOVA. Results
revealed a statistically significant multivariate effect for gender on the teachers’ competence
in the educational assessment; F(6, 74) = 3.798, Wilks’ Lambda = 0.865, p = 0.002. There
were no statistically significant multivariate effects for teaching subject, teaching class, pre-
service assessment training, and in-service assessment training on the teachers’ competence in
the educational assessment. The univariate analysis showed statistically significant gender
differences on recognizing ethics of assessment; F(1, 79) = 13.771, p = 0.000, partial η2 =
0.084. Female teachers (M = 4.083, SD = 0.45) perceived themselves to be more competent
on recognizing ethics of assessment than male teachers (M = 3.731, SD = 0.64).
Table 5. Pearson product-moment correlation coefficients of teaching load and
teaching experience with teacher’s competence in the educational assessment (N = 80).
Variables Teaching
load
Teaching
experience
1. Developing assessment methods -.148* 0.109
2. Analyzing assessment results -.106 0.057
3. Developing performance assessment -.215** 0.146*
4. Developing valid grading procedures -.137* 0.044
5. Communicating assessment results -.152* 0.127
6. Recognizing ethics of assessment -.133* 0.139*
7. Overall competence in assessment -.178** 0.123
*p < 0.05, **p < 0.01
Table 5 displays Pearson product-moment correlation coefficients of teaching load per
week and teaching experience with teacher’s competence in the educational assessment. As
shown in Table 5, weekly teaching load correlated negatively with teacher’s overall
competence in the educational assessment as well as with teacher’s competence in developing
and administering assessment methods, developing and scoring performance assessment,
developing valid grading procedures, communicating assessment results to various audiences,
and recognizing ethics of assessment. There was no statistically significant correlation
between weekly teaching load and teacher’s competence in analyzing assessment results.
According to Table 5, there were statistically significant positive relationships between
Page 12
World Scientific News 16 (2015) 95-115
-106-
teaching experience and teacher’s competence in developing and scoring performance
assessment and recognizing ethics of assessment. Teaching experience did not correlate
significantly with teacher’s overall competence in the educational assessment as well as with
teacher’s competence in developing and administering assessment methods, analyzing
assessment results, developing valid grading procedures, and communicating assessment
results to various audiences.
7. 3. Knowledge in Educational Assessment
The scores of the participating teachers on the TALQ ranged from 3 to 21 with an
average of 12.42 and a standard deviation of 3.34. Approximately 41 (25%) teachers
answered 10 items or less correctly out of 32 items of the TALQ. About 42 (50%) teachers
answered 12 items or less correctly out of 32 items of the TALQ. Approximately 60 (75%)
teachers answered 15 items or less correctly out of 32 items of the TALQ. Further analysis of
teachers’ knowledge in educational assessment was conducted to examine differences with
respect to teachers’ gender, teaching class, teaching subject, pre-service training in
assessment, and in-service training in assessment using factorial ANOVA.
Table 6. Factorial ANOVA for the educational assessment knowledge.
Sources SS df MS F p-Value
Gender 118.610 1 118.610 12.385 0.000
Teaching class 79.962 3 79.962 1.670 0.074
Teaching subject 97.664 3 97.664 2.14 0.034
Pre-service training 21.820 1 21.820 2.278 0.880
In-service training 57.814 1 57.814 6.036 0.007
Error 1229.190 71
Table 6 summarizes results of the factorial ANOVA. As shown in Table 6, there were
no statistically significant differences in the educational assessment knowledge as measured
by TALQ’s scores between the teachers with respect to their teaching class and pre-service
training in assessment. However, there were statistically significant differences in the
educational assessment knowledge with respect to teacher’s gender (partial η2
= 0.088),
teaching subject (partial η2 = 0.074), and in-service training in assessment (partial η
2 = 0.045).
Female teachers (M = 12.588, SD = 3.21) tended to have on average a higher level of
educational assessment knowledge than male teachers (M = 10.236, SD = 3.51). Teachers
having in-service training in assessment (M = 12.115, SD = 3.20) demonstrated on average a
higher level of educational assessment knowledge than teachers having no in-service
assessment training. Scheffe’s test indicated that Business Studies teachers (M = 12.438, SD =
3.53) and Mathematics teachers (M = 12.612, SD = 4.81) had on average a higher level of
educational assessment knowledge than English language teachers (M = 10.746, SD = 3.09).
Also, Business Studies teachers had on average a higher level of the educational assessment
knowledge than social science teachers (M = 10.155, SD = 2.67).
Page 13
World Scientific News 16 (2015) 95-115
-107-
Pearson product-moment correlation coefficients indicated no statistically significant
relationships of teaching load and teaching experience with educational assessment
knowledge.
7. 4. Educational Assessment Practices
Table 7 presents descriptive statistics for teachers’ assessment practices. As shown in
Table 7, the teachers reported involving students in the assessment process, analyzing
assessment results, using alternative assessment methods, and using non-achievement factors
in grading some of the time. Less than a quarter of the teachers indicated involving students in
the assessment process most to all of the time. Less than one third of the teachers reported
analyzing assessment results most to all of the time. About one third of the teachers
mentioned using alternative assessments most to all of the time. Also, the teachers reported
using traditional assessment methods, developing scoring criteria and standards for
performance assessments, and communicating assessment results to various audiences most
of the time. Nearly half of the teachers indicated using traditional assessment methods most to
all of the time. About 71% of the teachers reported communicating assessment results to
various audiences most to all of the time. Approximately 64% of the teachers indicated
developing scoring criteria and standards for performance assessments most to all of the time.
Table 7. Descriptive statistics for teachers’ assessment practices (N = 80).
Assessment practices
Scale value
M
SD
1.00-1.79 1.80-2.59 2.60-3.39 3.40-4.19 4.20-5.00
Never Seldom Some of
the time
Most of
the time
All of
the time
f (%) f (%) f (%) f (%) f (%)
1. Traditional assessment
methods 0 (0.0) 3(3.75) 36(45) 33(41.25) 8(10) 2.91 0.43
2. Alternative assessment
methods 0 (0.0) 12(15) 40(50) 18(22.5) 10(8) 2.68 0.48
3. Analysis of assessment
results 2 (3.6) 15(18.8) 38(46.7) 20(26.1) 5(4.8) 2.61 0.60
4. Assessment communication 0 (0.0) 0(0.0) 23(28.75) 42(52.5) 15(18.75) 2.66 0.33
5. Assessment standards and
criteria 0 (0.0) 2(2.4) 26(33.9) 35(44.8) 17(18.8) 3.04 0.48
6. Student-involved assessment 10(14.5) 13(15.8) 36(46.7) 11(13.9) 10(9.1) 2.47 0.76
7. Non-achievement grading
factors 1(1.25) 11(13.75) 40(50) 20(25) 8(10) 2.69 0.55
Further analysis of teachers’ assessment practices was conducted to examine differences
with respect to teachers’ gender, teaching class, teaching subject, pre-service training in
assessment, and in-service training in assessment using MANOVA. Results revealed a
statistically significant multivariate effect for gender on the teachers’ assessment practices;
F(7,73) = 7.499, Wilks’ Lambda = 0.734, p = 0.000.
Page 14
World Scientific News 16 (2015) 95-115
-108-
There were no statistically significant multivariate effects for teaching subject, teaching
class, pre-service assessment training, and in-service assessment training on the teachers’
assessment practices. The univariate analysis showed statistically significant gender
differences on using alternative assessments; F(1, 79) = 13.454, p = 0.000, partial η2 = 0.082;
analyzing assessment results; F(1, 79) = 5.790, p = 0.017, partial η2 = 0.037; communicating
assessment results; F(1, 79) = 5.434, p = 0.021, partial η2 = 0.035; using assessment standards
and criteria; F(1, 79) = 11.896, p = 0.001, partial η2 = 0.073; and using non-achievement
grading factors; F(1, 79) = 12.530, p = .001, partial η2 = 0.077. Alternative assessments were
used more frequently by male teachers (M = 3.548, SD = 0.51) than by female teachers (M =
3.156, SD = 0.54). Male teachers (M = 3.483, SD = 0.48) tended to analyze assessment results
more frequently than female teachers (M = 3.154, SD = 0.75). Female teachers (M = 3.772,
SD = 0.50) tended to communicate assessment results with various audiences more frequently
than male teachers (M = 3.552, SD = 0.45). Assessment standards and criteria were used more
frequently by female teachers (M = 3.703, SD = 0.55) than by male teachers (M = 3.322, SD =
0.57). Female teachers (M = 3.126, SD = 0.67) tended to use non-achievement factors in
grading less frequently than male teachers (M = 3.570, SD = 0.48).
Table 8. Pearson product-moment correlation coefficients of teaching load and
teaching experience with teachers’ assessment practices (N = 80).
Variables Teaching
load
Teaching
experience
1. Traditional assessment methods -0.158* 0.133*
2. Alternative assessment methods -0.064 0.064
3. Analysis of assessment results -0.118 0.011
4. Assessment communication -0.209** 0.087
5. Assessment standards and criteria -0.136* 0.034
6. Student-involved assessment -0.011 -0.029
7. Non-achievement grading factors -0.021 -0.045
*p < .05, **p < .01
Table 8 displays Pearson product-moment correlation coefficients of teaching load per
week and teaching experience with teachers’ assessment practices. Weekly teaching load
correlated negatively various audiences. There were no statistically significant correlations
between weekly teaching load and teacher’s use of alternative assessments, analysis of
assessment results, student-involved assessment, and non-achievement grading factors. There
was a statistically significant positive relationship between teaching experience and teacher’s
use of traditional assessments. However, teaching experience did not correlate significantly
with teacher’s use of alternative assessments, analysis of assessment results, communication
of assessment results, assessment standards and criteria, student-involved assessment, and
non-achievement grading factors.
Page 15
World Scientific News 16 (2015) 95-115
-109-
7. 5. Uses of Classroom Tests
Table 9 presents descriptive statistics for teachers’ uses of classroom tests. As shown in
Table 9, on average, the teachers reported using classroom tests for assigning grades and
motivating students for learning all of the time. Also, on average the teachers indicated using
classroom tests most of the time for other purposes such as diagnosing students’ weakness,
grouping students for instruction, planning for instruction, evaluating instructional methods,
controlling students’ behavior, evaluating academic achievement, comparing students’
performances with each other, and upgrading students from one class to another.
Table 9. Descriptive statistics for teachers’ uses of classroom tests (N = 80).
Assessment practices
Scale value
M SD
1.00-1.79 1.80-2.59 2.60-3.39 3.40-4.19 4.20-5.00
Never Seldom Some of
the time
Most of
the time
All of
the time
f (%) f (%) f (%) f (%) f (%)
1. Diagnose student
weaknesses 0(0.0) 2(2.5) 15(18.75) 33(41.25) 30(37.5) 3.51 0.68
2. Group students for
instruction 0(0.0) 3(3.75) 27(33.75) 33(41.25) 17(21.25) 3.24 0.70
3. Plan for instruction 2(2.5) 7(8.75) 26(32.5) 34(42.5) 11(13.75) 3.06 0.82
4. Assign grades 0(.00) 2(2.5) 15(18.75) 22(27.5) 41(51.25) 3.65 0.71
5. Evaluate
instructional methods 3(3.75) 8(10) 27(33.75) 26(32.5) 16(20) 3.11 0.88
6. Control student
behavior 4(5) 3(3.75) 23(28.75) 20(25) 30(37.5) 3.33 0.94
7. Motivate students
for learning 0(0.0) 2(2.5) 16(20) 25(31.25) 37(46.25) 3.62 0.71
8. Evaluate academic
achievement 1(1.25) 2(25) 17(21.25) 26(32.5) 36(45) 3.55 0.74
9. Compare students’
performances 3(3.75) 4(5) 31(38.75) 27(33.75) 15(18.75) 3.08 0.83
10. Upgrade students
to upper classes 2(25) 4(5) 23(28.5) 25(31.5) 26(32.5) 3.32 0.82
Further analysis of teachers’ uses of classroom tests was conducted to examine
differences with respect to teachers’ gender, teaching class, teaching subject, pre-service
training in assessment, and in-service training in assessment using MANOVA. Results
revealed statistically significant multivariate effects for gender; F(10, 70) = 3.084, Wilks’
Lambda = 0.822, p = 0.001; teaching class; F(50, 650.984) = 1.696, Wilks’ Lambda = 0.572, p
= 0.003; and teaching subject; F(50, 650.984) = 0.719, Wilks’ Lambda = 0.568, p = 0.002 on
the teachers’ uses of classroom tests. There were no statistically significant multivariate
effects for pre-service assessment training and in-service assessment training on the teachers’
uses of classroom tests. The univariate analysis showed statistically significant gender
Page 16
World Scientific News 16 (2015) 95-115
-110-
differences favoring female teachers than male teachers on using classroom tests for grouping
students; F(1, 79) = 6.132, p = 0.014, partial η2 = 0.039; assigning grades; F(1, 79) = 17.494,
p = 0.000, partial η2 = 0.104; motivating students; F(1, 79) = 4.609, p = 0.033, partial η
2 =
0.030; evaluating academic achievement; F(1, 79) = 10.923, p = 0.001, partial η2 = 0.067; and
upgrading students from one class to another; F(1, 79) = 6.092, p = 0.015, partial η2 = 0.039.
Also, the univariate analysis showed statistically significant differences by teaching class on
using classroom tests for grouping students; F(5, 75) = 2.621, p = 0.026, partial η2 = 0.080;
and assigning grades; F(5, 75) = 2.458, p = 0.036, partial η2 = 0.075. Scheffe’s test indicated
that sixth grade teachers (M = 4.16, SD = 0.82) tended to use classroom tests for grouping
students more frequently than ninth grade teachers (M = 3.46, SD = 0.95). Also, the sixth
grade teachers (M = 4.68, SD = 0.60) reported using classroom tests for assigning grades more
frequently than fifth grade teachers (M = 3.91, SD = 0.90) and ninth grade teachers (M = 4.08,
SD = 0.89). Further, the univariate analysis showed statistically significant differences by
teaching subject on using classroom tests for grouping students; F(5, 75) = 2.970, p = 0.014,
partial η2 = 0.090; and evaluating academic achievement; F(5, 75) = 3.328, p = 0.007, partial
η2 = 0.026. Scheffe’s test indicated that Bangla language teachers (M = 4.20, SD = 0.76)
tended to use classroom tests for grouping students more frequently than Business Studies
teachers (M = 3.59, SD = 0.79). Also, Social science teachers (M = 4.55, SD = 0.51) reported
using classroom tests for evaluating academic achievement more frequently than Bangla
language teachers (M = 3.84, SD = 0.90).
Table 10. Pearson product-moment correlation coefficients of teaching load
and teaching experience with teachers’ uses of classroom tests (N = 80).
Variables Teaching
load
Teaching
experience
1. Diagnose student weaknesses -0.133* 0.075
2. Group students for instruction -0.180** -0.008
3. Plan for instruction 0.032 -0.048
4. Assign grades -0.114 0.149*
5. Evaluate instructional methods -0.105 0.001
6. Control student behavior -0.016 -0.063
7. Motivate students for learning -0.124 0.063
8. Evaluate academic achievement -0.123 0.129*
9. Compare students’ performances -0.129* 0.110
10. Upgrade students to upper classes -0.034 0.095
*p < .05, **p < .01
Table 10 displays Pearson product-moment correlation coefficients of teaching load per
week and teaching experience with teachers’ uses of classroom tests. As shown in Table 10,
weekly teaching load correlated negatively with teacher’s use of classroom tests for
Page 17
World Scientific News 16 (2015) 95-115
-111-
diagnosing students’ weaknesses, grouping students for instruction, and comparing student
performance with others. There were no statistically significant correlations between weekly
teaching load and teacher’s use of classroom tests for planning for instruction, evaluating
instructional methods, controlling students’ behavior, motivating students, evaluating
academic achievement, and upgrading students from one class to another. According to Table
10, there were statistically significant positive relationships between teaching experience and
teacher’s use of classroom tests for assigning grades and evaluating academic achievement.
However, teaching experience did not correlate significantly with teacher’s use of classroom
tests for diagnosing students’ weakness, grouping students for instruction, planning for
instruction, evaluating instructional methods, controlling students’ behavior, motivating
students, comparing students’ performances with each other, and upgrading students from one
class to another.
7. 6. Attitude towards Classroom Tests
An analysis of teachers’ attitude towards classroom tests is presented in Table-11.
Overall, the teachers tended to have a positive attitude towards classroom tests (M = 3.56, SD
= 0.38). The 68.75% of the teachers reported having positive to strongly positive attitude
towards classroom tests. About one quarter of the teachers reported being neutral in their
attitude towards classroom tests.
Table 11. Frequencies for teacher attitude towards classroom tests.
Scale Value Attitude f %
1.00-1.79 Strongly negative attitude 0 0.00
1.80-2.59 Negative attitude 0 0.00
2.60-3.39 Neutral 25 31.25
3.40-4.19 Positive 50 62.50
4.20-5.00 Strongly positive attitude 5 6.25
N 80 100.00
Further analysis of teachers’ attitude towards classroom tests was conducted to examine
differences with respect to teachers’ gender, teaching class, teaching subject, pre-service
training in assessment, and in-service training in assessment using factorial ANOVA.
Table 12 summarizes results of the factorial ANOVA. As shown in Table 12, there were
no statistically significant differences in the attitude towards classroom tests between the
teachers with respect to their gender, teaching class, teaching subject, pre-service training in
assessment, and in-service training in assessment. Pearson product-moment correlation
coefficients indicated teachers’ attitude towards classroom tests correlated negatively with
weekly teaching load, r(73) = -0.151, p = 0.052; and positively with teaching experience;
r(73) = 0.194, p = 0.013
Page 18
World Scientific News 16 (2015) 95-115
-112-
Table 12. Factorial ANOVA for the attitude towards classroom tests (N = 80).
Sources SS df MS F p-Value
Gender 0.306 1 0.306 2.159 0.096
Teaching class 0.280 3 0.056 0.396 0.680
Teaching subject 0.560 3 0.112 0.791 0.393
Pre-service training 0.034 1 0.034 0.247 0.501
In-service training 0.278 1 0.278 1.969 0.110
Error 18.178 71 0.120
8. CONCLUSIONS
Assessment of student learning is one of the daily classroom tasks for teachers. A
significant proportion of the classroom time is devoted to educational assessment-related
activities. These assessment activities play a critical role in shaping student academic
motivation and performance. Educators have long recognized that teachers’ knowledge and
beliefs might influence their classroom practices. As might be expected, undesirable teachers’
knowledge and beliefs about educational assessment could cripple the quality the assessment
outcomes. Thus, there is a need to fully understand teachers’ attitudes, competence,
knowledge, and practices about educational assessment. The present study aimed at
addressing this need. Results revealed that although teachers held a favorable attitude towards
and perceived themselves as being competent in educational assessment, they demonstrated a
low level of knowledge in educational assessment. Teachers used a variety of assessments in
the classroom primarily for assigning grades and motivating students to learn, with some
variations by gender, grade level, and subject area. Teaching load and teaching experience
accounted for some of the variations in teachers’ educational assessment practices.
Appropriate classroom assessment practices have been identified as one of the critical element
that must be considered in order to maximize student learning. However, this research has
consistently reported that teachers, in general, lack adequate knowledge about educational
assessment deemed necessary for appropriate assessment practices. It is identified that two
external sources (educational policy and professional development) and an internal source
(teachers’ beliefs) mediating teachers’ assessment practices.
The present study provided evidence that in-service training in educational assessment
might have a positive impact on teachers’ educational assessment knowledge. Thus, it is
recommended that ongoing professional development programs should be designed to
strengthen teachers’ educational assessment knowledge and skills. As shown in this study, the
teachers had positive views about educational assessment and perceived themselves as
competent in educational assessment. Teachers’ assessment practices tend to be influenced by
their beliefs about educational assessment. However, the results of the present study showed
that heavy weekly teaching load of the teachers might have a negative impact on teachers’
assessment beliefs, knowledge, and practices. The present study found that teaching load and
other school responsibilities could cause conflicts between teachers’ assessment beliefs and
Page 19
World Scientific News 16 (2015) 95-115
-113-
practices. Thus, it is recommended that the authority should pay attention to the teaching load
of the teachers in relation to the educational assessment responsibilities of the teachers. The
current findings showed some trends with respect to grade level and subject area in relation to
teachers’ self-perceived competence, knowledge, and practices in educational assessment.
Thus, it is recommended that teacher educators should consider the specific nature of the
various grade levels and subject areas when designing and implementing professional
development programs for teachers in educational assessment.
The findings of this study revealed that gender differences exist in educational
assessment competence, knowledge, and practices. In this study, female teachers were found
to have on average a higher level of knowledge and self-perceived competence in educational
assessment than male teachers. The study reported that gender differences in the self-
perceived assessment skills favoring female teachers and found gender differences in the
educational assessment knowledge favoring male teachers. In addition, the current study
showed that female teachers tended to use non-achievement factors such as effort and ability
in grading more frequently than male teachers. These practices do not align with those
recommended by educational assessment experts who state that non-achievement factors such
as effort, ability, interest, and motivation should not be incorporated into academic grades
because they are complex to be operationally defined and measured. In this study it is also
found that female teachers seemed to be more skillful than male teachers in writing test items
and communicating assessment results, Science teachers perceived themselves more skillful
than Bangla and English language teachers and Business studies teachers in developing
performance assessment and analyzing assessment results, sixth grade teachers reported
higher levels of self-perceived skills in developing performance assessment than eighth and
tenth grade teachers, teaching experience correlated positively with self-perceived assessment
skills, and teachers with in-service assessment training showed a higher level of assessment
skills than those without in-service assessment training.
9. DIRECTIONS FOR FUTURE RESEARCH
Future research using classroom observations and interviews might shed more light on
gender differences in the educational assessment competence, knowledge, and practices.
Finally, the generalizability of the present study findings is limited by the use of self-report
questionnaire and by the particular sample of teachers. Future research might consider using
interviews and direct observations of teachers’ assessment practices to judge the validity of
the teachers’ responses to the questionnaire. Also, future research should be conducted to
testify the findings using a representative larger sample of teachers selected from various
educational institutions in the country.
References
[1] Alkharusi, H. A., An analysis of the internal and external structure of the teacher
assessment literacy questionnaire. International Journal of Learning, 18 (2011) 515-
528.
Page 20
World Scientific News 16 (2015) 95-115
-114-
[2] Alkharusi, H., A logistic regression model predicting assessment literacy among in-
service teachers. Journal of Theory and Practice in Education, 7 (2011) 280-291.
[3] American Federation of Teachers, National Council on Measurement in Education, &
National Education Association. Standards for teacher competence in educational
assessment of students. Educational Measurement: Issues and Practice, 9 (1990) 30-32.
[4] Alimo-Metcalfe, B. & Alban-Metcalfe, R., The development of a new Transformational
Leadership Questionnaire. Journal of Occupational and Organizational Psychology,
(2001) 1-27.
[5] Brookhart, S. M., Educational assessment knowledge and skills for teachers.
Educational Measurement: Issues and Practice, 30 (2011) 3-12.
[6] Calderhead, J., Teacher: Beliefs and knowledge. In D. C. Berliner & R. C. Calfee (Eds.),
Handbook of educational psychology (1996) 709-725). New York: Macmillan.
[7] Koh, K. H., Improving teachers’ assessment literacy through professional development.
Teaching Education, 22 (2011) 255-276.
[8] Lyon, E. G., Beliefs, practices and reflection: Exploring a science teacher’s classroom
assessment through the assessment triangle model. Journal of Science Teacher
Education, 22 (2011) 122-124.
[9] McMillan, J. H., & Lawson, S. R., Secondary science teachers’ classroom assessment
and grading practices, (2001) 301.
[10] Mertler, C. A., Teachers’ assessment knowledge and their perceptions of the impact of
classroom assessment professional development. Improving Schools, 12 (2009) 101-
113.
[11] Mertler, C. A., & Campbell, C., Measuring teachers' knowledge and application of
classroom assessment concepts: Development of the assessment knowledge inventory,
(2005) 25-28.
[12] Ogan-Bekiroglu, F., Assessing assessment: Examination of pre-service physics teachers’
attitudes towards assessment and factors affecting their attitudes. International Journal
of Science Education, 31 (2009) 1-29.
[13] Plake, B. S., & Impara, J. C., Teacher competencies questionnaire description. Lincoln,
NE: University of Nebraska, (1992) 312.
[14] Pope, N., Green, S. K., Johnson, R. L., & Mitchell, M., Examining teacher ethical
dilemmas in classroom assessment. Teaching and Teacher Education, 25 (2009) 778-
782.
[15] Popham, W. J., Needed: A dose of assessment knowledge. Educational Leadership, 63
(2006) 84-85.
[16] Siegel, M., & Wissehr, C., Preparing for the plunge: Preservice teachers’ assessment
literacy. Journal of Science Teacher Education, 22 (2011) 371-391.
[17] Volante, L., & Fazio, X., Exploring teacher candidates' assessment knowledge:
Implications for teacher education reform and professional development. Canadian
Journal of Education, 30 (2007) 749-770.
Page 21
World Scientific News 16 (2015) 95-115
-115-
[18] Wolfe, E. W., Viger, S. G., Jarvinen, D. W., & Linksman, J., Validation of scores from a
measure of teachers' efficacy toward standards-aligned classroom assessment.
Educational and Psychological Measurement, 67 (2007) 460-474.
[19] Zhang, Z., & Burry-Stock, J. A., Classroom assessment practices and teachers’ self-
perceived assessment skills. Applied Measurement in Education, 16 (2003) 323-342.
( Received 22 June 2015; accepted 08 July 2015 )