Page 1
1
A study on employee job satisfaction withspecial reference to the Indian automobile industry
Mousumi Sengupta
Chairperson - SDM RCMS &
Professor - HRM & OB
[email protected]
Nilanjan Sengupta
Professor – HRM & OB
[email protected]
Srilakshminarayana G.
Assistant Professor - Quantitative Methods
[email protected]
Shri Dharmasthala Manjunatheshwara
Institute for Management Development
Page 2
2
Applied Research Series, 2017
(C) Applied Research Series 2017, SDM RCMS, SDMIMD, Mysuru
ISBN : 978-93-83302-21-5
Note :
All views expressed in this work are that of the author(s). SDM RCMS does not take any responsibility for the
views expressed herein by the author(s).
No part of this publication can be reproduced or transmitted in any form or by any means, without prior
permission of the publisher.
Page 3
3
Preface
SDM Research Center for Management Studies (RCMS), since inception, has endeavored to promote
research in the field of management education, in various ways. In this direction, in order to promote applied
research, the Research Center has taken a unique initiative to encourage the faculty members to carry out
various projects in the areas of management.
After completion of the projects, based on the peer review, reports are published with an ISBN number,
by the Institute. The projects help the faculty members, and the students, who assist the faculty members
for these projects, in various aspects, to gain practical knowledge, in the field of management.
The institute takes into account the time and resources required by the faculty members to carry out
such projects, and, fully sponsors them to cover the various costs of the project work (for data collection,
travel, etc).
From the academic viewpoint, these projects provide a unique opportunity to the faculty members and
the students to get a first-hand experience, in investigating issues and concerns of targeted organizations or
sectors, on a face to face basis, thereby, helping in knowledge creation and its transfer.
Mousumi Sengupta
Chairperson – SDM RCMS
Page 4
4
Applied Research Series, 2017
Page 5
5
We wish to thank Dr. N. R. Parasuraman,
Director – SDMIMD, who has been the key inspiration
behind the present study.
We wish to thank the SDME Trust, which has been
a constant source of motivation in this academic
journey.
Ms. Smitha Shetty, Ms. Aakansha Lakhani and
Mr. Manchit Mehta, the students of 2016-2018 Batch
of PGDM at SDMIMD, have provided timely support,
for collection and entry of data. We thank them for
their continuous support, and enthusiasm.
We thank all the faculty and staff members, who have
helped us, directly or indirectly, to complete this
project.
Finally, we like to extend our thanks to all the
respondents, who, despite their busy schedule, obliged
us by providing valuable information by filling up
the questionnaire and attending the personal
interviews.
Mousumi Sengupta
Nilanjan Sengupta
Srilakshminarayana G.
Acknowledgement
Page 6
6
Applied Research Series, 2017
Page 7
7
Table of Contents
Executive summary ..................................................................................................................................... I
Section I : Introduction ................................................................................................................................ 1
Section II : Review of literature ................................................................................................................... 2
Section III : Objectives of the study ............................................................................................................. 8
Section IV : Methodology and data analysis ................................................................................................ 9
Section V : Discussion ................................................................................................................................ 32
Section VI : Scope for further research...................................................................................................... 34
Section VII : References ............................................................................................................................. 34
Page 8
8
Applied Research Series, 2017
Page 9
9
Executive summary
Job satisfaction among employees is an important aspect of achieving desired productivity target and
remaining sustainable. It can be said that, organizations need to nurture both the extrinsic and intrinsic fac-
tors, which are responsible for developing and maintaining positive effect on the level of job satisfaction
among employees. The present project makes an attempt to investigate the concept of job satisfaction
among the employees in the automobile industry, which is one of the key drivers that boosts the economic
growth of the country.
A theoretical model has been proposed to measure the employee perception on the job satisfaction in the
automobile sector. The proposed model consisted of five factors and each factor was proposed to consist of a
number of variables. The factors explained both internal and external work-related issues: Engagement at
work, Relationship with boss, Relationship with co-workers, Reward and recognition, Work environment.
A questionnaire was prepared and administered on the entry-level and middle-level employees working in the
Indian automobile industry. Based on the Exploratory Factor Analysis of the data, collected at three different
phases by administering the questionnaire, it was revealed that the variables significantly explained the
respective factors. Also, there significant consistency levels in measuring the five factors, in measuring
the construct. This proved the reliability of the questionnaire. Based on the data analysis, it was concluded
that the model built is a good fit and also that the model built will give one an opportunity to understand
the factors associated with job satisfaction.
The analysis indicated that, the proposed model of job satisfaction is reliable, consistent, and good fit
to measure job satisfaction. This also proves that, as supported by the existing literature, entry-level and
middle-level employees, working in the Indian automobile industry, considered both the internal and external
factors responsible for their job satisfaction. It was also proved that, an organization can use the above
model and questionnaire to measure investigate the perception among the employees about the job
satisfaction. To investigate whether to measure job satisfaction, all the factors (proposed in the model) need
to be considered.
Based on the analysis, one could note that, though all the five factors were significant to investigate job
satisfaction, ‘engagement at work’ had to be given top priority, in order to investigate job satisfaction in
the Indian automobile industry. Further ‘work environment’ was identified of having the least priority in
investigating job satisfaction. ‘Relationship with boss’, ‘relationship with co-workers’ and ‘reward and
recognition’ were identified to be of second, third and fourth priority, respectively.
For ‘engagement at work’, the higher priority was assigned to ‘individual’s role in decision- making’, ‘autonomy’
and ‘job-role & responsibilities’. ‘Treatment from boss’ was ranked highest under the factor ‘relationship with
boss’. However, interestingly, in the case of factor ‘Relationship with co-workers’, aspect, such as, Co-workers’
support was ranked highest by the respondents. ‘Current salary’ was of the least rank among all the aspects
for the factor Reward and recognition’. In the context of the factor ‘work environment’, rest room facility,
safety measures, and refreshment facility were given top priority.
In addition to the above data, the researchers also gathered information based on personal and telephonic
interviews conducted with regard to the study. Issues, such as, Clarity and preciseness in communication
pattern, creation of a team culture by making an effort to know employees, training and improvement
programs, employee empowerment, enriching jobs, adequate and fair compensation and reward systems,
career advancement, regular and honest feedback, and safe working conditions, were stated as crucial actors
by the respondents.
I
Page 10
1
A study on employee job satisfaction with special
reference to the Indian automobile industry
Section I : Introduction
In the ever-changing business world, with increasing
competition and continuous demands from the stake-
holders, employees are believed to be the most
valuable asset in any organization, capable of meet-
ing such uncertain demands. Employees
bring the abilities, acquired knowledge and skills
represented by each individual employee. It is,
the employee’s performance which contributes
towards attainment of organizational goals. It is,
therefore, imperative to utilize the employees’
capabilities to the maximum possible extent, in order
to achieve individual and organizational goals. In
this context, it has been argued that, employees’
performance, to a large extent, is influenced by
motivation and job satisfaction (Rao, 2000).
According to Spector (1997), there are certain
common facets, which encompass the concept of
job satisfaction: Appreciation, Communication,
Co-workers, Fringe benefits, Job conditions,
Nature of the work, Organization, Personal growth,
Policies and procedures, Promotion opportunities,
Recognition, Security, and Supervision.
There are three important dimensions to job
satisfaction:
1) Job satisfaction refers to an individual employee’s
feeling towards his/her job. It can only be inferred
but not seen.
2) Job satisfaction can also be determined by
how well outcomes meet or exceed
expectations. This results into increased
commitment in the fulfi lment of formal
performance requirements.
3) The terms, job satisfaction and job attitudes are
often used synonymously. Both indicate positive
and affirmative orientations of the individuals
towards their job.
The concept of job satisfaction may be defined in sev-
eral ways.
It may be defined as how content an individual is with
his or her job, in other words, whether or not they
like the job or individual aspects or facets of jobs, such
as nature of work or supervision (Spector, 1997).
Hulin and Judge (2003) suggested that the concept
of job satisfaction was the multi-dimensional
psychological responses to one’s job in question.
One of the most popular definitions of job
satisfaction has been proposed by Locke (1976:1304).
According to this definition, job satisfaction as
“a pleasurable or positive emotional state resulting
from the appraisal of one’s job or job experiences”.
Feldman and Arnold (1983) argued that Job
satisfaction was the overall positive affect (or feelings)
that individuals have towards their jobs.
Kreitner and Kinicki (1995) described Job satisfaction
is an affective or emotional response toward
various facets of one’s job. This definition means job
satisfaction is not a unitary concept.
Davis and Newstrom (1989) explained Job satisfaction
is a set of favorable or unfavorable feelings with which
employees view their work.”
The study of job satisfaction is of great significance
for any organization, for several reasons. They are as
follows:
Ø Study on job satisfaction helps the management
in gathering information pertaining to job,
employee, work environment etc. This, in turn,
facilitates the decision-making process and
acts as a catalyst in changing or modifying
organizational policies, if needed.
Ø Survey on job satisfaction may be used as a
diagnostic instrument in identifying employees’
resistance towards organizational change. This
may be useful introducing the level of resistance,
with corrective measures.
Ø Again, job satisfaction survey strengthens the
process of communication between management
and employees, as employees get exposed
towards the management’s view and vision
towards organizational goals. .
Ø The study also helps in improving the attitudes
of employees towards the present role and
responsibilities and develops a sense of
belongingness and participation.
Ø It also helps in determining the training and
development needs of the both, employees and
the organization.
In the light of the above, one can arrive to the
point that, job satisfaction among employees is an
important aspect of achieving desired productivity
Page 11
2
Applied Research Series, 2017
target and remain sustainable. The present project
makes an attempt to investigate the concept of job
satisfaction among the employees in the automobile
industry, which is one of the key drivers that boosts
the economic growth of the country (http://
info.shine.com/industry/automobiles-auto-ancillar-
ies/3.html).
Section II : Review of literature
In this section, following aspects of job satisfaction
have been discussed:
A. Job satisfaction and employee performance
B. Models pertaining to job satisfaction
C. Factors that influence job satisfaction
D. Work-related aspects enhancing job satisfaction
E. Major global research findings on job satisfaction
F. Indian automobile industry
G. Major Research findings on job satisfaction in
Indian automobile sector
Each of the above sections are discussed below.
A. Job satisfaction and employee performance
1. Satisfaction and Productivity: Employee
productivity is higher in organizations with more
satisfied workers.
2. Satisfaction and Absenteeism: Satisfied
employees tend to be less absentees at work
3. Satisfaction and Turnover: Satisfied employees
are happier with the organization, and thus, tend
to quit less in number.
4. Satisfaction and Workplace Deviance:
Dissatisfied employees are more prone towards
deviant behavior at the workplace, such as,
substance abuse, stealing at work, undue
socializing and tardiness, and so on.
5. Satisfaction and Organization Citizenship
Behaviour (OCBs): Satisfied employees are more
willing to engage in behaviors that go beyond the
normal expectations of their job.
6. Satisfaction and Customer Satisfaction: Satisfied
workers provide better customer service, as they
are more friendly and responsive.
B. Models pertaining to job satisfaction
The most popular theories pertaining to job
satisfaction are stated below.
Affect theory
As stated earlier, Locke’s (1976) theory is among
the the most popular one in this context. According
to this theory, satisfaction may be determined as an
inconsistency between the expectation an employee
has in in a job vis –a –vis what he / she receives
from the job. This theory also emphasizes on the
significance of autonomy in making an employee
satisfied in his/ her job. More the employee values
autonomy, more he/she will be satisfied with greater
autonomy he/she is provided with.
Equity theory
This theory proposes how an individual perceives
fairness in regard to work relationships. The fairness
is perceived based on the ration between the amount
of input (things gained) from a relationship compared
to the output (things given). Then this ratio is
compared to the ratio of other individuals (within
and outside the organizations). This, in turn,
results into the same individuals’ perception as to
whether or not he / she has an equitable relationship.
According to this theory, an individual employee will
be distressed and dissatisfied, if his/her ration and the
same of others are not equitable (Adams, 1965).
Two-factor theory (Motivator-Hygiene factor theory)
This theory is a well-known theory, which attempts
to explain satisfaction and motivation in the
workplace. According to this theory, satisfaction and
dissatisfaction are driven by different factors. These
factors are called motivators and hygiene factors,
respectively. Motivators are the internal drives
that motivate individuals to attain personal and
organizational goals. Motivators encourage
employees to attain performance goals, and provide
job satisfaction. Examples of motivators include,
aspects, such as, achievement in work, recognition,
promotion opportunities. Hygiene factors are the
factors, which prevent dissatisfaction. Employees tend
to become dissatisfied, if the hygiene actors are not
present sufficiently at the work place. These factors
include external aspects, such pay, company policies,
supervisory practices, and other working conditions
(Herzberg et al, 1959).
Page 12
3
A study on employee job satisfaction with special
reference to the Indian automobile industry
Job characteristics theory
This model has been proposed by Hackman & Oldham
( 1980). This model is often referred as a framework
to investigate how particular job characteristics
influence outcomes of a job role, such as, job
satisfaction. This model discusses five core job
characteristics, which are influence an employee’s
attitudes and behaviors at work. They are as follows:
• Skill Variety: It explains the degree to which a
job involves various activities, which makes
employees to develop a variety of skills and
talents. This leads to more meaningfulness in jobs.
• Task Identity: It explains the degree to which a
job demands the employees to identify and
complete a task, with outcome from the goal-at-
tainment, in totality. Employees perceive more
meaningfulness in a job when they feel that they
are involved in the entire goal-attainment process,
rather than just being responsible for a part of
the work.
• Task Significance: It explains the degree to which
the job influences the immediate organization or
the external environment. Employees feel
a job more meaningful if it improves either
psychological or physical well-being of other
people.
• Autonomy: It explains the degree to which the
job provides the employee with independence,
freedom, and choice to execute a task. This leads
to more sense of pride and self-fulfillment among
the employees.
• Feedback: It explains the degree to which the
employees are aware about detailed information
about the effectiveness of their job performance.
Attainable and constructive information and
feedback help employees to value their job more.
C. Factors that influence job satisfaction
The factors which are responsible in influencing
job satisfaction, may be categorized into two:
(a) Environmental factors and (b) Individual factors.
They are as stated below.
(a) Environmental factors : There are several
environmental factors, which may influence job
satisfaction. They are as follows:
Ø Communication overload and under-load-
Communication over-load and communication
under-load may affect level of individual’s job
satisfaction. Individuals may experience
communication overload when too many
information or too complicated information are
shared in a short period of time. This may lead
to failure in processing the information and
inability to achieve the optimal utilization of such
information to complete a given task (Farace,
et al , 1977). On the contrary, individuals may
face communication under- load, when
insufficient information is provided with them.
This too may lead to sub-optimal performance.
In either case, the individual employee will
experience low level of job satisfaction.
Ø Superior-subordinate communication – The way
in which subordinates perceive a supervisor’s
behavior, can positively or negatively influence
job satisfaction. The aspects of behaviour
include aspects, such as, facial expression, eye
contact, vocal expression, and overall body
language (Burgoon et al, 1996). Interestingly,
the pattern and style of non-verbal
communication of the supervisors are
perceived as more crucial to their subordinates,
in deciding whether the communication is
favourable or otherwise. Employees experience
higher level of job satisfaction, if the supervisor
uses non-verbal immediacy, friendliness, and
open communication.
Ø Recognition – Employee recognition is a
significant organizational strategy, which acts as
a catalyst in enhancing level of job satisfaction.
More an employee gets recognition for his/her
achievement at work, more he/she will be
satisfied and motivated to perform. This, in turn,
lead to higher employee retention and better
management of talent pipeline.
(b) Individual factors: There are several individual
factors, which may influence job satisfaction.
They are as follows:
Ø Emotion – Moods and emotions are related
to overall job satisfaction. Frequency of
experiencing net positive emotion will be a
better predictor of overall job satisfaction
than will intensity of positive emotion when it is
experienced (Fisher, 2000). Interestingly, study
revealed that suppression of unpleasant emotions
leads to lower level of job satisfaction and the
magnification of pleasant emotions leads to
increased job satisfaction (Cote & Morgan, 2002).
Page 13
4
Applied Research Series, 2017
Ø Personality - There are two personality
factors, which have close relationship with job
satisfaction: alienation and locus of control.
Employees, with more internal locus of control
and are less alienated, experience higher job
satisfaction, job involvement and organizational
commitment (Bruk-Lee et al, 2009).
Ø Psychological well-being (PWB) - PWB is a
concept which explains the overall effectiveness
of an individual’s “psychological functioning” as
related to primary facades of an individual’s life:
work, family, community, etc (Wright &
Cropanzano, 2000). Studies revealed that it plays
a significant role in causing job satisfaction
(Baptiste, 2008; Robertson et al 2012).
D. Work-related aspects enhancing job
satisfaction
1. Policies of Compensation and Benefit: This is
the most important variable for employee
satisfaction. Compensation can be described as
the amount of reward that, a worker expects from
the job. Employees should be satisfied with
competitive salary packages and they should
be satisfied with it, while comparing their pay
packets with those of the outsiders, who are
working in the same industry. A sense of
satisfaction is felt by individual employees in
attaining fair, equitable, and, appropriate
reward. Following points may be delineated
under this category:
• Salaries or wages
• Bonus
• Incentives such as medical allowance, educational
allowance, HRA etc.
2. Job security: Job security is the assurance of
current employment provided by the
management. Employees with a high level of
job security perceive the workplace as more
safe and comfortable place to work. Certain
affected by a worker’s performance, success
of the business and the current economic
environment. Following points come under this
category:
• Facility of transfer
• Accessible / reasonable target
• Leaves
3. Working conditions: good and comfortable
working condition is a significant factor which
enhances job satisfaction. It provides a feeling of
safety, comfort and motivation. On the contrary,
poor working condition brings out a fear of
bad health in employees. The more comfortable
the working environment is more productive
will be the employees. Following these points
come under this category:
• Feeling safe and comfort in working environment
• Tools and equipment
• Working methods
• Security guards and parking facility
• Well ventilated with good light fans and
air- conditioning
• Neat and clean office place, rest area and
washrooms.
4. Relationship with superior authority: A good
working relationship with your supervisor is
essential since, at every stage, you need his or
her professional input, constructive criticism, and
general understanding. The following points
come under this category:
• Relationship with immediate supervisor
• Communication between employees and senior
management
• Treatment to employee.
5. Promotion and career development: Promotion
can be reciprocated as a significant achievement
in the work-life. It comes with future potential
of receiving more pay, responsibility, authority,
independence and status. The opportunity for
promotion determines the degree of satisfaction
to the employee. Some of the pointers in this
regard are as follows:
• Opportunity for promotion
• Equal opportunity to grow despite being male or
female
• Training programs
• Opportunity for use of skills and abilities.
Page 14
5
A study on employee job satisfaction with special
reference to the Indian automobile industry
6. Leadership styles: The satisfaction level in the
job can be determined by the leadership
style. Employee satisfaction is greatly enhanced
by democratic style of leadership. Democratic
leaders nurture relationship among the
employees. On the contrary, employees
working under authoritarian and dictatorial
leaders experience low level of employee
satisfaction. Following issues come under this
category:
• Prefer democratic style of leadership
• Friendship, respect and warmth relationship.
7. Work group: It is a natural desire for human
beings to interact with others. Therefore,
existence of group in organization is a common
observable fact. This characteristic results in the
formation of work group at the work place.
Isolated workers dislike their job. The work
groups make use of a remarkable influence on
the satisfaction of employees. Following points
come under this category:
• Relationship with the group members.
• Group dynamics
• Group cohesiveness
• Need for affiliation.
8. Other factors: There are some other important
factors, which may influence the level of
employee satisfaction in organization. They are
as follows (Sageer et al,2012):
• Group outgoing (feel like a part of family).
• Encouragement and feedback.
• Use of internet and other technology for doing
job.
E. Major global research findings on job
satisfaction
Following are some of the major findings on job
satisfaction at the work place, worldwide.
1. A study, conducted among nurses in Australia
(Savery, 1989) revealed that the job satisfaction
level of the nurses was influenced most by
interesting and challenging work. , Salary was
ranked as a very low satisfier.
2. Burke and MacDermid (1999) proposed six
variables of workaholic patterns: Workaholics,
Enthusiastic Workaholics, Work Enthusiastic,
Unengaged Workers, Relaxed Workers and
Disenchanted Workers. According to this study,
the job satisfaction level and career satisfaction
level was much more prevalent in Enthusiastic
Workaholics.
3. Researches also confirmed the role of
environmental design of an organization in job
satisfaction (Melvin, 1993).
4. A study, conducted by Singh & Jain (2013), argued
that employees’ job satisfaction had an impact
on their performance and retention.
5. Tietjen & Myers (1998), advocated that job
Satisfaction would be maximum when an
employee would be satisfied with the nature of
his/her work itself, and not the hygiene factors.
6. Oshagbemi (1997) found out that gender and rank
had direct impact on the level of job satisfaction
of University teachers in UK. Female academics
were found to be more satisfied in regard to pay,
promotion, physical conditions/working facilities,
than men.
7. Seniwoliba A.J. (2013) conducted a study on the
job satisfaction level of teachers in public senior
high school in Ghana. Interestingly, it was found
that extrinsic factors i.e. salary, incentives,
working conditions, and so on, help in achieving
job satisfaction effectively.
8. Toma•ev et al (2014) reported that the police
employees rated salary and security as the least
motivator. Management support, trust and
belongingness were rated as the key factors to
job satisfaction.
9. Austin (2007) also forwarded the similar
finding in Cyprus. According to this study,
“Self-fulfilment”, “Independence” and “Job
environment” are the key reasons to managers’
job satisfaction.
10. Hoffman and Ingram (1992) also suggested that
the concept of job satisfaction was related to
work, co-workers, promotion, pay, supervision
quality, and so on.
11. In a study on Lebanese banking non -managerial
staff, Zaki (2003) found out significant
relationship between job satisfaction and gender
in relation to pay and supervision. Female
Page 15
6
Applied Research Series, 2017
employees were found to be more satisfied with
the salary, whereas male employees were more
satisfied with the supervision.
12. Fairbrother and Warn (2003) argued that work
place dimensions, and resultant stress led to
reduced job satisfaction. Stress could be
experienced due to lack of power, role conflict
and role ambiguity.
13. In Ramayah’s (2011) study in Malaysia, it was
found that mentor played an important role in
learning always and it led to positive employee
outcomes. However, psychological mentoring
did not have a significant relationship with job
satisfaction.
14. Silverthrone (2008) reported that internal locus
of control led to higher level of job satisfaction
and performance.
15. Association between fringe benefits and job
satisfaction was studied by Artz (2010). It was
revealed that fringe benefits did not necessarily
lead to job satisfaction.
16. Mudor and Tookson (2011) aimed to examine
the association link between human resource
management practices and job satisfaction, and
resulting turnover. It was found out that, HRM
practices, such as supervision, training and
pay practices were negatively associated with job
satisfaction.
17. In the study in private and public Jordanian
companies, Al-Zoubi (2012) summarized that
salary was not a prime factor that influenced job
satisfaction. Salary might be of help in sustaining
job satisfaction in the short term. But, in the long
term, psycho-social variables, such as, the work
life quality, also needed to be considered.
In the light of the above, it can be said that,
organizations need to nurture both the extrinsic and
intrinsic factors, which are responsible for developing
and maintaining positive effect on the level of job
satisfaction among employees.
F. Indian automobile industry
The Indian automobile industry, which contributes
7.1 per cent of India’s Gross Domestic Product (GDP
is one of the largest in the world. In this industry, Two
Wheelers segment owns with 80 per cent market
share. India is a major auto exporter. Exports of
Passenger Vehicles and Commercial Vehicles (CV)
has been increased by 16.20 per cent and 4.99
per cent respectively, in April-March 2017, over
April-March 2016. Government and automobile
companies’ latest initiatives are expected to result into
marking India as a global leader in the two wheeler
and four wheeler market, by 2020. The industry has
recorded Foreign Direct Investment (FDI) of US$ 17.40
billion during the period April 2000 to June 2017
(https://www.ibef.org/industry/india-automobiles.
aspx).
The automobiles sector may be structured under
four different sectors. They are as follows (http://
info.shine.com/industry/automobi les-auto-
ancillaries/3.html):
Ø Two-wheelers: Mopeds, scooters, motorcycles
and electric two-wheelers
Ø Passenger Vehicles: Passenger cars, utility vehicles
and multi-purpose vehicles
Ø Commercial Vehicles: Light and medium-heavy
vehicles
Ø Three Wheelers: Passenger carriers and goods
carriers.
Trend in production and gross turnover
A total of 25,316,044 vehicles, including passenger
vehicles, commercial vehicles, three wheelers, two
wheelers and quadricycle, have been produced by this
industry, in April-March 2017, as against 24,016,599
in April-March 2016. Registration of vehicles grew 5.41
percent over the same period last year (http://
www.siamindia.com/statistics.aspx?mpgid=8&
pgidtrail=9).
The Gross Turnover of the Automobile
Manufacturers in India (In USD Million), for the
period between2009-2010 and 2014-2015 is shown
below (http:// www.siamindia.com/statistics.aspx?
mpgid= 8&pgidtrail=10):
Page 16
7
A study on employee job satisfaction with special
reference to the Indian automobile industry
The Automobile Production Trends from 2011-12 to 2016-17 is as follows (http://www.siamindia.com /
statistics.aspx? mpgid=8& pgidtrail=13)
Category 2011-12 2012-13 2013-14 2014-15 2015-16 2016-17
Passenger
Vehicles 31,46,069 32,31,058 30,87,973 32,21,419 34,65,045 37,91,540
Commercial
Vehicles 9,29,136 8,32,649 6,99,035 6,98,298 7,86,692 8,10,286
Three
Wheelers 8,79,289 8,39,748 8,30,108 9,49,019 9,34,104 7,83,149
Two Wheelers 1,54,27,532 1,57,44,156 1,68,83,049 1,84,89,311 1,88,30,227 1,99,29,485
Grand Total 2,03,82,026 2,06,47,611 2,15,00,165 2,33,58,047 2,40,16,068 2,53,14,460
Factors determining the growth
Following factors are responsible in determining the
growth of the industry
• Fuel economy and demand for greater fuel
efficiency are determining the purchase decision
• Affordability of middle-class Indian population is
increasing
• The Government technology modernization fund
is concentrating on establishing India as an
auto-manufacturing hub.
• Availability of skilled and cheap workers
• Women, youth, rural and luxury segments are
becoming enlarged.
(http://info.shine.com/industry/automobiles-
auto-ancillaries/3.html)
Along with the bright side, as mentioned above,
automobile industry is facing certain challenges. For
example, urban India is suffering from increased
pollution levels as a result of poorly maintained ad
old cars. To salvage the situation, The National Green
Tribunal has announced restrictions on old cars
remaining on roads. Also, an alarming increase in the
number of automobile accidents has been a matter
of high concern for road safety (https://
www.futurescape.in/csr-what-the-automotive-
industry-should-really-focus-on/). The automotive
industry is a major consumer of water for various
production processes. Producing a car may use over
39,000 gallons of water, and increasing water scarcity
is a major concern for the industry. Also, automobile
industry is under pressure to use more renewable
energy, in order to make the business more
sustainable. Waste management is a key concern for
the industry, as well. Auto manufacturing plants are
responsible for producing production waste, scrap,
end of life products. (https://www.futurescape.in/
csr-what-the-automotive-industry-should-really-
focus-on/).
G. Major research findings on job satisfaction
in Indian automobile sector
Swarnalatha and Sureshkrishna (2012) investigated
the management practices, such as, introducing
employee empowerment, teamwork, and employee
compensation, management leadership, for studying
employee job satisfaction among the employees
of automotive industries in India. The research,
which was conducted among 234 employees of
automotive industries in India, revealed that, there
was a significant relationship of job satisfaction with
employee empowerment, teamwork, employee
compensation and management leadership.
Another study on 315 samples, conducted by
Swarnalatha, C & Sureshkrishna, G (2013), revealed
how the role of employee engagement delivers
employee satisfaction in their job and how it
makes him committed to work for the welfare and
productivity of the organization.
Bhavani et. al (2015) have conducted a study at
Automotive Axles Ltd, to investigate to what extent,
the employees are engaged. The data was collected
by interviewing the respondents with the help of a
structured questionnaire. The study revealed that,
most of the respondents were motivated with reward
and recognition. Most of the respondents agreed that
employees are treated with respect and valued and
there is an honest two way communication with
motivated employees. Most of the respondents felt
Page 17
8
Applied Research Series, 2017
satisfied in the job and had a sense of personal
accomplishment.
In another study on 100 employees, working in
automotive industry in Assam, effort was made to
study relationships in between fair compensation
and job satisfaction, supervisor support and job
satisfaction, working environment and job satisfaction
and Job Security and job satisfaction (Neog & Barua,
2014). The result revealed that salary is the most
important factor for influencing job satisfaction of
employees. It was also found that the influence of
supervisor support, healthy working environment,
high job satisfaction level, proper work-life
balance, career opportunities and promotion,
proper training and development opportunities were
significant factors for determining employee’s
job satisfaction.
Section III : Objectives of the study
Based on the discussions in the earlier chapters, the
present study makes an attempt to investigate the
employee job satisfaction, with special reference to
Indian Automobile Industry. Based on the existing
literature, five factors are proposed to be responsible
for job satisfaction (given below).
The present study has the following objectives:
• To investigate whether the set of variables together
are expected to measure the latent factors.
• The investigate whether proposed model is close
to the actual model i.e. the hypothesized model is
a good fit, and supported by the collected sample.
• To investigate whether to measure job satisfaction,
all the factors (proposed in the model) need to be
considered.
• To investigate whether engagement at work is to
have the highest significance, while investigating
employee job satisfaction.
• To investigate whether work environment is
to have least significance, while investigating
employee job satisfaction.
Based on the above objectives, following hypotheses
have been framed:
Hypothesis 1a: There is a significant association
between the variables in explaining the respective
factors.
Hypothesis 2a: The proposed model is close to the
actual model i.e. the hypothesized model is a good
fit, and supported by the collected sample.
Hypothesis 3a: To investigate whether to measure job
satisfaction, all the factors (proposed in the model)
need to be considered.
Hypothesis 4a: Engagement at work is to have the
highest significance, while investigating employee job
satisfaction.
Hypothesis 5a: Work environment is to have least
significance, while investigating employee job
satisfaction.
factors Variables / aspects
Reward and recognition Recognition policy; Bonuses/incentives; Allowances;
Annual increment; Welfare and benefit; Current salary
Work environment
Rest room facility; Safety measures; Refreshment facility;
Office Rules & regulations; Parking spaces; Family-
friendly policies; Space for lunch and break; working
hours; Workload
Relationship with co-workers Co-workers' support; Relationship with co-workers; Trust
Relationship with boss
Treatment from boss; Relationship with boss; Boss's
support towards personal and work goals; Motivation
from boss; Support from boss
Engagement at work
Individual's role in decision making; Autonomy; Job role
& responsibilities; Recognition policy; Training &
development facilities; Career progression; Promotion
policy; Performance appraisal
Page 18
9
A study on employee job satisfaction with special
reference to the Indian automobile industry
Section IV : Methodology and
analysis of data
In this section, we present the methodology used to
achieve the objectives of the study.
Population, sampling design, data collection
The population for the study were the employees
working in Indian Automobile sector organizations,
manufacturing and selling two-wheelers, three-
wheelers, and for-wheelers, during period from
February 2017 to December 2017. For the current
study, non-probability sampling technique was
used. The entry-level and middle-level employees,
belonging to the Indian automobile sector, were
requested to participate in the survey, and based on
their acceptance, the responses were collected.
Data was collected from the many cities across
the country, such as, Delhi, Gurgaon, Lucknow,
Mumbai, Pune, Ahmedabad, Bhopal, Nagpur, Indore,
Chennai, Hyderabad, Mysore, Bangalore, Kolkata,
Jamshedpur, and Patna. Data collection methods
include administration of questionnaire, personal and
telephonic interviews.
Questionnaire and scaling of the variables
In order to achieve the objectives of the study, a
questionnaire was designed and the responses
collected. The variables (questions) considered in
the questionnaire are measured using a 5 point Likert
Scale, where 5 indicates strongly agree, 4 indicates
agree, 3 indicates neutral, 2 indicates disagree, and, 1
indicates strongly disagree. Note that, the numbers
mentioned here are the weights assigned, based on
the preferences given by the respondents.
Pilot study
A pilot study was conducted to test for the reliability
and also to check whether the respondents will be
comfortable in answering the questions. This was done
in two rounds. The first round was conducted with a
sample size of 109 and the second round with a sample
size of 51. The results of the same are presented
under data analysis section.
Testing the reliability of the questionnaire
In many studies, related to understanding the
perception of the individuals, it is a regular practice
to build a questionnaire containing the variables on
which responses are collected. Sometimes, a set of
variables together are expected to measure a latent
construct and in such cases it is important to have
internal consistency among the variables in
measuring the construct. The responses taken on the
variables are used to measure the internal consistency
and this is termed as reliability of the questionnaire.
To achieve this, it is a regular practice to use Cronbach
alpha proposed by Cronbach (1970) to measure
the degree of reliability of the questionnaire
considered in the current study. The following is
the given cut-off points for Cronbach alpha. One can
note that a value of alpha close to one is considered
to be excellent and a value less than 0.50 is not
desirable.
Cut-off points for Cronbach Alpha
Source: Wikipedia-retrieved on 25.10.2017
In the current study, we have used Cronbach alpha to
check for the consistency of the questionnaire in
measuring the job satisfaction.
Sample size determination
Based on the results of the pilot study, the final
sample size was estimated using the following
formula.
Where n is the sample size, α is the level of
significance σ is the standard deviation and B is the
degree of precision (Difference between the actual
and the estimated).
Description of the sample
Before getting into addressing the objectives of the
study, one has to describe the sample. For example,
number of male and female, age-wise distribution
etc. That is, describing the sample based on the
demographics and other factors, if any.
Page 19
10
Applied Research Series, 2017
Exploratory and Confirmatory Factor Analysis
The model is built in two stages. In the first stage, we
have used Exploratory Factor Analysis (EFA) to find the
latent factors, which are the resultants of observed
variable-grouping. Formation of factors is based on
the concept of correlation. That is, observed variables
that have high correlations with a factor will be listed
under that factor and the process is iteratively used
till all the factors are identified. Note that, the set of
variables together are expected to measure the latent
factors and also the factors are expected to contain
the essence of the set of variables. Finally, EFA gives a
variable-factor structure which can be used for model
building. The method is exploratory in nature because,
the researcher does not know the variable-factor
structure and the analysis gives the structure. To test
the model built, Confirmatory Factor Analysis (CFA) is
used. While EFA gives the factors to build the model,
CFA helps to test the model built.
Note that, EFA is used in the two rounds of the pilot
study and also in the final study. This is to ensure that
the variables proposed to measure the factors satisfy
the required cut-offs of the EFA and also have the
necessary consistency levels. Based on the results,
the final questionnaire will be designed.
Data analysis and model building
In this section we present the results of the data
analysis and also the model built.
Results of the pilot study
We first present the results of the first round of
pilot study, followed by the second round of the pilot
study.
Results of first round of the pilot study
A theoretical model has been proposed to measure
the employee perception on the job satisfaction in the
automobile sector. The proposed model consisted of
total five factors. Each factor was proposed to consist
of a number of variables. A questionnaire was
proposed to measure each of the factors.
The questionnaire was administered on 500
employees, working in the automobile sector. Total
109 responses were received, which were used for
the purpose of analysis. The pilot size study 500
was chosen, based on the population size and
researchers’ experience, and, also the effectiveness
of the statistical methods. Out of the 109 respondents,
35 were female employees, while 74 were the
male employees. 14 were from central, 23 from
eastern, 20 from northern, 40 from southern, and
the rest 12 from western part of the country. 12
respondents were in the age group of 18 to 22 years,
31 respondents in the age group of 23 to 27 years, 27
respondents were in the age group of 28 to 32 years,
22 were in the age group of 33 to 37 years and 17
respondents was in the age group of 38 years and
above. 13 respondents had less than 1 year of work
experience, 15 had 1 to 3 years of work experience,
32 had work experience between 3 to 6 years, 20
respondents had 6 to 8 years of experience, and, 29
respondents had more than 8 years of experience.
For 25 respondents, the tenure in the present
company was less than 1 year, 28 respondents had
experience of 1 to 3 years in the present company, 31
respondents had 3 to 6 years of experience, 9 had 6
to 8 years of experience and 16 respondents had more
than 8 years of experience in the present company.
14 respondents were at the entry level, 25 were at
the junior level, 45 were at the middle level, while
the rest 25 were at the senior level.
48 respondents were engaged in non-managerial
work, whereas, the rest 61 were engaged in
managerial work.
The data was analysed with Exploratory Data Analysis
(Table no 1 to 5). Analysis of the data revealed
that the sample supported the association between
the variables in explaining the respective factors
(value of KMO is .5 or more, in all the five factors).
Further, Bartlett test value (in all the five factors)
was less than .05. This proved the significance of the
correlation matrix. Also, in case of all the five factors,
communalities value is more than .5. Therefore,
the percentage of variance in each of the variables,
meets the required levels. In all the factors, the value
of total variance explained is more than 60% and value
of component loading is more than .5, for all the
factors (except item no 13, which is .481). For all the
five factors, Cronbach Alpha is more than .8, which
proves that correlation is high for all the variables for
the respective factors. In the light of the above, the
questionnaire has been retained, and used for the
final data collection. In the light of the above, it can
be concluded that, the sample is leading to the
significant consistency levels, in measuring the five
factors, using the proposed model.
Page 20
11
A study on employee job satisfaction with special
reference to the Indian automobile industry
Table 1 : Reward and recognition
Construct KMO Bartlett
test Communalities
Total
variance
explained
Component
loading
Reliability-
Cronbach
alpha
8 I am satisfied with
my current salary.
0.872 0.0001 0.733
68.054 0.856
0.905
9
I am satisfied with
the allowances
provided by the
company.
0.794 0.891
10
I am satisfied with
the annual increment
provided by my
company.
0.732 0.856
11
I am satisfied with
the recognition
policy practiced in
the company.
0.692 0.832
12
I am satisfied with
the bonuses or
incentives available
to me.
0.652 0.808
13
I am satisfied with
the employee
welfare and benefits
offered by the
company.
0.481 0.693
Source: From data analysis
Page 21
12
Applied Research Series, 2017
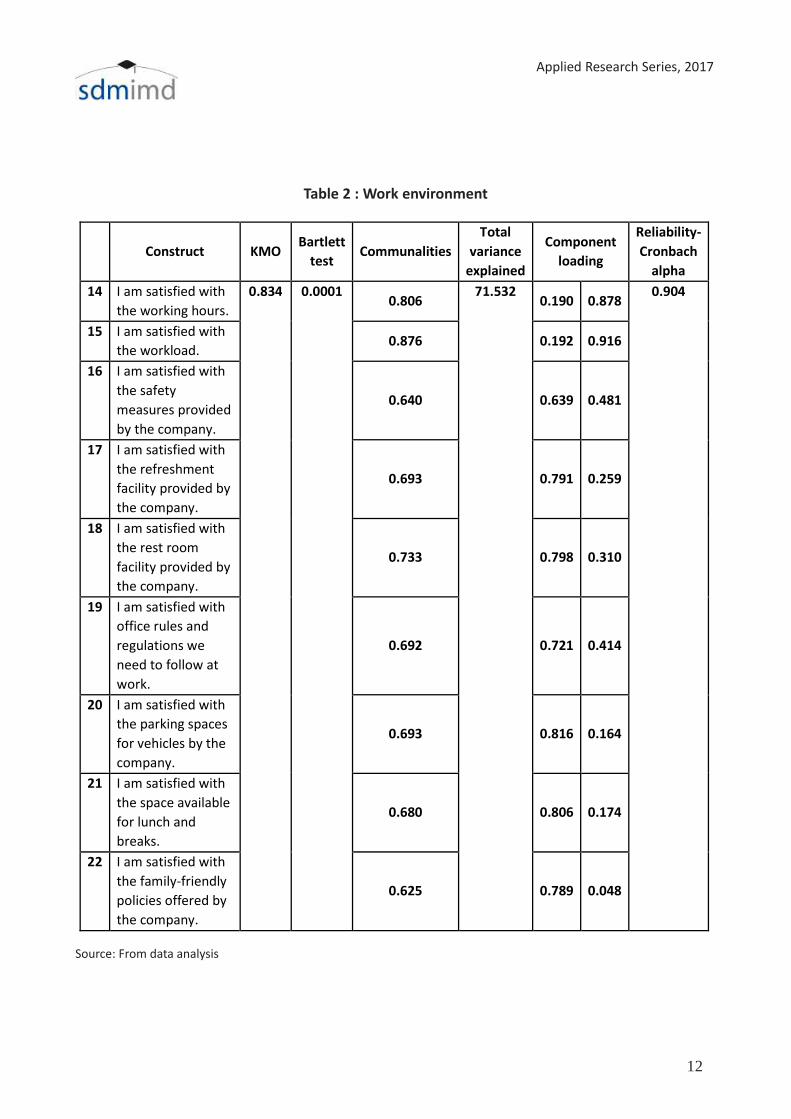
Table 2 : Work environment
Construct KMO Bartlett
test Communalities
Total
variance
explained
Component
loading
Reliability-
Cronbach
alpha
14 I am satisfied with
the working hours.
0.834 0.0001 0.806
71.532 0.190 0.878
0.904
15 I am satisfied with
the workload. 0.876 0.192 0.916
16 I am satisfied with
the safety
measures provided
by the company.
0.640 0.639 0.481
17 I am satisfied with
the refreshment
facility provided by
the company.
0.693 0.791 0.259
18 I am satisfied with
the rest room
facility provided by
the company.
0.733 0.798 0.310
19 I am satisfied with
office rules and
regulations we
need to follow at
work.
0.692 0.721 0.414
20 I am satisfied with
the parking spaces
for vehicles by the
company.
0.693 0.816 0.164
21 I am satisfied with
the space available
for lunch and
breaks.
0.680 0.806 0.174
22 I am satisfied with
the family-friendly
policies offered by
the company.
0.625 0.789 0.048
Source: From data analysis
Page 22
13
A study on employee job satisfaction with special
reference to the Indian automobile industry
Table 3: Relationship with co-workers
Source: From data analysis
Table 4: Relationship with boss
Construct KMO Bartlett
test
Communalities Total
variance
explained
Component
loading
Reliability-
Cronbach
alpha
23 I am satisfied with the
support I get from my
co-workers
0.744 0.0001 0.968 94.359 0.984 0.970
24 I am satisfied with the
working relationship I
have with my co-
workers.
0.944 0.972
25 I am satisfied with the
level of trust I have at
work.
0.919 0.959
Construct KMO Bartlett
test
Communalities Total
variance
explained
Component
loading
Reliability-
Cronbach
alpha
26 I am satisfied with the support
I get from my boss.
0.889 0.0001 0.838 83.241 0.915 0.959
27 I am satisfied with the working
relationship I have with my
boss.
0.857 0.926
28 I am satisfied with the way my
boss motivates me to achieve
the company goals.
0.887 0.942
29 I am satisfied with the way my
boss treats me.
0.846 0.920
30 I am satisfied with the way my
boss helps me to maintain
parity between my personal as
well as professional goals.
0.811 0.901
31 I am satisfied with the way my
boss sets realistic goals and
achievable targets.
0.755 0.869
Source: From data analysis
Page 23
14
Applied Research Series, 2017
Table 5 : Engagement at work
Source: From data analysis
Result of retest analysis
A questionnaire was proposed to measure each of the
factors. A theoretical model has been proposed to
measure those factors.
The questionnaire was administered on 100
employees, working in the retail sector. Total 50
responses were received, which were used for the
purpose of retest analysis. Out of the 50 respondents,
32 were female employees, while 18 were the male
employees. 9 respondents were in the age group of
18 to 22 years, 15 respondents in the age group of
23 to 27 years, 14 respondents were in the age group
of 28 to 32 years, 4 were in the age group of 33 to 37
years and only 8 respondents were in the age
group of 38 years and above. 8 respondents had less
than 1 year of work experience, 12 had 1 to 3 years of
work experience, 8 had work experience between 3
to 6 years, 4 respondents had 6 to 8 years of
experience, and, 18 respondents had more than 8
years of experience. For 15 respondents, the tenure
in the present company was less than 1 year, 16
respondents had experience of 1 to 3 years in the
present company, 10 respondents had 3 to 6 years of
experience, 5 had 6 to 8 years of experience and 4
respondents had more than 8 years of experience in
the present company. 8 respondents were at the
entry level, 10 were at the junior level, 13 were at
the middle level, while the rest 19 were at the
senior level. 23 respondents were engaged in
non-managerial work, whereas, the rest 27 were
engaged in managerial work.
The data has been analysed with Exploratory Data
Analysis (Table no 6 to 10). Analysis of the data
revealed that the sample supported the association
between the variables in explaining the respective
factors (value of KMO is .5 or more, in all the five
factors). Further, Bartlett test value (in all the five
factors) was less than .05. This proved the significance
of the correlation matrix. Also, in case of all the five
factors, communalities value is more than .5 (except
items 14, 15, 21, which have values very close to .5).
Therefore, the percentage of variance in each of the
variables, meets the required levels. In all the factors,
the value of total variance explained is more than 50%
and value of component loading is more than .5, for
all the factors. For all the five factors, Cronbach Alpha
is more than .8, which proves that correlation is high
for all the variables for the respective factors.
Construct KMO Bartlett
test Communalities
Total
variance
explained
Component
loading
Reliability-
Cronbach
alpha
32 I am satisfied with my job role
and responsibilities.
0.726 0.0001 0.727 72.834 0.842 0.132 0.877
33 I am satisfied with the
autonomy I have in my job
Excluded
34 I am satisfied with the way my
views are considered for work-
related decision-making.
0.717 0.773 0.344
35 I am satisfied with the
promotion policy
0.663 0.470 0.665
36 I am satisfied with the
performance appraisal system
of the company.
0.906 0.087 0.948
37 I am satisfied with career
progression in the company.
0.813 0.244 0.868
38 I am satisfied with the
company policy to recognize
employee’s potential to grow.
0.725 0.654 0.545
39 I am satisfied with the training
and development facilities
offered by the company.
0.548 0.730 0.120
Page 24
15
A study on employee job satisfaction with special
reference to the Indian automobile industry
Table 6: Reward and recognition
Source: From data analysis
Table 7: Work environment
Source: From data analysis
Construct KMO Bartlett
test Communalities
Total
variance
explained
Component
loading
Reliability-
Cronbach
alpha
8 I am satisfied with my current
salary.
0.856 0.0001 0.584 67.477 0.764 0.903
9 I am satisfied with the
allowances provided by the
company.
0.804 0.897
10 I am satisfied with the annual
increment provided by my
company.
0.773 0.879
11 I am satisfied with the
recognition policy practiced in
the company.
0.550 0.742
12 I am satisfied with the bonuses
or incentives available to me.
0.680 0.825
13 I am satisfied with the
employee welfare and benefits
offered by the company.
0.657 0.811
Construct KMO Bartlett
test Communalities
Total
variance
explained
Component
loading
Reliability-
Cronbach
alpha
14 I am satisfied with the working
hours.
0.858 0.0001 0.449 53.909 0.670 0.890
15 I am satisfied with the
workload.
0.448 0.669
16 I am satisfied with the safety
measures provided by the
company.
0.592 0.769
17 I am satisfied with the
refreshment facility provided
by the company.
0.700 0.837
18 I am satisfied with the rest
room facility provided by the
company.
0.575 0.758
19 I am satisfied with office rules
and regulations we need to
follow at work.
0.670 0.819
20 I am satisfied with the parking
spaces for vehicles by the
company.
0.453 0.673
21 I am satisfied with the space
available for lunch and breaks.
0.364 0.603
22 I am satisfied with the family-
friendly policies offered by the
company.
0.602 0.776
Page 25
16
Applied Research Series, 2017
Table 8: Relationship with co-workers
Source: From data analysis
Table 9: Relationship with boss
Construct KMO Bartlett
test Communalities
Total
variance
explained
Component
loading
Reliability-
Cronbach
alpha
23 I am satisfied with the support
I get from my co-workers
0.691 0.0001 0.763 72.360 0.873 0.809
24
I am satisfied with the working
relationship I have with my
co-workers.
0.636 0.798
25 I am satisfied with the level of
trust I have at work.
0.772 0.879
Construct KMO Bartlett
test Communalities
Total
variance
explained
Component
loading
Reliability-
Cronbach
alpha
26 I am satisfied with the
support I get from my boss.
0.920 0.0001 0.711 80.850 0.843 0.950
27 I am satisfied with the
working relationship I have
with my boss.
0.829 0.910
28 I am satisfied with the way
my boss motivates me to
achieve the company goals.
0.858 0.926
29 I am satisfied with the way
my boss treats me.
0.829 0.910
30 I am satisfied with the way
my boss helps me to
maintain parity between
my personal as well as
professional goals.
0.783 0.885
31 I am satisfied with the way
my boss sets realistic goals
and achievable targets.
0.841 0.917
Source: From data analysis
Page 26
17
A study on employee job satisfaction with special
reference to the Indian automobile industry
Table 10: Engagement at work
Source: From data analysis
Based on the above analysis, it can be concluded that,
the sample is leading to the significant consistency
levels, in measuring the five factors,using the proposed
model. Therefore, the original questionnaire was
retained, and used for the final data collection.
Final study
Sample size determination
Based on the pilot and retest results, we have
Construct KMO Bartlett
test Communalities
Total
variance
explained
Component
loading
Reliability-
Cronbach
alpha
32 I am satisfied with my job role
and responsibilities.
0.845 0.0001 0.561 71.577 0.749 0.943
33 I am satisfied with the
autonomy I have in my job
0.668 0.817
34 I am satisfied with the way my
views are considered for work-
related decision-making.
0.648 0.805
35 I am satisfied with the
promotion policy
0.823 0.907
36 I am satisfied with the
performance appraisal system
of the company.
0.771 0.878
37 I am satisfied with career
progression in the company.
0.782 0.884
38 I am satisfied with the
company policy to recognize
employee’s potential to grow.
0.776 0.881
39 I am satisfied with the training
and development facilities
offered by the company.
0.698 0.835
estimated the final sample. The final sample
was 100 with a degree of precision B=0.24 and a
sample standard deviation of 1.494316. The value
of B was fixed by the researcher based on the
experience and available resources. The sample
size 100 was the minimum sample size required to
conclude the results at the confidence level of
95% and this level is fixed throughout the study
(Table No. 11).
Page 27
18
Applied Research Series, 2017
Table 11 : Sample size determination
Source: From researcher’s data analysis
Final data collection
In order to complete the final survey, the
questionnaire was administered to 100 respondents
and 100 have responded.
Description of the sample
Note that, the questionnaire used in the pilot, retest
Mean Variance
Critical
value of Z B Sample
Q8 3.371069 1.298145 1.96 0.24 86.57906
Q9 3.363057 1.335293 1.96 0.24 89.05664
Q10 3.352201 1.267574 1.96 0.24 84.54016
Q11 3.462025 1.231033 1.96 0.24 82.10305
Q12 3.386076 1.372289 1.96 0.24 91.52405
Q13 3.373333 1.269083 1.96 0.24 84.64077
Q14 3.531646 1.129565 1.96 0.24 75.33574
Q15 3.525641 1.16708 1.96 0.24 77.83777
Q16 3.735849 1.069023 1.96 0.24 71.29791
Q17 3.575949 1.124768 1.96 0.24 75.01579
Q18 3.880503 0.91601 1.96 0.24 61.09277
Q19 3.798742 0.984555 1.96 0.24 65.66437
Q20 3.786164 1.080567 1.96 0.24 72.0678
Q21 3.415094 1.37091 1.96 0.24 91.43208
Q22 3.531646 1.256954 1.96 0.24 83.83185
Q23 3.525316 1.270056 1.96 0.24 84.70565
Q24 3.522013 1.225778 1.96 0.24 81.7526
Q25 3.402516 1.317968 1.96 0.24 87.90116
Q26 3.339623 1.402914 1.96 0.24 93.56656
Q27 3.5 1.092357 1.96 0.24 72.85412
Q28 3.442308 1.125682 1.96 0.24 75.07676
Q29 3.417722 1.276627 1.96 0.24 85.1439
Q30 3.322785 1.4047 1.96 0.24 93.68572
Q31 3.35443 1.249375 1.96 0.24 83.32638
Q32 3.515924 1.251347 1.96 0.24 83.45792
Q33 3.4 1.371429 1.96 0.24 91.46667
Q34 3.291139 1.494316 1.96 0.24 99.66257
Q35 3.062893 1.363108 1.96 0.24 90.91173
Q36 3.112583 1.433907 1.96 0.24 95.63365
Q37 3.178344 1.429528 1.96 0.24 95.34158
Q38 3.283019 1.280153 1.96 0.24 85.37908
Q39 3.553459 1.046175 1.96 0.24 69.77404
99.66257
& final study is same. Therefore, we combine all the
data collected in the above mentioned three phases.
Total put togather, the final sample size is 242. This
sample is considered for final analysis
In this section, we present the description of
the sample (Table No. 12 to 18 and Figure No.1 to 7).
Page 28
19
A study on employee job satisfaction with special
reference to the Indian automobile industry
Table 12 : Place of work (Region)
Figure 2 : Age
Table 14: Gender
1. Place of work (Region)
Frequency Percent Valid
Percent
Cumulative
Percent
0 1 .4 .4 .4
C 14 5.8 5.8 6.2
E 23 9.5 9.5 15.7
N 55 22.7 22.7 38.4
S 137 56.6 56.6 95.0
W 12 5.0 5.0 100.0
Total 242 100.0 100.0
Source: From Researcher’s data analysis
C=Central, E = Eastern, N = Northern, S = Southern,
W = Western, O = Other
Figure 1: Place of work (region)
2. My age
Frequency Percent Valid
Percent
Cumulative
Percent
99 3 1.2 1.2 1.2
A1 30 12.4 12.4 13.6
A2 68 28.1 28.1 41.7
A3 67 27.7 27.7 69.4
A4 45 18.6 18.6 88.0
A5 29 12.0 12.0 100.0
Total 242 100.0 100.0
3. Gender
Frequency Percent Valid
Percent
Cumulative
Percent
0 2 .8 .8 .8
9 8 3.3 3.3 4.1
F 95 39.3 39.3 43.4
M 137 56.6 56.6 100.0
Total 242 100.0 100.0
Figure 3 : Gender
Table 13: Age
A1 = 18-22 yrs, A2 = 23-27 Yrs, A3 = 28-32 Yrs, A4 = 33-37
Yrs, A5 = 38 Yrs and above, 99 = Missing value
F = Female, M = Male, O = Others, 9 = Missing value
Page 29
20
Applied Research Series, 2017
Table 15 : Years of experience
Figure 5: tenure in the present company
Table 17: Work level
4. My total years of experience
Frequency Percent Valid
Percent
Cumulative
Percent
99 8 3.3 3.3 3.3
E1 32 13.2 13.2 16.5
E2 50 20.7 20.7 37.2
E3 67 27.7 27.7 64.9
E4 36 14.9 14.9 79.8
E5 49 20.2 20.2 100.0
Total 242 100.0 100.0
Figure 4: years of experience
Table 16: tenure in the present company
5. My tenure in the present company
Frequency Percent Valid
Percent
Cumulative
Percent
99 7 2.9 2.9 2.9
T1 57 23.6 23.6 26.4
T2 71 29.3 29.3 55.8
T3 57 23.6 23.6 79.3
T4 24 9.9 9.9 89.3
T5 26 10.7 10.7 100.0
Total 242 100.0 100.0
E1 = Less than 1Yrs, E2 = 1-3 Yrs, E3 = 3 - 6 Yrs, E4 = 6-8 Yrs,
E5 = More than 8 Yrs, 99 = Missing value
T1 = Less than 1 Yr, T2 = 1-3 Yrs, T3 = 3-6 Yrs, T4 = 6-8 Yrs,
T5 = More than 8 Yrs, 99 = Missing value
Frequency Percent Valid
Percent
Cumulative
Percent
Va
lid
99 7 2.9 2.9 2.9
L1 34 14.0 14.0 16.9
L2 63 26.0 26.0 43.0
L3 84 34.7 34.7 77.7
L4 54 22.3 22.3 100.0
Total 242 100.0 100.0
L1 : Entry, L2 = Junior, L3 = Middle, L4 = Senior,
99 = Missing value
Figure 6: work level
Page 30
21
A study on employee job satisfaction with special
reference to the Indian automobile industry
Table 18 : Type of work
7. Type of work
Frequency Percent
Valid
Percent
Cumulative
Percent
0 2 .8 .8 .8
99 16 6.6 6.6 7.4
TW1 86 35.5 35.5 43.0
TW2 138 57.0 57.0 100.0
Total 242 100.0 100.0
Figure 7: Type of work
Testing the reliability of the final sample
The following Table no 19 gives the final consistency
check of the survey conducted on 100 employees.
Table 19 : Cronbach Alpha
Sl.
No.
Factor Number
of items
Cronbach
alpha value
1 Reward and
Recognition 6 0.951
2 Work
environment 9 0.938
3 Relationship
with Co-workers 3 0.919
4 Relationship
with boss 6 0.802
5 Engagement at
work 8 0.943
Source: From researcher’s data analysis
From the above table, one can note that the levels
of Cronbach alpha are high and we conclude that
the final questionnaire has the needed reliability
levels. Note that, the questionnaire used is not
changed and we combine the data points collected
in the first, second pilot studies and final study.
Total put together, the final sample size happens to
be 242. This is more than the estimated and hence
sufficient to conduct the analysis.
Exploratory Factor Analysis
The following tables gives the results of the EFA of the
combined sample (n = 242). The data was analysed
with Exploratory Data Analysis (Table no 20 to 24).
Analysis of the data revealed that the sample
supported the association between the variables in
explaining the respective factors (value of KMO is .5
or more, in all the five factors). Further, Bartlett test
value (in all the five factors) was less than .05. This
proved the significance of the correlation matrix. Also,
in case of all the five factors, communalities value is
more than .5. Therefore, the percentage of variance
in each of the variables, meets the required levels. In
all the factors, the value of total variance explained
is more than 60% and value of component loading
is more than .5, for all the factors. For all the five
factors, Cronbach Alpha is more than .8, which
proves that correlation is high for all the variables
for the respective factors. In the light of the above,
the questionnaire has been retained, and used for the
final data collection. In the light of the above, it
can be concluded that, the sample is leading to the
significant consistency levels, in measuring the five
factors, using the proposed model (Figure no 8). This
proves Hypothesis 1a.
Tw1 = Non-managerial, Tw2 = Managerial,
99 = Missing value
Page 31
22
Applied Research Series, 2017
Table 20: Reward and recognition
Construct KMO Bartlett
test Communalities
Total
variance
explained
Component
loading
Reliability-
Cronbach
alpha
8 I am satisfied with my current
salary.
0.897 0.0001 0.754 75% 0.868 0.935
9 I am satisfied with the
allowances provided by the
company.
0.842 0.917
10 I am satisfied with the annual
increment provided by my
company.
0.826 0.909
11 I am satisfied with the
recognition policy practiced in
the company.
0.732 0.856
12 I am satisfied with the bonuses
or incentives available to me.
0.740 0.860
13 I am satisfied with the
employee welfare and benefits
offered by the company.
0.636 0.797
Source: From data analysis
Table 21: Work environment
Construct KMO Bartlett
test Communalities
Total
variance
explained
Component
loading
Reliability-
Cronbach
alpha
14 I am satisfied with the working
hours.
0.908 0.0001 0.578 65% 0.760 0.932
15 I am satisfied with the workload. 0.567 0.753
16 I am satisfied with the safety
measures provided by the
company.
0.720 0.849
17 I am satisfied with the
refreshment facility provided by
the company.
0.698 0.836
18 I am satisfied with the rest room
facility provided by the
company.
0.732 0.855
19 I am satisfied with office rules
and regulations we need to
follow at work.
0.686 0.828
20 I am satisfied with the parking
spaces for vehicles by the
company.
0.630 0.794
21 I am satisfied with the space
available for lunch and breaks.
0.606 0.779
22 I am satisfied with the family-
friendly policies offered by the
company.
0.618 0.786
Source: From data analysis
Page 32
23
A study on employee job satisfaction with special
reference to the Indian automobile industry
Table 22 : Relationship with co-workers
Construct KMO Bartlett
test Communalities
Total
variance
explained
Component
loading
Reliability-
Cronbach
alpha
23 I am satisfied with the support I
get from my co-workers
0.759 0.0001 0.879 86% 0.938 0.920
24 I am satisfied with the working
relationship I have with my co-
workers.
0.865 0.930
25 I am satisfied with the level of
trust I have at work.
0.845 0.919
Source: From data analysis
Table 23 : Relationship with boss
Source: From data analysis
Construct KMO Bartlett
test Communalities
Total
variance
explained
Component
loading
Reliability-
Cronbach
alpha
26 I am satisfied with the
support I get from my boss.
0.916 0.0001 0.781 80% 0.884 0.949
27 I am satisfied with the
working relationship I have
with my boss.
0.825 0.908
28 I am satisfied with the way
my boss motivates me to
achieve the company goals.
0.822 0.907
29 I am satisfied with the way
my boss treats me.
0.806 0.898
30 I am satisfied with the way
my boss helps me to maintain
parity between my personal
as well as professional goals.
0.803 0.896
31 I am satisfied with the way
my boss sets realistic goals
and achievable targets.
0.749 0.865
Page 33
24
Applied Research Series, 2017
Table 24: Engagement at work
Construct KMO Bartlett
test Communalities
Total
variance
explained
Component
loading
Reliability-
Cronbach
alpha
32 I am satisfied with
my job role and
responsibilities.
0.903 0.0001 0.598 67% 0.774 0.930
33 I am satisfied with
the autonomy I have
in my job
0.699 0.836
34 I am satisfied with
the way my views
are considered for
work-related
decision-making.
0.664 0.815
35 I am satisfied with
the promotion
policy
0.673 0.820
36 I am satisfied with
the performance
appraisal system of
the company.
0.660 0.812
37 I am satisfied with
career progression
in the company.
0.696 0.834
38 I am satisfied with
the company policy
to recognize
employee’s
potential to grow.
0.745 0.863
39 I am satisfied with
the training and
development
facilities offered by
the company.
0.640 0.800
Source: From data analysis
Based on the above analysis, we have constructed
a model to measure the opinion of the employees
towards the job satisfaction. Note that, the study
aims at measuring the perception of the
employees on the job satisfaction and the same is
measured using factors related to job satisfaction.
The model below is constructed using the same
factors.
Page 34
25
A study on employee job satisfaction with special
reference to the Indian automobile industry
Figure 8: Initial modelSource: From researcher’s data analysis
Q8 = Current salary Q9 = Allowances Q10 = Annual increment Q11=Recognition policy
Q12 = Bonuses / incentives Q13 = Welfare & benefits Q14 =Working hours Q15 = Workload
Q16 = Safety measures Q17= Refreshment facility Q18 =Rest room facility Q19=Office rules &
regulations
Q20=Parking spaces Q21=Space for
lunch&break
Q22 = Family-friendly
policies Q23 =Co-workers’ support
Q24=Relationship with
co-workers Q25 = Trust Q26 = Support from boss
Q27 = Relationship with
boss
Q28 =Motivation from boss Q29= Treatment from
boss
Q30 = Boss’s support
towards personal & work
goals
Q31 = goal-setting by boss
Q32 = Job roles and
responsibilities Q33 = Autonomy
Q34 = Individual’s role in
decision-making Q35 = Promotion policy
Q36 = Performance appraisal Q37 = Career progression Q38 = Recognition policy Q39 = Training &
development facilities
Page 35
26
Applied Research Series, 2017
Confirmatory Factor Analysis
To test the above model built, we have used
Confirmatory Factor Analysis (CFA). In order to
finalize the model, one has to look at certain indices
and the following discussion is on the same.
Model fit indices and explanation
In order to identify the model, we look at the
model fit indices. Theoretically it was proven that
these indices have to meet certain cut-off values. The
following gives the discussion related to the same.
Table 25: CMIN
the values of GFI and AGFI (see Hu and Bentler
(1995) indicate that the model is a good fit. This proves
Hypothesis 2a.
Table 27: Baseline comparisons
Source: From researcher’s data analysis
The first of the fit statistics that one has to look at is
the CMIN/DF. This gives an indication of whether the
fit of the data to the proposed model is good or
not-good. The hypothesis tested here is “The proposed
model is close to the actual model” and the values
of CMIN/DF are looked at to test his hypothesis.
Values between 2 and 3 indicates that the fit is a
good fit (refer to Ullman, 2001, Schumacker &
Lomax, 2004). From the table no 25, one can note that
the value (1.232) is less than 2 and we conclude that
the fit is a good fit. This indicates that the covariance
structure proposed is supported by the sample
drawn. We now look at other model fit indices to
evaluate the model.
Table 26: RMR, GFI
Model RMR GFI AGFI PGFI
Default model .066 .900 .864 .664
Saturated model .000 1.000
Independence model .796 .103 .044 .097
Model NPAR CMIN DF P CMIN/DF
Default model 130 451.081 366 .002 1.232
Saturated
model 496 .000 0
Independence
model 31 7563.879 465 .000 16.266
Source: From researcher’s data analysis
The above table no 26 gives the indices, Root mean
square residual (RMR), Goodness-of fit index (GFI) and
Adjusted Goodness-of-fit index (AGFI). A value of RMR
close to zero is considered to be a good fit (Hu and
Bentler (1999)) and for the current model the value
of 0.066 indicates that the model is a good fit. Also,
Model NFI
Delta1
RFI
rho1
IFI
Delta2
TLI
rho2 CFI
Default model .940 .924 .988 .985 .988
Saturated
model 1.000
1.000
1.000
Independence
model .000 .000 .000 .000 .000
Source: From researcher’s data analysis
The next set of indices that one has to look at are
comparative fit index (CFI), proposed by Bentler (1990)
and Tucker-Lewis index (TLI), proposed by Tucker and
Lewis (1973). In both the cases, a value close to 1 is
considered as a good fit. From the above table no 27,
one can note that the values for the model fit are close
to the required cut-off and hence we conclude that
the model is a good fit.
Table 28: RMSEA
Source: From researcher’s data analysis
Root mean square error of approximation (RMSEA)
was proposed by Steiger and Lind (1980) and a value
of 0.031 (see, Hu and Bentler (1999), Browne and
Cudeck (1993)) indicates a good fit between the
hypothesized model and the observed data. In
addition to this, the PCLOSE value as suggested by
Jöreskog and Sörbom (1996a) has to be >0.50, for a
model to be a good fit. For the proposed model,
from table no 28, one can see that the RMSEA value is
0.031 and the PCLOSE value is 1. These values
indicate that the model is a good fit. Based on the
above indices, the final model (figure no 9) was
built and the following figure gives the same.
Note that, only variable-31 is excluded because of its
insignificance.
Model RMSEA LO 90 HI 90 PCLOSE
Default model .031 .020 .040 1.000
Independence
model .252 .247 .257 .000
Page 36
27
A study on employee job satisfaction with special
reference to the Indian automobile industry
Figure 9: Final model
Source: From researcher’s data analysis
Q8 = Current salary Q9 = Allowances Q10 = Annual
increment
Q11=Recognition policy
Q12 = Bonuses /
incentives
Q13 = Welfare &
benefits
Q14 =Working hours Q15 = Workload
Q16 = Safety measures Q17= Refreshment
facility
Q18 =Rest room
facility
Q19=Office rules &
regulations
Q20=Parking spaces Q21=Space for lunch
& break
Q22 = Family-friendly
policies
Q23 =Co-workers’
support
Q24=Relationship with
co-workers
Q25 = Trust Q26 = Support from
boss
Q27 = Relationship with
boss
Q28 =Motivation from
boss
Q29= Treatment
from boss
Q30 = Boss’s support
towards personal &
work goals
Q31 = goal-setting by
boss
Q32 = Job roles and
responsibilities
Q33 = Autonomy Q34 = Individual’s role
in decision-making
Q35 = Promotion policy
Q36 = Performance
appraisal
Q37 = Career
progression
Q38 = Recognition
policy
Q39 = Training &
development facilities
Page 37
28
Applied Research Series, 2017
Significance of regression paths and the
standardized regression weights
Based on the above analysis, we conclude that
the model built is a good fit and also that the model
built will give one an opportunity to understand the
factors associated with job satisfaction. One can note
that, each directed line into either the variables or the
sub-components are the regression paths and testing
for their significance will give one the right paths.
These paths will help one to focus on the significant
variables with respect to the sub-components and
the significant sub-components with respect to the
satisfaction. The following tables give the same.
The table no 29 below reveals that, to measure
whether the employees are satisfied with their job,
an organization has to check whether he employees
are satisfied with all the factors, such as, ‘engagement
at work’, ‘relationship with boss’, ‘relationship with
co-workers’, ‘reward and recognition’, and, ‘work
environment’. From the above table, we note that,
each of the paths proposed are highly significant. Here,
paths indicate the link between job satisfaction and
all other factor associated with job satisfaction. Since
all the paths are significant, we can conclude that, an
organization that wishes to measure their employees’
job satisfaction, has to consider all the factors,
proposed in the model. This proves Hypothesis 3a.
Similarly, an organization, to check their employees
are satisfied with respect to each of the factors,
has to check whether they are happy with each of
the observed aspects under these factors, in the
following manner:
• To check whether the employees are satisfied
with reward and recognition, the organization
has to check whether they are happy with
Recognition policy, Bonuses/incentives,
Allowances, Annual increment, Welfare and
benefit, Current salary.
• To check whether the employees are satisfied with
relationship it boss, the organization has to check
whether they are happy with Treatment from
boss, Relationship with boss, Boss’s support
towards personal and work goals, Motivation
from boss, Support from boss.
• To check whether the employees are satisfied
with relationship with co-workers, the
organization has to check whether they are happy
with Co-workers’ support, Relationship with
co-workers, Trust.
• To check whether the employees are satisfied
with engagement at work, the organization has to
check whether they are happy with Individual’s
role in decision making, Autonomy, Job role &
responsibilities, Recognition policy, Training & de-
velopment facilities, Career progression,
Promotion policy, Performance appraisal.
• To check whether the employees are satisfied with
work environment, the organization has to check
whether they are happy with Rest room facility,
Safety measures, Refreshment facility, Office Rules
& regulations, Parking spaces, Family-friendly
policies, Space for lunch and break, Working hours,
Workload.
Page 38
29
A study on employee job satisfaction with special
reference to the Indian automobile industry
Source: From researcher’s data analysis
Table 29: Regression weights: (Group number 1 - default model)
Estimate S.E. C.R. P Label
Engagement at_Work <--- Job Satisfaction 1.305 .133 9.845 ***
Relationship with_ Boss <--- Job Satisfaction 1.418 .138 10.277 ***
Relationship with_Co-workers <--- Job Satisfaction 1.399 .135 10.391 ***
Reward &_Recognition <--- Job Satisfaction .897 .097 9.267 ***
Work_Environment <--- Job Satisfaction 1.000
Q13 <--- Reward &_Recognition 1.000
Q12 <--- Reward &_Recognition 1.131 .074 15.209 ***
Q11 <--- Reward &_Recognition 1.079 .071 15.116 ***
Q10 <--- Reward &_Recognition 1.082 .076 14.222 ***
Q9 <--- Reward &_Recognition 1.137 .078 14.571 ***
Q8 <--- Reward &_Recognition 1.004 .080 12.557 ***
Q22 <--- Work_Environment 1.000
Q21 <--- Work_Environment .973 .073 13.346 ***
Q20 <--- Work_Environment 1.012 .071 14.239 ***
Q19 <--- Work_Environment 1.036 .079 13.109 ***
Q18 <--- Work_Environment 1.100 .078 14.086 ***
Q17 <--- Work_Environment 1.078 .081 13.269 ***
Q16 <--- Work_Environment 1.087 .081 13.370 ***
Q15 <--- Work_Environment .869 .082 10.624 ***
Q14 <--- Work_Environment .912 .086 10.582 ***
Q23 <--- Relationship with_Co-workers 1.000
Q24 <--- Relationship with_Co-workers .929 .044 21.084 ***
Q25 <--- Relationship with_Co-workers .927 .045 20.467 ***
Q26 <--- Relationship with_ Boss 1.000
Q27 <--- Relationship with_ Boss 1.002 .052 19.397 ***
Q28 <--- Relationship with_ Boss .985 .053 18.742 ***
Q29 <--- Relationship with_ Boss 1.051 .054 19.510 ***
Q30 <--- Relationship with_ Boss 1.037 .055 18.964 ***
Q32 <--- Engagement at_Work 1.000
Q33 <--- Engagement at_Work 1.039 .064 16.338 ***
Q34 <--- Engagement at_Work 1.073 .069 15.608 ***
Q35 <--- Engagement at_Work .928 .081 11.459 ***
Q36 <--- Engagement at_Work .934 .081 11.488 ***
Q37 <--- Engagement at_Work .956 .081 11.775 ***
Q38 <--- Engagement at_Work 1.012 .079 12.765 ***
Q39 <--- Engagement at_Work .968 .077 12.556 ***
Page 39
30
Applied Research Series, 2017
In order to rank the factors, based on the analysis,
the following table no 30 can be used. One can
note that, ‘engagement at work’ has to be given
top priority, followed by ‘relationship with boss’,
‘relationship with co-workers’, ‘reward and
recognition’, and ‘work environment’, respectively.
This proves Hypothesis 4a and 5a.
Similarly, we can look at the table below to identify
the ranking order of the observed aspects, which need
to be considered under each of the five factors. It is
shown below.
Engagement at work: aspects in the sequence of
descending order -
1. Individual’s role in decision making
2. Autonomy
3. Job role & responsibilities
4. Recognition policy
5. Training & development facilities
6. Career progression
7. Promotion policy
8. Performance appraisal
‘Relationship with boss’: aspects in the sequence of
descending order-
1. Treatment from boss
2. Relationship with boss
3. Boss’s support towards personal and work goals
4. Motivation from boss
5. Support from boss
‘Relationship with co-workers’: aspects in the
sequence of descending order-
1. Co-workers’ support
2. Relationship with co-workers
3. Trust
‘Reward and recognition’: aspects in the sequence of
descending order-
1. Recognition policy
2. Bonuses/incentives
3. Allowances
4. Annual increment
5. Welfare and benefit
6. Current salary
‘Work environment’: aspects in the sequence of
descending order-
1. Rest room facility
2. Safety measures
3. Refreshment facility
4. Office Rules & regulations
5. Parking spaces
6. Family-friendly policies
7. Space for lunch and break
8. Working hours
9. Workload
Page 40
31
A study on employee job satisfaction with special
reference to the Indian automobile industry
Table 30: Standardized regression weights: (Group number 1 - default model)
Estimate
Engagement at_Work <--- Job Satisfaction .981
Relationship with_ Boss <--- Job Satisfaction .918
Relationship with_Co-workers <--- Job Satisfaction .883
Reward &_Recognition <--- Job Satisfaction .675
Work_Environment <--- Job Satisfaction .758
Q13 <--- Reward &_Recognition .777
Q12 <--- Reward &_Recognition .857
Q11 <--- Reward &_Recognition .859
Q10 <--- Reward &_Recognition .824
Q9 <--- Reward &_Recognition .835
Q8 <--- Reward &_Recognition .748
Q22 <--- Work_Environment .759
Q21 <--- Work_Environment .705
Q20 <--- Work_Environment .760
Q19 <--- Work_Environment .799
Q18 <--- Work_Environment .852
Q17 <--- Work_Environment .809
Q16 <--- Work_Environment .817
Q15 <--- Work_Environment .670
Q14 <--- Work_Environment .702
Q23 <--- Relationship with_Co-workers .920
Q24 <--- Relationship with_Co-workers .881
Q25 <--- Relationship with_Co-workers .864
Q26 <--- Relationship with_ Boss .858
Q27 <--- Relationship with_ Boss .893
Q28 <--- Relationship with_ Boss .877
Q29 <--- Relationship with_ Boss .896
Q30 <--- Relationship with_ Boss .885
Q32 <--- Engagement at_Work .776
Q33 <--- Engagement at_Work .796
Q34 <--- Engagement at_Work .804
Q35 <--- Engagement at_Work .702
Q36 <--- Engagement at_Work .699
Q37 <--- Engagement at_Work .714
Q38 <--- Engagement at_Work .767
Q39 <--- Engagement at_Work .757
Source: From researcher’s data analysis
Page 41
32
Applied Research Series, 2017
Section V : Discussion
As discussed earlier, organizations need to nurture
both the extrinsic and intrinsic factors, which are
responsible for developing and maintaining
positive effect on the level of job satisfaction among
employees. Considering this, for the present study,
a theoretical model has been proposed to measure
the employee perception on the job satisfaction in
the automobile sector. The proposed model consisted
of total five factors and each factor was proposed to
consist of a number of variables. The factors explained
both internal and external work-related issues. The
factors are as follows:
• Engagement at work
• Relationship with boss
• Relationship with co-workers
• Reward and recognition
• Work environment
A questionnaire was prepared and administered on
the entry-level and middle-level employees working
in the Indian automobile industry. Based on the
exploratory factor analysis of the data, collected
at three different phases by administering the
questionnaire, it was revealed that the variables
significantly explained the respective factors. Also,
there significant consistency levels in measuring the
five factors, in measuring the construct. This proved
the reliability of the questionnaire.
In the light of the above, it can be concluded that,
the sample is leading to the significant consistency
levels, in measuring the five factors, using the
proposed model. Also, based on the confirmatory
factor analysis, it can be said that, proposed model is
close to the actual model i.e. the hypothesized model
is a good fit, and supported by the collected sample.
Therefore, based on the above analysis, we conclude
that the model built is a good fit and also that the
model built will give one an opportunity to understand
the factors associated with job satisfaction.
The analysis indicates that, the proposed model of job
satisfaction is reliable, consistent, and good fit
to measure job satisfaction. This also proves that, as
supported by the existing literature, entry-level
and middle-level employees, working in the Indian
automobile industry, considered both the internal
and external factors responsible for their job
satisfaction.
The analysis of regression paths and standardized
regression weights also revealed that, to measure
whether the employees are satisfied with their
job, the organization has to check whether the
employees are satisfied with all the factors, proposed
in the model. Therefore, an organization can use
the above model and questionnaire to measure and
investigate the perception among the employees’
about the job satisfaction. To investigate whether to
measure job satisfaction, all the factors (proposed in
the model) need to be considered.
Based on the analysis, one could note that, though all
the five factors were significant to investigate job
satisfaction, ‘engagement at work’ had to be given top
priority, in order to investigate job satisfaction in
the Indian automobile industry. This supported the
findings of the existing literature, which proposed
that, the internal factors associated with the job itself
led to higher job satisfaction. ‘Engagement at work’
represents the significance of the value of the job an
employee perceives and, resultantly, feels highly
satisfied by associating him/herself with the same job.
Further, in the above context, ‘work environment’ was
identified as having the least priority in investigating
job satisfaction. This also supported the finding
from the major studies, conducted earlier. Work
environment is a hygiene factor and helps in
preventing dissatisfaction. However, the role of the
work environment in enhancing job satisfaction is
arguable and the present study supported this view.
‘Relationship with boss’, ‘relationship with
co-workers’ and ‘reward and recognition’ were
identified to be of second, third and fourth priority,
respectively. Here, relationship is more psycho-social
aspects of work place. And, the data analysis
supported that the employees valued these two
factors more than work environment (mostly
maintenance factors). Also, reward and recognition,
though in short-term, helps employees to feel
satisfied. Therefore, this factor was given more
priorities over work environment.
Data analysis further revealed that, under each
factor, the observed aspects might be ranked.
For ‘engagement at work’, the higher priority was
assigned to ‘ individual’s role in decision-making’,
‘autonomy’ and ‘job-role & responsibilities’. All the
three aspects are connected with the internal aspects
of the job itself, and employees perceived them as
more significant in making them satisfied with the
job. The aspects related mostly with the organization’s
Page 42
33
A study on employee job satisfaction with special
reference to the Indian automobile industry
policies and strategies, such as, recognition politicizes,
training & development facilities, career progression,
promotion policy, and, performance appraisal, were
ranked low, in order to investigate job satisfaction.
‘Treatment from boss’ was ranked highest under
the factor ‘relationship with boss’. This proved that,
employees valued the communication style, pattern
and behavioral pattern more than the support from
the boss (lowest ranked aspect).
However, interestingly, in the case of factor
‘Relationship with co-workers’, aspect, such as,
Co-workers’ support was ranked highest by the
respondents. Aspect, such as, ‘trust’ was perceived
as the lowest ranked aspect, which perhaps indicated
that employees did not assign significant value
towards the trustworthiness among peers as a factor
for job satisfaction.
‘Current salary’ was of the least rank among all
the aspects for the factor Reward and recognition’.
Recognition policy was ranked the top and it indicated
that employees assign more value towards the
recognition more that the salary, per say.
In the context of the factor ‘work environment’,
rest room facility, safety measures, and refreshment
facility were given top priority. This might be true due
to the lack of day-to-day hygiene factor, lack of which
led to dissatisfaction among the employees. On the
other hand, working hours and workload were given
factors for the employees, and thus, were perhaps
considered as not too relevant in making employees
satisfied.
In addition to the above data, the researchers
also gathered information based on personal and
telephonic interviews conducted with regard to
the study. A few significant pointers demonstrated
that certain factors were perceived as salient by
respondents with regard to job satisfaction:
1. Clarity and preciseness in communication pattern:
Keeping the employees informed on various issues
like mission, vision, change initiatives and policy
changes is a must. This helps in building trust and
develops an open-culture organization, which con-
tributes to employees becoming better engaged
in job, resulting in greater job satisfaction.
2. Creating a team-culture by making an effort to
know employees: Putting the right person in
the right job from the point of recruitment
and building trust and providing challenges to
employees helps them to contribute significantly
in organizations. Additionally, the employees
must be groomed into working comfortably in
team-based organizational culture to foster trust
and joint commitment in them through synergy
to achieve organizational goals, which could
provide the strategic business advantage to the
firm vis-a-vis their competitors.
3. Training and improvement programs: Regular
investment in people through training and
development initiatives will augment the
employees’ skills, knowledge and competencies.
This would help them to take on greater challenges
in the organization as process-owners with
more confidence, which would be beneficial to the
organization.
4. Fostering employee empowerment across
organizational hierarchy: Decentralizing
decision-making process down the line in the
organizations makes employees more responsible
and accountable. This helps them to dispense off
their jobs in a quick and efficient manner thereby
increasing the speed of delivering results across
various organizational levels.
5. Enriching jobs: Providing Job rotations through job
enrichment and enlargement helps in building
cross-functional abilities among employees
thereby helping them to take on challenges in the
jobs in a multi-tasking environment.
6. Adequate and fair compensation and reward
systems: Helps in retaining talent by motivating
them and creating a sense of satisfaction at the
workplace among employees across the firm.
7. Avenues and scope for career-advancement:
Through proper performance management,
the most talented employees can be tracked
and provided avenues for fast track promotions
and opportunities for career advancement
which would help in talent retention and aid the
succession –planning process in the organizations.
8. Provision for regular and honest feedback;
Regular and constructive feedback helps
employees in raising their bar of performance, and
helps to promote loyalty, and creates an
open-culture of trust, among employees.
9. Provision for safe working conditions: by proper
and timely investments in tools and equipments,
safety can be ensured in the workplaces which
instils confidence in people and motivates
Page 43
34
Applied Research Series, 2017
them. Safe working conditions lessens stress
among employees and enhances their levels of
performance. It demonstrates the positive ethics
for employee safety as a sign of a caring culture
within organizations and boosts the morale of the
employees.
Section VI : Scope for further
research
From the present study, it can be said that,
organizations need to nurture both the extrinsic and
intrinsic factors, which are responsible for developing
and maintaining positive effect on the level of job
satisfaction among employees. The factors explained
both internal and external work-related issues:
Engagement at work, Relationship with boss,
Relationship with co-workers, Reward and recognition,
Work environment. Based on the analysis, one could
note that, though all the five factors were significant
to investigate job satisfaction, ‘engagement at work’
had to be given top priority, in order to investigate job
satisfaction in the Indian automobile industry. Further
‘work environment’ was identified of having the least
priority in investigating job satisfaction. ‘Relationship
with boss’, ‘relationship with co-workers’ and ‘reward
and recognition’ were identified to be of second,
third and fourth priority, respectively. It needs to be
considered that, the data was collected from the
employees at the entry-level and middle-level
positions, from the Automobile Industry.
Keeping this in mind, the above findings may be
further validated with the responses from the top
management employees, to investigate whether
there is a gap in the perception about job
satisfaction, across the organizational hierarchical
levels. Also, further investigation may be carried to
test whether the perception about job satisfaction is
significantly consistent across the industries, keeping
the role-demand, working conditions, and, nature of
the job, in mind.
Further, one may further investigate whether
demographic factors, such as age, gender and so
on, have any significant role in job satisfaction, in the
Indian Automobile and other industries.
Section VII : References
Adams, J. S. (1965). Inequity in social exchange. In L.
Berkowitz (Ed.), Advances in experimental social
psychology (pp. 276-299). New York: Academic
Press.
Al-Zoubi, M.T. (2012). The shape of the relations hip
between salary and job satisfaction: A field study.
Far East Journal of Psychology and Business ,
7(3),1-12
Artz, B. (2010). Fringe benefits and job satisfaction.
International Journal of Management ,31(6),626-
644
Austin, A. D. J. (2007). Job satisfaction of managers in
Cyprus, EuroMed Journal of Business,2(2),208 –
222
Baptiste, N. R. (2008). “Tightening the link between
employee wellbeing at work and performance: A
new dimension for HRM”. Management Decision.
46 (2): 284–309.
Bentler, P.M. (1990). Comparative fit indexes in struc-
tural models. Psychological
Bulletin, 107, 238–246
Bhavani SA, Sharavan, Arpitha (2015). A Study Effec-
tiveness of Employee Engagement in Automobile
Industry. International Journal of Economics &
Management Sciences . vol 4, issue 10, http://
dx.doi.org/10.4172/2162-6359.1000295
Browne, M.W. & Cudeck, R. (1993). Alternative ways
of assessing model fit. In Bollen,
K.A. & Long, J.S. [Editors.] Testing structural equa-
tion models. Newbury Park, CA:
Sage, 136–162.
Bruk-Lee, V.; Khoury, H. A.; Nixon, A. E.; Goh, A.;
Spector, P. E. (2009). “Replicating and extending
past personality/job satisfaction meta-analyses”.
Human Performance. 22 (2): 156–189.
Burgoon, J.K. Buller, D.B. and Woodall, W.G. (1996)
Nonverbal Communication, New York: McGraw-
Hill
Burke, R. j. & MacDermid, G. (1999). Are workaholics
job satisfied and successful in their careers?. Ca-
reer Development International,4 (5) , 277 –282
Cote S., Morgan LM (2002). A longitudinal analysis of
the association between emotion regulation, job
satisfaction, and intentions to quit. Journal of Or-
ganizational Behavior vol 23, 947–962
Cronbach, L. J. (1970). Essentials of Psychological Test-
ing. New York: Harper & Row.
Davis, K. & Newstrom, J. W. (1989). Human Behavior
at Work. Organizational Behavior, New York;
McGraw-Hill, p.176.
Page 44
35
A study on employee job satisfaction with special
reference to the Indian automobile industry
Fairbrother, K. & Warn, J. (2003). Workplace dimen-
sions, stress and job satisfaction, Journal of Mana-
gerial Psychology,18(1),8 –21
Farace, R. V., Monge, P. R., & Russell, H. M. (1977).
Communicating and organizing. Reading, MA:
Addison-Wesley.
Feldman, D. C. & Arnold, H. J. (1983). Managing Indi-
vidual and Group Behavior in Organizations, New
York ; McGraw -Hill, p.192
Fisher D. (2000). Mood and emotions while working:
missing pieces of job satisfaction? Journal of Or-
ganizational Behavior 21, 185-202
Hackman, J. R. & Oldham, G. R. (1980). Work rede-
sign, Addison-Wesley, Reading, MA.
Herzberg, F., Mausner, B. & Snyderman, B. (1959). The
Motivation to Work (2nd ed.). New York: John
Wiley.
Hoffman, K. & Ingram, T. N. (1992). Service Provider
Job Satisfaction and Customer, Journal of Services
Marketing,6(2),68 –78
Hu, L T & Bentler, P M (1995). Evaluating model fit. In
R. H. Hoyle (Editor), Structural Equation Model-
ing. Concepts, Issues, and Applications (pp. 76-99).
London: Sage.
Hu, L., & Bentler, P. M. (2009, November 3). Cut-off
criteria for fit indexes in
covariance structure analysis: Conventional crite-
ria versus new alternatives. Structural Equation
Modeling, Retrieved, Nov 2016, from Taylor &
Francis Online,6,1-55. http://dx.doi.org/10.1080/
10705519909540118
Hulin, C. L., & Judge, T. A. (2003). Job attitudes. In W.
C. Borman, D. R. ligen, & R. J. Klimoski (Eds.), Hand-
book of psychology: Industrial and organizational
psychology (pp. 255-276). Hoboken, NJ: Wiley.
Jöreskog, K.G. & Sörbom, D. (1996). LISREL 8 User’s
reference guide. Chicago: Scientific Software. Re-
trieved (Jan 2016) https://books.google.co.in/
books?id=9ACs50RjacC&printsec=frontcover
&redir_esc=y#v=onepage&q&f=false
Kline, R. B. (2016). Principles and practice of structural
equation modeling (4th ed.).
New York: Book © Guilford Press
Kreitner, R. & Kinicki, A. (1995). Organizational Behav-
ior, Third Edition, Richard D. Irwin. INC, USA, 1995,
p.159
Locke, E.A. (1976). The nature and causes of job satis-
faction. In M.D. Dunnette (Ed.), Handbook of in-
dustrial and organizational psychology (pp.1297-
1349). Chicago: Rand McNally.
Locke, E.A. (1976). The nature and causes of job satis-
faction. In M.D. Dunnette (Ed.), Handbook of in-
dustrial and organizational psychology (pp.1297-
1349). Chicago: Rand McNally.
Melvin, J. (1993). Design and the Creation of Job Sat-
isfaction, Facilities,11(4),15 –18
Mudor, H. & Tookson, P. (2011). Conceptual frame-
work on the relationship between human resource
management practices, job satisfaction, and turn-
over. Journal of Economics and Behavioral Stud-
ies ,2(2),41-49
Neog, B. B. & Barua, M. (2014). Factors Influencing
Employee’s Job Satisfaction: An Empirical Study
among Employees of Automobile Service Work-
shops in Assam. The SIJ Transactions on Industrial,
Financial & Business Management (IFBM), Vol. 2 ,
No. 7 , September 2014. Pp 305 - 314
Oshagbemi, T. (1997). The influence of rank on the
job satisfaction of organizational members, Jour-
nal of Managerial Psychology,12(8),511 –519
Ramayah, M. T. (2011). Mentoring and job satisfac-
tion in Malaysian SMEs, Journal of Management
Development,30(4),427 –440
Rao, P. S. (2000). Essentials of Human Resource Man-
agement and industrial relations Himalaya pub-
lishing House, Mumbai, India, p.480
Robertson, I. T.; Birch, A. J.; Cooper, C. L. (2012). “Job
and work attitudes, engagement and employee
performance: Where does psychological well-be-
ing fit in?”. Leadership & Organization Develop-
ment Journal. 33 (3): 224–232.
Sageer, A., Rafat, S., Agarwal, P. (2012). Identification
of Variables Affecting Employee Satisfaction and
Their Impact on the Organization. IOSR Journal of
Business and Management (IOSR-JBM). ISSN:
2278-487X. Volume 5 , Issue 1 (Sep-Oct. 2012),
PP 32-39
Savery, L. K. (1989), Job Satisfaction and Nurses. Jour-
nal of Managerial Psychology, 4 (5) , 11 –16
Seniwoliba, A.J. (2013).Teacher motivation and job
satisfaction in senior high schools in the Tamale
Page 45
36
Applied Research Series, 2017
metropolis of Ghana. Merit Research Journal of
Education and Review,1(9),181-196
Silverthorne, J. C. (2008). The impact of locus of con-
trol on job stress, job performance and job satis-
faction in Taiwan, Leadership & Organization De-
velopment Journal,29(7),572 -582
Singh , J.K & Jain , M. (2013). A Study of Employees’
Job Satisfaction and its impact on their Perfor-
mance. Journal of Indian Research, 1(4), 105-111.
Spector, P.E. (1997). Job satisfaction: Application, as-
sessment, causes and consequences. Thousand
Oaks, CA: SAGE.
Steiger, J.H. & Lind, J.C. (1980, May 30). Statistically-
based tests for the number of
common factors. Paper presented at the Annual
Spring Meeting of the Psychometric
Society, Iowa City.
Swarnalatha, C & Sureshkrishna, G (2013) Role of
employee engagement in building job satisfaction
among employees of automotive industries in In-
dia. International Journal of Human Resource
Management and Research (IJHRMR). Vol. 3, Is-
sue 1, Mar 2013, 1-6.
Swarnalatha. C. & Sureshkrishna, G. (2012). Job Sat-
isfaction among Employees of Automotive Indus-
tries in India international Journal of Future Com-
puter and Communication, Vol.1, No. 3, October
2012, pp-245 to 248.
Tietjen, M. & Myers, R. (1998). Motivation and job
satisfaction, Management Decision,36(4),226 –
231
Toma•ev, N., Seljak, J. & Aristovnik, A. (2014). Factors
influencing employee satisfaction in the police ser-
vice: the case of Slovenia, Personnel Re-
view,43(2),209 –227
Tucker, L.R & Lewis, C. (1973). A reliability coefficient
for maximum likelihood factor
analysis. Psychometrika, 38, 1–10
Ullman, J. B. (2001). Structural equation modeling. In
B. G. Tabachnick & L. S. Fidell
(Editors.), Using Multivariate Statistics (4th ed.)
(pp. 653-771). Needham Heights, MA:
Allyn & Bacon.
Wright, T. A.; Cropanzano, R. (2000). “Psychological
well-being and job satisfaction as predictors of job
performance”. Journal of Occupational Health Psy-
chology. 5 (1): 84–94.
Zaki, A. C. B. (2003),Job satisfaction and employee
performance of Lebanese banking staff”, Journal
of Managerial Psychology, Vol. 18(4),368 –376.
Webliography
http://info.shine.com/industry/automobiles-auto-
ancillaries/3.html
http://info.shine.com/industry/automobiles-auto-
ancillaries/3.html
http://info.shine.com/industry/automobiles-auto-
ancillaries/3.html
http://www.siamindia.com/statistics.aspx?mpgid=
8&pgidtrail=10
http://www.siamindia.com/statistics.aspx?mpgid=
8&pgidtrail=13
http://www.siamindia.com/statistics.aspx?mpgid=
8 &pgidtrail=9
https://www.futurescape.in/csr-what-the-automo-
tive-industry-should-really-focus-on//)
https://www.ibef.org/industry/india-automobiles.
aspx
h t t p s : / / w w w . i b e f . o r g / i n d u s t r y / i n d i a -
automobiles.aspx