A STUDY ON TEACHER ATTRITION IN TWO SMALL SCHOOL DISTRICTS IN SOUTHEASTERN VIRGINIA Walter R. Clemons Dissertation submitted to the faculty of the Virginia Polytechnic Institute and State University in partial fulfillment of the requirements for the degree of Doctor of Philosophy In Educational Leadership and Policy Studies Travis W. Twiford, Committee Chair M. David Alexander N. Wayne Tripp Marion Wilkins November 3, 2009 Virginia Beach, Virginia Keywords: Teacher, Attrition, Retention, Small, Rural
Transcript
A STUDY ON TEACHER ATTRITION IN TWO SMALL SCHOOL DISTRICTS IN SOUTHEASTERN VIRGINIA
Walter R. Clemons
Dissertation submitted to the faculty of the Virginia Polytechnic Institute and State University in partial fulfillment of the requirements for the degree of
Doctor of Philosophy
In Educational Leadership and Policy Studies
Travis W. Twiford, Committee Chair M. David Alexander
A STUDY ON TEACHER ATTRITION IN TWO SMALL SCHOOL DISTRICTS IN SOUTHEASTERN VIRGINIA
Walter R. Clemons
ABSTRACT
All students deserve the opportunity to receive a high quality education that will enable them to
reach their full potential and become productive members of society. Teachers play a vital role in the
academic development of students and therefore school districts across the country need to do all they can to
ensure that all students have highly qualified teachers in their classrooms. Many school districts across the
country are having major difficulty retaining the very best educators. The purpose of this study was to
identify the factors that impact teacher attrition in two small school districts in Southeastern Virginia. This
study through survey responses gathered data from teachers who left both districts after the 2007-2008
school year on the factors that impacted their decisions to leave and the challenges they perceived both
school districts face that impact teachers attrition. Other data from the survey responses identified
characteristics of the teachers who left both school districts after the 2007-2008 school year. Additionally,
2007-2008 demographic data on the total teacher population in both school districts were collected from the
Human Resources departments of both school districts.
Results from the study revealed that 54 out of 240 (22.5%) teachers combined left both school
districts after the 2007-2008 school year. Of the 54 teachers who left, 52 were mailed surveys. A total of
40 responses were received from the survey population of teachers. This represented a 77% survey
response rate. A variety of reasons for leaving were given by the teachers who left both school districts, but
a major reason given for leaving was student discipline. The biggest challenge that both school districts
face that impacts teacher attrition as perceived by teachers who left was geographical location. Of the 54
teachers who left both school districts, the majority were White and female. The majority of teachers who
left both school districts combined had five years or less of total teaching experience. The majority of the
teachers who left indicated they entered the teaching profession with the desire to impact the lives of
children.
iii
DEDICATION
I dedicate this dissertation to my loving wife LaGuamna, who has always been and still is a rock in
my corner and my eternal soul mate. I truly appreciate your belief in me and your dedication, commitment,
and faithfulness to me. I will always love you. I also dedicate this dissertation to my mother and father, the
late Mr. and Mrs. Walter Clemons Jr. My parents provided a household for me filled with love and always
encouraged me to do my very best. I will always love them and miss them greatly.
Finally, this dissertation is dedicated in loving memory to my boxer puppy Mercedes, who passed
away suddenly and unexpectedly at the tender age of two on August 8, 2009 due to a rare heart condition in
boxers known as cardiomyopathy. Mercedes was truly a daddy’s girl, and lay beside my chair every
opportunity she had when I was working on my dissertation. She was dearly loved and is truly missed.
iv
ACKNOWLEDGMENTS
I first give all honor and praise to almighty God, who continues to bless me and without whom
none of this would be possible. To my loving wife LaGuamna, thank you for your encouragement
throughout this process and your unwavering belief that I could do it. I love you dearly and I thank you for
your continuous support in all my endeavors.
To Dr. Travis W. Twiford, my committee chairman, thank you for having enough belief in my work
and agreeing to serve as my chair. I truly appreciate your wisdom, feedback, and guidance throughout this
process. To my committee members, Dr. M. David Alexander, Dr. N. Wayne Tripp, and Dr. Marion
Wilkins, thank you for your feedback and constructive criticism in the effort to make this the best study
possible.
To Mr. Lloyd Hamlin (Superintendent of Schools) of Surry County Public Schools, thank you Mr.
Hamlin for allowing me to collect the data that I needed for this study from your school district. To Mr.
Patrick Barnes (Director of Human Resources and Food Services) of Surry County Public Schools, thank
you Mr. Barnes for providing me with the information that I needed for this study. To Mrs. Beverly Rabil
(Acting Superintendent of Schools) of Franklin City Public Schools, thank you Mrs. Rabil for signing the
District consent form I needed for data collection purposes for this study. To the former teachers in the
Franklin City and Surry County School districts that completed and returned the surveys, thank you for
giving me the feedback that I needed for this study.
v
TABLE OF CONTENTS
Page
Abstract………………………………………………………………………………….ii Dedication………………………………………………………………………………iv Acknowledgments………………………………………………………………………v Table of Contents……………………………………………………………………….vi List of Figures…………………………………………………………………………..x List of Tables…………………………………………………………………………...xi Chapter One: THE PROBLEM…………………………………………………………1
Context and Overview of the Study…..…………………………………………….2
Historical Background and Current Status…..……………………………………...2
Statement of the Problem……………………………………………………………3
Purpose and Significance of the Study…..…………………………………………..4
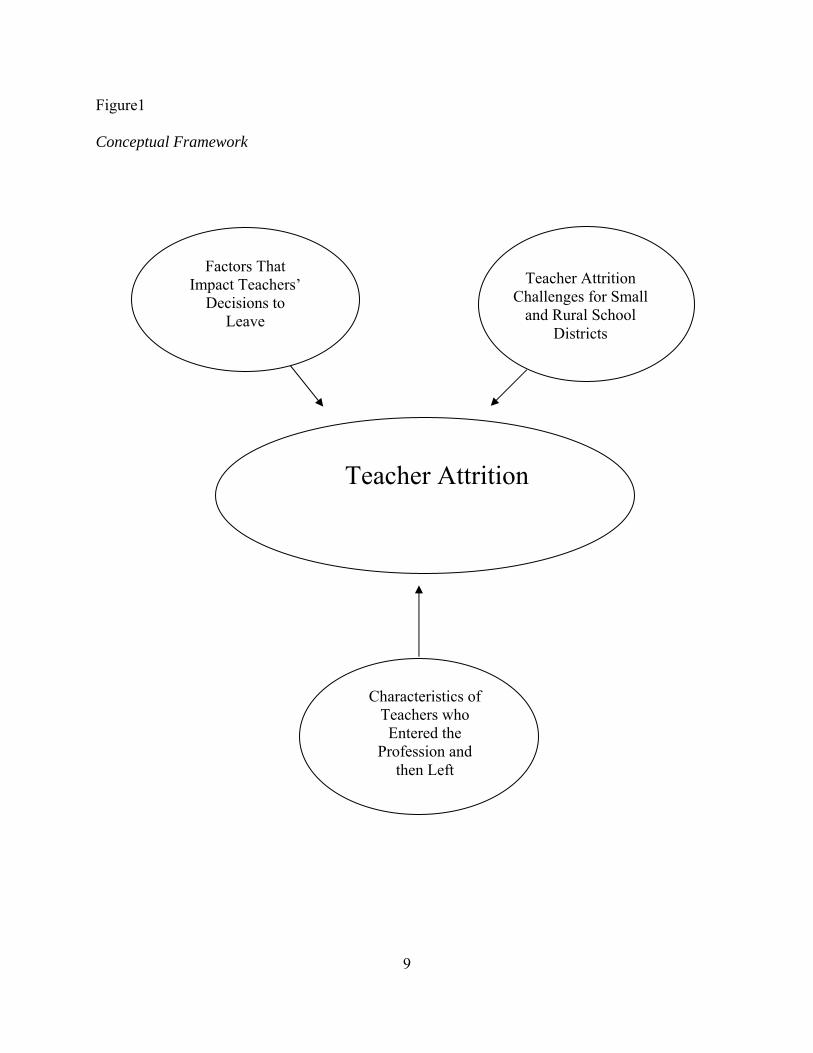
Conceptual Framework……………………………………………………………...8
Definition of Key Terms…………………………………………………………….8
Organization of the Study…………………………………………………………..10 Chapter Two: REVIEW OF RELATED LITERATURE………………………………11
Ability (ACT Scores, SAT Scores and Postsecondary Institution Selection).……..27 Psychological and Family Factors………………………………………………….28 Chapter Summary (Analysis of Literature)………………………………………...29
A. Cover Letter to District Superintendents………………………………………..81 B. Franklin City Public Schools District Consent Form…………………………....82 C. Surry County Public Schools District Consent Form……………………………83 D. Cover Letter Number One to Teachers………………………………………….84
viii
E. Cover Letter Number Two to Teachers………………………………………….85
F. Teacher Attrition Survey……………………………………………………........86 G. Survey Validation Instrument One (October 13, 2008)……………………….....90 H. Survey Validation Instrument Two (November 3, 2008)……..…………………95 I. Survey Validation Instrument One Alignment Results…………………………...99 J. Survey Validation Instrument Two Alignment Results………………………….100
K. Survey Validation Instrument One Clarity Results……………………………...101
L. Survey Validation Instrument Two Clarity Results……………………………...102
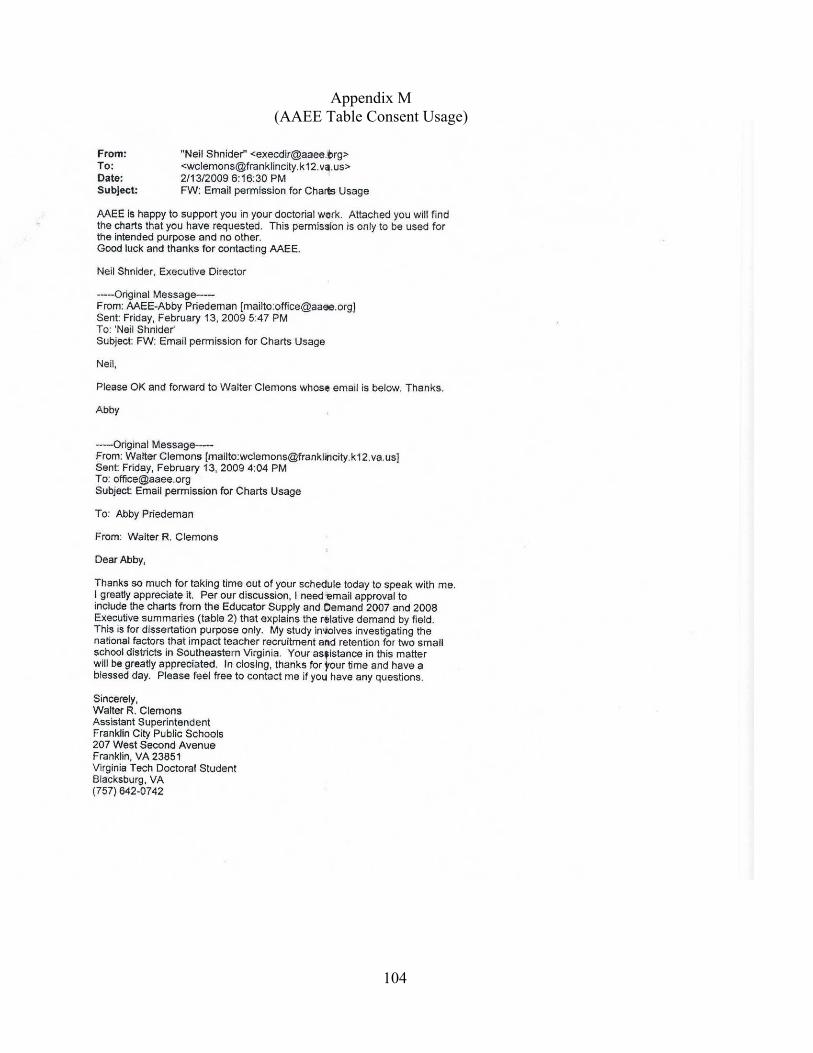
M. AAEE Table Consent Usage………………………………………………….....104
N. NCES Table Consent Usage…………………………………………………......105
O. IRB Approval………………………………………………………………….....106
P. Human Subjects Training………………………………………………………...107 Q. 2007-2008 Recoded Electronic Teacher Data for Surry County and
Franklin City………………………………………………………………….....108
ix
LIST OF FIGURES
Figure 1 Page
Conceptual Framework …………………………………………………………………9
x
LIST OF TABLES
Table Page
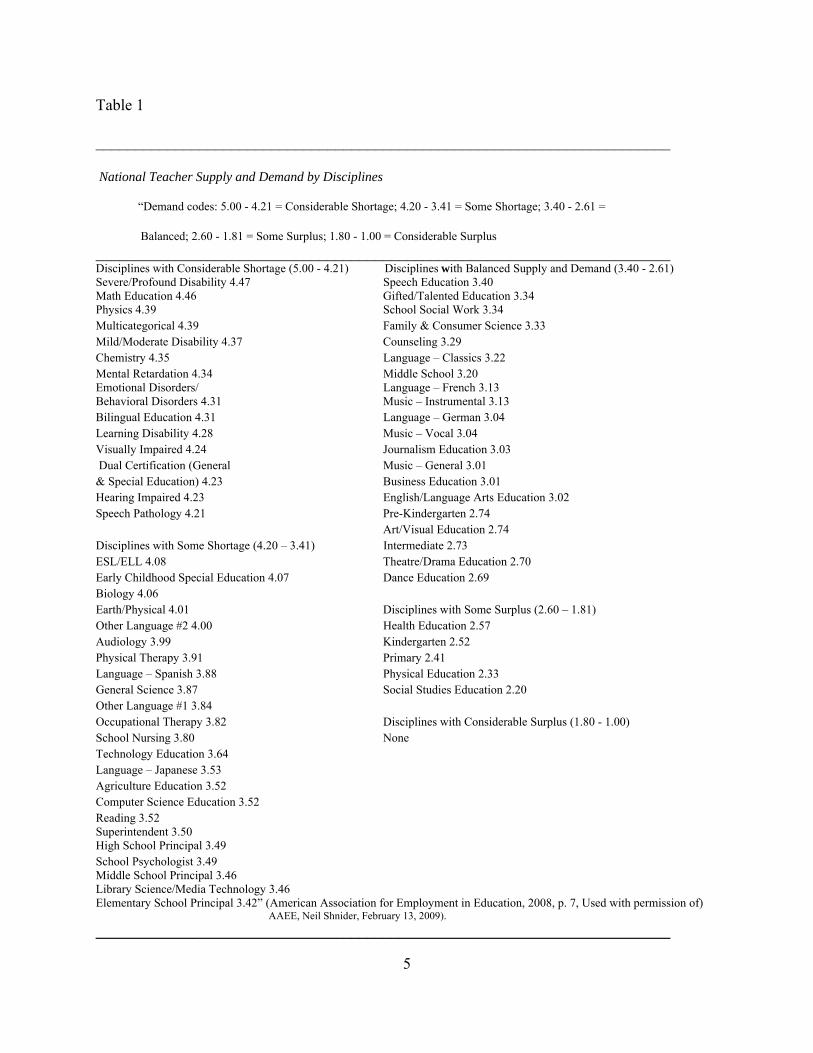
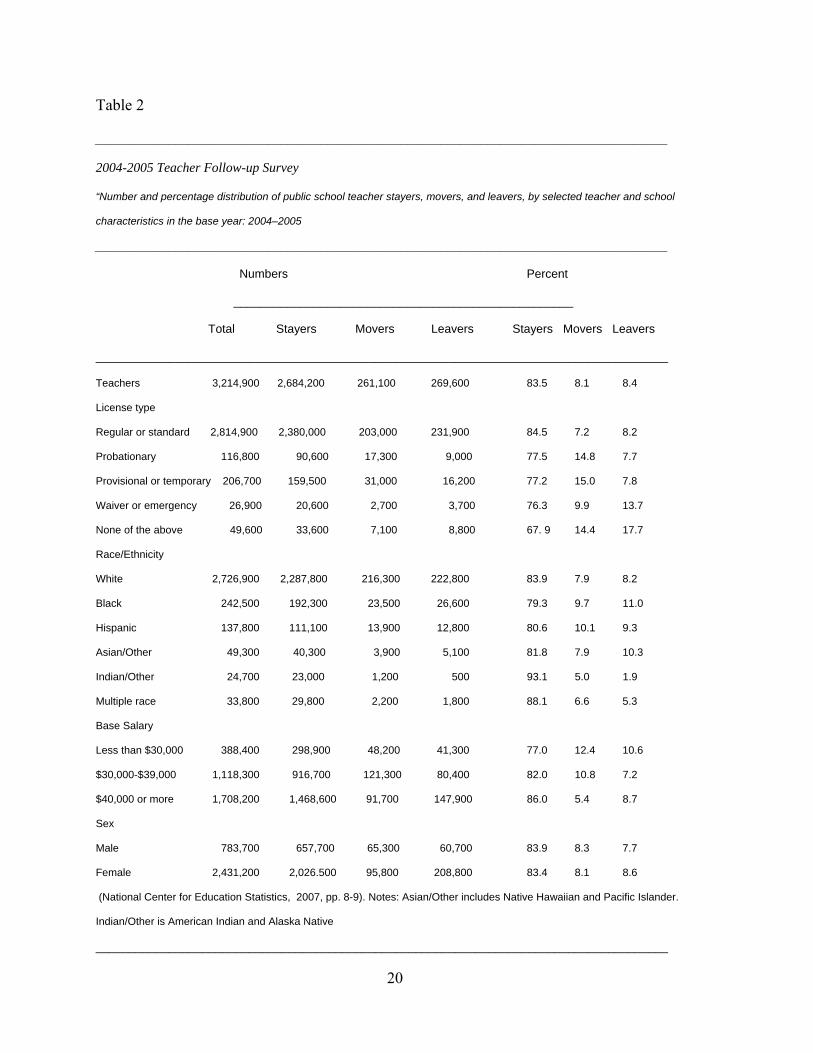
1 National Teacher Supply and Demand by Disciplines…………………………..5
Balanced; 2.60 - 1.81 = Some Surplus; 1.80 - 1.00 = Considerable Surplus ________________________________________________________________________ Disciplines with Considerable Shortage (5.00 - 4.21) Disciplines with Balanced Supply and Demand (3.40 - 2.61) Severe/Profound Disability 4.47 Speech Education 3.40 Math Education 4.46 Gifted/Talented Education 3.34 Physics 4.39 School Social Work 3.34 Multicategorical 4.39 Family & Consumer Science 3.33 Mild/Moderate Disability 4.37 Counseling 3.29 Chemistry 4.35 Language – Classics 3.22 Mental Retardation 4.34 Middle School 3.20 Emotional Disorders/ Language – French 3.13 Behavioral Disorders 4.31 Music – Instrumental 3.13 Bilingual Education 4.31 Language – German 3.04 Learning Disability 4.28 Music – Vocal 3.04 Visually Impaired 4.24 Journalism Education 3.03 Dual Certification (General Music – General 3.01 & Special Education) 4.23 Business Education 3.01 Hearing Impaired 4.23 English/Language Arts Education 3.02 Speech Pathology 4.21 Pre-Kindergarten 2.74
Art/Visual Education 2.74 Disciplines with Some Shortage (4.20 – 3.41) Intermediate 2.73 ESL/ELL 4.08 Theatre/Drama Education 2.70 Early Childhood Special Education 4.07 Dance Education 2.69 Biology 4.06 Earth/Physical 4.01 Disciplines with Some Surplus (2.60 – 1.81) Other Language #2 4.00 Health Education 2.57 Audiology 3.99 Kindergarten 2.52 Physical Therapy 3.91 Primary 2.41 Language – Spanish 3.88 Physical Education 2.33 General Science 3.87 Social Studies Education 2.20 Other Language #1 3.84 Occupational Therapy 3.82 Disciplines with Considerable Surplus (1.80 - 1.00) School Nursing 3.80 None Technology Education 3.64 Language – Japanese 3.53 Agriculture Education 3.52 Computer Science Education 3.52 Reading 3.52 Superintendent 3.50 High School Principal 3.49 School Psychologist 3.49 Middle School Principal 3.46 Library Science/Media Technology 3.46 Elementary School Principal 3.42” (American Association for Employment in Education, 2008, p. 7, Used with permission of)
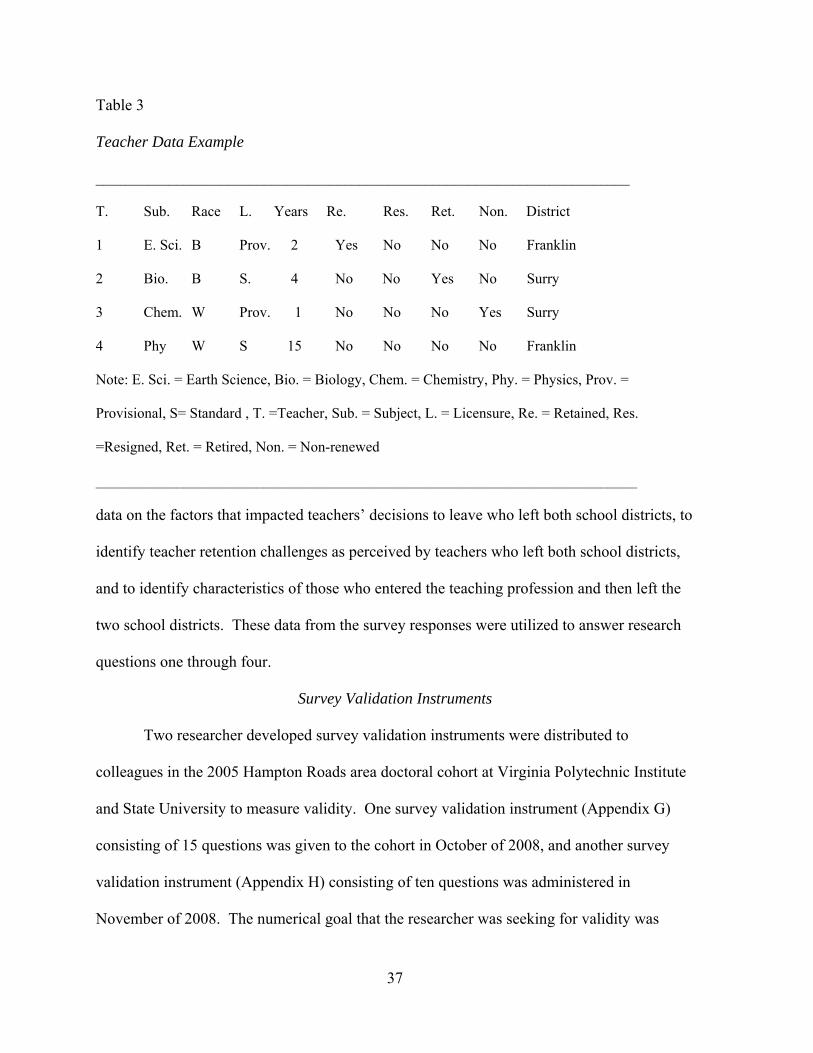
data on the factors that impacted teachers’ decisions to leave who left both school districts, to
identify teacher retention challenges as perceived by teachers who left both school districts,
and to identify characteristics of those who entered the teaching profession and then left the
two school districts. These data from the survey responses were utilized to answer research
questions one through four.
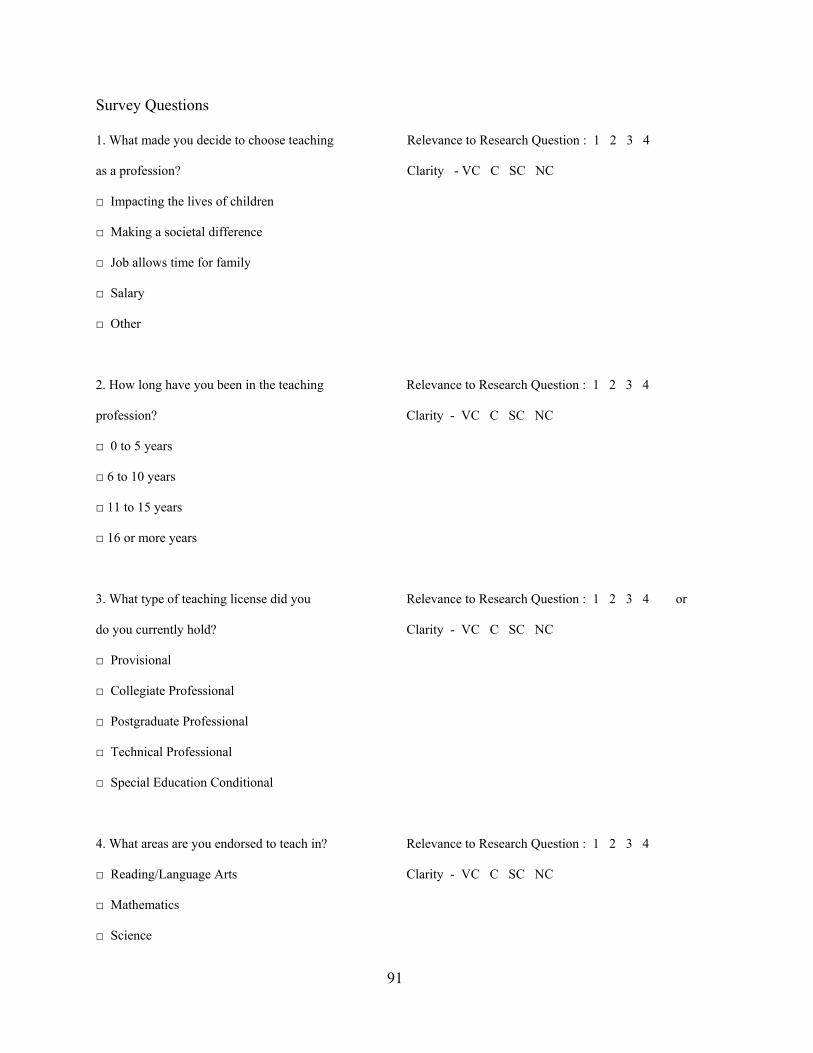
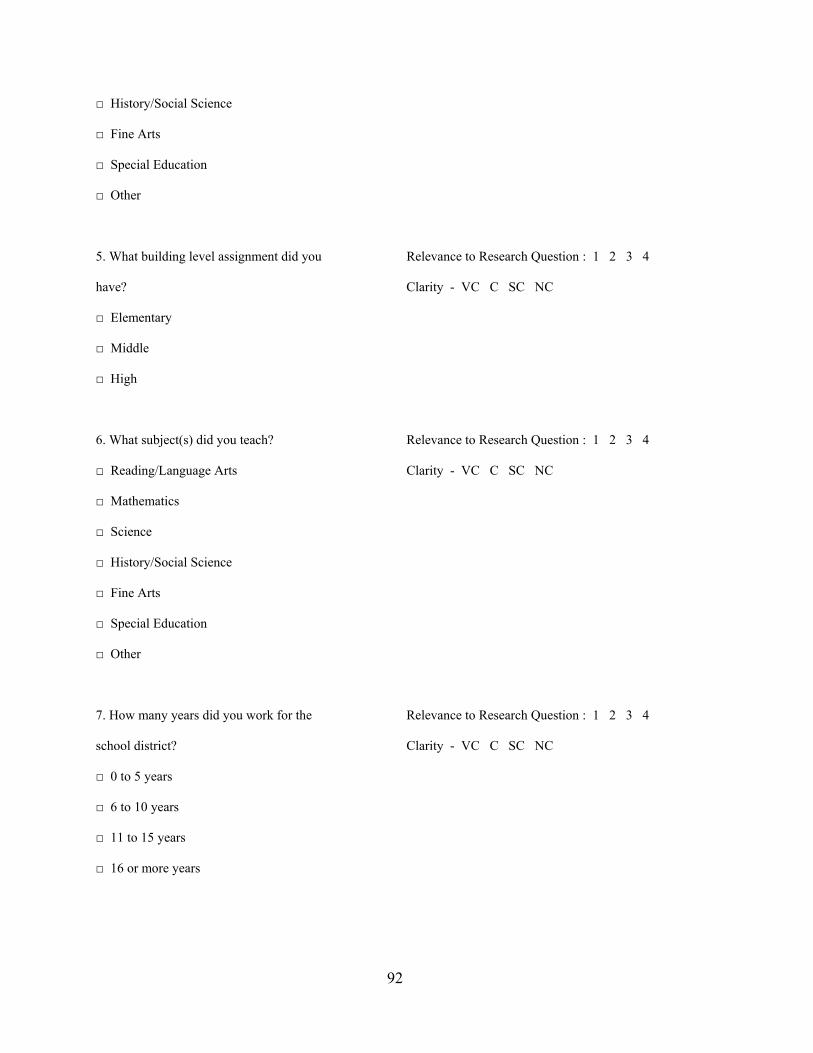
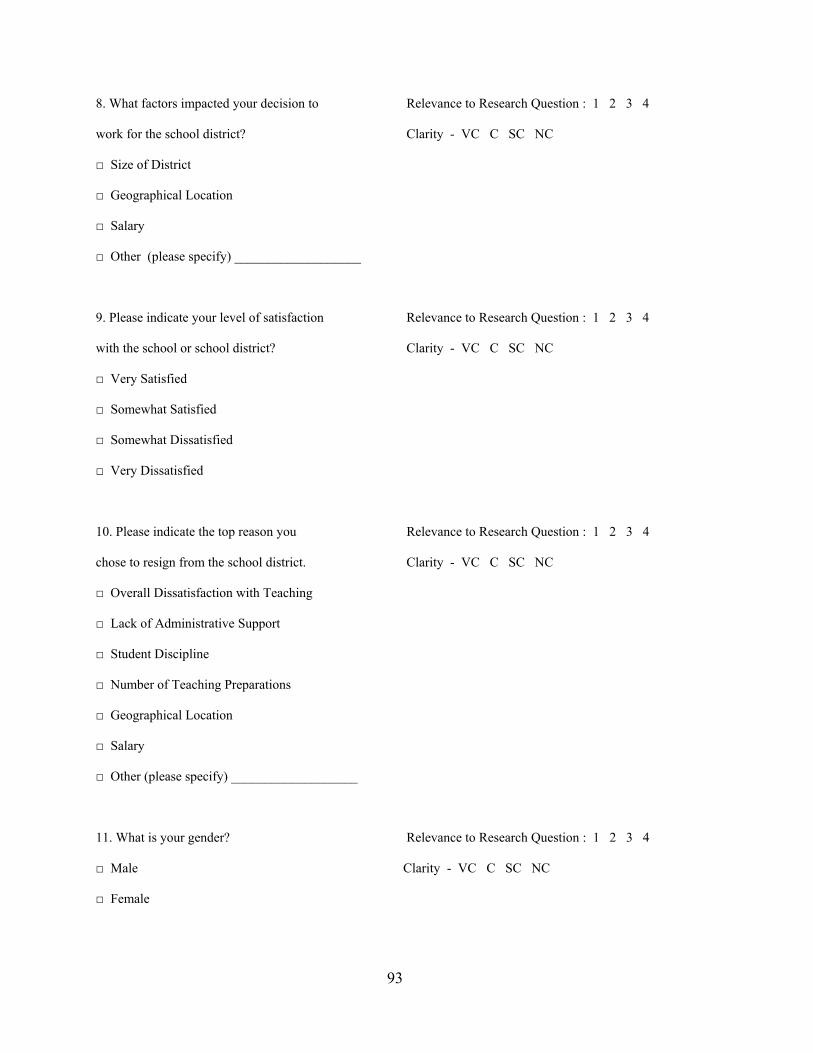
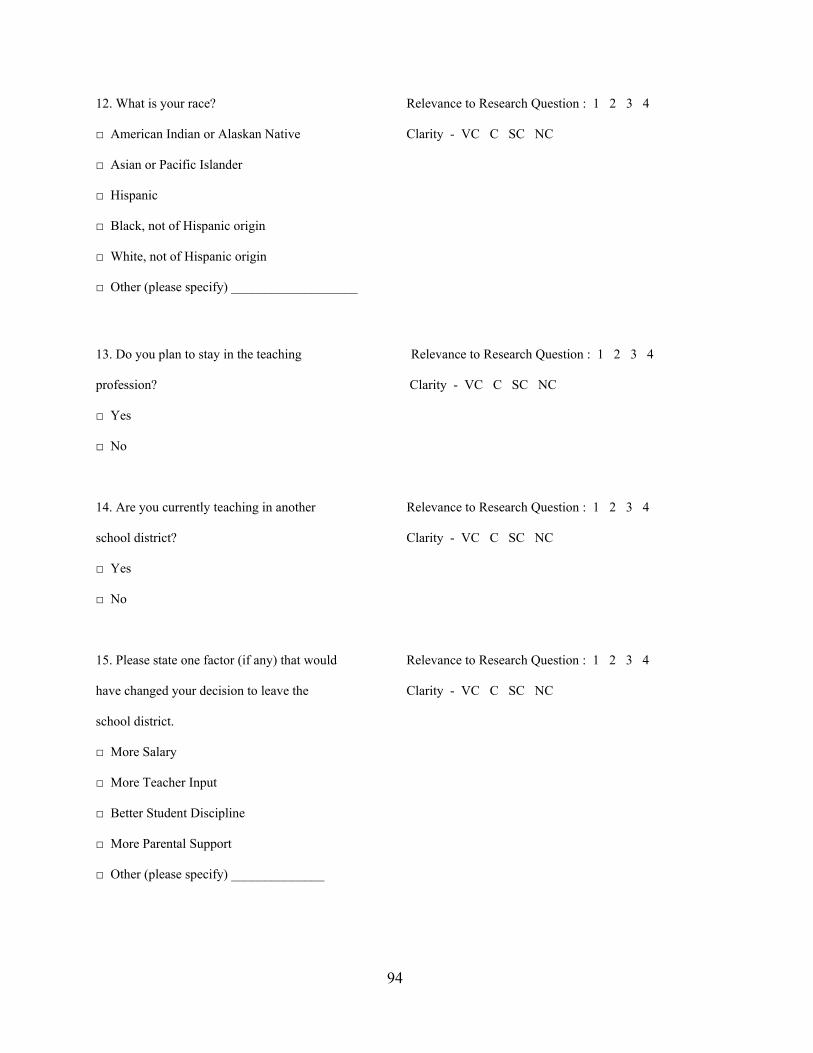
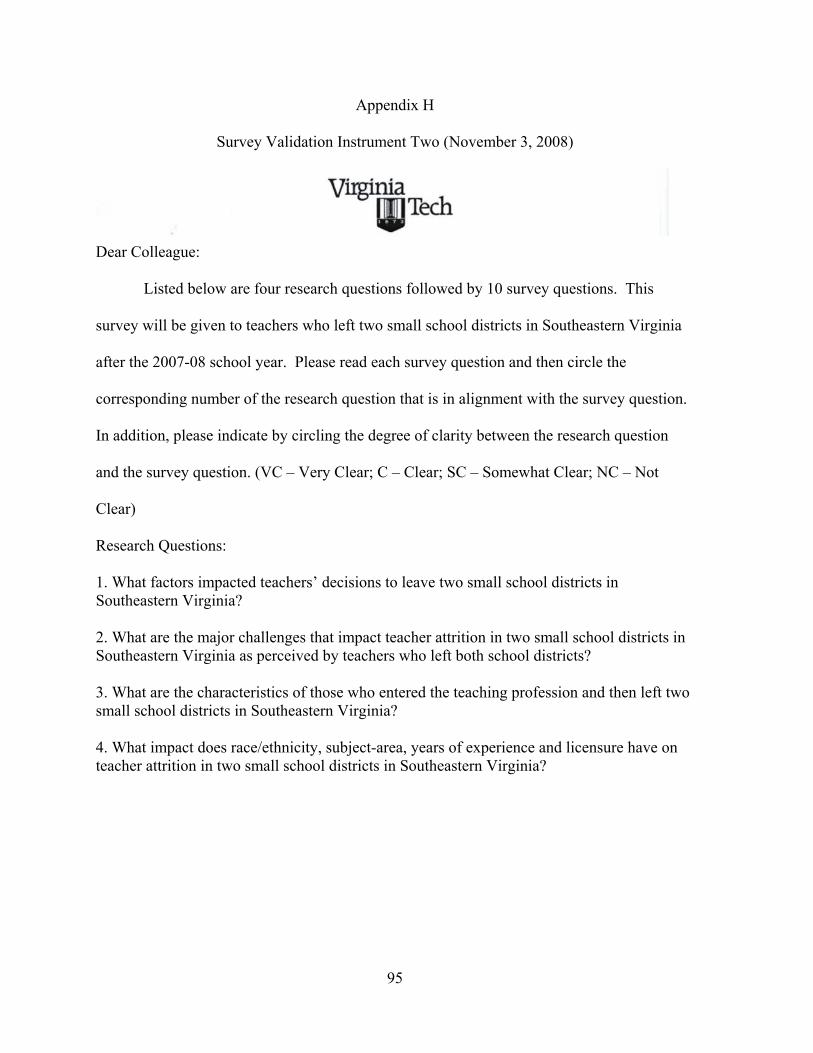
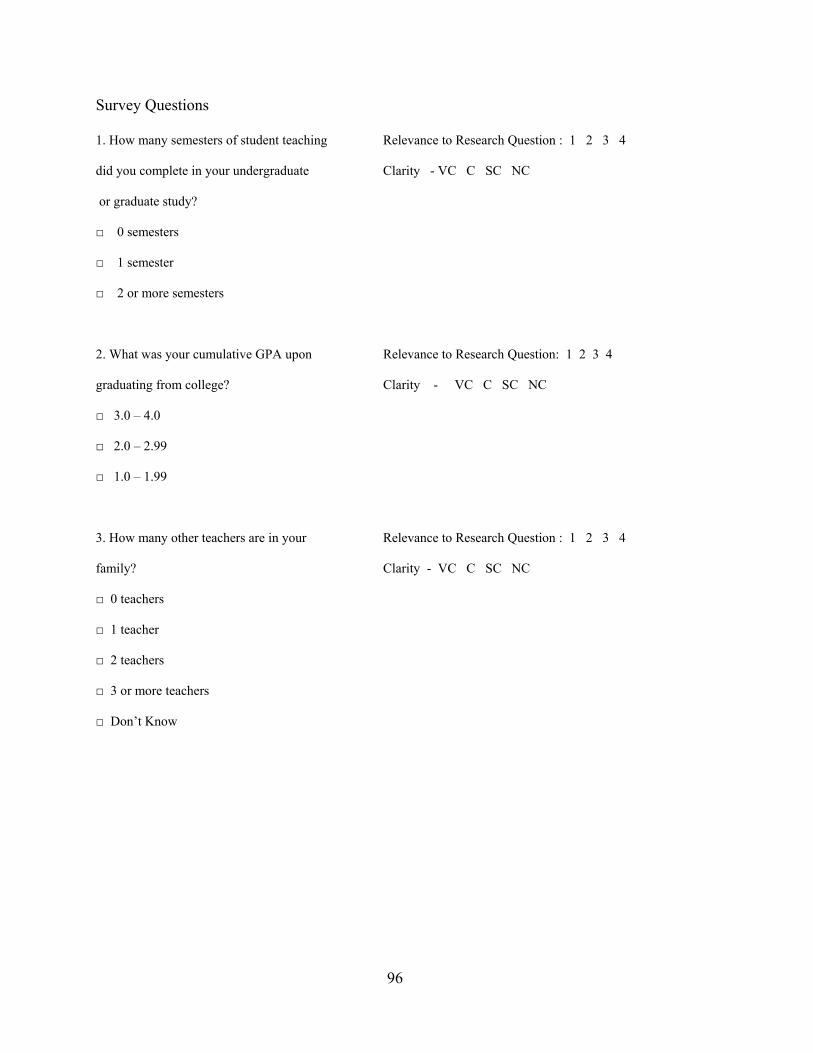
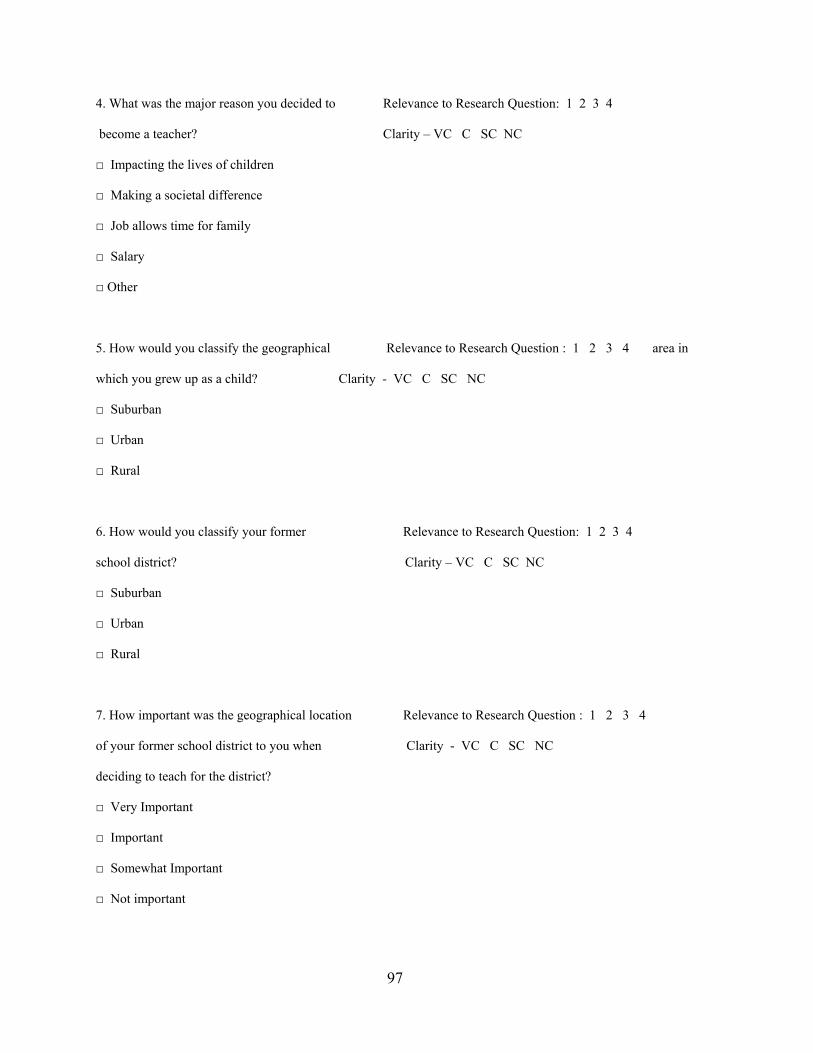
Survey Validation Instruments
Two researcher developed survey validation instruments were distributed to
colleagues in the 2005 Hampton Roads area doctoral cohort at Virginia Polytechnic Institute
and State University to measure validity. One survey validation instrument (Appendix G)
consisting of 15 questions was given to the cohort in October of 2008, and another survey
validation instrument (Appendix H) consisting of ten questions was administered in
November of 2008. The numerical goal that the researcher was seeking for validity was
38
80%. The 80% standard is the widely accepted number in the Behavioral and Social
Sciences that measure statistical power and validity (Trochim, 2006). This standard indicates
that the odds of confirming the theory correctly that there is a relationship between one thing
to another when in fact there is at least at an 80% rate (Trochim, 2006). The researcher used
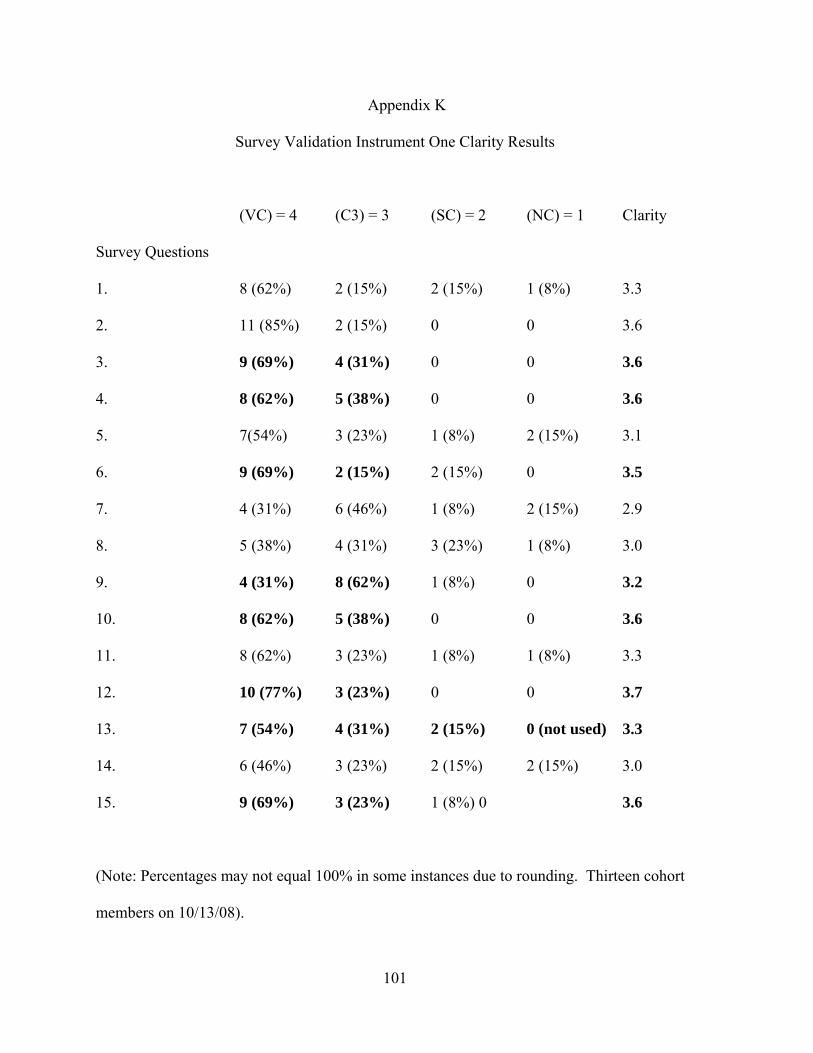
a four point Likert scale to determine clarity (question was easy to understand) as follows: 1
= not clear (nc), 2 = somewhat clear, 3 = clear (c), and 4 = very clear (vc).
This means that each survey question had to have alignment with a specific research
question by having an 80% agreement by cohort members on each question. Each survey
question also had to have a clarity rating of at least 3.0 (clear and above) on the Likert scale.
Any question that had under an 80% cohort agreement that the question related to a specific
research question or had clarity below 3.0 on the Likert scale was considered unreliable. The
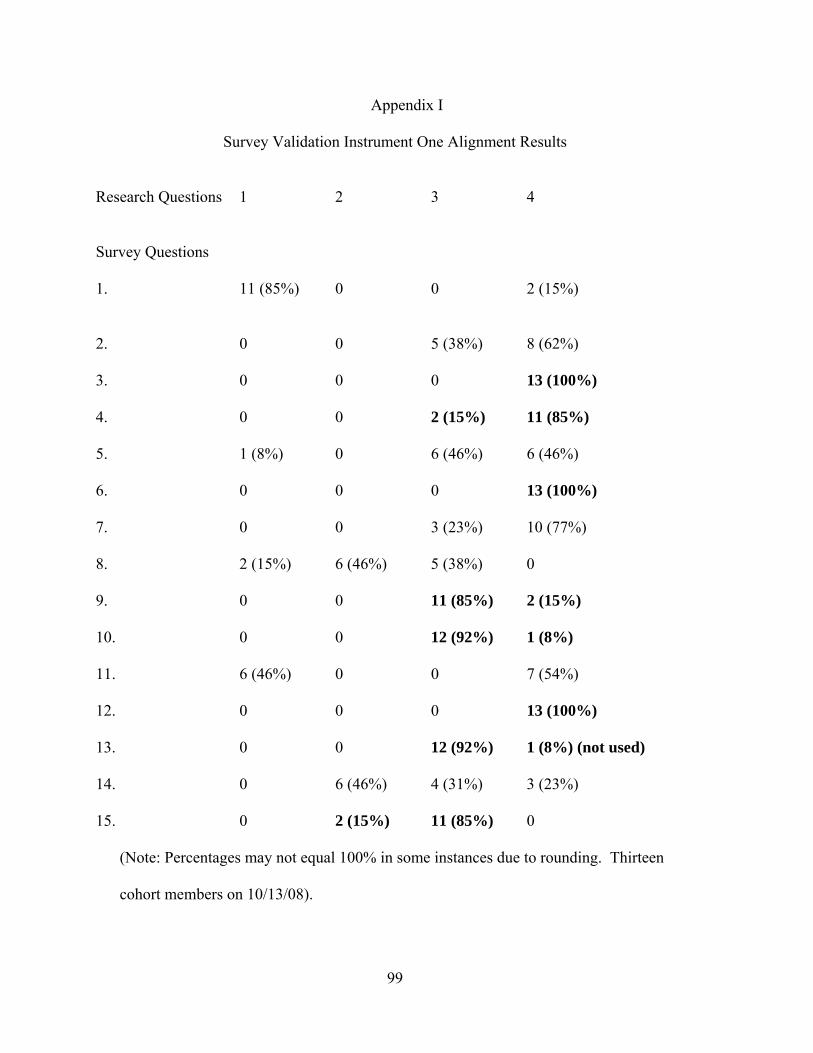
survey validation instrument (instrument one) given in October of 2008 had 8 out of 15
survey questions reach an 80% cohort agreement and a clarity rating at 3.0 or above. This
means that at least 11 out of 13 cohort members agreed that 8 out of 15 survey questions had
alignment and clarity as specified above. The seven survey questions that did not have the
80% alignment and 3.0 clarity rate were revised or eliminated and a second survey validation
instrument was administered.
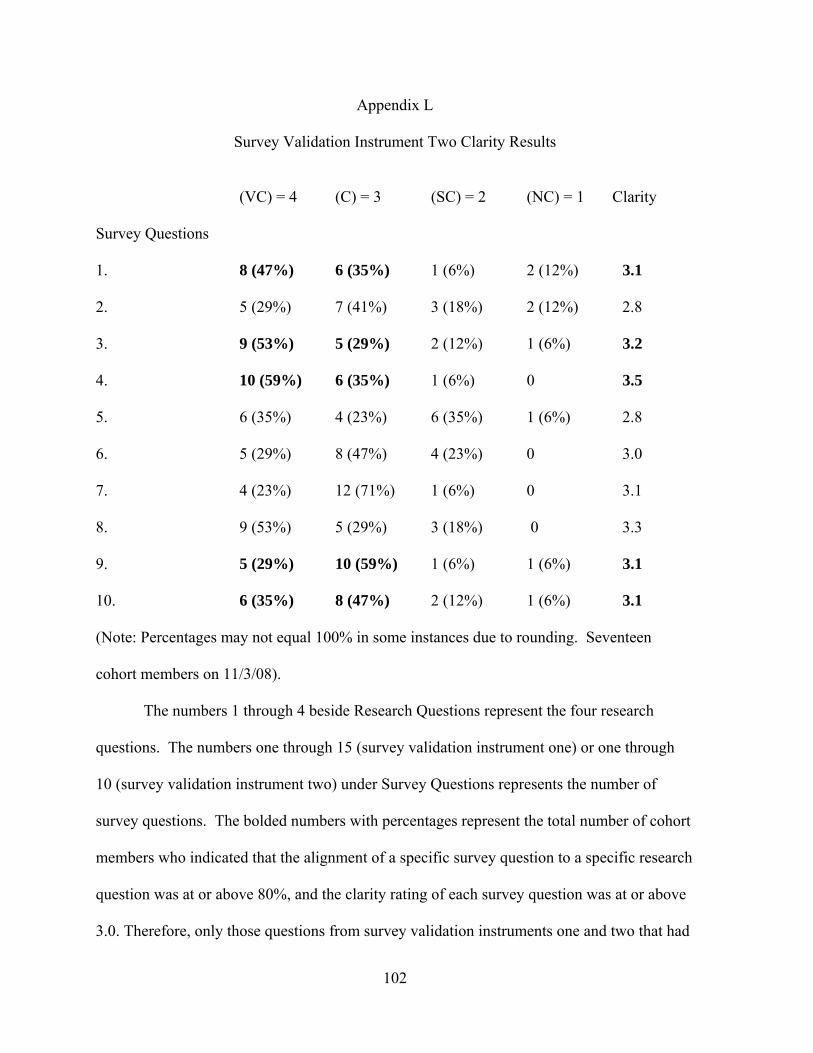
The second survey validation instrument (instrument two) given in November of
2008 had five out of 10 survey questions reach an 80% cohort agreement and a clarity rating
of 3.0 or above. This means that at least 14 out of 17 cohort members agreed that five out of
ten survey questions had alignment and clarity as specified above. The five survey questions
that did not have the 80% alignment and 3.0 clarity rate were eliminated. The validity results
of both survey instruments are in Appendices I through L. The survey in Appendix F is the
39
final survey used for the study (seven questions from survey validation instrument one and
five questions from survey validation instrument two) questions having at least an 80%
validation rate and a 3.0 clarity rate. The researcher did not utilize one question from survey
validation instrument one (question 13) though validated.
Data Treatment and Management
All database information was stored on the home computer of the researcher. The
database information also had a backup disk that was kept in a locked file cabinet at the
home of the researcher. Any identifiable teacher information was recoded to numbers. The
returned surveys were also kept in the locked file cabinet at the home of the researcher. After
successfully defending the dissertation and making appropriate written revisions, the results
will be shared with the Superintendents of Franklin City and Surry County Schools and the
information will be deleted from the home computer of the researcher and the backup disk
destroyed.
Data Analysis Techniques
The researcher collected total teacher population data for each school district
electronically. These data from the electronic submissions and the survey responses were
input into SPSS to conduct the frequency and cross tabulation procedures as appropriate. All
survey responses were recorded and placed in table format with frequency and cross
tabulation of responses given.
Methodology Summary
The cross tabulation procedure was conducted on the data submitted electronically
from both school districts. This procedure was conducted utilizing SPSS and allowed the
researcher to distinguish between school districts. The frequency procedure allowed the
40
researcher to determine the percentages by variable category. The frequency and cross
tabulation procedures were conducted on the survey responses. The cross tabulation results
from the electronic submissions and the frequency and cross tabulation results from the
survey responses were reported out utilizing descriptive statistics.
41
CHAPTER FOUR
RESULTS OF THE STUDY
The purpose of this study was to identify the factors that impact teacher attrition in
two small school districts in Southeastern Virginia. This study through survey responses
gathered data from teachers who left both districts after the 2007-2008 school year on the
factors that impacted their decisions to leave and the challenges they perceived both school
districts face that impact teacher attrition. Other data from the survey responses identified
characteristics of the teachers who left both school districts after the 2007-2008 school year.
Additionally, 2007-2008 data on the total teacher population in both school districts were
collected electronically from the Human Resources departments of both school districts. The
research questions that guided this study were as follows:
1. What factors impacted teachers’ decisions to leave two small school districts in
Southeastern Virginia?
2. What are the major challenges that impact teacher attrition in two small school
districts in Southeastern Virginia as perceived by teachers who left both school
districts?
3. What are the characteristics of those who entered the teaching profession and then
left two small school districts in Southeastern Virginia?
4. What impact does race/ethnicity, subject-area, years of experience and
licensure have on teacher attrition in two small school districts in Southeastern
Virginia?
This chapter is organized as follows: receipt of electronic data, mailing of surveys and
receipt of surveys, data results and analysis, and chapter summary.
42
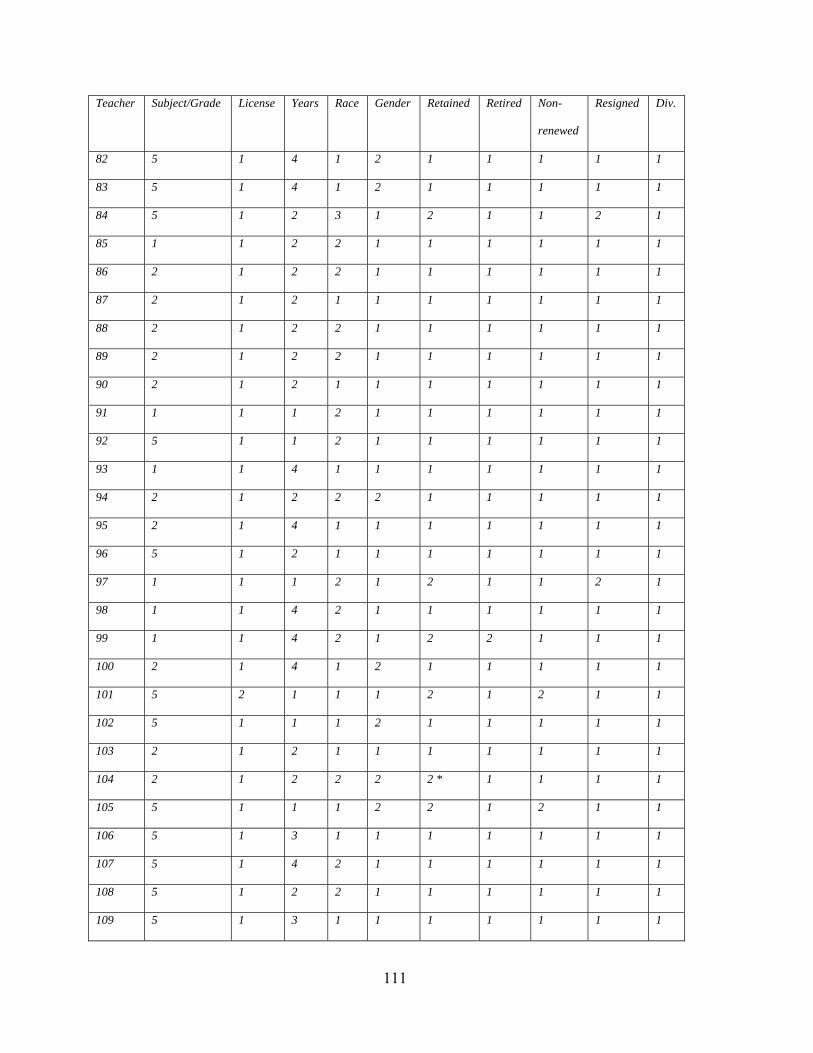
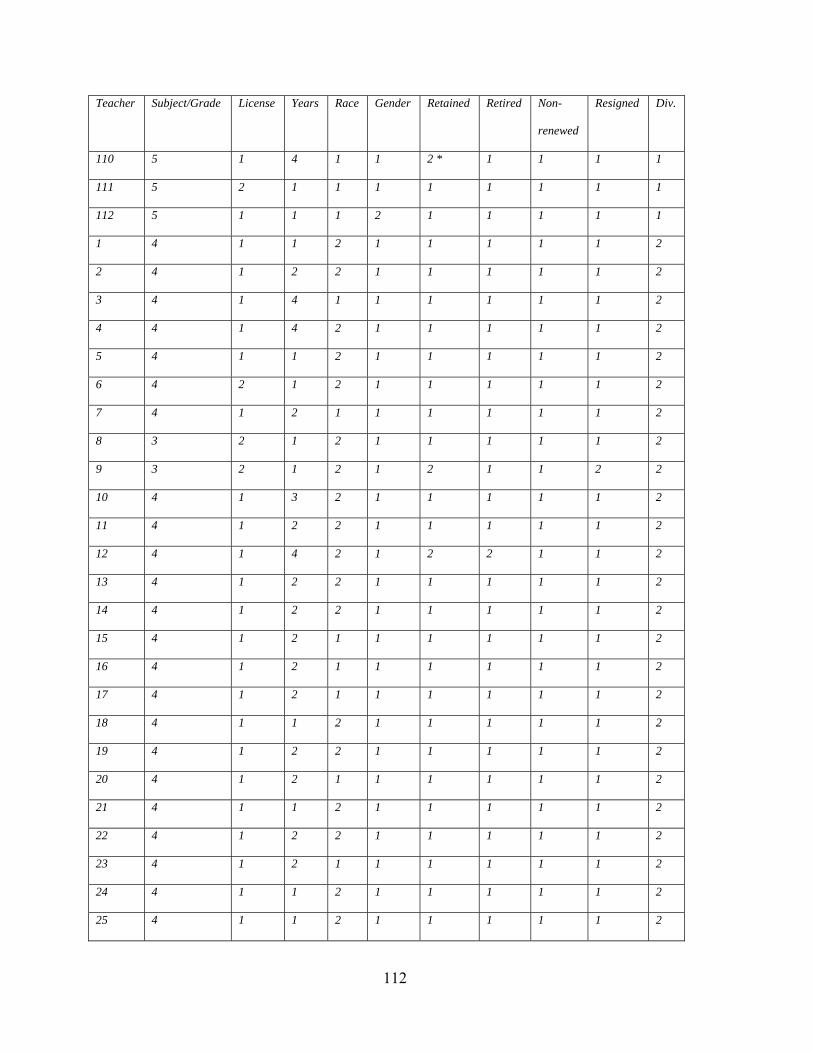
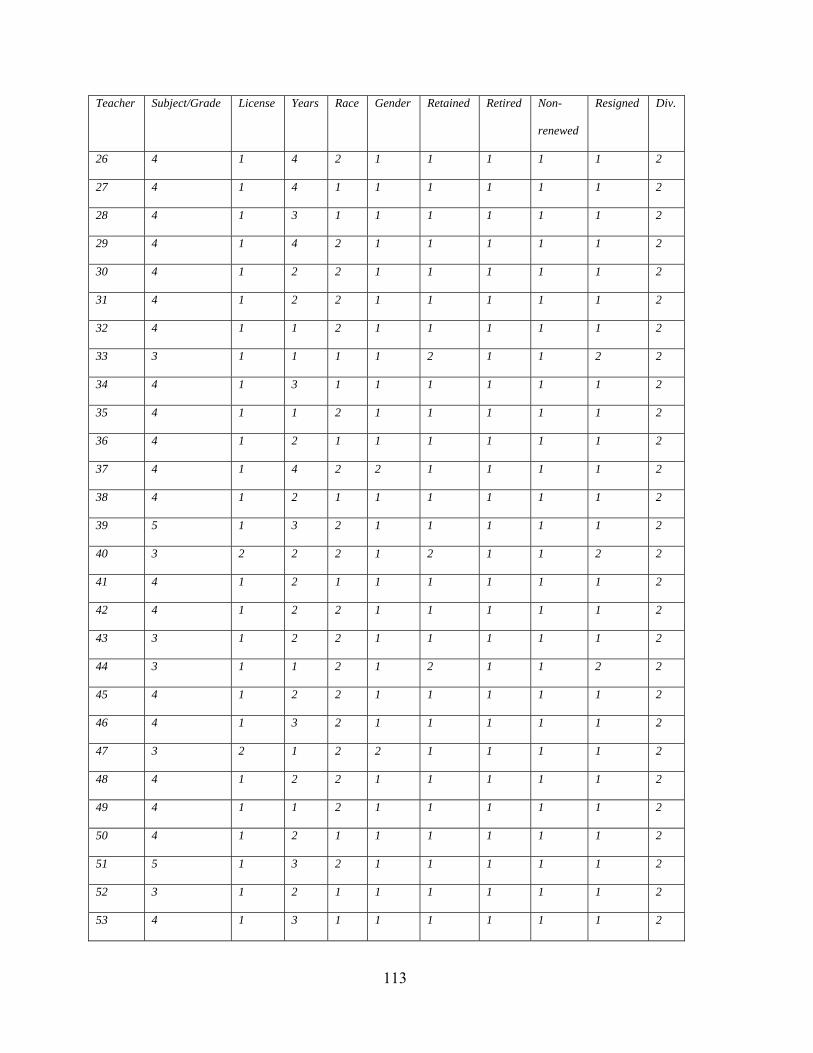
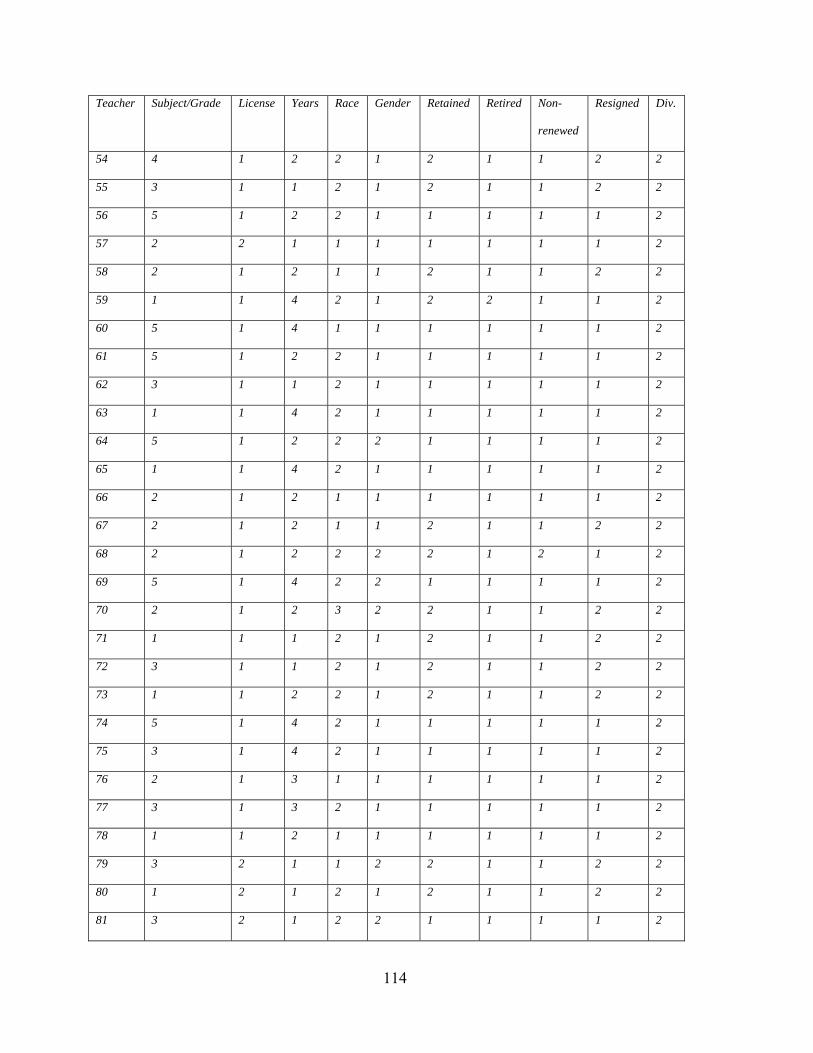
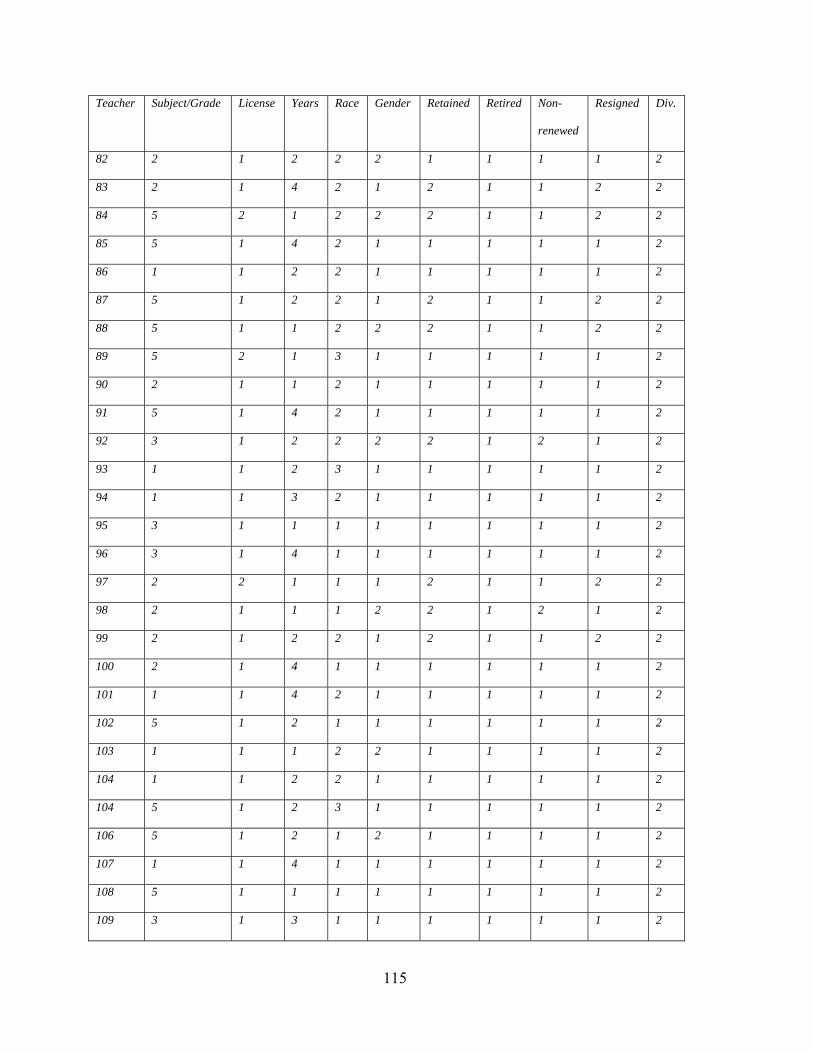
Receipt of Electronic Data
The researcher received the information sent electronically by both school districts
on March 1, 2009. The information received from each district included the name of the
school district, total number of teachers in each school district, specific subjects taught or
building/grade level, years of teaching experience, license type, race/ethnicity, gender,
number of teachers who stayed or left and number of teachers who resigned, retired or were
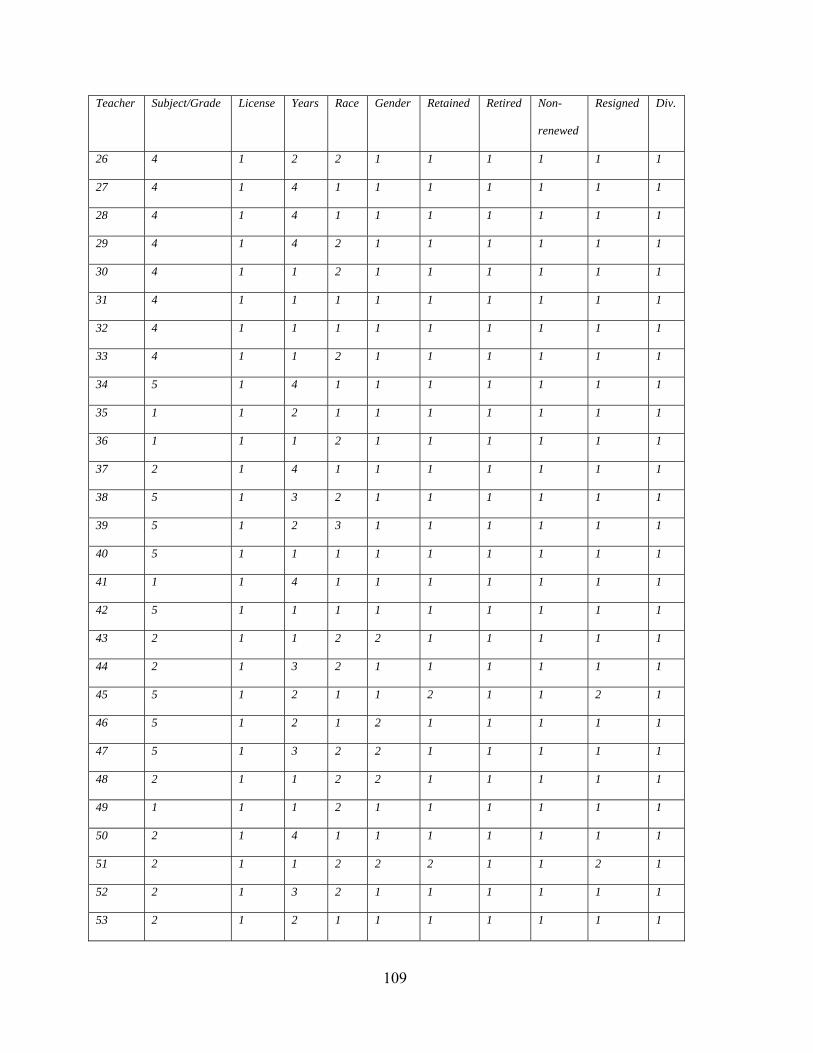
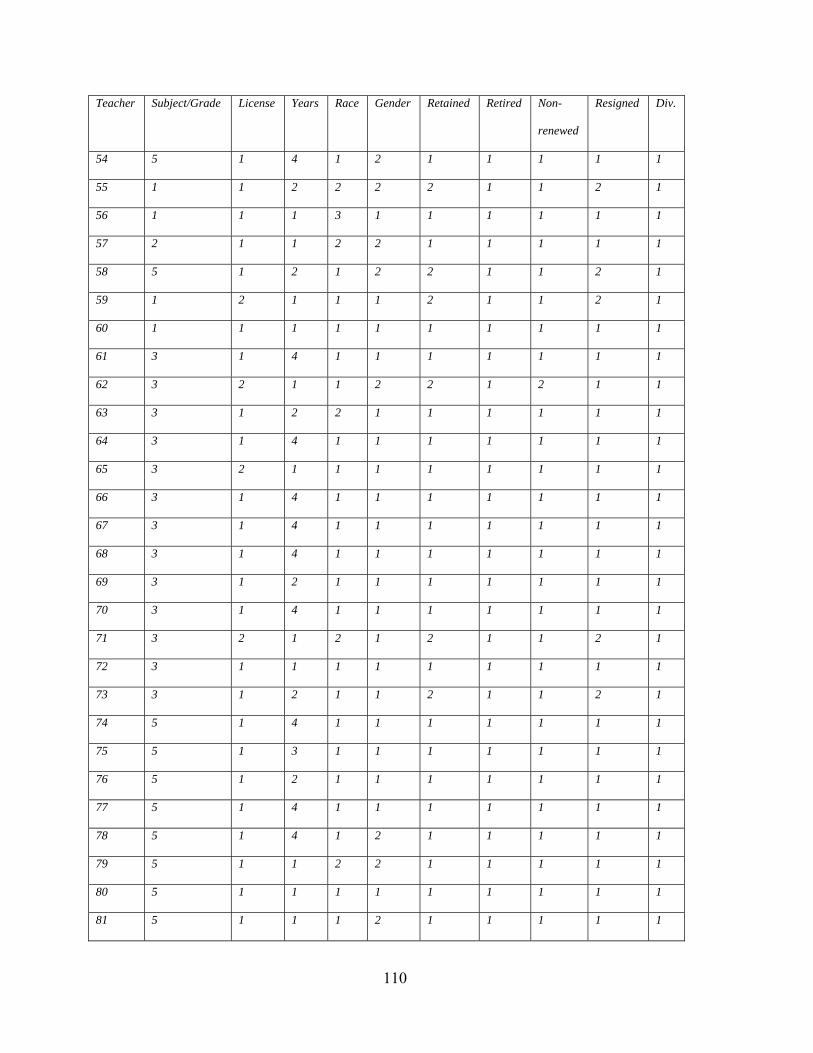
non-renewed. These data are shown in recoded form in Appendix Q.
Mailing of Surveys and Receipt of Surveys
The information received electronically from both school districts revealed that a total
of 54 out of 240 teachers combined left the Surry County and Franklin City School districts
after the 2007-2008 school year. These data submitted also revealed that two of the teachers
from Surry County died during the 2007-2008 school year. Therefore, the researcher mailed
52 surveys with an attached cover letter (Appendix D) on March 3, 2009 to those teachers
who left both school districts after the 2007-2008 school year. A total of 36 teacher survey
responses were received by March 31, 2009.
The researcher then conducted a follow-up mailing on April 3, 2009 to the 16
teachers who did not respond from the initial mailing. The cover letter for the follow-up
mailing is shown in Appendix E. Three additional teacher responses were received by April
17, 2009 in addition to two surveys being returned to sender with no forwarding address.
The researcher then attempted to contact by phone on April 20, 2009 the 13 (including the
two scheduled survey recipients that were returned to sender) teachers that did not respond
from the second mailing. The researcher was able to leave messages for two of the thirteen
teachers to give a return call, but the two teachers did not return the call. Another eight
43
numbers were disconnected and did not have new numbers for the researcher to call. The
researcher did speak with the remaining three teachers. Two of the three teachers indicated
they would return the surveys, but only one actually did. The third teacher indicated that he
would not return the survey. Therefore, the researcher contacted or attempted to contact all
identified (52 teachers) survey recipients and received a total of 40 teacher responses, which
represented a return rate of 77%. Of the forty returned surveys, all 12 questions on each
survey were completed correctly by all 40 respondents and were considered usable for this
study.
Data Results and Analysis
Research Question One: What factors impacted teachers’ decisions to leave two
small school districts in Southeastern Virginia? Descriptive statistics, including cross
tabulation and frequency of responses for survey questions 7, 8, 10, and 12 were used to
identify the factors that impacted teachers’ decisions to leave the Franklin City and Surry
County school districts. Questions 7, 8, 10, and 12 specifically correlate to the factors that
impacted the decisions of teachers to leave both school districts. A total of 40 usable
responses from the surveys were utilized for this study. Surry County had 9 usable
responses, and Franklin City had 31 usable responses.
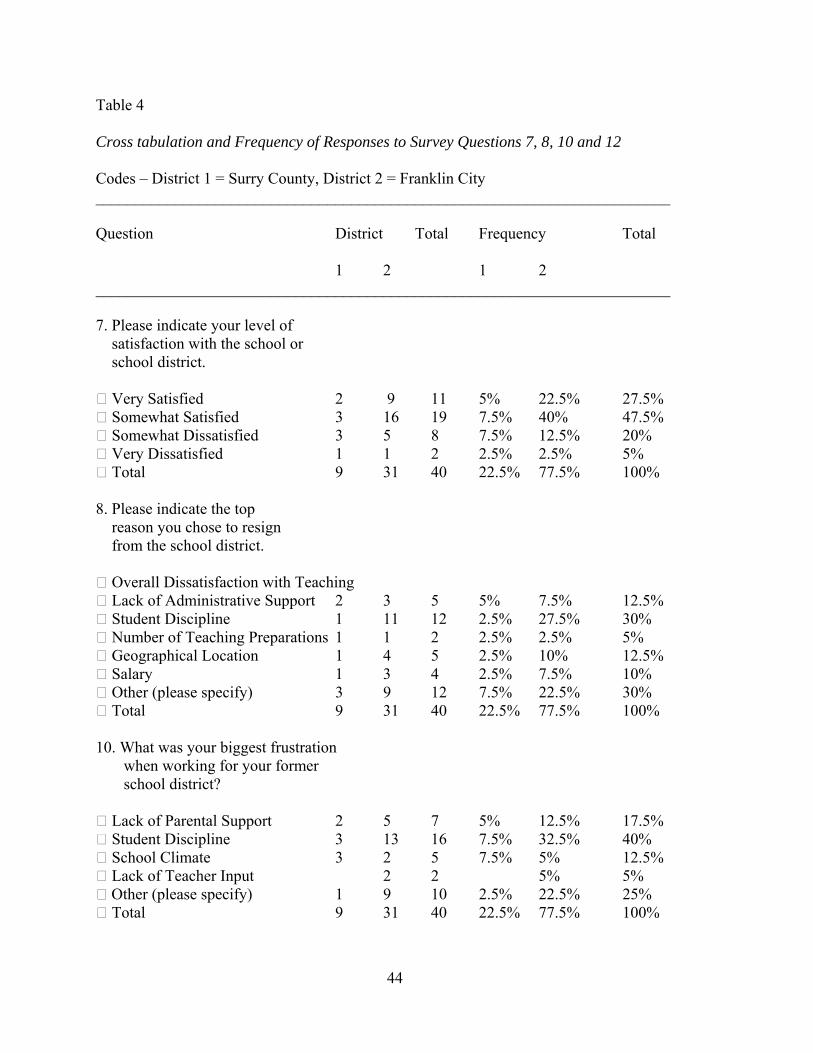
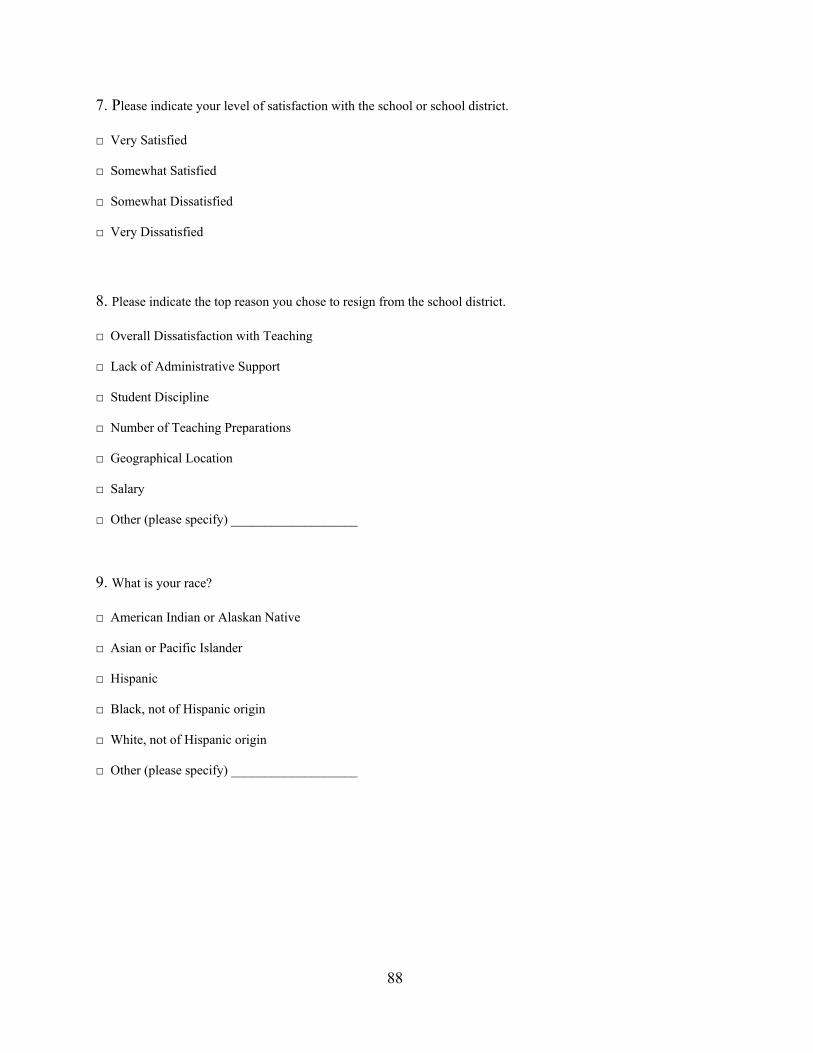
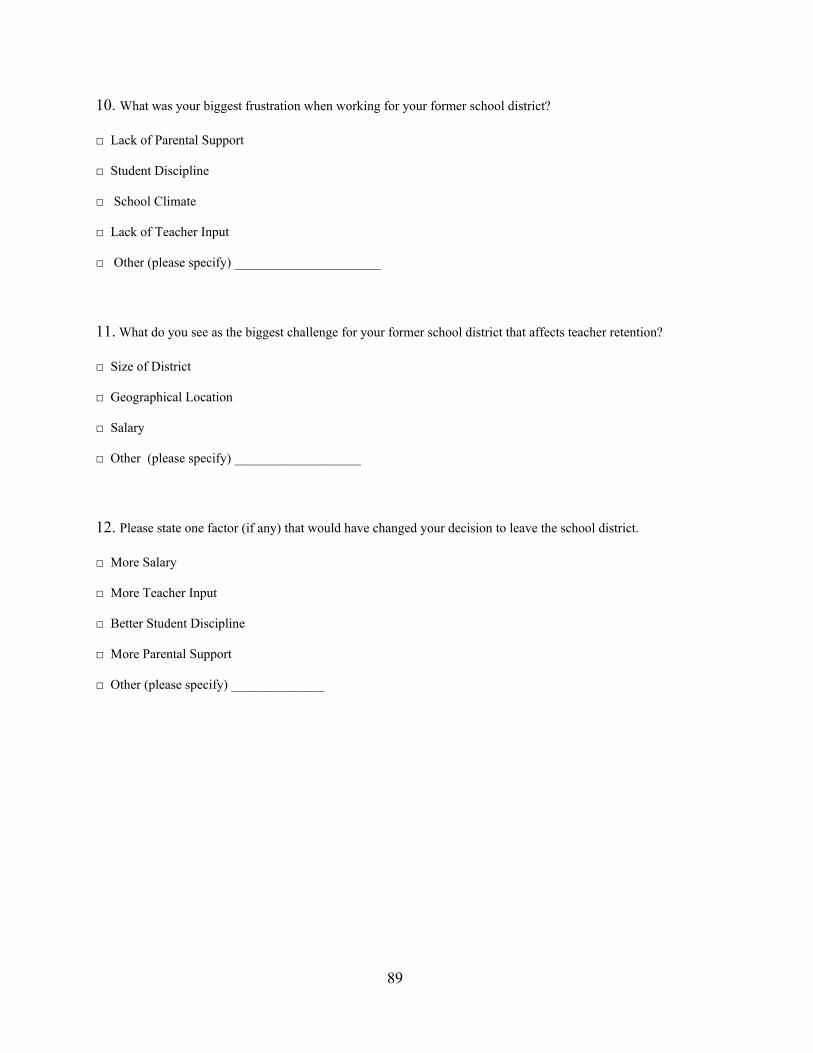
Table 4 illustrates the survey responses to questions 7, 8, 10, and 12. Question 7
data revealed that the majority of teachers were somewhat satisfied or very satisfied with
their school or school district. Question 8 data revealed that student discipline and other
had equal selection from teachers when indicating their top reason for resigning.
Responses to question 8 under other included non-renewal, retirement, student and parent
attitudes, full-time employment and relocation. Question 10 data revealed that student
44
Table 4
Cross tabulation and Frequency of Responses to Survey Questions 7, 8, 10 and 12
Codes – District 1 = Surry County, District 2 = Franklin City ________________________________________________________________________
Question District Total Frequency Total
1 2 1 2 ________________________________________________________________________ 7. Please indicate your level of satisfaction with the school or school district.
Very Satisfied 2 9 11 5% 22.5% 27.5% Somewhat Satisfied 3 16 19 7.5% 40% 47.5% Somewhat Dissatisfied 3 5 8 7.5% 12.5% 20% Very Dissatisfied 1 1 2 2.5% 2.5% 5% Total 9 31 40 22.5% 77.5% 100% 8. Please indicate the top reason you chose to resign from the school district.
Overall Dissatisfaction with Teaching Lack of Administrative Support 2 3 5 5% 7.5% 12.5% Student Discipline 1 11 12 2.5% 27.5% 30% Number of Teaching Preparations 1 1 2 2.5% 2.5% 5% Geographical Location 1 4 5 2.5% 10% 12.5% Salary 1 3 4 2.5% 7.5% 10% Other (please specify) 3 9 12 7.5% 22.5% 30% Total 9 31 40 22.5% 77.5% 100% 10. What was your biggest frustration when working for your former school district?
Lack of Parental Support 2 5 7 5% 12.5% 17.5% Student Discipline 3 13 16 7.5% 32.5% 40% School Climate 3 2 5 7.5% 5% 12.5% Lack of Teacher Input 2 2 5% 5% Other (please specify) 1 9 10 2.5% 22.5% 25% Total 9 31 40 22.5% 77.5% 100%
12. Please state one factor (if any) that would have changed your decision to leave the school district.
More Salary 4 4 10% 10% More Teacher Input 1 1 2.5% 2.5% Better Student Discipline 1 9 10 2.5% 22.5% 25% More Parental Support 1 1 2.5% 2.5% Other 7 17 24 17.5% 42.5% 60% Total 9 31 40 22.5% 77.5% 100% ________________________________________________________________________ discipline was the biggest frustration indicated by teachers. Responses to question 10 under
other included number of at-risk students, student accountability, micromanagement,
increasing demands, inclusion, number of meetings and lack of an appropriate curriculum
and lack of equipment. Question 12 data revealed that the factor selected by teachers by
majority percentage that would have changed their decisions to leave was other. Various
responses were given to question 12 under other including promotion opportunities, non-
renewal, retirement, inclusion, teaching at a different grade level, lack of planning time and
full-time employment.
Research Question Two: What are the major challenges that impact teacher
attrition in two small school districts in Southeastern Virginia as perceived by teachers who
left both school districts? Descriptive statistics, including cross tabulation and frequency of
46
survey responses to question 11 were used to identify the major challenges that impact
teacher attrition in the Franklin City and Surry County school districts as perceived by
teachers who left both school districts. Question 11 specifically correlates to the major
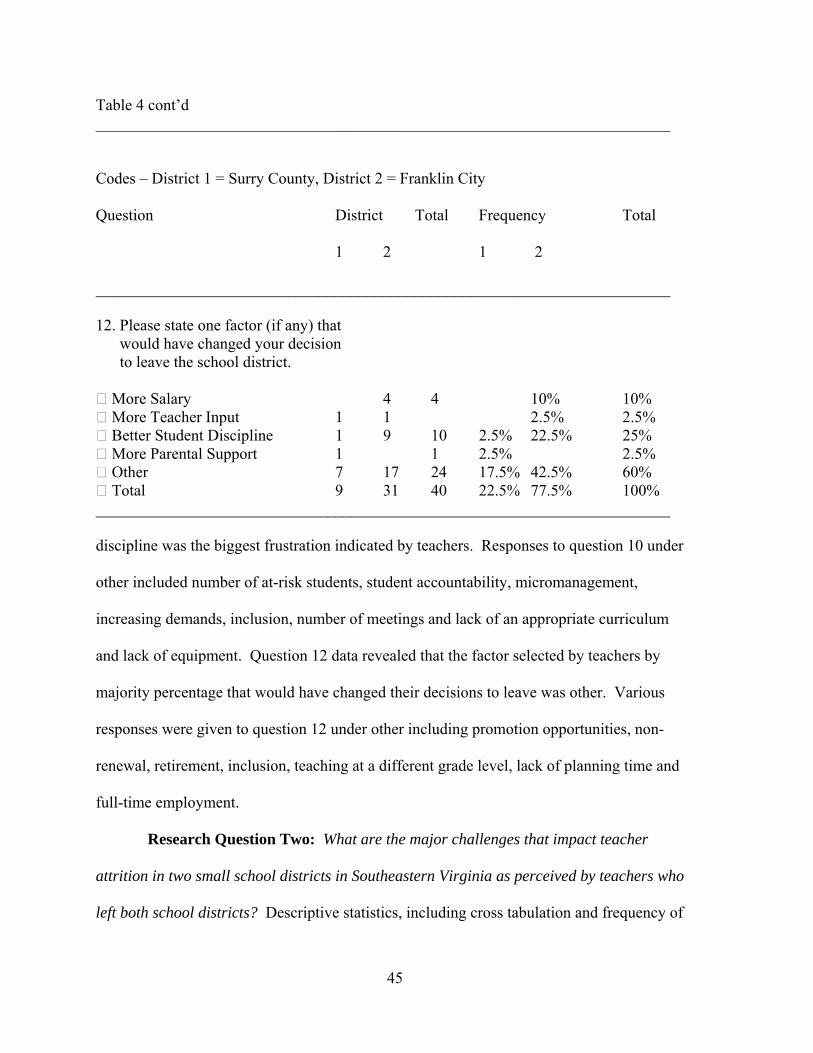
challenges identified by teachers who left both school districts. Table 5 illustrates the
responses to question 11. Question 11 data revealed that the major challenges that affect
teacher retention as perceived by teachers who left both school districts were geographical
location, other and salary. A further breakdown by district showed that the major challenges
identified by teachers in Surry County were geographical location, followed by salary. The
major challenges identified by teachers from Franklin City were other with emphasis on
student discipline and administrative support, followed by geographical location.
Research Question Three. What are the characteristics of those who entered the
teaching profession and then left two small school districts in Southeastern Virginia?
Descriptive statistics, including cross tabulation and frequency of survey responses to
questions 1, 2, and 3 were used to identify the characteristics of those who entered the
teaching profession and then left the Franklin City and Surry County school districts.
Questions 1, 2, and 3 specifically correlate to the characteristics of those who entered
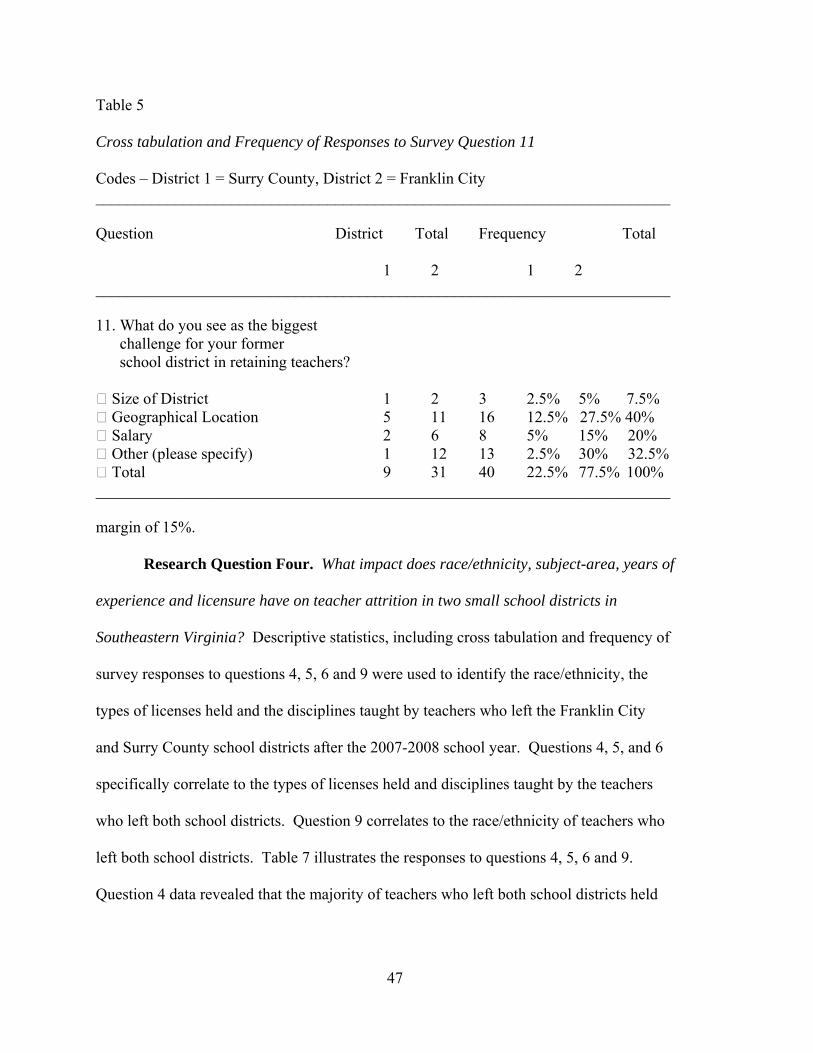
the teaching professions and then left both school districts. Table 6 illustrates the
responses to questions 1, 2, and 3. Question 1 data revealed that the major reason
indicated by teachers who chose to enter the teaching profession and then left both school districts was impacting the lives of children. Question 2 data revealed that a slight
majority of the teachers who left had not gone through student teaching as opposed to those
who went through student teaching. Question 3 data revealed that more teachers had
teachers in their families as opposed to those who didn’t have teachers in their families by a
47
Table 5 Cross tabulation and Frequency of Responses to Survey Question 11 Codes – District 1 = Surry County, District 2 = Franklin City ________________________________________________________________________
Question District Total Frequency Total
1 2 1 2 ________________________________________________________________________ 11. What do you see as the biggest challenge for your former school district in retaining teachers? Size of District 1 2 3 2.5% 5% 7.5% Geographical Location 5 11 16 12.5% 27.5% 40% Salary 2 6 8 5% 15% 20% Other (please specify) 1 12 13 2.5% 30% 32.5% Total 9 31 40 22.5% 77.5% 100% ________________________________________________________________________ margin of 15%.
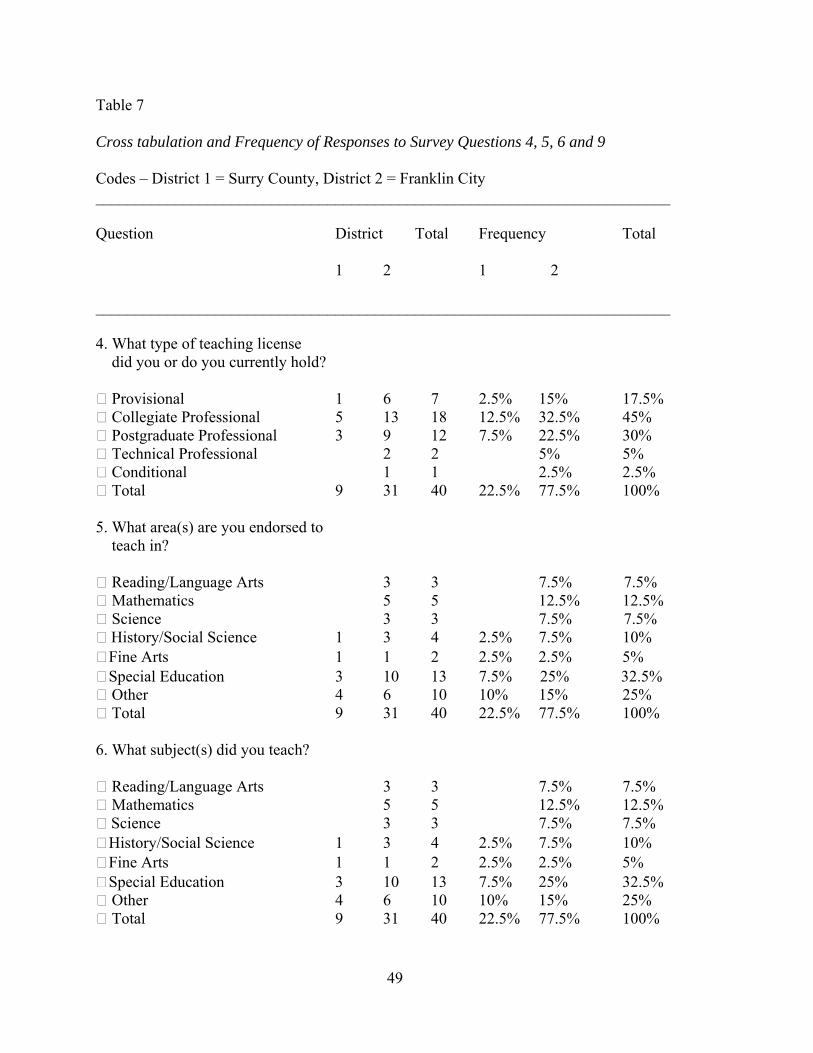
Research Question Four. What impact does race/ethnicity, subject-area, years of
experience and licensure have on teacher attrition in two small school districts in
Southeastern Virginia? Descriptive statistics, including cross tabulation and frequency of
survey responses to questions 4, 5, 6 and 9 were used to identify the race/ethnicity, the
types of licenses held and the disciplines taught by teachers who left the Franklin City
and Surry County school districts after the 2007-2008 school year. Questions 4, 5, and 6
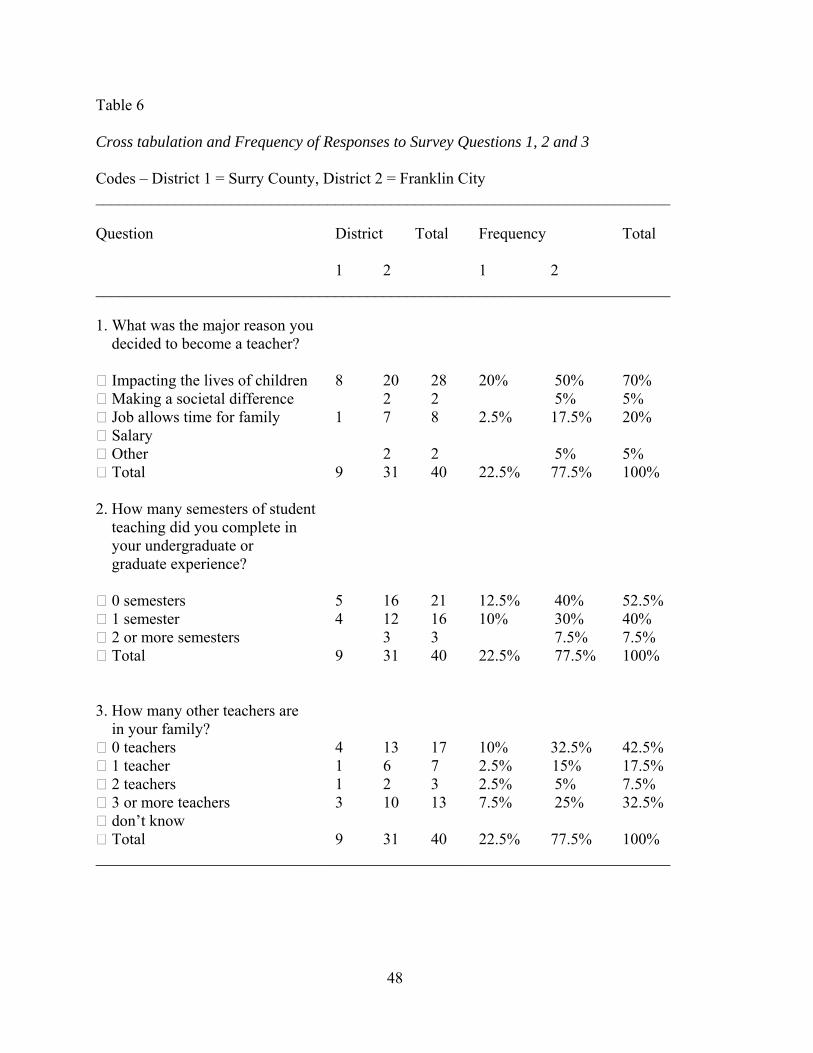
specifically correlate to the types of licenses held and disciplines taught by the teachers who left both school districts. Question 9 correlates to the race/ethnicity of teachers who left both school districts. Table 7 illustrates the responses to questions 4, 5, 6 and 9. Question 4 data revealed that the majority of teachers who left both school districts held
48
Table 6
Cross tabulation and Frequency of Responses to Survey Questions 1, 2 and 3
Codes – District 1 = Surry County, District 2 = Franklin City ________________________________________________________________________
1. What was the major reason you decided to become a teacher? Impacting the lives of children 8 20 28 20% 50% 70% Making a societal difference 2 2 5% 5% Job allows time for family 1 7 8 2.5% 17.5% 20% Salary Other 2 2 5% 5% Total 9 31 40 22.5% 77.5% 100% 2. How many semesters of student teaching did you complete in your undergraduate or graduate experience? 0 semesters 5 16 21 12.5% 40% 52.5% 1 semester 4 12 16 10% 30% 40% 2 or more semesters 3 3 7.5% 7.5% Total 9 31 40 22.5% 77.5% 100% 3. How many other teachers are in your family? 0 teachers 4 13 17 10% 32.5% 42.5% 1 teacher 1 6 7 2.5% 15% 17.5% 2 teachers 1 2 3 2.5% 5% 7.5% 3 or more teachers 3 10 13 7.5% 25% 32.5% don’t know Total 9 31 40 22.5% 77.5% 100% ________________________________________________________________________
49
Table 7
Cross tabulation and Frequency of Responses to Survey Questions 4, 5, 6 and 9 Codes – District 1 = Surry County, District 2 = Franklin City ________________________________________________________________________
Question District Total Frequency Total
1 2 1 2
________________________________________________________________________ 4. What type of teaching license did you or do you currently hold? Provisional 1 6 7 2.5% 15% 17.5% Collegiate Professional 5 13 18 12.5% 32.5% 45% Postgraduate Professional 3 9 12 7.5% 22.5% 30% Technical Professional 2 2 5% 5% Conditional 1 1 2.5% 2.5% Total 9 31 40 22.5% 77.5% 100% 5. What area(s) are you endorsed to teach in? Reading/Language Arts 3 3 7.5% 7.5% Mathematics 5 5 12.5% 12.5% Science 3 3 7.5% 7.5% History/Social Science 1 3 4 2.5% 7.5% 10%
Fine Arts 1 1 2 2.5% 2.5% 5% Special Education 3 10 13 7.5% 25% 32.5%
Other 4 6 10 10% 15% 25% Total 9 31 40 22.5% 77.5% 100%
6. What subject(s) did you teach? Reading/Language Arts 3 3 7.5% 7.5% Mathematics 5 5 12.5% 12.5% Science 3 3 7.5% 7.5%
History/Social Science 1 3 4 2.5% 7.5% 10% Fine Arts 1 1 2 2.5% 2.5% 5% Special Education 3 10 13 7.5% 25% 32.5%
Other 4 6 10 10% 15% 25% Total 9 31 40 22.5% 77.5% 100%
9. What is your race? American Indian or Alaskan Native Asian or Pacific Islander 1 1 2.5% 2.5% Hispanic Black, not of Hispanic origin 5 8 13 12.5% 20% 32.5% White, not of Hispanic origin 4 22 26 10% 55% 65% Other (please specify) Total 9 31 40 22.5 77.5% 100% ________________________________________________________________________
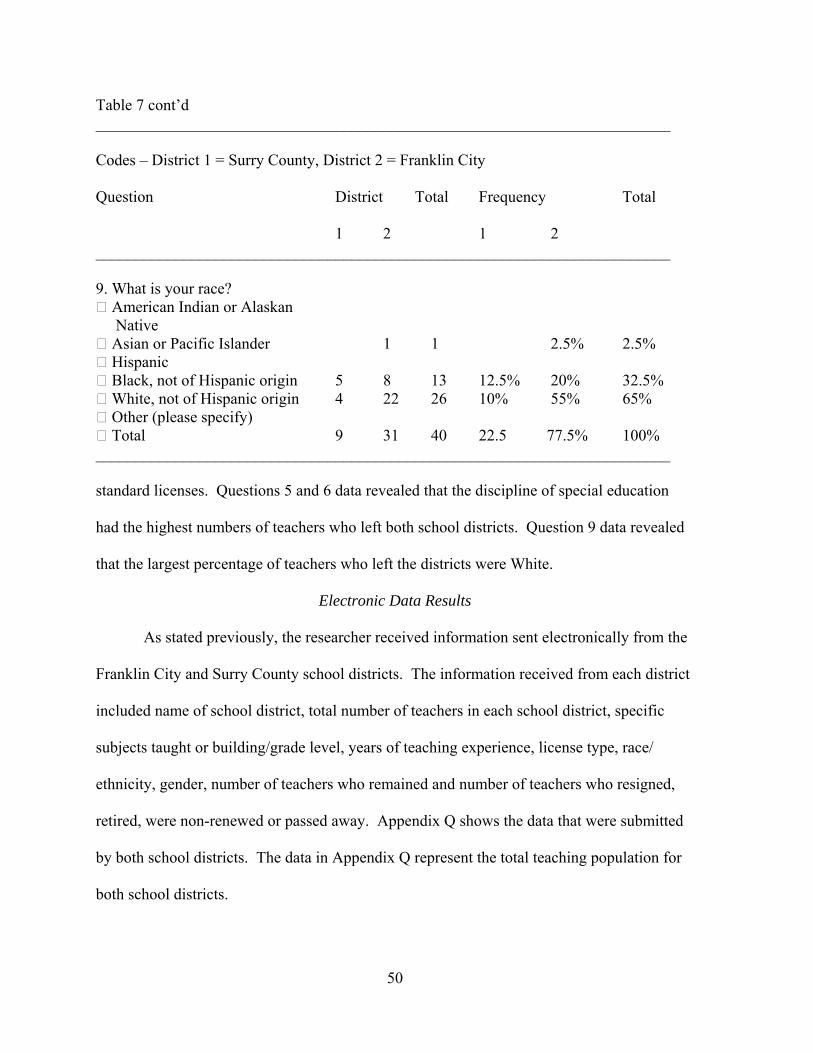
standard licenses. Questions 5 and 6 data revealed that the discipline of special education
had the highest numbers of teachers who left both school districts. Question 9 data revealed
that the largest percentage of teachers who left the districts were White.
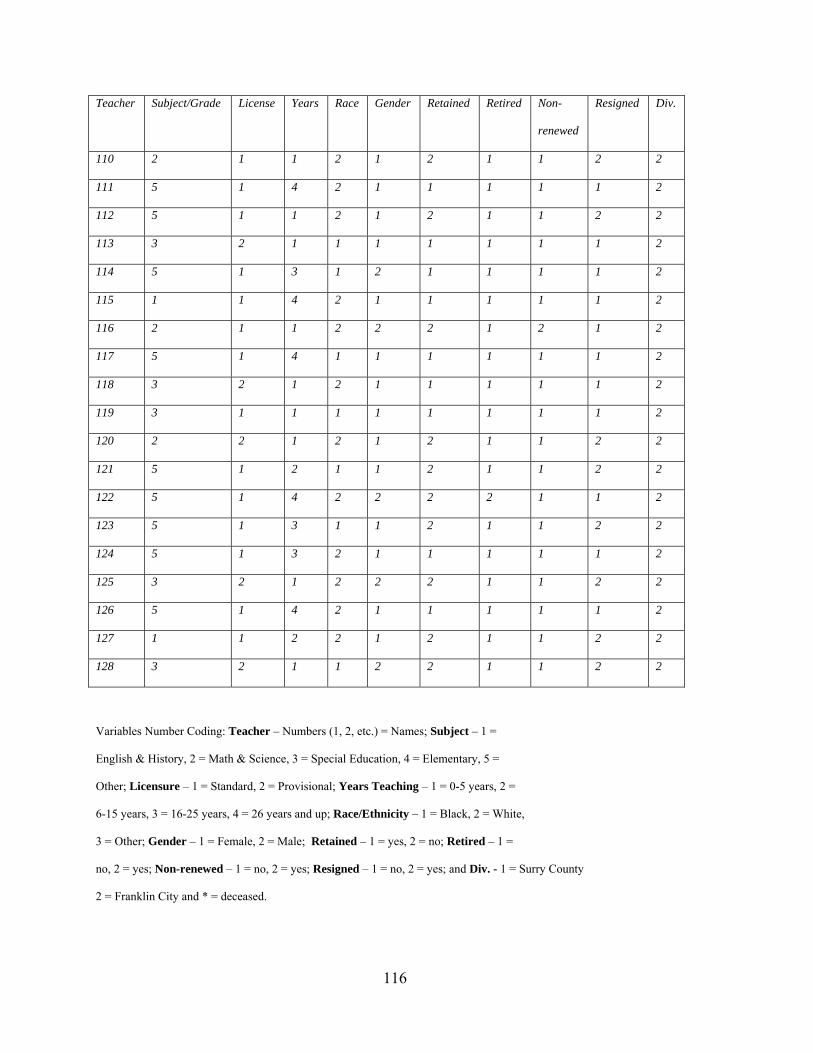
Electronic Data Results
As stated previously, the researcher received information sent electronically from the
Franklin City and Surry County school districts. The information received from each district
included name of school district, total number of teachers in each school district, specific
subjects taught or building/grade level, years of teaching experience, license type, race/
ethnicity, gender, number of teachers who remained and number of teachers who resigned,
retired, were non-renewed or passed away. Appendix Q shows the data that were submitted
by both school districts. The data in Appendix Q represent the total teaching population for
both school districts.
51
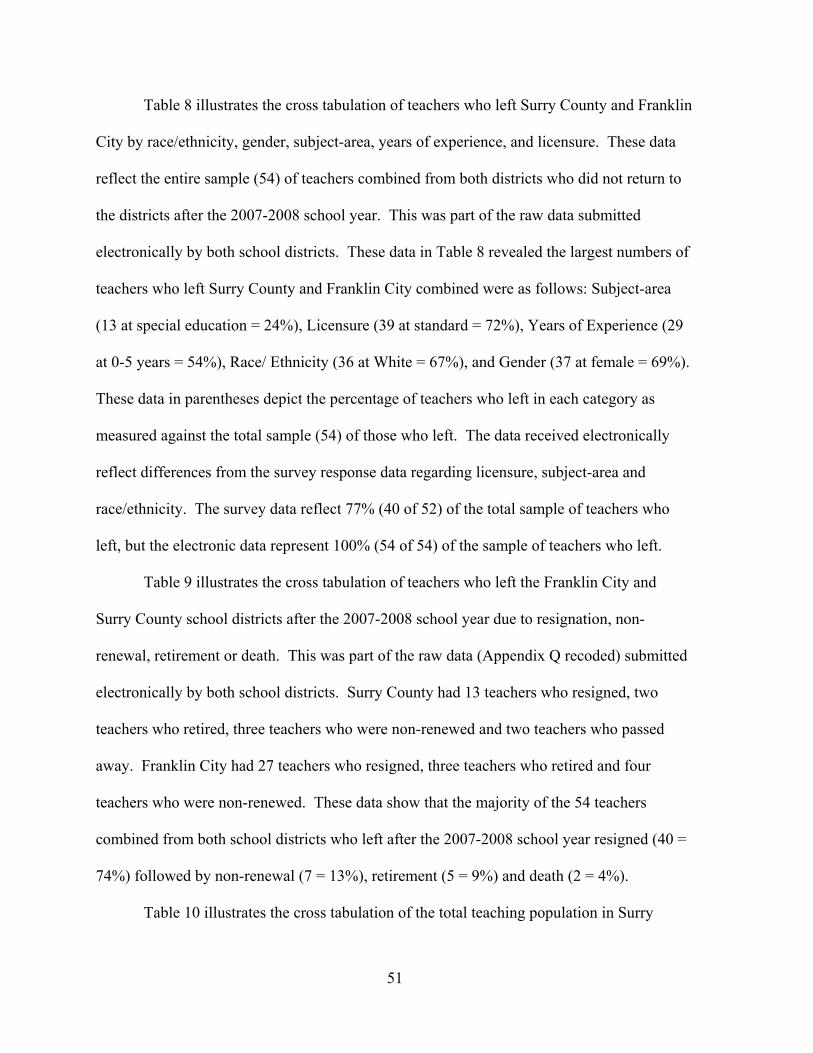
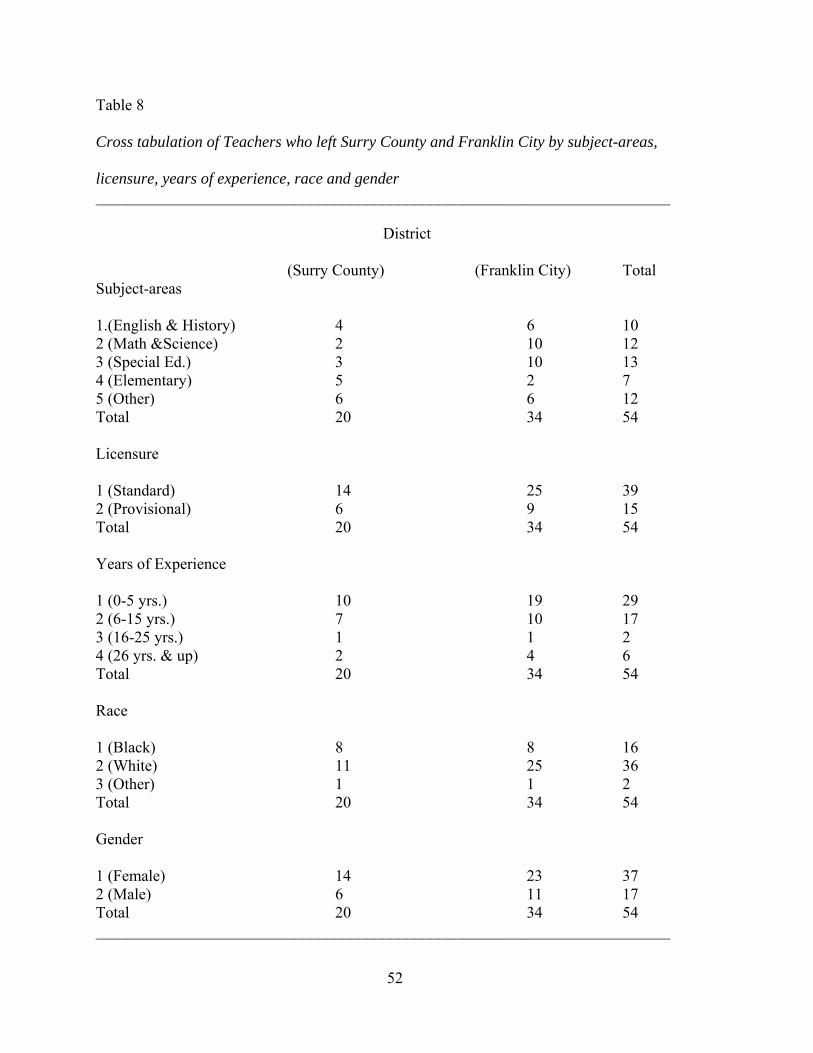
Table 8 illustrates the cross tabulation of teachers who left Surry County and Franklin
City by race/ethnicity, gender, subject-area, years of experience, and licensure. These data
reflect the entire sample (54) of teachers combined from both districts who did not return to
the districts after the 2007-2008 school year. This was part of the raw data submitted
electronically by both school districts. These data in Table 8 revealed the largest numbers of
teachers who left Surry County and Franklin City combined were as follows: Subject-area
(13 at special education = 24%), Licensure (39 at standard = 72%), Years of Experience (29
at 0-5 years = 54%), Race/ Ethnicity (36 at White = 67%), and Gender (37 at female = 69%).
These data in parentheses depict the percentage of teachers who left in each category as
measured against the total sample (54) of those who left. The data received electronically
reflect differences from the survey response data regarding licensure, subject-area and
race/ethnicity. The survey data reflect 77% (40 of 52) of the total sample of teachers who
left, but the electronic data represent 100% (54 of 54) of the sample of teachers who left.
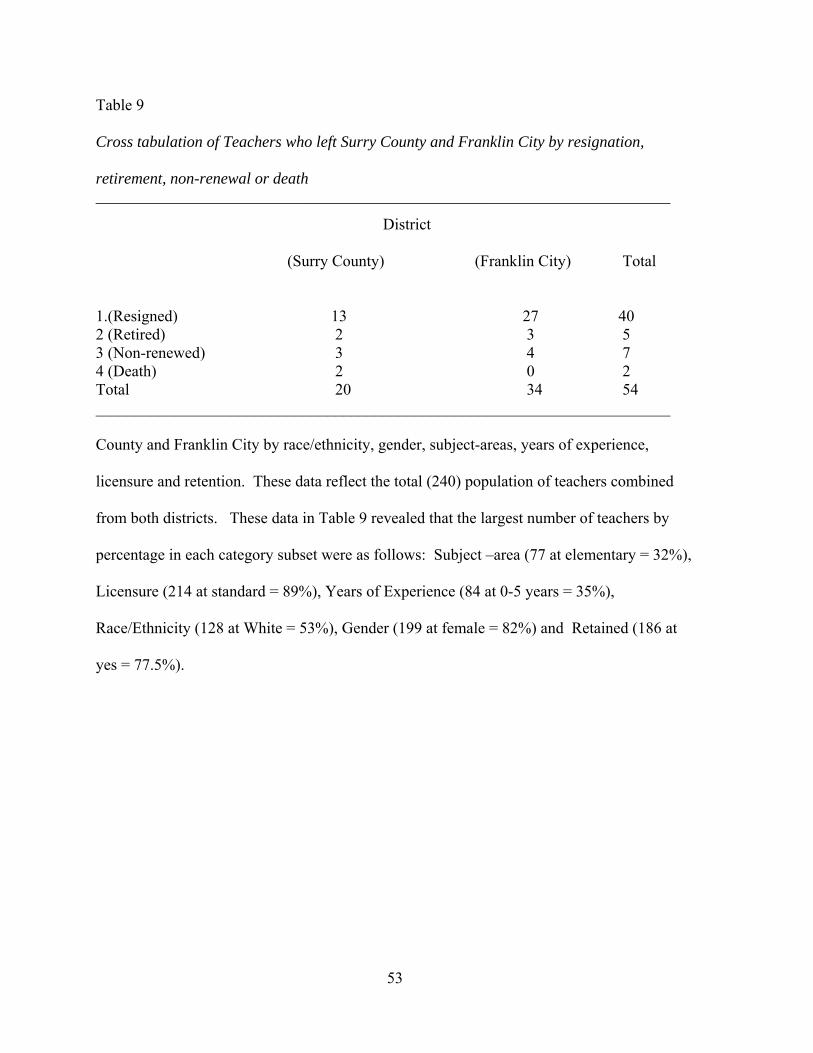
Table 9 illustrates the cross tabulation of teachers who left the Franklin City and
Surry County school districts after the 2007-2008 school year due to resignation, non-
renewal, retirement or death. This was part of the raw data (Appendix Q recoded) submitted
electronically by both school districts. Surry County had 13 teachers who resigned, two
teachers who retired, three teachers who were non-renewed and two teachers who passed
away. Franklin City had 27 teachers who resigned, three teachers who retired and four
teachers who were non-renewed. These data show that the majority of the 54 teachers
combined from both school districts who left after the 2007-2008 school year resigned (40 =
74%) followed by non-renewal (7 = 13%), retirement (5 = 9%) and death (2 = 4%).
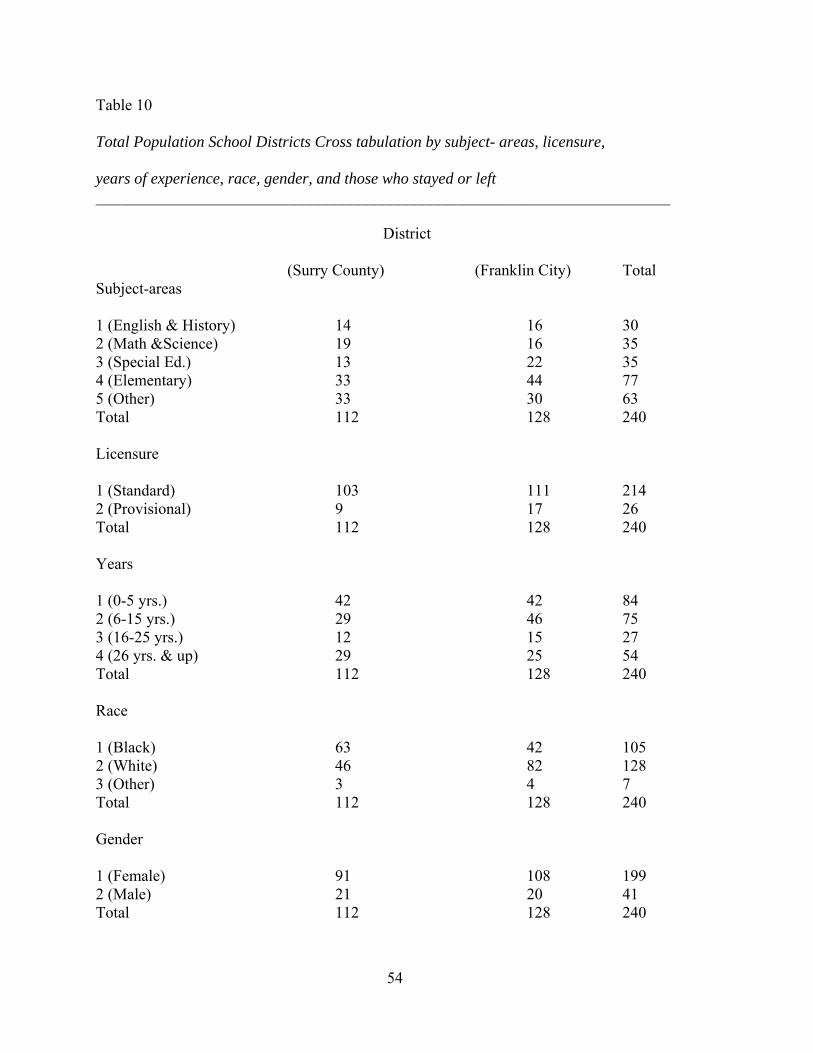
Table 10 illustrates the cross tabulation of the total teaching population in Surry
52
Table 8
Cross tabulation of Teachers who left Surry County and Franklin City by subject-areas, licensure, years of experience, race and gender ________________________________________________________________________
Cross tabulation of Teachers who left Surry County and Franklin City by resignation, retirement, non-renewal or death ________________________________________________________________________
District
(Surry County) (Franklin City) Total 1.(Resigned) 13 27 40 2 (Retired) 2 3 5 3 (Non-renewed) 3 4 7 4 (Death) 2 0 2 Total 20 34 54 ________________________________________________________________________ County and Franklin City by race/ethnicity, gender, subject-areas, years of experience,
licensure and retention. These data reflect the total (240) population of teachers combined
from both districts. These data in Table 9 revealed that the largest number of teachers by
percentage in each category subset were as follows: Subject –area (77 at elementary = 32%),
Licensure (214 at standard = 89%), Years of Experience (84 at 0-5 years = 35%),
Race/Ethnicity (128 at White = 53%), Gender (199 at female = 82%) and Retained (186 at
yes = 77.5%).
54
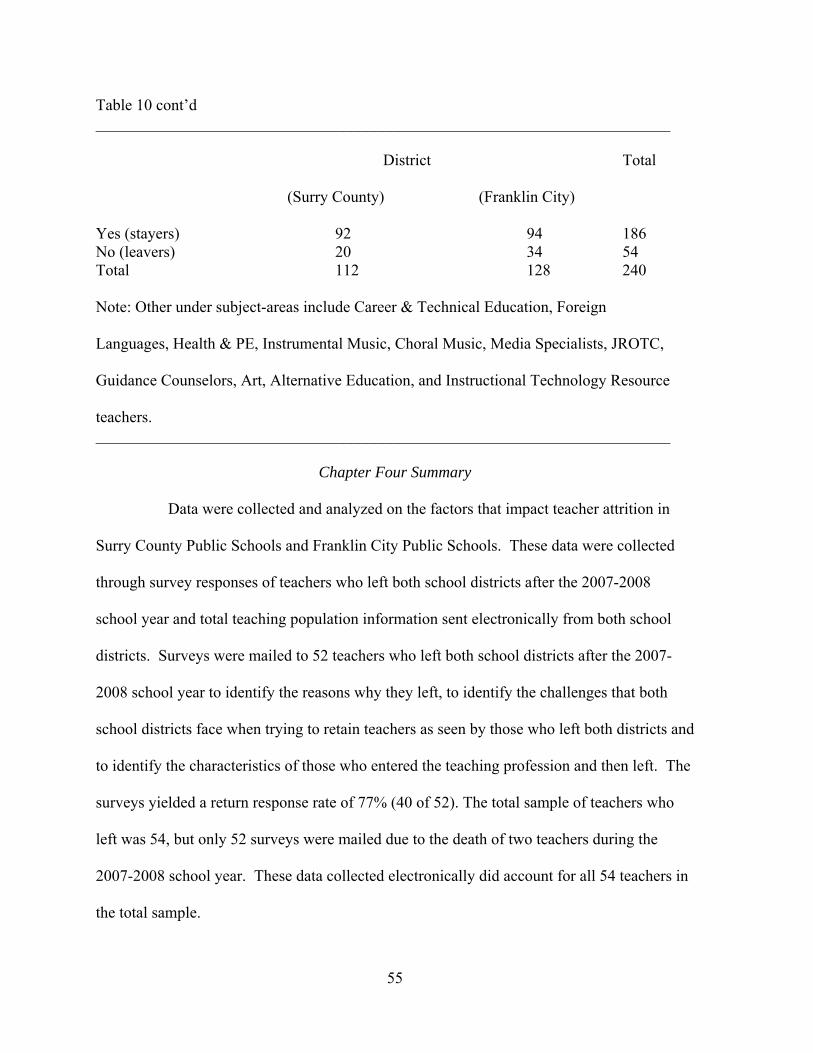
Table 10
Total Population School Districts Cross tabulation by subject- areas, licensure, years of experience, race, gender, and those who stayed or left ________________________________________________________________________
(Surry County) (Franklin City) Yes (stayers) 92 94 186 No (leavers) 20 34 54 Total 112 128 240 Note: Other under subject-areas include Career & Technical Education, Foreign Languages, Health & PE, Instrumental Music, Choral Music, Media Specialists, JROTC, Guidance Counselors, Art, Alternative Education, and Instructional Technology Resource teachers. ________________________________________________________________________
Chapter Four Summary
Data were collected and analyzed on the factors that impact teacher attrition in
Surry County Public Schools and Franklin City Public Schools. These data were collected
through survey responses of teachers who left both school districts after the 2007-2008
school year and total teaching population information sent electronically from both school
districts. Surveys were mailed to 52 teachers who left both school districts after the 2007-
2008 school year to identify the reasons why they left, to identify the challenges that both
school districts face when trying to retain teachers as seen by those who left both districts and
to identify the characteristics of those who entered the teaching profession and then left. The
surveys yielded a return response rate of 77% (40 of 52). The total sample of teachers who
left was 54, but only 52 surveys were mailed due to the death of two teachers during the
2007-2008 school year. These data collected electronically did account for all 54 teachers in
the total sample.
56
Results from the study revealed that a variety of reasons for leaving were given by the
teachers who left both school districts, but a major reason given for leaving was student
discipline. The biggest challenge that both school districts face when trying to retain
teachers as perceived by teachers who left was geographical location. Of the 54 teachers
who left both school districts, the majority were White and female. The majority of teachers
who left both school districts combined had five years or less of total teaching experience.
The majority of the teachers who left indicated they entered the teaching profession with the
desire to impact the lives of children. Further discussion regarding the findings in this
chapter occurs in chapter five.
57
CHAPTER FIVE
FINDINGS, IMPLICATIONS FOR PRACTICE, LIMITATIONS/DELIMITATIONS,
RECOMMENDATIONS FOR FUTURE RESEARCH AND PERSONAL REFLECTIONS
Introduction
Teacher attrition is a problem that many school districts across this nation are faced
with on a yearly basis. Many school districts are having major difficulty retaining the very
best educators. The purpose of this study was to identify the factors that impact teacher
attrition in two small school districts in Southeastern Virginia. This study through survey
responses gathered data from teachers who left both districts after the 2007-2008 school year
on the factors that impacted their decisions to leave and the challenges they perceived both
school districts face that impact teacher attrition. Other data from the survey responses
identified characteristics of the teachers who left both school districts after the 2007-2008
school year. Additionally, 2007-2008 demographic data on the total teacher population in
both school districts were collected from the Human Resources departments of both school
districts. This chapter is divided into five sections. These five sections include a discussion
of findings, implications for practice, limitations/delimitations, recommendations for future
research and personal reflections.
These data collected for this study were used to answer the research questions. The
research questions were as follows:
1. What factors impacted teachers’ decisions to leave two small school districts in
Southeastern Virginia?
2. What are the major challenges that impact teacher attrition in two small school
58
districts in Southeastern Virginia as perceived by teachers who left both school
districts?
3. What are the characteristics of those who entered the teaching profession and then
left two small school districts in Southeastern Virginia?
4. What impact does race/ethnicity, subject-area, years of experience and licensure have
on teacher attrition in two small school districts in Southeastern Virginia?
Findings (Survey Data)
This study found that the majority of teachers in the two small school districts were
satisfied with working in the schools or districts. Data from this study revealed that 75% of
teachers who left combined from both school districts indicated that they were either
somewhat satisfied or very satisfied with their schools or districts. A breakdown by district
showed that five (56%) of nine teachers in Surry County were somewhat satisfied or very
satisfied with their school or district. Twenty-five (81%) of 31 teachers in Franklin indicated
they were somewhat satisfied or very satisfied with their school or district. These data found
in this study are similar to the data found in the MetLife (2006) study that also found that
more than half (56%) of teachers were satisfied with their careers.
This study found that teachers who left Franklin City indicated student discipline and
administrative support were major challenges. In contrast, the survey responses from
teachers in Surry County did not indicate student discipline and administrative support being
major challenges. The Schwartzbeck et al. (2003) and Hammer et al. (2005) studies also did
not indicate student discipline and administrative support as being major challenges.
This study found that the majority of teachers in the two small school districts
indicated student discipline was their biggest frustration. Data from this study revealed that
59
40% of teachers combined from both districts indicated student discipline was their biggest
frustration. A breakdown by district showed that three (33%) of nine teachers in Surry
County indicated student discipline was their biggest frustration. It is interesting to note that
survey responses from teachers in Surry County did not indicate student discipline as being a
major challenge, but did indicate student discipline as being their biggest frustration.
Thirteen (42%) of 31 teachers in Franklin indicated student discipline was their biggest
frustration. These data show that a larger percentage of teachers in Franklin City viewed
student discipline as being a bigger problem than teachers in Surry County. These data found
in this study are similar to the data found in the MetLife (2006) study that also cited a reason
for leaving by teachers was student discipline.
This study found that the majority of teachers who left the two small school districts
indicated geographical isolation was the biggest challenge that impacted teacher attrition.
Data from this study revealed that geographical isolation (40%) was the number one survey
response of teachers who left both school districts. A breakdown by district showed that five
(56%) of nine teachers in Surry County indicated geographical isolation was the biggest
challenge impacting teacher attrition. Eleven (35%) of 31 teachers in Franklin City indicated
geographical isolation was the biggest challenge impacting teacher attrition. These data in
this study are also similar to the data found in the Schwartzbeck et al. (2003) and Hammer et
al. (2005) studies that also indicated that a great challenge for rural school districts was
geographical isolation.
This study found that salary was a challenge reported by teachers who left the two
small school districts that impacts teacher attrition. Data from this study revealed that 20%
of teachers who left both school districts indicated salary was a challenge. A breakdown by
60
district showed that two (22%) of nine teachers in Surry County indicated salary was a
challenge. Six (19%) of 31 teachers in Franklin City indicated salary was a challenge. These
data found in this study are also similar to the data found in the Schwartzbeck et al. (2003)
and Hammer et al. (2005) studies which indicated that salary was a big challenge for rural
school districts that impacts teacher attrition.
This study found that the majority of teachers who left the two small school districts
entered the teaching profession to impact the lives of children. Data from this study revealed
that impacting the lives of children (70%) was the number one survey response from teachers
who left the Franklin City and Surry County Schools’ districts. A breakdown by district
showed that eight (89%) of nine teachers in Surry County chose impacting the lives of
children as the reason they entered teaching. Twenty (65%) of 31 teachers in Franklin City
chose impacting the lives of children as the reason they entered teaching. These data found
in this study are similar to the data found in the King (1993) study that revealed through
survey responses (73%) that contributing to the betterment of society by impacting the lives
of young people was a major reason for entering the teaching profession.
This study found that teachers who left the two small school districts indicated
that teaching allows time for family as being another reason for entering the teaching
profession. Data from this study revealed that the job allows time for family (20%) was the
second highest survey response from teachers who left the Franklin City and Surry County
Schools’ districts. A breakdown by district showed that one (11%) of nine teachers in Surry
County chose teaching because it allows time for family as the reason he/she entered
teaching. Seven (23%) of 31 teachers in Franklin City chose teaching because it allows time
for family as the reason they entered teaching. These data found in this study are similar to
61
the data found in the Farkas et al. (2000) study which also revealed through survey responses
(81%) that teaching allows time for family was a major reason for entering the teaching
profession. Teaching allows time for family was also the second highest survey response in
the Farkas et al. (2000) study.
This study found that the majority of teachers who left the two small school districts
had not done student teaching. Data from this study revealed that 52.5% of survey
respondents did not have student teaching experience. A breakdown by district showed that
five (56%) of nine teachers in Surry County did not have student teaching experience.
Sixteen (52%) of 31 teachers in Franklin City did not have student teaching experience.
Many public school teachers have gone through traditional teacher preparation programs to
become teachers. The state of Virginia has several methods in which one may obtain a
teaching license without having to go through student teaching. These include one year of
successful classroom teaching experience in lieu of student teaching, experiential learning,
career switcher programs and alternative licensure options (Virginia Department of
Education, 2007).
This study found that the majority of teachers who left the two small school districts
had one or more teachers in their families. Data from this study revealed that 57.5% of
survey respondents had one or more teachers in their families. A breakdown by district
showed that five (56%) of nine teachers in Surry County had one or more teachers in their
families. Eighteen (58%) of 31 teachers in Franklin City had one or more teachers in their
families. These data from this study revealed that having teachers in one’s family does not
necessarily have an impact on reducing teacher attrition.
This study found other reasons cited by teachers who left both school districts
62
included lack of teacher input, lack of an appropriate curriculum, lack of equipment and lack
of parental and administrative support. These data are similar to the data found in the
Johnson and Birkeland (2003) and MetLife (2006) studies. The Johnson and Birkeland
(2003) study indicated that factors cited by teachers who either moved from one school
district to another or left the profession entirely included poor working conditions and
inadequate support. The MetLife (2006) study indicated reasons for leaving cited by teachers
included professional prestige, lack of resources, being ill-prepared to work with children of
varying abilities, lack of teacher input in decision making and lack of parental and
administrative support.
This study found that special education teachers had the highest rate of attrition when
comparing by disciplines of those who left after the 2007-2008 school year. Specifically, 13
of 40 survey respondents who left both school districts taught special education. These data
are similar to the data found in the Schwartzbeck et al. (2003) and Hammer et al. (2005)
studies which both indicated the academic discipline that posed the greatest staffing
challenge for rural areas is special education.
Findings (Electronic Data)
This study found that White teachers left both school districts at a rate
disproportionate to the percentage of Whites in the overall population of teachers. Whites
accounted for 53% (128 of 240) of the overall teaching population, but left at a 69% (37 of
54) rate. This also held true when broken down by individual school district. These data
revealed that White teachers had a higher rate of attrition in both school districts than any
other race/ethnicity. The numbers of Whites who left both school districts included all
reasons for leaving such as those who retired, were non-renewed or may have gone to other
63
school districts. In contrast, the NCES (2007) study found that Blacks (11.0%) left the
teaching profession more frequently than Whites (8.2%) or any other race/ ethnicity.
This study found that the majority of the total teacher population in Surry County was
Black. Data from this study revealed that 56% (63 of 112) of the total teaching population in
Surry County was Black. This means that Surry County had more Black (56%) teachers than
teachers from any other race/ethnicity. These data are in sharp contrast to the total teacher
population data for Franklin City as well as specific studies discussed in the review of
literature on the overall racial makeup of the American teaching labor force. The total
teaching population data for Franklin City revealed that 64% (82 of 128) teachers in the
district were White. The Rong and Preissle (1997) study and the NCES (2007) study found
that minorities were underrepresented in the American teaching labor force. Education
Commission of the States’ (2005) study indicated the nation’s teaching workforce was
predominantly White (86%).
This study found that male teachers left both school districts at a rate disproportionate
to the percentage of males in the overall population of teachers. Males accounted for 17%
(41 of 240) of the overall teaching population, but left at a 31% (17 of 54) rate. This also
held true when broken down by individual school district. These data revealed that male
teachers had a higher rate of attrition in both school districts than any other race/ethnicity.
These data found in this study are similar to the data found in the NCES (2007) study that
also found males as compared to females had the highest rate of teacher attrition when
comparing to the overall teaching population by gender. Specifically, 126,000 (16%) of
787,700 male teachers in the NCES (2007) study either moved to other school females who
either moved to other school districts or left the teaching profession .
64
This study found that the majority of teachers combined in the two small school
districts were female. These data from this study revealed that the school districts combined
percentage of female teachers in Franklin City and Surry County was 83% (199 of 240).
These data in this study are also similar to that of the NCES (2007) study that found females
accounted for 76% (2,431,200 of 3,214,900) of the American teacher labor force. The
Broughman and Rollefson (2000), Flyer and Rosen, (1997) and Henke et al. (2000) studies
found that the majority of individuals in the teaching profession were female. This means
that male teachers were vastly underrepresented in the total teaching population in this study
as well as in the studies from the review of literature.
This study found that Franklin City and Surry County had a combined teacher
attrition rate of 22.5% for the 2007-2008 school year. Data from this study regarding teacher
retention in the two small school districts are illustrated in Table 10. A breakdown by district
showed that Surry County had a teacher attrition rate of 18% (20 of 112 left) after the 2007-
2008 school year. Franklin City had a teacher attrition rate of 27% (34 of 128 left) after the
2007-2008 school year. These data found in this study revealed that Surry County and
Franklin City had higher teacher attrition rates (meaning lower retention rates) than the
Virginia state (16%) teacher attrition rate as reported by Alliance for Excellent Education
(2005) and the national (16.5%) teacher attrition rate as shown in the NCES (2007) study.
This study found that provisionally licensed teachers left both school districts at a rate
disproportionate to the percentage of provisionally licensed teachers in the overall
population. Provisionally licensed teachers accounted for 9% (21 of 240) of the overall
teaching population, but left at a 17% (9 of 54) rate. This also held true when broken down
by individual school district. These data revealed that provisionally licensed teachers had a
65
higher rate of attrition in both school districts than teachers who held standard licenses.
These data found in this study are similar to the data found in the NCES (2007) study which
also revealed that a higher percentage (23%) of teachers in the American teacher labor force
that either moved from one school district to another or left the teaching profession altogether
held provisional licenses (47,200 of 206,700) as opposed to teachers (15 %) who held
standard licenses (434,900 of 2,814,900).
This study found that the majority (54%) of teachers (29 of 54) who left the two small
school districts after the 2007-2008 school year combined had five years or less of total
teaching experience. The total population of teachers combined from both school districts
also revealed that the largest percentage of teachers (35%) in teaching span was those who
had five years or less of total teaching experience. Data from this study regarding years of
experience of those who left the two small school districts are illustrated in Table 11. A
breakdown by district showed that Surry County had 50% (10 of 20) of teachers who left had
five years or less of total teaching experience. Franklin City had 56% (19 of 34) of teachers
who left had five years or less of total teaching experience. These data found in this study
are similar to the data found in the studies (Kirby & Grissmer, 1993; Mark & Anderson,
1977; Rabinowitz & Crawford, 1960; Schlecty & Vance, 1981 & Hanushek et al., 2001) that
also showed that the highest rate of teacher attrition occurred in those teachers who had five
years or less of total teaching experience.
66
Table 11
School Districts Cross tabulation with Percentages within Selected Subgroups ________________________________________________________________________
Rabinowitz & Crawford, 1960; Schlecty & Vance, 1981; & Hanushek et al., 2001) found that
the highest rate of teacher attrition occurred in those teachers who had five years or less of
total teaching experience, and that student discipline and lack of administrative support were
factors cited by teachers that impacted their decisions to leave their respective school
68
districts.
3. Small and rural school districts should continuously emphasize to their local Boards of
Supervisors or City Councils the importance of offering competitive salaries that match or
exceed the salaries of their larger urban and suburban counterparts. The results from this
study and studies discussed in the review of literature (Schwartzbeck et al., 2003; & Hammer
et al., 2005) found that geographical location and low salaries were major challenges that
impacted teacher attrition in small and rural school districts.
4. School districts should continuously place emphasis on bringing to the districts those
teachers who have gone through teacher preparation programs in their undergraduate or
graduate courses of study whenever possible. Although the state has various routes to
licensure, this study found that higher teacher attrition rates existed among teachers who do
not go through a traditional teacher preparation program. This could be an underlying factor
that increases teacher attrition.
5. School districts that serve high minority student populations should place greater emphasis
on improving or developing strategies that improve their retention rates regarding White
teachers. This study found that White teachers left both school districts at a disproportionate
rate when comparing by race/ethnicity to the overall teaching population. This is in contrast
to the NCES (2007) study that found Blacks (11.0%) left the teaching profession more
frequently than Whites (8.2%) or any other race/ ethnicity.
6. School districts should constantly share best practices that have shown to have an impact
on reducing attrition of minority teachers. This study found that Surry County had more
minority teachers in their school district than any other race/ethnicity. In contrast, Franklin
City and studies in the review of literature (Rong & Preissle, 1997; & Education Commission
69
of the States, 2005) found that Whites accounted for the largest percentage of teachers. This
information shows that Surry County may have strategies that if shared could possibly help
other school districts reduce their attrition rate of minority teachers.
7. School districts should place greater emphasis on improving or developing strategies that
improve their retention rates regarding male teachers. The results from this study and the
NCES (2007) study found that male teachers either moved from their school districts to other
school districts or left the profession of teaching altogether more frequently than female
teachers.
8. School districts should continuously place emphasis on bringing those teachers to the
districts that have standard licenses whenever possible. This study and the NCES (2007)
study found that higher teacher attrition rates existed among teachers who held provisional
licenses as opposed to those who held standard licenses.
Limitations/Delimitations
Limitations to this type of methodology included a lack of flexibility by analyzing
numbers, which gave a sense of rigidness. In addition, limitations to this study included
having a small sample size and analyzing data from only two school districts. Limitations to
this study also included having only a 50% return rate of teacher surveys from those who left
the Surry County Public Schools district after the 2007-2008 school year.
Recommendations for Future Research
The following depicts recommendations for future research.
1. A similar study could be conducted that is expanded to include all small and rural school
districts in Virginia to determine if other small and rural districts have similar challenges to
the challenges that were found in this study regarding teacher attrition.
70
2. A study could be conducted that measures the impact teacher attrition has on schools or
school districts abilities in meeting Adequate Yearly Progress (AYP) benchmarks as defined
by “No Child Left Behind”.
3. A study could be conducted that measures the impact the United States economy and state
budget shortfalls have on teacher attrition. Both Surry County and Franklin City saw a
decrease in teachers who left the school districts after the 2008-2009 school year as
compared to the 2007-2008 school year. Specifically, Surry County had 20 (18%) teachers
who left after the 2007-2008 school year, but only 14 (12.5%) left after the 2008-2009 school
year (P. Barnes, personal communication, August 11, 2009). Franklin City had 34 (27%)
teachers who left after the 2007-2008 school year, but only 22 (17%) left after the 2008-2009
school year.
4. Ongoing research could be conducted to determine if percentages of teachers leaving
school districts increase due to the race/ethnicity of the students in the school districts. C.
Kirabo Jackson (2009) conducted a study that studied patterns of teacher movement in the
Charlotte-Mecklenburg (North Carolina) school system between 2002 and 2003 when the
school district ended its policy on busing that promoted racial integration. The results of the
study revealed that the schools that had an increase in Black student enrollment saw a
decrease in highly qualified teachers, which was measured by years of experience and
licensure. In comparison, this study found that the majority of teachers who left Surry
County and Franklin City after the 2007-2008 school year had five years or less of total
teaching experience. Surry County and Franklin City also had predominantly African-
American student populations.
71
5. A study could be conducted to determine if minority teachers feel more comfortable
working in school districts that serve predominantly minority student populations as opposed
to school districts that serve predominantly non-minority student populations.
6. A follow-up study could be conducted on these two school divisions (Surry County and
Franklin City) that illustrates annually the number of teachers who leave both school districts
and go to other school districts or leave the teaching profession altogether.
Personal Reflections
I wanted to conduct this study on teacher attrition due to the fact that I currently
serve in the capacity of assistant superintendent for human resources and administrative
services in Franklin City Public Schools. I have seen a high attrition rate of teachers in the
District over the past few years. Through empirical research, I wanted to determine if those
factors identified in the review of literature that was said to impact teacher attrition had
impact on teacher attrition in Franklin City and Surry County. In addition, I wanted to see
if school districts with similar characteristics experienced similar challenges regarding
teacher attrition.
After conducting this study, I was surprised to find that Surry County had a larger
percentage of Black teachers than White teachers in the school district. This finding was in
contrast to the percentage of Black teachers in Franklin City and the national research on
percentages of teachers by race/ethnicity. I was also surprised to find that Franklin City had
a significantly higher teacher attrition rate than Surry County. Overall, this experience has
been rewarding and challenging, and has made me have an even greater appreciation for
scholarly research. I really felt ownership of this study when I got to chapter four, where I
was actually able to conduct this study and examine the results. In conclusion, I hope this
72
study can be used to guide educational practice and facilitate future research on teacher
attrition.
73
References
Alliance for Excellent Education. (2005). Teacher Attrition: A Costly Loss to the Nation and to the States. Issue Brief, Retrieved May 25, 2008 from http://www.all4ed.org/files/archive/publications/TeacherAttrition.pdf American Association of School Administrators. (1999). AASA online advocacy.
Retrieved October 8, 2007 from
http://www.ericdigests.org/2000-4/rural.htm
American Association for Employment in Education. (2003). Executive Summary: Educator
Supply & Demand Research. Retrieved October 12, 2007 from
Darling-Hammond, L. (1984). Beyond the commission reports: The coming crisis
in teaching. Santa Monica, CA: Rand Corporation.
Darling-Hammond, L. (1999). Teacher quality and student achievement. A review
of state policy evidence. Education Policy Analysis Archives 8. Retrieved July
5, 2008 from http://epaa.asu.edu/epaa/v8n1/
Education Commission of the States. (2005). Eight Questions on Teacher
Recruitment and Retention: What Does the Research Say? Denver, CO.
Farkas, S., Johnson, J., & Foleno, T. (2000). A sense of calling: Who teaches and why. New York: Public Agenda Flyer, F., & Rosen, S. (1997). The new economics of teachers and education. Journal of Labor Economics, 15(1), S104-139 Giacometti, K. (2005). Factors Affecting Job Satisfaction and Retention of Beginning Teachers. doctoral dissertation, Virginia Tech, Blacksburg, VA. Gitomer, D., Latham, A., & Ziomek, R. (1999). The academic quality of
75
prospective teachers: The impact of admissions and licensure testing. Princeton, NJ: Educational Testing Service. Guarino, C., Santibañez, L., & Daley, G. (2006). Teacher Recruitment and Retention: A Review of the Recent Empirical Literature. Review of Educational Research, Vol. 76. No.2, pp.173-208. Haggstrom, G., Darling-Hammond, L., & Grissmer, D. (1988). Assessing teacher supply and demand (R-3633-ED/C578). Santa Monica, CA: RAND. Hammer, P., Hughes, G., McClure, C., Reeves, C., & Salgado, D. (2005). Rural Teacher Recruitment and Retention Practices: A Review of the Research Literature, National Survey of Rural Superintendents, and Case Studies of Programs in Virginia. Appalachia Educational Laboratory at Edvantia. (ERIC Document Reproduction Service No. ED 489143) Hanushek, E. A., Kain, J. F., & Rivkin, S. G. (2001). Why public schools lose teachers. (NBER Working Paper 8599). Cambridge, MA: National Bureau of Economic Research. Henke, R., Zahn, L., & Carroll, C. (2001). Attrition of new teachers among recent
college graduates: Comparing occupational stability among 1992-1993 college graduates who taught and those who worked in other occupations. Washington, DC: National Center for Education Statistics.
Ingersoll, R. (2003). Is There Really a Teacher Shortage? A Research Report co- Sponsored by the Center for the Study of Teaching and Policy and the Consortium for Policy Research in Education. Retrieved April 1, 2008 from http://depts.washington.edu/ctpmail/PDFs/Shortage-RI-09-2003.pdf
76
Ingersoll, R., & Smith, T. (2003). What are the effects of induction and mentoring programs for new teachers? Retrieved November 3, 2007 from http://www.ecs.org/clearinghouse/50/36/5036.htm Jackson, C. K. (2009). Do Good Teachers Leave When Black Students Enroll? Journal of Labor Economics, 27(2) pp. 213-256 Johnson, S., & Birkeland, S. (2003). Pursuing a “sense of success”: New teachers
explain their career decisions. American Educational Research Journal, 40(3), 581-617. King, S. (1993). Why did we choose teaching careers and what will enable us to stay? Insights from one cohort of the African-American teaching pool. Journal of Negro Education, 62(4), 475-492. Kirby, S., Berends, M., & Naftel, S. (1999). Supply and demand of minority teachers In Texas: Problems and prospects. Educational Evaluation and Policy Analysis, 21(1), 47-66. Kirby, S., & Grissmer, D. (1993). Teacher attrition: Theory, evidence, and suggested policy options. Santa Monica, CA-Rand Corporation, Center for the study of the Teacher Profession. Lankford, M., Loeb, S., & Wyckoff, J. (2002). Teacher sorting and the plight of urban schools: A descriptive analysis. Educational Evaluation and Policy Analysis, 24(1), 37-62. Mark, J., & Anderson, N. (1977). Teacher survival rates: A current look. The American Educational Research Journal, 15, 379-383. McKinney, S. E., Berry, R. Q., Dickerson, D. L., & Campbell-Whately, G. (2007).
77
Addressing urban high-poverty school attrition by addressing urban high- poverty school teacher retention: why effective teachers persevere.
Educational Research and Review Vol.3 (1), pp.001-009, January 2007 Retrieved July 8, 2008 from http://www.academicjournals.org/ERR/PDF/pdf%202008/Jan/McKinney%20et%20al.pdf MetLife. (2006). The MetLife Survey of the American Teacher, 2006: Expectations and Experiences. Retrieved December 12, 2008 from www.metlife.com/teachersurvey MetLife. (2008). Study of Employee Benefits Trends. Retrieved December 12, 2008 from http://www.whymetlife.com/trends/study.asp Murphy, P., & Angelski, K. (1996/1997). Rural teacher mobility: A report from British Columbia. Rural Educator, 18. National Academy of Sciences. (1987). Toward understanding teacher supply and demand. Washington, DC: National Academy Press. National Center for Education Statistics. (2005a). District Detail for Franklin City
Public Schools. Office of Educational Research & Improvement, United States Department of Education, Retrieved December 14, 2008 from
http://nces.ed.gov/ccd/districtsearch/district_detail.asp National Center for Education Statistics. (2005b). District Detail for Surry County Public Schools. Office of Educational Research & Improvement, United States Department of Education, Retrieved December 14, 2008 from http://nces.ed.gov/ccd/districtsearch/district_detail.asp National Center for Education Statistics. (2007). Teacher Attrition and Mobility: Results from the 2004-05 Teacher Follow-up Survey. United States
78
Department of Education. Retrieved February 26, 2009 from http://nces.ed.gov/pubs2007/2007307.pdf National Commission on Excellence in Education. (1983). A nation at risk: The imperative for education reform. Washington, DC: Government Printing Office. National Commission on Teaching and America’s Future. (1997). Doing what matters most: Investing in quality teaching. Retrieved September 30, 2007
from http://www.nctaf.org/ National Commission on Teaching and America’s Future. (2003). No dream denied: A Pledge To America’s children. (Summary Report). Retrieved September 30, 2007 from http://www.nctaf.org/documents/no-dream-denied_summary_report.pdf Neill, J. (2007). Qualitative versus Quantitative Research: Key Points in a Classic
Debate. Retrieved November 13, 2009 from http://wilderdom.com/research/QualitativeVersusQuantitativeResearch.html
Norton, M. S. (1999). Teacher retention: Reducing costly teacher turnover. Contemporary Education, 70 (3). Podgursky, M., Monroe, R., & Watson, D. (2004). The academic quality of public school teachers: An analysis of entry and exit behavior. Economics of Education Review, 23, 507-518. Rabinowitz, W., & Crawford, K. (1960). A study of teachers’ careers. The School Review, 68 (4), 377-99. Reed, D. F., & Busby, D. W. (1985). “Teacher Incentives in Rural Schools.” Research in Rural Education, 3(2), 69-73.
79
Reeves, C. (2003). Implementing the No Child Left Behind Act: Implications for Rural Schools and Districts. Retrieved November 5, 2007 from www.ncrel.org/policy/pubs/html/implicate/ Rong, X., & Preissle, J. (1997). The continuing decline in Asian-American teachers. American Educational Research Journal, 34(2), 267-293. Rural School and Community Trust. (2000). Why rural matters: The need for every state to take action on rural education. Washington, DC: Author. Sanders, W. L. & Rivers, J. C. (1996). Cumulative and residual effects of teachers on future student academic achievement. Knoxville, TN: University of Tennessee Value-Added Research and Assessment Center. Schlecty, P., & Vance, V. (1981). Do academically able teachers leave education, NC case. Phi Delta Kappan, 63, 106-112. Schwartzbeck, T., Prince, C., Redfield, D., Morris, H., & Hammer, P. (2003). How Are Rural Districts Meeting the Teacher Quality Requirements of No Child Left Behind? Retrieved November 6, 2007 from www.aasa.org/files/PDFs/Policy/Rural_Teacher_Quality_Study1.pdf Shipp, V. (1999). Factors influencing the career choices of African-American collegians: Implications for minority teacher recruitment. Journal of Negro Education, 68 (3), 343-351. Spradlin, T. E., & Prendergast, K. A. (2006). “Emerging Trends in Teacher Recruitment and Retention in the No Child Left Behind Era”. Retrieved September 17, 2008 from http://www.ceep.indiana.edu/projects/PDF/PB_V4N12_Winter_2006_Recruitment.pdf State Council for Higher Education in Virginia. (2009). High Need School Divisions
80
2008-2009 School Year. Retrieved September 4, 2009 from http://www.schev.edu/AdminFaculty/RFPs/NCLBforms/High%20needs%20schools%20revi
sed%202-13-09.doc Stinebrickner, T. (2002). An analysis of occupational change and departure from the labor force: Evidence of the reasons that teachers leave. Journal of Human Resources, 37(1), 192-216. Trochim, W. M. K. (2006). Statistical Power. Retrieved February 4, 2009 from http://www.socialresearchmethods.net/kb/concimp.php United States Department of Education. (2004). No Child Left Behind. A Toolkit for Teachers. Virginia Department of Education. (2007). Licensure Regulations for School Personnel. Retrieved November 18, 2009 from http://www.doe.virginia.gov/VDOE/Compliance/TeacherED/nulicr.pdf Vocational and Educational Services for Individuals with Disabilities. (2005). Keeping Quality Teachers – The Art of Retaining General and Special Education Teachers: Making the Case for Teacher Retention. Retrieved January 30, 2008 from http://www.vesid.nysed.gov/specialed/publications/persprep/qualityteachers/retention.htm
81
Appendix A
Cover Letter to District Superintendents
Dear Superintendent of Schools:
Teacher attrition is a major challenge that many school districts across this country are facing. Therefore, we are conducting a study on those factors that impact teacher attrition. We are asking for your support in using data from your district data on the total numbers of teachers during the 2007-08 school year. In addition, we are asking for permission to distribute a brief survey to those teachers who left your district after the 2007-08 school year. The information gained might help school districts understand the reasons for teacher attrition and develop strategies that will hopefully reduce annual teacher turnover.
All information will be kept confidential. In addition, we would be more than willing
to answer any questions that you may have about this study. We can be contacted by email ([email protected]) or by phone (H-757-365-0678 or C-757-409-7717).
In closing, thank you for your assistance in this matter. Have a great day.
Sincerely,
Walter R. Clemons Graduate Student Virginia Polytechnic Institute and State University
Dr. Travis W. Twiford Professor Virginia Polytechnic Institute and State University
82
Appendix B
83
Appendix C
ppendix C
84
Appendix D
Cover Letter Number One to Teachers
Date: March 3, 2009
Dear Colleague:
My name is Walter R. Clemons, and I am currently a doctoral student in the Educational Leadership and Policy Studies program at Virginia Polytechnic Institute and State University. My chairperson at Virginia Tech is Dr. Travis W. Twiford. In addition, I currently serve in the capacity of Assistant Superintendent for Human Resources and Administrative Services for Franklin City Public Schools, located in Franklin, Virginia.
Teacher attrition is a major challenge that many school districts across this country are facing.
Therefore, we are conducting a study on those factors that impact teacher attrition. We are asking you to complete a brief survey (enclosed) to assist me in this study. You have been selected based on the fact that you left your teaching position in Franklin City or Surry County Public Schools after the 2007-08 school year. Answers from the study will hopefully help pinpoint those factors that have the most impact on teachers’ decisions to leave their respective school districts. The information gained will hopefully help school districts understand the reasons for teacher attrition and possibly develop strategies that can help in reducing annual teacher turnover.
All information provided will be confidential. Your name will never be placed on the survey
itself. The survey only consists of 12 questions that require checking the responses, and should take 5 minutes or less to complete. The survey will have an identification number only for mailing purposes and the monitoring of returns. A self-addressed, stamped envelope is enclosed for your convenience. We are asking that you please complete and return the survey by March 27, 2009. The success of this study is dependent on your timely participation.
We would be more than willing to answer any questions that you may have about this study.
We can be contacted by email ([email protected]) or by phone (H-757-365-9678 or C-757-409-7717).
In closing, thank you for your assistance in this matter. Have a great day.
Sincerely,
Walter R. Clemons, Doctoral Student
Dr. Travis W. Twiford, Professor Virginia Polytechnic Institute and State University
85
Appendix E
Cover Letter Number Two to Teachers
Date: April 3, 2009
Dear Colleague:
My name is Walter R. Clemons, and I am currently a doctoral student in the Educational
Leadership and Policy Studies program at Virginia Polytechnic Institute and State University. My chairperson at Virginia Tech is Dr. Travis W. Twiford. In addition, I currently serve in the capacity of Assistant Superintendent for Human Resources and Administrative Services for Franklin City Public Schools, located in Franklin, Virginia.
We recently (March 3, 2009) sent you a survey on teacher attrition. We are resending the
survey (enclosed) and asking you to complete it if at all possible. We are trying to obtain at least 10 additional surveys from the initial mailing to increase our sample population. Therefore, your assistance in this matter would be greatly appreciated. You have been selected based on the fact that you left your teaching position in Franklin City or Surry County Public Schools after the 2007-08 school year. Answers from the study will hopefully help pinpoint those factors that have the most impact on teachers’ decisions to leave their respective school districts. The information gained will hopefully help school districts understand the reasons for teacher attrition and possibly develop strategies that can help in reducing annual teacher turnover.
All information provided will be confidential. Your name will never be placed on the survey
itself. The survey only consists of 12 questions that require checking the responses, and should take 5 minutes or less to complete. The survey will have an identification number only for mailing purposes and the monitoring of returns. A self-addressed, stamped envelope is enclosed for your convenience. We are asking that you please complete and return the survey by April 15, 2009. The success of this study is dependent on your timely participation.
We would be more than willing to answer any questions that you may have about this study.
We can be contacted by email ([email protected]) or by phone (H-757-365-9678 or C-757-409-7717).
In closing, thank you for your assistance in this matter. Have a great day.
Sincerely,
Walter R. Clemons, Doctoral Student
Dr. Travis W. Twiford, Professor Virginia Polytechnic Institute and State University
86
Appendix F
Teacher Attrition Survey
Instructions: Please read each question carefully and fill in text box or answer as appropriate.
Please answer all questions.
1. What was the major reason you decided to become a teacher?
□ Impacting the lives of children
□ Making a societal difference
□ Job allows time for family
□ Salary
□ Other
2. How many semesters of student teaching did you complete in your undergraduate or graduate experience?
□ 0 semesters
□ 1 semester
□ 2 or more semesters
3. How many other teachers are in your family?
□ 0 teachers
□ 1 teacher
□ 2 teachers
□ 3 or more teachers
□ Don’t know
87
4. What type of teaching license did you or do you currently hold?
□ Provisional
□ Collegiate Professional
□ Postgraduate Professional
□ Technical Professional
□ Conditional
5. What area(s) are you endorsed to teach in?
□ Reading/Language Arts
□ Mathematics
□ Science
□ History/Social Science
□ Fine Arts
□ Special Education
□ Other
6. What subject(s) did you teach?
□ Reading/Language Arts
□ Mathematics
□ Science
□ History/Social Science
□ Fine Arts
□ Special Education
□ Other
88
7. Please indicate your level of satisfaction with the school or school district.
□ Very Satisfied
□ Somewhat Satisfied
□ Somewhat Dissatisfied
□ Very Dissatisfied
8. Please indicate the top reason you chose to resign from the school district.
□ Overall Dissatisfaction with Teaching
□ Lack of Administrative Support
□ Student Discipline
□ Number of Teaching Preparations
□ Geographical Location
□ Salary
□ Other (please specify) ___________________
9. What is your race?
□ American Indian or Alaskan Native
□ Asian or Pacific Islander
□ Hispanic
□ Black, not of Hispanic origin
□ White, not of Hispanic origin
□ Other (please specify) ___________________
89
10. What was your biggest frustration when working for your former school district?
□ Lack of Parental Support
□ Student Discipline
□ School Climate
□ Lack of Teacher Input
□ Other (please specify) ______________________
11. What do you see as the biggest challenge for your former school district that affects teacher retention?
□ Size of District
□ Geographical Location
□ Salary
□ Other (please specify) ___________________
12. Please state one factor (if any) that would have changed your decision to leave the school district.
□ More Salary
□ More Teacher Input
□ Better Student Discipline
□ More Parental Support
□ Other (please specify) ______________
90
Appendix G
Survey Validation Instrument One (October 13, 2008)
Survey Validation Instrument One (October 13, 2008)
Dear Colleague:
Listed below are four research questions followed by 15 survey questions. This
survey will be given to teachers who left two small school districts in Southeastern Virginia
after the 2007-08 school year. Please read each survey question and then circle the
corresponding number of the research question that is in alignment with the survey question.
In addition, please indicate by circling the degree of clarity between the research question
and the survey question. (VC – Very Clear; C – Clear; SC – Somewhat Clear; NC – Not
Clear)
Research Questions:
1. What factors impacted teachers’ decisions to leave two small school districts in Southeastern Virginia? 2. What are the major challenges that impact teacher attrition in two small school districts in Southeastern Virginia as perceived by teachers who left both school districts?
3. What are the characteristics of those who entered the teaching profession and then left two small school districts in Southeastern Virginia? 4. What impact does race/ethnicity, subject-area, years of experience and licensure have on teacher attrition in two small school districts in Southeastern Virginia?
91
Survey Questions 1. What made you decide to choose teaching Relevance to Research Question : 1 2 3 4
as a profession? Clarity - VC C SC NC
□ Impacting the lives of children
□ Making a societal difference
□ Job allows time for family
□ Salary
□ Other
2. How long have you been in the teaching Relevance to Research Question : 1 2 3 4
profession? Clarity - VC C SC NC
□ 0 to 5 years
□ 6 to 10 years
□ 11 to 15 years
□ 16 or more years
3. What type of teaching license did you Relevance to Research Question : 1 2 3 4 or
do you currently hold? Clarity - VC C SC NC
□ Provisional
□ Collegiate Professional
□ Postgraduate Professional
□ Technical Professional
□ Special Education Conditional
4. What areas are you endorsed to teach in? Relevance to Research Question : 1 2 3 4
□ Reading/Language Arts Clarity - VC C SC NC
□ Mathematics
□ Science
92
□ History/Social Science
□ Fine Arts
□ Special Education
□ Other
5. What building level assignment did you Relevance to Research Question : 1 2 3 4
have? Clarity - VC C SC NC
□ Elementary
□ Middle
□ High
6. What subject(s) did you teach? Relevance to Research Question : 1 2 3 4
□ Reading/Language Arts Clarity - VC C SC NC
□ Mathematics
□ Science
□ History/Social Science
□ Fine Arts
□ Special Education
□ Other
7. How many years did you work for the Relevance to Research Question : 1 2 3 4
school district? Clarity - VC C SC NC
□ 0 to 5 years
□ 6 to 10 years
□ 11 to 15 years
□ 16 or more years
93
8. What factors impacted your decision to Relevance to Research Question : 1 2 3 4
work for the school district? Clarity - VC C SC NC
□ Size of District
□ Geographical Location
□ Salary
□ Other (please specify) ___________________
9. Please indicate your level of satisfaction Relevance to Research Question : 1 2 3 4
with the school or school district? Clarity - VC C SC NC
□ Very Satisfied
□ Somewhat Satisfied
□ Somewhat Dissatisfied
□ Very Dissatisfied
10. Please indicate the top reason you Relevance to Research Question : 1 2 3 4
chose to resign from the school district. Clarity - VC C SC NC
□ Overall Dissatisfaction with Teaching
□ Lack of Administrative Support
□ Student Discipline
□ Number of Teaching Preparations
□ Geographical Location
□ Salary
□ Other (please specify) ___________________
11. What is your gender? Relevance to Research Question : 1 2 3 4
□ Male Clarity - VC C SC NC
□ Female
94
12. What is your race? Relevance to Research Question : 1 2 3 4
□ American Indian or Alaskan Native Clarity - VC C SC NC
□ Asian or Pacific Islander
□ Hispanic
□ Black, not of Hispanic origin
□ White, not of Hispanic origin
□ Other (please specify) ___________________
13. Do you plan to stay in the teaching Relevance to Research Question : 1 2 3 4
profession? Clarity - VC C SC NC
□ Yes
□ No
14. Are you currently teaching in another Relevance to Research Question : 1 2 3 4
school district? Clarity - VC C SC NC
□ Yes
□ No
15. Please state one factor (if any) that would Relevance to Research Question : 1 2 3 4
have changed your decision to leave the Clarity - VC C SC NC
school district.
□ More Salary
□ More Teacher Input
□ Better Student Discipline
□ More Parental Support
□ Other (please specify) ______________
95
Appendix H
Survey Validation Instrument Two (November 3, 2008)
Survey Validation Instrument Two (November 3, 2008)
Dear Colleague:
Listed below are four research questions followed by 10 survey questions. This
survey will be given to teachers who left two small school districts in Southeastern Virginia
after the 2007-08 school year. Please read each survey question and then circle the
corresponding number of the research question that is in alignment with the survey question.
In addition, please indicate by circling the degree of clarity between the research question
and the survey question. (VC – Very Clear; C – Clear; SC – Somewhat Clear; NC – Not
Clear)
Research Questions:
1. What factors impacted teachers’ decisions to leave two small school districts in Southeastern Virginia? 2. What are the major challenges that impact teacher attrition in two small school districts in Southeastern Virginia as perceived by teachers who left both school districts?
3. What are the characteristics of those who entered the teaching profession and then left two small school districts in Southeastern Virginia? 4. What impact does race/ethnicity, subject-area, years of experience and licensure have on teacher attrition in two small school districts in Southeastern Virginia?
96
Survey Questions
1. How many semesters of student teaching Relevance to Research Question : 1 2 3 4
did you complete in your undergraduate Clarity - VC C SC NC
or graduate study?
□ 0 semesters
□ 1 semester
□ 2 or more semesters
2. What was your cumulative GPA upon Relevance to Research Question: 1 2 3 4
graduating from college? Clarity - VC C SC NC
□ 3.0 – 4.0
□ 2.0 – 2.99
□ 1.0 – 1.99
3. How many other teachers are in your Relevance to Research Question : 1 2 3 4
family? Clarity - VC C SC NC
□ 0 teachers
□ 1 teacher
□ 2 teachers
□ 3 or more teachers
□ Don’t Know
97
4. What was the major reason you decided to Relevance to Research Question: 1 2 3 4
become a teacher? Clarity – VC C SC NC
□ Impacting the lives of children
□ Making a societal difference
□ Job allows time for family
□ Salary
□ Other
5. How would you classify the geographical Relevance to Research Question : 1 2 3 4 area in
which you grew up as a child? Clarity - VC C SC NC
□ Suburban
□ Urban
□ Rural
6. How would you classify your former Relevance to Research Question: 1 2 3 4
school district? Clarity – VC C SC NC
□ Suburban
□ Urban
□ Rural
7. How important was the geographical location Relevance to Research Question : 1 2 3 4
of your former school district to you when Clarity - VC C SC NC
deciding to teach for the district?
□ Very Important
□ Important
□ Somewhat Important
□ Not important
98
8. What was your biggest challenge when Relevance to Research Question : 1 2 3 4
working for your former Clarity - VC C SC NC
school district?
□ Lack of Parental Support
□ Student Discipline
□ Lack of Administrative Support
□ Other (please specify)
9. What was your biggest frustration when Relevance to Research Question : 1 2 3 4
working for your former school district? Clarity - VC C SC NC
□ Lack of Parental Support
□ Student Discipline
□ School Climate
□ Lack of Teacher Input
□ Other (please specify)
10. What do you see as the biggest Relevance to Research Question : 1 2 3 4
challenge for your former school Clarity - VC C SC NC
district that affects teacher retention?
□ Size of District
□ Geographical Location
□ Salary
□ Other (please specify) ___________________
99
Appendix I
Survey Validation Instrument One Alignment Results
(Note: Percentages may not equal 100% in some instances due to rounding. Thirteen cohort members on 10/13/08).
100
Appendix J
Survey Validation Instrument Two Alignment Results
Research Questions 1 2 3 4
Survey Questions
1. 15 (88%) 0 0 2 (12%)
2. 11 (65%) 0 6 (35%) 0
3. 14 (82%) 0 3 (18%) 0
4. 17 (100%) 0 0 0
5. 10 (59%) 4 (23%) 3 (18%) 0
6. 0 9 (53%) 8 (47%) 0
7. 6 (35%) 4 (23%) 7 (41%) 0
8. 0 12 (70%) 2 (12%) 3 (18%)
9. 0 14 (82%) 3 (18%) 0
10. 0 15 (88%) 2 (12%) 0
(Note: Percentages may not equal 100% in some instances due to rounding. Seventeen cohort members on 11/3/08).
101
Appendix K
Survey Validation Instrument One Clarity Results
(VC) = 4 (C3) = 3 (SC) = 2 (NC) = 1 Clarity
Survey Questions
1. 8 (62%) 2 (15%) 2 (15%) 1 (8%) 3.3
2. 11 (85%) 2 (15%) 0 0 3.6
3. 9 (69%) 4 (31%) 0 0 3.6
4. 8 (62%) 5 (38%) 0 0 3.6
5. 7(54%) 3 (23%) 1 (8%) 2 (15%) 3.1
6. 9 (69%) 2 (15%) 2 (15%) 0 3.5
7. 4 (31%) 6 (46%) 1 (8%) 2 (15%) 2.9
8. 5 (38%) 4 (31%) 3 (23%) 1 (8%) 3.0
9. 4 (31%) 8 (62%) 1 (8%) 0 3.2
10. 8 (62%) 5 (38%) 0 0 3.6
11. 8 (62%) 3 (23%) 1 (8%) 1 (8%) 3.3
12. 10 (77%) 3 (23%) 0 0 3.7
13. 7 (54%) 4 (31%) 2 (15%) 0 (not used) 3.3
14. 6 (46%) 3 (23%) 2 (15%) 2 (15%) 3.0
15. 9 (69%) 3 (23%) 1 (8%) 0 3.6
(Note: Percentages may not equal 100% in some instances due to rounding. Thirteen cohort
members on 10/13/08).
102
Appendix L
Survey Validation Instrument Two Clarity Results
(VC) = 4 (C) = 3 (SC) = 2 (NC) = 1 Clarity
Survey Questions
1. 8 (47%) 6 (35%) 1 (6%) 2 (12%) 3.1
2. 5 (29%) 7 (41%) 3 (18%) 2 (12%) 2.8
3. 9 (53%) 5 (29%) 2 (12%) 1 (6%) 3.2
4. 10 (59%) 6 (35%) 1 (6%) 0 3.5
5. 6 (35%) 4 (23%) 6 (35%) 1 (6%) 2.8
6. 5 (29%) 8 (47%) 4 (23%) 0 3.0
7. 4 (23%) 12 (71%) 1 (6%) 0 3.1
8. 9 (53%) 5 (29%) 3 (18%) 0 3.3
9. 5 (29%) 10 (59%) 1 (6%) 1 (6%) 3.1
10. 6 (35%) 8 (47%) 2 (12%) 1 (6%) 3.1
(Note: Percentages may not equal 100% in some instances due to rounding. Seventeen cohort members on 11/3/08). The numbers 1 through 4 beside Research Questions represent the four research
questions. The numbers one through 15 (survey validation instrument one) or one through
10 (survey validation instrument two) under Survey Questions represents the number of
survey questions. The bolded numbers with percentages represent the total number of cohort
members who indicated that the alignment of a specific survey question to a specific research
question was at or above 80%, and the clarity rating of each survey question was at or above
3.0. Therefore, only those questions from survey validation instruments one and two that had
103
an alignment rate at or above 80% and clarity rate at 3.0 or above minus number 13 on
survey validation instrument one were used for the survey in Appendix F. The questions
used from survey validation instrument one were numbers three, four, six, nine, ten, twelve,
and fifteen. The questions used from survey validation instrument two were numbers one,
three, four, nine, and ten.
104
Appendix M (AAEE Table Consent Usage)
105
Appendix N (NCES Table Consent Usage)
106
Appendix O (IRB Approval)
107
Appendix P (Human Subjects Training)
108
Appendix Q
(2007-2008 Recoded Electronic Teacher Data from Surry County and Franklin City)
Teacher Subject/Grade License Years Race Gender Retained Retired Non-
renewed
Resigned Div.
1 4 1 2 1 1 1 1 1 1 1
2 4 1 2 2 1 1 1 1 1 1
3 4 1 4 1 1 1 1 1 1 1
4 4 1 4 1 1 1 1 1 1 1
5 4 1 2 1 1 1 1 1 1 1
6 4 1 1 2 1 1 1 1 1 1
7 4 2 1 2 1 1 1 1 1 1
8 4 1 3 1 1 1 1 1 1 1
9 4 1 1 1 1 1 1 1 1 1
10 4 2 1 2 1 2 1 1 2 1
11 4 1 1 2 1 1 1 1 1 1
12 4 2 2 2 1 2 1 1 2 1
13 4 1 4 1 1 1 1 1 1 1
14 4 1 1 2 1 1 1 1 1 1
15 4 1 1 2 1 2 1 1 2 1
16 4 1 2 1 1 1 1 1 1 1
17 4 1 1 2 1 1 1 1 1 1
18 4 1 4 1 1 2 2 1 1 1
19 4 1 3 2 1 1 1 1 1 1
20 4 1 1 2 1 1 1 1 1 1
21 4 1 3 2 1 1 1 1 1 1
22 4 1 1 2 1 1 1 1 1 1
23 4 1 2 2 1 1 1 1 1 1
24 4 1 1 2 1 2 1 1 2 1
25 4 1 1 1 1 1 1 1 1 1
109
Teacher Subject/Grade License Years Race Gender Retained Retired Non-
renewed
Resigned Div.
26 4 1 2 2 1 1 1 1 1 1
27 4 1 4 1 1 1 1 1 1 1
28 4 1 4 1 1 1 1 1 1 1
29 4 1 4 2 1 1 1 1 1 1
30 4 1 1 2 1 1 1 1 1 1
31 4 1 1 1 1 1 1 1 1 1
32 4 1 1 1 1 1 1 1 1 1
33 4 1 1 2 1 1 1 1 1 1
34 5 1 4 1 1 1 1 1 1 1
35 1 1 2 1 1 1 1 1 1 1
36 1 1 1 2 1 1 1 1 1 1
37 2 1 4 1 1 1 1 1 1 1
38 5 1 3 2 1 1 1 1 1 1
39 5 1 2 3 1 1 1 1 1 1
40 5 1 1 1 1 1 1 1 1 1
41 1 1 4 1 1 1 1 1 1 1
42 5 1 1 1 1 1 1 1 1 1
43 2 1 1 2 2 1 1 1 1 1
44 2 1 3 2 1 1 1 1 1 1
45 5 1 2 1 1 2 1 1 2 1
46 5 1 2 1 2 1 1 1 1 1
47 5 1 3 2 2 1 1 1 1 1
48 2 1 1 2 2 1 1 1 1 1
49 1 1 1 2 1 1 1 1 1 1
50 2 1 4 1 1 1 1 1 1 1
51 2 1 1 2 2 2 1 1 2 1
52 2 1 3 2 1 1 1 1 1 1
53 2 1 2 1 1 1 1 1 1 1
110
Teacher Subject/Grade License Years Race Gender Retained Retired Non-
renewed
Resigned Div.
54 5 1 4 1 2 1 1 1 1 1
55 1 1 2 2 2 2 1 1 2 1
56 1 1 1 3 1 1 1 1 1 1
57 2 1 1 2 2 1 1 1 1 1
58 5 1 2 1 2 2 1 1 2 1
59 1 2 1 1 1 2 1 1 2 1
60 1 1 1 1 1 1 1 1 1 1
61 3 1 4 1 1 1 1 1 1 1
62 3 2 1 1 2 2 1 2 1 1
63 3 1 2 2 1 1 1 1 1 1
64 3 1 4 1 1 1 1 1 1 1
65 3 2 1 1 1 1 1 1 1 1
66 3 1 4 1 1 1 1 1 1 1
67 3 1 4 1 1 1 1 1 1 1
68 3 1 4 1 1 1 1 1 1 1
69 3 1 2 1 1 1 1 1 1 1
70 3 1 4 1 1 1 1 1 1 1
71 3 2 1 2 1 2 1 1 2 1
72 3 1 1 1 1 1 1 1 1 1
73 3 1 2 1 1 2 1 1 2 1
74 5 1 4 1 1 1 1 1 1 1
75 5 1 3 1 1 1 1 1 1 1
76 5 1 2 1 1 1 1 1 1 1
77 5 1 4 1 1 1 1 1 1 1
78 5 1 4 1 2 1 1 1 1 1
79 5 1 1 2 2 1 1 1 1 1
80 5 1 1 1 1 1 1 1 1 1
81 5 1 1 1 2 1 1 1 1 1
111
Teacher Subject/Grade License Years Race Gender Retained Retired Non-
renewed
Resigned Div.
82 5 1 4 1 2 1 1 1 1 1
83 5 1 4 1 2 1 1 1 1 1
84 5 1 2 3 1 2 1 1 2 1
85 1 1 2 2 1 1 1 1 1 1
86 2 1 2 2 1 1 1 1 1 1
87 2 1 2 1 1 1 1 1 1 1
88 2 1 2 2 1 1 1 1 1 1
89 2 1 2 2 1 1 1 1 1 1
90 2 1 2 1 1 1 1 1 1 1
91 1 1 1 2 1 1 1 1 1 1
92 5 1 1 2 1 1 1 1 1 1
93 1 1 4 1 1 1 1 1 1 1
94 2 1 2 2 2 1 1 1 1 1
95 2 1 4 1 1 1 1 1 1 1
96 5 1 2 1 1 1 1 1 1 1
97 1 1 1 2 1 2 1 1 2 1
98 1 1 4 2 1 1 1 1 1 1
99 1 1 4 2 1 2 2 1 1 1
100 2 1 4 1 2 1 1 1 1 1
101 5 2 1 1 1 2 1 2 1 1
102 5 1 1 1 2 1 1 1 1 1
103 2 1 2 1 1 1 1 1 1 1
104 2 1 2 2 2 2 * 1 1 1 1
105 5 1 1 1 2 2 1 2 1 1
106 5 1 3 1 1 1 1 1 1 1
107 5 1 4 2 1 1 1 1 1 1
108 5 1 2 2 1 1 1 1 1 1
109 5 1 3 1 1 1 1 1 1 1
112
Teacher Subject/Grade License Years Race Gender Retained Retired Non-
renewed
Resigned Div.
110 5 1 4 1 1 2 * 1 1 1 1
111 5 2 1 1 1 1 1 1 1 1
112 5 1 1 1 2 1 1 1 1 1
1 4 1 1 2 1 1 1 1 1 2
2 4 1 2 2 1 1 1 1 1 2
3 4 1 4 1 1 1 1 1 1 2
4 4 1 4 2 1 1 1 1 1 2
5 4 1 1 2 1 1 1 1 1 2
6 4 2 1 2 1 1 1 1 1 2
7 4 1 2 1 1 1 1 1 1 2
8 3 2 1 2 1 1 1 1 1 2
9 3 2 1 2 1 2 1 1 2 2
10 4 1 3 2 1 1 1 1 1 2
11 4 1 2 2 1 1 1 1 1 2
12 4 1 4 2 1 2 2 1 1 2
13 4 1 2 2 1 1 1 1 1 2
14 4 1 2 2 1 1 1 1 1 2
15 4 1 2 1 1 1 1 1 1 2
16 4 1 2 1 1 1 1 1 1 2
17 4 1 2 1 1 1 1 1 1 2
18 4 1 1 2 1 1 1 1 1 2
19 4 1 2 2 1 1 1 1 1 2
20 4 1 2 1 1 1 1 1 1 2
21 4 1 1 2 1 1 1 1 1 2
22 4 1 2 2 1 1 1 1 1 2
23 4 1 2 1 1 1 1 1 1 2
24 4 1 1 2 1 1 1 1 1 2
25 4 1 1 2 1 1 1 1 1 2
113
Teacher Subject/Grade License Years Race Gender Retained Retired Non-
renewed
Resigned Div.
26 4 1 4 2 1 1 1 1 1 2
27 4 1 4 1 1 1 1 1 1 2
28 4 1 3 1 1 1 1 1 1 2
29 4 1 4 2 1 1 1 1 1 2
30 4 1 2 2 1 1 1 1 1 2
31 4 1 2 2 1 1 1 1 1 2
32 4 1 1 2 1 1 1 1 1 2
33 3 1 1 1 1 2 1 1 2 2
34 4 1 3 1 1 1 1 1 1 2
35 4 1 1 2 1 1 1 1 1 2
36 4 1 2 1 1 1 1 1 1 2
37 4 1 4 2 2 1 1 1 1 2
38 4 1 2 1 1 1 1 1 1 2
39 5 1 3 2 1 1 1 1 1 2
40 3 2 2 2 1 2 1 1 2 2
41 4 1 2 1 1 1 1 1 1 2
42 4 1 2 2 1 1 1 1 1 2
43 3 1 2 2 1 1 1 1 1 2
44 3 1 1 2 1 2 1 1 2 2
45 4 1 2 2 1 1 1 1 1 2
46 4 1 3 2 1 1 1 1 1 2
47 3 2 1 2 2 1 1 1 1 2
48 4 1 2 2 1 1 1 1 1 2
49 4 1 1 2 1 1 1 1 1 2
50 4 1 2 1 1 1 1 1 1 2
51 5 1 3 2 1 1 1 1 1 2
52 3 1 2 1 1 1 1 1 1 2
53 4 1 3 1 1 1 1 1 1 2
114
Teacher Subject/Grade License Years Race Gender Retained Retired Non-
renewed
Resigned Div.
54 4 1 2 2 1 2 1 1 2 2
55 3 1 1 2 1 2 1 1 2 2
56 5 1 2 2 1 1 1 1 1 2
57 2 2 1 1 1 1 1 1 1 2
58 2 1 2 1 1 2 1 1 2 2
59 1 1 4 2 1 2 2 1 1 2
60 5 1 4 1 1 1 1 1 1 2
61 5 1 2 2 1 1 1 1 1 2
62 3 1 1 2 1 1 1 1 1 2
63 1 1 4 2 1 1 1 1 1 2
64 5 1 2 2 2 1 1 1 1 2
65 1 1 4 2 1 1 1 1 1 2
66 2 1 2 1 1 1 1 1 1 2
67 2 1 2 1 1 2 1 1 2 2
68 2 1 2 2 2 2 1 2 1 2
69 5 1 4 2 2 1 1 1 1 2
70 2 1 2 3 2 2 1 1 2 2
71 1 1 1 2 1 2 1 1 2 2
72 3 1 1 2 1 2 1 1 2 2
73 1 1 2 2 1 2 1 1 2 2
74 5 1 4 2 1 1 1 1 1 2
75 3 1 4 2 1 1 1 1 1 2
76 2 1 3 1 1 1 1 1 1 2
77 3 1 3 2 1 1 1 1 1 2
78 1 1 2 1 1 1 1 1 1 2
79 3 2 1 1 2 2 1 1 2 2
80 1 2 1 2 1 2 1 1 2 2
81 3 2 1 2 2 1 1 1 1 2
115
Teacher Subject/Grade License Years Race Gender Retained Retired Non-
renewed
Resigned Div.
82 2 1 2 2 2 1 1 1 1 2
83 2 1 4 2 1 2 1 1 2 2
84 5 2 1 2 2 2 1 1 2 2
85 5 1 4 2 1 1 1 1 1 2
86 1 1 2 2 1 1 1 1 1 2
87 5 1 2 2 1 2 1 1 2 2
88 5 1 1 2 2 2 1 1 2 2
89 5 2 1 3 1 1 1 1 1 2
90 2 1 1 2 1 1 1 1 1 2
91 5 1 4 2 1 1 1 1 1 2
92 3 1 2 2 2 2 1 2 1 2
93 1 1 2 3 1 1 1 1 1 2
94 1 1 3 2 1 1 1 1 1 2
95 3 1 1 1 1 1 1 1 1 2
96 3 1 4 1 1 1 1 1 1 2
97 2 2 1 1 1 2 1 1 2 2
98 2 1 1 1 2 2 1 2 1 2
99 2 1 2 2 1 2 1 1 2 2
100 2 1 4 1 1 1 1 1 1 2
101 1 1 4 2 1 1 1 1 1 2
102 5 1 2 1 1 1 1 1 1 2
103 1 1 1 2 2 1 1 1 1 2
104 1 1 2 2 1 1 1 1 1 2
104 5 1 2 3 1 1 1 1 1 2
106 5 1 2 1 2 1 1 1 1 2
107 1 1 4 1 1 1 1 1 1 2
108 5 1 1 1 1 1 1 1 1 2
109 3 1 3 1 1 1 1 1 1 2
116
Teacher Subject/Grade License Years Race Gender Retained Retired Non-
renewed
Resigned Div.
110 2 1 1 2 1 2 1 1 2 2
111 5 1 4 2 1 1 1 1 1 2
112 5 1 1 2 1 2 1 1 2 2
113 3 2 1 1 1 1 1 1 1 2
114 5 1 3 1 2 1 1 1 1 2
115 1 1 4 2 1 1 1 1 1 2
116 2 1 1 2 2 2 1 2 1 2
117 5 1 4 1 1 1 1 1 1 2
118 3 2 1 2 1 1 1 1 1 2
119 3 1 1 1 1 1 1 1 1 2
120 2 2 1 2 1 2 1 1 2 2
121 5 1 2 1 1 2 1 1 2 2
122 5 1 4 2 2 2 2 1 1 2
123 5 1 3 1 1 2 1 1 2 2
124 5 1 3 2 1 1 1 1 1 2
125 3 2 1 2 2 2 1 1 2 2
126 5 1 4 2 1 1 1 1 1 2
127 1 1 2 2 1 2 1 1 2 2
128 3 2 1 1 2 2 1 1 2 2
Variables Number Coding: Teacher – Numbers (1, 2, etc.) = Names; Subject – 1 = English & History, 2 = Math & Science, 3 = Special Education, 4 = Elementary, 5 = Other; Licensure – 1 = Standard, 2 = Provisional; Years Teaching – 1 = 0-5 years, 2 = 6-15 years, 3 = 16-25 years, 4 = 26 years and up; Race/Ethnicity – 1 = Black, 2 = White, 3 = Other; Gender – 1 = Female, 2 = Male; Retained – 1 = yes, 2 = no; Retired – 1 = no, 2 = yes; Non-renewed – 1 = no, 2 = yes; Resigned – 1 = no, 2 = yes; and Div. - 1 = Surry County 2 = Franklin City and * = deceased.