A Study on the Kerosene Distribution and Related Subsidy Administration and the Generation and Assessment of Options for Improvement of the System Final Report Submitted to the Petroleum Federation of India, New Delhi Sebastian Morris (coordinator) Ajay Pandey Samir K Barua Indian Institute of Management Ahmedabad 1 st June 2006
Transcript
A Study on the Kerosene Distribution and Related Subsidy Administration and the Generation and Assessment of Options for Improvement of the
System
Final Report Submitted to the Petroleum Federation of India, New Delhi
Sebastian Morris (coordinator) Ajay Pandey
Samir K Barua
Indian Institute of Management Ahmedabad
1st June 2006
Contents
Abbreviations iii Executive Summary 1
1 Antecedents and Introduction 42 Issues in Priced-Based Subsidisation 63 The Current System of Kerosene Allocation and Subsidisation 124 The Current System of Distribution of kerosene 215 The Problem and the Changes Required 306 The Proposed System of Direct Subsidisation 347 Identification and Issuance of Smart Cards 448 Implementation of the Proposed System 529 Estimate of Future Savings Possible In Shift To Direct Subsidies 62 Bibliography 65 Boxes
1 The Large (First Order) Distortions in “Targeted” Price Based Subsidies: The Case of Kerosene
14
2 Performance Evaluation of Targeted Public Distribution System (TDPS) (Programme Evaluation Organisation, Planning Commission, Government of India, March 2005 )
28
Figures 1 Schematic Representation of the Cost of Subsidy and Subsidy actually
Delivered to the Poor under the Current Regime 15
2 Variation in Return on Total Capital Employed in Trucking Operations at Varying Degrees of Adulteration of Diesel Fuel with Kerosene
20
3 Schematic Representation of Subsidy Administration (Option A) 36 Tables
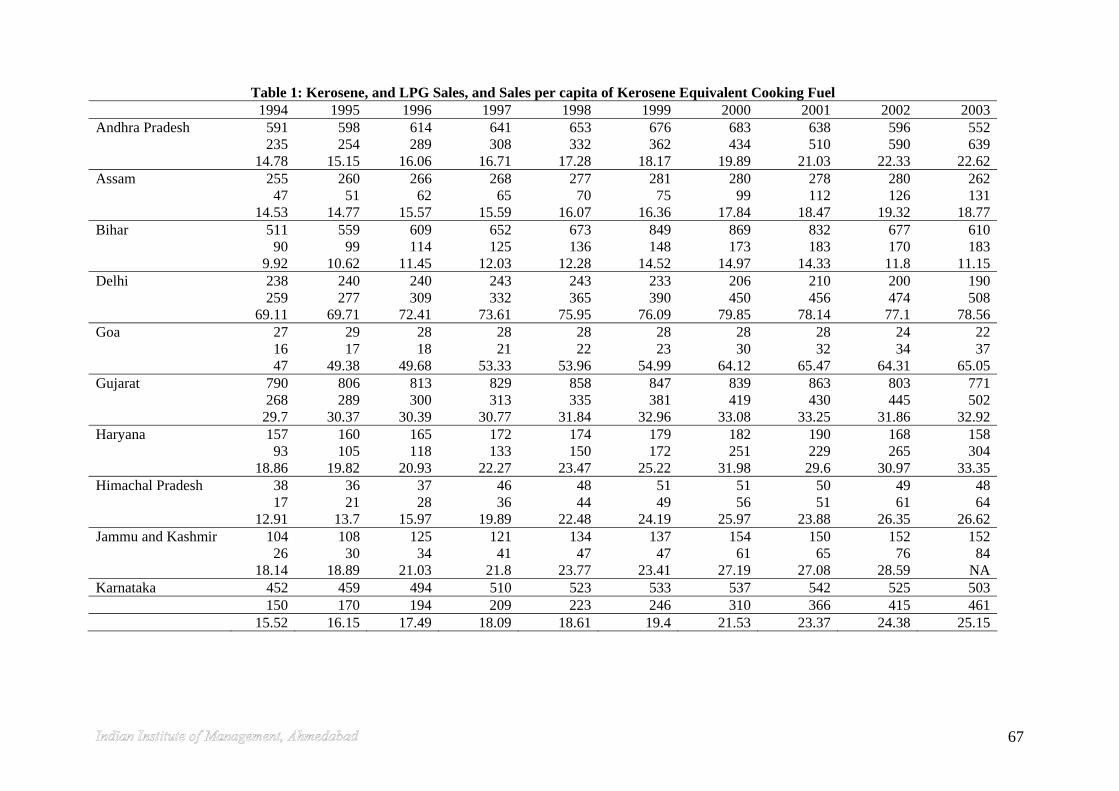
1 Kerosene, and LPG Sales, and Sales per capita of Kerosene Equivalent Cooking Fuel
67
2 Regression Results – for Log (kerosene Sold in ‘000 tonnes and (28/15)*LPG Sold in ‘000 tonnes)
69
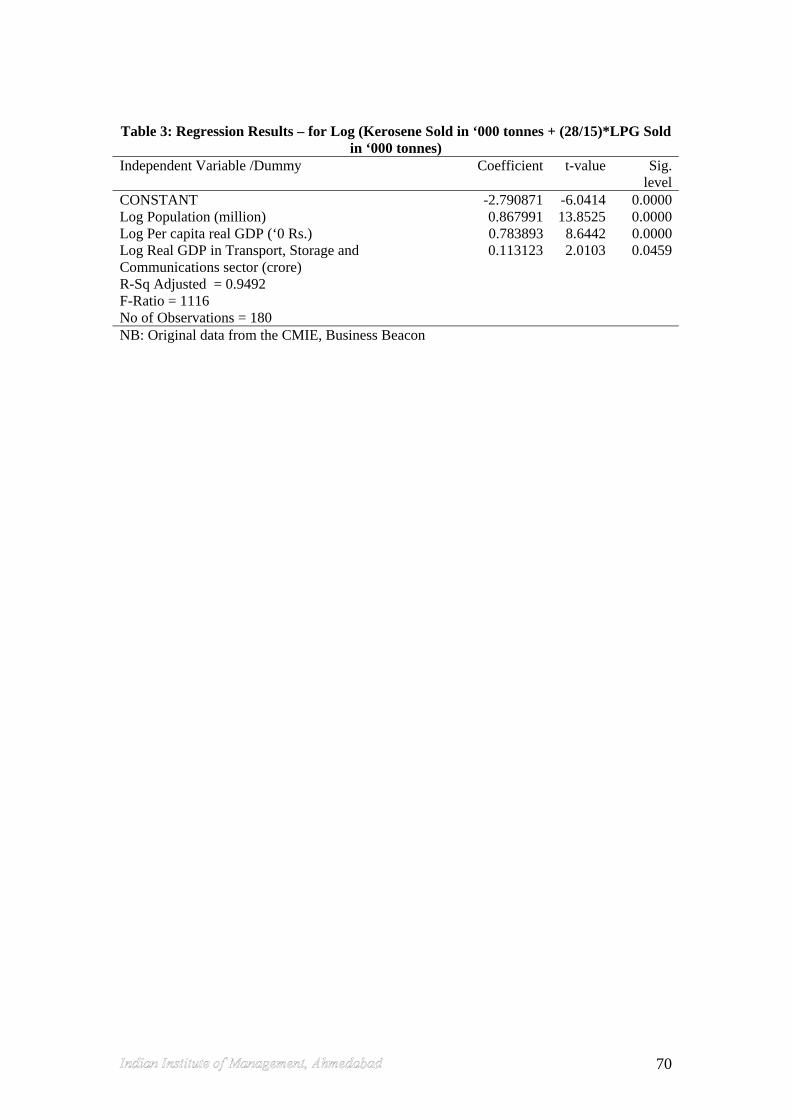
3 Regression Results – for Log (Kerosene Sold in ‘000 tonnes + (28/15)*LPG Sold in ‘000 tonnes
70
4 Assumptions in Trucking Operations to Estimate the Economics of Adulteration 715 Operational Economics over Three Years for Adulteration Level of 30% of Diesel
with Kerosene (Rs. unless otherwise stated) 72
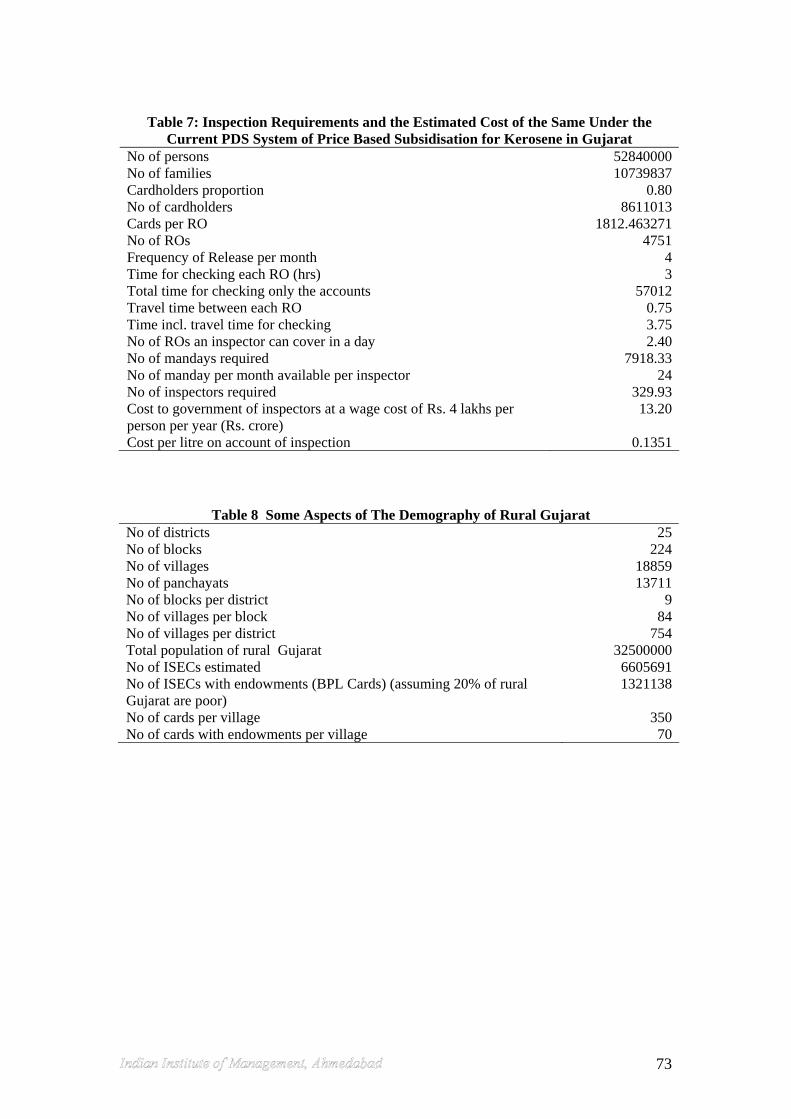
6 Table 6: Some Aspects of the Kerosene Distribution System in Gujarat 727 Inspection Requirements and the Estimated Cost of the Same Under the Current
PDS System of Price Based Subsidisation for Kerosene in Gujarat 73
8 Table 8 Some Aspects of The Demography of Rural Gujarat 739 Some Key Features Related to the Kerosene and LPG and Subsidisation in Gujarat 74
10 Dealer and Reseller Economic Analysis 7511 Summary of the Current Situation, Costs, Delivered Benefits, of the Present and
Proposed Systems and Fiscal Savings in Moving to the Proposed System 76
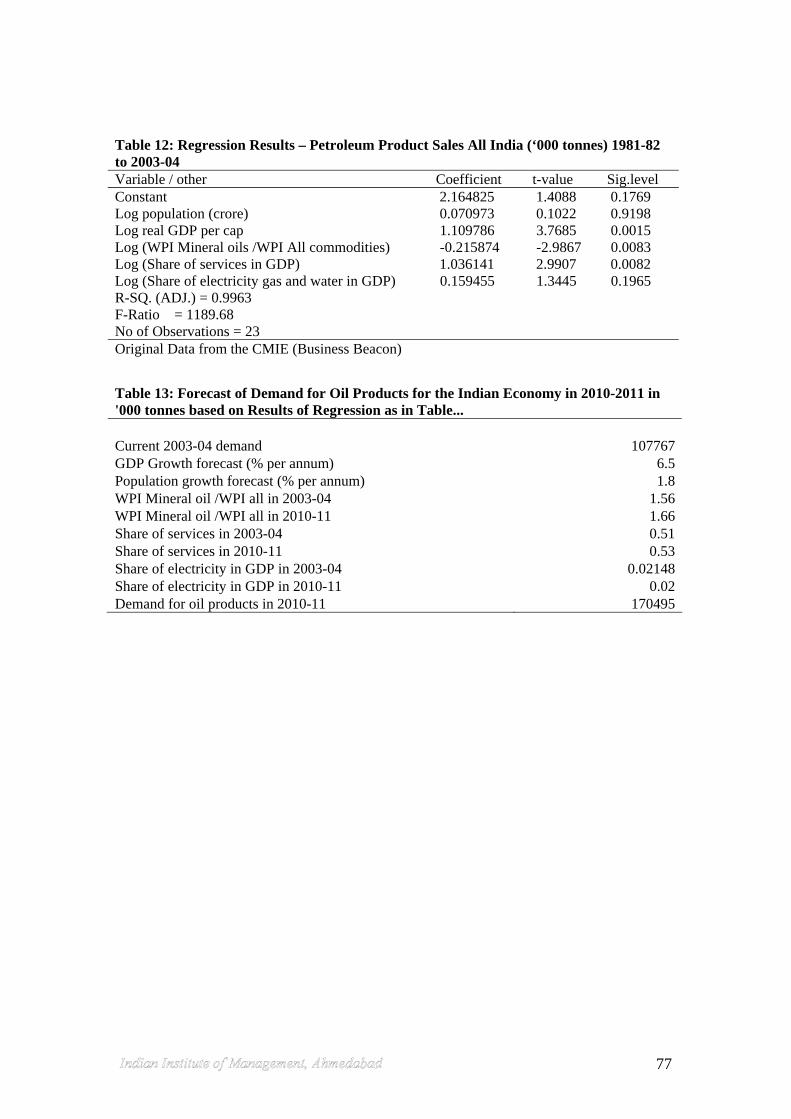
12 Regression Results – Petroleum Product Sales All India (‘000 tonnes) 1981-82 to 2003-04
77
13 Forecast of Demand for Oil Products for the Indian Economy in 2010-2011 in '000 tonnes based on Results of Regression
77
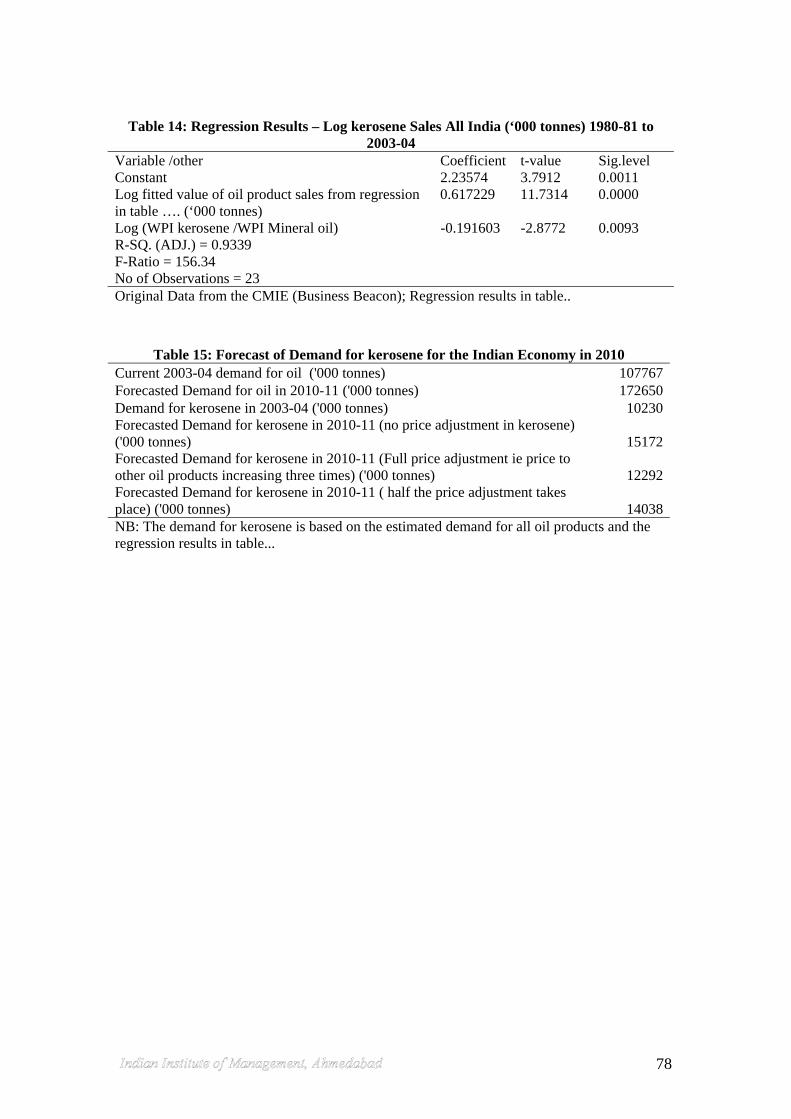
14 Regression Results – Log kerosene Sales All India (‘000 tonnes) 1980-81 to 2003-04
78
15 Forecast of Demand for kerosene for the Indian Economy in 2010 7816 Implications for Subsidy if there is no Change in Policy and Price Based Subsidies
continue at prices with the same relative difference 79
17 Impact of Direct Subsidy to Poor Families Instead of Price Based Subsidies as Current Today
79
ii
Abbreviations AP Andhra Pradesh APL Above Poverty Line BPL Below Poverty Line CCC Credit Card Company CCT Credit Card Terminal CMIE Centre for Monitoring the Indian Economy CPI Consumer Price Index CSO Central Statistical Organisation DPID Drought Prone Area Programme EOI Expression of Interest FPS Fair Price Shop GoI Government of India HUF Hindu Undivided Family IIMA Indian Institute of Management, Ahmedabad ISEC Identity cum Subsidy Endowment Card ITDG Intermediate Technology Development Group (formerly) LPG Liquefied petroleum gas LS Local Shop NCAER National Council of Applied Economic Research NGO Non Government Organisation NSS National Sample Survey NW Net worth PCA Per Capita Allocation PDS Public Distribution System PRI Panchayat Raj Institutions PSU Public Sector Undertaking RFP Request for Proposal RFQ Request for Qualification RO Retail Outlet SKO Superior kerosene oil SPV Special Purpose Vehicle TCE Total Capital Employed TF Task Force TPDS Targeted PDS TSO Traditional sources of energy WPI Wholesale Price Index
iii
Executive Summary The study on allocation, distribution and subsidization of kerosene was carried out with the following specific objective:
To identify the major deficiencies and reasons for the same in the existing system
To propose either modifications to the existing or a new system to overcome the deficiencies identified
To outline the manner in which the proposals may be implemented effectively
To assess the gains from implementing the proposed system. Observations on the Existing System:
There is clear evidence that a significant percentage (about 40) of kerosene is diverted out of the PDS and sold at higher prices.
The manual information and control system to keep diversions and leakages in check is completely ineffective.
The commission paid to the distribution channel, in particular to the retailers of kerosene does not make the business financially viable.
The rents being earned by those associated with the distribution channel for kerosene are very large.
The rent extractors have become so well entrenched over time that it is plausible that other agencies in the system and even the regulatory process itself may be hostage today to their influences.
The indirect losses from use of sub-optimal fuel mix, product mix and investment decisions are very large and may harm the economy significantly in the long term.
The subsidy through uniform low pricing of kerosene, though intended for the poor, is in fact not reaching them as they are in no position to buy much of the kerosene allotted to them even at the low issue prices being charged by the fair price shops.
In sum, kerosene subsidy has become the ever-growing white elephant of the Indian economy.
Alternative to Existing System:
It is imperative to bring into play information and communication technologies so as to break the stranglehold of the distribution
1
channel by capturing information at the point of sale and thereby creating a permanent audit trail of all relevant transactions.
It is imperative to empower the target segment, the BPL families, by providing them with the freedom to choose the manner in which they would like to consume the subsidy intended for them.
The well-documented failure of TPDS (Targeted Public Distribution System), implemented on an experimental basis, clearly demonstrates that tinkering with the existing system would not achieve the twin goal of benefiting the really poor and not-benefiting the non-poor.
The direct subsidy scheme, which is based on free market pricing of kerosene, and therefore a radical departure from the current method of uniform low pricing is the answer for achieving effectiveness of subsidization.
The subsidy is to be disbursed to the poor through smart cards and the accounting of disbursal is to be done using systems similar to those used by credit card companies.
The purchasing power put in the hands of the beneficiaries would allow them to use it for spending on their choice of commodities and services and thereby not only enhance the use of subsidy to the full but would also add greatly to their welfare.
The proposed system would almost completely eliminate the indirect losses arising from distorted choices since the price of kerosene would be market determined and therefore not relatively cheap compared to alternate fuels.
Implementation of Proposed System:
A task force (TF) must be set-up for implementation, with wide-ranging powers and full financial backing of the government of India so as to be able to function autonomously.
The task force should consist of eminently qualified individuals with diverse skills and known for their integrity and appreciation for the significance of the task to be performed.
The critical task of identifying the beneficiaries at micro-level should be done using all possible sources of data and information (outlined in the report) so as to minimize both, Type I and Type II errors, that is, chance of exclusion of genuine beneficiary and chance of inclusion of spurious beneficiary in the list of target beneficiaries.
2
The disbursement of subsidy should be such that the disbursement is recorded at the point of transaction and get immediately captured in a large centralized database, thereby creating a permanent audit trail, akin to operation of credit cards (details outlined in the report).
The activities associated with initial identification of beneficiaries, disbursement of subsidies and updating the list of beneficiaries is to be done by well-qualified private agencies.
The operations of the system should be monitored by an SPV to be specially created for the purpose and working under the broad supervision and direction of the task force.
The SPV and the TF should ensure full transparency of operation of the private vendor and the scheme by making public all relevant information on the operation of the system and opting for periodic audit of operations.
Gains from the Proposed System:
The immediate gain to the exchequer from the proposed system, due to market based pricing of kerosene would be an estimated inflow of Rs. 14000 crore per year by way of additional taxes.
This gain from additional taxes, based on certain assumptions, is expected to rise to over Rs. 37000 crore in 2010-11.
The gain to the economy and society at large from elimination of indirect losses due to sub-optimal choices of fuel-mix, product-mix, and asset mix would be immense as they would be completely eliminated in the new system.
The most important gain however is that the beneficiaries would be in a position to fully utilize their entitlements and spend the same on products and services of their choice, significantly enhancing thereby the utility of their consumption.
3
Chapter 1 Antecedents and Introduction Petrofed approached the Indian Institute of Management, Ahmedabad (IIMA) to carry
out a study on the distribution system and subsidy administration mechanism for
kerosene in the second week of July 2005, and IIMA in response sent Petrofed a
proposal for the same. IIMA proposed that it would carry out an initial study
evaluating the current system and suggest a suitable approach that could overcome
many of the shortcomings of the current system. The terms of reference for the study
were as follows:
1. To assess the existing system of subsidisation and distribution of kerosene.
2. To examine alternative mechanisms including direct subsidisation to improve
the system.
3. To examine the alternative arrangements for subsidy and distribution
administration, from the point of view of reach, access, feasibility, robustness
and cost-benefit tradeoffs so as to suggest possible changes required to make
the system more effective.
4. To outline the implementation issues associated with the recommendations
and suggest appropriate method for effective implementation of
recommendations.
The objective of the study by the IIMA would be to examine the possibility of
improving the subsidy administration for kerosene with a view to minimize
diversions, leakages, and to remove the prevailing distortions. The study would
suggest institution of a new system that is cost effective, easy to administer, and is yet
able to fully take care of the needs of the segment of population that requires
subsidies.
4
Possible Post Study Actions
The recommendations of the study may lead to possible revamping /reorganisation of
the system.
5
Chapter 2 Issues in Priced-Based Subsidisation
Price Based versus Direct Subsidies
Subsidies in India including that on kerosene have been delivered through lowering of
price of the goods and services to be subsidised. The resultant excess demand has
been dealt with by rationing the commodity/service through parallel distribution
arrangements principally the PDS (Public Distribution System). The experience with
regard to subsidization of kerosene for the economically weaker sections of society
reveals inefficacy in dealing with diversion, adulteration of other products using
kerosene, increasing subsidization cost, and most importantly denial of subsidy to the
target groups. It has been argued that these issues have arisen not merely on account
of the limitations in the administrative machinery but due to the inherent weaknesses
in the system arising from the relatively low price of kerosene generating perverse
incentives to indulge in diversion and adulteration. It is estimated that the diversion
may amount to as much as half of the quantity of kerosene released for distribution
through the PDS. The diversion to the open market at this rate in 1999-2000
amounted to over 5000 MMT. At a price difference of Rs 10 per litre between cost
and the price at which the kerosene was sold, this meant a loss of Rs. 5000 crore to
the exchequer. This amount does not monetise the significant losses to the society that
arise from adulteration of other products using kerosene.
As opposed to price-based subsidy, direct-subsidy approach could be more efficient as
demonstrated by a small-scale implementation in the PDS system in Andhra Pradesh
(AP). The implementation revealed that AP was able to bring about significant
savings and far better targeting. The 10th Plan Document, p. 371, points to realized
savings of 20,000 tonnes of rice and 7100 kilolitres of kerosene, as a result of use of
coupons system. This scheme may have had other shortcomings, but was evidently
successful in reducing diversion. The experience of AP and elsewhere in the world
point to the desirability of direct subsidisation with appropriate features and
contextual modifications that would ensure better delivery of the subsidy to the
6
targeted users. An appropriate direct subsidy scheme would reduce the costs of
subsidy administration and more importantly would remove the perverse incentives
/distortions that result from price-based subsidies.
Distortions due to Price-based Subsidisation
When subsidies are rendered though low differential prices (price based subsidies)
and through the product being distributed through parallel channels many distortions
and perversities arise. It would be useful to describe the chain of causation so that
significance of the distortion is well understood and recognised.
The lower prices to the user usually lead to increased demand. The extent of effect of
prices on demand depends upon the price elasticity of demand. While for oil products
as a whole the revealed price elasticity of demand in the short to medium term is
small, for particular products it could be large. In the case of kerosene, since the
product is inferior to both LPG and piped gas (LPG/ NG) and superior to traditional
sources of energy (TSOs), at particular levels of income the shift from TSOs to
kerosene and from kerosene to LPG can be expected to take place. Given the current
average incomes in urban areas in India, at non-distorting prices, the demand for
kerosene would be low since the LPG supply system exists and most people opt for
LPG in comparison to kerosene. That there is some demand for kerosene is because
kerosene is priced relatively even lower although both LPG and kerosene are
subsidised, and there is no convenient replacement for electricity given the large scale
failure of the public electricity system to reach customers and provide uninterrupted
power.
Lower prices for kerosene could create options for diversion of kerosene meant for
the subsidised segments to other uses. Besides hotels and restaurants, low priced
kerosene meant for cooking and lighting application in households could be diverted
to industrial uses and for generating electricity through portable gensets. Adulteration
of other fuels especially diesel is another possibility. While these effects may not be
large over the initial period of introduction of the price differentials through a
7
controlled distribution channel, the continued existence of price differentials is bound
to make this almost inevitable due to strong incentives for diversion.
The diversion of kerosene, if priced higher to reflect its cost of production, would
reduce considerably. This would result in recovery of revenue loss due to increased
demand for the adulterated fuels (diesel/ petrol).
In response to the potential for diversion for adulteration or alternative use due to
price-based subsidy, the system of delivery and marketing invariably is more control
oriented and is monitored by multiple agencies. This increases the cost of distribution
and subsidy administration.
Efforts to find seeming technological “solutions” to reduce diversions are likely to
lead to imposition of higher costs upon the society and the distributing entity. Since
the supply to the households would have to be restricted to reduce diversion while
catering to the genuine needs, shortages and consequently allocation/ rationing
problems are created. The simple task of marketing and distribution of a product like
kerosene on commercial lines thereby eventually gets converted into a complex
administrative-cum-policing problem.
Since price-based subsidies imply that commercial players are awarded their costs, the
issue (unproductive activity) of assessing the costs of commercial players would arise.
Use of standard costs results in imposition of either unnecessary costs on the system
(due to pressure from the players) or if the costs reimbursed are inadequate the system
attracts only those players who are willing to recover their ‘costs’ through unethical
practices. Significant manpower and administrative resources of the government then
gets involved in determining the appropriate costs to be reimbursed to reduce the
motivation for indulging in unethical practices.
The price difference between the low priced kerosene for household and the high
priced kerosene for other uses or for diesel creates opportunities for “arbitrage”. This
in turn creates rent seeking in the society and breeds corruption. Dealerships of
8
kerosene are then valued not because they are genuine business propositions but
because they provide opportunities for generating significant amounts of rent. As
rents get institutionalised and well entrenched, it becomes increasingly difficult for
the incumbent government to clean-up the system. There is a distinct possibility of
capture of the regulations by the regulated (dealers and transporters).
Adverse selection with regard to kerosene dealers is inevitable and the oil marketing
companies are then forced to accept as their dealers the wrong kind of people.
Dealerships then increasingly become mechanisms to earn incomes from rents rather
than from efficient distribution of the product (kerosene).
The need to minimise misuse and diversion would imply the need for creating parallel
channels for distribution. The exclusive parallel distribution channels are operable
only at high costs since the considerable synergies in joint distribution of oil products
(with other products) is lost and economies of scope are unavailable.
Consumers using diverted kerosene (such as when used in diesel engines) add to
pollution (given less efficient usage, and greater production of effluents), and to other
social costs (lower engine life, greater intensity of overhaul, slower performance on
the road). When such practices are resorted to by some elements in the user industries
(such as trucking and industry) and when these industries are competitive without
much market power (as is certainly the case of the trucking industry), it is inevitable
that the practice spreads widely. This results in entrenched corruption. Monitoring in
such a situation would at best be ritualised.
The need to produce more of the subsidized product adversely impacts the product-
mix of the refineries and makes them operate at sub-optimal levels. This enhances the
cost of production and adds a dead weight on the society due to increased costs. Also,
when distorted price differentials remain for long it is quite possible that investment
decisions too get influenced by these prices. In case the distortions cease at some
point in the future, the investment choices, the asset structure and the operating
9
processes used could become inefficient as these may not be alterable in the short
term. These are value reducing distortions and could harm the economy significantly.
Since commercial orientation is affected by such policies, disinvestment and
privatisation become if not impossible, certainly less valuable. Such policies may
result in significant reduction in flow of capital in the key sector and harm the
nation’s long-term interests. In the situation of “price arbitrage”, privatisation also has
the danger of internalisation of the available “arbitrage” within the private entities,
since unlike public sector undertakings (PSUs) the private entities would be able to
“arbitrage” with much greater ease.
If the price-based subsidy is also meant only for a group of consumers and not for all
(as is the case with the kerosene), diversions provide huge rents for those indulging in
the same. As a result, the legitimate requirement of those intended to be subsidised
competes with the diversion demands of the rent seekers. In this competition, only
the rent seekers can win since customers have no way of collectively demanding their
due, since collective expression is beset with free rider debility. The rent seekers can
and do organise quickly to ensure that their interests are protected. Large rents would
also allow rent seekers to share their rents with those who are supposed to monitor
them and the system of rents can become so well entrenched that the government
willy-nilly becomes a hostage to the influence that the rent seekers can exert on
government decision making.
The overall result of these effects would be to considerably heighten the fiscal cost of
a rupee of delivered subsidy. The social costs as outlined can be much larger than the
value of the subsidy actually delivered to the poor.
In sum, these perversions result in creation of nightmare for effective governance. The
energies spent in trying to battle diversion and adulteration are wasteful and the
associated direct and indirect costs are huge. The system also does not result in
effective delivery of subsidy to those who need subsidization. There is therefore an
10
urgent need to design alternative system for distribution and subsidization that is more
effective and free of distortions.
11
Chapter 3 The Current System of Kerosene Allocation and Subsidisation
The Ministry of Petroleum and Natural Gas with inputs and requests from the state
civil supplies ministries allocates PDS kerosene to various states leaving it to the
states to make further detailed district-wise (and down to the fair price shop level)
allocations. The quantity allocated to different states has evolved from the actual off
take and additional demands made by the states over the years. Since different states
used different criteria for PDS supplies, the allocation figures for 1992-93 on a per
capita basis were widely different across states.
The differences on a per head basis, ought to have shown larger PDS allocations to
the poorer states where more people are below the poverty line. The allocations
however have been much higher for the richer states – reflecting the total off-take of
kerosene for all purposes rather than merely the off-take by the poor.
Kerosene subsidy is a universal subsidy to all household consumers of kerosene (and
of course, to the beneficiaries of diverted kerosene!). Kerosene being superior to the
use of agricultural wastes and residues, firewood, coal, charcoal, shrubs and bushes
(TSOs) for cooking, and LPG being superior to kerosene, the impact of the kerosene
subsidy on society may be stated as follows: The LPG subsidies have largely
benefited the middle and upper middle classes, and the kerosene subsidies have
benefited the middle, the lower middle and the poor classes. The kerosene subsidies
have gone to the poor through their use of kerosene in oil lamps for lighting and not
as fuel for cooking, particularly in rural areas, since TSOs continue to be far cheaper
and therefore more affordable fuel for cooking for the poor. [Gangopadhayay, S.
(2004), World Bank (2004), Pandey (2002)].
If the lowest two deciles at the all India level (it may mean even the lowest four
deciles in states like Bihar) are considered and the kerosene demand for these
segments are estimated from the NSS Data, then not more than 15% of the PDS
12
kerosene could have gone to these segments. Since the allocations were driven more
by total off-take, the allocations per se were much less effective in directing
subsidised kerosene to the poor. The impact of subsidised kerosene on the consumers,
especially among the non-poor, would have been significant and would have
increased its demand. The price effect of kerosene on the poor in raising its demand
would have been much less since it had to compete with TSOs for cooking (but not
for lighting). The benefit to the poor would have been more due to the lower price as
subsidisation makes it less expensive. Even here the data (NCAER, 2005) suggests
that the diversion from PDS is about 39% out of this about 18% gets diverted back to
household consumption. As a result, the poor (some of whom may not even be having
ration cards) may actually be paying “market prices” for kerosene rather than the
lower PDS prices. [Another study based on the NSS 2002, Gangopadhayay, S. (2004)
estimated the diversion from PDS supplies to be of the order of 50%].
Between 1993-94 to 1997-98, the government increased the allocations by around 3%
per annum to reduce the variation in the per capita allocations across states. Higher
growth “was allowed” to states with lower per capita allocations but in no case the
allocations were reduced during the period. The enhanced allocations arising from
the same would have also increased the diversions, and possibly even the net
diversions (that going outside the household sector).
13
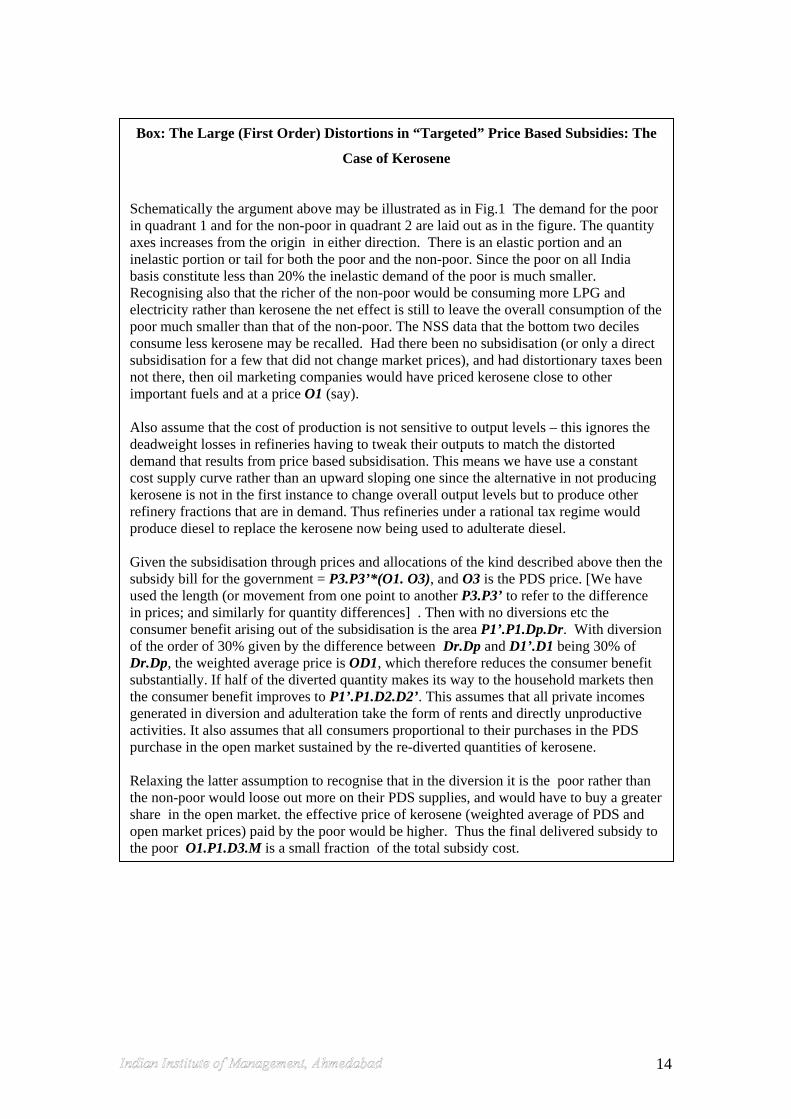
Schematically the argument above may be illustrated as in Fig.1 The demand for the poor in quadrant 1 and for the non-poor in quadrant 2 are laid out as in the figure. The quantity axes increases from the origin in either direction. There is an elastic portion and an inelastic portion or tail for both the poor and the non-poor. Since the poor on all India basis constitute less than 20% the inelastic demand of the poor is much smaller. Recognising also that the richer of the non-poor would be consuming more LPG and electricity rather than kerosene the net effect is still to leave the overall consumption of the poor much smaller than that of the non-poor. The NSS data that the bottom two deciles consume less kerosene may be recalled. Had there been no subsidisation (or only a direct subsidisation for a few that did not change market prices), and had distortionary taxes been not there, then oil marketing companies would have priced kerosene close to other important fuels and at a price O1 (say). Also assume that the cost of production is not sensitive to output levels – this ignores the deadweight losses in refineries having to tweak their outputs to match the distorted demand that results from price based subsidisation. This means we have use a constant cost supply curve rather than an upward sloping one since the alternative in not producing kerosene is not in the first instance to change overall output levels but to produce other refinery fractions that are in demand. Thus refineries under a rational tax regime would produce diesel to replace the kerosene now being used to adulterate diesel. Given the subsidisation through prices and allocations of the kind described above then the subsidy bill for the government = P3.P3’*(O1. O3), and O3 is the PDS price. [We have used the length (or movement from one point to another P3.P3’ to refer to the difference in prices; and similarly for quantity differences] . Then with no diversions etc the consumer benefit arising out of the subsidisation is the area P1’.P1.Dp.Dr. With diversion of the order of 30% given by the difference between Dr.Dp and D1’.D1 being 30% of Dr.Dp, the weighted average price is OD1, which therefore reduces the consumer benefit substantially. If half of the diverted quantity makes its way to the household markets then the consumer benefit improves to P1’.P1.D2.D2’. This assumes that all private incomes generated in diversion and adulteration take the form of rents and directly unproductive activities. It also assumes that all consumers proportional to their purchases in the PDS purchase in the open market sustained by the re-diverted quantities of kerosene. Relaxing the latter assumption to recognise that in the diversion it is the poor rather than the non-poor would loose out more on their PDS supplies, and would have to buy a greater share in the open market. the effective price of kerosene (weighted average of PDS and open market prices) paid by the poor would be higher. Thus the final delivered subsidy to the poor O1.P1.D3.M is a small fraction of the total subsidy cost.
Box: The Large (First Order) Distortions in “Targeted” Price Based Subsidies: The
Case of Kerosene
14
Dp
Fig. 1: Schematic Representation of the Cost of Subsidy and Subsidy actually Delivered to the Poor under the Current Regime
O
Dr
P1
P2
P3
P1’
P2’
P3’
D2
D1’D2’
D1D3D3’
O1
OD1
MO3
15
In 1998-99, another attempt to reduce interstate variation was made with the added
objective of bringing all the states to a minimum level of 10 Kg per annum per capita.
A one-time high growth of 8.58% over 1997-1998 allocation was provided. The rule
of distributing growth in inverse proportion to their per capita allocation (PCA) was
followed. High growth in allocations took place for the states of Orissa, Bihar, MP,
Rajasthan and Uttar Pradesh, which till then had been low on allocations per capita.
This process of enhancing allocations ignored the actual demand for kerosene. In the
absence of any natural addition to demand for kerosene, increased allocations might
have stimulated diversion of kerosene even more. It is therefore hardly surprising that
the NSS studies show that as much as 50% of PDS kerosene was diverted out of the
sector. In 1999-2000, the government belatedly realised the need to moderate the per
capita allocation of kerosene by linking it with the consumption of LPG, which was
rising. A modest corrective effort was made using this reasoning. The ceiling of 24
Kg per capita of kerosene was introduced, and the “shortage” was allocated more to
states with higher PCA.
In 2000-01, there was no change in the total kerosene made available to the states.
However, certain states such as Andhra Pradesh, Rajasthan and Maharashtra
surrendered SKO (superior kerosene oil) in lieu of release of additional LPG
connections. The surrendered SKO was allotted to states with a lower per capita
allocation and only to such states that were at levels lower than the 12.4 kg national
average then. SKO allocation for the year 2001-2002 to various States/UTs was
reduced by about 4.5% over the previous year. The formula adopted for reducing
kerosene allocation against LPG connections released was as follows:
No. of LPG connections released x 5.5 (average family size) x Per Capita Allocation
(PCA) of the concerned State = Quantity of SKO to be reduced.
Over the next several years the reductions in allocation occurred recognising the
increase in the LPG connections, and the present policy is essentially based on the
same reasoning. The belated recognition of the need to moderate kerosene allocations
linking SKO allocation with the LPG connections while in the right direction is
16
nevertheless faulty on account of the following reason. It is almost certain that even
in 1993 the demand might have been more than the allocated PDS kerosene with the
result that the growth in allocations till 1999-2000 itself might have resulted in excess
demand induced by the low prices of kerosene. That means that the reduction possible
in kerosene allocation is from a higher base than warranted.
The adjustment for LPG is substantially incomplete
The matter of adjustment for LPG cannot be done over a unit of analysis as large as a
state, since districts vary widely on the intensity of use of LPG. Urbanisation,
availability of TSOs and per capita incomes, also vary widely within a state. TSOs,
especially agricultural residues and waste, are an important determinant of demand for
kerosene. Indeed even within a district there would be wide variation across talukas.
The idea of allocations based on past off-take with the intention of reducing PDS
supplies would have to be done at the taluka level to limit diversions due to lower
demand for kerosene. This would mean asking the states to surrender what has not
been sold of the allocation on a taluka-wide basis. However, the issue of allocation
within states has been left entirely to the states!
States have no incentive to surrender kerosene quota. The subsidy is entirely borne by
the centre, and given possible nexus between state officials and the distribution
channel, there would be a strong pressure to increase /maintain the allocations. In
some situations where additional LPG connections are being requested for by the
states, this incentive may be moderated by the need to balance the trade-off between
kerosene allocations and LPG connections.
The idea of moving to a uniform per capita allocation is in conflict with the reality
that the kerosene subsidy, being essentially a universal subsidy, would result in more
demand from the middle class, that is, from the non-poor and for diversions.
The releases of kerosene are made on quarterly basis. These need to be lifted before
the end of the corresponding quarter. The quantity of SKO not lifted during the period
lapses. Revalidation and carry forward of the lapsed quota is not generally permitted.
17
State Governments have been arguing for increased allocations. The Centre has asked
the National Council of Applied Economic Research (NCAER) to carry out a study to
determine the demand for kerosene and the extent of its diversion. Awaiting the
report of NCAER, allocations have been maintained for the year 2005-06 at the
previous year’s level. Additional allocations were also made during that year to meet
“urgent” demands of PDS kerosene from some states.
Although the NCAER has submitted its report in 2005, no action to correct the vast
distortions induced by the current subsidy administration has been initiated so far.
After all adjustments made thus far, the distribution of subsidised LPG and kerosene
per capita is as brought out in Table 1. The figures in the Table have been computed
using the kerosene equivalent of LPG. The figures recognise LPG’s higher delivery of
energy to the cooking pan per kg of product as compared to kerosene. The ratio of
28:15 has been used for converting LPG to kerosene based on ITDG, c. 2000 from
“Rural Energy and Development”, The World Bank, Washington D.C., 1994. These
figures show a high 78.56 kgs of kerosene equivalent consumption per person for
Delhi in 2003 as compared to a low of 11.15 kgs of consumption for Bihar! Indeed
there is a very good inverse correlation between poverty levels across states and their
use of subsidised fuels. Since these levels are based on actual sales of subsidised LPG
and kerosene rather than on allocations (which anyway are very close), there is clear
evidence of the perversity of kerosene (and LPG) subsidies as far as their being meant
for the poorer segments of society.
The data in table 1 can be further analysed to arrive at the determinants of the joint
demand for LPG and kerosene. The question is of more than academic interest since
the kerosene allocations are increasingly being linked to LPG connections and the
kerosene subsidy being justified in the interest of the poor.
The data on “cooking fuel demand” as in Table 1 (across 19 states for the years 1994
to 2003) from the CMIE database, Business Beacon, were drawn up as a panel and
were subjected to panel regression analysis on likely determinants of demand such as
population and per capita income. Being essentially on account of household use
18
(cooking and lighting use), the kerosene equivalent of cooking fuel is expected to be
most importantly determined by the population and the per capita income, since all
families cannot be assumed to be above the level of income where their need for
cooking fuel is fully met from fossil duels (the poor would be using substantial
amounts of TSOs, and their purchases would also be limited by their incomes), there
would be a per capita dependence too.
Table 2 contains the results of regression of cooking fuel on these two dependent
variables with State dummies for the constant term (18 to take care of 19 states in the
data). As expected, the coefficients of both independent variables are highly
significant. The State dummies for most of the States are also statistically significant,
implying that there are significant state level determinants not accounted for by the
two independent variables.
The set of independent variables is expanded through inclusion of real GDP in the
“transport, storage and communications” sub-sector. This variable captures much of
the interstate variation suggesting that the “demand” arising from the sector (truck and
bus transport would be an important component of the sector besides the railways,
airlines and telecom) could explain the unexplained variation. The explanation power
of the model improved, as indicated by the improvement in the overall F-ratio. The
results are reported in Table 3. Thus diversion of the kerosene for use in the transport
sector (adulteration of diesel with kerosene) is suggested by the result.
The above inference was also confirmed in our interviews with people in the field
including truck operators, oil company officials, besides private parties involved in
distribution and FPS (Fair Price Shop) owners and civil supplies officials. The relative
economics of truck operations using kerosene is brought out in Tables 4 and 5 based
on the information we were able to gather from the field. There are vast returns to
adulteration of diesel with kerosene at Rs. 10 per litre price differential based on the
cost adjusted price of PDS kerosene when diverted. Even if the price of kerosene is at
Rs 18-20 per litre, the returns to adulteration are large. Thus rents are large and the
sharing of rents between truck operators and fuel retailers is inevitable. This means
19
that ROs (Retail Outlets) sourcing kerosene could adulterate with the knowledge of
the user to allow both to make very significant gains.
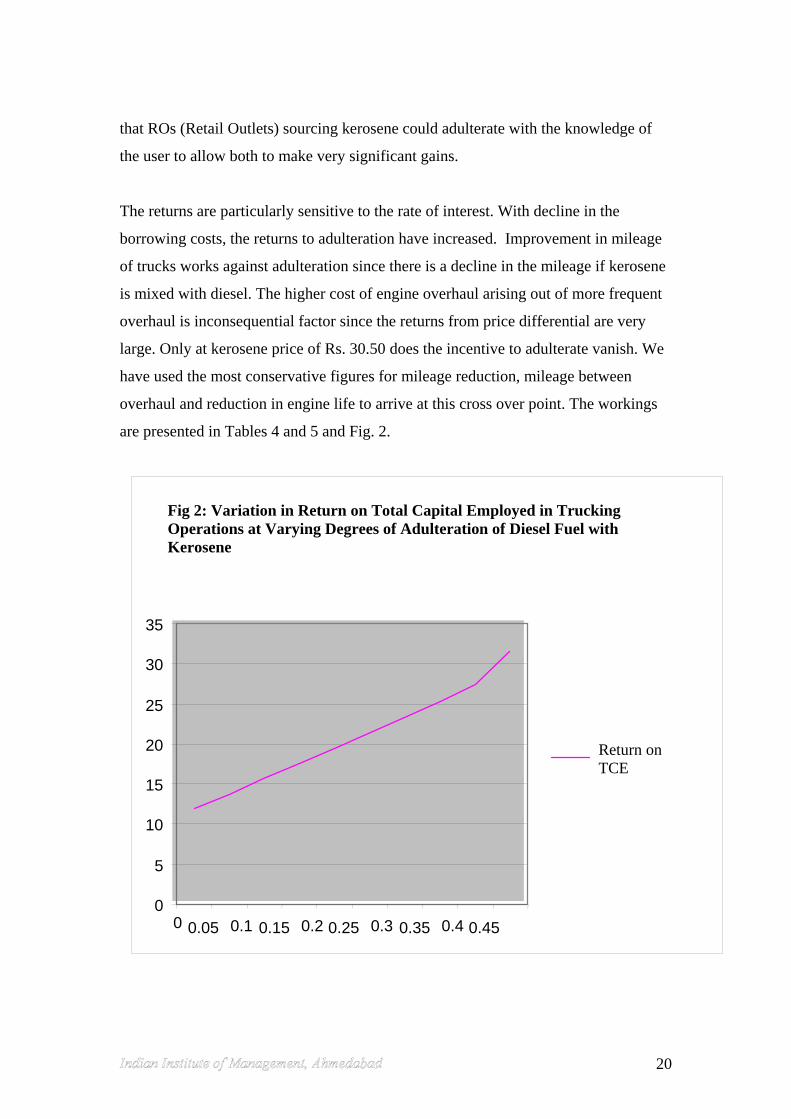
The returns are particularly sensitive to the rate of interest. With decline in the
borrowing costs, the returns to adulteration have increased. Improvement in mileage
of trucks works against adulteration since there is a decline in the mileage if kerosene
is mixed with diesel. The higher cost of engine overhaul arising out of more frequent
overhaul is inconsequential factor since the returns from price differential are very
large. Only at kerosene price of Rs. 30.50 does the incentive to adulterate vanish. We
have used the most conservative figures for mileage reduction, mileage between
overhaul and reduction in engine life to arrive at this cross over point. The workings
are presented in Tables 4 and 5 and Fig. 2.
Fig 2: Variation in Return on Total Capital Employed in Trucking Operations at Varying Degrees of Adulteration of Diesel Fuel with Kerosene
0
5
10
15
20
25
30
35
0 0.05 0.1 0.15 0.2 0.25 0.3 0.35 0.4 0.45
Return on TCE
20
Chapter 4 The Current System of Distribution of Kerosene
Much of the distribution responsibility really lies with the state civil supplies
departments. Oil companies release quantities of kerosene from their oil depots to
licensed dealers based on authorisation from the state government in quantities as
determined by state government civil supplies department. The company’s
responsibilities end with the off-take of the requisite quantities. The company of
course checks licenses, the trucks and dealers for their equipment including the
storage tanks, measuring and dispensing equipment. It is also responsible for safety.
The wholesalers, who typically own or lease trucks, distribute the product to the
retailers – the PDS kerosene shops. Typically dealers have territory wherein the
quantities are determined by the department of civil supplies for each fair price shop
(FPS). Small quantities of non-PDS white kerosene are also intermittently lifted
typically by the ultimate bulk consumer and by the dealers on behalf of the ultimate
consumer. Besides PDS shops, sometimes individuals are attached to the retailers as
vendors who deliver kerosene from mobile carts and cycle rickshaws in areas not
served by permanent FPSs.
The dealer’s truck that lifts stocks from the company depots typically carries a list of
shops to which kerosene is to be delivered. If a particular FPS owner does not have
the ready cash, kerosene is not delivered to the shop. Each FPS shop receives supplies
at least twice a month. Despite several attempts, we could not get the details of the
quantities sent, the differences if any at the FPS level, the records of the allocations
and off-take at each level even on a sample basis. Ostensibly based on the population,
the number of ration cards, the number of BPL (Below Poverty Line) cardholders, and
the number of LPG connections in an area, the allocations on a FPS level are
determined by the civil supplies and then aggregated over taluka, district and state
levels. In Gujarat since the kerosene allocations do not distinguish between the BPL
and non-BPL families, the allocations are logically much more influenced by the
number of LPG connections in a particular area than due to the number of families
holding ration cards in the area. Since the number of families with cards is close (but
21
not equal) to the number of the families as such, the number of LPG connections is
ostensibly the determinant of the allocations of kerosene.
There is little documentation over and above the usual documentation carried by oil
tankers that kerosene tankers carry. Drivers have a list of dealers to cover, which does
not change with the particular load but is merely a cyclostyled list of the shops in the
route of the truck/ dealer. Even the addresses therein may be incomplete. Given this
limited documentation, there is little that the kerosene truck can be checked for. Only
if it is found way outside its distribution territory can the truck driver be questioned.
Wholesale dealers are continually reallocated among the various distribution
territories. The motivation in doing so is to prevent the wholesaler and the retailer
from colluding to divert kerosene meant for PDS sales to other uses, including
diversion to the transport sector and diesel retailing.
Retailers pay with cash for the kerosene that is supplied to them. They distribute the
kerosene to ration cardholders as per their entitlements. The quota for the retailer is
ostensibly the sum of the entitlements of all cards that come under the retailer; and for
the dealer the sum of the entitlements of all the retailers in the distribution territory
/beat.
Civil supplies ministry officials continually visit the retailers and the dealers’
premises to check and carry out inspection; and sometimes even suspend the license
of retailers for diversion.
Our Observations on the Distribution System
1. Rotating dealers among the various distribution territories through the state
means that any checks on particular territories or dealers to throw up
incriminating evidence of diversion is prevented.
2. The records of the dealers and the retailers are apparently maintained to near
perfect consistency. This more than anything is an evidence of forced
22
matching of the figures. The records showing that the releases match off-take
month after month are not possible unless the releases at the smallest
distribution unit are way below the demands. This is unlikely since the
allocation of 2 litres per capita per month is probably very close to the demand
from consumers who would be using only kerosene for their cooking.
3. The system of control over diversion of kerosene is based on verification of
records maintained manually. Hence, any reconciliation down the chain is
difficult. Any independent check on the same would take so much time and
effort that it is hardly ever likely. In addition, in the absence of any conflict
between the parties that form the chain, everyone in the chain is likely to
benefit from diversions., It is therefore unlikely that the records would not
match but for any minor inadvertent discrepancies.
4. The actual distribution of PDS kerosene seems to be or is likely to be far
below the off-take on records and dealers are likely to divert truck loads to
industry and for adulteration on own account as a truck operator or more
typically to diesel oil retailers (ROs) or to the kerosene black market.
5. What reaches the typical retailer is a fraction of the sum of the entitlements on
the cards. Since individual consumers cannot cumulate their allocations and
cannot claim this month the kerosene which was not received last month, the
strategy of the system is to release a minimal quantity over a few days
(typically two or there days) of the month, so that only those consumers, who
can stand in long queues and who have ready cash, can hope to purchase
kerosene at the rationed price. In many areas, the supplies seem to be larger
than the demand since those with LPG connections would have very small or
no demand for kerosene.
6. The entries at the retailer (FPS) level are barely visible carbon copies of small
bills on which the ration card numbers are entered. There is no way to prevent
23
an FPS owner from entering the number of all cards irrespective of whether or
not kerosene was purchase by the cardholder.
7. The FPS shop owners’ ability to divert the kerosene for adulteration and
industrial use (i.e. to exercise “arbitrage”) also seems limited since his scale of
operation is small. The only way for him is to dispose off the PDS kerosene in
the local market for white kerosene, would be through decolouration of the
PDS kerosene. This would be possible only if there is sufficient demand in the
local market for white kerosene. Alternatively, he could divert some small
quantities to black market but this would be costlier as he would have to shift
it away from the shop.
8. It is likely therefore that diversions occur at the dealer level in connivance
with the civil supplies officials, who can use their bargaining power vis-à-vis
the FPS owner to make him fill up the requisite numbers of false vouchers. As
a result, only a part of the kerosene that is lifted by the dealer is likely to be
actually sent on the retailers. The current system of record keeping and
entrenched nature of relationships due to long history of price-based subsidy
on kerosene and other items enables this diversion without effective controls.
9. The FPS owners maximum possible income assuming zero operating expenses
is approximately Rs. 11000 to Rs. 15000 per year; the latter figure being for
the prevailing “average sales” (average release per FPS+Ferrywala), and the
former if the releases are fully adjusted for LPG connections and LPG sales.
Thus, the income of an FPS shop owner is no more that Rs. 15,000 per year.
On food distribution, his income is even lower (Planning Commission, 2005).
It is estimated that about one third or more of the gross income for a combined
FPS owner arises on account of his kerosene business. Clearly therefore, the
FPS owner survives only because he gets a share in the “arbitrage” income
arising from diversion. Given the low bargaining power, the FPS owner has
become a mere tool for rent extraction with a small part of the rent being
24
shared with him to keep him in business and continue to ‘participate’ in the
deception.
The dealer is likely to be the key player in the adulteration and the diversion business.
The rents generated are so large that it can be shared with the retailers (FPS owners)
and civil supply officials. Indeed such is the design of the system that there is nothing
much that supervision or monitoring can do. The mamlatdar and the lower civil
supplies officials including the inspectors are likely to get involved since all
inspections can at best be ritualistic. Even a rudimentary analysis reveals that even
for routine checking of all FPS for consistency of sales with releases (assuming that
there is any incentive to do so other than merely as a ritual), the time required would
involve services of over 300 inspectors. The salary and travel cost for inspection
would add another Rs.0.25 per litre to the cost of kerosene released (Tables 6, 7 and 8
and 9).
As estimated in various ways, diversion and adulteration is likely to be a big business
and the administration would be willy-nilly a party to the same.
In case of Gujarat, the kerosene release as per official figures is currently around 15
KG per capita. Including the LPG releases and going by the gross sales of kerosene
reported by the oil companies, the kerosene equivalent of cooking fuel released
(kerosene + (28/15)*LPG) is as high as 32 kg per year which is approx. 40 litres per
year per capita. This is far too high since nearly 60% of the population in Gujarat is
rural and consumption of TSOs would also be considerable.
Going by the reported figures of kerosene and LPG releases and the electricity sold to
consumers, the expenditure per month per household works out to around Rs. 288
c.203-04. The NSS (National Sample Survey) figures for fuel and light that also
includes consumption of firewood and TSOs, besides things like matches, petrol and
diesel, are close to this figure. We can therefore infer that there is significant diversion
outside the household sector. Since the detailed break up of NSS expenditure on fuel
and light was not available to us, we had to resort to this comparison. Others who had
25
access to the data have shown that the NSS based expenditure estimates of kerosene
are far lower than the kerosene release figures (Table 9). In the year 2003 977.29
million litres of kerosene were released under the PDS. The NSS59 valid for the same
year can account for only 483.60. Thus the diversion is to the tune of 493.7 million
litres or 50.5%. A 140 million litres were also reported as non-PDS kerosene
consumption bought at prices much higher than PDS prices. Thus there is a reflow of
14.4 % so that 36.1% of the PDS kerosene in Gujarat is used for adulteration and in
non-household applications. (Morris, S., Ajay Pandey and S.K. Barua (2006)
forthcoming, IIMA mimeo, “Kerosene Subsidies in India: A Direct Subsidy Scheme
to Overcome Large Distortions”)
The dealership business is overly profitable - the wholesale margins are the same as
retail margins! And the profitability of the transport operations is high. The oil
companies do the allocation of up-liftment of SKO, dealer-wise, based on the quota
allotted to the state and the districts/resellers allotted by the State Government. The
trucks and the drivers are registered with the Oil companies so that they are able to
ensure that the vehicle is right and the drivers are identified. The trucks are loaded by
the Oil companies based on the order received from the dealer and the draft paid by
the dealer. The dealer collects cash from resellers in advance. The Dealer distributes
the products to the resellers without unloading the product into any intermediate
storage most of the times. If he has storage license then he gets Rs. 43 per kl more as
commission. The Dealer gets no compensation for distributing SKO to the resellers
located within 10 km of his 'depot' or storage location. The cost of distribution else is
recovered from the resellers who in turn are allowed to charge the same from
customers. Price allowed by State : Rs. 8589 per kl and price paid to oil companies :
Rs. 8141.90, that is, margin of 447.10 per kl. See table 10 for a rough estimate. They
reveal that the annualised returns are in excess of 200% .
The final purpose for diversion arises from the industrial demand where the use of
kerosene is either necessary or is a substitute for other more expensive fuels.
Similarly, its application in portable generation sets and in marine engines used by the
26
fishing industry is cost saving in comparison to possible alternatives. But these
demands are not large enough to support the vast diversion of kerosene. The
adulteration of diesel with kerosene in the road transport business and more generally
in diesel engines coupled with selling of kerosene for cooking and lighting to the
households through black market are the chief avenues for large-scale diversions.
We have examined the economics of kerosene use in trucks making conservative
estimates of the cost saving and these are considerable enough to make adulteration a
major business (Table 5).
27
Box: Performance Evaluation of Targeted Public Distribution System (TDPS)
(Programme Evaluation Organisation, Planning Commission, Government of India, March 2005 )
The key findings of the exercise are as follows: About 57% of the subsidized grain from the Central Pool does not reach the target group. Of the 57%, about 36% is siphoned off the supply chain and 21% reaches APL families. Only about 23% of the sample FPSs are financially viable. The rest survive of leakages and diversions of subsidized grains. GOI spends about Rs. 3.65 to transfer Re 1 to the poor. TDPS suffers seriously from targeting errors of exclusion and inclusion. To improve TPDS, the committee has two broad recommendations: 1. Streamline BPL identification through:
- use attributes that are easily observable and leave less room for arbitrariness,- use wealth ranking methods – similar to the method used in AP, MP and
Rajasthan for implementation of DPAP, - get a fresh survey done by reputed survey organizations (NSSO, NCAER,
ICSSR), - active involvement of PRIs for identification of the poor – for example similar
to the process for used for PRA (Participatory Rural Appraisal), - create computerized baseline database and update the same over time to
make the same error-free and up to date.
2. Make the delivery mechanism more effective through: - improve financial viability of FPSs – each state must draw up a plan to make
them viable, - fix a margin that improves the financial viability, - PRIs must be empowered to inspect accounts/ transaction records of FPSs –
their findings must be regularly discussed in the Gram Sabha, - authenticate delivery of grain by PRI members, - allow consumers to draw quota in weekly instalments. - allow BPL families to lift additional quota at rates for APL families, - reduce the price for APL families by the holding cost of grain so as to
increase upliftment, - ensure that entitlement to food grain is not lower than that stipulated by GOI A rudimentary assessment of costs shows that the additional cost of implementing the system would be about Rs. 400 crore per annum and that will yield a savings of Rs. 4197 crore annually.
28
It is quite clear from the above observations and recommendations that the current method of operation of TDPS has failed to achieve the objectives with which the method was introduced in 1997 – namely, to improve targeting of subsidy and to reduce the burden of subsidy on the government (if poverty is indeed declining) over time. The recommendations suggested by the committee suffer from the same deficiencies that plague the process now. Therefore, an out-of-the-box thinking is required to check diversions and leakages. The method being suggested for kerosene distribution has two major advantages: a) complete electronic record from the point of transaction would ensure that there is an audit trail of all transactions, b) creation and updating with every transaction of computerized database for verification, analysis and course correction if required, c) freedom to the BPL families to allocate resource to their preferred items for consumption (in case cash is paid out to them and not coupon for uplifting kerosene), d) financial viability of all the players involved in the process chain for disbursement of subsidy, and e) complete record of utilization of subsidy.
The issue of better identification of BPL families remains. A combination of criteria may be adopted to ensure better targeting. It would be useful if the amount of subsidy is based on the number of criteria on which a family qualifies for inclusion. The issuance of a machine readable card would improve tracking and sample check of remove errors of classification over a period of time.
29
Chapter 5 The Problem and the Changes Required
The current system of kerosene allocation, distribution and subsidisation, as argued so
far, has several short-comings. On the allocation side, the states are always likely to
ask for higher and higher allocation as they do not bear the cost of higher subsidies
arising from higher allocations. The distribution system for kerosene within a state
would also create pressure for higher allocations in the presence of possibility of
diversion of kerosene at a higher price than the price fixed for the retail end
consumers through fair-price shops. In fact, in the presence of diversion, even the end
consumers would also demand higher quantity to be allocated as that is likely to
increase the quantity available to them despite diversion.
The distribution system for kerosene, at least at the retail level is questionably
unviable without the possibility of diversion and higher prices realised thereby. It is
just as possible that a large number of retail outlets are unviable for other petroleum
products (diesel, petrol) unless adulteration or selling short quantities is used to
enhance margins and profits! The possibility of such adulteration itself is likely to
have attracted rent seekers with political clout over a period of time. The amount of
price difference between kerosene and other fuels leaves large rents for the
distribution chain. It also forces or distorts choices made by the society in the form of
use of adulterated fuel leading to wasteful and incomplete burning of fuel, pollution
and shortened engine lives as the cost of such inefficiencies are externalised - to be
borne by the larger society.
The administrative machinery to check diversion and to ensure adequately supply of
kerosene, in the form of civil supplies departments, is unlikely to be effective in
preventing diversion of kerosene and in ensuring that it reaches poor for whom it is
meant. This is because (a) the manual accounting and book-keeping system is too
difficult to exercise any kind of effective control, and (b) the associated rents from
diversions are likely to corrupt the administrative machinery itself. The antiquated
system of record keeping also makes it virtually impossible for any independent
30
checking of the releases by an outsider. Since the accounting is not real time and also
because the accounts are decentralized, it is easy to manipulate figures ex-post so as
to reconcile the figures for the entire distribution chain. The consumer groups are
also likely to be less effective in controlling diversions in absence of adequate,
reliable and quick retrieval of information. At suitable level of aggregation, diversions
can be easily hidden behind aggregate statistics. (c) Above all, the core problem from
which all the problems emanate is the price “arbitrage” opportunity. Thus attempts to
put better systems while keeping the overall price “arbitrage” open would only result
in higher administrative costs and ritualisation of monitoring systems.
In short, the key attributes and issues in the current arrangement for allocation,
distribution and subsidisation of kerosene can be summarized as follows:
(a) Universal price-based subsidy causes severe distortions and social waste
(b) Lack of centralised information and controls to monitor releases and sale of
kerosene permits fudging of accounts
(c) Strong incentives for diversion of kerosene for alternative uses and for sale
through black market
(d) Likely denial of kerosene to the poorer end consumers through diversion as
their bargaining power is extremely weak
(e) Excess demand of kerosene created by the possibility of diversion and
unfulfilled demand of targeted consumers
Some Desired Elements of an Alternate System
Any changes proposed in the current system need to deal with the short-comings
described above. The system instituted in lieu of existing system should be such that
the subsidy, if decided by the Government, reaches targeted consumer groups rather
than the unintended beneficiaries. It should support capture of information on the
allocation and release of kerosene at FPS shop on real time basis and through periodic
reporting so that the information can be easily monitored by the end consumers,
consumer groups and can not be easily manipulated later to reconcile the data at each
31
level of distribution chain. Any changes in the existing system needs to also weaken
the incentive for diversion and should increase the bargaining power of the entities
down the distribution chain. In other words, it should lead to empowerment and
consumers at the expense of wholesales and civil supplies department, who currently
enjoy maximum power in the system. For this to happen the consumer choices need to
be widened and the retailer’s business has to be viable.
The incentives for diversion can be easily removed by making kerosene subsidy direct
instead of being price-based subsidy. In case the subsidy is restricted to target
consumer groups but remains price-based, it is likely to end up in denial of kerosene
to the targeted consumer groups given their weak bargaining and political power.
Thus as long as kerosene is sold at a low price universally or to the target
consumer groups, it would be difficult to prevent diversion of kerosene. The only
way to eliminate such distortions would be to provide subsidy directly through
cash equivalents to the end consumers. If need be, this can be done for all ration
card holders drawing kerosene irrespective of their income levels. This would
substantially reduce the effective demand for kerosene and consequently increase the
revenue for the government through higher demand of competing fuels such as diesel.
Improving the economics of distribution would require ensuring adequate margins for
the retailers. This would increase the end consumer price as well. An alternative,
which is consistent with direct subsidy to the consumers, is to let the kerosene be sold
on a commercial basis just as any other product. The effective end consumer price
would be less by the amount directly received as cash. The retailer margin for those
FPS shops in villages and remote areas, where kerosene may not attract commercially
oriented shop keepers may be kept higher.
The identification of the target segment in a country like India always poses major
difficulties. This has often been cited as the reason for continuation of price-based
subsidies. While the problem is difficult since any identification exercise always has
errors of omissions and misclassifications, it is not a valid reason to insist on price-
based subsidisation. Even if all ration holders are given cash equivalent of existing
32
subsidy, socially it would be much better compared to the current method as it would
reduce incentives for adulteration. Moreover, identification itself can be improved if
the process followed takes into account inputs from institutions other than the official
administrative set-up. Similarly, making the identification outcomes / results
transparent can elicit response from the public rather than being based on discretion of
the officials involved in identification exercise. This can improve the accuracy of
identification.
The last and extremely crucial element in any new system has to be centralized
information and control system, which can support the required monitoring and
control on subsidy so that the subsidy flows to the intended groups rather than
siphoned by vested interest. This is possible today through use of information and
communication technologies to capture information at the point of transaction as and
when a transaction occurs. In addition to such a system, the system should empower
the beneficiaries to monitor their payments and receipts as per their entitlements.
Possible Solutions
In line with the above discussion, the possible solutions and policy choices to address
some of the problems of the current system are as under:
1. Universal direct subsidy
2. Targeted direct subsidy
3. Improved monitoring and control through use of IT and communication
technologies to check diversions within the current system.
The first two essentially are similar except for their impact on the amount of subsidy
to be given by the Government. The first one would increase the subsidy and would
also require larger system for subsidy administration and monitoring in view of larger
number of beneficiaries. The second one would require systems support only for those
who are identified as the target group for the subsidy. The second one would also face
issues related to identification and costs associated with it whereas the first one would
33
not. Both first and second options are compatible with market-based distribution of
kerosene wherein the beneficiaries receive cash to subsidise the cost of kerosene.
There would be no need for specialized infrastructure for marketing and
distribution of kerosene. The allocation process and the FPS’s can be generally
eliminated except may be in remote areas and villages.
The third option can be viewed as strengthening the monitoring and control system to
allow for real time centralized tracking of the entire distribution system mapped
through a state-wide centralized data base and information system linked with the
entire distribution chain. While this solution may improve allocations and possibility
of detecting leakages, the price differential between open market competing fuels and
subsidised kerosene prices would still leave strong incentives for diversion. Real
improvements may also not be realisable as “innovations” in fudging, in ritualisation
and in obfuscation would happen with the passage of time. It also would require
restricting the sale of subsidised kerosene only through a control system as at present.
Given these problems, it is unlikely that such an administrative solution would
overcome the ills associated with the current system.
In the light of the above analysis, we would think that targeted direct subsidy
administered through a centralised system without the need for any special
channels for distribution of kerosene is the most desirable solution.
34
Chapter 6 The Proposed System of Direct Subsidisation
In order to minimise the risks associated with implementation, while the system could
be designed for eventual all-India application, a beginning can be made in one state
on pilot basis. The proposed system is based on using IT to administer kerosene
subsidy (and later possibly other entitlements) through a card based centralized
system. The system needs to be capable of recording the transaction details for
analysis, monitoring and control. The targeted consumers would receive their
entitlements as defined by the subsidy decided by the Government and would be paid
as cash/cash equivalent which may be used by them to purchase kerosene from the
market.
The cash equivalent would be collected by the system operator, who would in turn get
paid by the Government through transfer after scrutiny of the bills raised. The system
operator as well as the acceptors of cash equivalent would operate on commercial
basis with the Government paying for the cost of operations. As against these
incremental costs, the Government stands to gain from savings of costs associated
with the current distribution system, increased revenue through higher taxes on
account of increase in demand for competing fuels and likely reduction in the subsidy
bill on kerosene. These benefits are in addition to elimination of social costs
associated with diversion.
35
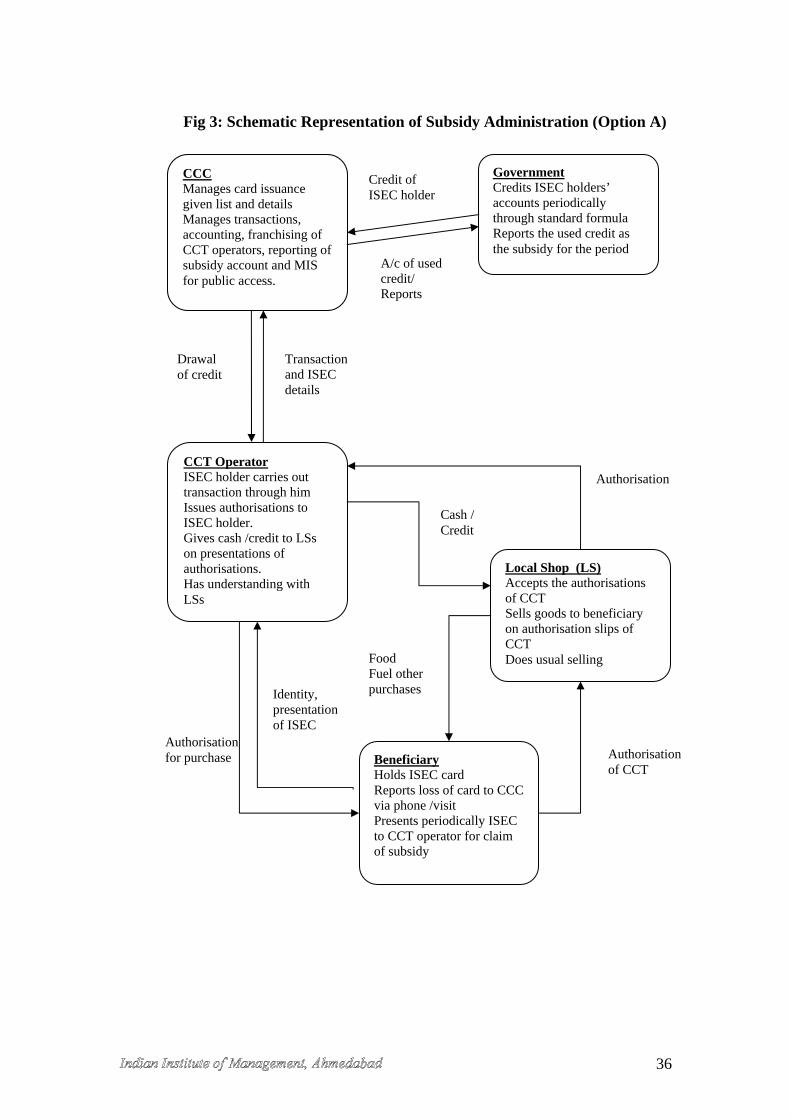
Government Credits ISEC holders’ accounts periodically through standard formula Reports the used credit as the subsidy for the period
CCC Manages card issuance given list and details Manages transactions, accounting, franchising of CCT operators, reporting of subsidy account and MIS for public access.
Credit of ISEC holder
A/c of used credit/ Reports
CCT Operator ISEC holder carries out transaction through him Issues authorisations to ISEC holder. Gives cash /credit to LSs on presentations of authorisations. Has understanding with LSs
Beneficiary Holds ISEC card Reports loss of card to CCC via phone /visit Presents periodically ISEC to CCT operator for claim of subsidy
Transaction and ISEC details
Drawal of credit
Authorisation for purchase
Identity, presentation of ISEC
Local Shop (LS) Accepts the authorisations of CCT Sells goods to beneficiary on authorisation slips of CCT Does usual selling
Authorisation of CCT
Food Fuel other purchases
Authorisation
Cash / Credit
Fig 3: Schematic Representation of Subsidy Administration (Option A)
36
Key Process Elements of the Proposed System
The elements of the proposed system recommended by us to administer targeted
direct subsidies are summarised and discussed below (Fig. 3 presents a schematic
representation).
• The subsidy is directly given to the target consumer in the form of
authorisations/ coupons which the beneficiary can use to buy kerosene /food in
the market. This would make his and others’ decisions on use of kerosene
independent of artificial (subsidised) price.
• The parallel distribution network of the PDS would become redundant as a
consequence and could therefore be abolished entirely. Instead, consumers can
use local markets to purchase their grains /kerosene, with their authorisations
/coupons. This will eliminate entirely the humungous inefficiencies associated
with the PDS.
• Consumers are issued Identity cum Subsidy Endowment Cards (ISECs) once.
(The next section outlines the details of the scheme for issuance of ISECs).
These cards would allow the targeted consumers to claim their subsidy
entitlements.
• The ISECs would have validity for five years from the date of issuance. This
would mean that the category for a family could change once in five years.
• The data related to all consumers would be available on a centralised database
to be maintained by the central card issuer-cum-subsidy administrator.
• The entitlement for each category of consumer would be defined by the
government and changed any time through entries and changes in the
centralised database.
• The information and issuance system would build almost entirely on the
services currently available in the market and being used for commercial
purposes such as for credit card operations.
37
• The cards issued to the customers would be akin to credit cards with the
difference that every month the government would credit the amount of
subsidy to the customer to the extent of his entitlement. This would be
automatically done every month through a programme on the basis of
instructions given by the Government.
• The consumer would be allowed to go to any shopkeeper, STD/PCO stall/
Post office or dealer in oil products who has a Credit Card Terminal (CCT)
(e.g. Verifone, Hypercom, Ingenico etc) to access and utilize his entitlement as
per his convenience with no restriction on the number of times he uses the
card.
o The beneficiary pays the difference between the local price of kerosene
/food she desires to purchase and the subsidy entitlement and issues
out an authorisation from the CCT operator. The CCT operator
connects the instrument with the consumers ISEC and debits her
account. The authorisation issued by the CCT operator is in the form of
a slip with the transaction number and the amount for purchase
authorisation equal to the debited amount on the consumer’s subsidy
credit created by the government and the amount she pays to the CCT
operator. The CCT operator’s authorisations are recognised by local
kirana shops/ super markets / kerosene /oil dealers (Local Shops or
LSs). (Option B)
o The consumer presents the ISEC, signs/ places thumb impression on
transaction slip and gets authorisation to the tune of the entitlement
debited by the CCT operator. The CCT operator simultaneously credits
his own account via the same transaction. The authorisation of the
CCT operator is recognised by local shopkeepers. (Option A).
o It is assumed that acceptance of authorisation would be in the interest
of the shopkeepers and CCT operators. Otherwise, CCT operator itself
can give out cash to the consumer. (Option C)
• The consumer with the authorization buys food /kerosene from any of the
local shops with whom the CCT operator has an understanding. (Option B).
The consumer with the authorisation and additional payment buys food and
38
fuel from local shops (Option A). Alternatively, the consumer could use cash
given by the CCT operator (Option C).
• The local shops collect the authorisations and collect money /credit to their
accounts from the CCT operators on a daily or some pre-determined basis
from the CCT operators.
• In this system the consumer could use her authorisations in a way so as to buy
more food or fuel of her choice. Consumer choice would therefore be fully
reflected in the purchase decisions. She could also buy any other commodity,
so that the current subsidy on account of food and fuel would become a
general consumption subsidy. This would have a far greater ‘utility’ to the
consumers compared to specific commodity linked subsidies currently in
vogue.
• The proposed method is perhaps the simplest solution for delivering
consumption subsidy that provides the highest possible utility to beneficiary
(through preservation of choice) while ensuring delivery of subsidy.
• The value of the ISEC would be net present value of the stream of benefits
that the card holder would be entitled to. Therefore the card itself could
potentially be tradable if a person other than its holder can use the same. This
problem can be greatly reduced by making the card cancellable at any point in
time, and the card holder being entitled to a new card at a small cost. Thus
even if a money lender or someone else lends to the poor consumer on the
basis of his card, he knows that the card holder after giving him the card can
legitimately cancel the card. This risk, and the high cost of closely monitoring
the consumer and ensuring that she does not do so, would render its value
small in relation to the net present value of the stream of entitlements. This
means that the card holder’s choice would be narrowed down to actually using
the card, and not selling or mortgaging the same. At the second level, the use
of a ISEC by any other person can be made an offence on the same grounds as
in the case of credit cards. Signature/ thumb impression and photograph on the
card would provide the necessary safeguards. A second card issued to spouse,
while the first card is issued to the head of the family, on the lines of
39
subsidiary credit cards should be possible, and would provide the required
convenience in using the card for purchases of fuel and food widely.
• The business of CCT operation would be automatically viable since in
addition to a small transaction fee which the CCT operator would earn he
would also enjoy the benefit of the credit arising out the difference between
the time his account is credited by the government by debiting the account of
the ISEC holder, and the time local shops present his authorisations for cash.
• Larger shops should be allowed to combine the functions of the CCT operator
and the local shop. Indeed the need to provide for the separation arises only
because not many shopkeepers (especially kirana shops) encourage credit card
purchases. Credit card companies usually charge some percentage of sales
made through credit cards to small shop keepers and for certain kinds of
commodities, which in highly competitive businesses would discourage such
sales. The fact that the transactions are recorded by the credit-card issuer also
is deterrent.
• CCT operator could ideally combine STD /PCO operations along with CCT
operations.
• (Option A). CCT operators could issue authorisation for the value of the
entitlement. Such practice would actually be beneficial to the ISEC holder
since even without any cash she can get the benefit of her entitlement.
Moreover since in Option A, the CCT issues authorisations only to the extent
of the subsidy entitlement, he does not have to know the market price of the
good in question. Thus the purchase decision and the disbursal of purchasing
power is completely separated. It makes the task for all parties much easier. If
the government wants to fix the entitlement in quantities it would have to
work out the equivalent in money terms on the basis of state level prices and
credit the ISEC holder through a standard formula. This may be done once a
month. Henceforth Option B would be dropped from further discussions,
though the adoption of any of the options would be dictated by the ground
realities.
• CCT operations should not be limited in any way. In urban areas and in dense
rural areas for very low fee per transaction or even no fees CCT operators are
40
likely to come forward. In the few remote rural areas, a few CCT operators
would have to be encouraged to operate through payment of higher transaction
fees. Alternatively, mobile CCT operators could be allowed by the card issuer.
Such operators can move across an area for issuing authorisations/ disbursal of
cash.
• CCT operations being purely financial intermediaries would have a relatively
low cost per rupee of subsidy delivered, in relation to any other system such as
monthly issue of coupons by the government or through a system dedicated to
the purpose of subsidy. Since the CCT is common to other credit card
transactions the investment cost in most case for the CCT operator is nil,
wherever such infrastructure exists.
• Since the proposed system rides on existing transfer of information and credit
facility, its social cost is relatively very small.
• With 200 million families, out of which about 30-40 million families are likely
to be poor and therefore beneficiaries of entitlements from the state, the
business of CCT and credit cards in general would receive a boost. It would
also have positive spillover effects, especially if for all subsidies for the target
groups the same method is adopted. Thus fertilisers, LPG, electricity, small
pensions and other income transfers, besides food and kerosene could be
disbursed on the same principle. Indeed, it can be designed with enough fields
of information such that it can become acceptable identification vehicle in the
long run.
• Leading credit card companies (CCCs) or transaction processing companies
with expertise in use of IT and/or managing field staff, would have to be
invited to take up the business by bidding on the required transaction fee per
transaction and per crore of rupees delivered as subsidy. Theoretically, even
negative bids are possible if the company estimates a significant time lag
between the date of creation of credit in the accounts of ISEC holders and the
drawal of the same.
• The CCC that is authorised to operate is the only entity that seemingly has the
potential to generate fictitious transactions to claim the subsidy transferred to
the ISEC holders even when they would not have claimed /collected the same.
41
The danger of this is small due to the large pull of the consumer to claim the
subsidy. Unlike in the present system where accountability is intrinsically not
possible. The gains are small for the consumer and his own effort in claiming
is very large. While in the proposed method since the net benefits after
subtracting the value of his costs of claiming are very large, the chance of
under use or non-use by genuine ISEC holders is almost nil.
• Safeguards can be built into the operations of the CCCs by insisting that only
CCT operations with firm transaction number, transaction date, and CCT
operator stamp are valid. Moreover consistency between ISEC data and CCT
operator data in terms of location can also be insisted upon. Ideally any ISEC
holder should have the choice of at least three CCT operators, and it is better
not to limit the choices of ISEC holders to particular CCTs. In any case,
intelligent data mining would most certainly reveal any fraudulent
transactions. Given that audit trail of all transactions would be available would
itself be a big deterrent .
• To improve the security the underlying phone transactions can be cross
checked for genuineness and matched with CCT transactions.
A comparison of likely fiscal impact of the proposal as compared to the current
system has been made in Table 11. The changes proposed would entail one time cost
of rolling out new system including issue of cards. However, as can be seen, the
benefits outweigh the costs and the fiscal impact is hugely beneficial (approx. Rs.
14,900 crore annually). The additional social benefits not captured in the analysis
include: pollution reduction, elimination of rent seeking and directly unproductive
activities, optimal decision processes in the oil companies, removal of subsidy burden
of the oil sector, avoidance of improper choice of fuels, erosion of the political basis
for dealership, significant increase in the actual benefit delivered to the target group
while retaining consumer choice, and significant impact on poverty reduction.
The effective income gain per BPL household with the current “Targeted” PDS
(TPDS) is Rs. 506 annually (approx.) [Based on Planning Commission, 2005].
Leakages outside the BPL are nearly 60% of the food released. Therefore with correct
42
direct subsidies at least Rs. 1250 could be added to every BPL family. On account of
kerosene at least Rs. 4800 per family can be added to consumer expenditure.
Accounting for higher cost avoidance by removing the PDS and allowing consumers
to buy in the market both grain and kerosene, the total gain per consumer on direct
food and kerosene is of the order of Rs. 7000 per annum. This amounts to addition of
Rs. 116 to monthly per capita income in current (2003-04) price terms which is more
than 20% of the monthly per capita consumption expenditure (all items) of farmer
households in rural areas of Rs. 503 per head per month [NSS 2003-04]. It would be
about 45% of their food and fuel expenditure of Rs. 230 per month.
43
Chapter 7 Identification and Issuance of Smart Cards
The process of identification of the beneficiary and the issuance of smart cards with
detailed information including number of family members, address, economic
categorisation would remain the government’s responsibility. Although for
transparency, accountability, quality and low cost the government could get the same
done through vendors through a tightly specified agreement. In this chapter, we bring
out the key aspect of the processes that are involved in identification of category to
which a consumer belongs and issuance of smart cards for the targeted beneficiaries.
The criteria for identification have to be simple and yet not easily amenable to
fudging. It has to be an exercise that is carried out once with great care, since mistakes
would lead to misdirection of benefits that would be difficult to correct. The errors of
omission and commission in the proposed system can only be no worse than the
current use of printed cards, where the identification process has essentially been top
down. The point to recognise is that even if there are errors in identification, the
proposed process of separating subsidisation from prices prevents all the distortions.
Furthermore, by unbundling the identification from the issuance, making the former
an exercise that is carried out infrequently, and the latter a routine card based
transaction the identification exercise can be focussed upon and carried out carefully.
It is also thereby possible to improve the process of identification substantially,
especially by making the process itself “incentive compatible”, and by using local
information.
The entirety of the scheme for identification should be publicised and made clear to
the population at large through various channels including extensive use of television.
A manual on the process of identification covering the philosophy and the details
would have to be made widely available to all concerned including citizens groups
and local bodies. Field studies must be carried out for collecting data on possible
misidentification, for use by the state level officials. The manual must get into the
44
details of the roles of the various actors in the process of identification (government at
various levels, oil companies, PRIs and local bodies, NGOs, Vendors of various
kinds, Credit Card Company, civil supplies officials, Specific departments of the
government).
BPL, when based on calorific intake of food, is not a category that can be
operationalised easily since it is transcendental in character with the surveyor having
to know not only the overall consumption expenditure but also the components of the
same and the calorific content of all food stuffs.
It is much better to rely on the NSS consumer expenditure figures to arrive at the
number of people whose expenditure on food is below a certain level in real terms
(adjusting the money value of expenditures with the local price index for food). An
extended NSS with a much larger sample should be able to assess the number of such
people taluka wise separated into rural and urban areas. The level so chosen should be
such as to give at the national level no higher than 20% of people. This would mean
that in poorer talukas, the number of persons below that level of real expenditure
would be much more than 20% and in others much less. For determining the
proportion at taluka level, similar studies can be used. This should constitute the
ceiling on the total number of people to be covered taluka wise.
The centre should not allow more than a 5% change in the absolute numbers of the
persons in each taluka to be covered when it backs up its estimate with a sample
survey as outlined above.
But such an exercise need not wait for a more extended NSS. Even the existing NSS
consumer expenditure surveys can be used to arrive at district level estimates of the
number of persons below a certain level of consumer expenditure fixed in real terms
when the current expenditures are adjusted by the variation in local food price indices.
This can be carried out by using the local CPI for manual workers / agricultural
workers to adjust the cut off level of consumer expenditure at the district level.
Particular centres for which the CPI is available could be used to cover more than one
45
district. Further allocation of the number so arrived at for each district to the taluka
level can be left to the state government.
The taluka wise total numbers of people that would be covered should be broken up
further to each village and ward of urban areas based on their population and local
information available on the relative status of incomes of villages and wards. This can
be done by the district administration in collaboration with zilla parishad elected
officials. The key here is that the bureaucracy at the district and taluka levels using all
information at its command can generate the numbers of poor at the taluka, and
village levels (town and ward levels).
The numbers at the taluka level can be presented to the zilla (district) panchayat who
can fine-tune the distribution. They can bring in local information on the
concentration of the poor etc in particular talukas and villages to make these
adjustments. The point that they would have to recognise is that the increase in the
assessment of the number of poor in a particular taluka would have to necessarily
mean reduction in some other talukas elsewhere in the district. This would make the
elected representatives recognise the compositional aspect of their decisions. In any
case no more than say 10% change from the figures estimated by the district
bureaucracy should be allowed. The district bureaucracy could of course choose to
employ consultants to arrive at the initial assessment taluka wise. The same procedure
can be extended to decide the numbers of poor village wise. This can be done at the
block / mandal /parishad level where all villages are represented. In some states where
the geographical consistency is not maintained, the process would have to recognise
the same.
Thus, for Gujarat, there are 25 districts, 224 blocks or talukas so that on an average
the quota for each district has to allocated among 10 blocks at the zilla parishad level.
Similarly, there are a total of 13711 panchayats covering 18859 villages since some
panchayats represent more than one village and some villages do not have their
panchayats (Table 8).
46
This means that each block on the average has 84 to 85 villages so that the quota for
each village has to be allocated at the block level among the constituent villages. This
is best done by the village pradhans themselves meeting at the block level and
dividing the quota on the basis of the population of their villages and the data on
consumer expenditures at the village level / their own assessment of the numbers of
poor.
Caste groupings are important in village elections and in decision making at the block
and village levels. It is important that all panchayat members and local political
leaders are made aware of the scheme of identification, the information basis, and the
criteria for the same and their own roles in the allocation of quota down to the village
level. On an average this would result in about 350 Smart Cards being made per
village of which about 70 are likely to be cards with entitlements. It is better to issue
cards to all families and to specify the entitlements on each card with those without
entitlements from the state being specified nil entitlements.
Once the number of persons to be covered in each village is fixed through the process
above, then a village database involving many of the aspects of governance besides
known socio-economic profile of the families can be developed as follows:
Each family has to apply for the Smart Card in a format that is specified as below:
1) Name of Head of Household
2) Names of other members of the family and their ages
a. Occupation /Employment status of each member of the household and
b. Income of each member even if self employed.
c. Identification marks of head and spouse
3) Residence address of the household
4) Phone number/s if any
5) Total income from all sources
a. Agricultural income
b. Wage income as labourer
c. Other income as self employed
47
d. Other income
6) Self classification of income category
a. Poor
b. Lower middle class
c. Middle class
d. Other
7) If claiming food subsidy as poor
8) If claiming fuel subsidy as poor
9) If not claiming any subsidy then the details required in items 10 and 11 are
not necessary to provide
10) Immovable assets possessed:
a. No of two wheelers including registration no
b. No of other motor vehicles including registration no
c. Land possessed including survey numbers and location of land
d. House/s possessed including address and registration numbers
e. Bank accounts including account numbers
f. Gold and other financial assets (NSC, NSS, PF etc)
11) Existing Ration card if any and the details therein
a. Names covered and their date of birth
b. Entitlements of food
c. Entitlements of kerosene
d. Other details such as place of issue, card no, etc
12) Existing Passport details of the members of the family included
a. Name/s
b. Passport nos.
c. Date and place of issue
d. Address in passport
e. Countries visited
13) Other indicators of consumption expenditure /status
a. School fees paid for all dependents
b. No of college goers
c. Household gadgets: Refrigerator; Sofa set etc
48
d. Electricity Bill for household
e. Electricity bill for IP set is operated
f. Telephone bill over the last month
g. Kilos of grain /pulse/ bread and related food consumed
h. Monthly expenditure on meat, eggs, and milk and milk products
14) Case status of head of household
15) Caste status of spouse if different from that of head of household
16) Names and addresses of three persons who can identify and vouch for the
veracity of information provided
List of households in each village and names of members have to be prepared with the
household being defined as a common kitchen. Thus HUFs / other joint families
having different kitchens could be considered as different households. The land
records should be matched to families and the ownership of land family wise can be
generated. Only such lands as they belong to persons outside the village /block can be
left out in the initial list.
The list would also have the following:
• Current status in terms of ration card, and if so the category of the card
• Address of household with clear specification of survey no of house /plot,
village, mandal or block and district.
• Other information such as telephone no, other immovable assets possessed
such as houses and recorded assets as per government records. (Motor vehicles
and house registration, house tax, establishment record, driver’s license) All
these government agencies record the address of the owner and when a
proprietor or partnership the address of the principal partner can be used to
develop village wise /urban ward wise lists of shops establishments, telephone
connections, motor vehicles, and houses.).
Such lists can be fed to the village panchayat who then have the task of relating these
lists to families in the village. This aspect while desirable is not essential. The
49
electoral roll of the village is the core first list to which the social, economic and
administrative data are appended.
The PRI or a survey subcommittee (adequately represented by all caste and religious
groups) of the same gathers additional information of assets possessed, income of
households, age, educational qualifications of each member, caste status (SCST,
Backward, other) if this is not already known and an integrated list of all households
ranked from the poorest to the wealthiest is developed. The bottom so many families
to make up as many individuals as in the quota for the village, rounded off to the
nearest full family are listed as “Poor” or deserving of consumption expenditure
subsidy.
This integrated list (with other information generated above) of about 500 households
is printed in large print and displayed on the village office notice boards and in
prominent places by the PRI.
People are invited to submit their objections to the list including information on why
they should be listed poorer than another family. Similarly families are invited to state
through anonymous notes which of their neighbouring families are just above and
below, and also identify another family equal to them, in income status. This has to
done in a closed ballot like process under the supervision of a government /public
sector official, randomly selected for such duty, in a manner akin to the election duty.
Each family validly on the rolls is given a unique temporary identifier which is the
serial number of listing in the first list. Such submissions can be consistently put
together, and the list modified to give rise to a revised ordered list. After some
iterations the final ordered list from the gram panchayat is accepted by the Collector.
The Collector invites one round of submissions from families not identified as poor.
This is allowed to all identified BPL card holders who are not included in the list of
poor. The collector sets up an agency or empowers groups consisting of NGO’s,
school teachers and lower officials one to each block or taluka, to verify the veracity
50
of these cases, and allows only those cases which are genuine to be included in the list
of the poor.
Collectors are additionally allowed to include migrant poor people who may lack a
permanent residence address and their inclusions cannot be more than a certain 10%
of the total quota of the poor in their district. They have to satisfy their commissioners
/ seniors of the basis of their inclusions, as also the numbers.
An empowered vigilance committee needs to be set up to receive possible accounts of
malpractices, and when cases are proven large awards can be made to those providing
the information and the proof. A proportional award can be made to the officials of
vigilance making the investigations. Such vigilance committees are set up by the state
level vigilance at each district. For every 1 misclassifications (of non-poor being
classified as “poor”) so corrected the amount should be in the range of a thousand
rupees so that there is sufficient incentive to correct mass misclassification.
The final list is put at the village level and any further complaints are entertained by
local courts with a process that reimburses all court fees in case the representation is
proven correct. Courts have to take due cognisance of the basis for inclusion and rank
ordering, and the prior information provided.
The same list is also sent to the Credit Card Company (CCC) selected for the purpose,
who them makes the card by visiting each village and photographing up to two
members typically the head of the household and the spouse, and matching the same
to the application from, and to any prior ration card that had been issued. The CCC
through agencies with the photograph and verified information prepares the Smart
cards which are mailed to the cardholder with a key.
The Information the Smart Card Contains:
Names, age and sex and such details as Identification marks of head and spouse,
finger prints, photo of head and of spouse, assets possessed, land holding, occupation
51
of all members, telephone numbers (if any), address in detail, estimated income
category including BPL etc, date of entry, of verification, issuance and place of issue.
In addition the card would contain spaces for defining the entitlements of all
subsidies:
Kerosene
LPG
Food
And space for defining the entitlements for other subsidies in the future as the
administration of these subsidies are reformed and made direct:
Electricity
Irrigation water
Fertiliser
Old Age and other Pensions
Subsidies under other possible schemes of the government
A unique identification number which is the base number for the accounts of the
consumer on various subsidies.
52
Chapter 8 Implementation of the Proposed System The Institutional Framework In case it is decided to go ahead with implementation of direct subsidy of kerosene,
the Ministry of Finance and the Ministry of Petroleum and Natural Gas may begin by
setting up a task force (TF) to implement the suggested system. Other departments/
Ministries could join in the implementation as the benefits from direct subsidization
as against universal price based subsidies are realized and other subsidies too are
provided using the suggested mechanisms.
The TF would consist of persons with diverse expertise and experience including ,
public management, IT, law and general management. The chairperson of the TF
would have the status of cabinet secretary and would have a tenure of 5 years and his
independence would be ensured by the government through suitable enactments. The
major task of the TF would be to set up an SPV (Special Purpose Vehicle) for the
administration of direct subsidies. The budget of the SPV for the subsidy alone,
routed through the TF, would be a part of the budget of the Finance Ministry. The
performance of the SPV would be judged on the basis of the total cost - direct and
social- incurred in transferring a rupee of benefit to those intended and reduction in
the distortions and perversities that it is able to bring about in the administration of
subsidies over the current situation. In addition to general administrative experience,
the skills required for operating the SPV effectively would include accounting,
finance and design of bidding systems for developing RFQs/RFPs for dealing with
vendors.
The TF needs to be adequately empowered either through a legislative or an executive
action. It should have its own team for implementation. The size of staff needed for
implementation may not be more than 20. The TF would have a line of credit from the
government of India annually for the estimated level of subsidy (depending on the
number of beneficiaries and the quantum of entitlements) on account of kerosene. It
53
would have additional amount of credit if subsidies on food, electricity, etc. are also
delivered through direct subsidy mode.
The TF would have the responsibility of :
(1) Designing and ensuring suitable direct subsidy mechanisms that have the
least possible distortions; insulating and disengaging the productive and
supply organisations from the mechanism, so that the productive and
supply organisations are entirely free to manage their businesses
commercially.
(2) Ensuring correct identification of the beneficiaries, and delivery of benefits
to the intended beneficiaries; handling complaints from consumers and
citizens, NGOs and other public bodies including politicians.
(3) Preparing answers to questions raised in the parliament on administration
of the direct subsidy system.
(4) Ensuring that the SPV makes available all information to help the
concerned citizen assess the performance of the SPV. Only such
information as is required to be kept confidential for instance finance bids
of vendors that take up the SPV and the associated terms etc would not be
so available.
The TF would also have the following elements of authority, which it could delegate
to the SPV for subsidy administration:
(1) While the criteria for identifying the beneficiaries would be decided in
mutual consultation with the appropriate ministry/ ministries, the TF
would have the final say in the matter, keeping in view the feasibility,
functionality, fairness and its external effects of the criteria.
(2) The TF and on its behalf the SPV would have the authority to call upon all
ministries and departments of the government of India and its parastatals,
the state governments and their parastatals and all other public and private
54
bodies (in public management) for data with regard to consumers, their
asset base, their incomes, their consumption, electoral lists, census
information, other indicators of economic status and such other
information that the SPV may require for effective functioning.
(3) It would be able to enter into contracts for services and supplies with
vendors with the understanding that its liabilities would be that of the
government of India.
The Procurement Process for Subsidy Administration The TF would carry initiate the process of direct subsidisation in the following
manner:
The separate tasks of (1) identification and (2) Delivery mechanism as differentiated
in this report, would be carried out either separately by two different vendors or
together by one vendor depending upon whether the identification process is carried
out involving local politicians or otherwise. In case local politicians –elected PRI
members, MLAs and national parties are involved, it is important to separate the two
processes. In case only the PRIs (as bodies) are to be involved and politicians (PRI
members, MLAs and national parties) are not involved then it is necessary that the
tasks of (1) identification and (2) delivery mechanism while distinct and specified as
such are carried out through the same vendor.
It would be possible to have different vendors geographically but it would be
desirable that only one or at best two vendors are selected across the country to ensure
that there is uniformity of design and practice. The details of the entitlement, as also
the channels to be used for distribution of entitlements could differ across regions,
depending upon the local conditions. Additional reasons for restricting the number of
vendors are to ensure accountability, national level recognition, ease of public and
media monitoring of the activities and performance of the vendors, besides ensuring
sufficiently large economies of scale and scope.
55
The vendors business for subsidy administration whether for identification and for
issuance or for both needs to be necessarily separated from other businesses, with its
own special formats for reporting to the SPV created for subsidy administration.
The SPV would initiate the process by inviting EOI from potential vendors. The
criteria for qualification of vendors would be sufficient net worth (of the order of a
Rs. 100 crore) for the participants, and strong prior reputation in managing businesses
involving large numbers of people and with adequate IT experience.
It is expected that the EOI may attract credit card companies, banks with sufficient
large ATM networks, leading IT companies in India, companies in FMCG marketing
with a rural reach etc. The document inviting EOI would outline the basic approach of
identification as in this report, the system for issuance of subsidy as in this report, the
aims and objectives of the task, the problems encountered in the current price based
mode of subsidisation and need for non-distortionary direct consumer / producer (as
in the case of farmers) subsidies to be instituted in their place. It would also provide
data on the number of estimated ISECs to be issued, the volume of subsidy to be
delivered in money and quantity terms, the transactions that are likely, the mode of
monitoring and the databases that the vendor would have to develop and maintain on
behalf of the government and the TF. The benefits to the vendor besides directly
through the activity of issuance of subsidy would be indirectly through the
enhancement and extension of the credit card /CCT business and through the
businesses of telephone calls/ data transfer. This aspect has to be made clear in the
invitation for the EOI itself.
Once the potential vendors are identified, the TF would meet them and clarify the
aims and objectives of the proposed direct subsidy scheme, the nature and design of
the scheme, the roles and responsibilities of the TF/Government, the selected vendor
(SPV) and the legal and administrative framework for the same. This exercise would
have to be inter-alia directed at identifying the risks that the vendor (SPV) would face
and the TF/Government is likely to face with regard to direction and cost of subsidy.
The consultants to the TF would assist in this exercise to ensure that there is no
mistranslation in the communication of the proposed scheme. The RFP document
56
would be prepared based on the clarity that emerges through this processes and then
proposals from potential vendors would be invited.
Since the proposed system is for very large number of people care in the design is of
vital importance. The importance of coherence of design and ensuring incentive
compatibility of the process cannot be over-emphasized. Since the RFP is for
procurement of a service that has many complex interlinked elements including an
aspect of governance, and is for the first time by the government of India, due care
and diligence in design with efforts to anticipate the implementation details would be
called for. Hence invitation of objections or suggestions to the scheme from the public
and NGOs would be useful. It may also be useful, at the appropriate time -once the
core details of the scheme are firmed up – for TF to announce the details of the
scheme as well as the vendor selected for implementation publicly.
The bid for the identification exercise leading up to issuance of cards needs to be
separated from the management of disbursement of subsidy once the new system is in
operation. The fee per person for the identification exercise and issuance of cards
could be either a positive or negative depending on how the credit is operationalized.
If the credit from the government is directly to the account of the beneficiary then a
small positive bid (the government having to pay the vendor) is likely. The evaluation
process of the bids must pay specific attention to the method proposed by the vendor
to ensure transparency as well as increasing accuracy through continual updating of
records proposed by the vendor. The evaluation should also pay attention to the extent
of the responsibilities of the TF/Government that the vendor proposes to shoulder.
The weight of the technical part of the bid should be considerable. Indeed it may
perhaps be better to have the cost of identification and issuance per person fixed
upfront based on a cost study of the activities as outlined in this report, and once it is
accepted by the agencies that have expressed an interest in implementing the system,
the bids are evaluated purely on basis of technical aspects of implementation -
implementation capability, knowledge and experience in information and
57
communication technologies, design and management of databases, and other similar
features as discussed earlier.
Required Safeguards The actual implementation of the scheme both identification and issuance system has
to be outsourced to a commercial party (vendor) with much reputation and success in
other fields such as in IT, banking, retailing etc. This separation would make possible
and allow the government to hold the agency to its contract and therefore responsible.
A government agency is less likely to be held responsible. Most certainly there is little
basis for the TF to hold any internal agency /department etc responsible. Thus the
actual implementation would have to be outside any ministry including the
Department of Civil Supplies, though the senior officials of the Department of Civil
Supplies and the Ministry of Petroleum would have to drive the TF.
Although no contract can be complete it is desirable that as much of the task ahead
and the contingencies, including the risks, the responsibilities and deliverables of
various agencies including departments of the government, the vendor/SPV and all
others involved are anticipated and recognised for their influence, interaction and
determination of costs and of success.
A pilot scheme is important since many details can only be encountered at the ground
level and the pilot would allow the learning to be incorporated into the final design of
the scheme and of its possible variants.
The identification can best be carried out with ample publicity and coverage of the
scheme in the media and elsewhere at the correct time. [Which would be once the
scheme in its details is agreed to be the vendor/SPV and the SPV is ready to start the
implementation at either the pilot or national level]. This would bring all relevant
information including micro level private information to positively impact the
identification exercise.
58
It is important that the ceiling on the number of poor is imposed form above by the TF
and not much leeway is allowed to the district authorities. And even when this is done
the enhancement in a particular area has to come from the decline in numbers
elsewhere in the district/ taluka, so that the incentive power of “fixed sum game” to
bring forth private information is taken advantage of.
The criticality of the proposed detailed survey of consumers to arrive at the taluka/
block wise estimates of the number of people below the poverty line is important. To
make the matter simple we have proposed a shift in the calorific intake to the total
monthly consumer expenditure amount (below which) to identify BPL families. It is
important that this survey is done to ensure that the significance of the estimates is at
a one per cent level. This would mean different proportions of sampling in different
areas depending upon the variability. The current NSS surveys can be used to up the
number to be sampled and to reduce it elsewhere where either the variability is low or
the consumer expenditures way above the poverty line level. It is important that since
decisions are to be based on the survey this is carried out with due care. The
involvement of outside consultants with the CSO’s NSS could enhance the reliability
of the results. All such data should be available for scrutiny. Dual samples may also
be called for.
Phasing Implementation Plan and Managing Transition
Phasing of the implementation of the scheme is of crucial importance. Ensuring
correct identification is of crucial importance to the state not only in the issuance of
kerosene subsidies but in the issuance of food and other subsidies like fertiliser and
electricity. While the latter two are not entirely poor in their orientation the element of
‘income of the farmer’ is important, and production subsidies have been politically
sold on account of the ‘poor’ aspect. Food and kerosene subsidies even in the current
framework are on account of the poor. Since in the latter two the aspect of poverty
and income of the recipient is likely to be important, though not overriding it makes
sense to get to the correct identification of the poor although this is not critical to the
success of ‘direct’ non-price based subsidisation. Even with misidentification the
59
savings on account of moving to direct subsidies in kerosene is very large, and must
be pursued. So even if the starting point are the current BPL lists available with the
state governments, it is important to have processes of weeding out of cards in place
through continued use of private information and the competition in fixed sum games.
This approach is less desirable than the first one of doing a good job of identification
since its use for directing food subsidies and for poverty alleviation is considerable.
Thus direct subsidies which can be delivered with accuracy and low cost, can
overcome the problem of poverty in India; while actually saving on current
expenditures. Therefore much is at stake.
The enormous potential of direct subsidies should not be whittled away in a poorly
designed and implemented scheme. Given the potential it is important to get the
scheme right first and therefore the importance of the pilot scheme.
Estimated Costs and Time-frame
Table 11 presents the estimates of the costs likely to incurred in instituting a direct
subsidy scheme, and the fiscal savings on account of direct subsidies. It is important
to realise the current fiscal cost on account of low price of kerosene excludes revenue
that could have been made had kerosene been taxed on the same level as diesel. In
relation to this the current fiscal cost of subsidisation of kerosene is Rs. 24,500 crore
approximately assuming that the subsidy per litre of kerosene is approx Rs. 20 in
relation to the price of diesel, rather than the reported subsidy of the order Rs 4500
crore reported by the government (2004-05, Infraline, 2005). The current cost of
delivering one rupee of benefit is Rs. 3.40 in the case of kerosene. Through the
proposed system it can be reduced to Rs. 1.05, without accounting for the vast gains
through reduction in perversities and distortions.
The current cost of delivering one rupee of benefit is Rs. 3.40 in the case of kerosene.
Through the proposed system it can be reduced to Rs. 1.05, without accounting for the
vast gains through reduction in perversities and distortions.
60
The annual fiscal savings are of the order of Rs. 14,900 crore. This is very large for
any state to be unconcerned with. Therefore the shift from price based subsidies to
direct subsidies in kerosene which can realise these gains and in other areas food and
electricity is very urgent. Otherwise the high growth potential of the economy would
be nullified by the unsustainability of the current price based subsidies.
The pilot scheme it is expected should take a year or so if it is developed at the level
of a state to begin to be implemented. After six months of operation of the pilot
scheme it is possible to start the process for the RFQ/RFP for the nation wide scheme.
This of course presumes major administrative and political commitment and the
suitable empowerment of the TF.
61
Chapter 9 Estimate Of Future Savings Possible In Shift To Direct Subsidies
The implications of the current mode of subsidisation in the future are difficult to
foresee accurately especially in all its perversities and ramifications. While
adulteration, diversion and revenue losses are likely to continue they are likely to
grow at least in proportion to kerosene demand. Two contrary influences on the
genuine demand for kerosene by households may be recognised. As a product inferior
to LPG its demand is likely to decline sharply as LPG grows. Similarly the lighting
demand for kerosene is inferior to the use of electricity. Unfortunately the
horrendously unreliable supply in much of the country and nearly all of rural India
makes it impossible for most households to not depend upon kerosene. Battery back
up and generators (using kerosene) are options for the well to do or by commercial
establishments. LPG has grown at rates close to 11% per annum over the last decade.
In contrast as incomes rise there arises a critical level beyond which the use of LSOs
is shunned, and in that sense kerosene is superior to LSOs. But if the experience of
Kerala is any example then the continued use of LSOs especially (coconut tree
wastes) and in Punjab of agricultural residues, LSOs are likely to be in use. Unless the
bottom 20% of the population’s income rise beyond that point when collection of
LSOs is not economical the use of LSOs in rural areas is likely to continue. This is not
expected over the next five years. But urbanisation brings about a sudden demand for
commercial fuels of all but the poorest households and therefore the trends in
urbanisation would drive the real household demand for kerosene in its aspect of
replacing LSOs. On the whole the inferior aspect of kerosene and should have
dominated, so that kerosene sales should have fallen as the LPG penetration took
place. Unfortunately given the perversities the actual kerosene sales is a total demand
that represents both household demand other demands and demand arising out of
diversion. Since the latter depends upon the “excess” supplies made available through
the PDS what goes as kerosene sales are really the amounts of kerosene made
62
available under the PDS. The non-PDS use of kerosene is very small, most such users
having already resorted to purchases in the unofficial market supplied through
diversion and decoloring of PDS kerosene.
Therefore estimating the future demand for kerosene is fraught with difficulties since
regime shifts to interalia overcome the distortions are likely or cannot be ruled out,
and as part of this exercise relative price changes are likely which could drive the
demand for particular products differentially from that of oil products as such. In any
case since what we have the release of kerosene under the PDS masquerading as sales
we are forced to use the same. We have attempted to forecast the demand for kerosene
in a do nothing scenario over for 2010-11 assuming a growth in real GDP of 6.5% per
annum and a population growth rate of 1.8% per annum.
We first estimated a model for all petroleum product sales, which is reported in table
12. Using 23 points of data the relevant dependencies were on population, real GDP
per capita, relative price of oil vis-à-vis all commodities, and the share of services,
and the share of electricity gas and water, to proxy other impacts such as those arising
out of urbanisation and other structural in the economy. A good fit is obtained. Using
the estimated coefficients as reported in table 12 and the assumptions of growth etc as
in table 13 we have estimated the demand for oil products c. 2010-11. Kerosene
demand is estimated as a function of oil demand and the relative price between
kerosene and oil products since the variable part of the demand for kerosene is
expected to be determined by this relative price which drives diversion and
substitution. The model and the estimates are reported in tables 14 and 15
respectively.
Kerosene demand with the same relative price ratios grows to above 15,000 MT from
the 2003-04 sale of 10,000 MT. Since household demand on the whole could not
grow above population growth rate, the true household demand today estimated at
70% of total supplies today cannot grow more than by 1.8% per annum. Therefore the
rest of demand is on account of adulteration and in general use outside the household.
The revenue losses at a rate in excess of 18% if inflation is assumed to grow at 5%.
63
The estimated revenue loss on account of leakage of kerosene outside the household
sector use is as high as Rs. 17000 core c.2010-11. If the “subsidy” on kerosene were
to be measured with respect to the option of pricing (taxing) it at the same level as
diesel then it is around Rs. 25000 crore today. This assumes that with a rise in retail
prices of kerosene of Rs. 20 today the price would be nearly equal to that of diesel.
The subsidy similarly computed for c. 2010-11 given the demands then and inflation
having risen at 5% (if the same price ratio between diesel and kerosene is maintained)
rises to over Rs. 50,000 crore c. 2010-11. See table 16 for the details.
The savings the exchequer would make in shifting to direct subsidies with the market
price of kerosene moving up to that of diesel today, i.e., c.2003-04 is in excess of Rs
14000 crore larger than the reported “subsidy” which is only a measure of the
compensation payments the government has to make to companies to hold the retail
price of kerosene at the PDS prices. With tax reform (all taxes central and state going
on value added basis, and a high value added rate that ensures revenue neutrality, the
price of kerosene is expected to be no different from that of diesel if the trends
elsewhere where such non-distortionary regimes is any indication. With reference to
that price, in allowing an offset of Rs 20 per litre of kerosene consumed by the poor
households the direct subsidy bill is of the order of Rs. 10000 crore giving a saving of
Rs. 14000 crore today. The saving by the same token would in excess of Rs. 37000
crore c.2010-11. See table 17
64
Bibliography D’Sa, Antonette and K.V. Narasimha Murthy (2004), “LPG as a cooking fuel option for India”, International Energy Initiative, (http://ieiglobal.org/ESDVol8No3/LPGindia.pdf) Gangopadhyay, Shubhashis; Bharat Ramaswami and Wilma Wadhwa (2004), “Reducing Subsidies on Household Fuels in India: How Will it Affect the Poor?”, March, mimeo John, Paul (2004), “Garage in Your Neighbourhood May be an LPG Time Bomb”, Times of India, Ahmedabad, December 12. Joshi, and Little (1996), India’s Economic Reforms: 1991-2001”, New Delhi, Oxford University Press. MoD (c. 2003), Manual on Disinvestment [of Indian Public Sector Enterprises]”, mimeo, Ministry of Disinvestment, Govt of India. (website) Morris, S. (2002), “The Challenge of Governance in India”, chapter 2, in Morris, S. and Rajiv Shekar (eds.) (2002) India Infrastructure Report 2002: Governance Issues for Commercialisation”, 3inetwork, New Delhi, Oxford University Press. Morris, S. and Ajay Pandey, “A Study of the LPG Distribution and Related Subsidy Administration and the Generation and Assessment of Options for Improvement of the System”, Final Report Submitted to the Petrofed, 27th December, 2004, mimeo Indian Institute of Management, Ahmedabad. Morris, S., Ajay Pandey and S.K. Barua (2006), “Efficient Subsidisation of Kerosene in India”, IIMA Working paper, forthcoming. NCAER (2005), “Public Distribution of Kerosene in India”, National Council of Applied Research, mimeo, New Delhi. Pandey, Ajay and Sebastian Morris (2006), “Efficient Subsidisation of LPG: A Study of Options”, IIMA working paper, No 2006-04-07. Indian Institute of Management Ahmedabad, mimeo, forthcoming. Pandey Devendra (2002), “Fuelwood Studies in India: Myth and Reality”, International Forestry Research, Centre for International Forestry Research. Planning Commission(2005), Performance Evaluation of Targeted Public Distribution System (TPDS), Programme Evaluation Organisation, Government of India, New Delhi, March. Rajakutty, S., Masami Kojima, V. Madhava Rao, Jayalakshmi, D.P.R. Reddy, Suman Chandra, V. Annamalai, and Nagaseshna. (2002). “Promoting Clean Household Fuels
among the Rural Poor: Evaluation of the Deepam Scheme in Andhra Pradesh.” South Asia Region Internal Discussion Paper Report No. IDP-183. Washington, D.C.: World Bank. Srivastava Pradeep, (2004), Poverty Targeting in Asia: Country Experience of India, ADB Institute Discussion Paper No. 5, February Vaidyanathan, A. (2003), “Irrigation Subsidies”, Chapter 9.1, of Morris, S. (ed.) (2003) , India Infrastructure Report 2003: Public Expenditure Allocation and Accountability, 3inetwork, New Delhi, Oxford University Press. World Bank (1994). Rural Energy and Development, The World Bank, 1996. World Bank (c.2003), “Kerosene and LPG Markets in India”, (http://lnweb18.worldbank.org/SAR/sa.nsf/Attachments/InHHFuelCh2/$File/Chapter+2.pdf), Chapters 2 and 5.
Table 2: Regression Results – for Log (kerosene Sold in ‘000 tonnes and (28/15)*LPG Sold in ‘000 tonnes)
Independent Variable /Dummy Coefficient t-value Sig. level CONSTANT -6.038363 -11.5617 0.0000 Log Population (million) 2.040341 10.1341 0.0000 Log Per capita real GDP (‘0 Rs.) 0.646644 6.4180 0.0000 Assam 1.282575 6.8247 0.0000 Bihar 0.207205 1.7952 0.0744 Delhi 2.677928 6.1030 0.0000 Goa 4.703526 5.2498 0.0000 Gujarat 0.759274 5.8583 0.0000 Haryana 1.45583 4.8345 0.0000 Himachal Pradesh 2.6876 5.1568 0.0000 Jammu and Kashmir 2.512971 6.2431 0.0000 Karnataka 0.398265 4.2275 0.0000 Kerala 0.967843 5.3619 0.0000 Maharashtra 0.099026 1.9475 0.0531 Madhya Pradesh 0.318937 5.6144 0.0000 Orissa 0.499324 4.1113 0.0001 Punjab 1.531707 5.5659 0.0000 Rajasthan 0.201633 2.7623 0.0064 Tamilnadu 0.377996 5.1310 0.0000 Uttar Pradesh -0.675441 -3.4860 0.0006 West Bengal -0.08379 -1.8809 0.0617 R-Sq Adjusted = 0.9902 F-Ratio = 946.746 No of Observations = 189 NB: Original data from the CMIE, Business Beacon
69
Table 3: Regression Results – for Log (Kerosene Sold in ‘000 tonnes + (28/15)*LPG Sold in ‘000 tonnes)
Independent Variable /Dummy Coefficient t-value Sig. level
CONSTANT -2.790871 -6.0414 0.0000Log Population (million) 0.867991 13.8525 0.0000Log Per capita real GDP (‘0 Rs.) 0.783893 8.6442 0.0000Log Real GDP in Transport, Storage and Communications sector (crore)
0.113123 2.0103 0.0459
R-Sq Adjusted = 0.9492 F-Ratio = 1116 No of Observations = 180 NB: Original data from the CMIE, Business Beacon
70
Table 4: Assumptions in Trucking Operations to Estimate the Economics of Adulteration
Engine overall cost (Rs.) 90000Kilometres truck would have covered by the time of overall in normal course 150000Reduction in kms before overhaul 0.18Average kms covered by truck in day 300Cost of truck 100000
0Cost of engine 300000Reduction in overall engine life 0.12Mileage of truck (average loading) kms per litre 5Reduction in mileage due to fuel adulteration 0.06Price of diesel (Rs per litre) 40Market price of kerosene (Rs per litre) 10Per cent of adulteration 0.3Life of truck in years 12No of operating days in year 300Cycle Time Assumed (Years) 3Additional FA required 0.05Return on TCE 0.12Max Reduction in kms before overhaul 0.3Max Reduction in overall engine life 0.2Mac Reduction in mileage 0.1Ceiling of adulteration for model 0.5Debt Equity Ratio 3Bank lending rate for trucking business 0.1
71
Table 5: Operational Economics over Three Years for Adulteration Level of 30% of
Diesel with Kerosene (Rs. unless otherwise stated) Without Adulteration With AdulterationCost of fuel without adulteration 2160000 1780851Engine overhaul cost 54000 65853.66Depreciation cost of engine 75000 85227.27Costs above 2289000 1931932Difference in cash flow 357068Cash due to Net Return on total capital employed
378000 735068
Return on TCE per annum 0.12 0.23Cash due to Equity Return 141750 498818Return on NW 0.18 0.63
Table 6: Some Aspects of the Kerosene Distribution System in Gujarat No of Households as Per NSS 2003-04 9830900No of Ration cards c.2005 11400132No of Non Gas Ration cards c.2005 8611013No of Fair Price Shops 12485No of Ferrywalas 3401Allocations Ahmedabad and Baroda City (Litres per card per month) 15AUDA limit (Litres per card per month) 12Rest of Gujarat (Litres per card per month) 10 No of LPG Connections c.2004 4417039No of LPG Connections recognised in kerosene allocations 2789119Extra kerosene being allocated at approx. 11 litres per card per month. for the year (KL)
368164
Industrial SKO Price c. 2005 (Rs per KL) 36807.5PDS price c.2005 (Rs. per KL) 8850Revenue loss on account of "extra allocations" Rs. crore per annum 1029Population of Gujarat, c.2005 52840000Persons covered per FPS 4232 Consumption of kerosene recognising the "extra allocations" KL per year c.2004
609128
Kerosene sale per FPS (incl. ferrywala sales) KL/year (incorporates possible diversion, and higher demand due to subsidy)
48.79
Turnover in Rs. lakhs per year on account of PDS kerosene per FPS 4.3Turnover required for a 10% margin and gross profit of Rs. 3.0 lakhs per year (Rs. lakhs per year)
30.0
72
Table 7: Inspection Requirements and the Estimated Cost of the Same Under the
Current PDS System of Price Based Subsidisation for Kerosene in Gujarat No of persons 52840000No of families 10739837Cardholders proportion 0.80No of cardholders 8611013Cards per RO 1812.463271No of ROs 4751Frequency of Release per month 4Time for checking each RO (hrs) 3Total time for checking only the accounts 57012Travel time between each RO 0.75Time incl. travel time for checking 3.75No of ROs an inspector can cover in a day 2.40No of mandays required 7918.33No of manday per month available per inspector 24No of inspectors required 329.93Cost to government of inspectors at a wage cost of Rs. 4 lakhs per person per year (Rs. crore)
13.20
Cost per litre on account of inspection 0.1351
Table 8 Some Aspects of The Demography of Rural Gujarat No of districts 25No of blocks 224No of villages 18859No of panchayats 13711No of blocks per district 9No of villages per block 84No of villages per district 754Total population of rural Gujarat 32500000No of ISECs estimated 6605691No of ISECs with endowments (BPL Cards) (assuming 20% of rural Gujarat are poor)
1321138
No of cards per village 350No of cards with endowments per village 70
73
Table 9: Some Key Features Related to the Kerosene and LPG and Subsidisation in
Gujarat 2000-01 2001-02 2002-03 2003-04 LPG sales MT 433126 462616 507914 540006LPG customer base (no of connections)
3700674 3875148 4123508 4417039
LPG customer base on the basis of one cylinder 12kg /month of consumption
3007819 3212611 3527181 3750042
Kgs of packed LPG sold per connection
107.2 113.9 112.6 116.7
Population of Gujarat (million) 49 50.1 51.27 51.89Estimated Households in Gujarat (4.92 per HH)
9959350 10182927 10420732 10546748
NSS Households (Nos) 9283371 9491773 9713437 9830900Kerosene releases under PDS 1066358 1022697 1005732 977292Families covered by kerosene on the basis of 2.5 Lit/ Card/Week
8202754 7866900 7736400 7517631
Estimated no of families covered by either PDS kerosene or subsidised LPG
11903428 11742048 11859908 11934670
11210573 11079511 11263581 11267672Estimated no of families covered by either PDS kerosene or subsidised LPG (% to total estimated families)
119.52 115.31 113.81 113.16
112.56 108.80 108.09 106.84Estimated no of families covered by either PDS kerosene or subsidised LPG (% to total estimated families)
128.22 123.71 122.10 121.40
120.76 116.73 115.96 114.61Price of SKO (PDS) Rs per KL (based on Ahmedabad City prices)
7150 8546.5 8580.5 8576
Price of LPG (Subsidised) Rs. 14.2 kg cylinder (estimated)
227.63 245.36 260.88 262.35
Price Index of LPG (WPI) 247.8 267.1 284 285.6Total expenditure on kerosene and LPG per month (Rs.crore)
121 139 150 153
Expenditure on LPG and kerosene (Rs/month/family)
121.89 136.94 143.63 145.05
Fuel and Light NSS per month 42.40 48.33 55.10 62.81Electricity sales to domestic sector million units
3122 3466 3813 4194
Price of electricity per unit 2.43 2.65 2.915 3.2065Expenditure on electricity per month per family for all Gujarat
85 101 119 142
Expenditure on electricity per month per family (SEBs sales only)
68 81 95 114
Elec+LPG+kerosene 207 238 263 288NSS fuel and light expenditure per month per Household (Rs.)
209 238 271 309
74
Table 10: Dealer and Reseller Economic Analysis
Assets: Tanker Truck 80000Land 600 sq yards 300000Operations' Details: Volume sold (kl) 177Margin earned (Margin is less by Rs 43/kl without the plot of land) (per kl) 447Number of trips 17Distance per trip km 100Operating expenses: Driver's cost 5000Cleaner's cost 3000Security cost 2000Clerical cost 2500Maintenance of vehicle 1000Fuel cost per km 12Revenue and Expenses: Revenue earned 79137Costs: Salaries 12500 Vehicle 21400 Total 33900Net inflow 45237Add: Value of 1% loss (permitted officially) 15203Monthly return: 11.90%Annualized return 285.63%Monthly return (without loss) 15.91%Annualized return (without loss): 487.80%See text for details: (Based on Dealer 'Shree Ram Petroleum Co. Dealer: Mr. Ashok Modi)
75
Table 11: Summary of the Current Situation, Costs, Delivered Benefits, of the Present and Proposed Systems and Fiscal Savings in Moving to the Proposed System
Present System 1 Current actual fiscal cost of subsidy (Rs. crore) per year 24540
Current reported subsidy (without accounting for duties) [total consumer subsidy including to unintended beneficiaries] per year 100002 Subsidy currently delivered to BPL and near BPL households (Rs. crore) per year 73623 Current administrative cost per litre of kerosene delivered arising out of parallel distribution (Rs. per litre) 0.254
5 Kilo litres of kerosene released under PDS per year 12269939Current administrative cost of parallel distribution channel (direct) based on additional margin (Rs. crore) per year 3076 Current indirect cost of PDS monitoring and inspection (indirect incurred by government's civil supplies dept) based on 4500 inspectors required on an all India basis and their cost of employment per year to government of Rs. 3.00 lakhs per employee per year 1357
8 No of families 2000000009 No of BPL families at approx 20% of all families 40000000
Benefit delivered per BPL family during the year today (Rs. per family per year) 184010
11 True fiscal cost of subsidisation today (Rs. crore) 2498212 Cost to benefit delivered ratio (11)/(3) 339.33%
Aspects of Proposed Direct Subsidy System 13 Cost of "owners' consultation" and evaluation of vendors; 5
Cost of identification @ Rs. 500 per card (i.e. per family) one time cost; including that of survey, for identification with appropriate safeguards as in this report (Rs. crore) 1050014
15 Total one time cost Rs crore 10505Cost one time cost and cost of identification attributable to the need for kerosene subsidisation at third the above cost (Rs,. crore) 350516 Amortization of one time cost (item 16) over a 20 year period of the cost of identification share of kerosene, at 5% interest rate (Rs per year) 28117 Benefit to the delivered per family (10 litres of kerosene for 12 months with a subsidy of Rs. 20 per litre to all BPL families) (Rs. crore per year) 960018
19 Cost of annual transaction @ 2% of value transacted for BPL families 19220 Total annual cost of subsidisation (Rs crore per year) [(17)+(18)+(19)] 1007321 Cost to benefit delivered ratio [(20)/(18)] 104.93%
Fiscal Savings (Rs. crore per year) [(11)-(20)] 1490822 Fiscal Savings + Additional Benefit to Consumers 1714623 Social savings (removal of incentive to adulterate and divert, savings on account of prevention of pollution resulting from adulteration, savings from avoiding additional wear and tear of engines, in avoidance of directly unproductive activities like bribery, extra monitoring and vigilance by oil companies, avoidance of political pressure on selection of dealers, extension of small cost to other subsidies with large savings therein -food and electricity) Not calculated 24
76
Table 12: Regression Results – Petroleum Product Sales All India (‘000 tonnes) 1981-82 to 2003-04 Variable / other Coefficient t-value Sig.level Constant 2.164825 1.4088 0.1769 Log population (crore) 0.070973 0.1022 0.9198 Log real GDP per cap 1.109786 3.7685 0.0015 Log (WPI Mineral oils /WPI All commodities) -0.215874 -2.9867 0.0083 Log (Share of services in GDP) 1.036141 2.9907 0.0082 Log (Share of electricity gas and water in GDP) 0.159455 1.3445 0.1965 R-SQ. (ADJ.) = 0.9963 F-Ratio = 1189.68 No of Observations = 23 Original Data from the CMIE (Business Beacon)
Table 13: Forecast of Demand for Oil Products for the Indian Economy in 2010-2011 in '000 tonnes based on Results of Regression as in Table... Current 2003-04 demand 107767GDP Growth forecast (% per annum) 6.5Population growth forecast (% per annum) 1.8WPI Mineral oil /WPI all in 2003-04 1.56WPI Mineral oil /WPI all in 2010-11 1.66Share of services in 2003-04 0.51Share of services in 2010-11 0.53Share of electricity in GDP in 2003-04 0.02148Share of electricity in GDP in 2010-11 0.02Demand for oil products in 2010-11 170495
77
Table 14: Regression Results – Log kerosene Sales All India (‘000 tonnes) 1980-81 to 2003-04
Variable /other Coefficient t-value Sig.level Constant 2.23574 3.7912 0.0011 Log fitted value of oil product sales from regression in table …. (‘000 tonnes)
0.617229 11.7314 0.0000
Log (WPI kerosene /WPI Mineral oil) -0.191603 -2.8772 0.0093 R-SQ. (ADJ.) = 0.9339 F-Ratio = 156.34 No of Observations = 23
Original Data from the CMIE (Business Beacon); Regression results in table..
Table 15: Forecast of Demand for kerosene for the Indian Economy in 2010 Current 2003-04 demand for oil ('000 tonnes) 107767Forecasted Demand for oil in 2010-11 ('000 tonnes) 172650Demand for kerosene in 2003-04 ('000 tonnes) 10230Forecasted Demand for kerosene in 2010-11 (no price adjustment in kerosene) ('000 tonnes) 15172Forecasted Demand for kerosene in 2010-11 (Full price adjustment ie price to other oil products increasing three times) ('000 tonnes) 12292Forecasted Demand for kerosene in 2010-11 ( half the price adjustment takes place) ('000 tonnes) 14038NB: The demand for kerosene is based on the estimated demand for all oil products and the regression results in table...
78
Table 16: Implications for Subsidy if there is no Change in Policy and Price Based Subsidies continue at prices with the same relative difference
Detail Amount Unit Total kerosene demand today c.2003-04 10230 000 MT Adulteration and use non-households today assumed to be at 30% of total demand c.2003-04
3069 000 MT
Derived household demand 7161 000 MT Revenue loss (assuming Rs. 20 to the net revenue loss for a litre of kerosene to be sold instead of kerosene) c.2003-04
7511 Rs.crore
Demand c.2010-11 (no price adjustment assumption) 15172 000 MT Household demand c. 2010-11 having grown at 1.8 % per annum (population growth rate)
8113 000 MT
Adulteration and use non-households c.2010-11 (assuming household demand is no higher than today)
7059 000 MT
Revenue loss (assuming to the net revenue loss for a litre of kerosene to be sold instead of kerosene) c.2010-11
17276 Rs.crore
Revenue loss incorporating inflation in oil prices at 5% per annum 24309 Rs.crore Rate of growth of revenue loss 12.6 % per
annum Likely revenue loss growth rate given a likely inflation rate of 5% 18.3 % per
annum "Gross Subsidy bill" c. 2003-04 (estimated at Rs. 20 per litre of kerosene)
25038 Rs.crore
"Gross Subsidy bill" c. 2010-04 (estimated at Rs. 20 per litre of kerosene)
37134 Rs.crore
NB: The "gross subsidy" is the notional total revenue loss arising in not pricing kerosene at the level of diesel with all its taxes.
Table 17: Impact of Direct Subsidy to Poor Families Instead of Price Based Subsidies as Current Today
"Gross Subsidy bill" c. 2003-04 (estimated at Rs. 20 per litre of kerosene) 25038 Rs.crore "Gross Subsidy bill" c. 2010-04 (estimated at Rs. 20 per litre of kerosene) 52251 Rs.crore Estimated "Poor Families" (20% of all families) c. 2003-04 43617886 nos. Estimated "Poor Families" (20% of all families) c. 2010-11 49419581 nos. Direct Subsidy bill at Rs 20 per litre of kerosene and 10 litres per family per month 10468 Rs.crore Direct Subsidy bill at Rs 20 per litre of kerosene and 10 litres per family per month 16689 Rs.crore Savings c. 2003-04 14570 Rs.crore Savings c. 2010-04 37681 Rs.crore