Retrospective eses and Dissertations Iowa State University Capstones, eses and Dissertations 1998 A study to ascertain the viability of ultrasonic nondestructive testing to determine the mechanical characteristics of wood/agricultural hardboards with soybean based adhesives Charles Raymond Colen Jr. Iowa State University Follow this and additional works at: hps://lib.dr.iastate.edu/rtd Part of the Agriculture Commons , Industrial Engineering Commons , Materials Science and Engineering Commons , and the Wood Science and Pulp, Paper Technology Commons is Dissertation is brought to you for free and open access by the Iowa State University Capstones, eses and Dissertations at Iowa State University Digital Repository. It has been accepted for inclusion in Retrospective eses and Dissertations by an authorized administrator of Iowa State University Digital Repository. For more information, please contact [email protected]. Recommended Citation Colen, Charles Raymond Jr., "A study to ascertain the viability of ultrasonic nondestructive testing to determine the mechanical characteristics of wood/agricultural hardboards with soybean based adhesives " (1998). Retrospective eses and Dissertations. 11851. hps://lib.dr.iastate.edu/rtd/11851
Transcript
Retrospective Theses and Dissertations Iowa State University Capstones, Theses andDissertations
1998
A study to ascertain the viability of ultrasonicnondestructive testing to determine the mechanicalcharacteristics of wood/agricultural hardboardswith soybean based adhesivesCharles Raymond Colen Jr.Iowa State University
Follow this and additional works at: https://lib.dr.iastate.edu/rtd
Part of the Agriculture Commons, Industrial Engineering Commons, Materials Science andEngineering Commons, and the Wood Science and Pulp, Paper Technology Commons
This Dissertation is brought to you for free and open access by the Iowa State University Capstones, Theses and Dissertations at Iowa State UniversityDigital Repository. It has been accepted for inclusion in Retrospective Theses and Dissertations by an authorized administrator of Iowa State UniversityDigital Repository. For more information, please contact [email protected].
Recommended CitationColen, Charles Raymond Jr., "A study to ascertain the viability of ultrasonic nondestructive testing to determine the mechanicalcharacteristics of wood/agricultural hardboards with soybean based adhesives " (1998). Retrospective Theses and Dissertations. 11851.https://lib.dr.iastate.edu/rtd/11851
wcnddy lootr hoA/e bee^v pcryidhle. Eve^o/ though/ they ewe y\xyt here to-
celehratexuithme/U^hody, I wiZicelebrate\viXh/them/ivi'my SKKd/.
WCthdU/m^ lo^/ea^nd/reapect, I dedX<:ateth(4'dC&iertatUyvvto-them/.
ChcwleyR. Coieriijr.
IV
TABLE OF CONTENTS
LIST OF TABLES vi
LIST OF FIGURES vii
ABSTRACT viii
CHAPTER I. INTRODUCTION 1 Problem of the Study 3 Purpose of the Study 3 Need for the Study 4 Research Questions 4 Statistical Hypotheses 5 Assumptions of the Study 5 Limitations of the Study 5 Procedures of the Study 6 Definition of Terms 7
CHAPTER 2. REVIEW OF LITERATURE 10 Historical Overview of Ultrasonic Nondestructive Testing 11 Nondestructive Testing of Wood and Wood Composites 16
CHAPTER 3. METHODOLOGY 21 Population of the Study 21 Sample of the Study 21 Level of Confidence 22 Experimental Design 22
Variables 23 Instrumentation 25
Destructive test 25 Nondestructive test 25
Data Collection 29 Nondestructive procedure 29 Destructive procedure 32
Analysis 33 Summar>- 34
CHAPTER 4. RESULTS AND FINDINGS 35 Restatement of the Purpose 35 Experimental Results 39 Findings Related to the Hypotheses 40
V
Findings Related to the Research Questions 42 Summarv' 48
CHAPTERS. CONCLUSIONS 50 Summary 50 Recommendations 52 Future Research 53
APPENDIX A. FREQUENCY SPECTRUM AND FREQUENCY RANGES FOR 55 VARIOUS APPLICATIONS OF ULTRASONIC TESTING
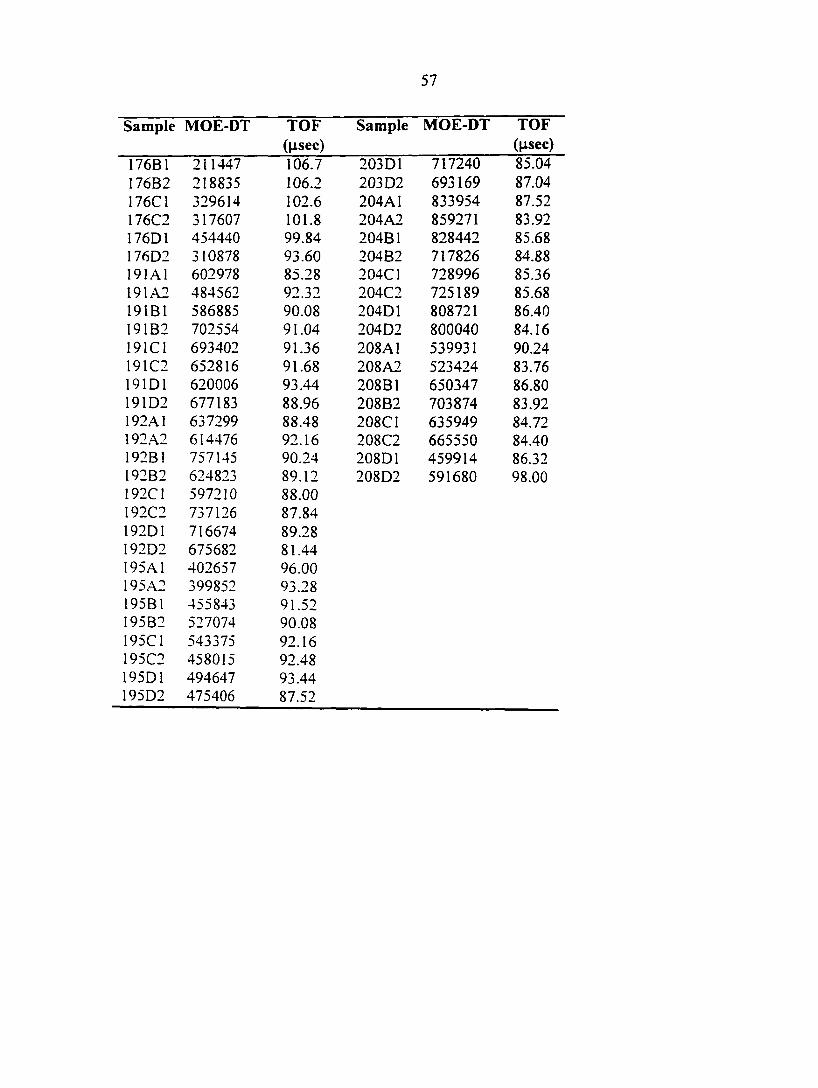
APPENDIX B. RAW DATA OF DESTRUCTIVE MOE VALUES AND TIME OF 56 FLIGHT MEASUREMENTS FROM NON DESTRUCTIVE TESTS
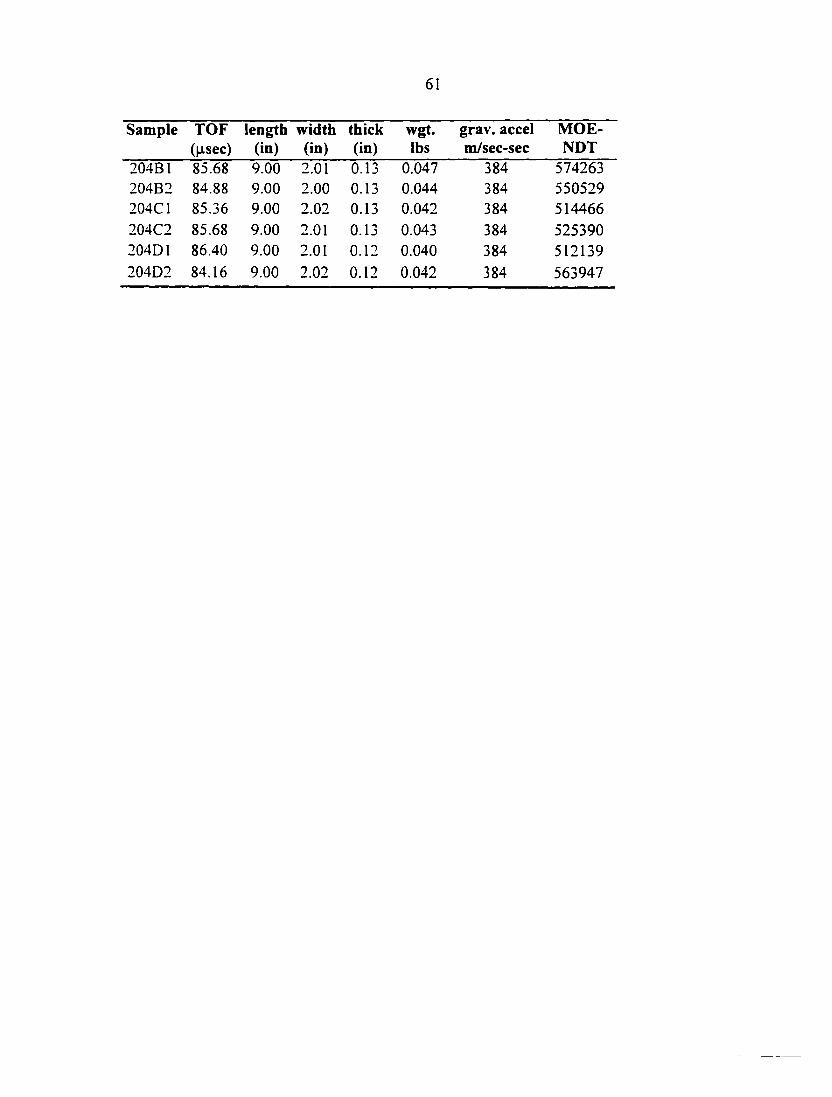
APPENDIX C. CALCULATION OF NONDESTRUCTIVE MOE VALUES FROM 58 TIME OF FLIGHT DATA FOR WOOD/AGRICULTURAL HARDBOARDS
REFERENCES 62
ACKNOWLEDGEMENTS 66
VI
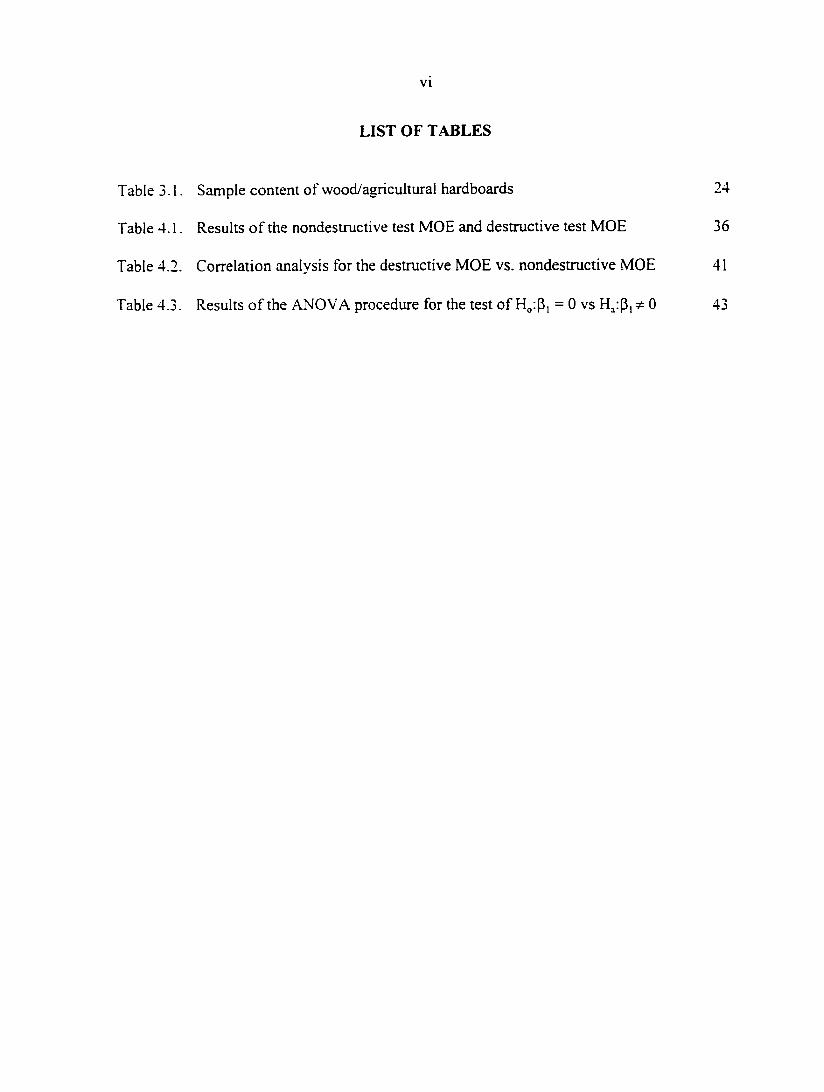
LIST OF TABLES
Table 3.1. Sample content of wood/agricultural hardboards 24
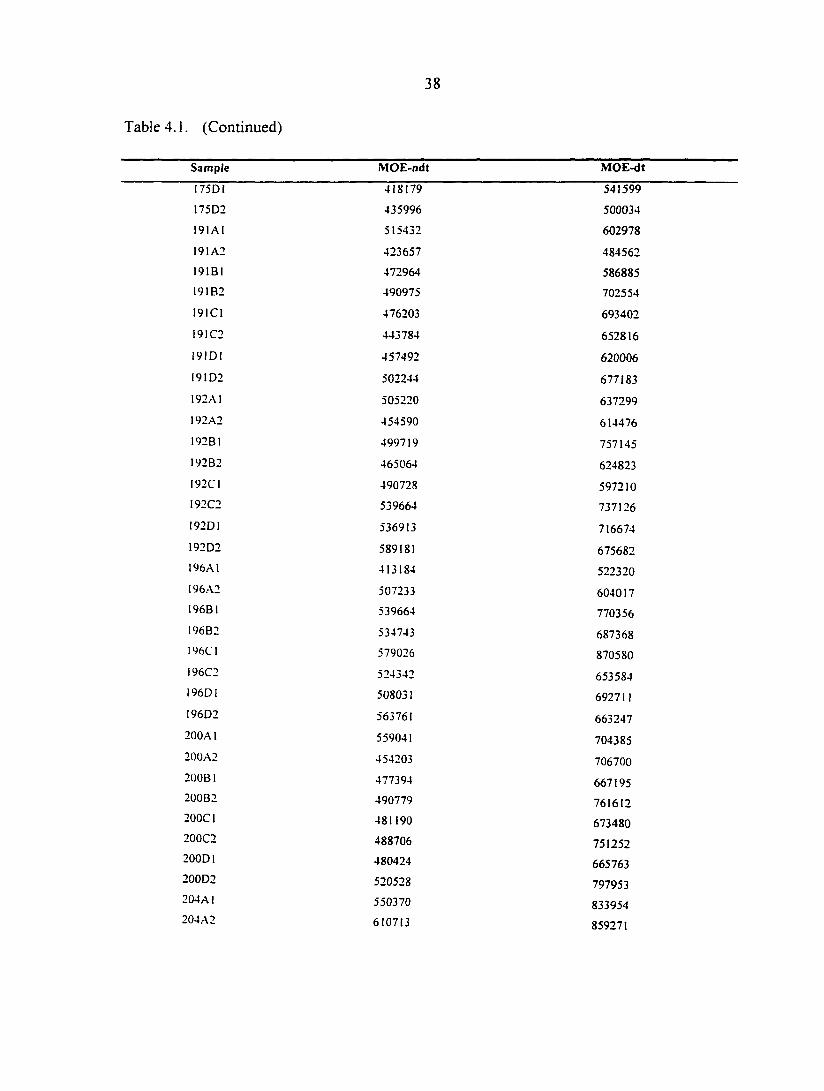
Table 4.1. Results of the nondestructive test MOE and destructive test MOE 36
Table 4.2. Correlation analysis for the destructive MOE vs. nondestructive MOE 41
Table 4.3. Results of the ANOVA procedure for the test of Hgip, = 0 vs ^ 0 43
vi i
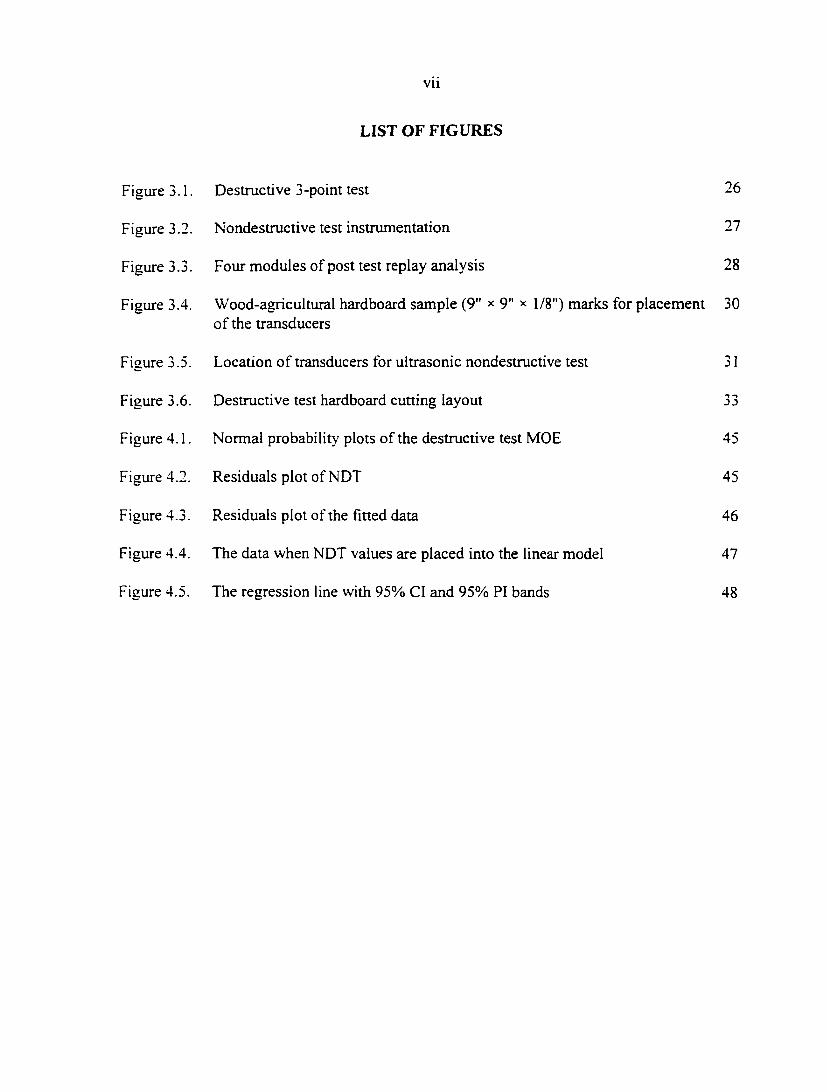
LIST OF FIGURES
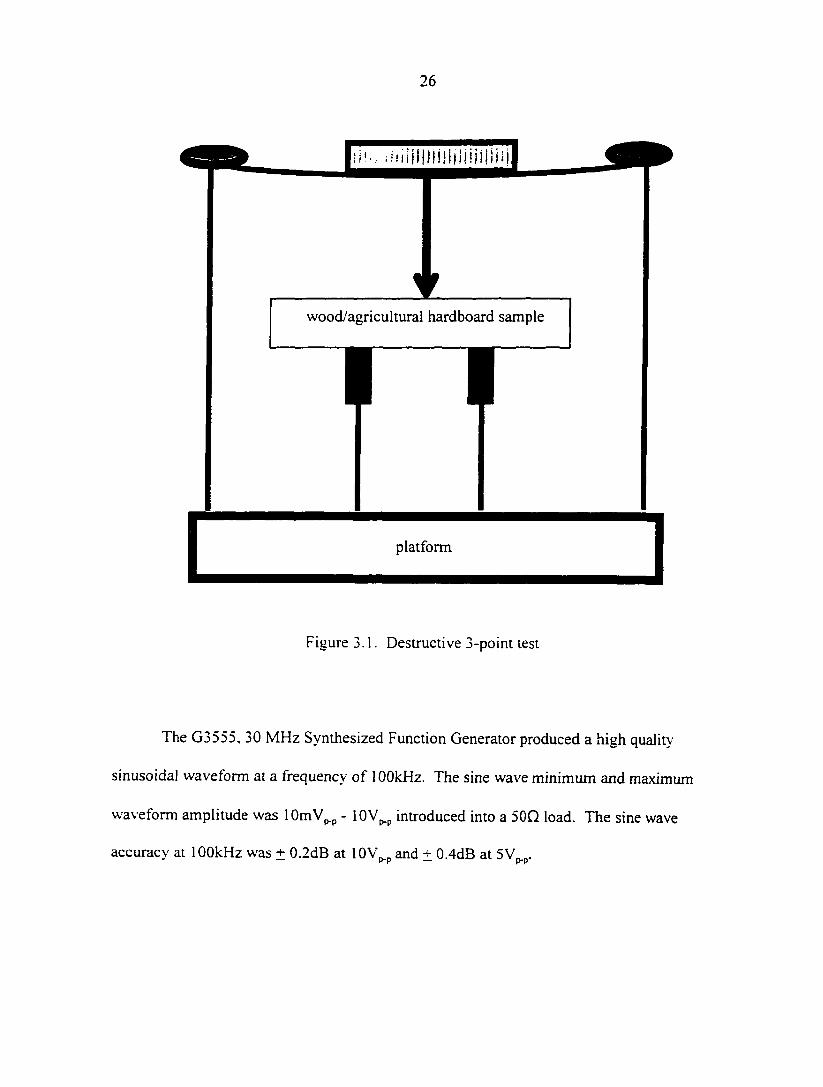
Figure 3.1 . DesUoict ive 3-point test 26
Figure 3.2. Nondestructive test instrumentation 27
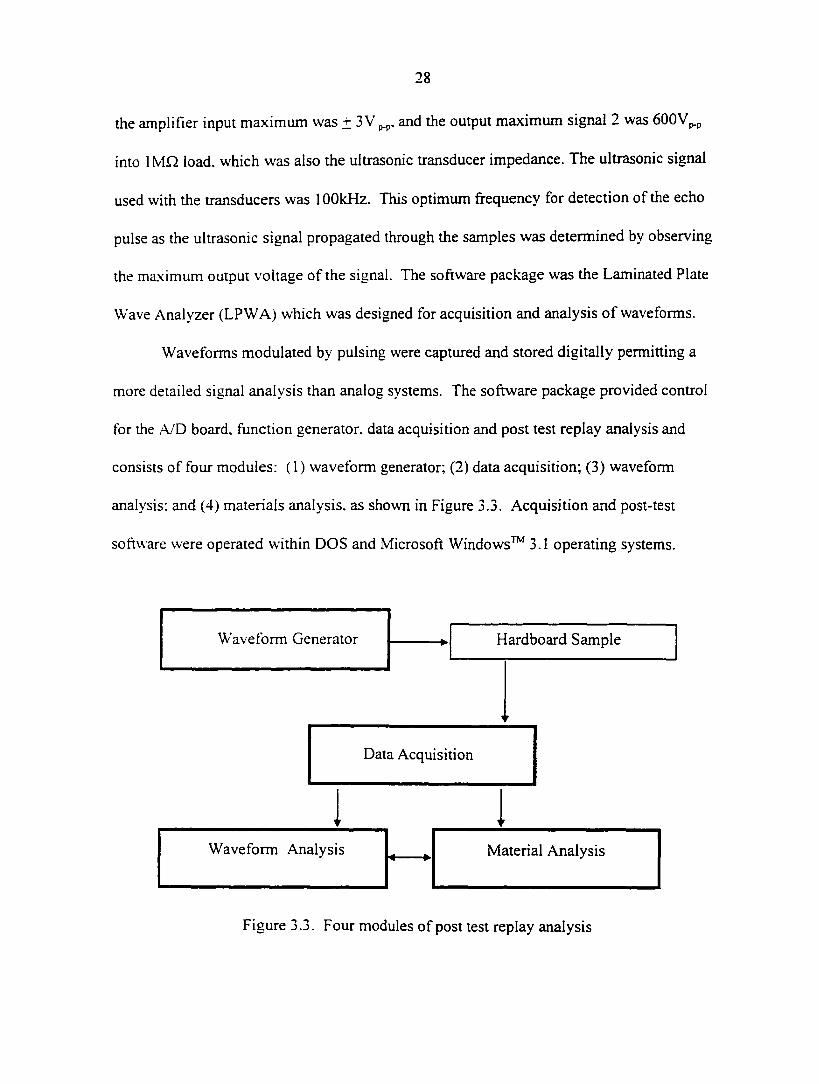
Figure 3.3. Four modules of post test replay analysis 28
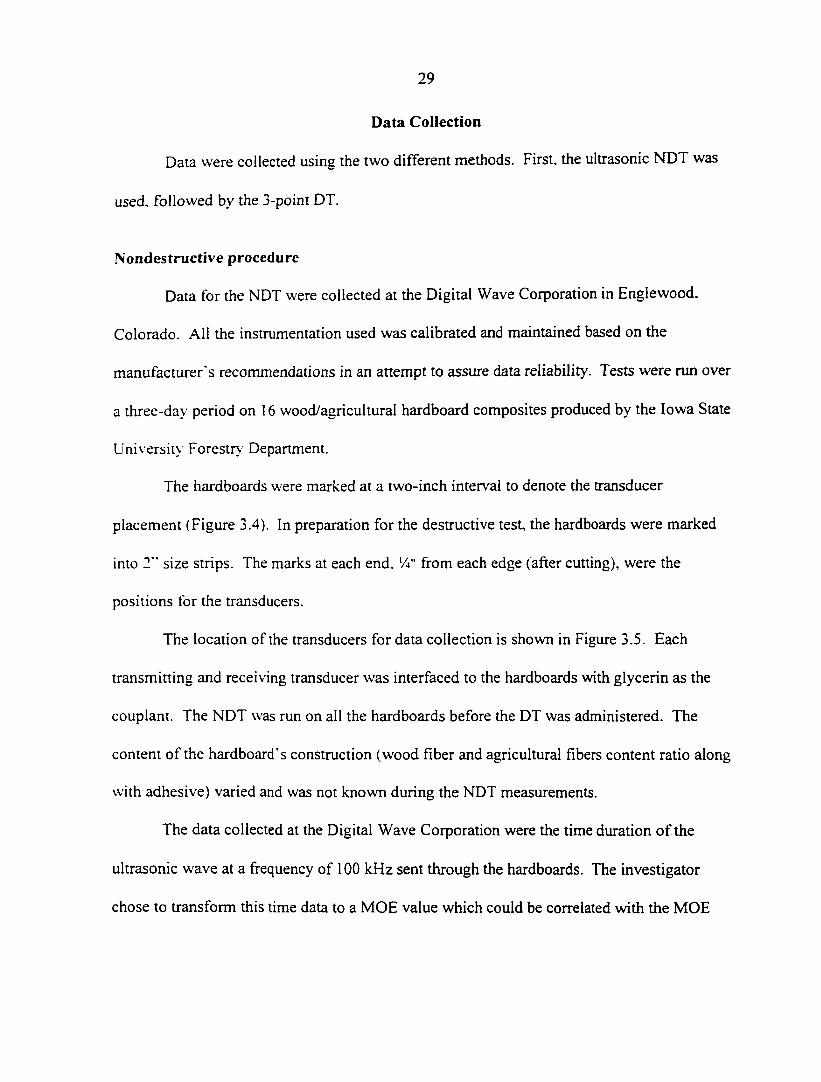
Figure 3.4. Wood-agricultural hardboard sample (9" x 9" x i/g") marks for placement 30 of the transducers
Figure 3.5. Location of transducers for ultrasonic nondestructive test 31
Figure 3.6. Destructive test hardboard cutting layout 33
Figure 4.1. Normal probability plots of the destructive test MOE 45
Figure 4.2. Residuals plot of NDT 45
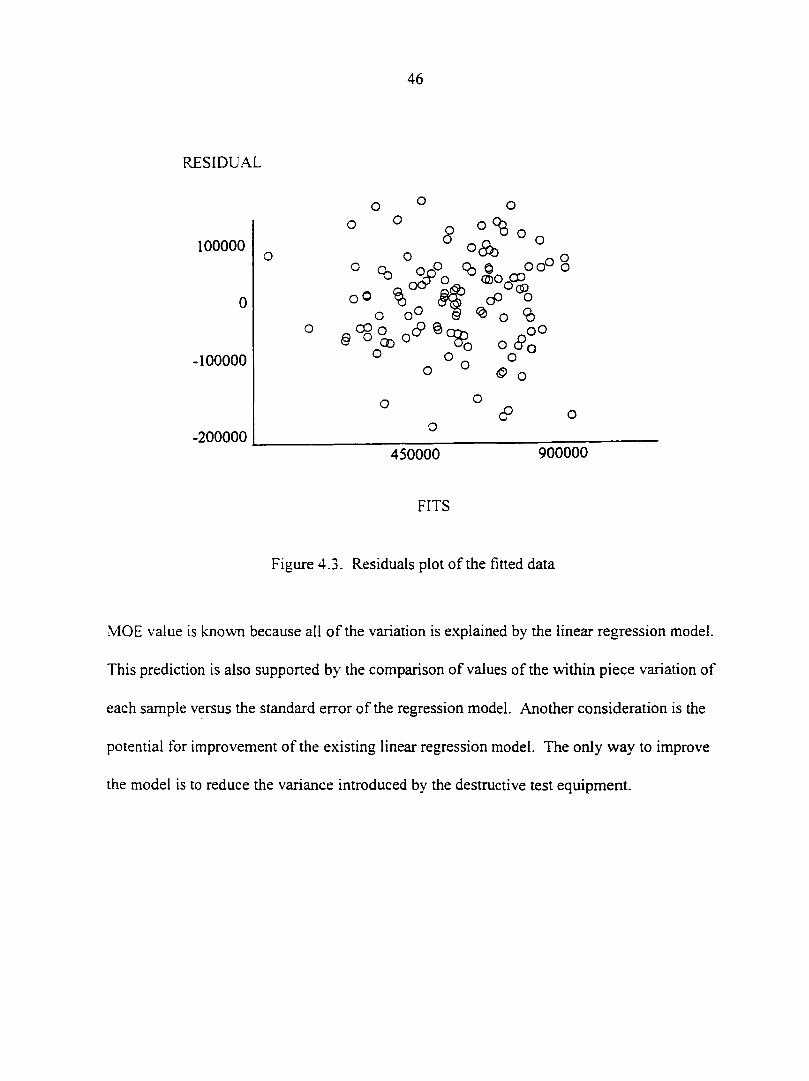
Figure 4.3. Residuals plot of the fitted data 46
Figure 4.4. The data when NDT values are placed into the linear model 47
Figure 4.5. The regression line with 95% CI and 95% PI bands 48
vi i i
ABSTRACT
There have been numerous studies with ultrasonic nondestructive testing and wood
fiber composites. The problem of the study was to ascertain whether ultrasonic
nondestructive testing can be used in place of destructive testing to obtain the modulus of
elasticity (MOE) of the wood/agricultural material with comparable results. The uniqueness
of this research is that it addressed the type of content (constalks and switchgrass) being used
with the wood fibers and the type of adhesives (soybean-based) associated wdth the
production of these composite materials.
Two research questions were addressed in the study. The major objective was to
determine if one can predict the destructive test MOE value based on the nondestructive test
MOE value. The population of the study was wood/agricultural fiberboards made from wood
fibers, cornstalks, and switchgrass bonded together with soybean-based, urea-formaldehyde,
and phenol-formaldehyde adhesives.
Correlational analysis was used to determine if there was a relationship between the
two tests. Regression analysis was performed to determine a prediction equation for the
destructive test MOE value. Data were collected on both procedures using ultrasonic
nondestructing testing and 3-point destructive testing.
The results produced a simple linear regression model for this study which was
adequate in the prediction of destructive MOE values if the nondestructive MOE value is
known. An approximation very close to the entire error in the model equation was explained
from the destructive test MOE values for the composites. The nondestructive MOE values
ix
used to produce a linear regression model explained 83% of the variability in the destructive
test MOE values. The study also showed that, for the particular destructive test values
obtained with the equipment used, the model associated with the study is as good as it could
be due to the variability in the results from the destructive tests.
In this study, an ultrasonic signal was used to determine the MOE values on
nondestructive tests. Future research studies could use the same or other hardboards to
examine how the resins affect the ultrasonic signal.
1
CHAPTER I. INTRODUCTION
The desired possibility of examining materials without destroying them using
ultrasonics originated in the late 1920s and early 1930s in Germany by Mulhauser, Trost. and
Pohlman. and at the same time in Russia by Sokoloff. all of whom investigated various
continuous wave techniques (Green. Jr.. 1991). Developments since the 1930s have made
ultrasonics one of the most versatile techniques in the nondestructive arena (Ensminger.
1988). Most nondestructive testing techniques involve low-intensity ultrasonic energy
(Ensminger 1988). The through-transmission method was one of the first techniques of
ultrasonic testing (Green. Jr.. 1991) and the basis for discontinuity detection equipment.
During the 1940s, an American named Firestone invented an apparatus using pulsed
ultrasonic wave trains to obtain reflections from minute discontinuities (Green, Jr., 1991).
With this development, the use of ultrasonics along with the aid of the contemporary growth
of electronic instrumentation and technology led to the marketing of practical ultrasonic
waves for nondestructive testing with their primary use in metallurgical research (Green. Jr..
1991). As examination procedures improved and different materials were being exposed to
new testing procedures with success, a need became apparent for determining the strength of
wood and wood-based composite boards for the construction industry.
Nondestructive testing machines capable of measuring the strength of lumber came
into use in the early 1960s (Pellerin. 1965). "With increasing demand, wood is now
recognized as the material of choice for years to come. Ultrasound has been used to grade
the materials strength properties of structural timber. This has promoted many new projects
2
regarding the investigation and development of new techniques for the assessment of wood
and wood based composite products" (Diederichs. 1998). One such product exists in the
Forestry' Department at Iowa State University. Ames. Iowa U.S.A., where hardboards and
medium-density fiberboards were developed by using different amounts of cornstalk,
switchgrass. and wood fibers bonded with synthetic resins and soy protein. The
characterization of the modulus of elasticity (MOE) of this material by using ultrasonic
nondestructive testing is the focus of this study.
Hoadley (1980) stated: "...the mechanics of materials is in itself a complex field of
science, even for 'simple' materials that are homogeneous (uniform in composition) and
isotropic (having equal properties in all directions), like steel. But on top of that, wood is an
anisotropic heterogeneous material, subject to species differences, biological variability and a
wide array of natural irregularities and defects" (p. 107).
Singh and Davies (1991) addressed the use of ultrasonic nondestructive testing
methods for two purposes: (a) the detection and characterization of discontinuities in
materials, and (b) the evaluation of material properties. A single ultrasonic transducer can be
used for pulse echo tests, but this technique has several limitations such as (1) poor signal -
to-noise ratios in highly attenuative materials, (2) limited discontinuity indication and
characterization capabilities. (3) inability to detect all discontinuities because of component
geometry, and (4) a generally slow test procedure (Singh & Davies, 1991). By using more
than one transducer, the previously mentioned disadvantages can be reduced (Singh &
Davies. 1991).
-» J
The current experiment was designed to investigate the use of ultrasonic
nondestructive testing to determine the MOE of wood/agricultural hardboards. The
examination of this material contributes to the need of evaluating how ultrasonic NDT can be
used to measure characteristics and assist in the production of these composites. Exploration
into the viability of using a test method that allows for continued use of the material beyond
strength characterization was a major factor in the necessity of this study, because all
previous evaluation of the hardboards had been done in a destructive maimer. The
uniqueness of this research was the nondestructive analysis of the type of composite content
(cornstalks and switchgrass) being used with the wood fibers, and the type of adhesives
(soybean-based) associated with the production of these composite materials.
Problem of the Study
The problem of this study was to ascertain whether ultrasonic nondestructive
evaluation could be used in place of destructive testing to obtain the modulus of elasticity
(MOE) of the wood/agricultural material with comparable results.
Purpose of the Study
The purpose of the study was to determine the MOE of a wood/agricultural material
without the destruction of the material, and to determine the viability of using ultrasonic
nondestructive evaluation to determine the MOE of a wood/agricultural material. Present
methods used to test the MOE of the wood/agricultural product usually requires the
destruction of the material upon evaluation. This study identified wave treinsmission data
4
characteristics for the wood/agricultural materials while maintaining the material in a usable
state.
Need for the Study
The need of the study was to develop a method of determining the MOE of a
wood/agricultural material without destroying the samples in the process of the evaluation.
Additional needs for the study include the following:
1. Maintain productive use of the wood/agricultural hardboards after its MOE (strength
characteristics) have been evaluated;
2. Determine if there is damage to the samples in real-time without removal, of the
samples from the manufacturing process;
3. Assist in the quality of the production of the wood-based material by implementing an
online evaluation during the production process.
Research Questions
The follouing research questions were investigated:
1. Is there a relationship between the MOE results of the wood/agricultural material
measured using a destructive test and the MOE results of the wood/agricultural
material using a nondestructive test?
2. Can one predict the destructive test MOE value when the nondestructive MOE value
is known?
5
Statistical Hypotheses
The following hypotheses were formulated to answer the research questions;
1. There is no relationship between the MOE results of the wood/agricultural material
measured using a destructive test and the MOE results of the wood/agricultural
material using a nondestructive test where p is the correlation coefficient value.
H„: p = 0
H,; p ^ 0
2. The destructive test MOE value of wood/agricultural hardboards can be predicted
when the nondestructive test MOE value of wood/agricultural hardboards is known.
3. There is no significance for the model parameters.
H„: P,=0
H , : P , ^ 0
Assumptions of the Study
The assumptions that were made include the following;
1. Error will be random.
2. The wood/agricultural hardboard composite samples for both evaluation methods will
be made by using the same controlled process.
Limitations of the Study
This research was subjected to the following limitations:
1. The wood/agricultural hardboards samples are as uniform as possible from the
production of the materials used.
6
2. The inferences made from this study are limited to the tested population of the
wood/agricultural hardboards (wood fibers, cornstalks, switchgrass. and
formaldehyde or soybean-based adhesives) .
Procedures of the Study
The following procedures were conducted to carry out this research;
1. Determine the research questions.
2. Review the literature related to ultrasonic nondestructive evaluation on
wood/agricultural hardboards.
3. Review the Laminated Plate Wave Analyzer (LPWA) software package for its
appropriateness for use in this study.
4. Determine hypotheses and statistical procedures.
5. Determine the appropriate data needed to answer the research questions.
6. Specify the sample design and the composition of various wood/agricultural
hardboards to be produced by the Forestry Department.
7. Collect data using nondestructive testing of wood-agricultural hardboards.
8. Conduct a destructive test pilot study on one-half of the sample boards to determine
whether to proceed with the full study before all the samples are destroyed.
9. Analyze the data from the pilot study to determine the relationships between the two
MOE tests.
10. Complete the destructive data collection.
11. Analyze the data.
7
12. Report the f indings .
13 . Summarize and draw conclusions .
14. Identify future research needs.
Definition of Terms
The following terms were defined for use in this study:
Background noise - E.xtraneous signals caused by signal sources within the ultrasonic testing
system, including the material in test.
Compressional wave - Waves in which the particle motion or vibration is in the same
direction as the propagated wave (longitudinal wave).
Contact testing - A method of testing in which the transducer contacts the test surface, either
directly or through a thin layer of couplant.
Decibel - The logarithmic expression of a ratio of two amplitudes or intensities of acoustic
energy.
Effective penetration - The maximum depth in a material at which the ultrasonic
transmission is sufficient for proper detection of discontinuities.
Frequency - The number of complete cycles of a wave motion passing a given point in a unit
time (1 second); number of times a vibration is repeated at the same point in the same
direction per unit time.
Impedance (acoustic) - Resistance to flow of ultrasonic energy in a medium. Impedance is a
product of particle velocity and material density.
8
Initial pulse - The first indication that may appear on the screen. This indication represents
the emission of ultrasonic energy from the crystal face.
Longitudinal wave velocity — The unit speed of propagation of a longitudinal (compressional
wave).
Modulus of elasticity - The ratio of stress to strain for a given piece of wood within the
elastic range (MOE or E).
Nondestructive testing - The testing to detect internal, surface and concealed defects or flaws
in materials using techniques that do not damage or destroy the items being tested.
Pulse Echo Method- A single crystal ultrasonic test method that both generates ultrasonic
pulses and receives the return echo.
Pulse Length - Time duration of the pulse from the search unit.
Pulse Method - An ultrasonic test method using equipment which transmits a series of pulses
separated by a constant period of time ( i.e. energy is not sent out continuously).
Pulse Rate - Number of pulses transmitted in a unit time (also called pulse repetition rate).
Resonance Frequency - The frequency at which a body will vibrate freely after being set in
motion by some outside force.
Surface Waves - Waves that are constrained to travel along the surface of a solid or fluid
interface. Their energy is concentrated in a relatively small region about one wavelength
deep near the surface.
Through transmission - A test method using two transducers in which the ultrasonic
vibration is emitted by one and received by another on the opposite side of the part. The ratio
of the magnitudes of vibration transmitted and received is used as the criterion of soundness.
9
Transducer - An assembly consisting basically of a housing, piezoelectric element, backing
material, wear plate (optional) and electrical leads for converting electrical impulses into
mechanical energy.
Ultrasonic spectrum - The frequency span of elastic waves greater than the highest audible
frequenc\'. generally regarded as being higher than 2.0 10"* cycles per second (cps). to
approximately 10^ cps.
Ultrasonic evaluation - A nondestructive method of inspecting materials by the use of high
frequency sound waves into or through them.
10
CHAPTER II. REVIEW OF LITERATURE
Nondestructive testing (NDT) is the method of testing to detect internal, surface, and
concealed defects or flaws in materials using techniques that do not damage or destroy the
items being tested (Hay ward. 1978). There is a great deal of interest in nondestructive
technologies beyond the location and identification of cracks and voids. Specifically, there is
a growing interest in the application of nondestructive evaluation (NDE) which entails the
measurement of physical and mechanical properties of materials (Ruud. Bussiere. & Green.
Jr.. 1991). This measurement of material properties is often used to characterize the samples
being investigated. Society's push toward higher quality products and recycling of materials
provides the area of nondestructive testing with a vital role. This method of evaluation
supports the attitude of maintaining our environment. The materials being evaluated in this
study utilizes some products from the environment which usually are discarded and replaces
carcinogenic materials.
Reis et al. (1990) stated that the feasibility of nondestructive
evaluation/characterization of laminated wood products has significant economic
ramifications. Destructive methods of testing require that the performance of a sample be
evaluated in order to characterize the larger group represented by the sample. If destructive
methods were conducted on the entire population, there would not be any product remaining
for use. .A.nalytical ultrasonics implies the measurement of material microstructure and
associated factors that govern mechanical properties and dynamic responses.
11
Historical Overview of Ultrasonic Nondestructive Testing
The concepts of nondestructive testing have been used almost exclusively for
detecting macroscopic discontinuities in structures after they have been in service for some
time. It has become increasingly evident that it is practical and cost effective to expand the
role of nondestructive testing to include all aspects of materials production (Green, Jr.. 1991).
Interpretations of nondestructive testing (NDT) methods have been categorized as a
field of study associated with the analysis, inspection, characterization or examination of an
object or system to determine its fliture utilization without altering the physical
characteristics of the test material (Ness, 1995). This area of study supports society's need of
reducing refuse in the environment by eliminating the waste often associated with destructive
evaluation of material. Numerous ways of interrogating materials with different forms of
energy exist within the destructive test arena. Destructive examination includes cutting
samples from material, load testing, hardness testing and impact evaluation. All of these
methods change the state of the material being tested. The destruction of material also leads
to disposal decisions of the evaluated piece, which adds to the process of destructive testing.
Nondestructive methods include mechanical, visual, penetrant, thermal, optical,
electrical, magnetic, radiographic, acoustic and ultrasonics testing. The particular method
used is often determined by the type of material and evaluation needed. This field of study
includes crack and material identification and characterization. The characterization of the
microstructure of the materials (e.g.. resin curing, case hardening, and stress) is the direction
of new applications for NDT. The current study utilizes the capabilities of ultrasonic NDT to
evaluate the wood/agricultural boards. The decision to use ultrasonic testing was determined
12
by a report from (Green. Jr.. 1991). Ultrasonic waves are mechanical vibrations and therefore
ultrasonic testing is especially suited to detection of elastic anomalies and measurement of
physical properties such as porosity, structure and elastic constants (Green, Jr., 1991).
Advantages of ultrasonic NDT include the sensitivity, directivity of the signal, safety
factors, and proved established applications of the method. The resolution (sensitivity) and
small divergence of the signal provide critical analysis. The convenience of ultrasonics,
which includes factors such as portability of the equipment, clear cut usage techniques and
acceptance in industry, make it a feasible choice for material characterization.
Disadvantages associated with ultrasonic NDT procedures can exist with the coupling
of the transducers or attenuation of the signal. The type and dimensions of the object
determines whether the limitations of ultrasonic testing would prevent the researcher from
using ultrasonic NDT as a viable method.
Ultrasonics is a branch of acoustics dealing with frequencies generally beyond the
audible limit. Ultrasonic frequencies range from 25 kHz to 100 GHz. Appendix A displays a
frequency spectrum and frequency range for various applications of ultrasonic testing.
Frederick (1965) reported that ultrasonic energy applications are classified by either
mechanical work (e.g.. welding, drilling, or physical therapy) or producing and detecting an
ultrasonic signal to measure physical characteristics.
Ultrasonic techniques are important and are a valuable asset in the evaluation of
microstructures. mechanical properties and discontinuities. Green, Jr. (1991) reported on
some of the benefits and drawbacks of ultrasonic testing. The benefits include high
sensitivity, good penetrating power, accuracy in the measurement of discontinuity size and
13
position, fast response and need for access to only one surface of the test object. The
drawbacks include inconvenience of test object geometry and internal structure. The use of
ultrasonic methods in NDT are categorized into resonance, pulse, and acoustic emission
(Ensminger. 1988). The resonance method consists of determining the intrinsic frequency of
the object being examined. The pulse method involves the material being subjected to an
ultrasonic wave. The acoustic emission method detects the ultrasonic signal emitted fi-om the
material, after some e.Ktemal stimuli.
The theory of sound reported by Lord Rayleigh. a famous acoustician, made some of
the earliest contributions to the field of ultrasonics (Graff, 1991). Rayleigh was responsible
for the modern ultrasonic transducer's principle operation. Other researchers who worked in
the area with Lord Rayleigh included Colladon. Stumm. Stokes. Lebedev. and Joule (Graff.
1991). These individuals made various contributions to the acoustic field, which was the
forerunner to ultrasonics. Some of the discoveries and inventions included underwater sound
velocity, theoretical expressions for sound velocity, a high frequency generator,
magnetostriction, and piezoelectricity. The latter two scientific breakthroughs
(magnetostriction and piezoelectricity) are the basics of electrical to mechanical transduction.
Savart. Gallon, and Koenig were other early scholars of high frequency acoustics
(Frederick. 1965). Their studies date back to the 1840s-1950s. Other early scientists
studying the characteristics of these acoustic signals included Sokolov (1929) in Russia.
Trost. Gotz. Pohlmand and Mulhauser (1930) in Germany, Sproule (1940) in England, and
Firestone (1940) in the United States (Graff. 1991). These individuals made significant
contributions to the field.
The application of sonar and radar to produce a minisonar for material inspection was
the focus of researchers in the 1930s and 1940s (Bond. Punjani, & Saffari, 1984). This era
developed the field known as ultrasonics and was recognized as an important branch of
acoustics research. Early applications included discontinuity detectors, metallurgy laboratory
analysis, railway axles testing, and jet engine rotor forgings manufacttiring. The
discontinuity detection applications had limitations associated with this method which
included attenuation in some materials (Graff. 1991).
The application of ultrasonic NDT was best adapted for homogeneous isotropic
materials, but has also found many uses in the heterogeneous anisotropic arena of composite
materials. Thomas (1998) stated that ultrasonics was often applied to detect thickness and
search for flaws in metals (e.g.. cracks, voids, etc.). However, ultrasonics can also be used to
quality (e.g.. adhesives). and determine elastic moduli.
There are two basic techniques of ultrasonic testing: (1) the through transmission
technique where the energy is transmitted through the specimen being tested and the
transferred energy is measured; and (2) the pulse echo technique where observation of energy
reflected from flaws, cracks or voids is used to characterize the test material. The essential
equipment of ultrasonic testing includes an ultrasonic probe and an 'ultrasonic flaw detector"
(Bowker & Owens. 1984). Later reports by Green, Jr. (1991) referred to the basic ultrasonic
test system make-up as a transmitting transducer, couplant to transfer acoustic energy to the
material being tested, test material, and couplant to transfer acoustic energy to the receiver
15
transducer. Green also noted that the selection of equipment is dependent upon the
application.
The applications for ultrasonic nondestructive testing have vastly increased since its
inception in the early 1930s when the technique was mainly used for discontinuities. The
principal applications have expanded to include: (1) surface motion; (2) thickness
measurement; (3) determination of elastic moduli; (4) study of metallurgical structure; (5)
evaluation of the effect of processing variables on the component; and (6) thermoelastic
analysis.
Sokolov and Mulhauser are recognized as the fathers of ultrasonic nondestructive
testing from the perspective of applying the techniques to practical use (Graff, 1991). With
Mulhauser obtaining the first patent of a discontinuity detector and Sokolov's concept of
through transmission which showed that discontinuities would screen some of the energy
from the receiver transducer (Graff. 1991). In an earlier study Altberg designed an
instrument to detect ultrasonic waves (Frederick. 1965). The unique factor of the studies
conducted by Sokolov was the continuous ultrasonic wave. In 1937. Sokolov developed an
ultrasonic image tube based on the piezoelectric effect, which earned him the first patent
granted in the United States for this type of testing (Graff, 1991).
The ultrasonic pulse echo concepts were inspired by attacks on submarines in World
War 11. Developments by Firestone and Sproule implemented the use of the pulse echo
method. Firestone received a patent on his instrument called the reflectoscope. Sproule
utilized two transducers (transmitter and receiver) to apply the pulse echo method. The
difference of using two transducers was the defining characteristic of the research in England.
16
Kxuse in Germany had also developed a discontinuity detector along with contributions to the
field by Pohlman and Hiedemann (Graff. 1991).
The utilization of the pulse echo method for nondestructive testing increased
dramatically after these developments. Sperry Products in the United States and Kelvin and
Hughes Limited in England marketed the pulse echo nondestructive equipment developed by
Firestone and Sproule. By 1955 the pulse echo method was the dominant ultrasonic
technique (Graff. 1991).
The technique of ultrasonic NDT is adaptable to diversified applications. Uses for
ultrasonic NDT can be applied to materials to obtain informative results of material integrity-
mechanical characteristics. NDT concentrates on the performance of the material, and
determines if flaws or faulty characteristics exist.
Nondestructive Testing of Wood and Wood Composites
"Throughout history, man has found increasing usefialness for one of nature's
commonly occurring materials—wood. The number of forms in which this material has
served him is indeed vast. The useful life of wood, however, has often been limited by the
failure of some component after an interval of time as a crack, or cracks, propagated through
it" (Drouillard. 1990. p. 157). The many uses of wood have also spurred the technological
need for more understanding of the mechanical properties of this material. Drouillard (1990)
also quoted Robert L. Young's perspective on the utilization of wood: "... in the
development of nondestructive testing for wood and wood-based products, specific properties
need not necessarily be measured with the thought of providing an exact value for each piece
17
tested, but rather to classify individual pieces into categories within which it could be with
reasonable certainty that a definite percentage of the pieces would be within established
levels" Cp. 158).
The concepts of nondestructive testing of wood were formalized first by the work
done by Polatch Forest. Inc. (PFI) and Jayne at Yale University (Pellerin, 1978). In 1959.
PFI published results relating MOE. a measure of the stiffness of a wood specimen and
MOR. a measure of the failure point of a wood specimen. The importance of this
relationship was accentuated by the work done by Jayne. first at Yale University and later at
Washington State University, in developing a vibration technique by which the MOE of
wood could be determined (Jayne. 1959). Based on Jayne's work, commercial stress-grading
equipment was developed to determine MOE and then using the PFI relationship to
determine MOR (Pellerin. 1965).
parallel line of research by Pellerin and Kaiserlik (1975) and Pellerin and Kern
(1974) resulted in a new technique which measures the transmission time of a stress wave
through a piece of wood. This transmission lime was found to be highly correlated with
mechanical properties of the wood specimen (i.e.. a fast transmission time implies a specimen
vvith high mechanical propenies and a slow transmission time, a specimen with low
mechanical properties) (Pellerin. 1974). Pellerin (1978) also reported the longitudinal stress
wave formula used to compute the mechanical property of MOE as:
MOE = c" p. where:
c = transmission velocity of a wave through a wood specimen
p = density of the wood specimen
18
Ross and Vogt (1985) discussed that one-dimensional stress wave theory in
homogeneous, isotropic, prismatic rod is a function of the rod's dynamic MOE and density.
The equation was derived for an idealized one-dimensional case, but has been shown to exist
for actual three-dimensional members so long as the length of the wave is large relative to
members' lateral dimensions. As previously mentioned, wood does not possess the
characteristics of homogeneality nor is it isotropic. Another study by Bertholf (1965) proved
this theory was applicable to wood.
Hoyle, Jr. and Pellerin (1978) studied the stress waves in wood barrel arches in two
school buildings. They used stress wave technology to study glued laminated wood sections
in which known built in void areas of different sizes and configurations were studied. Out of
this study they foimd the void areas caused a reduction in the velocity of the stress wave that
was characteristic of the size and shape of the void.
Kennedy (1978) reported the two basic methods of nondestructive testing of wood
products were resonant and velocity testing of which practical applications of ultrasonics
favored the pulse velocity techniques. Techniques for using ultrasonics in the production of
panel products were reported by Baker and Carlson (1978). Inspection of wood panels
during the production may enhance the quality of the product. Baker and Carlson (1978)
developed instrumentation to monitor wood composite production nondestructively.
The possibility of detecting fracture phenomena in wood in the early stages was
studied by Bucur (1978). Gasick. Lemaster. and Domfeld (1987) studied the type of
transducer pulse-receiver combinations that would produce the optimal results for NDT of
wood composites. Portala and Ciccotelli (1989) reported on the evaluation of wood
19
characteristics using sensors to measure three types of attributes: (1) measurement of
external dimensions; (2) inspection of appearance; and (3) nondestructive internal inspection.
Portala and Ciccotelli's (1989) study focused on defining sensors that could characterize
wood in real-time.
Another aspect of ultrasonic nondestructive testing of wood was examined by Szabo
(1978) who reported on composite board analysis and studied the basic parameters associated
with executing the test. Pellerin and Morschauser (1973) worked with particleboard to
predict flexural behavior.
The evaluation of characteristics of wood-based composites was studied by Ross and
Pellerin (1988) using longitudinal stress waves. The characteristics examined included
tensile, flexural. and internal bond properties of the materials. Results from their study
showed a strong correlation between stress wave speed and tensile and flexural moduli but
specific gravity was a poor predictor of tensile and flexural moduli.
Ross and Pellerin (1991) reponed on past, present and future research in the area of
ultrasonic nondestructive testing. They provided a brief overview of the evolution of NDT
over the past 30 years and how future opportunities would propose welcomed challenges.
A study completed by Bozhang and Zhiyoung (1994) used a nondestructive
evaluation vibration technique to predict internal bond strength. MOE, and MOR of full-
sized particleboard panels. The researchers obtained high correlation coefficient results.
This study examined the panels by exciting the resonance frequency within the panels and
observing the vibrations within the boards. The calculation of the frequency was determined.
20
The current study was not dependent upon the resonance frequency of the material, because
an exact frequency signal was transmitted through the hardboards.
A summary of the historical development of ultrasonic nondestructive testing, and its
use with wood and wood composites was discussed. The focus of historical ultrasonic NDT
studies was to compare non destructive to proven destructive test results. The field of NDT
relies on destructive evaluation as the standard for test comparison.
The current study examined theory-based use of ultrasonic nondestructive testing to
evaluate a different type of wood composite. The wood composite content of wood fibers,
cornstalks, and switchgrass bonded together with soybean based adhesives was the distinctive
characteristic of the wood composite material studied. The producers of the composite had
previously only used destructive measures to evaluate the final product. The assessment of
the material without destruction was the focus of this study.
21
CHAPTER III. METHODOLOGY
Population of the Study
The population of this study was wood/agricultural fiberboards made from wood
fibers, cornstalks, and switchgrass bonded together with soybean-based, urea-formaldehyde
and phenol-formaldehyde adhesives.
Sample
The samples used in the study were dry-formed hardboard samples. The
specifications were made according to Kuo et al. (1998, p. 72):
Cornstalks from central Iowa and switchgrass from southern Iowa were collected in the fall of 1994. Cornstalk and switchgrass were processed into pulp by a pressurized disk refiner at the technical center of Masonite Corporation. West Chicago. IL. Cornstalk and switchgrass fibers also were obtained by using an atmospheric Sprout-Bauer refiner at the Center for Crop Utilization Research, Iowa State University. The adhesives used were a liquid pnenol-formaldehyde (PF) resin (50% solids, pH 11.0. and 300 centipoises viscosity at 77°F) was obtained from the Georgia-Pacific Corporation, and a urea-formaldehyde (UP) resin (WC-10, 65% solids) and a wax emulsion (EW 430H) were obtained from Borden Chemical Company. Two types of soy protein isolates were used. Arpro 2100 from ADM and Supro 760 form Protein Technologies International. Arpro 2100 is in the form of fine granules that require dispersal in water or other solvents for use as an adhesive, whereas Supro 760 is a fine powder that can be used directly in a similar way as powder PF is used. The fiberboards used in this study for the samples were dry-formed hardboard smooth on both sides (S2S). The (S2S) boards were made in three wood/agricultural fiber compositions of 100/0, 50/50, and 0/100. The agricultural fibers used were pressure-refined and were bonded either with 8 percent UF or 4 percent PF plus 4 percent Supro 760. The size of the specimens were 9" 9" 1/8" thick S2S boards at a target density of 62.4 pcf In the production of the dry-formed hardboard, an exact amount of furnish was hand-felted into a 9" x 9" forming box and hotpressed to 1/8" thickness.
Level of Confldence
In statistical testing, alpha (a) denotes the acceptable error rate for the test being used.
Therefore, if alpha is set at .025. this means the researcher is willing to accept five false
decisions out of 100 (Winer, Brown. &. Michels, 1991). Alternatively, beta (P) is the power
of the test to reject the null hypothesis correctly when it is false (Winer et al., 1991). A Type-
I error can be made by a researcher if the null hypothesis is mistakenly rejected (Rosenberg.
1990). Alternatively, a Type-II error is made when a null hypothesis that is false is not
rejected (Rosenberg, 1990). Because a = .025 and p = .025 were used, this resulted in a 95%
confidence interval.
Experimental Design
The first procedure of the experimental design was the development of the research
questions. A review of literature on ultrasonic NDT and equipment for the measurements
was conducted. Hypotheses and statistical procedures were determined. The design of the
samples was also determined. The collection of appropriate data to answer the research
questions was conducted. The first statistical procedure performed was a correlation
analysis. This test allowed for the determination of the relationship between the destructive
test (DT) MOE values versus the NDT MOE values between the two data sets on the
wood/agricultural hardboard composites. The next step was to verify if there was a
relationship between the mean MOE values for the DT and NDT methods. At this time the
DT modulus of rupture (MOR) data was also obtained. DT MOR values were correlated
with destructive test MOE values. A high correlation between MOR and MOE was expected.
23
If this correlation were low, it would prevent a nondestructive MOR prediction of
wood/agricultural hardboard composites. The next step in the design was to develop a
regression model consisting of an intercept and coefficients to obtain for use in predicting the
DT MOE.
All the samples were tested first by using the NDT method that consisted of sending
an ultrasonic signal of 100 kHz through the sample and measuring the time of travel.
Following the NDT data collection, the identical hardboards were tested destructively using a
Universal Testing Machine by Reihle (Kuo et al., 1998) which was retrofitted by
Measurement Technologies. Incorporated (MTI) with a 40,000 pound load cell controlled by
a computer program written for American Standard Measurement (ASTM D-1037). The
computer software ran a three-point load test where an increasing force was placed on the
sample until it failed. This information was used as the standard to which the NDT method
data was compared.
After each sample failed, the MTI software package calculated the MOE and the
MOR values for each of the samples. The primary reason for choosing the correlation
method of design for this research was to show there was a relationship between the two
types of evaluation.
Variables
The independent and uncontrolled variables of the study included the NDT and
construction of the fiberboards that determined the density and the time of travel of the
ultrasonic signal. An attempt was made for the hardboard samples that were produced to be
24
uniform, and for tlie process to control the dimensions (e.g., same length and approximate
diickness) (+ 001). The makeup of the fiberboards was varied, with different percentages of
wood-fiber and agricultural fiber content and the percentage adhesive used in the process.
Table 3.1 illustrates how the sample content varied.
Table 3.1. Sample content for wood/agricultural hardboards
The nondestructive tests were completed at Digital Wave Corporation in Englewood.
Colorado. The destructive test data were collected in the Forestry Department at Iowa State
University. Ames. Iowa. Sixteen wood/agricultural hardboards were analyzed using the
ultrasonic nondestructive testing method. TTie same hardboards were analyzed using the
destructive testing 3-point method (ASTM D-1037) after being cut to the specified length for
the test.
The correlation coefficient indicated there was a relationship between the destructive
MOE values and the nondestructive MOE values. A linear regression model was developed
which allowed the investigator to predict the destructive MOE value for a known
nondestructive MOE value. The ANOVA indicated a value for p, which was not equal to
zero. The probability of this occurring by chance was shown to have a P value less than
0.0000 (i.e., significance); therefore, the results of the ANOVA showed that p, 0. The
correlation analysis determined the degree of relationship of the ANOVA analysis which was
found to be R = .91. or high, and R- = .83 which meant that 83% of the variability was
40
explained by this model (i.e.. R" value is a measure of the amount of reduction in the
variability of Y obtained by using the regressor variables in the model).
Regression models are often fitted to data when the true functional relationship is
unknown. Naturally, one would like to know whether the order of the model tentatively
assumed is correct. Another test designed to check the validity of this assumption is called
the Lack-of-Fit Test (Montgomer>'. 1991). The Lack-of-Fit test could have been done to
show the variability in a more formal way. The hypotheses for the Lack-of-Fit test would
have been stated as follows:
The model adequately fits the data
The model does not fit the data
From an examination of the residual plots and the regression line plot, one could
accept the null hypothesis for the Lack-of-Fit test. By observing the sum of squares
attributable to pure experimental error (DT) and the sum of squares attributable to the lack of
fit of the model, one fails to reject the null hypothesis pertaining to the Lack of fit test. This
interpretation supports the linear regression model developed for this study, assuring this is
the best fit for this set of data.
Findings Related to the Hypotheses
The findings for each hypotheses in this study are presented as follows.
1. It was hypothesized there was no relationship between the MOE results of the
wood/agricultural material measured using a destructive test and the MOE results of
41
the wood/agricultural material using a nondestructive test where p is the correlation
coefficient value.
H„:p = 0
HA: P 0
One can reject the null hypothesis because a value of 0.91 was obtained for the value
of p (see Table 4.2).
2. One can predict the destructive test MOE value of wood/agricultural hardboards from
the full regression model when the nondestructive test MOE value of
wood/agricultural hardboards is known. The analysis showed the coefficient for the
independent variable to be significant and the linear regression equation to be a good
fit.
3. There is no significance for the model parameter.
P, = 0
H,: p, 0
One can reject the null hypothesis because a P value less than 0.0000 was found
which proved to be significant; therefore, the value of the model parameter was not
equal to zero.
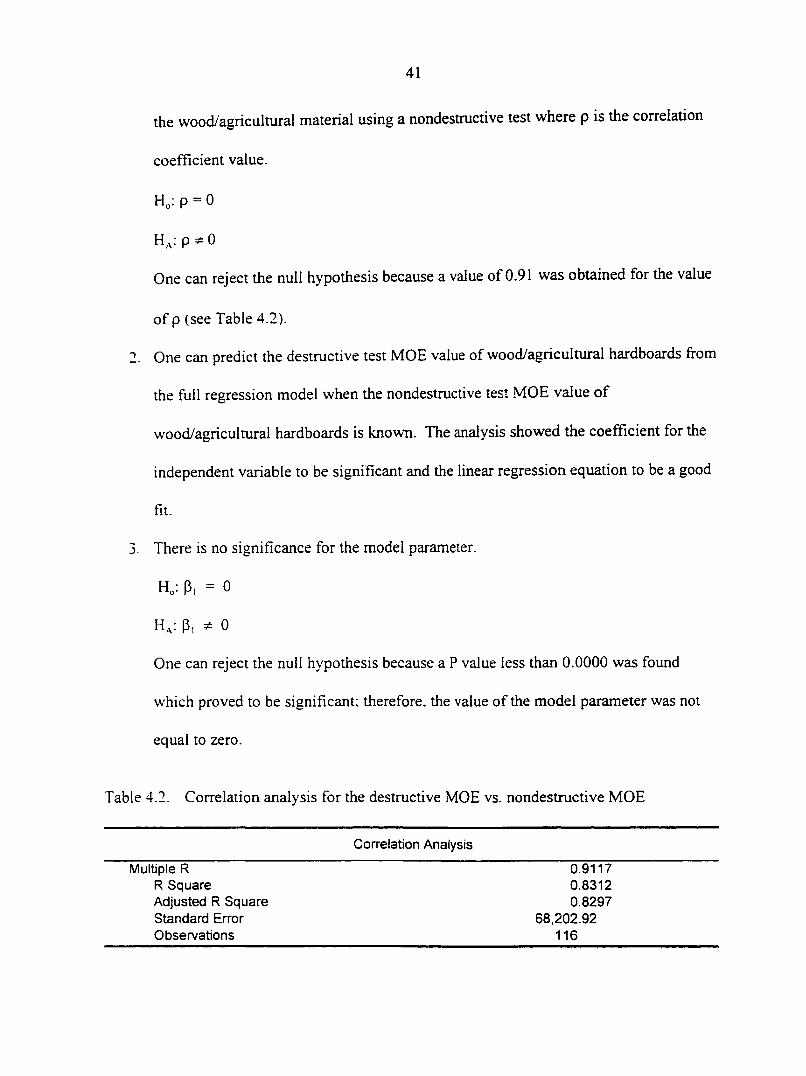
Table 4.2. Correlation analysis for the destructive MOE vs. nondestructive MOE
Correlation Analysis
Multiple R 0.9117 R Square 0.8312 Adjusted R Square 0.8297 Standard Error 68,202.92 Observations 116
42
Findings Related to the Research Questions
Two research questions guided this study.
Research Question 1: Is there a relationship between the MOE results of the wood/agricultural material measured using a destructive test and the MOE results of the
wood/agricultural material using a nondestructive test? That is, H^: Pi ^ 0, where Pi is the coefficient for a linear relationship benveen the between the destructive MOE values and the nondestructive MOE values
Yes. there is a relationship between the MOE results of the wood/agricultural material
measured using a destructive test and the MOE results of the wood/agricultural material
using a nondestructive test. The data used to answer Research Question 1 are displayed in
Table 4.1.
The correlation coefficient (R) of 0.9117 between the destructive MOE values and the
nondestructive MOE values indicated a high correlation with a P-value less than 0.0000. The
correlation coefficient shows that the dependent variable, destructive MOE and the
independent variable nondestructive MOE is strongly correlated with an R = 0.91. The value
of R' equals 0.83. indicating that 83 percent of the variability in Y has been explained by the
predictor X,.
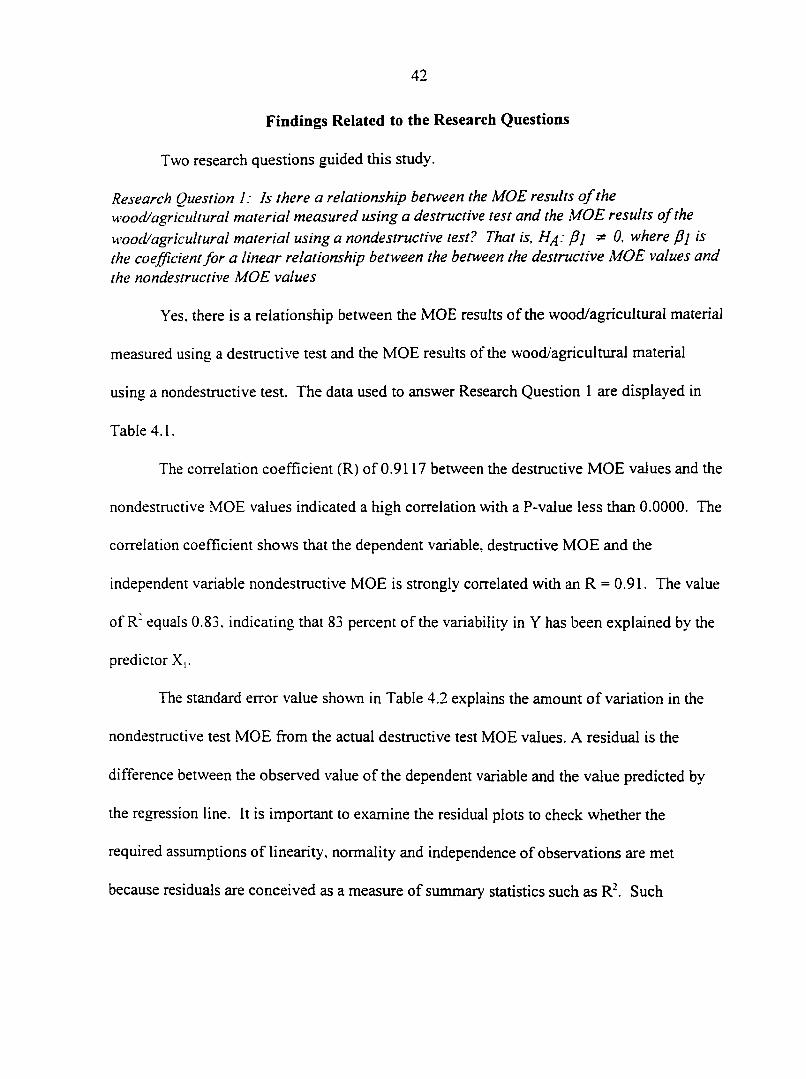
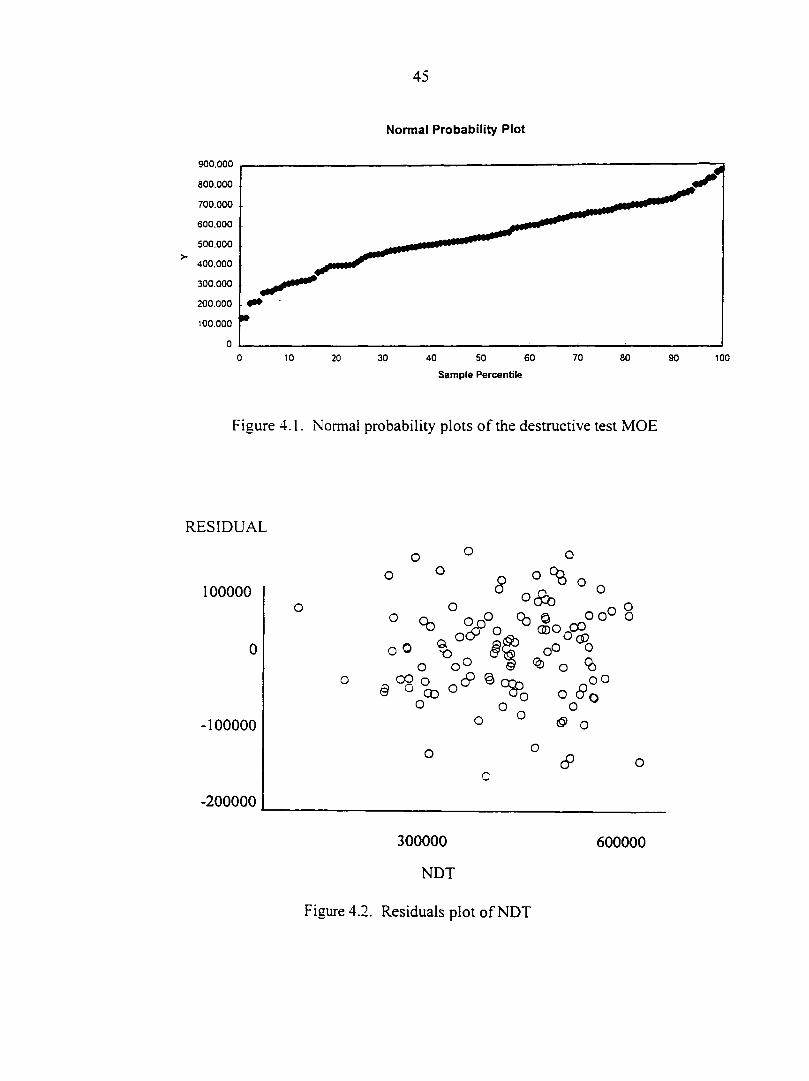
The standard error value shown in Table 4.2 explains the amount of variation in the
nondestructive test MOE from the actual destructive test MOE values. A residual is the
difference between the observed value of the dependent variable and the value predicted by
the regression line. It is important to examine the residual plots to check whether the
required assumptions of linearity, normality and independence of observations are met
because residuals are conceived as a measure of summary statistics such as R\ Such
43
summary statistics are useful in determining whether the fit of the regression equation is
good or bad. and whether the explained variation is adequate.
Research Question 2: Can one predict the MOE values for destructive test when the MOE
value for a nondestructive test is known?
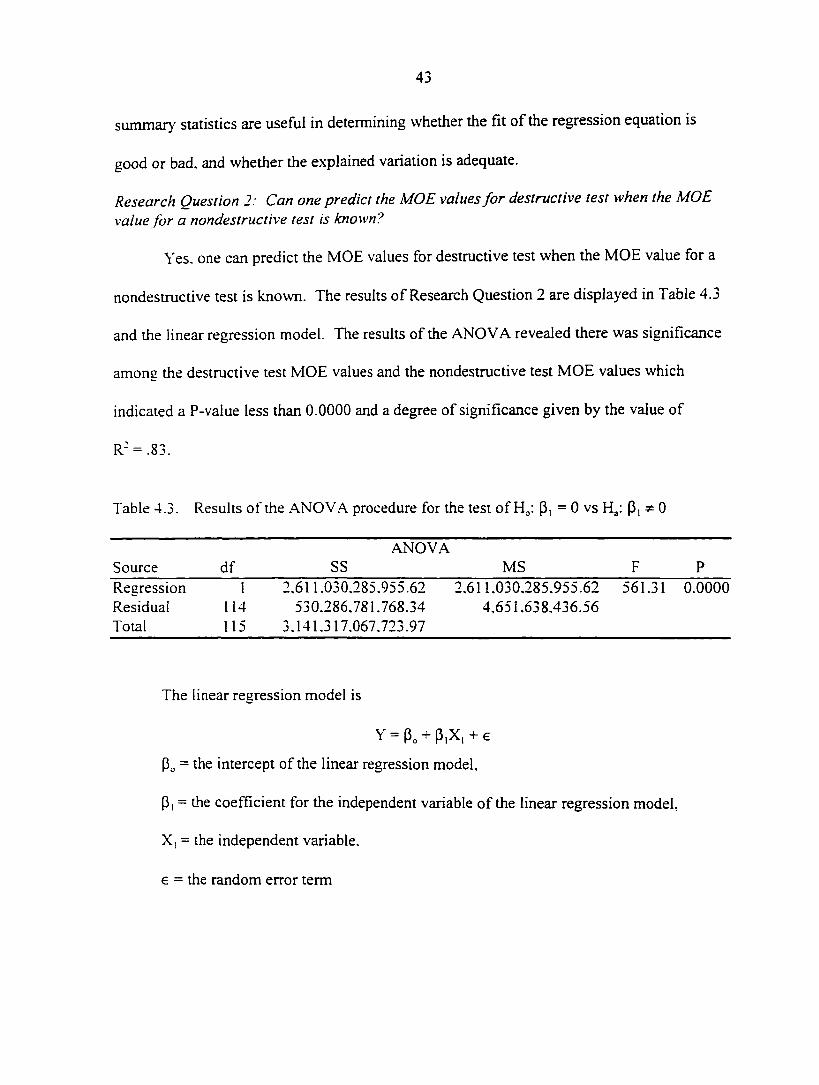
Yes, one can predict the MOE values for destructive test when the MOE value for a
nondestructive test is known. The results of Research Question 2 are displayed in Table 4.3
and the linear regression model. The results of the ANOVA revealed there was significance
among the destructive test MOE values and the nondestructive test MOE values which
indicated a P-value less than 0.0000 and a degree of significance given by the value of
R' = .83.
Table 4.3. Results of the ANOVA procedure for the test of P, = 0 vs H3: Pi ^ 0
Baker, D.. & Carlson, D. (1978). On-line product inspection by non-contact ultrasonics. Fourth Nondestructive Testing of Wood Symposium Proceedings. Washington State University, Pullman. The Engineering Extension Service. 233.
Bertholf. L. D. (1965). Use of elementary stress wave theory for prediction of dynamic strain in wood. Washington State Institute of Technology. Bulletin 291. Washington State University, Pullman.
Bond, L.J, Punjani. M., &. Saffari, N., (1984). Review of some recent advances in quantitative ultrasonic. lEE Proceedings, 13lA (4), 265.
Bowker, K.J. & Owen, R.C., (1984). Review of recent developments in ultrasonic NDT systems in the Central Electricity Generating Board (CEGB). lEE Proceedings, 13lA (4), 253.
Bozhang, S. & Zhiyong. C. (1994). Nondestructive evaluation of full-sized particleboard panels using the vibration technique. Ninth International Symposium on Nondestructive Testing of Wood. Conferences & Institutes, Washington State University Forest Products Society, Madison. WI. II7-122.
Bucur. V. (1978). Wood failure testing in ultrasonic methods. Fourth Nondestructive Testing of Wood Symposium Proceedings. Washington State University, Pullman. The Engineering Extension Service. 223.
Devore, J. L. (1987). Probability and statistics for engineering and the sciences (2"'' ed.). Belmont, CA: Brooks/Cole Publishing. 481.
Diederichs. R. (1998, April 10), Ultrasonic Testing Encyclopedia [on line]. http;//www.ndt.net/article/ut_az/ut_w/ut_w.htm#wheel
Drouillard. T. F. (1990). Anecdotal history of acoustic emission from wood. Journal of .Acoustic Emission. 9(3). 155-158.
Ensminger, D. (1988). Ultrasonics: Fundamentals, technology, applications (2"'' ed). New York: Marcell Decker, Inc. 2-4.
Frederick, J. R. (1965). Ultrasonic engineering. New York: John Wiley & Sons, Inc. 1-10.
63
Gasik. M. F., Lemaster. R. L., & Domfeld, D. A. (1987). Optimal transducer pulser-receiver combinations for use in acousto ultrasonic testing of wood and wood composites. Technical Report 35.01.442(1). Presented at the Acoustic Emission/ Forest
Products Workshop. 1-27.
Graff. K. (1991). Historical overview of ultrasonic test development. In A. S. Birks, R. E. Green. Jr.. & P. Mclntire (Eds.). Nondestructive testing handbook (2"'' ed.). pp. 24-32. United States of America: American Society for Nondestructive Testing.
Green. A. T. (1989). Correlation of internal bond strength of panicleboard with acousto ultrasonics. Joz/rwa/ of Acoustic Emission. 8(1-2), s307.
Green. R. E.. Jr. (1991). Introduction to ultrasonic testing. In A. S. Birks, R. E. Green. Jr.. & P. Mclntire (Eds.). Nondestructive testing handbook {2'^^ ed.). pp. 1-5. United States of America: American Society for Nondestructive Testing.
Hayward. G. P. (Ed.). (1978). Inspector's handbook series: Introduction to nondestructive testing. Milwaukee. Wl; .American Society of Quality Control. 32.
Hoadley. R. B. (1980). Understanding wood: A craftman 's guide to wood technology. Newtown. CT: Taunton Press, Inc. 107.
Hoyle. Jr. R. J. & Pellerin. R. F. (1978). Stress wave inspection of a wood structiu-e. Fourth Nondestructive Testing of Wood Symposium Proceedings. Washington State University. Pullman. The Engineering Extension Service. 33.
Jayne. B. .A. (1959). Vibrational properties of wood as indices of quality. Forest Products Journal, 9( 11). 413-416.
Kennedy. J. (1978). Ultrasonic testing of wood and wood products. Fourth Nondestructive Testing of Wood Symposium Proceedings. Washington State University. Pullman. The Engineering Extension Service. 185.
Kuo. M.. Adams. D.. Myers. D. Curry. D, Heemstra. H., Smith. J. L., & Bian, Y. (1998). Properties of wood/agricultural fiberboard bonded with soybean-based adhesives. Forest Products Journal, 48{2), 71-75.
Lemaster. R. L.. & Domfeld, D. A. (1987). Investigations of the feasability of using acousto-ultrasonics to measure defects in lumber. University of California, Berkley, Forest Product Laboratory.
Microsoft Excel user s guide, version 5.0. (1994). United States: Microsoft Corportation.
64
Minitab reference manual, release 10. (1994). United States: Minitab Inc.
Montgomery, D. C., (1991). Design and analysis of experiments (3"^ ed.). New York: John
Wiley & Sons. 493-494.
Mulhauser. O. (1931). Method of determining the state of work materials, particularly for the investigations flaws in them. German patent 569.598.
Ness. S. (1995). Nature of special nondestructive testing methods. In R. K. Stanley. P.O. Moore. & P. Mclntire (Eds.), Nondestructive testing handbook (2"'' ed). pp. 2-8. United States of America: American Society of Nondestructive Testing.
Pellerin. R. F. (1965). A vibrational approach to nondestructive testing of structural lumber. Forest Products Journal. 15(3). 93-101.
Pellerin. R. F. (1974). Nondestructive testing of particleboard. Proceedings of Seventh International Particleboard Symposium. Washington State University, Pullman.
Pellerin. R. F. (1978). Nondestructive testing of wood: A possible method for timber piling. Fourth Nondestructive Testing of Wood Symposium Proceedings. Washington State University. Pullman. The Engineering Extension Service. 169-174.
Pellerin. R. F. & Kaiserlik. J. (1975). Grading of wood products by stress wave. Paper presented at lUFRO Division 5 - Wood Engineering Group Meeting.
Pellerin R. F. & Kern. J.W. (1974). Stress wave analysis of logs. Unpublished report of the Wood Technology Section. Washington State University. Pullman.
Pellerin R. F. & Morschauser. C. R. (1973). Nondestructive testing of particleboard. Proceedings, Seventh International Particleboard Symposium, T. M. Maloney (Ed). Washington State University, Pullman.
Portala J. F., & Ciccotelli. J. (1989). NDT techniques for evaluating wood characteristics. Seventh Nondestructive Testing of Wood Symposium Proceedings, pp. 97-124 Washington State University. Pullman, & USDA Forest Products Laboratory, Madison. Wl.
Reis dos. H. L. M.. Beall, F. C., Camahan. J. V.. Chica, M. J., Miller, K. A., & Klick, V. M. (1990). Nondestructive evaluation/characterization of adhesive bonded connections in wood structures. Nondestructive testing and evaluation for manufacturing and construction, pp. 197-207. New York: Hemisphere Publishing Corporation.
65
Reis dos. H. L. M.. McFarland, D. M. (1986). On the acousto-ultrasonic characterization of wood fiber hardboard. Journal of Acoustic Emissions, 5(2), 67-70.
Rosenberg, K. M. (1990). Statistics for behavioral sciences. Dubuque, lA: William C. Brown.
Ross. R. J.. & Pellerin. R. F. (1991). Nondestructive evaluation of wood - past, present, and future. In C. O. Ruud. J. P. Bussiere. R. E.Green. Jr. (Eds.), Nondestructive characterization of materials IV. (pp. 59-64). New York: Plenum Press.
Ross. R. J. &. Pellerin, R. F. (1988). NDE of wood-based composites with longitudinal stress waves. Forest Products Journal, 38(5), 39 - 45.
Ross, R. J., & Vogt, J. J. (1985). Nondestructive evaluation of wood-based particle and fiber composites with longitudinal stress waves. Fifth Nondestructive Testing of Wood Symposium Proceedings. Washington State University, Pullman. The Engineering Extension Service. 121-157.
Ruud, C. O.. Bussiere. J. F., & Green, R. E., Jr. (Eds.). (1991). Nondestructive characterization of materials IV. International Symposium on Nondestructive Characterization of Materials (4''' ed). New York: Plenum Press.
Singh, G. P. & Davies. J.W. (1991).Multiple transducer ultrasonic techniques. In A. S. Birks. R. E. Green. Jr.. & P. Mclntire (Eds.). Nondestructive testing handbook (2"'' ed.). .p. 268. United States of America: American Society for Nondestructive Testing.
Sokolov. S. (1929). On the problem of transmission of ultrasonic vibrations in various materials. Electrische Nachrichten-Technik. vol.6. Berlin, Federal Republic of Germany: 454-461.
Szabo. T. (1978). Use of ultrasonics to evaluate or characterize wood composites. Fourth Nondestructive Testing of Wood Symposium Proceedings. Washington State University, Pullman. The Engineering Extension Service. 239-260.
Thomas. G. (1998. May 19). Ultrasonic inspection/acoustic microscopy [on line]. Available. http://www.llnl.gOv/IPandC/opportunities93/08-NDE/NDE_Overview.shtml
Winer. B. J.. Brown. D. R.. & Michels. K. M. (1991). Statistical principles in experimental design (3"" ed.). New York: McGraw Hill.
66
ACKNOWLEDGEMENTS
First. I give thanks and honor to almighty God for blessing, watching over and
providing me with the intelligence and perseverance to accomplish this educational goal.
Faith has always been a strong factor in my life, which is supported by my favorite verse:
Philippians 4:13;'i can do all things through Christ who strengthens me."
1 would like to express my most sincere appreciation to my major professor. Dr. Larry
Bradshaw. who has guided and directed my doctoral program. I am especially thankful for
his patience, encouragement, support and careful editing of the dissertation.
Thanks to my committee members: Drs. George Jackson, Derrick Rollins. Ellen
Mullen, and Steve Freeman. I am especially grateftil to Dr. Jackson for his financial support,
persistance. and golf lessons throughout my tenure at Iowa State University. Dr. Rollins,
thanks for providing the statistical expertise and spiritual guidance as well. During my years
at ISU. Dr. Mullen became a good friend and confidant. Dr. Freeman, thanks for joining my
committee in the eleventh hour—your support was appreciated. I would also like to
acknowledge Drs. Bill Paige and Denis Zeimet who were on my original committee and have
continued to show an interest in my well-being after they left ISU.
1 am thankful to the Industrial Education and Technology Department at Iowa State
University for providing me with a valuable educational experience, and to the Department of
Industrial Technology at the University of Arkansas, Pine Bluff for providing me with the
opportunity to go on sabbatical to obtain my terminal degree.
67
I would like to express my appreciation to Drs. Molin FCuo and Deland Myers for
providing me with the samples for this study.
To my Friendship Baptist Church family and Pastor Terrance Shane, I am grateful for
your prayers and warm solicitations throughout my stay in Ames. The opportunity to share
with everyone has helped me to mature as a Christian. I will remember you forever.
1 have made many friends during my four years in Ames, Iowa. They made the long
journey a lot warmer and shorter in spite of the bitter, harsh winter weather. A few special
persons have become my dear friends and I look forward to continuing our professional and
social relationships: Lawrence Hill, Dr. Israel Colon, Dr. Farhad Jadali, Dr. Brian Hemphill.
Michael Boulden. Dr. Yung Hsieh. Mandara Savage, and the "Crew".
1 am grateful to Pat Hahn. my editor and friend. I especially enjoy her enthusiasm
and dedication to Cyclone Hockey.
1 would be remiss without thanking Ms. Thelma Harding who recruited and nutured
me throughout this educational experience.
My family has been a blessing throughout my life. Thank you mama and daddy for
your sacrifices, prayers and most of all. your continual belief in my ability and concern about
my welfare. I am especially grateful for the strong Christian faith you instilled in me. To my
godmother, your presence is always with me. I also appreciate the love and prayers of my
wife's family who have become very dear to me over the four years of my marriage to their
wonderful daughter.
68
To my precious daughter. Asia, you have enriched our lives with your laughter, ever
present enthusiasm, endless questions, stimulating conversations on Saturday mornings, and
frequent visits. Your daddy loves you very much.
Last but most important, to my dear and lovely wife, Tonya (c.m.). who is my best
friend and the love of my life—without you none of this would be possible. You have given
me strength and courage to forge ahead through difficult times and you have shared the joys.
Tonya, you never gave up. and my success is your celebration, too. I love you today,
tomorrow—always.
IMAGE EVALUATION TEST TARGET (QA-3)
1.0 in
m 1
m • — Li
in
m 1 1—
I.I
Ui la la 1 |2.0
I.I u ^
nil 1.8 nil • -
1.25 1.4 1.6
1 r/% 1 ^Unim
6
V
«p /
• /
/APPLIED A IM/IGE . Inc .Jag; 1653 East Main Street
-=*• Rochester. NY 14609 USA -='•= Phone: 716/482-0300