A STUDY TO EVALUATE THE EFFECTIVENESS OF AUTOGENIC DRAINAGE AND POSTURAL DRAINAGE FOR IMPROVING PULMONARY FUNCTIONS IN PATIENTS WITH STABLE CHRONIC OBSTRUCTIVE PULMONARY DISEASES DESSERTATION SUBMITTED TO THE TAMILNADU DR. M.G.R. MEDICAL UNIVERSITY TOWARDS PARTIAL FULFILLMENT AS A REQUIREMENT FOR THE DEGREE MASTER OF PHYSIOTHERAPY (PHYSIOTHERAPY IN CARDIO RESPIRATORY) APRIL – 2016
Transcript
A STUDY TO EVALUATE THE EFFECTIVENESS OF
AUTOGENIC DRAINAGE AND POSTURAL DRAINAGE
FOR IMPROVING PULMONARY FUNCTIONS IN
PATIENTS WITH STABLE CHRONIC OBSTRUCTIVE
PULMONARY DISEASES
DESSERTATION SUBMITTED TO
THE TAMILNADU DR. M.G.R. MEDICAL UNIVERSITY
TOWARDS PARTIAL FULFILLMENT AS A REQUIREMENT FOR THE
DEGREE
MASTER OF PHYSIOTHERAPY
(PHYSIOTHERAPY IN CARDIO RESPIRATORY)
APRIL – 2016
A STUDY TO EVALUATE THE EFFECTIVENESS OF
AUTOGENIC DRAINAGE AND POSTURAL DRAINAGE
ON PULMONARY FUNCTIONS IN PATIENTS WITH
STABLE CHRONIC OBSTRUCTIVE PULMONARY
DISEASES .
Internal Examiner:
External Examiner:
A dissertation submitted in partial fulfillment
as a requirement for the degree
MASTER OF PHYSIOTHERAPY
To
THE TAMIL NADU DR. M.G.R. MEDICAL UNIVERSITY
CHENNAI
APRIL 2016
CERTIFICATE
This is to certify that the research work entitled “A STUDY TO
EVALUATE THE EFFECTIVENESS OF AUTOGENIC DRAINAGE
AND POSTURAL DRAINAGE ON PULMONARY FUNCTIONS IN
PATIENTS WITH STABLE CHRONIC OBSTRUCTIVE
PULMONARY DISEASES” was carried out by the candidate with the
(REG NO: 271430141) Master of physiotherapy student at Thanthai Roever
Collage of Physiotherapy, Perambalur, submitted to Tamil Nadu Dr.
M.G.R. Medical University, Chennai towards the partial fulfillment as a
requirement for the Degree Master of Physiotherapy (MPT- CARDIO
RESPIRATORY).
Prof. C.V. John Franklin, MPT., MIAP.,
Principal
Thanthai Roever College of Physiotherapy
Perambalur -621212
PLACE:
DATE:
CERTIFICATE
This is to certify that the research work entitled “A STUDY TO
EVALUATE THE EFFECTIVENESS OF AUTOGENIC DRAINAGE
AND POSTURAL DRAINAGE ON PULMONARY FUNCTIONS IN
PATIENTS WITH STABLE CHRONIC OBSTRUCTIVE
PULMONARY DISEASES” was carried out by the candidate with the
(REG NO: 271430141) Thanthai Roever College of Physiotherapy
Perambalur under the guidance of me towards the partial fulfillment as a
requirement for the degree Master of Physiotherapy Submitted to The
TamilNadu Dr. MGR Medical University Chennai. (MPT- - CARDIO
RESPIRATORY).
GUIDE: Prof. Muruganandam M.P.T (Cardio Respiratory)
Thanthai Roever College of Physiotherapy
Perambalur -621212
PLACE:
DATE:
ACKNOWLEDGEMENT
First and foremost I wish to acknowledge my heartfelt gratitude to
the LORD ALMIGHTY for his presence and guidance.
My warm-hearted thanks to the Thanthai Roever College of
Physiotherapy, St. John Sangam Trust, especially to the Chairman
Dr. K. VARADHARAJAN, B.A., B.L., FOR giving me an opportunity
to study in this Institution.
I am indebted to Prof. C.V. John Franklin, MPT., MIAP.,
Principal who spared his time and effort without his skilled knowledge,
performance guidance and benevolence this research work would never
have been finished.
I owe my sincere thanks to my Guide, Prof. P. Muruganandam,
MPT Associate Professor Thanthai Roever College of Physiotherapy for
his advice and assistance at different stages of this study.
I pay my thanks to my Faculty Members and their support and
guidance.
TABLE OF CONTENTS
S. No
Table of Content
Page. No
1
INTRODUCTION
1
2
NEED OF STUDY
4
3
AIM & OBJECTIVES
5
4
REVIEW OF LITERATURE
6
5
DESIGN & METHODOLOGY
9
6
DATA ANALYSIS & INTERPRETATION
26
7
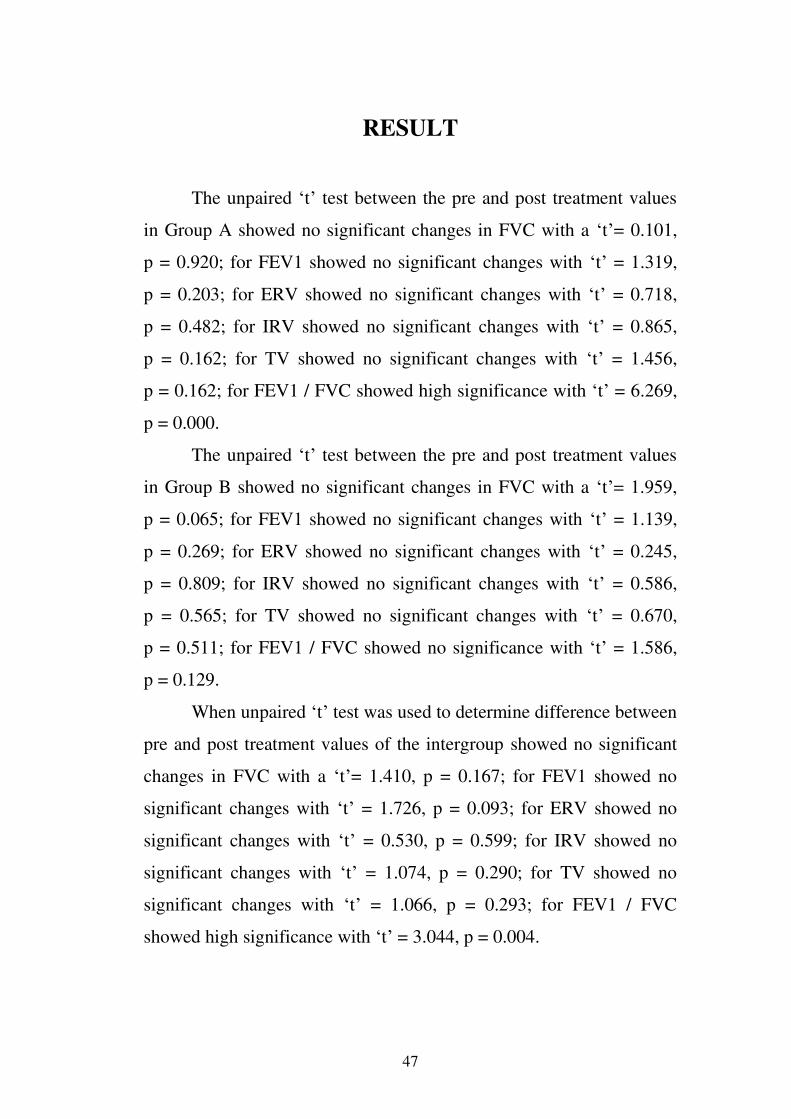
RESULT
47
8
DISCUSSION
48
9
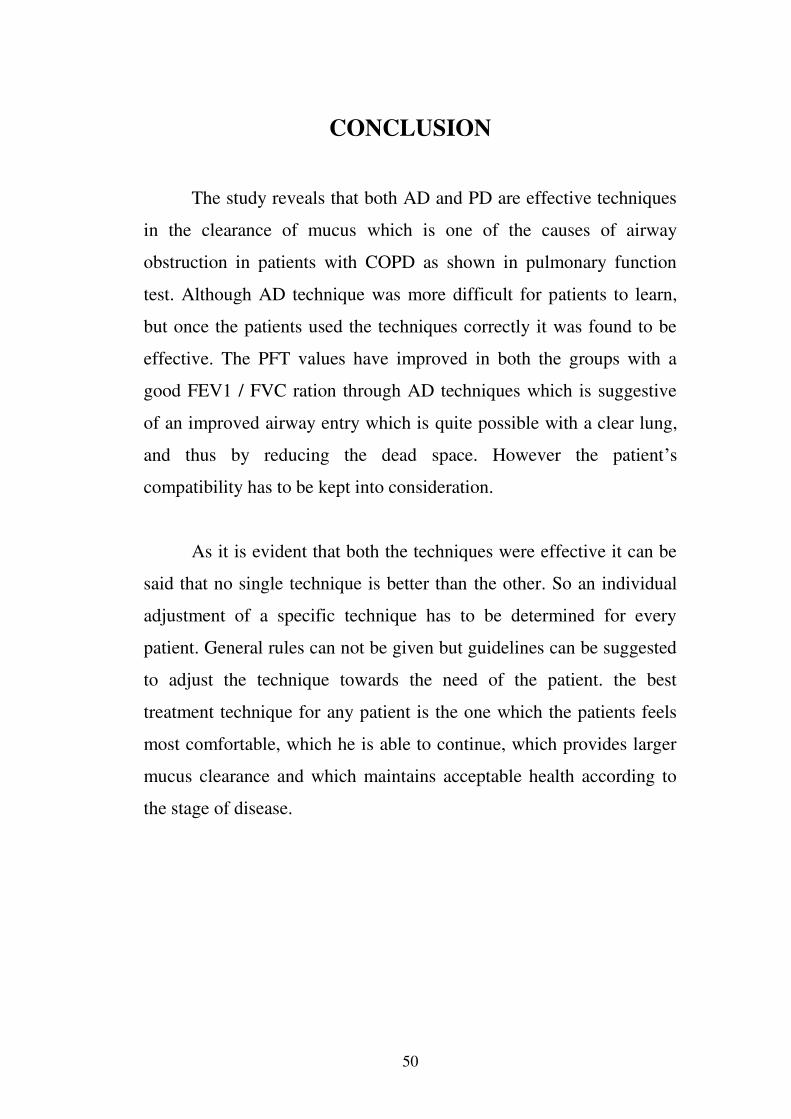
CONCLUSION
50
10
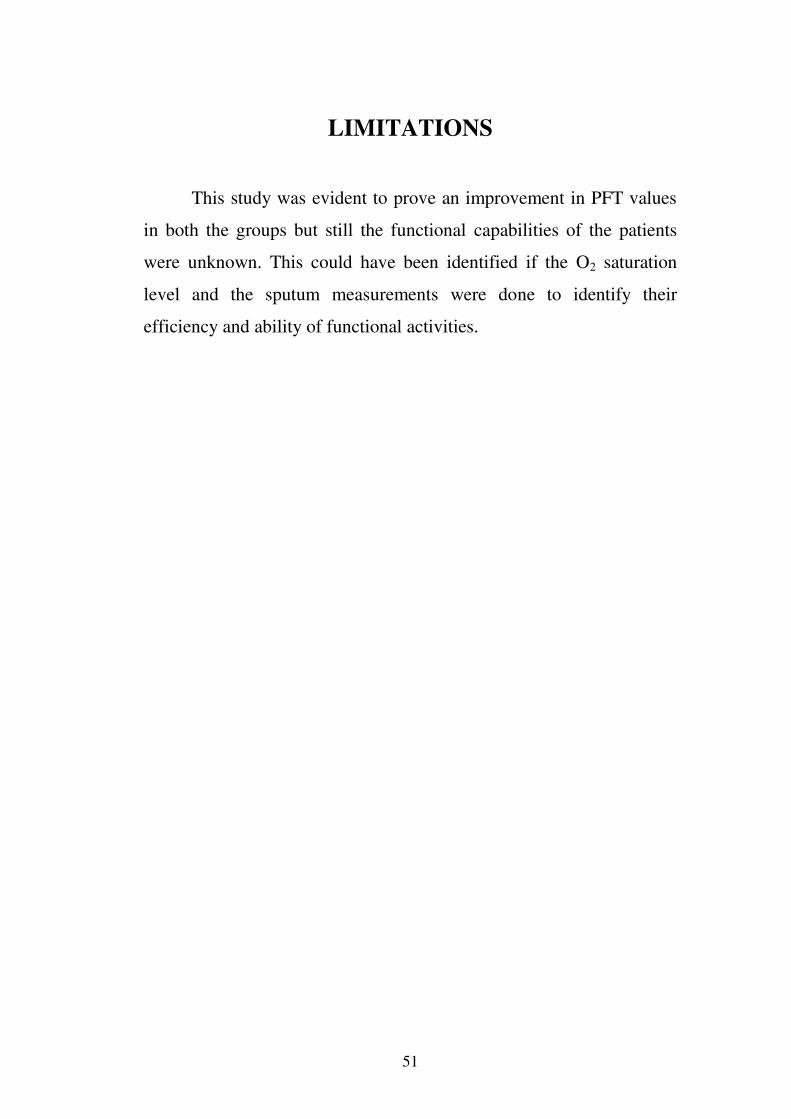
LIMITATION
51
11
REFERENCE
52
12
APPENDIX
55
1
INTRODUCTION
Chronic Obstructive Pulmonary Disorder is a slow progressive
disorder of the airways that is characterized by gradual loss of lung
function. This results in lung destruction due to chronic mucus
impartion and infection of airway. Clearance of this mucus is an
important part of therapy in COPD but is complicated by impaired
mucociliary clearance. The term COPD includes chronic bronchitis,
chronic Obstructive bronchitis, emphysema or combinations of these
conditions, as per National Heart Lung and Blood Institute, represents
the fourth leading cause of death in the world.1
The pathological changes that occur over time in COPD are
inflammation of the mucus membranes of the airways; decreased
production and retention of mucus; narrowing and destruction of
airways and bronchial walls. These structural changes are reflected in
pulmonary function tests. Much physical impairment develops over
time. Patients typically have a chronic, productive cough and are often
short of breath. There is inability to remove air from the lungs which in
turn affects the ability of the respiratory system to transport oxygen
into the lungs. Consequently, functional limitations and eventually
disability occur consistent with the disablement process. Impairments
such as decreased vital capacity and forced expiratory volume are
associated with decreased tolerance to exercise, frequent episodes of
dysponea, decreased walking speed and distance and eventually
inability to perform activities of daily living at home or in the work
place or to remain an active participation in the community.2
2
The purpose of this study was to determine the effectiveness of
postural drainage and Autogenic Drainage on pulmonary function by
mucus clearance techniques, because mucus clearance is a problem in
COPD and Autogenic Drainage and Postural Drainage is a traditional
method of facilitating mucus clearance. Research studies with COPD
patients support the efficacy of Autogenic Drainage and Postural
Drainage in patients who can tolerate it. Both these techniques promote
independence and self-care in the patients and effectiveness of both has
been supported by the researches.
Conventional therapy involves enhanced mucus clearance with
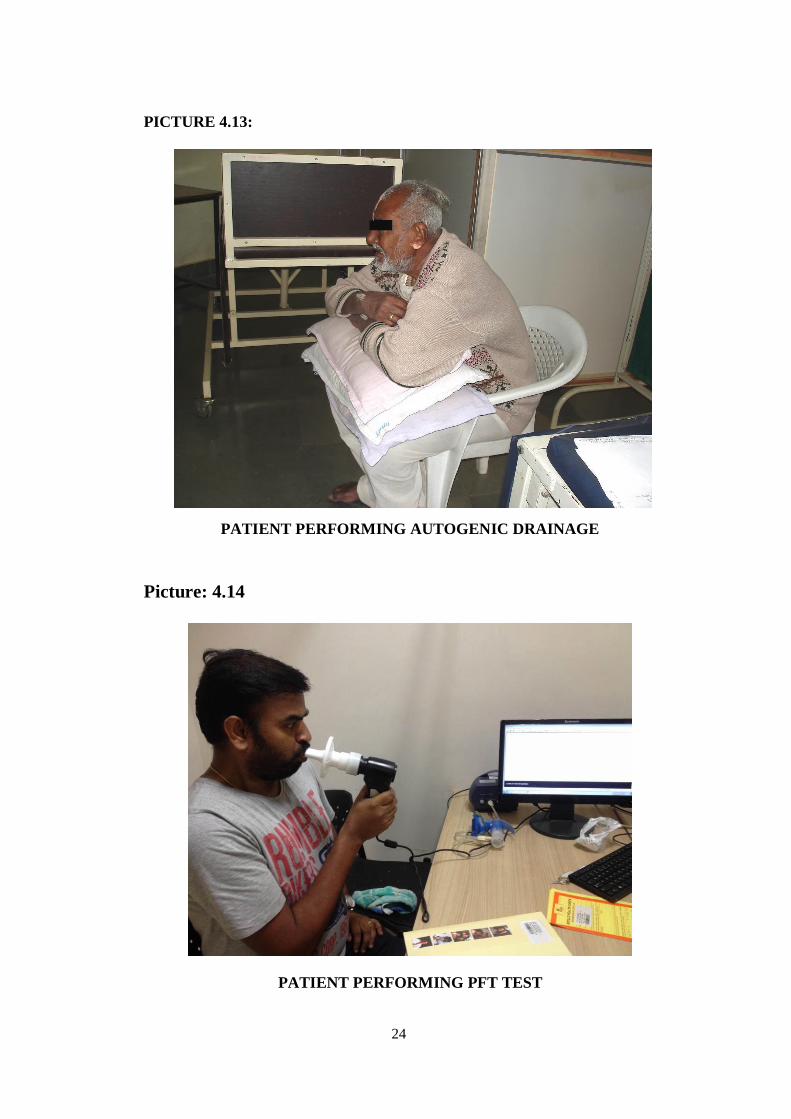
Autogenic Drainage and Postural Drainage. Autogenic Drainage is an
airway clearance that allows patients to do their own therapy. This
provides more independence and control over daily care when
compared with Postural Drainage. Autogenic Drainage was devised by
the Belgian physiotherapists Jean chevalier. It was first developed in
1960’s to treat Asthmatic patients. It is now being used widespread to
treat patients with retention of secretions.3
Autogenic Drainage uses diaphragmatic breathing to mobilize
secretions by varying expiratory airflow. It consists of these phases:
a. Breathing at low lung volumes to ‘unstick’ the peripheral
secretions.
b. Breathing at low – to – mid lung volume (tidal volume) to
‘collect’ mucus in the middle airways.
c. Breathing at mid – to – high lung volumes to ‘evacuate’ the
mucus from the central airways.4
3
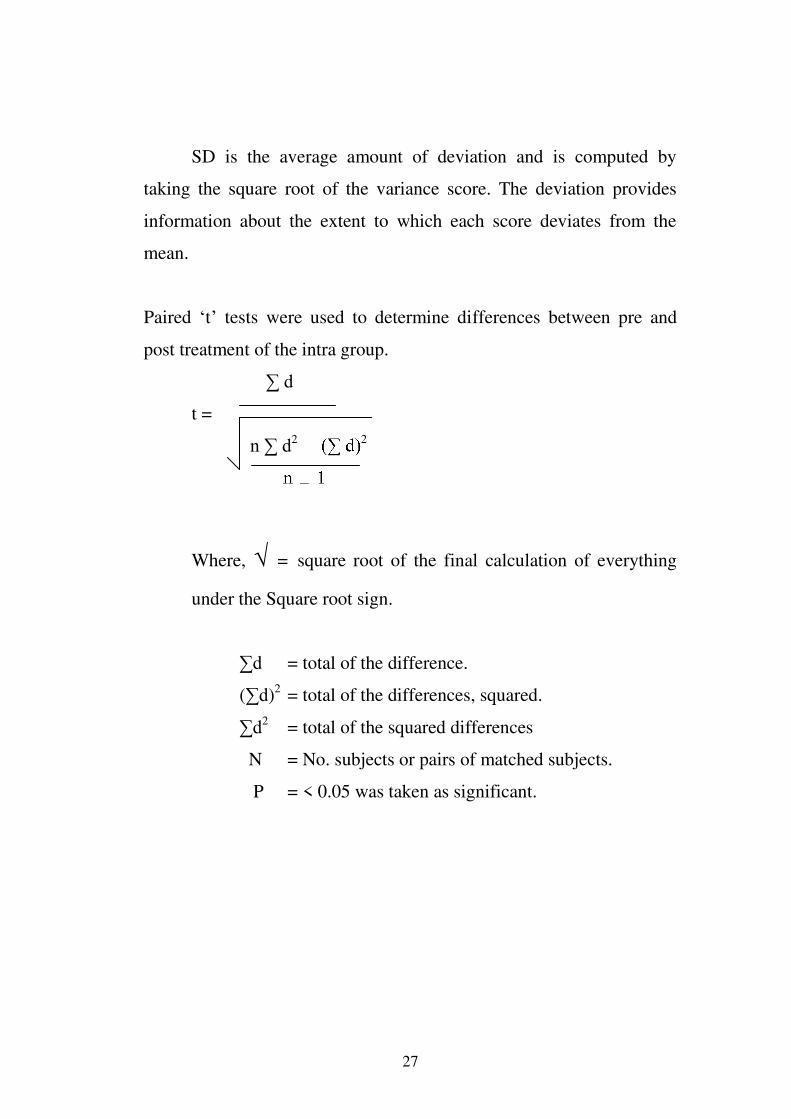
Postural Drainage is a component of bronchial hygiene therapy.
It is accomplished by positioning the patient so that position of the
lung segment to be drained allows gravity to have its greatest effect.
The length of the time spent in each position and total treatment time
will depend on the gravity of secretion in each area and the number of
areas that have to be drained. It may be necessary to spend an average
of 15 – 20 minutes in each position to allow adequate drainage and this
may mean that different areas will require draining at alternate
treatments. The worst areas would be drained first.4
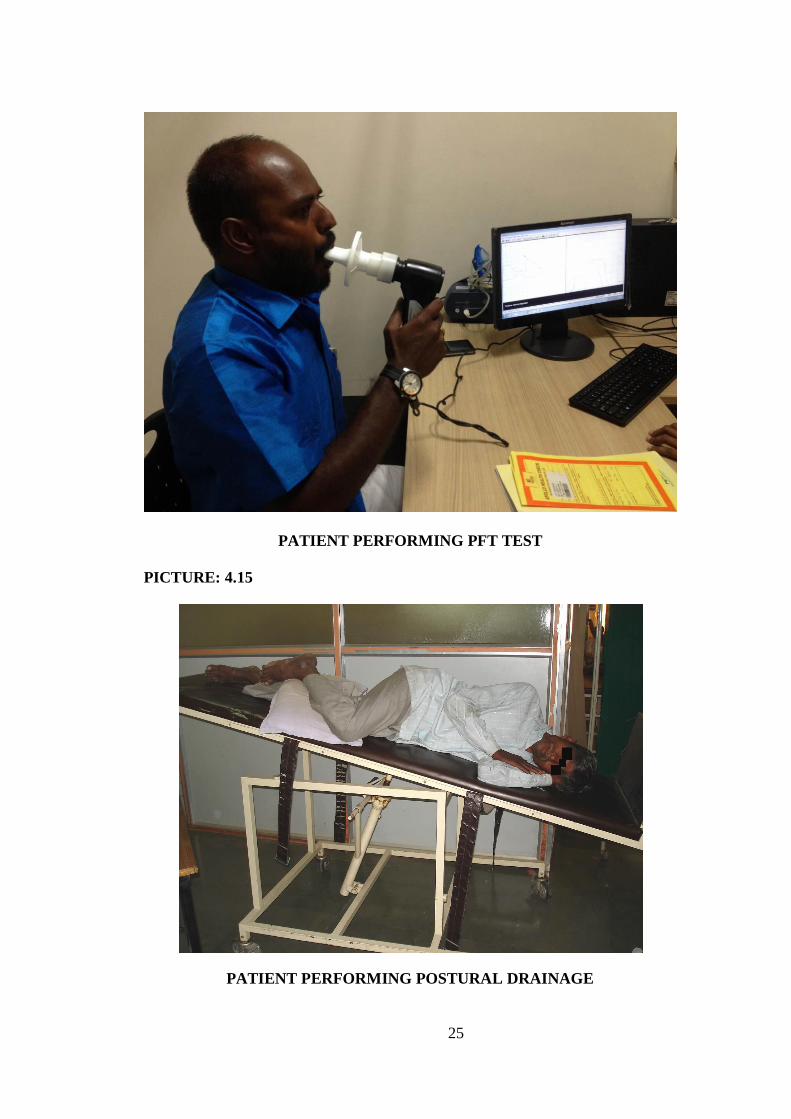
Both of these
techniques are used to improve forced vital capacity (FVC) and forced
expiratory volume in one second (FEV1) which is analyzed by
computerized spirometer. Spirometry is the pulmonary function test
done to measure how much and how quickly you can move air out of
your lungs. The test reveals the capacity of air it can hold, speed of
breathing and ability to exchange gases from blood. The test can
diagnose lung disease and measure the severity of lung problems.
So, the importance of doing this study is that as we have come to
know that COPD is characterized by a reduction in airflow and an
increase in dead space & chronic cough and sputum production are
common features of COPD and have significant impact on
exacerbation frequency and quality of life. So, to increase Tidal
Volume, decrease Respiratory Rate & sense of dysponea, postural
drainage and autogenic drainage has been used for improving the
quality of life and leading an independent life for the patient suffering
from COPD.
4
NEED FOR THE STUDY
To identify an effective technique for airway clearance and to improve
pulmonary function. Because some studies says autogenic drainage is the one
best for clear the secretion and other some says postural drainage is best.
HYPOTHESIS
Null hypothesis
There is no significant difference between autogenic drainage and
postural drainage in stable COPD patients.
Alternate hypothesis
There is significant difference between autogenic drainage and postural
drainage in stable COPD patients.
5
AIM & OBJECTIVES
AIM:
To identify an effective technique for airway clearance and to
improve pulmonary function.
OBJECTIVES:
1. To compare the pulmonary function tests between the Autogenic
Drainage and Postural Drainage.
2. To find out the effectiveness of Autogenic Drainage and
Postural Drainage in airway clearance.
6
REVIEW OF LITERATURE
Holland AE et al., (2006) in his study quoted that chronic cough and
sputum production are common features of chronic obstructive
pulmonary disease. So, analysis of short – term studies suggested that
there may be benefit from autogenic drainage which has proved
positive result in clearance of sputum.7
Pryor et al (2004) quoted that physical therapy techniques can be used
to augment mucociliary clearance, for example the ACBT, autogenic
drainage, positive expiratory pressure and there is a benefit from
physical therapy for people with obstructive airway disease.10
Opdekamp C et al., (2003) quoted that due to reduction in airflow and
an increase in dead space in COPD patients. Postural drainage in most
parts of the world has been used for airway clearance which also
includes forced expiratory maneuvers or techniques of breathing at
different airflow and lung volumes.8
Savei S et al., (2000) in his study stated that Autogenic drainage has
improved forced vital capacity, force expiratory volume in 1 second,
peak expiratory flow rate, forced expiratory volume from 25 to 75% an
concluded it by stating that Autogenic drainage is as effective as the
ACBT in clearing secretions and improving lung functions.5
7
Langenderfer B (1998) in his study stated that percussion and postural
drainage promotes independence and self care in the patients and these
2 techniques are the traditional method of facilitating mucus
clearance.6
Donald R Giles (1995) in his study suggested that autogenic drainage
and postural drainage has short term benefits in patients with cystic
fibrosis but in pulmonary function test autogenic drainage is superior
to postural drainage as a secretion clearance technique.9
Olseni et al (1994) stated that 2 techniques, postural drainage and
positive expiratory pressure breathing, were used. Both techniques
were given with the combination of forced expiratory techniques. The
outcome was the clearance of mucus was more effectively done by
postural drainage combined with forced expiratory techniques.11
Mortensen J et al., (1991) studied the effect of two chest
physiotherapy regimens on whole lung and regional tracheobronchial
clearance in 10 patients with cystic fibrosis. The regimen were given
on 2 separate days and consisted of 20 min of (1) Postural drainage and
the forced expiratory technique (PD + FET), and (2) Positive
expiratory pressure (PEP – mask) and FET (PEP + FET). A third day
served as control and he concluded that PD has short term whole lung
and regional TBC in patients with cystic fibrosis.12
8
Maloney FP et al., (1981) determined the effect of PD on pulmonary
functions and sputum volume in patients with partially reversible
chronic obstructive pulmonary disease; comparisons were made
between days with and without PD in 13 patients. Pulmonary function
tests were done 3 times a day over 12 – day period. Outcome was PD
showed effect in some patients.13
9
DESIGN AND METHODOLOGY
STUDY DESIGN:
Quasi Experimental Study Design
STUDY SETTING:
Hospital approved by the guide and college.
SAMPLING:
Purposive Random Sampling.
40 patients who were diagnosed for COPD were selected and
divided into 2 groups alternatively after taking written consent to
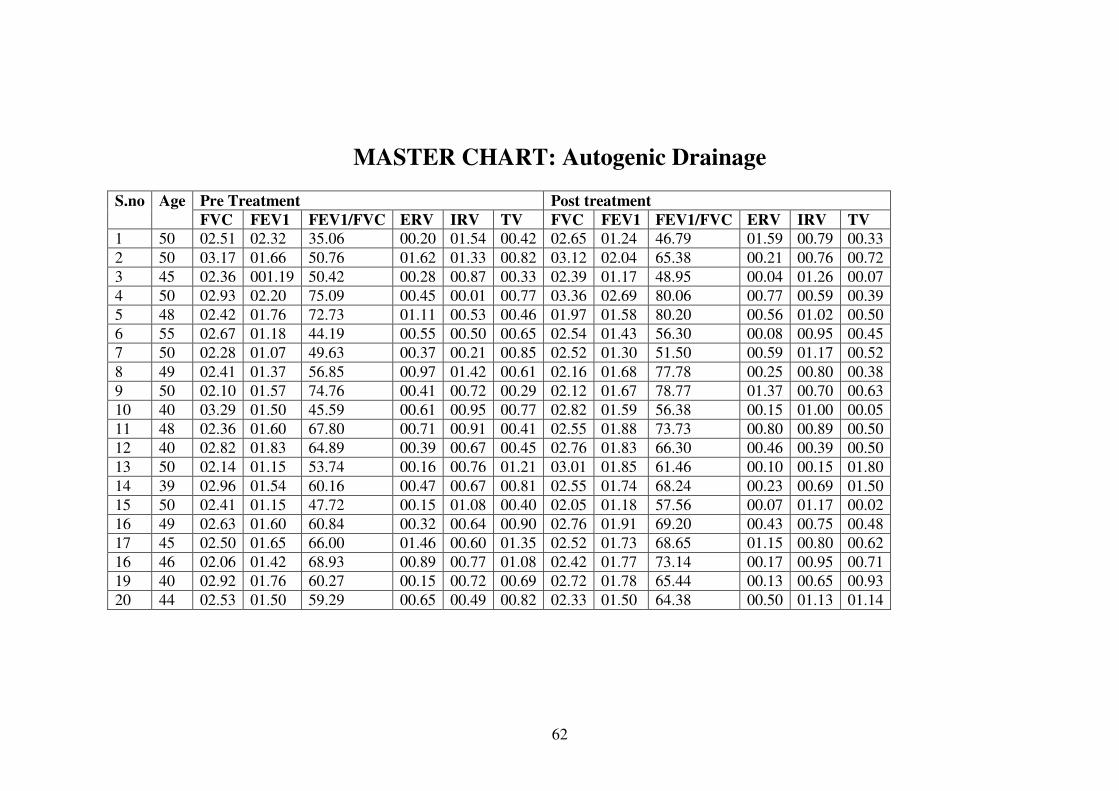
participate in the study. Participants in group ‘A’ received Autogenic
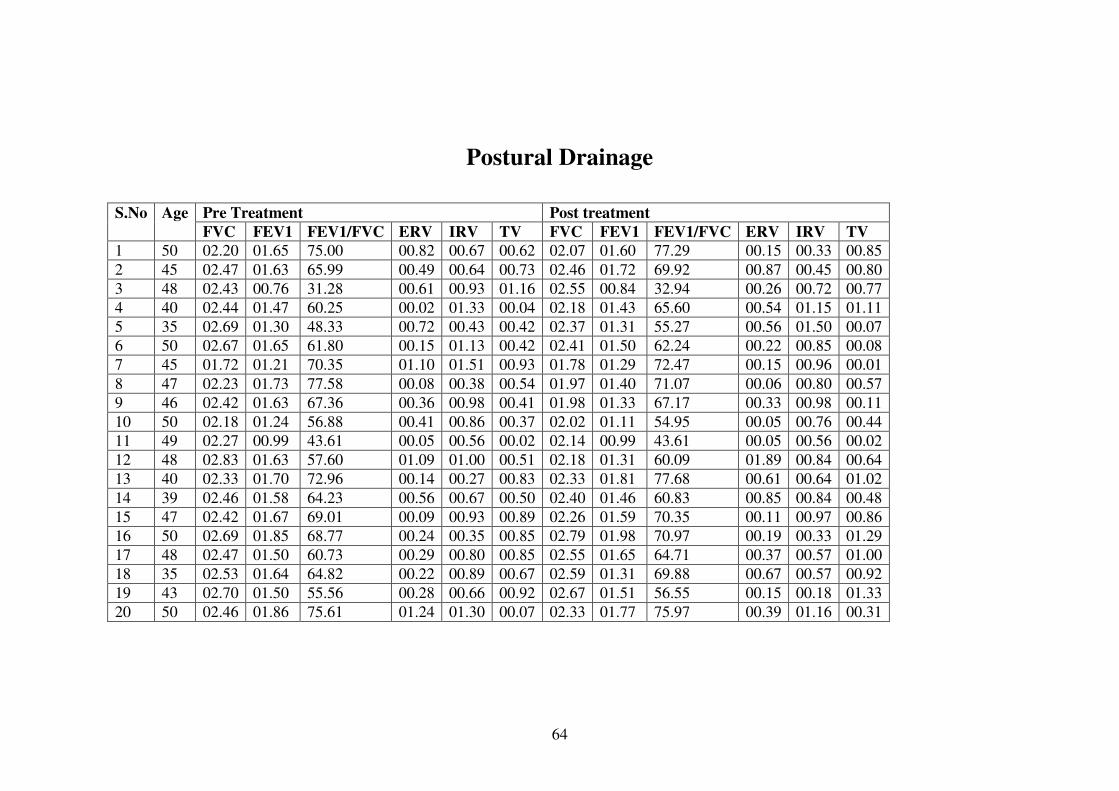
Drainage and participants in Group ‘B’ received Postural Drainage by
the same investigator twice a day for 10 days continuously.