39
2010 Annual Report A successful foundation for future growth Global Satellite Solutions For personal use only

2010 Annual Report
A successful foundation
for future growth
Global Satellite Solutions
For
per
sona
l use
onl
y

With the successful acquisition of the world-class teleports in Adelaide and Perth from SES Worldskies in 2005, NewSat positioned itself as a pure play satellite communications group and has since established a reputation as the partner of choice for governments, corporations and private enterprises.
NewSat provides its customers with access to an increasingly large and diverse range of
satellites and has developed a world-renowned reputation for providing a full range of managed satellite communication services including remote site video, voice and data from
its teleports in Perth and Adelaide. Today, NewSat has the ability to reach 75% of the
globe including: Australia, Asia, the Middle East, Africa, across the Indian Ocean extending into
Europe and across the Pacific Ocean, reaching into the west coast of the USA.
The company’s vision is to provide multiple solutions on multiple satellites across multiple platforms, enabling NewSat to provide cost-effective, timely and efficient satellite communications tailored to meet its customers’ requirements.
The company is currently working on the Jabiru Satellite Program. This has been set up to fund, design, build, launch and operate a next generation geostationary Ka-band and Ku-band satellite, Jabiru-1. Jabiru-1 will be the first independently Australian owned satellite.
NewSat is exceptionally placed for the future, with a strong pipeline of organic growth and a highly attractive Jabiru Satellite Program to deliver vertical integration opportunities and spectacular earnings growth.
NewSat is owned by over 6,500 shareholders and has evolved to become Australia’s largest specialist provider of satellite capacity delivering voice, data and video communications via satellite.
NewSat Limited 2010 Annual Report 1Global Satellite Solutions
For
per
sona
l use
onl
y

ABN 12 003 237 303
Directors
Richard Green (Non-Executive Chairman, Appointed 27 August 2009)Elwood Ellison (Non-Executive Deputy Chairman)Adrian Ballintine (Chief Executive Officer)Andrew Plympton (Non-Executive Director, Appointed 18 February 2010)Mark Fishwick (Non-Executive Director, Appointed 18 February 2010)John Walker (Non-Executive Director, Resigned 4 December 2009)
Company Secretary
Adam Shapiro
Principal and Registered office
Level 4, 6 Riverside Quay Southbank Victoria 3006 Australia
Telephone: + 613 9674 4644 Facsimile: + 613 9674 4655 Website: www.newsat.com E-mail: [email protected]
Chairman’s Statement
I am pleased to report NewSat’s financial results for the year ending 30 June 2010. NewSat delivered its maiden EBITDA and NPAT during the year. Despite the difficult global economic and financial environment, the company’s business model has proved resilient. Importantly, the company has made significant progress during the year in its continued evolution. The Board of Directors believe that this, together with major strategic and operational initiatives undertaken in the business, have created a platform for improved profitability in 2011 and beyond.
During the year, the management of your company has made significant progress in transforming NewSat into a leading pure play satellite communications group. In addition, the Jabiru Satellite Program has made major progress with a variety of stakeholders including manufacturers, launchers, financiers and other parties and I look forward to updating you on its progress in the near term. This satellite program forms a key part of the group’s longer term strategy to deliver resilient, long term growth. When vertically integrated with the existing Newsat business, the Jabiru Satellite Program offers an opportunity for a step-change in the group’s profitability and cash flows.
During the year our markets have continued to grow strongly with continued demand from the resources industry and governments. Major Australian and South East Asian oil and gas and mining groups have increased activity while governments continue to increase demand for satellite communications for both civil and defence/
military purposes. The outlook across all these markets is strong and our continued focus on high value customers in high growth markets, together with efficient and reliable service, continues to stand the company in good stead.
Mr John Walker stepped down from the Board as Chairman, after eight years. I would like to thank him for his contribution to the company during this time. The remaining Directors subsequently took the view that it was an appropriate time to refresh the Board composition and during the year welcomed the appointment of new Directors, Andrew Plympton and Mark Fishwick. Your Board now comprises four non-executive directors and the Chief Executive Officer with a wealth of relevant experience.
In conclusion, I would like to thank Directors and staff for their support during my first year both on the Board and as Chairman. I’d also like to thank our loyal shareholders for your continued support. I have greatly enjoyed meeting you since I became Chairman and look forward to meeting more of you during the year ahead and updating you on NewSat’s progress in the near future.
Richard Green Chairman 30 September 2010
Contents to Financial ReportCorporate Information 2Chairman’s Statement 3Chief Executive Officer’s Report 4Directors’ Report 10Corporate Governance Statement 25Consolidated Statement of Comprehensive Income 29Consolidated Balance Sheet 30Consolidated Cash Flow Statement 31Consolidated Statement of Changes in Equity 32Notes to the Consolidated Financial Statements 33
1 Corporate Information 332 Basis of Preparation and Accounting Policies 333 Parent Entity Information 444 Financial Risk Management 445 Operating Segments 467 Income Tax 508 Earnings Per Share 519 Cash and Cash Equivalents 5210 Trade and other Receivables 5311 Inventories 5412 Other Financial Assets 5413 Property, Plant and Equipment 5414 Intangible Assets and Goodwill 5615 Impairment Testing of Goodwill and Intangibles
with Indefinite Lives 5716 Share-based Payment Plans 5717 Trade and other payables 5818 Deferred income 5919 Loans, borrowings and government grants 5920 Provisions 5921 Contributed Equity 6022 Financial Instruments 6123 Commitments 6224 Contingencies 6226 Auditors’ Remuneration 6327 Key Management Personnel 64
Independent Audit Report to the members of NewSat Limited 69
Corporate Information
Share RegisterComputershare Investor Services Pty LtdYarra Falls 452 Johnston Street Abbotsford Victoria 3067 Australia
SolicitorsNorton Rose RACV Tower, 485 Bourke Street Melbourne Victoria 3000 Australia
Financial AdvisorsLazard Level 44, 1 Macquarie Place Sydney NSW 2000 Australia
BankersNational Australia Bank Limited 330 Collins Street Melbourne Victoria 3000 Australia
AuditorsErnst & Young 8 Exhibition Street Melbourne Victoria 3000 Australia
2 NewSat Limited 2010 Annual Report NewSat Limited 2010 Annual Report 3Index
For
per
sona
l use
onl
y

Chief Executive Officer’s Report
NewSat’s Service OfferingAdvanced ProductsNewSat keeps customers connected, regardless of how remote or temporary their site, through the latest satellite technology. Our extensive range of innovative VSAT services, world recognised teleport facilities and global satellite network, provides customers with coverage to 75% of the world. With fast, end-to-end connectivity, NewSat’s products ensure significant business advantage and return on investment.
World-Class SolutionsNewSat’s world-class solutions ensure customers are always connected, providing secure and reliable, connectivity to remote and temporary sites, where conventional communication technologies can’t. We have the capabilities to offer multiple solutions, satellites and platforms best suited and tailored to every customer’s individual requirements. NewSat has the experience to engineer the most efficient and cost-effective solution, to provide customers with the best possible conditions to maximise productivity.
Industry Leading SupportNewSat provides every customer with easy access to technical support 24 hours a day, 7 days a week, 365 days a year. Our managed Network Operations Centre and national network of technicians, installers and account managers ensures customer questions are always answered and their link is always on. With this high level of constant support, NewSat is able to protect the customer’s business, reduce the risks and implications of any significant down-time and maximise security.
Growth Drivers and Industry TrendsWhile the GFC and subsequent downturn created a challenging period for some communication providers, NewSat’s relentless focus on high value, resilient markets coupled with its focus on its customers and industry leading expertise became major points of differentiation. NewSat’s services were therefore in high demand and the business was virtually unaffected by the GFC. During the course of FY10, we signed a number of new contracts with worldwide system integrators, major oil and gas and mining corporations and large government departments involved in defence and national security.
As shown by these results, NewSat has had a strong FY10. We have delivered our maiden EBITDA and NPAT to the market as we promised and now have a profitable, stable and robust core business, capable of delivering significant future growth. Crucially, we have not been impacted by the post-GFC downturn, demonstrating the resilience of our business model. This year has therefore marked a crucial step in our journey to transform NewSat into a leading pure play satellite communications group. NewSat has now entered a growth phase and is now ready for the next stage of our journey. We have an annuity revenue model based on growing monthly profits and fixed cost leverage and an exciting Jabiru Satellite Program which is moving forward. These are real strengths as we look to grow the NewSat business and I look forward to reporting our progress in FY11 and beyond to you.
Since acquiring two teleport facilities in 2005, NewSat has worked to transform its business, using our teleports as the centre of space and satellite communications in Australia. Over the past two years we have:
►Assembled a first rate, experienced and results-oriented senior management team that is wholly committed to the success of NewSat. ►Developed our teleport business with a business model based on monthly recurring revenues. These monthly recurring revenues have now reached a break-even point so that the core business is now profitable. ►Established a significant reputation for service delivery. Our Perth and Adelaide teleports continue to be amongst the best in the industry with a 99.99995% average service uptime for our customers. ►Continued to leverage our customer base to win new contracts with new and existing customers.
►Begun work on, and made significant progress with, our Jabiru Satellite Program to provide sustainable future growth for NewSat, both within Australia and internationally.
NewSat is now ready to deliver growth, profits, and innovation to its shareholders from this strong and profitable platform. Given the significant transformation underway in the NewSat business, I wanted to take this opportunity to provide some additional information on, and insight into, our business, our achievements and the outlook for the future in this annual report. In doing so, I hope you will gain a better understanding not just of where we are today, but more importantly of the future growth prospects of NewSat.
NewSat’s Customers NewSat customers are global enterprises and government organisations. They are diverse in industry, market, geography and requirements. They include system integrators, communication providers and end users located across the Indian and Pacific Oceans, Asia, Europe, the Middle East, Africa and the United States of America. NewSat works in partnership with its customers to deliver the innovative, reliable and cost-effective solutions they require.
“What keeps me saying yes to NewSat is because in addition to the fact that they continue to provide me with sound value propositions, they meet my three critical requirements for a brilliant partnership: Creative Solutions, Teamwork and Price”
Marc LeGare, CEO Proactive Communications, Inc.
4 NewSat Limited 2010 Annual Report NewSat Limited 2010 Annual Report 5
For
per
sona
l use
onl
y

Monthly Recurring Revenue Growth*
1,300
1,400
1,500
1,600
1,700
1,800
1,900
2,000
2,100
Jun 10Mar 10Dec 09Sep 09Jun 09Mar 09Dec 09
A$000s
* The chart above shows rolling six month average monthly recurring revenue charge (MRC).
We continue to grow our month-on-month sales through both new customer acquisition and organic growth amongst our existing customers. As part of this we continue to set ambitious monthly sales targets and customer acquisition metrics. We review these targets annually, quarterly and monthly. Our Sales and Marketing teams remain focused on these metrics and work tirelessly to grow our business.
The management of all business costs remains an area of significant focus. Business operational and capital expenditure costs have not increased proportionately with revenue increases and are reviewed annually, quarterly and monthly by the Board. We continue to use a disciplined formula of calculating return on investment for every cost line in our business. I will continue to work closely with our CFO and department heads to fine-tune our cost-scaling and to ensure our business is running efficiently in all areas.
A number of industry trends are very favourable and NewSat has benefited from being strongly aligned to these trends and capable of delivering the services required:• Continuous demand from System Integrators,
Telecommunications Providers and Internet Service Providers (ISPs) to on-sell our services;
• Growth in on-demand minimal capex VSAT solutions;• Increased bandwidth requirements due to demand for
faster speeds and larger content sizes;• Increasing number of businesses relying on real-time
communications for critical purposes;• Shift towards to integration of communication systems and
solutions that offer total coverage; and• Ability to access and service domestic and international
customers and markets.
NewSat continues to evolve and innovate, taking advantage of our world-class infrastructure and industry know-how to constantly drive and deliver better outcomes for our customers.
Key Operational and Strategic InitiativesThroughout 2010 NewSat continued to innovate and be at the forefront of technology, enabling it to provide best-in-market satellite communication solutions to partners, corporations and government. In addition to further enhancing our world-class service offering, we grew our existing target markets of oil and gas, mining and defence and actively grew new business in new regions and industries. Along with these customer acquisition initiatives, we achieved a very low level of churn from our existing customers due to our quality product and service offering and our ability to continuously exceed customer expectations.
Strong Financial Highlights
Total Revenue By 26% or $5.1 million to $25 million
Gross Profit By 25% or $2.4 million to $11.8 million reflecting higher revenue and continued strong margins
EBITDA By $2.6 million reflecting both gross margin improvements and business cost reductions
Monthly recurring revenue charge (MRC)
By 27% to $2.13 million per month reflecting both strong new customer growth and retention
Annualised contracted annuity revenue
To $25.6 million
Annual average revenue per contract
By 115% to $43k per contract reflecting higher value contracts and higher grade customers
Total New Contract Value
By 25% or $15.9 million in total new contract value reflecting market penetration
Operating Cashflow
By 7038% or $2.2 million reflecting all of the above and structured cash management
Chief Executive Officer’s Report (Continued)
6 NewSat Limited 2010 Annual Report NewSat Limited 2010 Annual Report 7
For
per
sona
l use
onl
y

Chief Executive Officer’s Report (Continued)
Community ActivitiesIn 2010 NewSat was involved in and supported a range of community initiatives and activities. Our community participation reached further than just commercial sponsorship activities. During the year we supported not for profit organisations here in Australia and in our neighbouring countries. In East Timor we supported rural education through ‘Walk to School Day’, which supported the neediest students’ education costs for a year. This initiative assisted students to become teachers, supplied basic educational resources and installed bore water. Here in Australia we assisted the stepUP Foundation, to educate and excite teenagers about the possibilities for their future in business and in life, by bringing high profile, inspirational business, sporting and other leaders and teens together. In addition, our past Western Australian government initiative to connect the remote Kimberley region with satellite broadband continues to enrich and enhance lives. Our ongoing community support and contributions to local economies demonstrates our corporate values and our passion to be a responsible and good corporate citizen.
Outlook and StrategyOver the past two financial years, the NewSat management team and Board has set and achieved ambitious targets in a difficult economic period. We have a core satellite business that is now profitable, stable and resilient and is a strong platform from which to deliver significant future growth. We also have our Jabiru Satellite Program where we are making significant progress. Together, these are the backbone of our long term plan to grow the business.
2010 signified a new era of a profitable financial result for NewSat. In addition to our maiden EBITDA and NPAT, our report from our auditors, Ernst & Young is a ‘clean’ Unqualified Report which represents a significant milestone in our transformation of the company.
In closing, I would like to acknowledge the continued hard work, leadership and contributions of the NewSat Board of Directors, management and staff. Teamwork and simple, focused principles are at the centre of NewSat’s culture and I am grateful to all involved for their commitment to this. The teamwork demonstrated by NewSat is apparent to all our customers, business partners and staff. This teamwork will continue to be a pivotal element of company success in the future.
Adrian Ballintine
Chief Executive Officer 30 September 2010
MarketingWith our world-class infrastructure and extensive industry experience, we are able to provide our customers with state-of-the-art and highly differentiated service offerings. This is particularly important in today’s competitive business environment where real-time communications, anywhere anytime, are critical to business success. Understanding our customers’ unique requirements is the key, and has enabled our customers to be more productive and therefore service their customers more effectively.
We are now actively targeting the next stage of growth in our core business by launching highly focused and integrated acquisition campaigns into new markets, industries and regions. In addition, sophisticated marketing automation is assisting us to understand and better service prospects, engaging them throughout the buying cycle. Our highly integrated and customer focused approach to marketing allows us to stay in front of our competitors and actively acquire new customers, whilst better servicing our existing ones.
Jabiru Satellite ProgramNewSat is currently working on its plan to launch the first independently owned Australian satellite. This is intended to be the first in a fleet of geo-stationary satellites providing capacity into high value markets globally. For the existing NewSat business, satellites represent a major vertical integration initiative allowing NewSat to source capacity directly from owned and operated satellites, instead of purchasing from third party satellite owners and operators.
The company’s long-term goals continue to be focused on the launch of the Jabiru Satellite Program and Australia’s first commercial satellite. The business model has been created for both Jabiru-1 and a second satellite, Jabiru-2. We have engaged partners from all over the world in this ambitious program and aim to transform NewSat into a truly global satellite operator.
Significant progress has been made over the course of FY10 on the Jabiru Satellite Program with regard to customers, financiers and other stakeholders and we look forward to updating the market in due course.
8 NewSat Limited 2010 Annual Report NewSat Limited 2010 Annual Report 9
For
per
sona
l use
onl
y

Directors’ Report
Andrew Plympton(Non-Executive Director)
Andrew Plympton was appointed director on 18 February 2010. An active entrepreneur with extensive experience in the financial services sectors, sports administration and listed companies, including CEO of two global insurance broking firms and successful long term President of the St Kilda Football Club. Currently Andrew is an Executive Member and Director of the Australian Olympic Committee, President of Yachting Australia Inc., and is a non-executive Chairman of 4 other Boards (2 ASX listed companies).
During the past three years Mr Plympton has also served as Director of the following other listed companies:►► Beyond Sportswear International Limited – Appointed March 2005;
►► The Swish Group – Appointed February 2010; and
►► Intermoco Limited – Appointed April 2010.
Mark Fishwick(Non-Executive Director)
Mark Fishwick was appointed director on 18 February 2010. An out-of-home (‘OOH’) media veteran with 30 years global experience founding many well known brand names including: Nettlefold/NLD/Boyd (now Eye Corp), Cody (now APNO) and Claude Group. Currently Mark is the group managing director of Ambient Advertising, Chairman of Blue Media Group, Captive Vision Network and Plasma-OOH Indonesia.
John Walker(Non-Executive Director) Resigned 4 December 2009
John Walker was appointed Chairman of the Group on 23 May 2001. He was previously the Managing Director of Thrifty Car Rental as well as councillor on Woollahra Council, NSW. John stepped down from his position as Chairman and as a Director of the Group on 4 December 2009.
During the past three years Mr Walker has also served as Director of the following other listed company:►► Planet Power Energy Ltd – Appointed April 2009.
Richard Green(Non-Executive Chairman)
Richard Green was appointed Chairman of the Group on 27 August 2009. He has spent over 40 years in stock broking corporate finance, specialising in small to medium enterprises handling listings, mergers and acquisitions.
During the past three years Mr Green has also served as Director of the following other listed companies:►► VentureAxess – Appointed 21 April 2008;
►► Dromana Estates – Appointed 18 October 1999; Resigned 1 September 2008;
►► Authorised Investment Fund – Appointed 11 March 1998; Resigned 2 September 2008; and
►► Queensland Trustees & Investment Limited – Appointed 10 April 1996.
Elwood Ellison(Non-Executive Deputy Chairman)
Elwood Ellison was appointed director on 14 June 2002 and brings over 30 years of experience in sales and marketing in high technology companies including Microsoft, Ashton-Tate, Gupta Technologies Inc. and Asymetrix. At Ashton-Tate, he was responsible for the sales strategies that resulted in revenue growing from less than US$20m to over US$300m in four years. At Microsoft he pioneered the Government business division and is highly regarded throughout the USA for his ability to drive start-ups to NASDAQ.
Adrian Ballintine(Founder and Chief Executive Officer)
Adrian Ballintine founded NewSat Limited in 1988, originally as Pan Pacific Solutions. He has over 30 years of global technology experience with extensive knowledge of the satellite industry. Mr Ballintine successfully managed a number of technology start-ups in the period prior to the company’s 1999 ASX listing.
DirectorsThe names and details of the company’s directors in office during the financial year and until the date of this report are as follows. Directors were in office for this entire period unless otherwise stated.
10 NewSat Limited 2010 Annual Report NewSat Limited 2010 Annual Report 11
For
per
sona
l use
onl
y

Directors’ Report (Continued)
Executive Management Team
Merv Kuek Vice President Marketing
Merv Kuek has over a decade of marketing experience that includes working for telecommunications companies Telstra and more recently Crazy John’s (a subsidiary of Vodafone Hutchison Australia). His extensive telecommunications experience also extends to sales, products, operations and P&L accountability, giving Merv a unique understanding of the industry. Merv has a proven track record across the entire marketing mix including strategy development and execution, product design, pricing, communications and end-to-end campaign management.
Merv holds a Bachelor of Engineering Hons and Bachelor of Commerce from the University of Melbourne. He joined NewSat in July 2010 and with his results-driven marketing approach has quickly developed a dedicated marketing function to drive brand awareness, customer acquisition and future business growth.
Len McGoldrickVice President Engineering and Operations
Len McGoldrick has a 35 year work history in Scotland and Australia, specialising in satellite communications for 25 years of that period. During his career, Len has worked for British Telecom International (BTI), AAPT Sat-Tel and Newskies in various project management positions commissioning satellite networks and supporting multiple special earth station projects throughout Europe and the Middle East over two decades.
Len was appointed as VP of Engineering and Operations in July 2008 and has been integral to the growth in business and high levels of customer satisfaction in both the Perth and Adelaide teleports.
Mike KenneallyChief Operating Officer – Jabiru
Mike Kenneally has over 30 years global ICT and satellite experience, including managing large national and international ICT and satellite projects in several countries. During his career, Mike has worked or acted as a consultant for the Department of Defence, IBM, the California Highway Patrol, Los Angeles County, General Electric, Fujitsu Europe, Telstar, Lockheed Martin, Telstra, Optus and Telecom NZ. Mike was technical auditor for the first spatial census of Australia in 1996 and solution architect for the winning bid for the Australian defence spatial system. Mike was also the founding Director of Australian Private Networks in 2001.
Mike joined NewSat in 2006, fulfilling senior roles in sales, product development and business development and has been an instrumental member in helping NewSat build its business model the last few years.
Adam Shapiro Chief Financial Officer and Company Secretary
Adam Shapiro has a background in finance spanning over a decade that includes working for professional service firms PriceWaterhouseCoopers LLP in Boston, USA and Ernst & Young in Melbourne, Australia.
Joining NewSat in May 2007, Adam has instilled new financial practices and disciplines into the business and worked closely with the CEO, Board and the executive management team in fine tuning the Company’s business model, the key business performance metrics, forecasting and the long term business plan.
Adam was appointed Company Secretary on 7 May 2007. He holds a Bachelor in Business Administration from the University of Miami (Florida) and has been a member of the American Institute of Certified Public Accountants for the past 12 years.
Andrew Matlock Vice President Sales
Andrew Matlock has a 25 year work history which includes Regional Manager for Calcomp Inc, (a division of Lockheed Martin), VP Sales for Double Impact and co-founding successful start-up ventures in both the United States of America and in Australia.
Andrew joined NewSat in 2007 and in June 2008 Andrew took over the position of Vice President Sales and Marketing. Since assuming the position, Andrew has utilised his diverse experiences and strong interpersonal skills to effectively manage the sales team whilst incorporating a new targeted and aggressive lead generation platform into the company. Andrew holds a Bachelor of Applied Science majoring in computer science and mathematics from Swinburne University.
12 NewSat Limited 2010 Annual Report NewSat Limited 2010 Annual Report 13
For
per
sona
l use
onl
y
Directors’ Report (Continued)
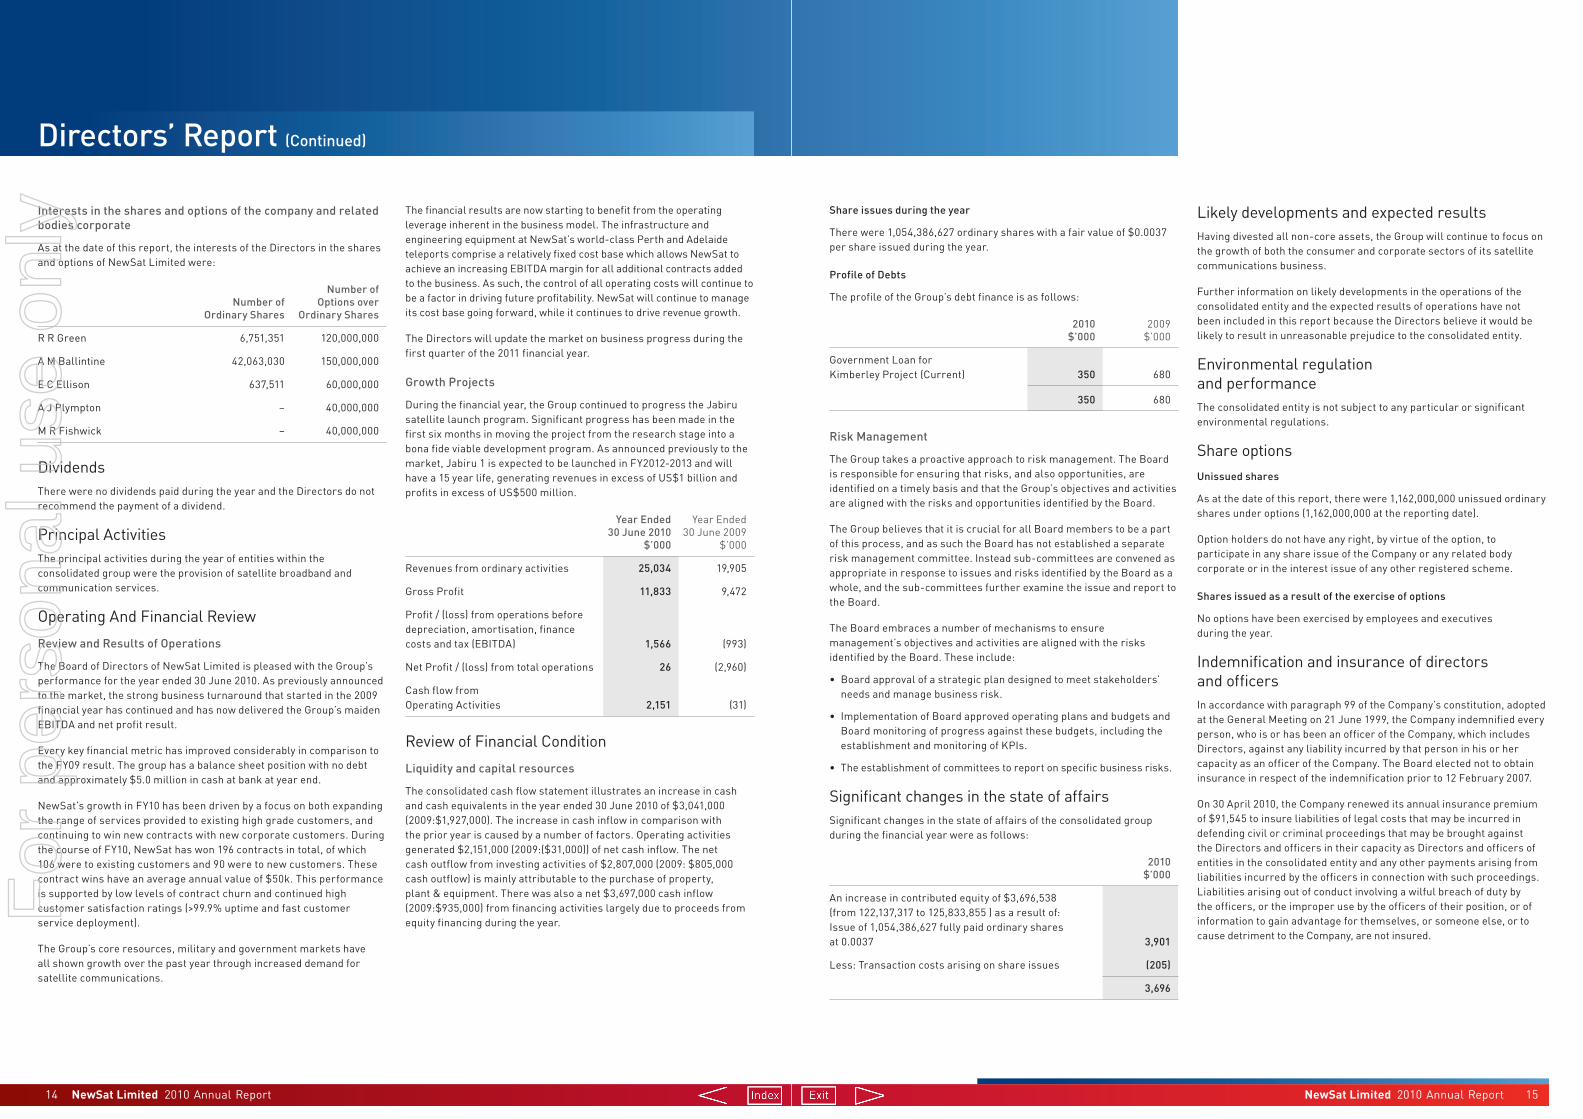
Share issues during the year
There were 1,054,386,627 ordinary shares with a fair value of $0.0037 per share issued during the year.
Profile of Debts
The profile of the Group’s debt finance is as follows:
2010 $’000
2009 $’000
Government Loan for Kimberley Project (Current) 350 680
350 680
Risk Management
The Group takes a proactive approach to risk management. The Board is responsible for ensuring that risks, and also opportunities, are identified on a timely basis and that the Group’s objectives and activities are aligned with the risks and opportunities identified by the Board.
The Group believes that it is crucial for all Board members to be a part of this process, and as such the Board has not established a separate risk management committee. Instead sub-committees are convened as appropriate in response to issues and risks identified by the Board as a whole, and the sub-committees further examine the issue and report to the Board.
The Board embraces a number of mechanisms to ensure management’s objectives and activities are aligned with the risks identified by the Board. These include:
• Board approval of a strategic plan designed to meet stakeholders’ needs and manage business risk.
• Implementation of Board approved operating plans and budgets and Board monitoring of progress against these budgets, including the establishment and monitoring of KPIs.
• The establishment of committees to report on specific business risks.
Significant changes in the state of affairsSignificant changes in the state of affairs of the consolidated group during the financial year were as follows:
2010 $’000
An increase in contributed equity of $3,696,538 (from 122,137,317 to 125,833,855 ) as a result of: Issue of 1,054,386,627 fully paid ordinary shares at 0.0037 3,901
Less: Transaction costs arising on share issues (205)
3,696
Likely developments and expected resultsHaving divested all non-core assets, the Group will continue to focus on the growth of both the consumer and corporate sectors of its satellite communications business.
Further information on likely developments in the operations of the consolidated entity and the expected results of operations have not been included in this report because the Directors believe it would be likely to result in unreasonable prejudice to the consolidated entity.
Environmental regulation and performanceThe consolidated entity is not subject to any particular or significant environmental regulations.
Share optionsUnissued shares
As at the date of this report, there were 1,162,000,000 unissued ordinary shares under options (1,162,000,000 at the reporting date).
Option holders do not have any right, by virtue of the option, to participate in any share issue of the Company or any related body corporate or in the interest issue of any other registered scheme.
Shares issued as a result of the exercise of options
No options have been exercised by employees and executives during the year.
Indemnification and insurance of directors and officersIn accordance with paragraph 99 of the Company’s constitution, adopted at the General Meeting on 21 June 1999, the Company indemnified every person, who is or has been an officer of the Company, which includes Directors, against any liability incurred by that person in his or her capacity as an officer of the Company. The Board elected not to obtain insurance in respect of the indemnification prior to 12 February 2007.
On 30 April 2010, the Company renewed its annual insurance premium of $91,545 to insure liabilities of legal costs that may be incurred in defending civil or criminal proceedings that may be brought against the Directors and officers in their capacity as Directors and officers of entities in the consolidated entity and any other payments arising from liabilities incurred by the officers in connection with such proceedings. Liabilities arising out of conduct involving a wilful breach of duty by the officers, or the improper use by the officers of their position, or of information to gain advantage for themselves, or someone else, or to cause detriment to the Company, are not insured.
Interests in the shares and options of the company and related bodies corporate
As at the date of this report, the interests of the Directors in the shares and options of NewSat Limited were:
Number of Ordinary Shares
Number of Options over
Ordinary Shares
R R Green 6,751,351 120,000,000
A M Ballintine 42,063,030 150,000,000
E C Ellison 637,511 60,000,000
A J Plympton – 40,000,000
M R Fishwick – 40,000,000
DividendsThere were no dividends paid during the year and the Directors do not recommend the payment of a dividend.
Principal ActivitiesThe principal activities during the year of entities within the consolidated group were the provision of satellite broadband and communication services.
Operating And Financial ReviewReview and Results of Operations
The Board of Directors of NewSat Limited is pleased with the Group’s performance for the year ended 30 June 2010. As previously announced to the market, the strong business turnaround that started in the 2009 financial year has continued and has now delivered the Group’s maiden EBITDA and net profit result.
Every key financial metric has improved considerably in comparison to the FY09 result. The group has a balance sheet position with no debt and approximately $5.0 million in cash at bank at year end.
NewSat’s growth in FY10 has been driven by a focus on both expanding the range of services provided to existing high grade customers, and continuing to win new contracts with new corporate customers. During the course of FY10, NewSat has won 196 contracts in total, of which 106 were to existing customers and 90 were to new customers. These contract wins have an average annual value of $50k. This performance is supported by low levels of contract churn and continued high customer satisfaction ratings (>99.9% uptime and fast customer service deployment).
The Group’s core resources, military and government markets have all shown growth over the past year through increased demand for satellite communications.
The financial results are now starting to benefit from the operating leverage inherent in the business model. The infrastructure and engineering equipment at NewSat’s world-class Perth and Adelaide teleports comprise a relatively fixed cost base which allows NewSat to achieve an increasing EBITDA margin for all additional contracts added to the business. As such, the control of all operating costs will continue to be a factor in driving future profitability. NewSat will continue to manage its cost base going forward, while it continues to drive revenue growth.
The Directors will update the market on business progress during the first quarter of the 2011 financial year.
Growth Projects
During the financial year, the Group continued to progress the Jabiru satellite launch program. Significant progress has been made in the first six months in moving the project from the research stage into a bona fide viable development program. As announced previously to the market, Jabiru 1 is expected to be launched in FY2012-2013 and will have a 15 year life, generating revenues in excess of US$1 billion and profits in excess of US$500 million.
Year Ended 30 June 2010
$’000
Year Ended 30 June 2009
$’000
Revenues from ordinary activities 25,034 19,905
Gross Profit 11,833 9,472
Profit / (loss) from operations before depreciation, amortisation, finance costs and tax (EBITDA) 1,566 (993)
Net Profit / (loss) from total operations 26 (2,960)
Cash flow from Operating Activities 2,151 (31)
Review of Financial ConditionLiquidity and capital resources
The consolidated cash flow statement illustrates an increase in cash and cash equivalents in the year ended 30 June 2010 of $3,041,000 (2009:$1,927,000). The increase in cash inflow in comparison with the prior year is caused by a number of factors. Operating activities generated $2,151,000 (2009:($31,000)) of net cash inflow. The net cash outflow from investing activities of $2,807,000 (2009: $805,000 cash outflow) is mainly attributable to the purchase of property, plant & equipment. There was also a net $3,697,000 cash inflow (2009:$935,000) from financing activities largely due to proceeds from equity financing during the year.
14 NewSat Limited 2010 Annual Report NewSat Limited 2010 Annual Report 15
For
per
sona
l use
onl
y

Directors’ Report (Continued)
Directors’ meetingsThe number of meetings of directors (including meetings of committees of directors) held during the year and the number of meetings attended by each director were as follows:
Meetings of CommitteesDirectors Meetings Audit Remuneration Nomination
Number of meetings held: 13 2 3 1
Number of meetings attended
R R Green 11 1 2 1
J H Walker 6 1 1 –
A M Ballintine 13 – 3 1
E C Ellison 11 – 3 –
A J Plympton 4 – – –
M R Fishwick 4 – – –
Committee membership
As at the date of this report, the company had an Audit Committee, a Remuneration Committee and a Nomination Committee of the Board of Directors. Members acting on the committees of the Board during the year were:
Audit Remuneration Nomination
R R Green R R Green R R Green
A J Plympton (c) A M Ballintine A M Ballintine
J H Walker* E C Ellison (c) M R Fishwick (c)
J H Walker* J H Walker*
Notes(c) Designatesthechairmanofthecommittee.* JohnWalkerresignedasaDirectorandChairmanofthecommittee
effective4December2009.
RoundingThe amounts contained in this report and in the financial report have been rounded to the nearest $1,000 (where rounding is applicable) under the option available to the company under ASIC Class Order 98/0100. The company is an entity to which the Class Order applies.
Auditor’s Independence DeclarationThe Directors have received the Auditor’s Independence Declaration from Ernst & Young (page 24) and it is deemed to be part of this Directors’ Report.
Corporate GovernanceIn recognising the need for the highest standards of corporate behaviour and accountability, the Directors of NewSat Limited support and have adhered to the principles of corporate governance. The Company’s corporate governance statement is contained on page 25 to 28 of this annual report.
Remuneration Report (Audited)This report outlines the remuneration arrangements in place for directors and executives of NewSat Limited (the company). This report also provides the audited disclosure required by Corporation Regulations 2.M.6.04.
Remuneration philosophy
The performance of the Company depends upon the quality of its directors and executives. To prosper, the Company must attract, motivate and retain highly skilled Directors and executives.
To this end, the company embodies the following principles in its remuneration framework:
• Provide competitive rewards to attract high calibre executives;
• Link executive rewards to shareholder value;
• Have a portion of executive remuneration ‘at risk’, dependent upon meeting pre-determined performance benchmarks; and
• Establish appropriate, demanding performance hurdles for variable executive remuneration.
Remuneration committee
The Remuneration Committee of the Board of Directors of the company is responsible for determining and reviewing compensation arrangements for the Directors, the Chief Executive Officer (CEO) and the senior management team.
The Remuneration Committee assesses the appropriateness of the nature and amount of remuneration of Directors and senior executives on a periodic basis by reference to relevant employment market conditions with the overall objective of ensuring maximum stakeholder benefit from the retention of a high quality Board and executive team.
Remuneration structure
In accordance with best practice corporate governance, the structure of Non-Executive Director and executive remuneration is separate and distinct.
Relationship of rewards to performance
The company’s core business during the past five financial years has been predominantly as a satellite communications service provider. As has been the case in those years, increase in shareholder wealth will for the foreseeable future be dependent on the improvement in the
company’s earnings and share price. Accordingly variable remuneration and long term incentives presently consist of options over unissued shares in the company.
2006 2007 2008 2009 2010
Earnings / (loss) per share (cents per share) (0.420) (0.210) (0.160) (0.047) 0.004
Non-Executive Director remuneration
Objective
The Board seeks to set aggregate remuneration at a level that provides the company with the ability to attract and retain directors of the highest calibre, whilst incurring a cost that is acceptable to shareholders.
Structure
The Constitution and the ASX Listing Rules specify that the aggregate remuneration of Non-Executive Directors shall be determined from time to time by a general meeting. An amount not exceeding the amount determined is then divided between the directors as agreed. The latest determination was at the Annual General Meeting held on 16 November 2007 when shareholders approved an aggregate cash and superannuation remuneration of $400,000 per year. Additionally, all share based payments granted to Directors are approved by shareholders at a general meeting prior to issuance.
The amount of aggregate remuneration sought to be approved by shareholders and the manner in which it is apportioned amongst Directors is reviewed annually. The Board considers advice from external consultants as well as the fees paid to Non-Executive Directors of comparable companies when undertaking the annual review process.
Each Director receives a fee for being a Director of the company. An additional fee is also paid for each Board committee on which a director sits. The payment of additional fees for serving on a committee recognises the additional time commitment required by Directors who serve on one or more sub committees.
Non-Executive Directors are encouraged by the Board to hold shares in the company (purchased by the Director on market). It is considered good governance for Directors to have a stake in the company on whose board they sit undertaken only in accordance with the Company’s code of conduct for trading in the Company’s securities.
The remuneration of Non-Executive Directors for the period ending 30 June 2010 is detailed in Table 1 on page 19 of this report.
Senior Manager and Executive Director remuneration
Objective
The company aims to reward executives with a level and mix of remuneration commensurate with their position and responsibilities within the company and so as to:
• Reward executives for company, business unit and individual performance against targets set by reference to appropriate benchmarks;
• Align the interests of executives with those of shareholders;
• Link rewards with the strategic goals and performance of the company; and
• Ensure total remuneration is competitive by market standards.
Structure
In determining the level and make-up of executive remuneration, the Remuneration Committee engaged an external consultant to provide independent advice both in the form of a written report detailing market levels of remuneration for comparable executive roles and by participating in the meeting from which the Committee makes its recommendations to the Board.
It is the Remuneration Committee’s policy that an employment contract is entered into only with the Chief Executive Officer and Chief Financial Officer and not with any other executives. Details of the contracts are provided on page 18.
Remuneration consists of the following key elements:
• Fixed Remuneration;
• Variable Remuneration;
• Short Term Incentive Plans (STIP); and
• Long Term Incentive Plans (LTIP).
The proportion of fixed remuneration and variable remuneration (potential short term and long term incentives) is established for each senior manager by the Remuneration Committee. Table 1 on page 19 details the fixed and variable components (%) of the key management personnel of the Group.
Fixed remuneration
Objective
Fixed remuneration is reviewed annually by the Remuneration Committee. The process consists of a review of company wide, business unit and individual performance, relevant comparative remuneration in the market and internally and, where appropriate, external advice on policies and practices. As noted above, the Committee has access to external advice independent of management.
Structure
Senior managers are given the opportunity to receive their fixed (primary) remuneration in a variety of forms including cash and fringe benefits such as motor vehicles and expense payment plans. It is intended that the manner of payment chosen will be optimal for the recipient without creating undue cost for the Group.
The fixed remuneration component of the key management personnel of the Group are detailed in Table 1 on page 19.
16 NewSat Limited 2010 Annual Report NewSat Limited 2010 Annual Report 17
For
per
sona
l use
onl
y

Directors’ Report (Continued)
Variable Remuneration – Short Term Incentive Plans (STIP)
Objective
The objective of the STI program is to link the achievement of the Group’s operational targets with the remuneration received by the executives charged with meeting those targets. The total potential STI available is set at a level so as to provide sufficient incentive to the senior manager to achieve the operational targets and such that the cost to the Group is reasonable in the circumstances.
Structure
Actual STIP payments granted to each Senior Manager depend on the extent to which specific Operating Targets set at the beginning of the financial year are met. The Operational Targets consist of a number of Key Performance Indicators (KPIs) covering both financial and non-financial measures of performance. Typically included are measures such as EBITDA against budget, customer service, risk management, product management, and leadership/team contribution. These measures were chosen as they represent the key drivers for short term success of the business and provide a framework for delivering long term value. The Group has predetermined benchmarks that must be met in order to trigger payments under the STI scheme.
On an annual basis, after consideration of performance against KPIs, an overall performance rating for the Group and each individual business unit is approved by the Remuneration Committee. The individual performance of each executive is also rated and all three ratings are taken into account when determining the amount, if any, of the short term incentive pool that is to be allocated to each executive. This process usually occurs within 3 months after the reporting date. Payments made are delivered as a cash bonus in the following reporting period.
Variable Pay – Long Term Incentive Plan (LTIP)
Objective
The objective of the LTIP plan is to reward senior executives in a manner that aligns this element of remuneration with the creation of shareholder wealth.
As such, LTIP grants are only made to executives who are able to influence the generation of Shareholder wealth and thus have a direct impact on the Group’s performance against the relevant long term performance hurdle.
Structure
LTIP grants to executives are delivered in the form of options under the Shareholder approved Staff and Executive Option Plans.
Specific Disclosure
This report covers the key management personnel of the Company and the Group. This includes the Directors of the Company and the three highest paid executives of the Group.
Employment contracts
Remuneration and other employment terms for the CEO and other key management personnel are formalised in a contract of employment. The major remuneration provisions of the contracts are set out below:
Adrian Ballintine – Chief Executive Officer• Term of Agreement – 1 April 2010 to 1 April 2011.
• Contract terms are one year rolling terms after expiration.
• The contract comprising fixed compensation and short and long term incentives may be extended for 1 year by mutual agreement.
• Where termination with cause occurs, only the fixed compensation is payable up to the date of termination.
• Either party may terminate the agreement on 12 months notice provided that the Company can terminate immediately for misconduct.
Adam Shapiro – Chief Financial Officer and Company Secretary• Term of Agreement – 6 May 2009 to 6 May 2011.
• Contract terms are one year rolling terms after expiration.
• Either party may terminate the agreement on 9 months notice provided that the Company can terminate immediately for misconduct.
• No termination payments are applicable.
Michael Kenneally – Chief Operating Officer Jabiru• Term of Agreement – unspecified.
• Either party may terminate the agreement on 2 months notice provided that the Company can terminate immediately for misconduct.
• No termination payments are applicable.
Len McGoldrick – Vice President of Engineering & Operations• Term of Agreement – unspecified.
• Either party may terminate the agreement on 2 months notice provided that the Company can terminate immediately for misconduct.
• No termination payments are applicable.
Andrew Matlock – Vice President of Sales & Marketing• Term of Agreement – unspecified.
• Either party may terminate the agreement on 3 months notice provided that the Company can terminate immediately for misconduct.
• No termination payments are applicable.
Remuneration of key management personnel
Table 1: Remuneration for the year ended 30 June 2010
Short term benefitsPost
employmentLong-term
benefits Share based payments %
Cash Salary and Fees
Short term cash incentive
Non monetary benefits
Superannuation Long service leave
Options# Shares Total Performance related
Non-executive directorsR R Green – Chairman* 67,745 – – – – 14,540 – 82,285 18%
J H Walker** 75,000 – – – – – – 75,000 0%
E C Ellison*** 84,000 – – – – 3,090 – 87,090 4%
M R Fishwick**** 20,833 – – – – 2,168 – 23,001 9%
A J Plympton**** 20,833 – – – – 2,168 – 23,001 9%
Sub-total non-executive directors 268,411 – – – – 21,966 – 290,377
Executive director
A M Ballintine 412,844 150,000 22,918 37,156 8,731 8,263 – 639,912 25%
Other key management personnelA Shapiro – Chief Financial Officer 229,358 40,000 4,800 20,642 3,087 10,986 – 308,873 17%
A Matlock – VP Sales & Marketing 160,550 308,756 4,800 41,887 2,337 8,614 – 526,944 60%
M Kenneally – Chief Operating Officer Jabiru 157,808 30,000 – 14,203 6,223 8,614 – 216,848 18%
L McGoldrick – VP Engineering & Operations 206,421 – 13,850 19,825 13,745 8,614 – 262,455 3%
Sub-total executive KMP 1,166,981 528,756 46,368 133,713 34,123 45,091 – 1,955,032
Totals 1,435,392 528,756 46,368 133,713 34,123 67,057 – 2,245,409
# valueincludesunvestedoptions.* Appointed27August2009** Resigned04December2009*** Inaddition,ECEliisson’sconsultingserviceswereretainedforJabiruSatelliteProjectfortotalamountof$45,461**** Appointed18February2010
Remuneration Report (Audited) (Continued)
18 NewSat Limited 2010 Annual Report NewSat Limited 2010 Annual Report 19
For
per
sona
l use
onl
y

Directors’ Report (Continued)
Remuneration of key management personnel
Table 2: Compensation options: Granted and vested during the year ended 30 June 2010 (Consolidated)
Granted Terms & Conditions for each Grant Vested
No. (‘000) Grant Date
Fair Value per option at
grant date ($) (note16)
Exercise price per
option (cents)(note 16) Expiry Date
First Exercise
DateLast Exercise
Date No (‘000)
DirectorsR R Green* 25,000,000 4/12/09 0.0015 1.0000 3/12/14 4/12/12 3/12/14 –
R R Green 25,000,000 4/12/09 0.0008 2.0000 3/12/14 4/12/12 3/12/14 –
R R Green 30,000,000 14/05/10 0.0010 1.0000 13/05/15 14/05/13 13/05/15 –
R R Green 40,000,000 14/05/10 0.0015 0.0001 13/05/15 14/05/13 13/05/15 –
A M Ballintine 50,000,000 14/05/10 0.0010 1.0000 13/05/15 14/05/13 13/05/15 –
A M Ballintine 100,000,000 14/05/10 0.0015 0.0001 13/05/15 14/05/13 13/05/15 –
E C Ellison 30,000,000 14/05/10 0.0010 1.0000 13/05/15 14/05/13 13/05/15 –
E C Ellison 30,000,000 14/05/10 0.0015 0.0001 13/05/15 14/05/13 13/05/15 –
M R Fishwick** 15,000,000 14/05/10 0.0010 1.0000 13/05/15 14/05/13 13/05/15 –
M R Fishwick 25,000,000 14/05/10 0.0015 0.0001 13/05/15 14/05/13 13/05/15 –
A J Plympton** 15,000,000 14/05/10 0.0010 1.0000 13/05/15 14/05/13 13/05/15 –
A J Plympton 25,000,000 14/05/10 0.0015 0.0001 13/05/15 14/05/13 13/05/15 –
ExecutivesA Shapiro 30,000,000 24/03/10 0.0010 1.0000 23/03/15 14/05/13 23/03/15 –
A Shapiro 65,000,000 24/03/10 0.0015 0.0001 23/03/15 14/05/13 23/03/15 –
A Matlock 25,000,000 24/03/10 0.0010 1.0000 23/03/15 14/05/13 23/03/15 –
A Matlock 50,000,000 24/03/10 0.0015 0.0001 23/03/15 14/05/13 23/03/15 –
M Kenneally 25,000,000 24/03/10 0.0010 1.0000 23/03/15 14/05/13 23/03/15 –
M Kenneally 50,000,000 24/03/10 0.0015 0.0001 23/03/15 14/05/13 23/03/15 –
L McGoldrick 25,000,000 24/03/10 0.0010 1.0000 23/03/15 14/05/13 23/03/15 –
L McGoldrick 50,000,000 24/03/10 0.0015 0.0001 23/03/15 14/05/13 23/03/15 –
Total 730,000,000 –
* Appointed27August2009** Appointed18February2010
The above Options were granted to Directors and Executives to align Director and Executive Remuneration with Company Performance and accretion in Shareholder value. Option were issued in 5 tranches to Directors and Executives. The Directors Options were approved by resolution at a General Meeting of the Shareholders on 4 December 2009 and 13 May 2010. The Executive Options were issued either under approval of the Executive Option Plan of the Company or upon terms imposed by the Directors outside such plan on 24 March 2010.
Remuneration for the year ended 30 June 2009
Short term benefits Post employmentLong-term
benefits Share based payments %
Cash Salary and Fees
Short term cash incentive
Non monetary benefits
Superannuation Long service leave
Options# Shares Total Performance related
Non-executive directorsJ H Walker – Chairman 180,000 – – – – 31,117 – 211,117 15%
E C Ellison 58,500 – – – – 23,280 – 81,780 28%
C M North (Resigned 17 March 2009) 33,333 – – – – 10,657 – 43,990 24%
Sub-total non-executive directors 271,833 – – – – 65,054 – 336,887
Executive director
A M Ballintine 412,844 – 30,509 37,156 7,132 46,560 – 534,201 9%
Other key management personnelA Shapiro – Chief Financial Officer 229,358 – 4,800 20,642 1,981 16,965 – 273,746 6%
A Matlock – VP Sales & Marketing 160,550 199,964 4,800 32,446 1,624 8,178 – 407,562 51%
M Kenneally – VP Planning & Development 138,354 30,000 – 12,452 1,347 – 20,000 202,153 25%
L McGoldrick – VP Engineering & Operations 161,150 – 13,850 15,750 13,889 3,393 – 208,032 2%
Sub-total executive KMP 1,102,256 229,964 53,959 118,446 25,973 75,096 20,000 1,625,694
Totals 1,374,089 229,964 53,959 118,446 25,973 140,150 20,000 1,962,581
# valueincludesunvestedoptions.
Remuneration Report (Audited) (Continued)
20 NewSat Limited 2010 Annual Report NewSat Limited 2010 Annual Report 21
For
per
sona
l use
onl
y

Directors’ Report (Continued)
Non-Audit ServicesNewSat may decide to employ the auditor on assignments additional to their statutory audit duties where the auditor’s expertise and experience with the company and/or the consolidated entity are important.
Details of the amounts paid or payable to the auditor (Ernst & Young) for audit and non-audit services provided during the year are set out in Note 26 of the financial report.
The Board of Directors has considered the position and, in accordance with the advice received from the Audit Committee is satisfied that the provision of the non-audit services is compatible with the general standard of independence for auditors imposed by the Corporations Act 2001. The Directors are satisfied that the provision of non-audit services by the auditor, as set out in Note 26 of the financial report, did not compromise the auditor independence requirements of the Corporations Act 2001 for the following reasons:
– all non-audit services have been reviewed by the Audit Committee to ensure they do not impact the impartiality and objectivity of the auditor; and
– none of the services undermine the general principles relating to auditor independence as set out in Professional Statement F1, including reviewing or auditing the auditor’s own work, acting in a management or a decision-making capacity for the Company, acting as advocate for the Company or jointly sharing economic risk and rewards
Signed in accordance with a resolution of the Directors.
Adrian Ballintine
Director and Chief Executive Officer Melbourne 30 September 2010
Details of the Option Tranches are as follows:
1. Tranche 1 Director Options issued on 4 December 2009 – Options at an exercise price of 1 cent and two cents, vesting in 36 months from the date of issuance. Director must remain a director of the company to exercise options. All options expire 60 months from the date of issuance.
2. Tranche 2 Executive Options issued on 24 March 2010 – Options at an exercise price of 1 cent, vesting in 36 months from the date of issuance. Executive must remain an employee of the company to exercise options. Options expire 60 months from date of issuance.
3. Tranche 3 Executive Options issued on 24 March 2010 – Options at an exercise price of 0.001 of a cent, vesting when all of the following conditions are met simultaneously:
– 36 months or more has lapsed from the date of issuance. – Continued employee service – Share price of NewSat Limited is 2 cents
Options expire 60 months from date of issuance.
4. Tranche 4 Director Options issued on 14 May 2010 – Options at an exercise price of 1 cent, vesting in 36 months from the date of issuance. Director must remain a director of the company to exercise options. Options expire 60 months from date of issuance.
5. Tranche 5 Director Options issued on 14 May 2010 – Exercise price of 0.001 of a cent, vesting when all of the following conditions are met simultaneously:
– 36 months or more has lapsed from the date of issuance. – Continued employee service – Share price of NewSat Limited is 2 cents
Options expire 60 months from date of issuance.
Remuneration Report (Audited) (Continued)
22 NewSat Limited 2010 Annual Report NewSat Limited 2010 Annual Report 23
For
per
sona
l use
onl
y

Liability limited by a scheme approved under Professional Standards Legislation
Auditor’s Independence Declaration to the Directors of NewSat Limited
In relation to our audit of the financial report of NewSat Limited for the year ended 30 June 2010, to the best of my knowledge and belief, there have been no contraventions of the auditor independence requirements of the Corporations Act 2001 or any applicable code of professional conduct.
Robert Dalton Partner Melbourne Ernst & Young 30 September 2010
Independence Declaration
NewSat Limited 2010 Annual Report 25
NewSat supports the Australian Stock Exchange Corporate Governance Council’s Principles of Good Corporate Governance and Best Practice Recommendations. The Company’s governance framework was reviewed during the year to ensure consistency with the recommendations and the Company and its controlled entities are working together referred to as the Group in this statement. NewSat does however recognise that its ability to achieve all the best practice recommendations is limited in part by restraints of size and cost. The 8 principles of the recommendations were in place during the entire 2010 year unless otherwise stated.
Principle 1 – Lay solid foundations for management and oversight
The NewSat Board is responsible for the overall corporate governance of the Group including responsibility to:
• Providing strategic guidance for the Group, the setting and monitoring of goals and objectives and the effective oversight of management to maximise shareholder wealth;
• Select and appoint Directors and ratify the appointment of senior management;
• Approve the annual budget and monitor financial performance;
• Ensure significant business risks are identified and managed;
• Ensure adequate internal controls exist and are monitored for compliance;
• Approve divestments and acquisitions;
• Ensure compliance of the Group’s accounts with relevant accounting standards and their true and fair presentation; and
• The Chief Executive Officer has delegated responsibility for operating and administering the Group and is accountable to the Board for the performance of these duties.
Principle 2 – Structure of the Board to add value
NewSat makes sure it has a Board of an effective composition, size and commitment to adequately discharge its responsibilities and duties. The Board facilitates the efficient discharge of the duties imposed by law on the Directors and adds value in the context of the Company’s specific circumstances.
The Board is structured in such a way that it:
• Has a proper understanding of, and competence to deal with, the current and emerging issues of the business; and
• Can effectively review and challenge the performance of management and exercise independent judgment.
Directors’ Independence
To be deemed independent, a Director must be a non-executive and:
• Not be a substantial shareholder of the company or an officer of, otherwise associated directly with, a substantial shareholder of the company;
• Within the last three years, not have been employed in an executive capacity by the company or any other group member, or been a Director after ceasing to hold any such employment;
• Within the last three years, not have been a principal of a material professional adviser or a material consultant to the Company or any other group member, or an employee materially associated with the service provided;
• Not be a material supplier or customer of the Company or any other group member, or an officer of or otherwise associated directly or indirectly with a material supplier or customer;
• Must have no material contractual relationship with the Company or a controlled entity other than as a Director of the Group;
• Not have been on the Board for a period which could, or could reasonably be perceived to, materially interfere with the Director’s ability to act in the best interests of the Company; and
• Be free from any interest and any business or other relationship which could, or could reasonably be perceived to, materially interfere with the Director’s ability to act in the best interests of the Company.
Materiality for these purposes is determined on both quantitative and qualitative bases. An amount of over 5% of annual turnover of the Company or Group or 5% of the individual Directors’ net worth is considered material for these purposes. In addition, a transaction of any amount or a relationship is deemed material if knowledge of it may impact the shareholders’ understanding of the Directors’ performance.
In accordance with the definition of independence above, and the materiality thresholds set, the following Directors of NewSat Limited are considered to be independent:
Name Position
Richard R Green Chairman, Non-executive Director
Elwood C Ellison Non-executive Director
Andrew J Plympton Non-executive Director
Mark R Fishwick Non-executive Director
In January 2004, the Directors established a nomination committee.
Corporate Governance Statement
24 NewSat Limited 2010 Annual Report
For
per
sona
l use
onl
y

26 NewSat Limited 2010 Annual Report NewSat Limited 2010 Annual Report 27
Corporate Governance Statement (Continued)
• Conducts any investigations relating to financial matters, records, accounts and reports which it considers appropriate;
• Reviews all material matters requiring exercise of judgment by management and reports those matters to the Board.
• Ratifies the Group’s operational risk policies for approval by the Board and reviews and informs the Board of the measurement and management of operational risk. Operational risk is a basic line management responsibility within the Group consistent with the policies established by the Committee’s Corporate Governance Statement;
• Considers, in the absence of management and the external auditor, the quality of the information received by the Committee and, in considering the financial statements, discusses with management and the external auditor;
• The financial statements and their conformity with accounting standards, other mandatory reporting requirements and statutory requirements;
• The quality of the accounting policies applied and any other significant judgments made;
• Discusses and receives assurances from the external auditors on the quality of the Company’s systems, its account processes and its financial results. It also receives a report from the Auditor on any significant matters raised by the Auditors with management; and
• All material accounting matters requiring exercise of judgment by management are specifically reviewed by the Audit Committee and reported on by the Committee of the Board.
NewSat established in June 2004 the following procedures for the selection and appointment of the External Auditors:
• The Committee considers whether the external audit should be tendered;
• In making this decision, the Committee considers (among other things) the performance of the auditor and the independence of the auditor. The Committee’s recommendation as to whether the audit should be tendered, or whether the auditor should be reappointed, will be put to the Board for their approval;
• If a tender is undertaken, all work on the tender will be undertaken by the Committee. Any subsequent recommendation for the appointment of the external auditor will be put to the Board and then if a change is approved it will be put forward to shareholders for their approval; and
• The company ensures no director past or present has any association with the Company’s external auditors.
Principle 5 – Make timely and balanced disclosure
NewSat promotes timely and balanced disclosure of all material matters concerning the Group and a written policy and process to ensure compliance with the ASX listing rules such that:
• All investors have equal and timely access to information concerning the Company including its financial position, performance, ownership and governance; and
• Company announcements are factual and presented in a clear and balanced way i.e. disclosure of both negative and positive information.
The Company Secretary has been nominated as the person responsible for communications with the Australian Stock Exchange (ASX). This role includes responsibility for ensuring compliance and the continuous disclosure of requirements in the ASX listing rules and overseeing and co-ordinating information disclosure to the ASX, analysts, brokers, shareholders, the media and the public.
Principle 6 – Respect the rights of shareholders
NewSat respects the rights of shareholders and endeavours to facilitate the effective exercise of those rights and the Company empowers its shareholders by communicating with them through:
• The annual report which is distributed to all shareholders;
• The annual general meeting and other meeting so called to obtain approval for Board action as appropriate;
• The shareholder newsletter; and
• The website which will:
– Provide ready access to balanced and understandable information about the company and corporate proposals, and
– Provide information including press releases, announcements and financial data.
Principle 7 – Recognise and manage risk
NewSat Limited maintains a system of risk oversight and management and internal control. The system has been designed to identify, assess, monitor and manage risk.
This structure enhances the environment for identifying and capitalising on opportunities to create value.
The Audit Committee manages this process through a risk management structure, headed by the CFO which answers directly to it.
The CEO and CFO confirm annually to the Board in writing that:
• Best practice recommendations are founded on a sound system of risk management and internal compliance and control which implements the policies adopted by the Board; and
The charter for the Company’s nomination committee as reviewed during 2010 is:• To advise the Board on Directorship appointments, with particular
attention to the qualifications and expertise of proposed appointees using the Procedure for selection and appointment of new Directors as defined below:
• To review and advise the Board on the performance of the Chief Executive Officer;
• To make recommendations to the Board on the appointment of the successor to the Chief Executive Officer;
• To establish a process for the regular evaluation of the Board, its committees and individual Directors and to assess regularly the effectiveness of the process;
• To review and advise the Remuneration Committee annually on:
– Chief Executive Officer’s remuneration, and – Non Executive Officers remuneration
• To review annually, the Board’s required mix of expertise and desirable competencies;
• To develop and implement a process for the orientation and education of new Directors; and
• To review management’s recommendations and advise the Board on succession plans for key senior positions within the Company.
Principle 3 – Promotion of ethical and responsible decision-making
In June 2004, the Board of NewSat approved a code of conduct, further revised during 2008, to guide the Directors, the CEO and the CFO. This code has established the practices necessary to maintain confidence in the Company’s integrity and the responsibility and accountability of individuals and investigating reports of unethical practices.
The code of conduct covers:
• Conflicts of interest;
• Corporate opportunities;
• Fair dealing;
• Protection and proper use of the company’s assets;
• Compliance with laws and regulations; and
• Encourage the report of unlawful/unethical behaviour.
Additionally the policy concerning trading in Company securities by Directors, Officers and employees established in 2003 is reviewed annually.
The main provisions of this policy are that it:
• Provides a clear identification of Directors, Officers, employees or group of employees who are restricted from trading (‘designated officers’);
• Identifies and raises awareness about the prohibitions under the law and the requirements of the policy;
• Requires designated Officers to provide notification to the Chairman of the Company of intended trading except for dividend reinvestment and the like;
• Requires subsequent confirmation of the trading that has occurred;
• Identifies when trading windows or blackouts are used and details of their application;
• Specifies whether there is any discretion to permit trading by designated officers in specific circumstances (e.g. financial hardship) details of such circumstances, and the basis upon which discretion is applied;
• Specifies whether the Company prohibits designated officers from trading in financial products issued or created over the Company’s securities by third parties, or trading in associated products; and
• Specifies whether the Company prohibits designated Officers from entering into transaction in associated products which operate to limit the economic risk of their security holding in the Company.
Principle 4 – Safeguard integrity in financial reporting
NewSat has created a structure which independently verifies and safeguards the integrity of the Company’s financial reporting. This is done through a process of review and authorisation designed to ensure the truthful and factual presentation of the Company’s financial position.
This includes the review and consideration of the accounts by the Audit Committee. The structures do not diminish the ultimate responsibility of the Board to ensure the integrity of the Company’s financial reporting. Due to the size of the Board of Directors, the Audit Committee comprises two of the Directors.
The Company ensures the CEO and CFO, state in writing to the Board that the financial reports present a true and fair view, in all material respects, of the Company’s financial condition and operational results are in accordance with relevant accounting standards.
The Audit Committee has the following formal charter.
In carrying out the Audit function, the Audit Committee:
• Is responsible for nominating the external auditor to the Board for appointment by shareholders. The Audit Committee approves the terms of the contract with the external auditor, agrees the annual audit plan and approves payments to the external auditor;
• Monitors and reviews and non audit work carried out by the external auditors;
• Reviews accounting policies to ensure compliance with current laws, relevant regulations and accounting standards;
• Reviews accounting policies to ensure compliance with current laws, relevant regulations and accounting standards;
For
per
sona
l use
onl
y

28 NewSat Limited 2010 Annual Report NewSat Limited 2010 Annual Report 29
Corporate Governance Statement (Continued)
for the year ended 30 June 2010
Notes
Year ended 30 June 2010
$’000
Year ended 30 June 2009
$’000
Revenue
Sale of goods and services 24,951 19,876
Finance revenue 83 29
Revenue 6(a) 25,034 19,905
Cost of sales (13,201) (10,433)
Gross margin 11,833 9,472
Other income 6(b) 22 160
Salaries & employee benefits expense 6(c) (5,607) (5,644)
Share based payments (non cash) 6(c) (99) (193)
Sales and marketing expense (1,498) (1,276)
Occupancy expense 6(d) (468) (545)
Other expenses 6(e) (2,617) (2,967)
Profit / (loss) from operations before depreciation, finance costs and tax 1,566 (993)
Depreciation & amortisation 6(f) (1,539) (1,630)
Finance costs 6(g) (1) (337)
Profit / (loss) from continuing operations before income tax 26 (2,960)
Income tax expense 7 – –
Net profit / (loss) for the period 26 (2,960)
Other comprehensive income for the period, net of tax – –
Total comprehensive income / (loss) 26 (2,960)
Earnings per share for profit/(loss) attributable to ordinary equity holders of the parent. 8
Basic earnings (loss) per share (cents) 0.0004 (0.0470)
Diluted earnings (loss) per share (cents) 0.0003 (0.0470)
The above Consolidated Statement of Comprehensive Income should be read in conjunction with the accompanying notes.
• The Company’s risk management and internal compliance and control system is operating efficiently and effectively in all material respects.
All policies are agreed, by the Board that describe the roles and respective accountabilities of the Board, Audit Committee CFO, Risk Manager, Senior Management and any internal audit and risk management functions.
These policies include oversight and awareness, risk profile, risk management, compliance and control and assessment of effectiveness as defined below:
1. Oversight of the risk management – The Board has overseen the establishment and implementation of a risk management system and will review at least annually the effectiveness of this system.
2. Develop an awareness of the principles of risk management – NewSat has developed and implemented an infrastructure to ensure that management of risk becomes integral part of the planning management processes and generally culture of the company.
3. Risk Profile – a description of the material risks facing the Company has been identified, drafted and agreed. These risks included evaluating, treating and managing material risk through the Company. This system includes the Company’s internal compliance and control systems.
4. Risk Management and compliance and control – Management has established and implemented a system for analysing, evaluating, treating and managing material risk throughout the Company. This system includes the Company’s internal compliance and control systems.
5. Assessment of effectiveness – The Company has designed a means of analysing the effectiveness of its risk management and internal compliance and control systems and of the effectiveness of their implementation. This is done by the CFO who supervises a management and internal audit review process which then answers to the Audit Committee.
Principle 8 – Remunerate fairly and responsibly
The Company has adopted remuneration policies that attract and maintain talented and motivated Directors and employees so as to encourage enhanced performance of the Company. There is a clear relationship between performance and remuneration, and that the policy underlying executive remuneration. A written policy and Remuneration Committee Charter reflecting these practices was adopted by the Directors in June 2005.
The Board established Remuneration Committee charter is to review and make recommendations to the Board on:
• Non-executive Directors and the Chief Executive Officer remuneration;
• Executive remuneration and incentive policies including share and share option plans;
• The remuneration packages of senior management;
• The Company’s recruitment, retention and termination policies and procedures for senior management;
• Incentive schemes; and
• Superannuation arrangements and other retirement schemes.
Consolidated Statement of Comprehensive Income
For
per
sona
l use
onl
y
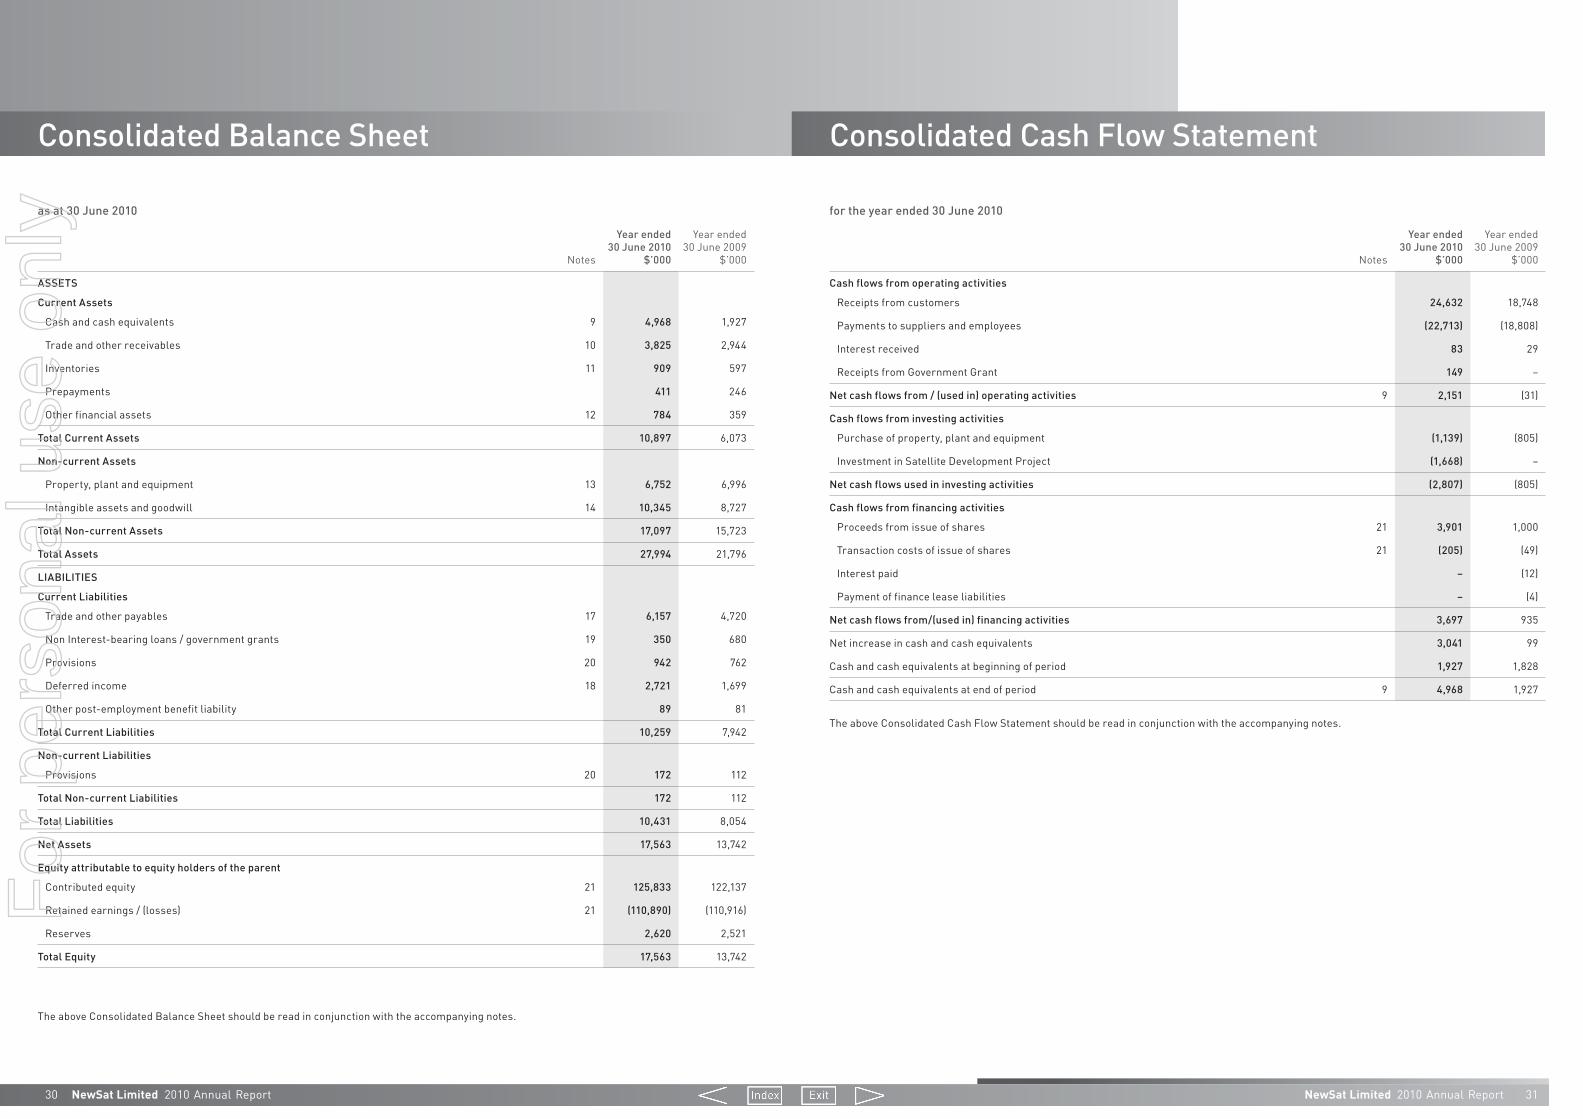
30 NewSat Limited 2010 Annual Report NewSat Limited 2010 Annual Report 31
Consolidated Balance Sheet
for the year ended 30 June 2010
Notes
Year ended 30 June 2010
$’000
Year ended 30 June 2009
$’000
Cash flows from operating activities
Receipts from customers 24,632 18,748
Payments to suppliers and employees (22,713) (18,808)
Interest received 83 29
Receipts from Government Grant 149 –
Net cash flows from / (used in) operating activities 9 2,151 (31)
Cash flows from investing activities
Purchase of property, plant and equipment (1,139) (805)
Investment in Satellite Development Project (1,668) –
Net cash flows used in investing activities (2,807) (805)
Cash flows from financing activities
Proceeds from issue of shares 21 3,901 1,000
Transaction costs of issue of shares 21 (205) (49)
Interest paid – (12)
Payment of finance lease liabilities – (4)
Net cash flows from/(used in) financing activities 3,697 935
Net increase in cash and cash equivalents 3,041 99
Cash and cash equivalents at beginning of period 1,927 1,828
Cash and cash equivalents at end of period 9 4,968 1,927
The above Consolidated Cash Flow Statement should be read in conjunction with the accompanying notes.
as at 30 June 2010
Notes
Year ended 30 June 2010
$’000
Year ended 30 June 2009
$’000
ASSETS
Current Assets
Cash and cash equivalents 9 4,968 1,927
Trade and other receivables 10 3,825 2,944
Inventories 11 909 597
Prepayments 411 246
Other financial assets 12 784 359
Total Current Assets 10,897 6,073
Non-current Assets
Property, plant and equipment 13 6,752 6,996
Intangible assets and goodwill 14 10,345 8,727
Total Non-current Assets 17,097 15,723
Total Assets 27,994 21,796
LIABILITIES
Current Liabilities
Trade and other payables 17 6,157 4,720
Non Interest-bearing loans / government grants 19 350 680
Provisions 20 942 762
Deferred income 18 2,721 1,699
Other post-employment benefit liability 89 81
Total Current Liabilities 10,259 7,942
Non-current Liabilities
Provisions 20 172 112
Total Non-current Liabilities 172 112
Total Liabilities 10,431 8,054
Net Assets 17,563 13,742
Equity attributable to equity holders of the parent
Contributed equity 21 125,833 122,137
Retained earnings / (losses) 21 (110,890) (110,916)
Reserves 2,620 2,521
Total Equity 17,563 13,742
The above Consolidated Balance Sheet should be read in conjunction with the accompanying notes.
Consolidated Cash Flow Statement
For
per
sona
l use
onl
y
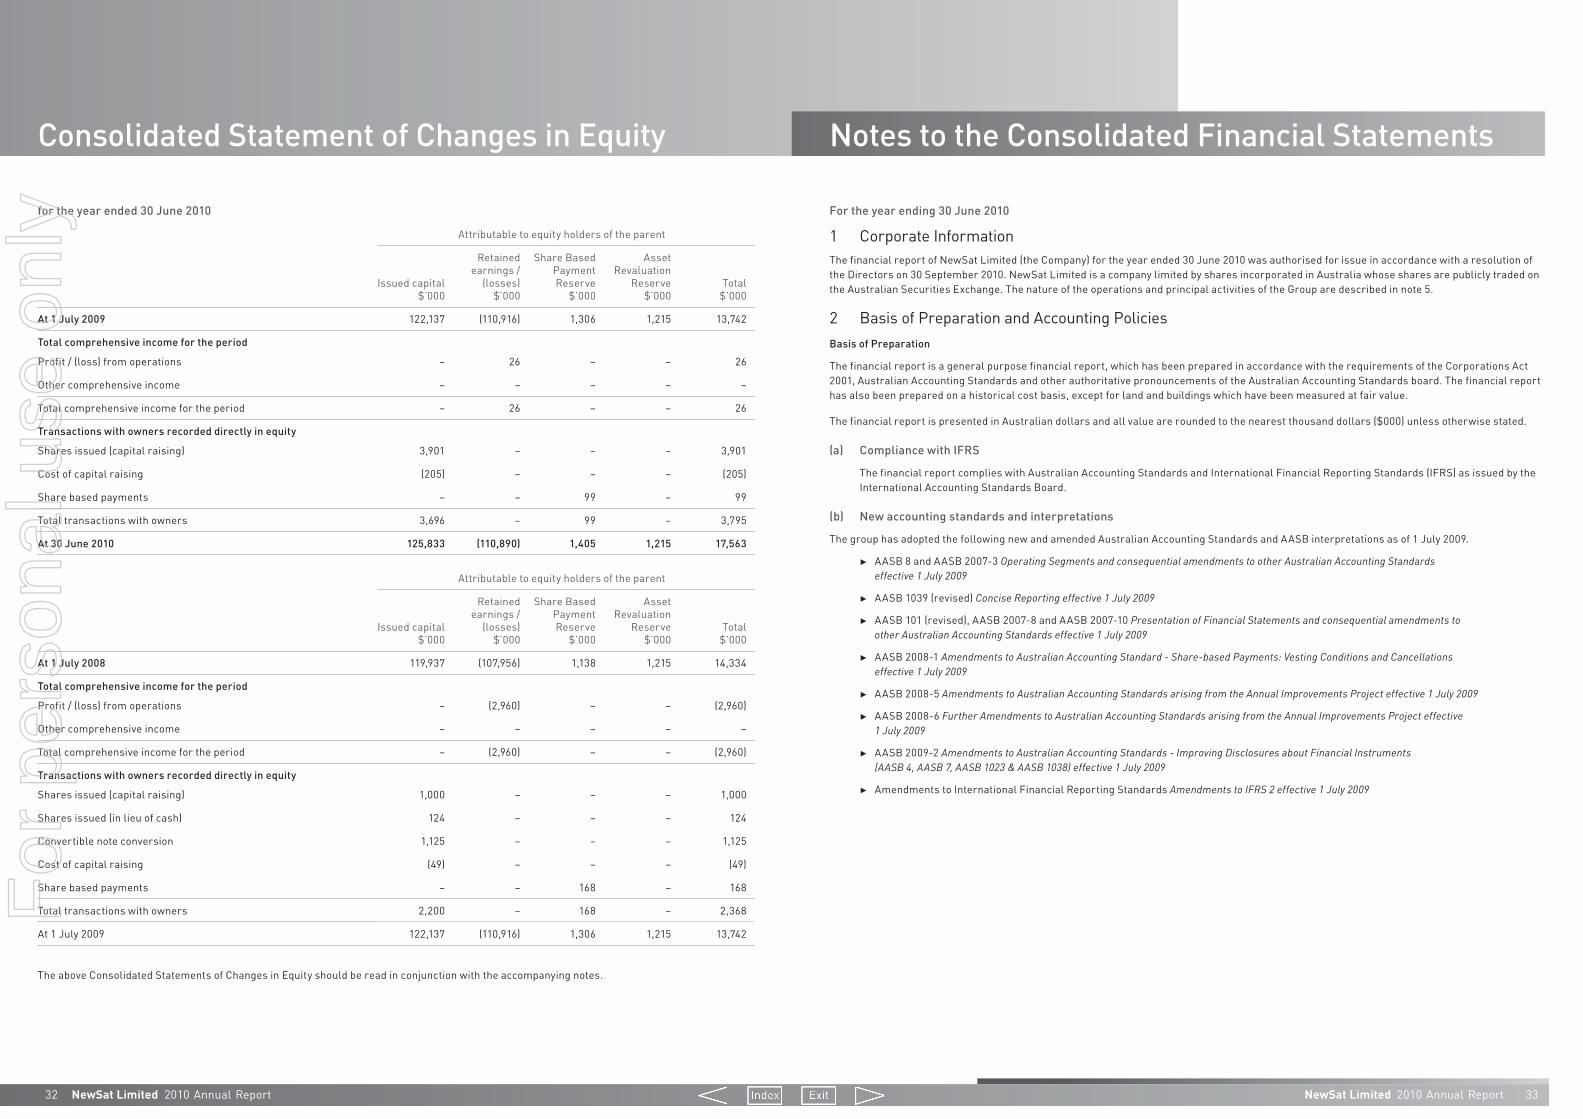
32 NewSat Limited 2010 Annual Report NewSat Limited 2010 Annual Report 33
Consolidated Statement of Changes in Equity
For the year ending 30 June 2010
1 Corporate InformationThe financial report of NewSat Limited (the Company) for the year ended 30 June 2010 was authorised for issue in accordance with a resolution of the Directors on 30 September 2010. NewSat Limited is a company limited by shares incorporated in Australia whose shares are publicly traded on the Australian Securities Exchange. The nature of the operations and principal activities of the Group are described in note 5.
2 Basis of Preparation and Accounting PoliciesBasis of Preparation
The financial report is a general purpose financial report, which has been prepared in accordance with the requirements of the Corporations Act 2001, Australian Accounting Standards and other authoritative pronouncements of the Australian Accounting Standards board. The financial report has also been prepared on a historical cost basis, except for land and buildings which have been measured at fair value.
The financial report is presented in Australian dollars and all value are rounded to the nearest thousand dollars ($000) unless otherwise stated.
(a) Compliance with IFRS
The financial report complies with Australian Accounting Standards and International Financial Reporting Standards (IFRS) as issued by the International Accounting Standards Board.
(b) New accounting standards and interpretations
The group has adopted the following new and amended Australian Accounting Standards and AASB interpretations as of 1 July 2009.
►► AASB 8 and AASB 2007-3 Operating Segments and consequential amendments to other Australian Accounting Standards effective 1 July 2009
►► AASB 1039 (revised) Concise Reporting effective 1 July 2009
►► AASB 101 (revised), AASB 2007-8 and AASB 2007-10 Presentation of Financial Statements and consequential amendments to other Australian Accounting Standards effective 1 July 2009
►► AASB 2008-1 Amendments to Australian Accounting Standard - Share-based Payments: Vesting Conditions and Cancellations effective 1 July 2009
►► AASB 2008-5 Amendments to Australian Accounting Standards arising from the Annual Improvements Project effective 1 July 2009
►► AASB 2008-6 Further Amendments to Australian Accounting Standards arising from the Annual Improvements Project effective 1 July 2009
►► AASB 2009-2 Amendments to Australian Accounting Standards - Improving Disclosures about Financial Instruments (AASB 4, AASB 7, AASB 1023 & AASB 1038) effective 1 July 2009
►► Amendments to International Financial Reporting Standards Amendments to IFRS 2 effective 1 July 2009
for the year ended 30 June 2010
Attributable to equity holders of the parent
Issued capital $’000
Retained earnings /
(losses) $’000
Share Based Payment Reserve
$’000
Asset Revaluation
Reserve $’000
Total $’000
At 1 July 2009 122,137 (110,916) 1,306 1,215 13,742
Total comprehensive income for the period
Profit / (loss) from operations – 26 – – 26
Other comprehensive income – – – – –
Total comprehensive income for the period – 26 – – 26
Transactions with owners recorded directly in equity
Shares issued (capital raising) 3,901 – – – 3,901
Cost of capital raising (205) – – – (205)
Share based payments – – 99 – 99
Total transactions with owners 3,696 – 99 – 3,795
At 30 June 2010 125,833 (110,890) 1,405 1,215 17,563
Attributable to equity holders of the parent
Issued capital $’000
Retained earnings /
(losses) $’000
Share Based Payment Reserve
$’000
Asset Revaluation
Reserve $’000
Total $’000
At 1 July 2008 119,937 (107,956) 1,138 1,215 14,334
Total comprehensive income for the period
Profit / (loss) from operations – (2,960) – – (2,960)
Other comprehensive income – – – – –
Total comprehensive income for the period – (2,960) – – (2,960)
Transactions with owners recorded directly in equity
Shares issued (capital raising) 1,000 – – – 1,000
Shares issued (in lieu of cash) 124 – – – 124
Convertible note conversion 1,125 – – – 1,125
Cost of capital raising (49) – – – (49)
Share based payments – – 168 – 168
Total transactions with owners 2,200 – 168 – 2,368
At 1 July 2009 122,137 (110,916) 1,306 1,215 13,742
The above Consolidated Statements of Changes in Equity should be read in conjunction with the accompanying notes.
Notes to the Consolidated Financial Statements
For
per
sona
l use
onl
y

34 NewSat Limited 2010 Annual Report
Notes to the Consolidated Financial Statements (Continued)
For the year ending 30 June 2010
NewSat Limited 2010 Annual Report 35
Reference Title Summary
Application date of standard
Impact on Group financial report
Application date for Group
AASB 2009-11
Amendments to Australian Accounting Standards arising from AASB 9 [AASB 1, 3, 4, 5, 7, 101, 102, 108, 112, 118, 121, 127, 128, 131, 132, 136, 139, 1023 & 1038 and Interpretations 10 & 12]
The revised Standard introduces a number of changes to the accounting for financial assets, the most significant of which includes:
►► two categories for financial assets being amortised cost or fair value
►► removal of the requirement to separate embedded derivatives in financial assets
►► strict requirements to determine which financial assets can be classified as amortised cost or fair value, Financial assets can only be classified as amortised cost if (a) the contractual cash flows from the instrument represent principal and interest and (b) the entity’s purpose for holding the instrument is to collect the contractual cash flows
►► an option for investments in equity instruments which are not held for trading to recognise fair value changes through other comprehensive income with no impairment testing and no recycling through profit or loss on derecognition
►► reclassifications between amortised cost and fair value no longer permitted unless the entity’s business model for holding the asset changes
►► changes to the accounting and additional disclosures for equity instruments classified as fair value through other comprehensive income
1 January 2013
The Group expected no significant impact to the disclosure or reported results in the financial statements following adoption of this standard.
1 July 2013
AASB 2009-12
Amendments to Australian Accounting Standards AASBs 5, 8, 108, 110, 112, 119, 133, 137, 139, 1023 & 1031 and Interpretations 2, 4, 16, 1039 & 1052
This amendment makes numerous editorial changes to a range of Australian Accounting Standards and Interpretations.
The amendment to AASB 124 clarifies and simplifies the definition of a related party as well as providing some relief for government-related entities (as defined in the amended standard) to disclose details of all transactions with other government-related entities (as well as with the government itself)
1 January 2011
The Group expected no significant impact to the disclosure or reported results in the financial statements following adoption of this standard.
1 July 2011
Interpretation 19
Interpretation 19 Extinguishing Financial Liabilities with Equity Instruments
This interpretation clarifies clarifies that equity instruments issued to a creditor to extinguish a financial liability are ‘consideration paid’ in accordance with paragraph 41 of IAS 39. As a result, the financial liability is derecognised and the equity instruments issued are treated as consideration paid to extinguish that financial liability.
The interpretation states that equity instruments issued in a debt for equity swap should be measured at the fair value of the equity instruments issued, if this can be determined reliably. If the fair value of the equity instruments issued is not reliably determinable, the equity instruments should be measured by reference to the fair value of the financial liability extinguished as of the date of extinguishment.
1 July 2010
The Group expected no significant impact to the disclosure or reported results in the financial statements following adoption of this standard.
1 July 2010
The following standards and interpretations have been issued by the AASB but are not yet effective for the period ending 30 June 2010.
Reference Title Summary
Application date of standard
Impact on Group financial report
Application date for Group
AASB 2009-5 Further Amendments to Australian Accounting Standards arising from the Annual Improvements Project
AASB 5, 8, 101, 107, 118, 136 & 139
The amendments to some Standards result in accounting changes for presentation, recognition or measurement purposes, while some amendments that relate to terminology and editorial changes are expected to have no or minimal effect on accounting except for the following:
The amendment to AASB 101 stipulates that the terms of a liability that could result, at anytime, in its settlement by the issuance of equity instruments at the option of the counterparty do not affect its classification.
The amendment to AASB 107 explicitly states that only expenditure that results in a recognised asset can be classified as a cash flow from investing activities.
The amendment to AASB 118 provides additional guidance to determine whether an entity is acting as a principal or as an agent. The features indicating an entity is acting as a principal are whether the entity:
►► has primary responsibility for providing the goods or service
►► has inventory risk
►► has discretion in establishing prices
►► bears the credit risk
1 January 2010
The Group expected no significant impact to the disclosure or reported results in the financial statements following adoption of this standard.
1 July 2010
AASB 2009-5 (con’t)
Further Amendments to Australian Accounting Standards arising from the Annual Improvements Project
AASB 5, 8, 101, 107, 117, 118, 136 & 139
The amendment to AASB 136 clarifies that the largest unit permitted for allocating goodwill acquired in a business combination is the operating segment, as defined in IFRS 8 before aggregation for reporting purposes.
The main change to AASB 139 clarifies that a prepayment option is considered closely related to the host contract when the exercise price of a prepayment option reimburses the lender up to the approximate present value of lost interest for the remaining term of the host contract.
The other changes clarify the scope exemption for business combination contracts and provide clarification in relation to accounting for cash flow hedges.
AASB 2009-8 Amendments to Australian Accounting Standards – Group Cash-settled Share-based Payment Transactions [AASB 2]
This Standard makes amendments to Australian Accounting Standard AASB 2 Share-based Payment and supersedes Interpretation 8 Scope of AASB 2 and Interpretation 11 AASB 2 – Group and Treasury Share Transactions.
The amendments clarify the accounting for group cash-settled share-based payment transactions in the separate or individual financial statements of the entity receiving the goods or services when the entity has no obligation to settle the share-based payment transaction.
The amendments clarify the scope of AASB 2 by requiring an entity that receives goods or services in a share-based payment arrangement to account for those goods or services no matter which entity in the group settles the transaction, and no matter whether the transaction is settled in shares or cash.
1 January 2010
The Group expected no significant impact to the disclosure or reported results in the financial statements following adoption of this standard.
1 July 2010
2 Basis of Preparation and Accounting Policies (Continued)
For
per
sona
l use
onl
y

36 NewSat Limited 2010 Annual Report
Notes to the Consolidated Financial Statements (Continued)
For the year ending 30 June 2010
NewSat Limited 2010 Annual Report 37
(g) Government grants and loans
Government grants are recognised in the balance sheet as a liability when the grant is received.
When the grant relates to an expense item, it is recognised as income over the periods necessary to match the grant on a systematic basis to the costs that it is intended to compensate. They are not credited directly to shareholders’ equity.
When the grant relates to an asset, the fair value is credited to a deferred income account and is released to the income statement over the expected useful life of the relevant asset by equal annual installments.
Forgivable government loans received are deemed to be government grants in accordance with AASB120. Amounts are released to the Statement of Comprehensive Income when milestones are met.
(h) Borrowing costs
Borrowing costs are recognised as an expense when incurred.
(i) Leases
The determination of whether an arrangement is or contains a lease is based on the substance of the arrangement and requires an assessment of whether the fulfillment of the arrangement is dependent on the use of a specific asset or assets and the arrangement conveys a right to use the asset.
(i) Group as a lessee
Finance leases, which transfer to the Group substantially all the risks and benefits incidental to ownership of the leased item, are capitalised at the inception of the lease at the fair value of the leased property or, if lower, at the present value of the minimum lease payments. Lease payments are apportioned between the finance charges and reduction of the lease liability so as to achieve a constant rate of interest on the remaining balance of the liability. Finance charges are recognised as an expense in profit or loss.
Capitalised leased assets are depreciated over the shorter of the estimated useful life of the asset and the lease term if there is no reasonable certainty that ownership will transfer to the Group an expiry of the lease term.
Operating lease payments are recognised as an expense in the income statement on a straight-line basis over the lease term. Lease incentives are recognised in the Statement of Comprehensive Income as an integral part of the total lease expense.
(j) Cash and cash equivalents
Cash and cash equivalents in the balance sheet comprise cash at bank and in hand and short-term deposits with an original maturity of three months or less.
For the purposes of the Cash Flow Statement, cash and cash equivalents consist of cash and cash equivalents as defined above, net of outstanding bank overdrafts.
(k) Trade and other receivables
Trade receivables, which generally have 7 to 30 day terms, are recognised and carried at original invoice amount less allowance for impairment.
An allowance for impairment is made when there is objective evidence that the Group will not be able to collect the receivable. Bad debts are written off when identified.
(l) Inventories
Inventories are valued at the lower of cost and net realisable value.
Costs incurred in bringing each product to its present location and condition are accounted for as follows:
Raw materials – purchase cost on a first-in, first-out basis; and
Finished goods and work-in-progress – cost of direct materials.
Net realisable value is the estimated selling price in the ordinary course of business, less estimated costs of completion and the estimated costs necessary to make the sale.
(c) Basis of consolidation
The consolidated financial statements comprise the financial statements of NewSat Limited and its subsidiaries as at 30 June each year (the Group).
The financial statements of the subsidiaries are prepared for the same reporting period as the parent company, using consistent accounting policies.
In preparing the consolidated financial statements, all intercompany balances and transactions, income and expenses and profit and losses resulting from intra-group transactions have been eliminated in full.
Subsidiaries are fully consolidated from the date on which control is transferred to the Group and cease to be consolidated from the date on which control is transferred out of the Group.
(d) Going Concern
The financial statements have been prepared on a going concern basis.
(e) Significant accounting judgments, estimates and assumptions
The carrying amounts of certain assets and liabilities are often determined based on estimates and assumptions of future events. The key estimates and assumptions that have a significant risk of causing a material adjustment to the carrying amounts of certain assets and liabilities within the next annual reporting period are:
(i) Impairment of goodwill and intangibles with indefinite useful lives
The Group determines whether goodwill and intangibles with indefinite useful lives are impaired at least on an annual basis. This requires an estimation of the recoverable amount of the cash-generating units to which the goodwill and intangibles with indefinite useful lives are allocated. The assumptions used in this estimation of recoverable amount and the carrying amount of goodwill and intangibles with indefinite useful lives are discussed in Note 15.
(ii) Share-based payment transactions
The Group measures the cost of equity-settled transactions with employees by reference to the fair value of the equity instruments at the date at which they are granted. The fair value is determined by an external valuer using a binomial model, under the assumptions detailed in Note 16.
(f) Revenue recognition
Revenue is recognised to the extent that it is probable that the economic benefits will flow to the Group and the revenue can be reliably measured. The following specific recognition criteria must also be met before revenue is recognised:
(i) Sale of goods
Revenue is recognised when the significant risks and rewards of ownership of the goods have passed to the buyer and the costs incurred or to be incurred in respect of the transaction can be measured reliably. Risks and rewards of ownership are considered passed to the buyer at the time of delivery of the goods to the customer.
(ii) Rendering of services
Revenue from a contract to provide services is recognised when the contract of the service is rendered. Revenue received in advance of the provision of the service is deferred until the service is rendered.
(iii) Interest income
Revenue is recognised as interest accrues using the effective interest method. This is a method of calculating the amortised cost of a financial asset and allocating the interest income over the relevant period using the effective interest rate, which is the rate that exactly discounts estimated future cash receipts through the expected life of the financial asset to the net carrying amount of the financial asset.
2 Basis of Preparation and Accounting Policies (Continued)
For
per
sona
l use
onl
y

38 NewSat Limited 2010 Annual Report
Notes to the Consolidated Financial Statements (Continued)
For the year ending 30 June 2010
NewSat Limited 2010 Annual Report 39
The net amount of GST recoverable from, or payable to, the taxation authority is included as part of receivables or payables in the balance sheet.
Cash flows are included in the Cash Flow Statement on a gross basis and the GST component of cash flows arising from investing and financing activities, which is recoverable from, or payable to, the taxation authority are classified as operating cash flows.
Commitments and contingencies are disclosed net of the amount of GST recoverable from, or payable to, the taxation authority.
(o) Property, plant and equipment
Plant and equipment is stated at cost less accumulated depreciation and any accumulated impairment losses. Such cost includes the cost of replacing parts that are eligible for capitalisation when the cost of replacing the parts is incurred. Similarly, when each major inspection is performed, its cost is recognised in the carrying amount of the plant and equipment as a replacement only if it is eligible for capitalisation.
Land and buildings are measured at fair value.
The policy of measuring land and building at fair value was adopted with effect from 30 June 2008. The previous policy was to measure land and buildings at cost less accumulated depreciation. The new policy was adopted to provide more relevant information of about land and buildings values. The change in accounting policy resulted in an increase in the carrying amount of land and buildings of $1,734,797 at 30 June 2008.
Leasehold improvements are depreciated over the period of the lease or estimated useful life, whichever is the shorter, using the straight line method.
Depreciation is calculated on a straight-line basis over the estimated useful life of the assets as follows:
Land – Not Depreciated
Buildings – 15 years
Leasehold improvements – lease term
Plant and equipment – over 2 to 5 years
The assets’ residual values, useful lives and amortisation methods are reviewed, and adjusted if appropriate, at each financial year end.
Impairment
The carrying values of plant and equipment are reviewed for impairment at each reporting date, with recoverable amount being estimated when events or changes in circumstances indicate that the carrying value may be impaired.
The recoverable amount of plant and equipment is the higher of fair value less costs to sell and value in use. In assessing value in use, the estimated future cash flows are discounted to their present value using a pre-tax discount rate that reflects current market assessments of the time value of money and the risks specific to the asset.
For an asset that does not generate largely independent cash inflows, the recoverable amount is determined for the cash-generating unit to which the asset belongs, unless the asset’s value in use can be estimated to be close to its fair value.
An impairment exists when the carrying value of an asset or cash-generating units exceeds its estimated recoverable amount. The asset or cash-generating unit is then written down to its recoverable amount. Impairment losses are recognised in the Statement of Comprehensive Income.
(p) Investments and other financial assets
Financial assets in the scope of AASB 139 Financial Instruments: Recognition and Measurement are classified as either financial assets at fair value through profit or loss, or loans and receivables, as appropriate. When financial assets are recognised initially, they are measured at fair value, plus, in the case of investments not at fair value through profit or loss, directly attributable transactions costs. The Group determines the classification of its financial assets after initial recognition and, when allowed and appropriate, re-evaluates this designation at each financial year-end.
All regular way purchases and sales of financial assets are recognised on the trade date i.e. the date that the Group commits to purchase the asset. Regular way purchases or sales are purchases or sales of financial assets under contracts that require delivery of the assets within
(m) Foreign currency translation
Both the functional and presentation currency of NewSat Limited and its Australian subsidiaries is Australian dollars ($). Each entity in the Group determines its own functional currency and items included in the financial statements of each entity are measured using that functional currency.
Transactions in foreign currencies are initially recorded in the functional currency by applying the weighted average exchange rates ruling at the date of the transaction. Monetary assets and liabilities denominated in foreign currencies are retranslated at the rate of exchange ruling at the reporting date.
(n) Income tax and other taxes
Current tax assets and liabilities for the current and prior periods are measured at the amount expected to be recovered from or paid to the taxation authorities. The tax rates and tax laws used to compute the amount are those that are enacted or substantively enacted by the reporting date.
Deferred income tax is provided on all temporary differences at the balance sheet date between the tax bases of assets and liabilities and their carrying amounts for financial reporting purposes.
Deferred income tax liabilities are recognised for all taxable temporary differences except:
• When the deferred income tax liability arises from the initial recognition of goodwill or of an asset or liability in a transaction that is not a business combination and that, at the time of the transaction, affects neither the accounting profit nor taxable profit or loss; or
• When the taxable temporary difference is associated with investments in subsidiaries, associates or interests in joint ventures, and the timing of the reversal of the temporary difference can be controlled and it is probable that the temporary difference will not reverse in the foreseeable future.
Deferred income tax assets are recognised for all deductible temporary differences, carry-forward of unused tax assets and unused tax losses, to the extent that it is probable that taxable profit will be available against which the deductible temporary differences and the carry-forward of unused tax credits and unused tax losses can be utilised, except:
• When the deferred income tax asset relating to the deductible temporary difference arises from the initial recognition of an asset or liability in a transaction that is not a business combination and, at the time of the transaction, affects neither the accounting profit nor taxable profit or loss; or
• When the deductible temporary difference is associated with investments in subsidiaries, associates or interests in joint ventures, in which case a deferred tax asset is only recognised to the extent that it is probable that the temporary difference will reverse in the foreseeable future and taxable profit will be available against which the temporary difference can be utilised.
The carrying amount of deferred income tax assets is reviewed at each reporting date and reduced to the extent that it is no longer probable that sufficient taxable profit will be available to allow all or part of the deferred income tax asset to be utilised.
Unrecognised deferred income tax assets are reassessed at each reporting date and are recognised to the extent that it has become probable that future taxable profit will allow the deferred tax asset to be recovered.
Deferred income tax assets and liabilities are measured at the tax rates that are expected to apply to the year when the asset is realised or the liability is settled, based on tax rates (and tax laws) that have been enacted or substantively enacted at the reporting date.
Income taxes relating to items recognised directly in equity are recognised in equity and not in profit or loss.
Deferred tax assets and deferred tax liabilities are offset only if a legally enforceable right exists to set off current tax assets against current tax liabilities and the deferred tax assets and liabilities relate to the same taxable entity and the same taxation authority.
Other taxes
Revenues, expenses and assets are recognised net of the amount of GST except:
• When the GST incurred on a purchase of goods and services is not recoverable from the taxation authority, in which case the GST is recognised as part of the cost of acquisition of the asset or as part of the expense item as applicable; and
• Receivables and payables, which are stated with the amount of GST included.
2 Basis of Preparation and Accounting Policies (Continued)
For
per
sona
l use
onl
y

40 NewSat Limited 2010 Annual Report
Notes to the Consolidated Financial Statements (Continued)
For the year ending 30 June 2010
NewSat Limited 2010 Annual Report 41
Other Intangibles
Intangibles assets acquired separately or in a business combination are initially measured at cost. The cost of an intangible asset acquired in a business combination is its fair value as at the date of acquisition. Following initial recognition, intangible assets are carried at cost less any accumulated amortisation and any accumulated impairment losses. Internally generated intangible assets, excluding capitalised development costs, are not capitalised and expenditure is recognised in profit or loss in the year in which the expenditure is incurred.
The useful lives of intangible assets are assessed to be either finite or indefinite. Intangibles assets with finite lives are amortised over the useful life and tested for impairment whenever there is an indication that the intangible asset may be impaired. The amortisation period and the amortisation method for an intangible asset with a finite useful life is reviewed at least at each financial year end. Changes in the expected useful life or the expected pattern of consumption of future economic benefits embodies in the asset are accounted for prospectively by changing the amortisation period or method, as appropriate, which is a change in accounting estimate. The amortisation expense on intangible assets with finite lives is recognised in profit or loss in the expense category consistent with the function of the intangible asset.
Intangible assets with indefinite useful lives are tested for impairment annually either individually or at the cash generating unit level. Such intangibles are not amortised. The useful life of an intangible asset with an indefinite life is reviewed each reporting period to determine whether indefinite life assessment continues to be supportable. If not, the change in the useful life assessment from indefinite to definite is accounted for as a change in an accounting estimate and is thus accounted for on a prospective basis.
(r) Impairment of non-financial assets other than goodwill
Intangible assets that have an indefinite useful life are not subject to amortisation and are tested annually for impairment, or more frequently if events or changes in circumstances indicate that they might be impaired. Other assets are tested for impairment whenever events or changes in circumstances indicate that the carrying amount may not be recoverable. An impairment loss is recognised for the amount by which the asset’s carrying amount exceeds its recoverable amount. Recoverable amount is the higher of an asset’s fair value less costs to sell and value in use. For the purposes of assessing impairment, assets are grouped at the lowest levels for which there are separately identifiable cash inflows that are largely independent of the cash inflows from other assets or groups of assets (cash-generating units). Non-financial assets other than goodwill that suffered an impairment are tested for possible reversal of the impairment whenever events or changes in circumstances indicate that such reversal would be appropriate.
(s) Trade and other payables
Trade payables and other payables are carried at amortised costs and represent liabilities for goods and services provided to the Group prior to the end of the financial year that are unpaid and arise when the Group becomes obliged to make future payments in respect of the purchase of these goods and services.
(t) Interest-bearing loans and borrowings
All loans and borrowings are initially recognised at the fair value of the consideration received less directly attributable transaction costs.
After initial recognition, interest-bearing loans and borrowings are subsequently measured at amortised cost using the effective interest method. Fee paid on the establishment of loan facilities that are yield related are included as part of the carrying amount of the loans and borrowings.
(u) Provisions
Provisions are recognised when the Group has a present obligation (legal or constructive) as a result of a past event, it is probable that an outflow of resources embodying economic benefits will be required to settle the obligation and a reliable estimate can be made of the amount of the obligation.
When the Group expects some or all of a provision to be reimbursed, for example under an insurance contract, the reimbursement is recognised as a separate asset but only when the reimbursement is virtually certain. The expense relating to any provision is presented in the statement of comprehensive income net of any reimbursement.
Provisions are measured at the present value of management’s best estimate of the expenditure required to settle the present obligation at the reporting date. If the effect of the time value of money is material, provisions are discounted using a current pre-tax rate that reflects the time value of money and the risks specific to the liability. The increase in the provision resulting from the passage of time is recognised in finance costs.
the period established generally by regulation or convention in the marketplace.
Loans and receivables
Loans and receivables are non-derivative financial assets with fixed or determinable payments that are not quoted in an active market. Such assets are carried at amortised cost using the effective interest method. Gains and losses are recognised in profit or loss when the loans and receivables are derecognised or impaired, as well as through the amortisation process.
(q) Goodwill and intangibles
Goodwill
Goodwill acquired in a business combination is initially measured at cost being the excess of the cost of the business combination over the Group’s interest in the net fair value of the acquiree’s identifiable assets, liabilities and contingent liabilities.
Following initial recognition, goodwill is measured at cost less any accumulated impairment losses.
Goodwill is reviewed for impairment annually or more frequently if events or changes in circumstances indicate that the carrying value may be impaired.
For the purpose of impairment testing, goodwill acquired in a business combination is, from the acquisition date, allocated to each of the Group’s cash-generating units, or groups of cash-generating units, that are expected to benefit from the synergies of the combination, irrespective of whether other assets or liabilities of the Group are assigned to those units or groups of units. Each unit or group of units to which the goodwill is so allocated:
• Represents the lowest level within the Group at which the goodwill is monitored for internal management purposes; and
• Is not larger than a segment based on either the Group’s primary or the Group’s secondary reporting format determined in accordance with AASB 8 Operating Segment.
Impairment is determined by assessing the recoverable amount of the cash-generating unit (group of cash-generating units), to which the goodwill relates. When the recoverable amount of the cash-generating unit (group of cash-generating units) is less than the carrying amount, an impairment loss is recognised. When goodwill forms part of a cash-generating unit (group of cash-generating units) and an operation within that unit is disposed of, the goodwill associated with the operation disposed of is included in the carrying amount of the operation when determining the gain or loss on disposal of the operation. Goodwill disposed of in this manner is measured based on the relative values of the operation disposed of and the portion of the cash-generating unit retained.
Impairment losses recognised for goodwill are not subsequently reversed.
Research and Development
Research costs are expensed as incurred. An intangible asset arising from development expenditure on an internal project is recognised only when the Group can demonstrate the technical feasibility of completing the intangible asset so that it will be available for use or sale, its intention to complete and its ability to use or sell the asset, how the asset will generate future economic benefits, the availability of resources to complete the development. Following the initial recognition of the development expenditure, the cost model is applied requiring the asset to be carried at cost less any accumulated amortisation and accumulated impairment losses. Any expenditure so capitalised is amortised over the period of expected benefit from the related project.
The carrying value of an intangible asset arising from development expenditure is tested for impairment annually when the asset is not yet available for use, or more frequently when an indication of impairment arises during the reporting .
Research and development costs in relation to the Jabiru-1 project are capitalised if they meet the conditions set out in AASB 138 ‘Intangible Assets’ which are that development costs are only capitalised once a business case has been demonstrated as to the technical feasibility and commercial viability. Capitalised development costs are amortised over the expected useful life of the asset.
Where the conditions are not met the costs are expensed through the statement of comprehensive income.
(p) Investments and other financial assets (continued)
2 Basis of Preparation and Accounting Policies (Continued)
For
per
sona
l use
onl
y

42 NewSat Limited 2010 Annual Report
Notes to the Consolidated Financial Statements (Continued)
For the year ending 30 June 2010
NewSat Limited 2010 Annual Report 43
If an equity-settled award is cancelled, it is treated as if it had vested on the date of cancellation, and any expense not yet recognised for the award is recognised immediately. However, if a new award is substituted for the cancelled award and designated as a replacement award on the date that it is granted, the cancelled and new award are treated as if they were a modification of the original award, as described in the previous paragraph.
The dilutive effect, if any, of outstanding options is reflected as additional share dilution in the computation of earnings per share (see note 8).
(y) Contributed equity
Ordinary shares are classified as equity. Incremental costs directly attributable to the issue of new shares or options are shown in equity as a deduction, net of tax, from the proceeds.
(z) Earnings per share
Basic earnings per share is calculated as net profit attributable to members of the parent, adjusted to exclude any costs of servicing equity (other than dividends) and preference share dividends, divided by the weighted average number of ordinary shares, adjusted for any bonus element.
Diluted earnings per share is calculated as net profit attributable to members of the parent, adjusted for:
• Costs of servicing equity (other than dividends) and preference share dividends;
• The after tax effect of dividends and interest associated with dilutive potential ordinary shares that have been recognised as expenses;
• Other non-discretionary changes in revenues or expenses during the period that would result from the dilution of potential ordinary shares; and
• Divided by the weighted average number of ordinary shares and dilutive potential ordinary shares, adjusted for any bonus element.
(aa) Comparatives
Where necessary, comparative figures have been adjusted to conform with changes in the presentation in the current period.
(ab) Operating Segments
An operating segment is a component of an entity that engages in business activities from which it may earn revenues and incur expenses (including revenues and expenses relating to transactions with other components of the same entity), whose operating results are regularly reviewed by the entity’s chief operating decision maker to make decisions about resources to be allocated to the segment and assess its performance and for which discrete financial information is available. This includes start up operations which are yet to earn revenues. Management will also consider other factors in determining operating segments such as the existence of a line manager and the level of segment information presented to the board of directors.
Operating segments have been identified based on the information provided to the chief operating decision makers – being the executive management team.
The group aggregates two or more operating segments when they have similar economic characteristics, and the segments are similar in each of the following respects:
• Nature of the products and services;
• Nature of the production processes;
• Type or class of customer for the products and services;
• Methods used to distribute the products or provide the services; and if applicable
• Nature of the regulatory environment.
Operating segments that meet the quantitative criteria as prescribed by AASB 8 are reported separately. However, an operating segment that does not meet the quantitative criteria is still reported separately where information about the segment would be useful to users of the financial statements. Information about other business activities and operating segments that are below the quantitative criteria are combined and disclosed in a separate category for ‘all other segments’.
(v) Employee leave benefits
(i) Wages, salaries, annual leave and sick leave
Liabilities for wages and salaries, including non-monetary benefits, annual leave and (accumulating sick leave) expected to be settled within 12 months of the reporting date are recognised in other payables in respect of employees’ services up to the reporting date. They are measured at the amounts expected to be paid when the liabilities are settled. Liabilities for non-accumulating sick leave are recognised when the leave is taken and are measured at the rates paid or payable.
(ii) Long service leave
The liability for long service leave is recognised in the provision for employee benefits and measured as the present value of expected future payments to be made in respect of services provided by employees up to the reporting date using the projected unit credit method. Consideration is given to expected future wage and salary levels, experience of employee departures, and periods of service. Expected future payments are discounted using market yields at the reporting date on national government bonds with terms to maturity and currencies that match, as closely as possible, the estimated future cash outflows.
(w) Other post-employment benefits
Contributions are made by the Group to employee superannuation funds and are charged as expenses when incurred. Contributions are made by the Group in accordance with statutory requirements of each jurisdiction. Contributions by the Group of up to 9% of employee’s wages and salaries are legally enforceable in Australia.
(x) Share-based payment transactions
The Group provides benefits to employees (including senior executives) of the Group in the form of share-based payments, whereby employees render services in exchange for shares or rights over shares (equity-settled transactions).
There are currently two plans in place to provide these benefits:
(i) The Executive Officer Option Plan No.3 (EOOP), which provides benefits to directors and senior executives, and
(ii) The Staff Share Option Plan (SSOP), which provides benefits to all employees, excluding senior executives and directors.
Each of these plans has been approved by the Remuneration Committee in a general meeting. Under the Employee Option Plan, the board may offer options to any full time employee.
The cost of these equity-settled transactions with employees is measured by reference to the fair value of the equity instruments at the date at which they are granted. The fair value is determined by an external valuer using a binomial pricing model, further details of which are given in note 16.
In valuing equity-settled transactions, no account is taken of any performance conditions, other than conditions linked to the price of the shares of NewSat Limited (market conditions).
The cost of equity-settled transactions is recognised, together with a corresponding increase in equity, over the period in which the performance and/or service conditions are fulfilled, ending on the date on which the relevant employees become fully entitled to the award (the vesting period).
The cumulative expense recognised for equity-settled transactions at each reporting date until vesting date reflects (i) the extent to which the vesting period has expired and (ii) the Group’s best estimate of the number of equity instruments that will ultimately vest. No adjustment is made for the likelihood of market performance conditions being met as the effect of these conditions is included in the determination of fair value at grant date. The statement of comprehensive income charge or credit for a period represents the movement in cumulative expense recognised as at the beginning and end of that period.
No expense is recognised for awards that do not ultimately vest, except for awards where vesting is only conditional upon a market condition.
If the terms of an equity-settled award are modified, as a minimum an expense is recognised as if the terms had not been modified. In addition, an expense is recognised for any modification that increases the total fair value of the share-based payment arrangement, or is otherwise beneficial to the employee, as measured at the date of modification.
2 Basis of Preparation and Accounting Policies (Continued)
For
per
sona
l use
onl
y

44 NewSat Limited 2010 Annual Report
Notes to the Consolidated Financial Statements (Continued)
For the year ending 30 June 2010
NewSat Limited 2010 Annual Report 45
The consolidated entity held the following financial instruments at the reporting date:
Note
Year ended 30 June 2010
$’000
Year ended 30 June 2009
$’000
Financial Assets
Cash and Cash equivalents 9 4,968 1,927
Trade and other receivables 10 3,825 2,944
Other financial assets 12 784 359
9,577 5,230
Financial Liabilities
Trade and other payables 17 6,157 4,396
6,157 4,396
(a) Credit Risk
Credit risk arises from the financial assets of the Group, which comprise cash and cash equivalents, trade and other receivables, available-for-sale financial assets and derivative instruments. The Group’s exposure to credit risk arises from potential default of the counter party, with a maximum exposure equal to the carrying amount of these instruments. Exposure at reporting date is addressed in each applicable note.
The Group does not hold any credit derivatives to offset its credit exposure.
The Group trades only with recognised, creditworthy third parties, and as such collateral is not requested nor is it the Group’s policy to securitise its trade and other receivables.
It is the Group’s policy that all customers who wish to trade on credit terms are subject to credit verification procedures including an assessment of their independent credit rating, financial position, past experience and industry reputation. Risk limits are set for each individual customer in accordance with parameters set by the board. These risk limits are regularly monitored.
In addition, receivable balances are monitored on an ongoing basis with the result that the Group’s exposure to bad debts is not significant. There are no significant concentrations of credit risk within the Group. The credit risk relating to cash on hand and cash equivalents and other financial assets is limited because the counterparty is a bank with high credit ratings assigned by international credit rating agencies.
For transactions that are not denominated in the functional currency of the relevant operating unit, the Group does not offer credit terms without the specific approval of the CFO.
(b) Foreign Currency Risk
The Group’s invoices significant contract revenues in United States Dollars (USD). It is the Group’s policy to match sales directly with purchases of satellite space capacity also denominated in USD. For sales denominated in other currencies where costs are either USD or AUD based, the foreign exchange risk is not considered significant.
Unrealised foreign exchange gains/losses arise on the revaluation of USD denominated working capital (monetary asset) balances at reporting dates. The foreign exchange risks associated to this are not actively hedged as they are considered to be a financial statement reporting risk (albeit not material) rather than an operational risk.
(c) Liquidity Risk
Liquidity risk is the risk that the consolidated entity will encounter difficulty in meeting obligations associated with financial liabilities. The Group’s objective is to maintain a balance between continuity of funding and flexibility through the use of bank overdrafts, bank loans, preference shares, finance leases and committed available credit lines.
The table below reflects all contractually fixed pay-offs and receivables for settlement, repayments and interest resulting from recognised financial assets and liabilities as of 30 June 2010.
3 Parent Entity Information(a) Financial Information relating to NewSat Ltd:
Parent
Year ended 30 June 2010
$’000
Year ended 30 June 2009
$’000
Current assets 1,027 1,600
Total assets 13,488 15,882
Current liabilities 2,314 1,162
Total liabilities 2,314 14,664
Contributed equity 125,844 122,137
Retained earnings (112,167) (108,779)
Other reserves 1,396 1,306
Total shareholders’ equity 11,174 14,664
Profit or loss of the parent entity (3,898) (672)
Total comprehensive income of the parent entity (3,898) (672)
(b) Other information
Contingent assets and liabilities of the parent entity. Refer to note 24 for discussion of the company’s contingent assets and liabilities.
4 Financial Risk ManagementThe Group’s principal financial instruments comprise receivables, cash and short-term deposits and payables.
The Group manages its exposure to key financial risks, including interest rate risk and currency risk in accordance with the Group’s financial risk management policy. The objective of the policy is to support the delivery of the Group’s financial targets whilst protecting future financial security.
The risks arising from the Group’s financial instruments are interest rate risk, foreign currency risk, credit risk and liquidity risk. Of these risks, only credit risk and liquidity risk are of material impact to the Group and as a result no sensitivity analysis has been performed on market risks.
The Group does not enter into derivative transactions, principally interest rate swaps and forward currency options as none of these items are material on everyday operations of the business.
The Group uses different methods to measure and manage different types of risk to which it is exposed. These include monitoring levels of exposure to interest rate and foreign exchange risk and assessments of market forecasts for interest rate and foreign exchange. Ageing analyses and monitoring of specific credit allowances are undertaken to manage credit risk, liquidity risk is monitored through the development of future rolling cash flow forecasts.
The Board reviews and agrees polices for managing each of these risks as summarised below.
Risk management is carried out by the consolidated entity’s Risk Management Committee under policies approved by the CFO and Board of Directors. The Committee identifies, evaluates and manages financial risks in close co-operation with the consolidated entity’s operating units. The CFO provides written principles for overall risk management, as well as policies covering specific areas, such as those identified above.
For
per
sona
l use
onl
y
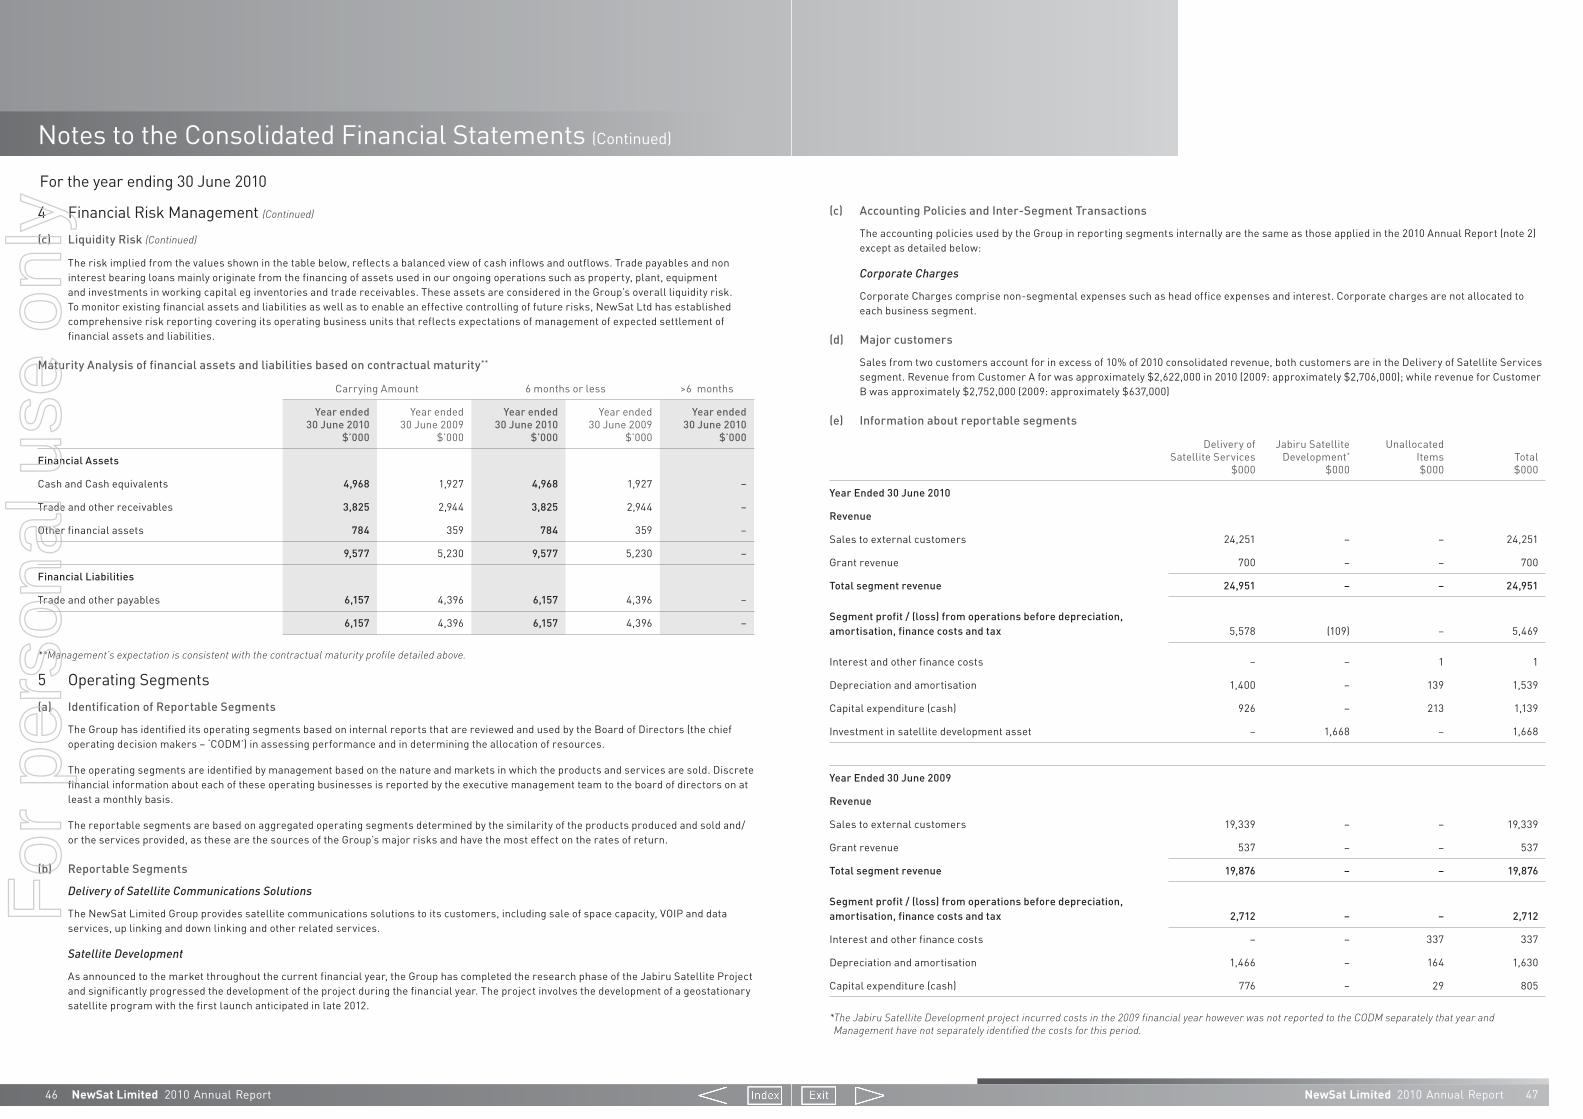
46 NewSat Limited 2010 Annual Report
Notes to the Consolidated Financial Statements (Continued)
For the year ending 30 June 2010
NewSat Limited 2010 Annual Report 47
(c) Accounting Policies and Inter-Segment Transactions
The accounting policies used by the Group in reporting segments internally are the same as those applied in the 2010 Annual Report (note 2) except as detailed below:
Corporate Charges
Corporate Charges comprise non-segmental expenses such as head office expenses and interest. Corporate charges are not allocated to each business segment.
(d) Major customers
Sales from two customers account for in excess of 10% of 2010 consolidated revenue, both customers are in the Delivery of Satellite Services segment. Revenue from Customer A for was approximately $2,622,000 in 2010 (2009: approximately $2,706,000); while revenue for Customer B was approximately $2,752,000 (2009: approximately $637,000)
(e) Information about reportable segments
Delivery of Satellite Services
$000
Jabiru Satellite Development*
$000
Unallocated Items $000
Total $000
Year Ended 30 June 2010
Revenue
Sales to external customers 24,251 – – 24,251
Grant revenue 700 – – 700
Total segment revenue 24,951 – – 24,951
Segment profit / (loss) from operations before depreciation, amortisation, finance costs and tax 5,578 (109) – 5,469
Interest and other finance costs – – 1 1
Depreciation and amortisation 1,400 – 139 1,539
Capital expenditure (cash) 926 – 213 1,139
Investment in satellite development asset – 1,668 – 1,668
Year Ended 30 June 2009
Revenue
Sales to external customers 19,339 – – 19,339
Grant revenue 537 – – 537
Total segment revenue 19,876 – – 19,876
Segment profit / (loss) from operations before depreciation, amortisation, finance costs and tax 2,712 – – 2,712
Interest and other finance costs – – 337 337
Depreciation and amortisation 1,466 – 164 1,630
Capital expenditure (cash) 776 – 29 805
*TheJabiruSatelliteDevelopmentprojectincurredcostsinthe2009financialyearhoweverwasnotreportedtotheCODMseparatelythatyearandManagementhavenotseparatelyidentifiedthecostsforthisperiod.
The risk implied from the values shown in the table below, reflects a balanced view of cash inflows and outflows. Trade payables and non interest bearing loans mainly originate from the financing of assets used in our ongoing operations such as property, plant, equipment and investments in working capital eg inventories and trade receivables. These assets are considered in the Group’s overall liquidity risk. To monitor existing financial assets and liabilities as well as to enable an effective controlling of future risks, NewSat Ltd has established comprehensive risk reporting covering its operating business units that reflects expectations of management of expected settlement of financial assets and liabilities.
Maturity Analysis of financial assets and liabilities based on contractual maturity**
Carrying Amount 6 months or less >6 months
Year ended 30 June 2010
$’000
Year ended 30 June 2009
$’000
Year ended 30 June 2010
$’000
Year ended 30 June 2009
$’000
Year ended 30 June 2010
$’000
Financial Assets
Cash and Cash equivalents 4,968 1,927 4,968 1,927 –
Trade and other receivables 3,825 2,944 3,825 2,944 –
Other financial assets 784 359 784 359 –
9,577 5,230 9,577 5,230 –
Financial Liabilities
Trade and other payables 6,157 4,396 6,157 4,396 –
6,157 4,396 6,157 4,396 –
**Management’sexpectationisconsistentwiththecontractualmaturityprofiledetailedabove.
5 Operating Segments(a) Identification of Reportable Segments
The Group has identified its operating segments based on internal reports that are reviewed and used by the Board of Directors (the chief operating decision makers – ‘CODM’) in assessing performance and in determining the allocation of resources.
The operating segments are identified by management based on the nature and markets in which the products and services are sold. Discrete financial information about each of these operating businesses is reported by the executive management team to the board of directors on at least a monthly basis.
The reportable segments are based on aggregated operating segments determined by the similarity of the products produced and sold and/or the services provided, as these are the sources of the Group’s major risks and have the most effect on the rates of return.
(b) Reportable Segments
Delivery of Satellite Communications Solutions
The NewSat Limited Group provides satellite communications solutions to its customers, including sale of space capacity, VOIP and data services, up linking and down linking and other related services.
Satellite Development
As announced to the market throughout the current financial year, the Group has completed the research phase of the Jabiru Satellite Project and significantly progressed the development of the project during the financial year. The project involves the development of a geostationary satellite program with the first launch anticipated in late 2012.
4 Financial Risk Management (Continued)
(c) Liquidity Risk (Continued)
For
per
sona
l use
onl
y

48 NewSat Limited 2010 Annual Report
Notes to the Consolidated Financial Statements (Continued)
For the year ending 30 June 2010
NewSat Limited 2010 Annual Report 49
Year ended 30 June 2010
$’000
Year ended 30 June 2009
$’000
(c) Employee benefits expense
Wages and salaries 4,991 5,102
Workers’ compensation costs 23 41
Defined contribution plan expense 455 472
Long service leave provision 138 29
Employee benefits expense (cash settled) 5,607 5,644
Share-based payments expense 99 193
Employee benefits expense (cash and equity settled) 5,706 5,837
(d) Occupancy expenses
Operating lease expense 390 468
Other occupancy expense 78 77
Total occupancy expenses 468 545
(e) Other expenses
Consulting fees 362 108
Audit and tax fees 186 177
Insurance 232 271
Legal fees 294 224
Director fees 268 272
Travel expenses 398 456
Repair & maintenance 68 120
Administrative expense 440 1,255
Foreign currency loss / (gain) 369 84
2,617 2,967
(f) Depreciation and amortisation
Amortisation of intangible assets 50 81
Depreciation 1,489 1,549
1,539 1,630
(g) Finance costs
Interest on other loans (including convertible notes) – 12
Finance charges payable under finance leases and hire purchase contracts 1 4
Equity facility extension fee (equity settled) – 321
Total finance costs 1 337
(f) Reconciliation of reportable segment revenues and profit or loss
Revenue
Year ended 30 June 2010
$’000
Year ended 30 June 2009
$’000
Total segment revenue 24,951 19,876
Interest revenue 83 29
Consolidated revenue 25,034 19,905
Profit / (loss) from operations before income tax
Year ended 30 June 2010
$’000
Year ended 30 June 2009
$’000
Reported segment profit / (loss) from operations before depreciation, amortisation, finance costs and tax 5,469 2,712
Unallocated items:
Share based payments charge (99) (193)
Foreign exchange gains / (losses) (369) 84
Unallocated amounts – other corporate expenses (3,435) (3,596)
Profit / (loss) from operations before depreciation, amortisation, finance costs and tax per the Statement of Comprehensive Income 1,566 (993)
Depreciation and amortisation (1,539) (1,630)
Finance costs (1) (337)
Profit / (loss) from operations before income tax per the Statement of Comprehensive Income 26 (2,960)
6 Revenue, Income and ExpensesYear ended
30 June 2010 $’000
Year ended 30 June 2009
$’000
(a) Revenue
Sale of goods 1,134 742
Rendering of services 23,116 18,597
Government grants 701 537
Finance revenue 83 29
25,034 19,905
(b) Other income
Export Marketing Development Grant 22 160
22 160
5 Operating Segments (Continued)
For
per
sona
l use
onl
y
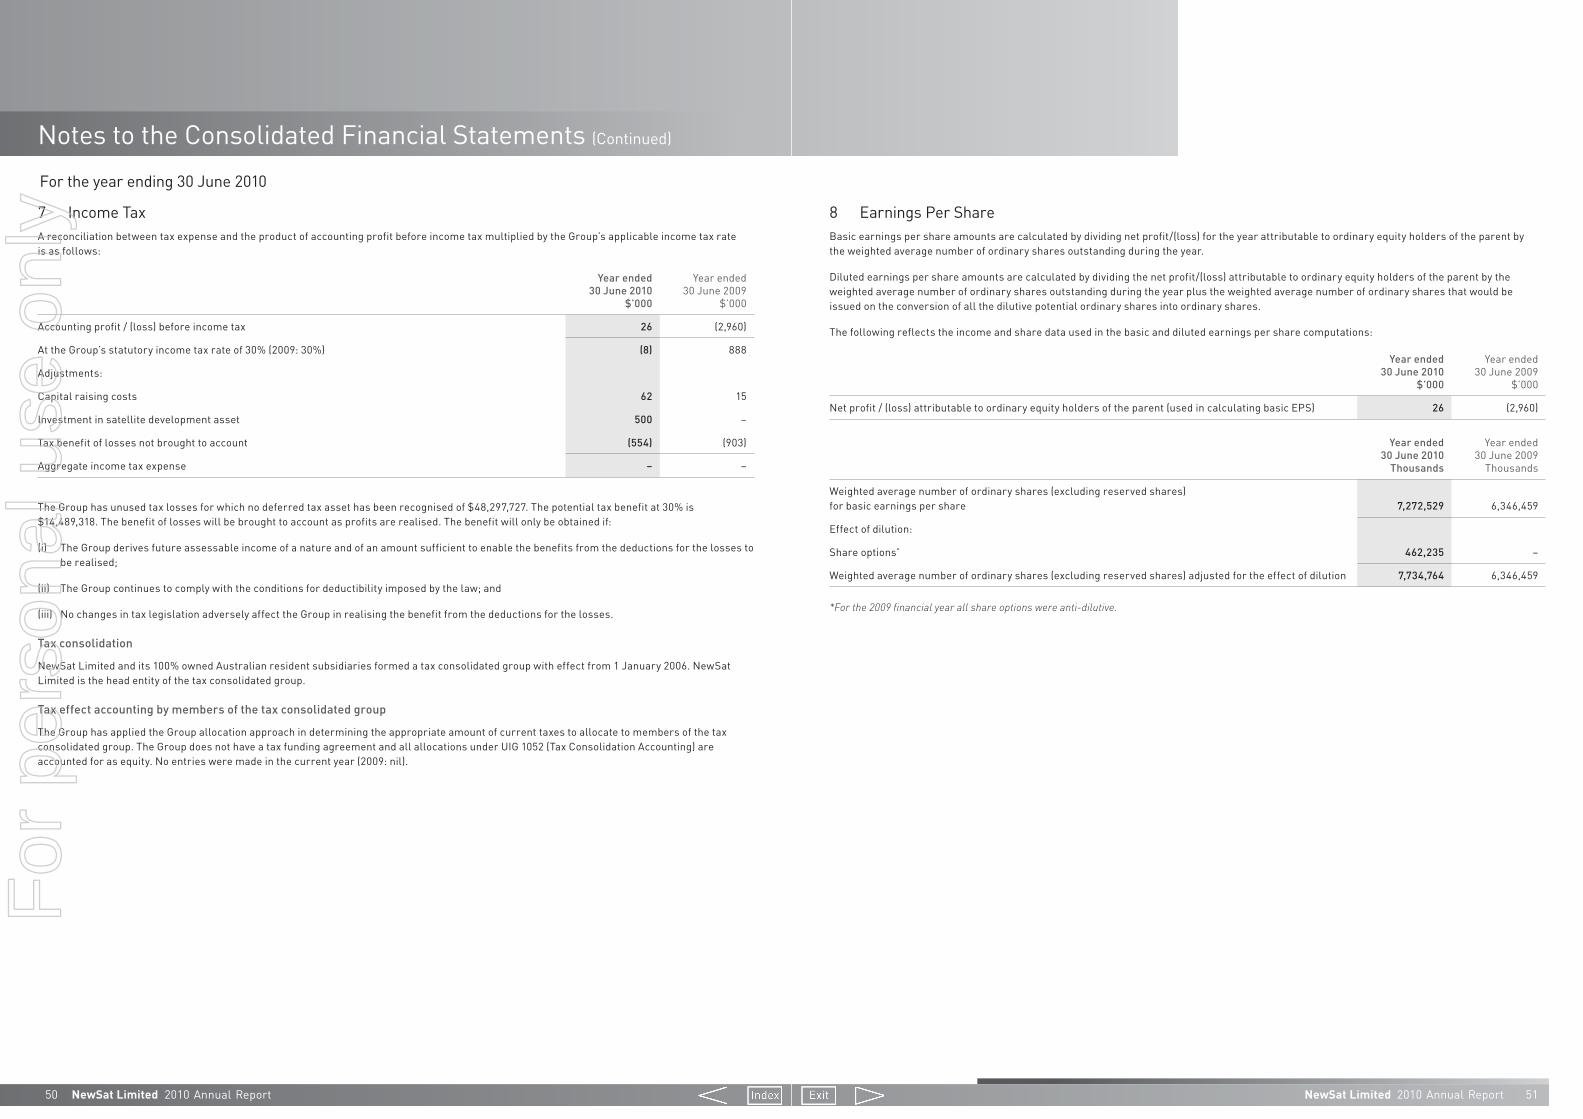
50 NewSat Limited 2010 Annual Report
Notes to the Consolidated Financial Statements (Continued)
For the year ending 30 June 2010
NewSat Limited 2010 Annual Report 51
8 Earnings Per ShareBasic earnings per share amounts are calculated by dividing net profit/(loss) for the year attributable to ordinary equity holders of the parent by the weighted average number of ordinary shares outstanding during the year.
Diluted earnings per share amounts are calculated by dividing the net profit/(loss) attributable to ordinary equity holders of the parent by the weighted average number of ordinary shares outstanding during the year plus the weighted average number of ordinary shares that would be issued on the conversion of all the dilutive potential ordinary shares into ordinary shares.
The following reflects the income and share data used in the basic and diluted earnings per share computations:
Year ended 30 June 2010
$’000
Year ended 30 June 2009
$’000
Net profit / (loss) attributable to ordinary equity holders of the parent (used in calculating basic EPS) 26 (2,960)
Year ended 30 June 2010
Thousands
Year ended 30 June 2009
Thousands
Weighted average number of ordinary shares (excluding reserved shares) for basic earnings per share 7,272,529 6,346,459
Effect of dilution:
Share options* 462,235 –
Weighted average number of ordinary shares (excluding reserved shares) adjusted for the effect of dilution 7,734,764 6,346,459
*Forthe2009financialyearallshareoptionswereanti-dilutive.
7 Income TaxA reconciliation between tax expense and the product of accounting profit before income tax multiplied by the Group’s applicable income tax rate is as follows:
Year ended 30 June 2010
$’000
Year ended 30 June 2009
$’000
Accounting profit / (loss) before income tax 26 (2,960)
At the Group’s statutory income tax rate of 30% (2009: 30%) (8) 888
Adjustments:
Capital raising costs 62 15
Investment in satellite development asset 500 –
Tax benefit of losses not brought to account (554) (903)
Aggregate income tax expense – –
The Group has unused tax losses for which no deferred tax asset has been recognised of $48,297,727. The potential tax benefit at 30% is $14,489,318. The benefit of losses will be brought to account as profits are realised. The benefit will only be obtained if:
(i) The Group derives future assessable income of a nature and of an amount sufficient to enable the benefits from the deductions for the losses to be realised;
(ii) The Group continues to comply with the conditions for deductibility imposed by the law; and
(iii) No changes in tax legislation adversely affect the Group in realising the benefit from the deductions for the losses.
Tax consolidation
NewSat Limited and its 100% owned Australian resident subsidiaries formed a tax consolidated group with effect from 1 January 2006. NewSat Limited is the head entity of the tax consolidated group.
Tax effect accounting by members of the tax consolidated group
The Group has applied the Group allocation approach in determining the appropriate amount of current taxes to allocate to members of the tax consolidated group. The Group does not have a tax funding agreement and all allocations under UIG 1052 (Tax Consolidation Accounting) are accounted for as equity. No entries were made in the current year (2009: nil).
For
per
sona
l use
onl
y

52 NewSat Limited 2010 Annual Report
Notes to the Consolidated Financial Statements (Continued)
For the year ending 30 June 2010
NewSat Limited 2010 Annual Report 53
10 Trade and other ReceivablesYear ended
30 June 2010 $’000
Year ended 30 June 2009
$’000
Current
Trade receivables 4,810 3,929
Allowance for impairment loss (a) (985) (985)
3,825 2,944
(a) Allowance for impairment loss
Trade receivables are non-interest bearing and are generally on 7-30 day terms. A provision for impairment loss is recognised when there is objective evidence that an individual trade receivable is impaired. A nil net impairment loss (2009: $287,000) has been recognised by the Group.
Movements in the provision for impairment loss were as follows:
Year ended 30 June 2010
$’000
Year ended 30 June 2009
$’000
At 1st July 2009 985 698
Charge for the year – 287
At 30th June 2010 985 985
At 30 June 2010, the ageing analysis of trade receivables is as follows:
Total 0-30 days 31-60 days61-90 days
PDNI*61-90 days
CI*90+ days
PDNI*90+ days
CI*
2010 Consolidated 4,810 2,079 968 30 – 748 985
2009 Consolidated 3,929 2,094 292 30 29 528 956
*Pastduenotimpaired(‘PDNI’)Consideredimpaired(‘CI’)
Receivables past due but not considered impaired are : Consolidated $778,000 (2009: $558,000). Each operating unit has been in direct contact with the relevant debtor and is satisfied that payment will be received in full or related trade payables will be offset with the customer. Other balances within trade and other receivables do not contain impaired assets and are not past due. It is expected that these other balances will be received when due.
Also the Group has no significant concentrations of credit risk. The Group has policy to ensure all sales of products and services are made to customers with an appropriate credit history.
(b) Related party receivables
No interest is charged on loan to wholly owned group entities. For terms and conditions relating to related party receivables refer to note 25.
9 Cash and Cash EquivalentsYear ended
30 June 2010 $’000
Year ended 30 June 2009
$’000
Cash at bank and in hand 2,940 1,927
Short-term deposits 2,028 –
4,968 1,927
Reconciliation to Cash Flow Statement
For the purposes of the Cash Flow Statement, cash and cash equivalents comprise the following at 30 June:
Cash at bank and short-term deposits 4,968 1,927
4,968 1,927
Reconciliation of net loss after tax to net cash flows from operations
Net profit / (loss) 26 (2,960)
Adjustments for:
Depreciation 1,489 1,549
Amortisation of intangibles 50 81
Stock adjustment – (97)
Interest on convertible notes (inc. facility extension fee) – 321
Interest expense – 12
Government grant (680) (537)
Share options expensed 99 193
Changes in assets and liabilities
(Increase)/decrease in inventories (313) 48
(Increase)/decrease in trade and other receivables (1,619) (1,151)
(Increase)/decrease in prepayments (165) (12)
(Decrease)/increase in trade and other payables 2,933 1,968
(Decrease)/increase in provisions 330 554
Net cash from (used in) operating activities 2,151 (31)
For
per
sona
l use
onl
y

54 NewSat Limited 2010 Annual Report
Notes to the Consolidated Financial Statements (Continued)
For the year ending 30 June 2010
NewSat Limited 2010 Annual Report 55
Freehold land, buildings and
leasehold improvements
$’000
Plant and equipment
$’000Total
$’000
Year ended 30 June 2009
At 1 July 2008, net of accumulated depreciation and impairment 3,144 4,495 7,639
Additions 3 855 858
Other Adjustment – 48 48
Depreciation charge for the year (111) (1,438) (1,549)
At 30 June 2009, net of accumulated depreciation and impairment 3,036 3,960 6,996
At 1 July 2008
Cost or fair value 4,099 12,706 16,805
Accumulated depreciation and impairment (955) (8,211) (9,166)
Net carrying amount 3,144 4,495 7,639
At 30 June 2009
Cost or fair value 4,102 13,609 17,711
Accumulated depreciation and impairment (1,066) (9,649) (10,715)
Net carrying amount 3,036 3,960 6,996
(b) Additional information
The useful life of the assets was estimated as follows both for 2009 and 2010:
Land Indefinite useful life (not depreciated)
Buildings 15 years
Leasehold improvements Lease term
Plant and equipment 2 to 5 years
In May 2008, NewSat obtained a 3rd party valuation by Herron, Todd & White Pty Ltd for the Land and Buildings asset class. The total amount of this new valuation was $3,945,000. The uplift in this asset value of $1,734,797 was recorded to the Asset Revaluation Reserve in the Equity account.
During the 2008 financial year, NewSat obtained an independent 3rd party ‘new for old’ replacement valuation of the plant and equipment asset class, by industry technical experts from Consulted IT&T Pty Ltd. The total amount of the valuation was $18,716,415 as at 30 June 2008. Replacement valuation is not an acceptable method of valuing assets in accordance with AASB 116 ‘Property, Plant and Equipment’ and therefore this amount has not been reflected in the financial statements, but has been included here for information purposes only.
11 InventoriesYear ended
30 June 2010 $’000
Year ended 30 June 2009
$’000
Finished goods (at net realisable value) 909 597
Total inventories on hand 909 597
Inventory expense
Inventories recognised as an expense for the year ended 30 June 2010 total $672,009 (2009:$312,890) for the Group.
12 Other Financial AssetsYear ended
30 June 2010 $’000
Year ended 30 June 2009
$’000
Current
Short term bank guarantee deposit 163 221
Other financial deposit 621 138
784 359
13 Property, Plant and Equipment(a) Movement in property, plant and equipment
Freehold land, buildings and
leasehold improvements
$’000
Plant and equipment
$’000Total
$’000
Year ended 30 June 2010
At 1 July 2009, net of accumulated depreciation and impairment 3,036 3,960 6,996
Additions 18 1,227 1,245
Depreciation charge for the year (110) (1,379) (1,489)
At 30 June 2010, net of accumulated depreciation and impairment 2,944 3,808 6,752
At 1 July 2009
Cost or fair value 4,102 13,609 17,711
Accumulated depreciation and impairment (1,066) (9,649) (10,715)
Net carrying amount 3,036 3,960 6,996
At 30 June 2010
Cost or fair value 4,120 14,836 18,956
Accumulated depreciation and impairment (1,176) (11,028) (12,204)
Net carrying amount 2,944 3,808 6,752
For
per
sona
l use
onl
y
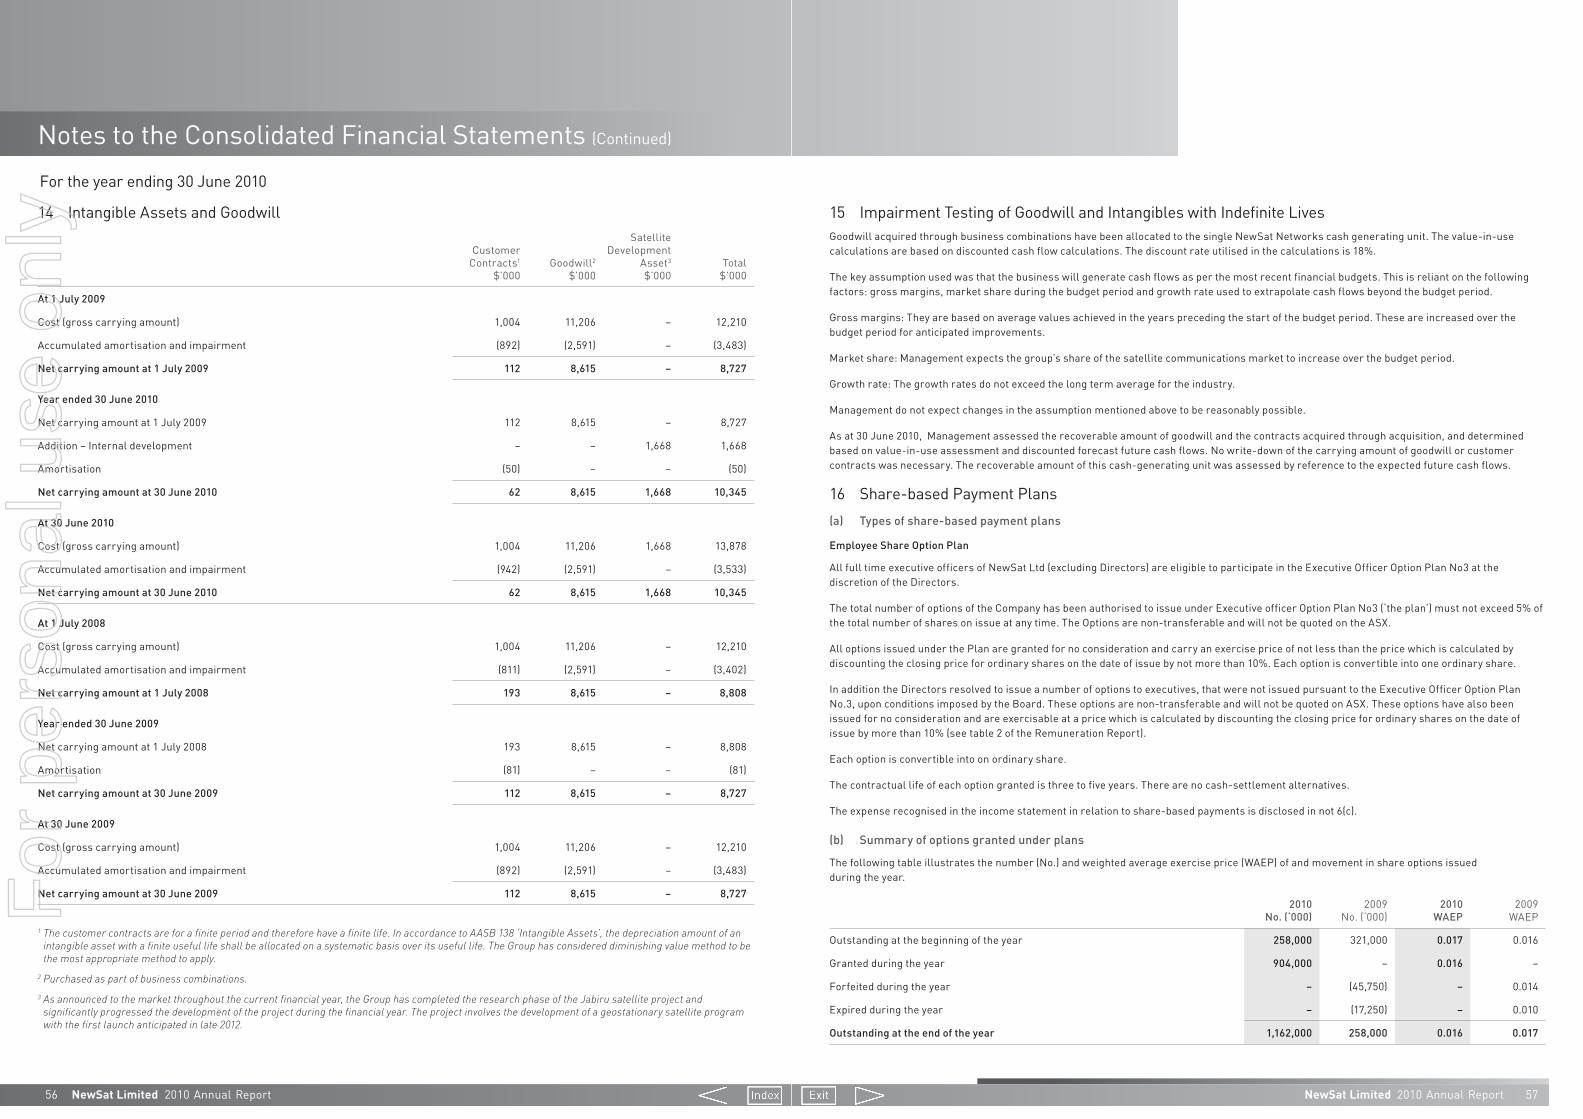
56 NewSat Limited 2010 Annual Report
Notes to the Consolidated Financial Statements (Continued)
For the year ending 30 June 2010
NewSat Limited 2010 Annual Report 57
15 Impairment Testing of Goodwill and Intangibles with Indefinite LivesGoodwill acquired through business combinations have been allocated to the single NewSat Networks cash generating unit. The value-in-use calculations are based on discounted cash flow calculations. The discount rate utilised in the calculations is 18%.
The key assumption used was that the business will generate cash flows as per the most recent financial budgets. This is reliant on the following factors: gross margins, market share during the budget period and growth rate used to extrapolate cash flows beyond the budget period.
Gross margins: They are based on average values achieved in the years preceding the start of the budget period. These are increased over the budget period for anticipated improvements.
Market share: Management expects the group’s share of the satellite communications market to increase over the budget period.
Growth rate: The growth rates do not exceed the long term average for the industry.
Management do not expect changes in the assumption mentioned above to be reasonably possible.
As at 30 June 2010, Management assessed the recoverable amount of goodwill and the contracts acquired through acquisition, and determined based on value-in-use assessment and discounted forecast future cash flows. No write-down of the carrying amount of goodwill or customer contracts was necessary. The recoverable amount of this cash-generating unit was assessed by reference to the expected future cash flows.
16 Share-based Payment Plans(a) Types of share-based payment plans
Employee Share Option Plan
All full time executive officers of NewSat Ltd (excluding Directors) are eligible to participate in the Executive Officer Option Plan No3 at the discretion of the Directors.
The total number of options of the Company has been authorised to issue under Executive officer Option Plan No3 (‘the plan’) must not exceed 5% of the total number of shares on issue at any time. The Options are non-transferable and will not be quoted on the ASX.
All options issued under the Plan are granted for no consideration and carry an exercise price of not less than the price which is calculated by discounting the closing price for ordinary shares on the date of issue by not more than 10%. Each option is convertible into one ordinary share.
In addition the Directors resolved to issue a number of options to executives, that were not issued pursuant to the Executive Officer Option Plan No.3, upon conditions imposed by the Board. These options are non-transferable and will not be quoted on ASX. These options have also been issued for no consideration and are exercisable at a price which is calculated by discounting the closing price for ordinary shares on the date of issue by more than 10% (see table 2 of the Remuneration Report).
Each option is convertible into on ordinary share.
The contractual life of each option granted is three to five years. There are no cash-settlement alternatives.
The expense recognised in the income statement in relation to share-based payments is disclosed in not 6(c).
(b) Summary of options granted under plans
The following table illustrates the number (No.) and weighted average exercise price (WAEP) of and movement in share options issued during the year.
2010 No. (‘000)
2009 No. (‘000)
2010 WAEP
2009 WAEP
Outstanding at the beginning of the year 258,000 321,000 0.017 0.016
Granted during the year 904,000 – 0.016 –
Forfeited during the year – (45,750) – 0.014
Expired during the year – (17,250) – 0.010
Outstanding at the end of the year 1,162,000 258,000 0.016 0.017
14 Intangible Assets and Goodwill
Customer Contracts1
$’000Goodwill2
$’000
Satellite Development
Asset3
$’000Total
$’000
At 1 July 2009
Cost (gross carrying amount) 1,004 11,206 – 12,210
Accumulated amortisation and impairment (892) (2,591) – (3,483)
Net carrying amount at 1 July 2009 112 8,615 – 8,727
Year ended 30 June 2010
Net carrying amount at 1 July 2009 112 8,615 – 8,727
Addition – Internal development – – 1,668 1,668
Amortisation (50) – – (50)
Net carrying amount at 30 June 2010 62 8,615 1,668 10,345
At 30 June 2010
Cost (gross carrying amount) 1,004 11,206 1,668 13,878
Accumulated amortisation and impairment (942) (2,591) – (3,533)
Net carrying amount at 30 June 2010 62 8,615 1,668 10,345
At 1 July 2008
Cost (gross carrying amount) 1,004 11,206 – 12,210
Accumulated amortisation and impairment (811) (2,591) – (3,402)
Net carrying amount at 1 July 2008 193 8,615 – 8,808
Year ended 30 June 2009
Net carrying amount at 1 July 2008 193 8,615 – 8,808
Amortisation (81) – – (81)
Net carrying amount at 30 June 2009 112 8,615 – 8,727
At 30 June 2009
Cost (gross carrying amount) 1,004 11,206 – 12,210
Accumulated amortisation and impairment (892) (2,591) – (3,483)
Net carrying amount at 30 June 2009 112 8,615 – 8,727
1Thecustomercontractsareforafiniteperiodandthereforehaveafinitelife.InaccordancetoAASB138‘IntangibleAssets’,thedepreciationamountofanintangibleassetwithafiniteusefullifeshallbeallocatedonasystematicbasisoveritsusefullife.TheGrouphasconsidereddiminishingvaluemethodtobethemostappropriatemethodtoapply.
2Purchasedaspartofbusinesscombinations.3Asannouncedtothemarketthroughoutthecurrentfinancialyear,theGrouphascompletedtheresearchphaseoftheJabirusatelliteprojectand
significantlyprogressedthedevelopmentoftheprojectduringthefinancialyear.Theprojectinvolvesthedevelopmentofageostationarysatelliteprogramwiththefirstlaunchanticipatedinlate2012.
For
per
sona
l use
onl
y

58 NewSat Limited 2010 Annual Report
Notes to the Consolidated Financial Statements (Continued)
For the year ending 30 June 2010
NewSat Limited 2010 Annual Report 59
18 Deferred incomeYear ended
30 June 2010 $’000
Year ended 30 June 2009
$’000
Kimberly Project deferred income 175 525
Other deferred income 2,546 1,174
Total deferred income 2,721 1,699
During the 2008/2009 financial year, the Group had received a total of $1.8 million of funds from the Western Australian and Federal Government for a rollout of broadband in the Kimberley Region known as the ‘Kimberley Project’.
By definition in the agreement, $1.6 million of the funds to be paid to the Group are considered to be ‘convertible loan’ funds and $200,000 of the funds are defined as grant funds. The convertible loan funds will convert from loan to grant as follows :
(i) $900,000 at the first anniversary (1 November 2008);
(ii) $350,000 at the second anniversary (1 Novovember 2009); and
(iii) $350,000 at the third anniversary (1 November 2010)
As per AASB 120, the Group has adopted the income approach of recognising this government grant, that is, the grant will be taken to income over one or more periods, which in the Group’s case will be over a 36 month term (the expected life of the project). In accordance with this arrangement, during the financial year ended 30 June 2010: $350,000 converted from Loan to Grant (2009: $900,000) and $700,733 was recognised in the Statement of Comprehensive Income (2009: $537,426).
19 Loans, borrowings and government grants
Maturity
Year ended 30 June 2010
$’000
Year ended 30 June 2009
$’000
Non-Interest Bearing
Current
Government Loan converts to Grant October 2009 – 350
Government Loan converts to Grant October 2010 350 330
350 680
Refer to note 18 for information relating to the Kimberly Project (to which these loan liabilities relate).
20 ProvisionsYear ended
30 June 2010 $’000
Year ended 30 June 2009
$’000
Current Liabilities – provisions
Annual leave 596 493
Long service leave 346 269
942 762
Non-Current Liabilities – provisions
Long service leave 172 112
172 112
The weighted average remaining contractual life for the share options outstanding as at 30 June 2010 is between 3 and approximately 5 years (2009: 1 and 4 years).
The range of exercise prices for options outstanding at the end of the year was $0.01-$0.02 (2009: $0.01-$0.02).
(c) Option pricing model
The weighted average fair value of options granted during the year was $0.004 (2009: Nil).
The fair value of the equity-settled share options granted under the option plan is estimated as at the date of grant using a binomial model taking into account the terms and conditions upon which the options were granted.
The following table lists the inputs to the model used for the years ended 30 June 2010 and 30 June 2009:
2010 2009*
Dividend yield (%) nil n/a
Expected volatility (%) 40% – 70% n/a
Risk-free interest rate (%) 5.1% – 5.45% n/a
Expected life of option (years) 3 – 5 n/a
Option exercise price ($) 0.01 – 0.02 n/a
Weighted average share price at grant date ($) 0.004 – 0.005 n/a
The expected life of the options is based on historical data and is not necessarily indicative of exercise patterns that may occur. The expected volatility reflects the assumption that the historical volatility is indicative of future trends, which may also not necessarily be the actual outcome. No other features of options granted were incorporated into the measurement of fair value.
The fair value of the equity-settled options is measured at the grant date using the Binomial option pricing model taking into account the terms and conditions upon which the instruments were granted. The services received and a liability to pay for those services are recognised over the expected vesting period. Until the liability is settled it is remeasured at each reporting date with changes in fair value recognised in profit or loss.
The total share-based payment expense for the year ended at 30 June 2010 was $99,280 (2009: $193,387).
17 Trade and other payablesYear ended
30 June 2010 $’000
Year ended 30 June 2009
$’000
Trade payables 5,940 4,211
Other creditors 217 509
6,157 4,720
Information regarding interest rate, foreign exchange and liquidity risk exposure is set out in note 4.
16 Share-based Payment Plans (Continued)
For
per
sona
l use
onl
y
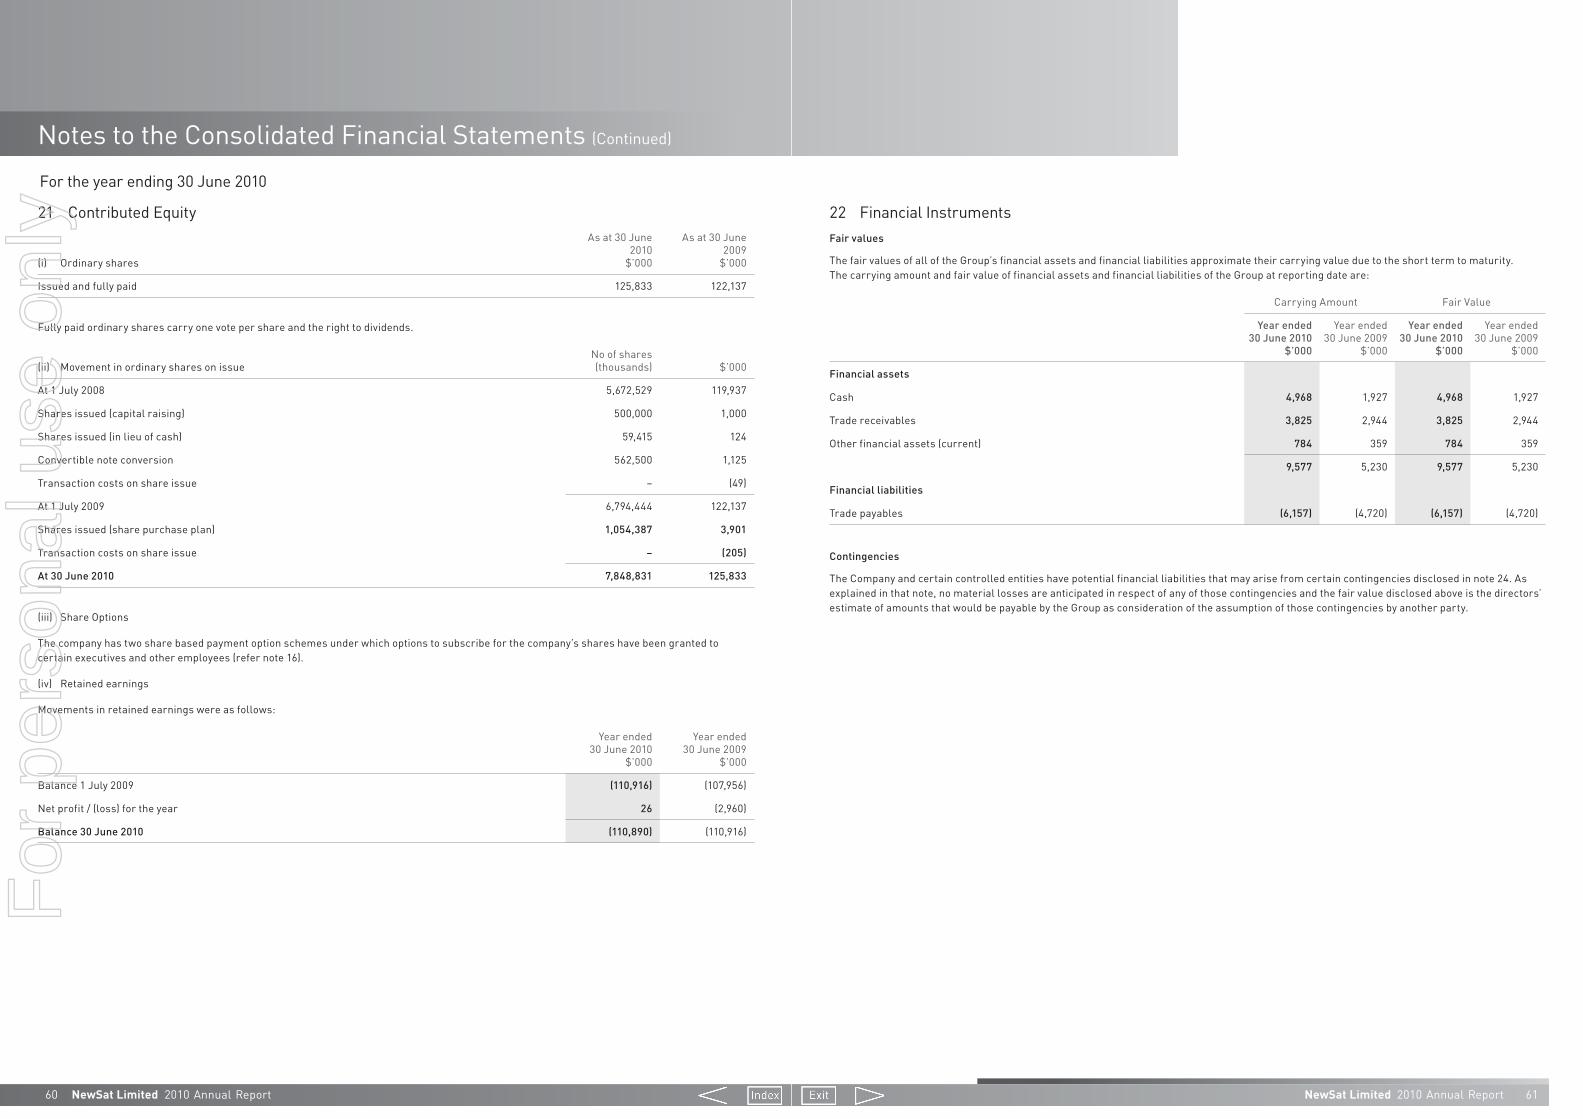
60 NewSat Limited 2010 Annual Report
Notes to the Consolidated Financial Statements (Continued)
For the year ending 30 June 2010
NewSat Limited 2010 Annual Report 61
22 Financial InstrumentsFair values
The fair values of all of the Group’s financial assets and financial liabilities approximate their carrying value due to the short term to maturity. The carrying amount and fair value of financial assets and financial liabilities of the Group at reporting date are:
Carrying Amount Fair Value
Year ended 30 June 2010
$’000
Year ended 30 June 2009
$’000
Year ended 30 June 2010
$’000
Year ended 30 June 2009
$’000
Financial assets
Cash 4,968 1,927 4,968 1,927
Trade receivables 3,825 2,944 3,825 2,944
Other financial assets (current) 784 359 784 359
9,577 5,230 9,577 5,230
Financial liabilities
Trade payables (6,157) (4,720) (6,157) (4,720)
Contingencies
The Company and certain controlled entities have potential financial liabilities that may arise from certain contingencies disclosed in note 24. As explained in that note, no material losses are anticipated in respect of any of those contingencies and the fair value disclosed above is the directors’ estimate of amounts that would be payable by the Group as consideration of the assumption of those contingencies by another party.
21 Contributed Equity
(i) Ordinary shares
As at 30 June 2010
$’000
As at 30 June 2009
$’000
Issued and fully paid 125,833 122,137
Fully paid ordinary shares carry one vote per share and the right to dividends.
(ii) Movement in ordinary shares on issueNo of shares (thousands) $’000
At 1 July 2008 5,672,529 119,937
Shares issued (capital raising) 500,000 1,000
Shares issued (in lieu of cash) 59,415 124
Convertible note conversion 562,500 1,125
Transaction costs on share issue – (49)
At 1 July 2009 6,794,444 122,137
Shares issued (share purchase plan) 1,054,387 3,901
Transaction costs on share issue – (205)
At 30 June 2010 7,848,831 125,833
(iii) Share Options
The company has two share based payment option schemes under which options to subscribe for the company’s shares have been granted to certain executives and other employees (refer note 16).
(iv) Retained earnings
Movements in retained earnings were as follows:
Year ended 30 June 2010
$’000
Year ended 30 June 2009
$’000
Balance 1 July 2009 (110,916) (107,956)
Net profit / (loss) for the year 26 (2,960)
Balance 30 June 2010 (110,890) (110,916)
For
per
sona
l use
onl
y

62 NewSat Limited 2010 Annual Report
Notes to the Consolidated Financial Statements (Continued)
For the year ending 30 June 2010
NewSat Limited 2010 Annual Report 63
25 Related Party DisclosureThe consolidated financial statements include the financial statements of NewSat Limited and the subsidiaries listed in the following table.
NameCountry of
incorporation% Equity interest
2010% Equity interest
2009
NewSat Ltd Australia – –
NewSat Services Pty Ltd Australia 100 100
NewSat MEA Pty Ltd Australia 100 100
NSN Holdings Pty Ltd, owns Australia 100 100
–100% NewSat Networks Pty Ltd Australia
Moby 6 Pty Ltd Australia 100 100
Click ‘n’ Go! RMS Pty Ltd Australia 100 100
MM Holdings Australia Pty Ltd, owns Australia 92 92
–100% of AWM Graphics Pty Ltd Australia
Jabiru Satellite Ltd Australia 100 100
NewSat Limited is the ultimate Australian parent entity.
Terms and conditions of transactions with related parties:
– Sales to and purchases from related parties are made in arm’s length transactions both at normal market prices and on normal commercial terms.
Outstanding balances on intercompany loans at year-end are unsecured, interest free with no fixed terms for the repayment of loans and are payable on demand.
26 Auditors’ RemunerationThe auditor of NewSat Limited is Ernst & Young.
Year ended 30 June 2010
$’000
Year ended 30 June 2009
$’000
Amounts received or due and receivable by Ernst & Young (Australia) for:
• an audit or review of the financial report of the entity and any other entity in the consolidated group 141,000 152,100
• other services in relation to the entity and any other entity in the consolidated group 3,000 3,500
144,000 155,600
23 CommitmentsCapital commitments
The Group has no capital commitments.
Operating lease commitments – Group as lessee
The Group has entered into commercial property leases for office use. These leases have an average life of between two and five years with an renewal option included for its Corporate Office in the contracts. There are no restrictions placed upon the lessee by entering into these leases.
Future minimum rentals payable under non-cancellable operating leases as at 30 June 2010 are as follows:
Year ended 30 June 2010
$’000
Year ended 30 June 2009
$’000
Within one year 251 312
After one year but not more than five years 377 628
628 940
Other expenditure commitments
Commitments to various Contractors and Suppliers contracted for at reporting date but not recognised as liabilities are as follows:
Contractors and Suppliers
Year ended 30 June 2010
$’000
Year ended 30 June 2009
$’000
Within one year 4,385 5,549
After one year but not more than five years 4,033 5,715
8,418 11,264
24 ContingenciesOther contingent liabilities
A fixed and floating charge over NewSat Networks Pty Ltd has been issued to NSS BV by the Group to secure all obligations arising from the NewSat Networks Pty Ltd transaction, which includes the ongoing space segment operating leases to a maximum of US$10,000,000. Provided there are no events of defaults, per the agreement in place it is scheduled to be discharged on 8 November 2010.
Other contingent assets
At balance date a contingent asset exists in relation to the sale of Airworks Media Pty Ltd whereby the sale structure includes the potential receipt of up to a further $5 million over time scalable subject to certain ongoing commercial conditions.
For
per
sona
l use
onl
y
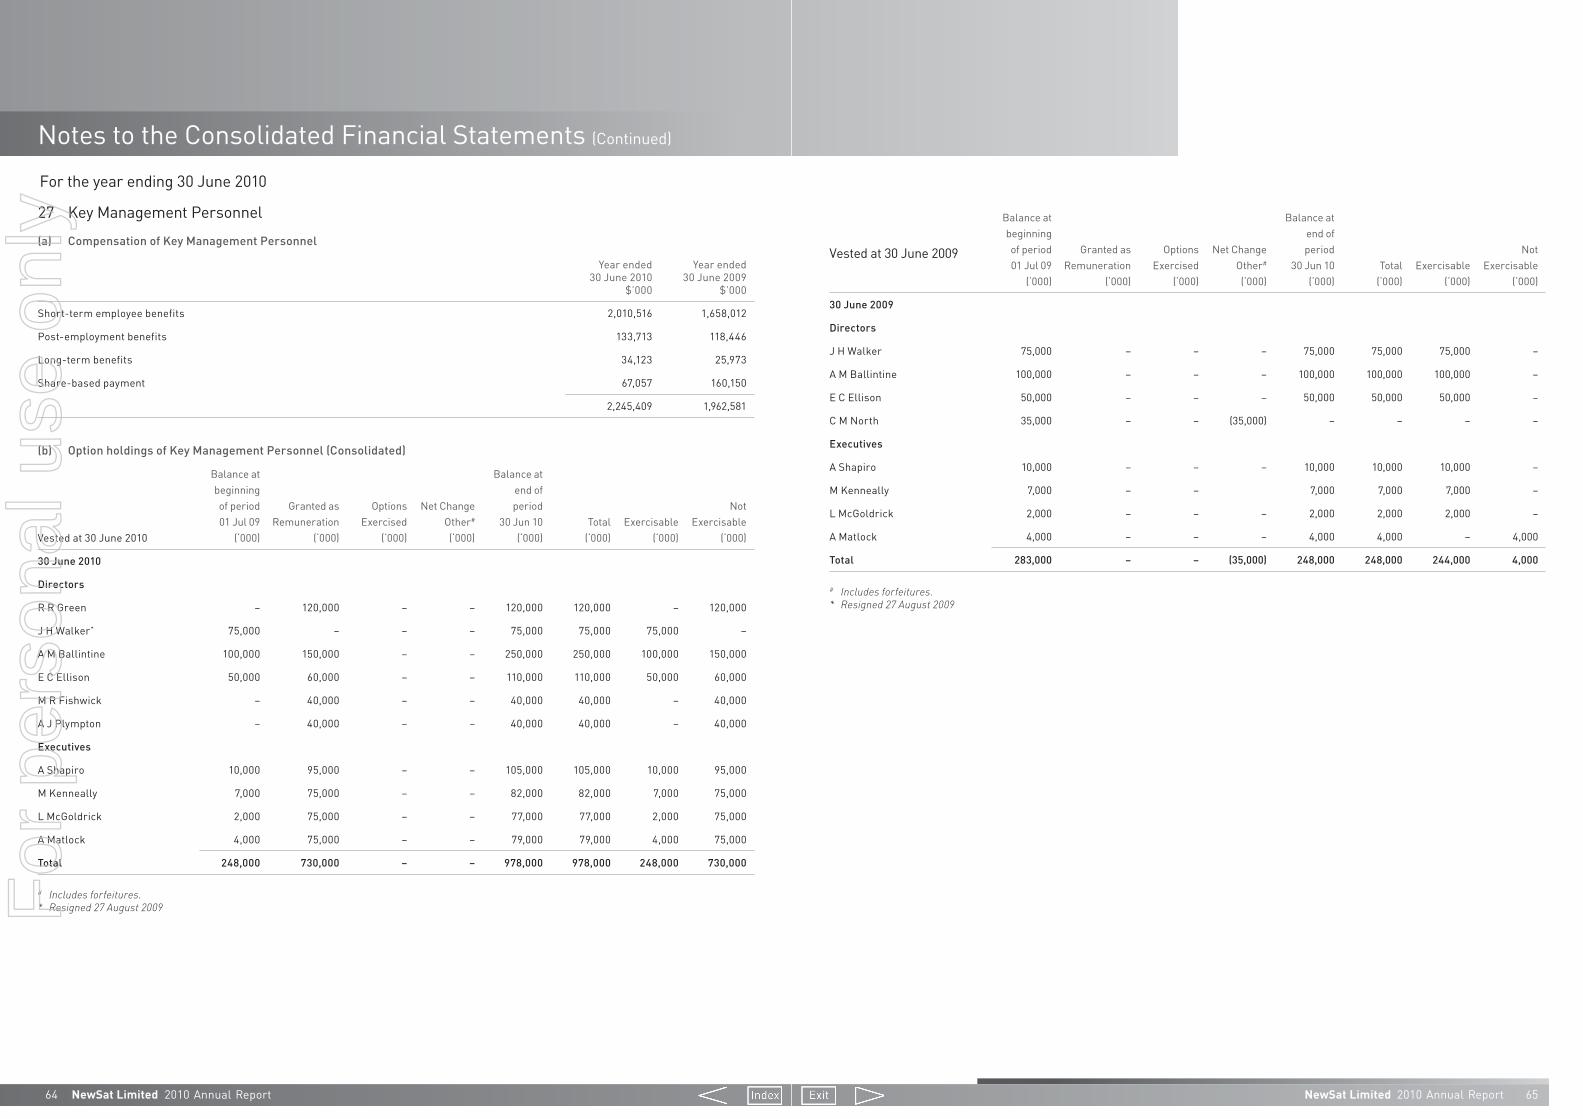
64 NewSat Limited 2010 Annual Report
Notes to the Consolidated Financial Statements (Continued)
For the year ending 30 June 2010
NewSat Limited 2010 Annual Report 65
Vested at 30 June 2009
Balance at beginning of period 01 Jul 09
(‘000)
Granted as Remuneration
(‘000)
Options Exercised
(‘000)
Net Change Other#
(‘000)
Balance at end of period
30 Jun 10 (‘000)
Total (‘000)
Exercisable (‘000)
Not Exercisable
(‘000)
30 June 2009
Directors
J H Walker 75,000 – – – 75,000 75,000 75,000 –
A M Ballintine 100,000 – – – 100,000 100,000 100,000 –
E C Ellison 50,000 – – – 50,000 50,000 50,000 –
C M North 35,000 – – (35,000) – – – –
Executives
A Shapiro 10,000 – – – 10,000 10,000 10,000 –
M Kenneally 7,000 – – 7,000 7,000 7,000 –
L McGoldrick 2,000 – – – 2,000 2,000 2,000 –
A Matlock 4,000 – – – 4,000 4,000 – 4,000
Total 283,000 – – (35,000) 248,000 248,000 244,000 4,000
# Includesforfeitures.* Resigned27August2009
27 Key Management Personnel(a) Compensation of Key Management Personnel
Year ended 30 June 2010
$’000
Year ended 30 June 2009
$’000
Short-term employee benefits 2,010,516 1,658,012
Post-employment benefits 133,713 118,446
Long-term benefits 34,123 25,973
Share-based payment 67,057 160,150
2,245,409 1,962,581
(b) Option holdings of Key Management Personnel (Consolidated)
Vested at 30 June 2010
Balance at beginning of period 01 Jul 09
(‘000)
Granted as Remuneration
(‘000)
Options Exercised
(‘000)
Net Change Other#
(‘000)
Balance at end of period
30 Jun 10 (‘000)
Total (‘000)
Exercisable (‘000)
Not Exercisable
(‘000)
30 June 2010
Directors
R R Green – 120,000 – – 120,000 120,000 – 120,000
J H Walker* 75,000 – – – 75,000 75,000 75,000 –
A M Ballintine 100,000 150,000 – – 250,000 250,000 100,000 150,000
E C Ellison 50,000 60,000 – – 110,000 110,000 50,000 60,000
M R Fishwick – 40,000 – – 40,000 40,000 – 40,000
A J Plympton – 40,000 – – 40,000 40,000 – 40,000
Executives
A Shapiro 10,000 95,000 – – 105,000 105,000 10,000 95,000
M Kenneally 7,000 75,000 – – 82,000 82,000 7,000 75,000
L McGoldrick 2,000 75,000 – – 77,000 77,000 2,000 75,000
A Matlock 4,000 75,000 – – 79,000 79,000 4,000 75,000
Total 248,000 730,000 – – 978,000 978,000 248,000 730,000
# Includesforfeitures.* Resigned27August2009F
or p
erso
nal u
se o
nly
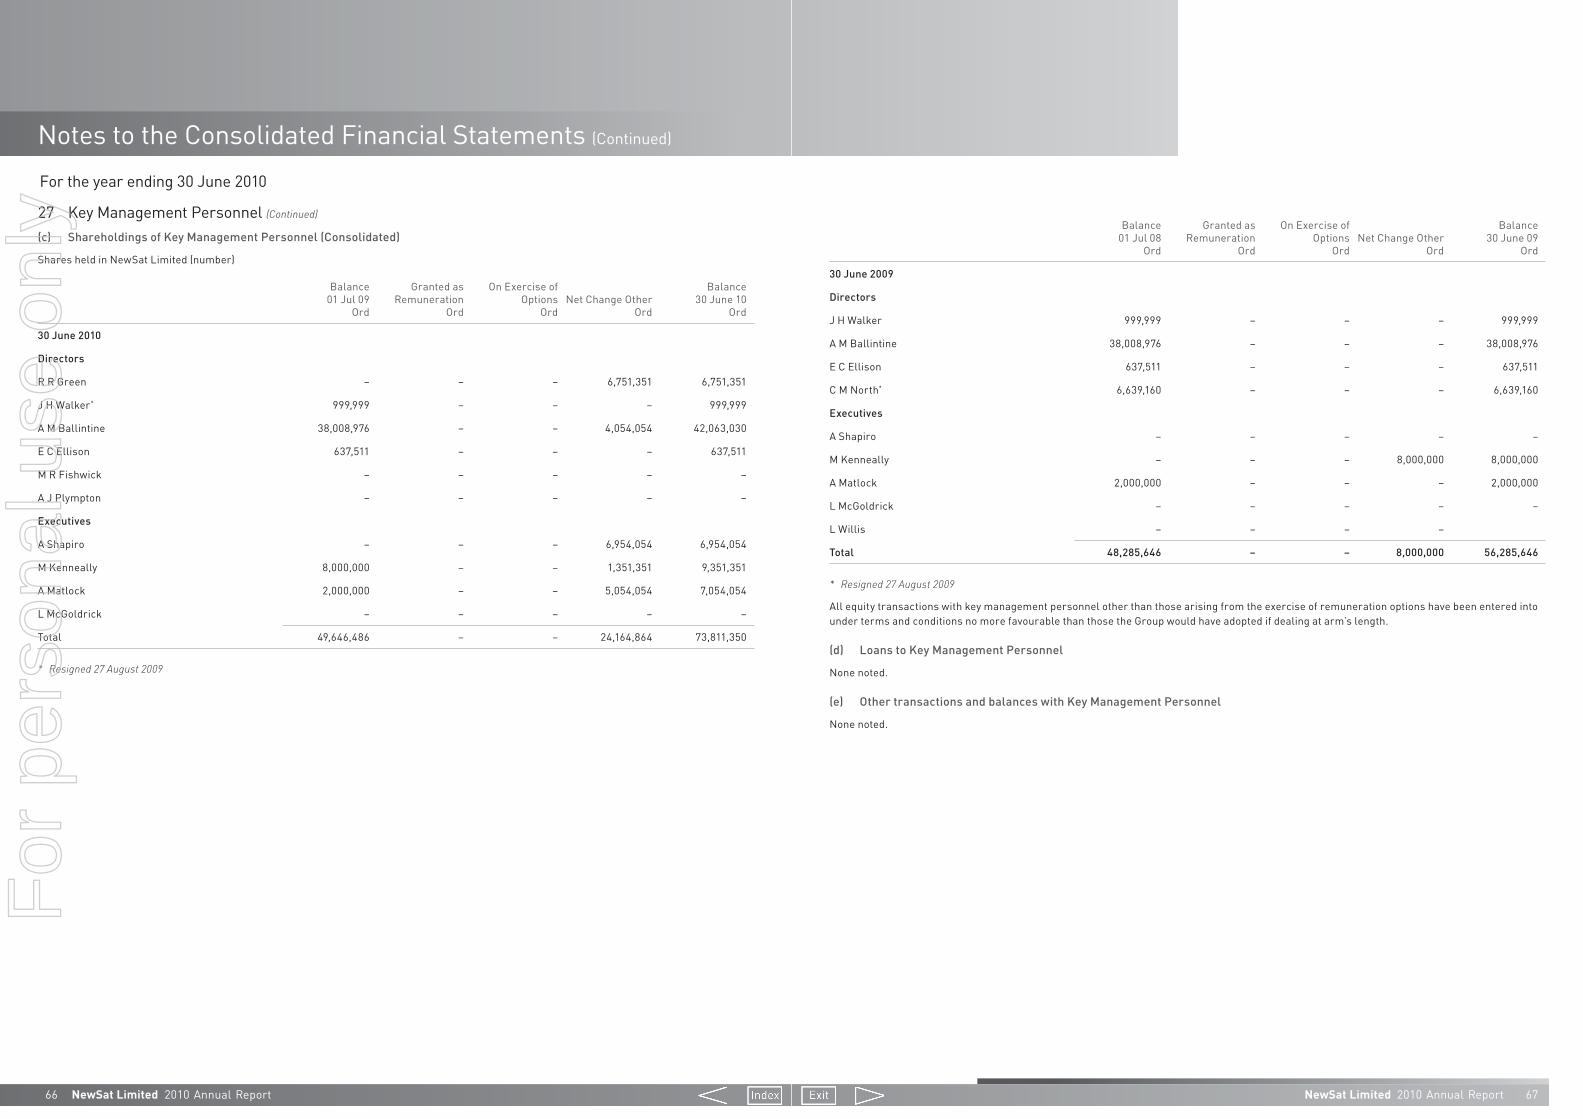
66 NewSat Limited 2010 Annual Report
Notes to the Consolidated Financial Statements (Continued)
For the year ending 30 June 2010
NewSat Limited 2010 Annual Report 67
Balance 01 Jul 08
Ord
Granted as Remuneration
Ord
On Exercise of Options
OrdNet Change Other
Ord
Balance 30 June 09
Ord
30 June 2009
Directors
J H Walker 999,999 – – – 999,999
A M Ballintine 38,008,976 – – – 38,008,976
E C Ellison 637,511 – – – 637,511
C M North* 6,639,160 – – – 6,639,160
Executives
A Shapiro – – – – –
M Kenneally – – – 8,000,000 8,000,000
A Matlock 2,000,000 – – – 2,000,000
L McGoldrick – – – – –
L Willis – – – –
Total 48,285,646 – – 8,000,000 56,285,646
* Resigned27August2009
All equity transactions with key management personnel other than those arising from the exercise of remuneration options have been entered into under terms and conditions no more favourable than those the Group would have adopted if dealing at arm’s length.
(d) Loans to Key Management Personnel
None noted.
(e) Other transactions and balances with Key Management Personnel
None noted.
(c) Shareholdings of Key Management Personnel (Consolidated)
Shares held in NewSat Limited (number)
Balance 01 Jul 09
Ord
Granted as Remuneration
Ord
On Exercise of Options
OrdNet Change Other
Ord
Balance 30 June 10
Ord
30 June 2010
Directors
R R Green – – – 6,751,351 6,751,351
J H Walker* 999,999 – – – 999,999
A M Ballintine 38,008,976 – – 4,054,054 42,063,030
E C Ellison 637,511 – – – 637,511
M R Fishwick – – – – –
A J Plympton – – – – –
Executives
A Shapiro – – – 6,954,054 6,954,054
M Kenneally 8,000,000 – – 1,351,351 9,351,351
A Matlock 2,000,000 – – 5,054,054 7,054,054
L McGoldrick – – – – –
Total 49,646,486 – – 24,164,864 73,811,350
* Resigned27August2009
27 Key Management Personnel (Continued)
For
per
sona
l use
onl
y

For the year ending 30 June 2010Independent Audit Report to the members of NewSat Limited
Liability limited by a scheme approved under Professional Standards Legislation
Independent auditor’s report to the members of NewSat Limited
Report on the Financial Report We have audited the accompanying financial report of NewSat Limited, which comprises the balance sheet as at 30 June 2010, and the statement of comprehensive income, statement of changes in equity and statement of cash flows for the year ended on that date, a summary of significant accounting policies, other explanatory notes and the directors’ declaration of the consolidated entity comprising the company and the entities it controlled at the year’s end or from time to time during the financial year.
Directors’ Responsibility for the Financial Report The directors of the company are responsible for the preparation and fair presentation of the financial report in accordance with the Australian Accounting Standards (including the Australian Accounting Interpretations) and the Corporations Act 2001. This responsibility includes establishing and maintaining internal controls relevant to the preparation and fair presentation of the financial report that is free from material misstatement, whether due to fraud or error; selecting and applying appropriate accounting policies; and making accounting estimates that are reasonable in the circumstances. In Note 2, the directors also state that the financial report, comprising the financial statements and notes, complies with International Financial Reporting Standards as issued by the International Accounting Standards Board.
Auditor’s Responsibility Our responsibility is to express an opinion on the financial report based on our audit. We conducted our audit in accordance with Australian Auditing Standards. These Auditing Standards require that we comply with relevant ethical requirements relating to audit engagements and plan and perform the audit to obtain reasonable assurance whether the financial report is free from material misstatement.
An audit involves performing procedures to obtain audit evidence about the amounts and disclosures in the financial report. The procedures selected depend on our judgment, including the assessment of the risks of material misstatement of the financial report, whether due to fraud or error. In making those risk assessments, we consider internal controls relevant to the entity’s preparation and fair presentation of the financial report in order to design audit procedures that are appropriate in the circumstances, but not for the purpose of expressing an opinion on the effectiveness of the entity’s internal controls. An audit also includes evaluating the appropriateness of accounting policies used and the reasonableness of accounting estimates made by the directors, as well as evaluating the overall presentation of the financial report.
We believe that the audit evidence we have obtained is sufficient and appropriate to provide a basis for our audit opinion.
Independence In conducting our audit we have met the independence requirements of the Corporations Act 2001. We have given to the directors of the company a written Auditor’s Independence Declaration, a copy of which is included in the directors’ report.
NewSat Limited 2010 Annual Report 6968 NewSat Limited 2010 Annual Report
Directors’ Declaration
In accordance with a resolution of the directors of NewSat Limited, I state that:
In the opinion of the directors:
(a) The financial statements and notes of the consolidated entity are in accordance with the Corporations Act 2001, including:
(i) Giving a true and fair view of the consolidated entity’s financial position as at 30 June 2010 and of its performance for the year ended on that date; and
(ii) Complying with Australian Accounting Standards (including the Australian Accounting Interpretations) and the Corporations Regulations 2001;
(b) The financial statements and notes also comply with International Financial Reporting Standards as disclosed in note 2; and
(c) There are reasonable grounds to believe that the consolidated entity will be able to pay its debts as and when they become due and payable.
(d) This declaration has been made after receiving the declarations required to be made to the Directors in accordance with section 295A of the Corporations Act 2001 for the financial year ending 30 June 2010.
On behalf of the Board
Adrian Ballintine
Chief Executive Officer 30 September 2010
For
per
sona
l use
onl
y

Independent auditor’s report
Auditor’s Opinion In our opinion: 1. the financial report of NewSat Limited is in accordance with the Corporations Act 2001, including:
i giving a true and fair view of the consolidated entity’s financial position at 30 June 2010 and of its performance for the year ended on that date; and
ii complying with Australian Accounting Standards (including the Australian Accounting Interpretations) and the Corporations Regulations 2001.
2. the financial report also complies with International Financial Reporting Standards as issued by the International Accounting Standards Board.
Report on the Remuneration Report We have audited the Remuneration Report included in pages 16 to 22 of the directors’ report for the year ended 30 June 2010. The directors of the company are responsible for the preparation and presentation of the Remuneration Report in accordance with section 300A of the Corporations Act 2001. Our responsibility is to express an opinion on the Remuneration Report, based on our audit conducted in accordance with Australian Auditing Standards.
Auditor’s Opinion In our opinion the Remuneration Report of NewSat Limited for the year ended 30 June 2010, complies with section 300A of the Corporations Act 2001.
Ernst & Young
Robert Dalton Partner Melbourne 30 September 2010
Additional information required by the Australian Securities Exchange Limited, which is not shown elsewhere in this report, is as follows:
Ordinary Fully Paid Shares (Total) as of 30 September 2010
(a) Distribution of equity securities
(i) Ordinary share capital
►► 7,848,830,551 fully paid ordinary shares are held by 6,980 individual shareholders.
►► All issued ordinary shares carry one vote per share and are listed on the Australian Securities Exchange Limited.
(ii) Options
►► 1,162,000 options are held by 29 individual option holders.
►► Each option is potentially convertible into one ordinary share.
►► All options do not carry a right to vote and are unquoted.
The number of shareholders, by size of holding, in each class is:
Ordinary Shares Unquoted Options
Range of Units Snapshot Number of Holders Number of Shares Number of Holders Number of Shares
1 – 1,000 57 32,535 – –
1,001 – 5,000 231 765,822 – –
5,001 – 10,000 209 1,777,568 – –
10,001 – 100,000 1,611 103,261,096 – –
100,001 – 9,999,999,999 4,872 7,742,993,530 29 1,162,000
Total 6,980 7,848,830,551 29 1,162,000
Holding less than a marketable parcel 1,692 64,237,021
(b) Substantial shareholders
Shareholder Ordinary Fully Paid Shares % of Units
AUSTRALIAN GLOBAL CAPITAL P/L 170,000,000 2.17
Additional Information
70 NewSat Limited 2010 Annual Report NewSat Limited 2010 Annual Report 71
For
per
sona
l use
onl
y

72 NewSat Limited 2010 Annual Report
(c) Twenty largest holders of quoted equity securities
Rank Ordinary shareholder Fully Paid Shares (Number) % of Units
1. AUSTRALIAN GLOBAL CAPITAL P/L 170,000,000 2.17
2. BOOM SECURITIES (HK) LTD <CLIENTS ACCOUNT> 130,250,000 1.66
3. MR STEVEN ROBERT BROWN 115,000,000 1.47
4. MR GARY RONALD HEATH + MRS MELISSA LOUISE HEATH 114,000,000 1.45
5. ABLETT PTY LTD <DAVID EDWARDS FAMILY A/C> 104,054,054 1.33
6. MR TONY DANILOV 95,000,000 1.21
7. MRS ENA VOSK <ITF MRS M A GENTZLER A/C> 65,806,666 0.84
8. MR XINHUI GONG 58,300,000 0.74
9. BETTERMAKE PTY LTD <B & L BASILE SUPER FUND A/C> 56,054,054 0.71
10. MR DONALD JEFFREY SMITH + MRS PATTY SUSAN SMITH <GFC SUPERANNUATION FUND A/C> 53,000,000 0.68
11. MR LASZLO MARER + MRS JUDITH MARER 46,064,375 0.59
12. MICALLEF PLUMBING INDUSTRIES PTY LTD 45,564,730 0.58
13. DEPOFO PTY LTD <SUPER A/C> 45,000,000 0.57
14. HURLBOOK PTY LTD 43,382,445 0.55
15. MR DONALD J SMITH + MRS PATTY SMITH <GFC SUPER FUND A/C> 42,000,000 0.54
16. MR WILLIAM CRAIG PATTY + MRS VIOLET JOYCE PATTY 41,921,025 0.53
17. LINWIERIK SUPER PTY LTD <LINTON SUPER FUND A/C> 40,000,000 0.51
18. MR LASZLO MARER + MRS JUDITH MARER <MARER INVESTMENT FUND A/C> 38,977,027 0.50
19. ABM SUPERANNUATION FUND PTY LTD <ABM SUPER FUND A/C> 36,958,108 0.47
20. ROCKGOLD HOLDINGS PTY LTD 35,000,000 0.45
Top 20 holders of ORDINARY FULLY PAID SHARES (TOTAL) 1,376,332,484 17.54
Total Remaining Holders Balance 6,472,498,067 82.46
Total 7,848,830,551 100.00
Additional Information
Designed and produced by Newsat Limited
Printed on Monza SatinMonza Recycled is Certified Carbon Neutral by The Carbon Reduction Institute (CRI) in accordance with the global Greenhouse Gas Protcol and ISO 14040 frame-work. Monza Recycled contains 55% recycled fibre (25% post consumer and 30% pre consumer) and 45% elemental chlorine free pulp. All virgin pulp is derived from well-managed forests and controlled sources. It is manufactured by an ISO 14001 certified mill.
100013
NewSat OfficesMelbourneLevel 4, 6 Riverside Quay, Southbank Victoria 3006 Australia Telephone: +61 3 9674 4644 Facsimile: +61 3 9674 4655
Adelaide12 Park Way, Mawson Lakes South Australia 5095 Australia Telephone: +61 8 8260 8300 Facsimile: +61 8 8260 8399
Perth44 Clavering Road, Bayswater Western Australia 6053 Australia Telephone: +61 8 6467 1100 Facsimile: +61 8 6467 1177
New South WalesTelephone: +61 2 9275 8854 Facsimile: +61 2 9275 8800
QueenslandTelephone: +61 7 5526 2841 Facsimile: +61 3 9674 4655
TexasTelephone: +1 972 322 8082 Facsimile: +61 3 9674 4655
For
per
sona
l use
onl
y

Global Satellite Solutions
For
per
sona
l use
onl
y


