A summary and review of eriss’ groundwater chemistry data at Ranger uranium mine Andreas Bollhöfer, Peter Medley & Sarah Marshall February 2015 Release status – unrestricted Project number – MON-1996-001 631 internal report
Transcript
A summary and review
of eriss’ groundwater
chemistry data at
Ranger uranium mine
Andreas Bollhöfer, Peter Medley &
Sarah Marshall
February 2015
Release status – unrestricted
Project number – MON-1996-001
631
internal
report
This page has been left blank intentionally.
A summary and review of eriss’ groundwater chemistry data at Ranger uranium mine
Andreas Bollhöfer, Peter Medley & Sarah Marshall
Supervising Scientist
GPO Box 461, Darwin NT 0801
February 2015
(Release status – unrestricted)
How to cite this report:
Bollhöfer A, Medley P & Marshall S 2015. A summary and review of eriss’ groundwater chemistry data at
3.3 Bores to the north-west of the TSF and in the Gulungul catchment 39
3.4 Bores close to the south and south-west wall of the TSF 42
3.5 Bores south of the TSF 45
3.6 Bores in the vicinity of Pit 1 and in the Corridor and Georgetown Creek catchments 48
3.7 Bores in the RP2 and Pit 3 area 51
3.8 Bores in the Djalkmarra Billabong and Magela Creek area 54
4 Discussion 58
4.1 Bores around the TSF 60
4.2 Bores in the Corridor Creek catchment 64
4.3 Magela LAA Bore 83_1 in the Djalkmara Creek catchment 67
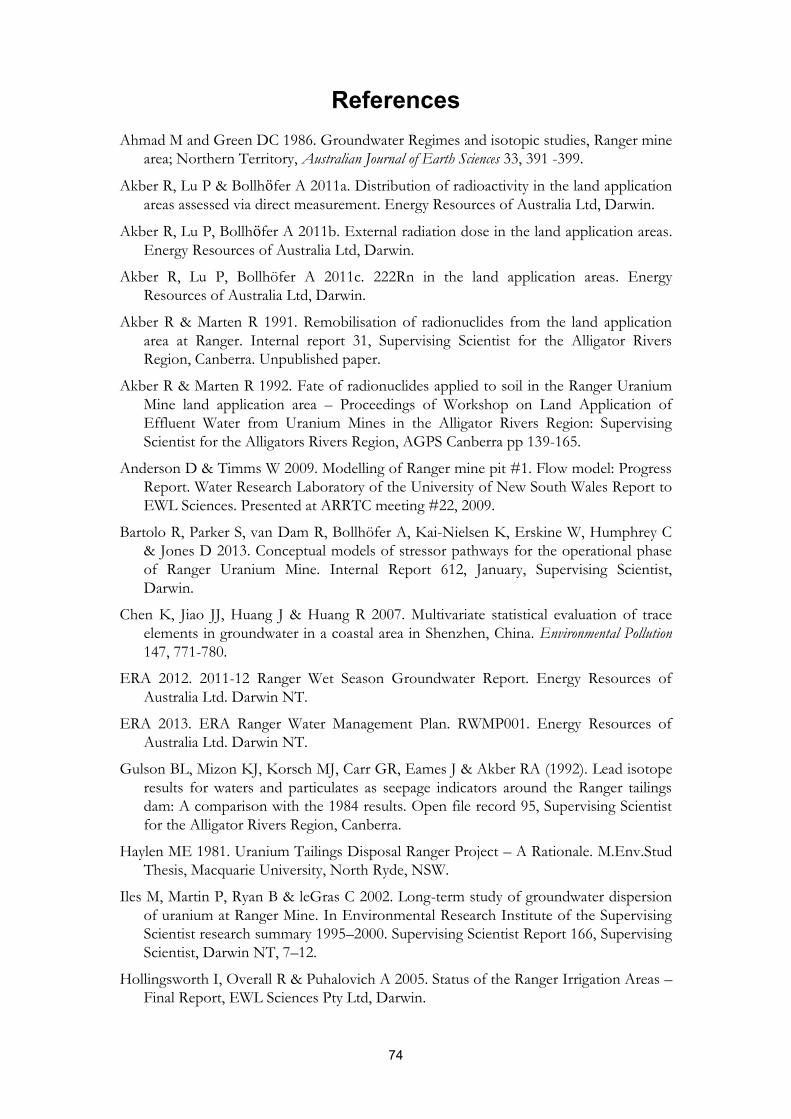
4.4 Bores RN23551 and B11 in the Coonjimba Creek catchment 69
5 Conclusions and recommendations 72
References 74
Appendix 1 78
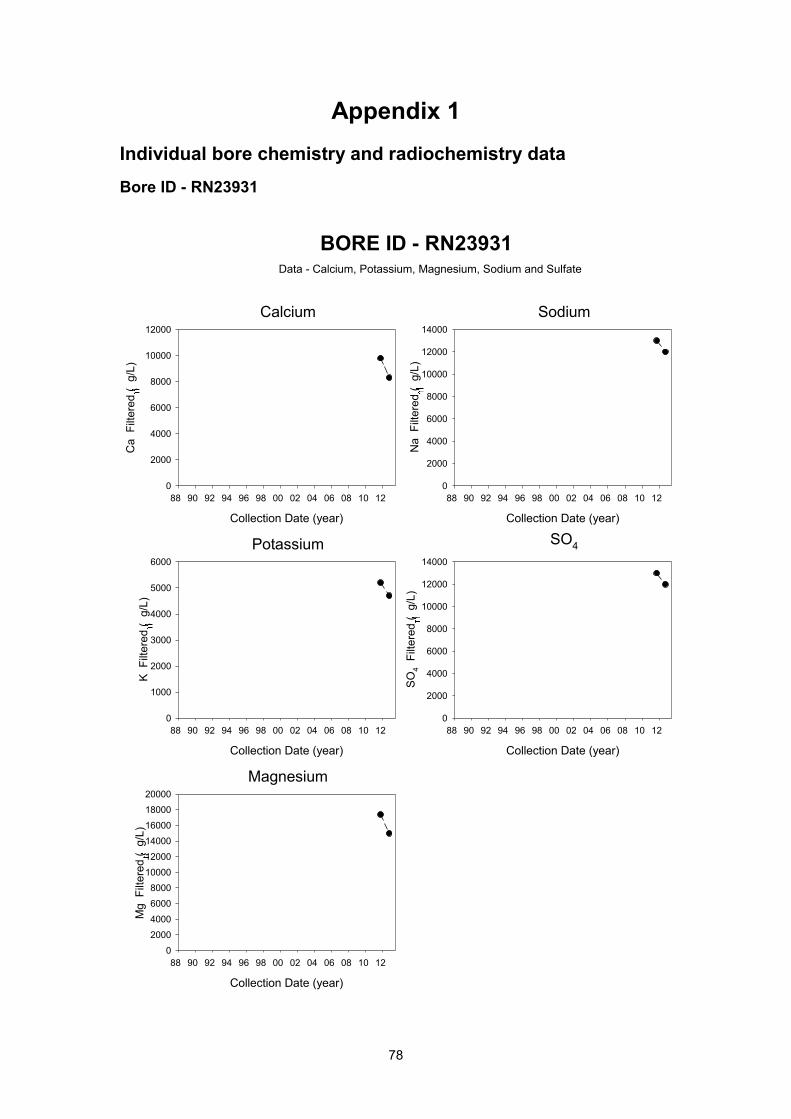
Individual bore chemistry and radiochemistry data 78
Bore ID - RN23931 78
Bore ID – R.P. 79/ 1 Ranger 81
Bore ID – R.P. 79/ 2 Ranger 82
Bore ID – 79/6 83
Bore ID – 79/9 84
Bore ID – 83_1 85
Bore ID – B11 88
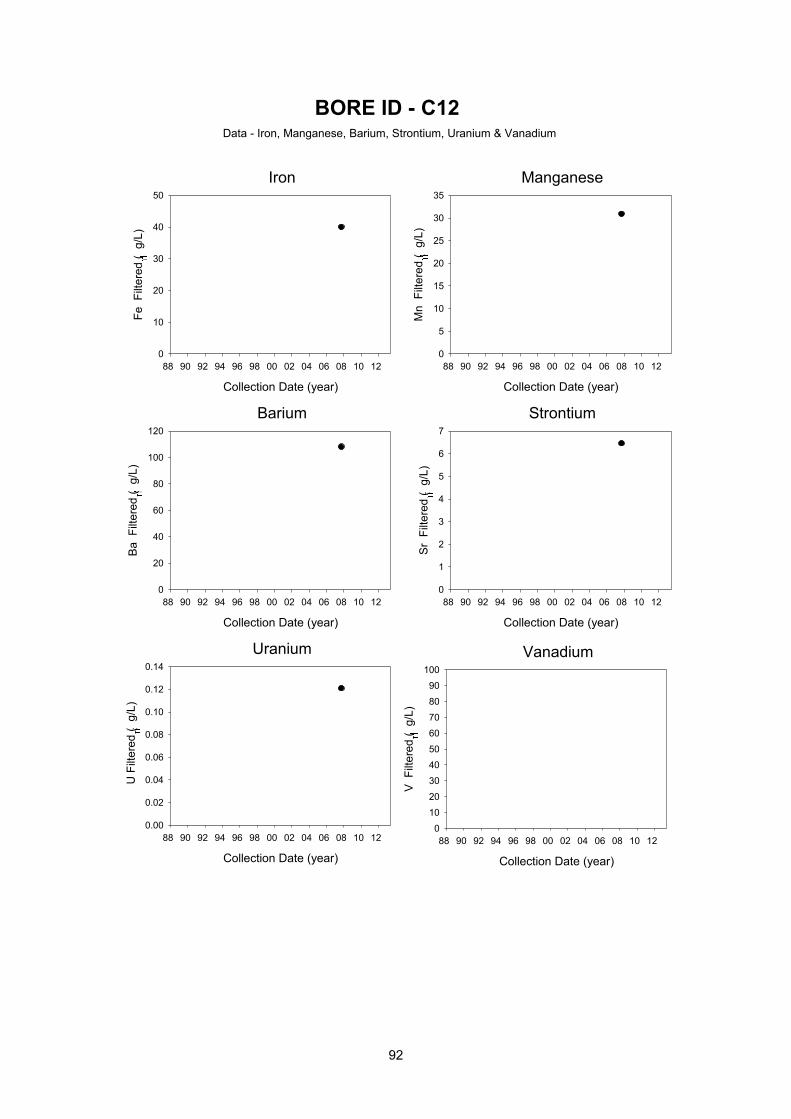
Bore ID – C12 91
iv
Bore ID – C1_Shallow 94
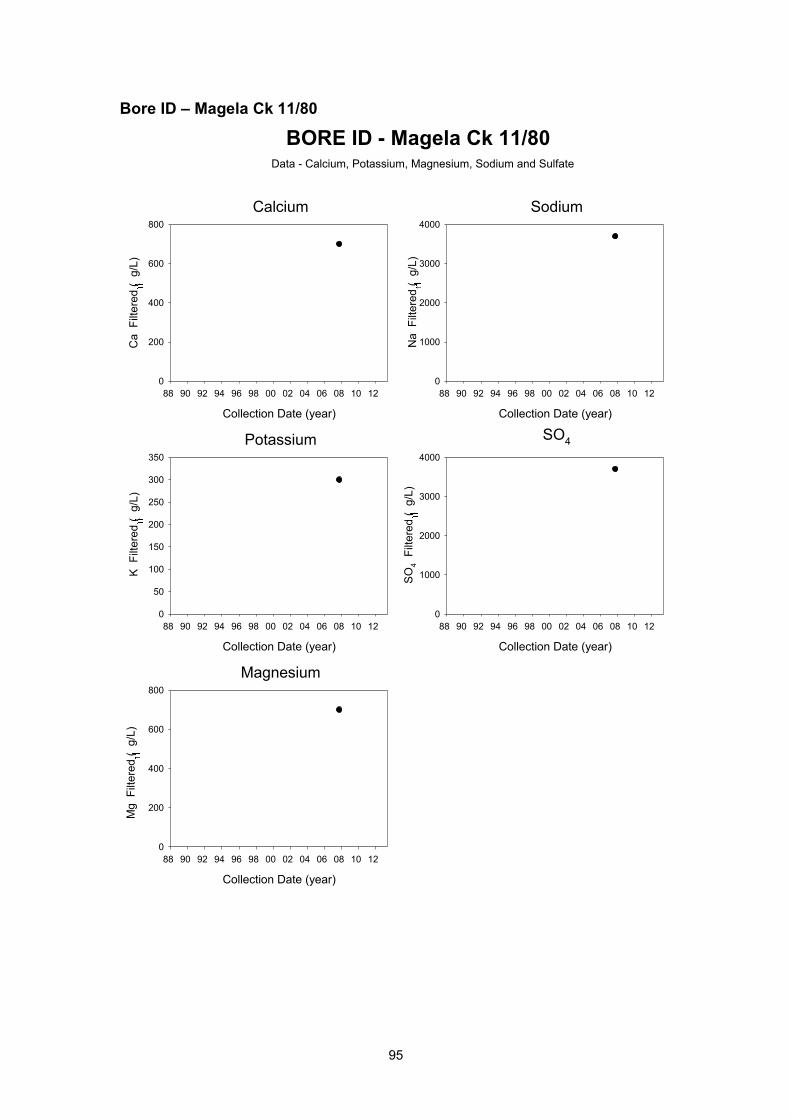
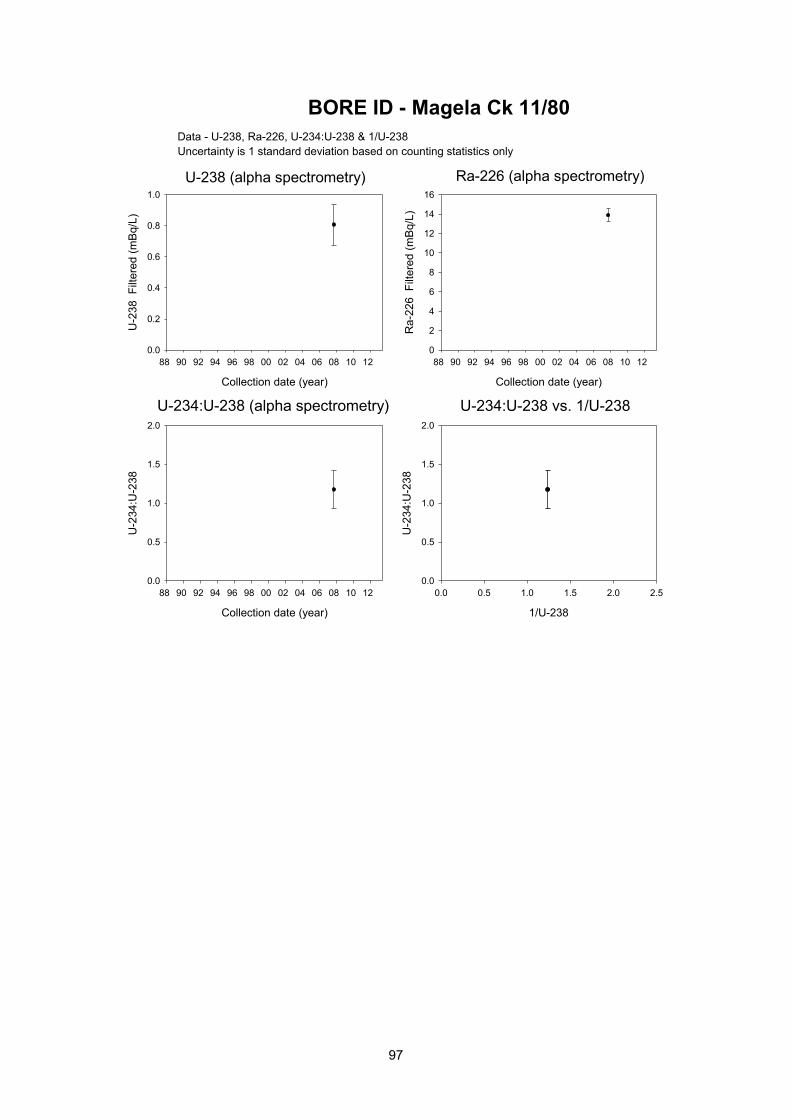
Bore ID – Magela Ck 11/80 95
Bore ID – MBH 98
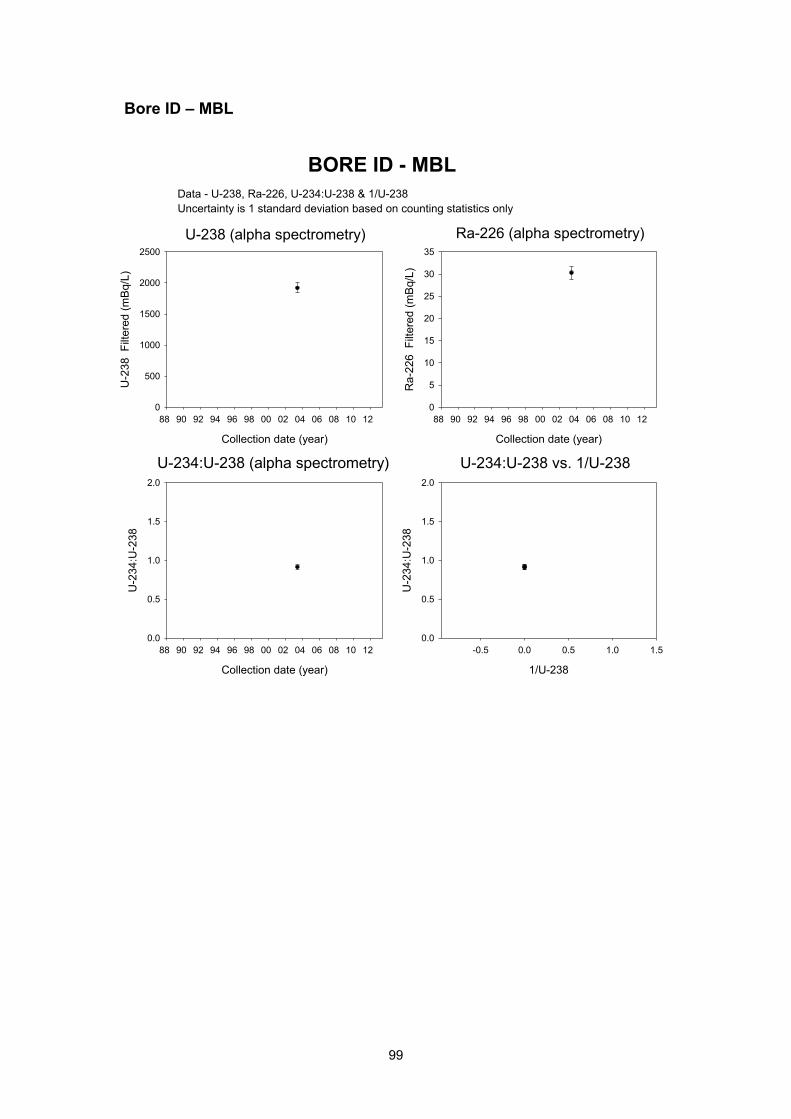
Bore ID – MBL 99
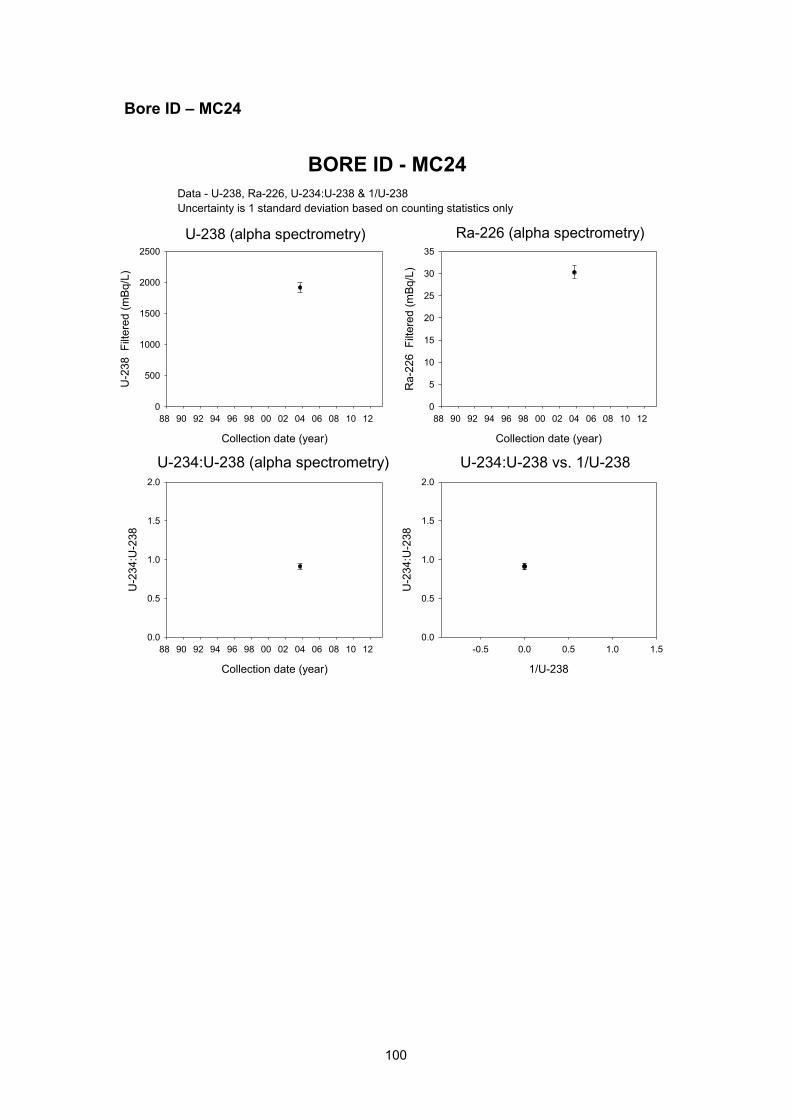
Bore ID – MC24 100
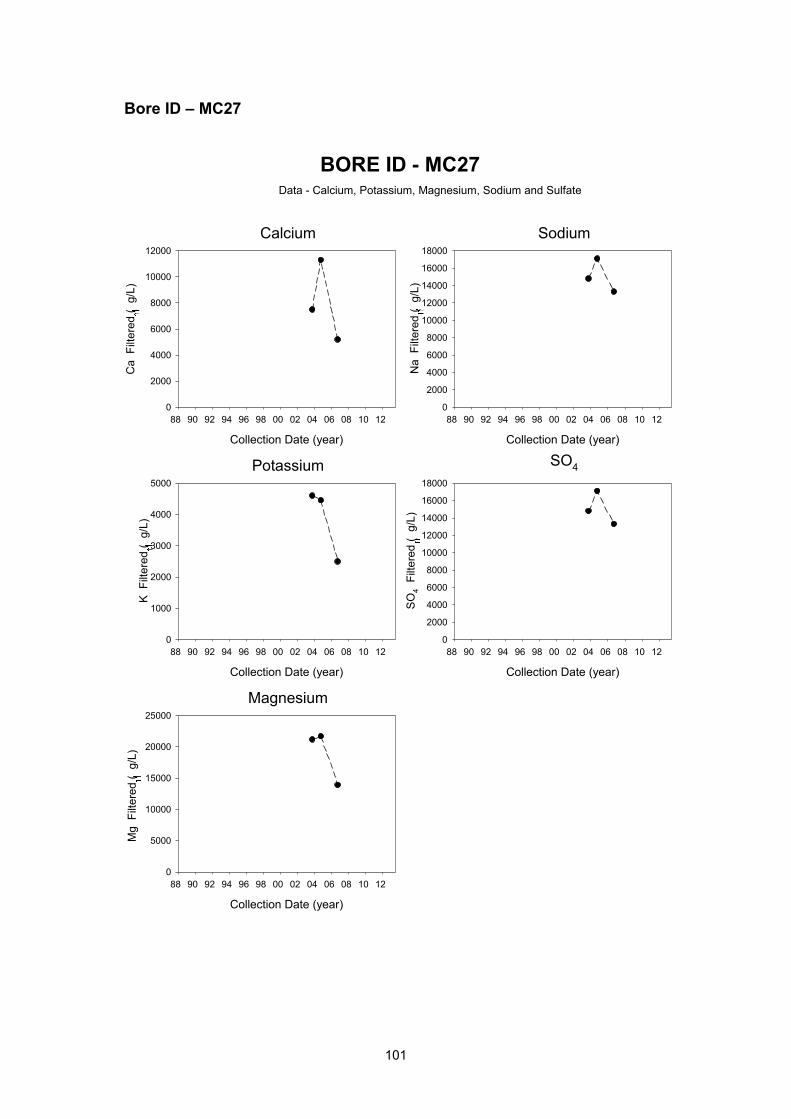
Bore ID – MC27 101
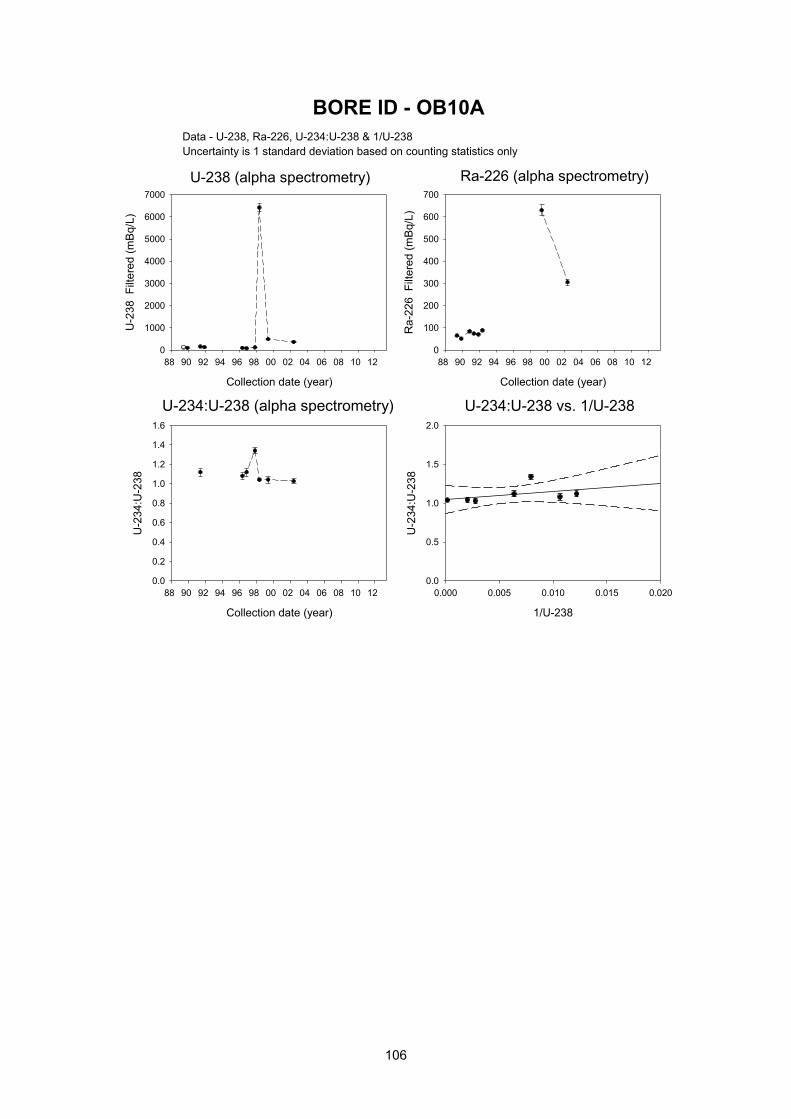
Bore ID – OB10A 104
Bore ID – OB11A 107
Bore ID – OB12A 108
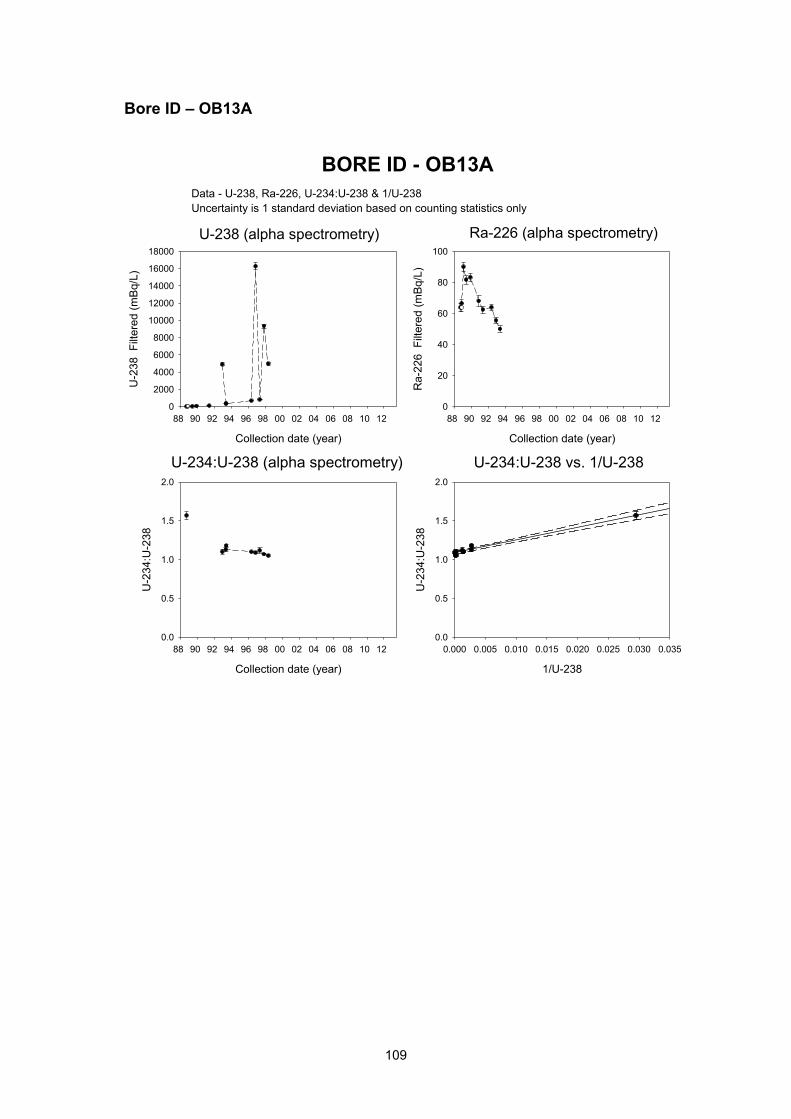
Bore ID – OB13A 109
Bore ID – OB15 110
Bore ID – OB16 111
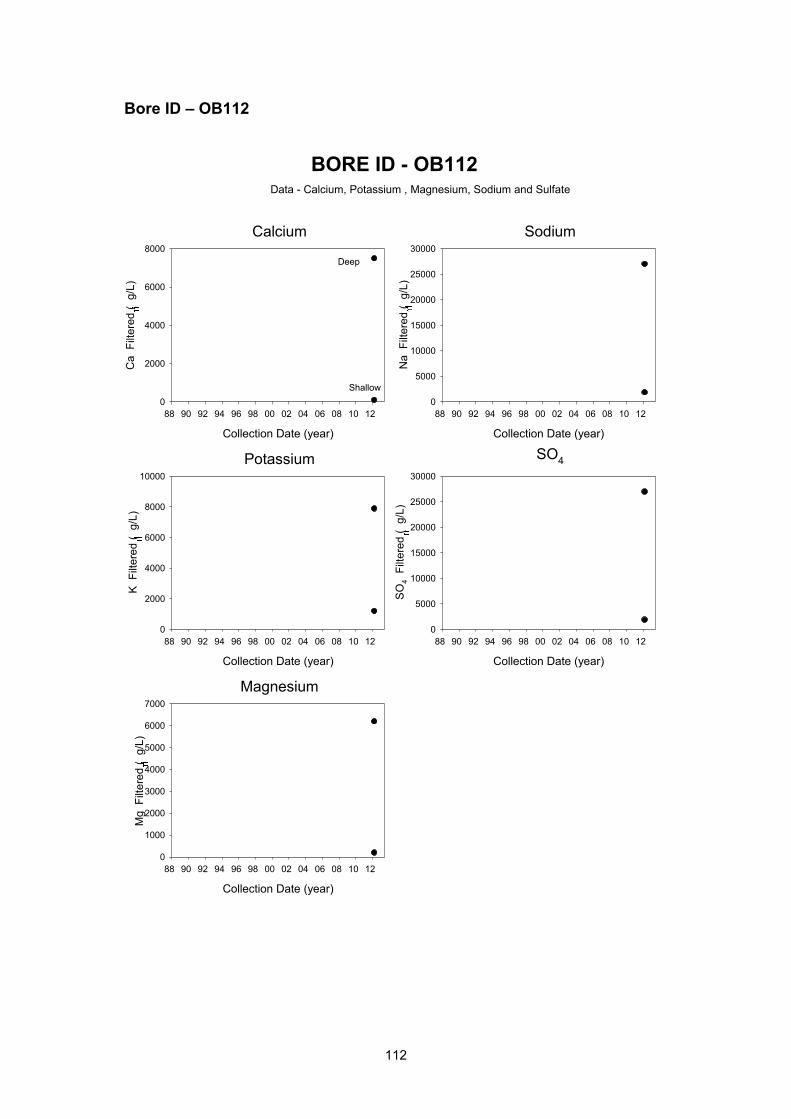
Bore ID – OB112 112
Bore ID – OB116 114
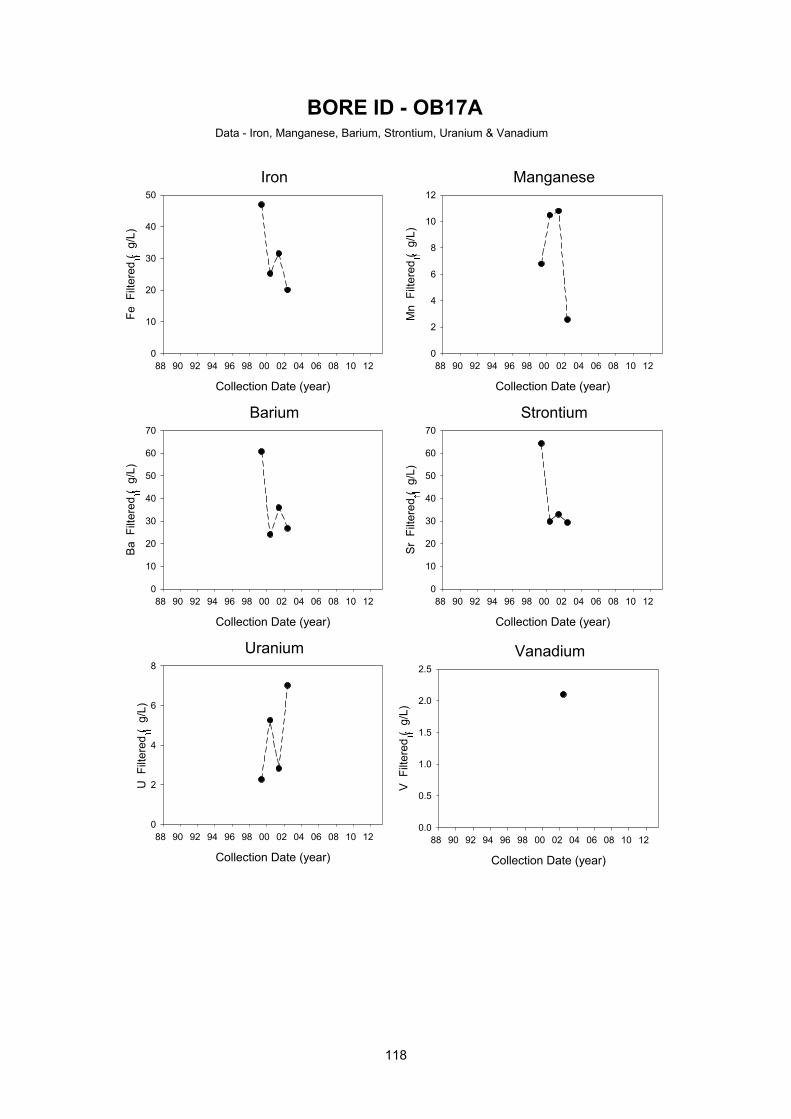
Bore ID – OB17A 117
Bore ID – OB18A 120
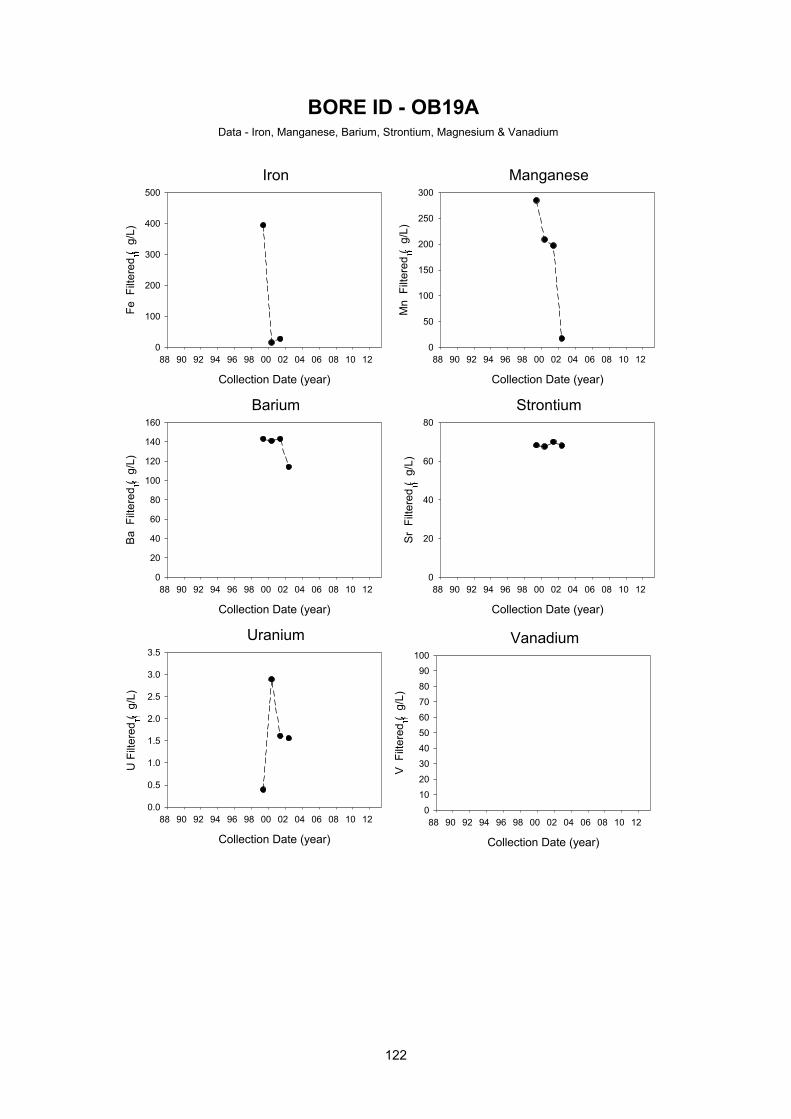
Bore ID – OB19A 121
Bore ID – OB1A 124
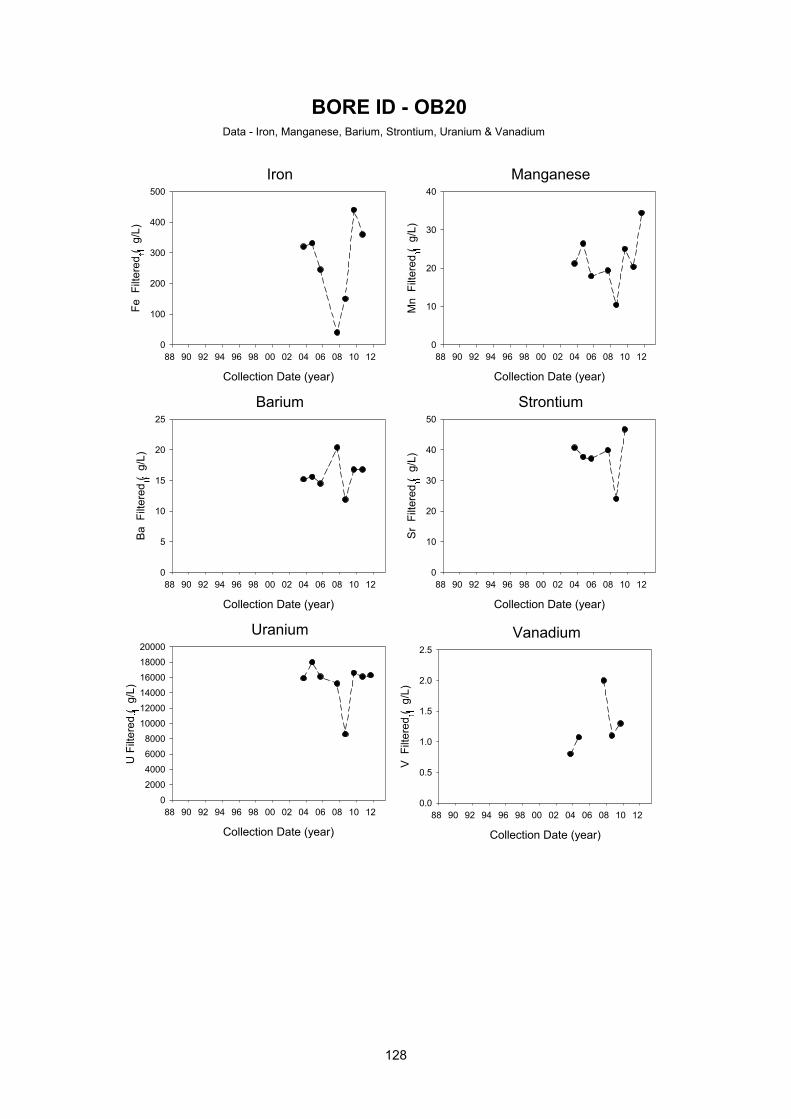
Bore ID – OB20 127
Bore ID – OB21A 130
Bore ID – OB22 133
Bore ID – OB23 134
Bore ID – OB24 137
Bore ID – OB26 140
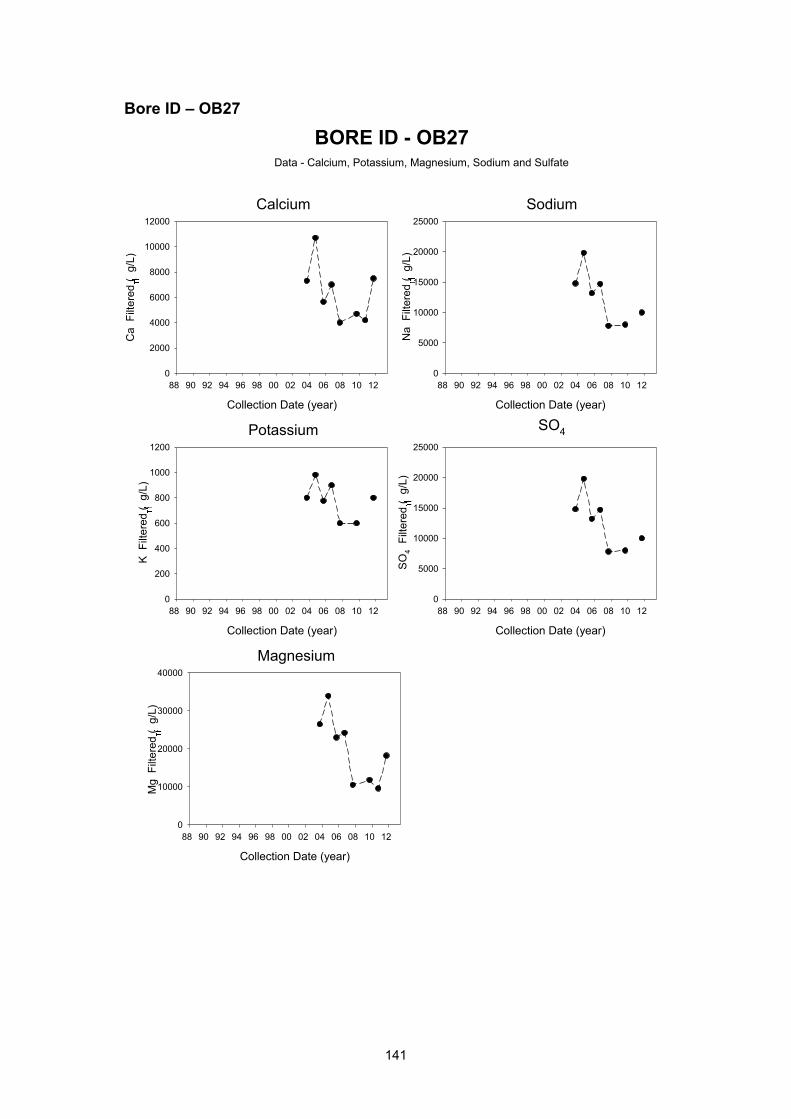
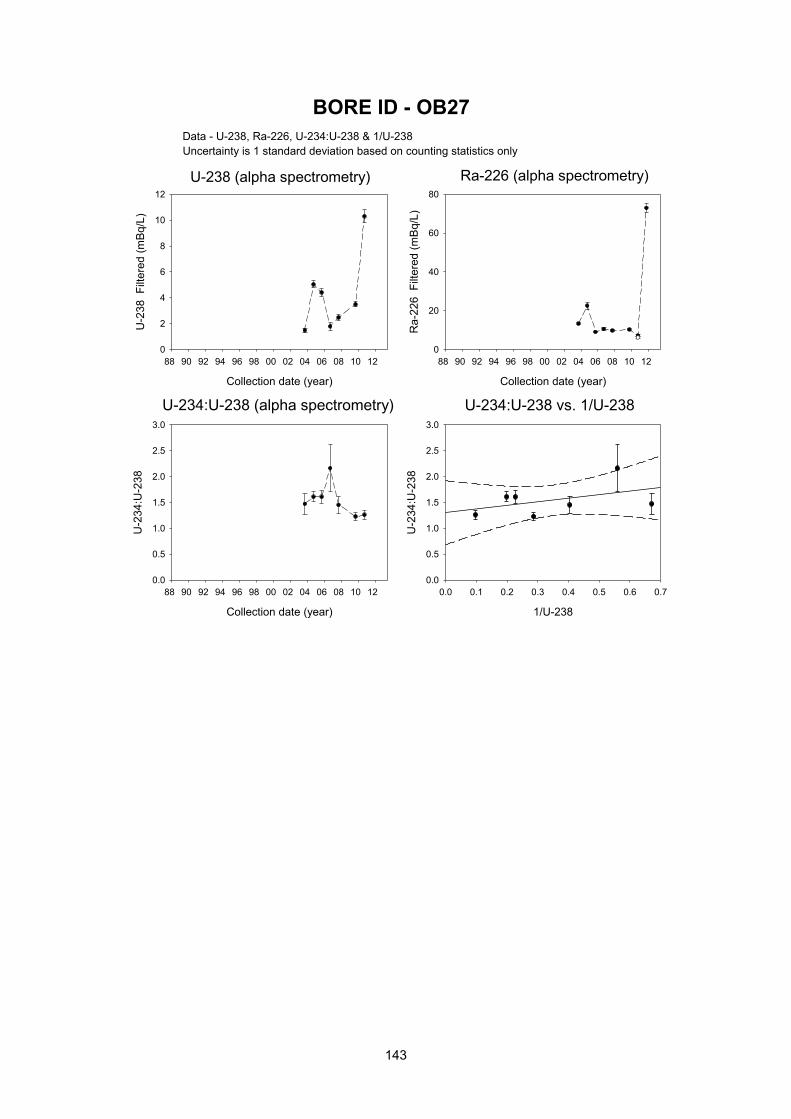
Bore ID – OB27 141
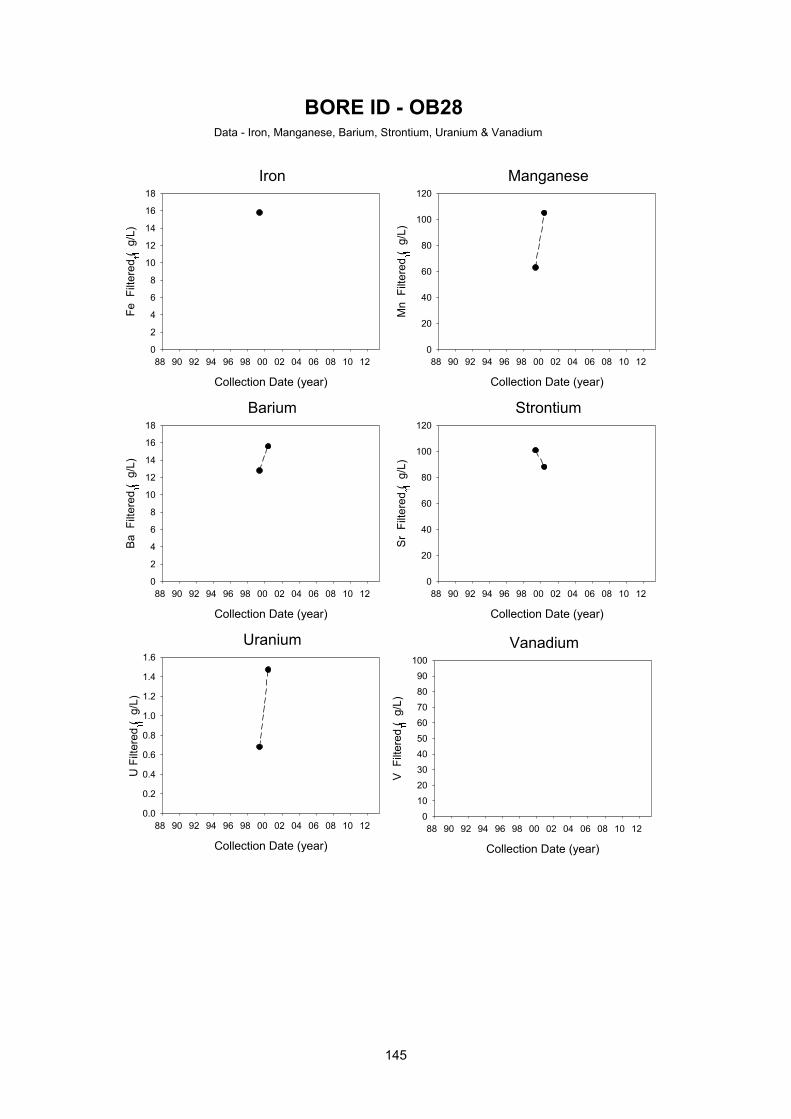
Bore ID – OB28 144
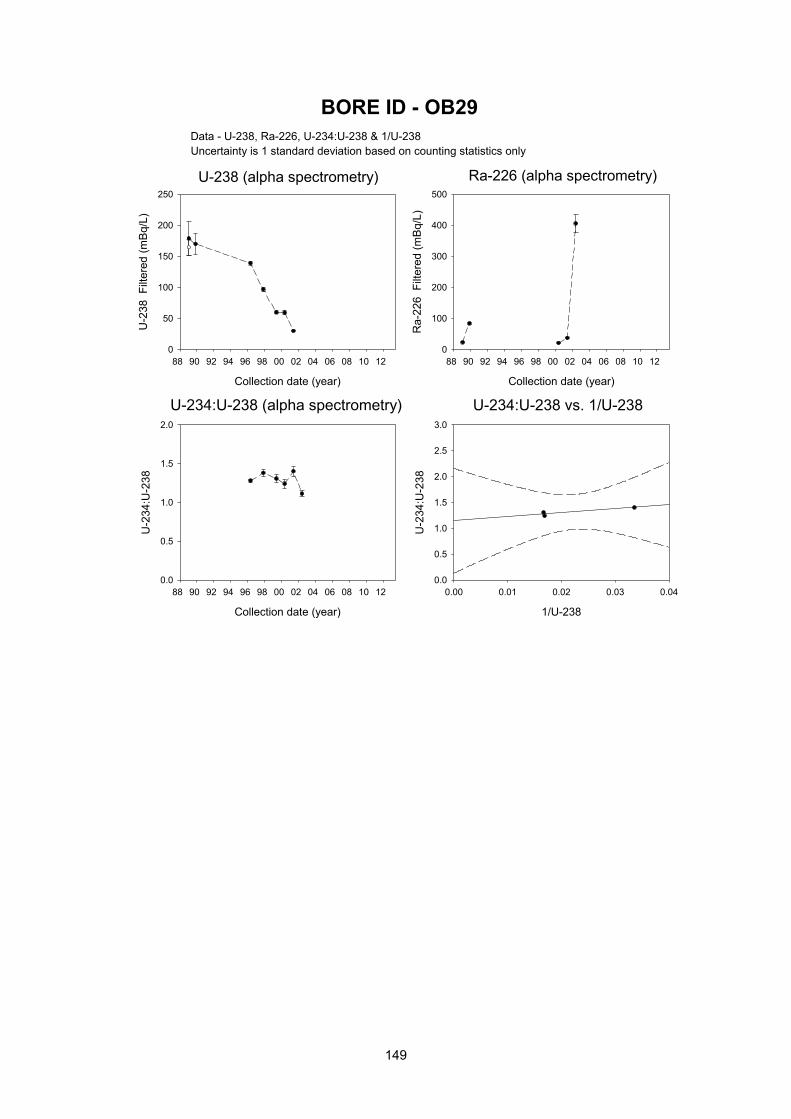
Bore ID – OB29 147
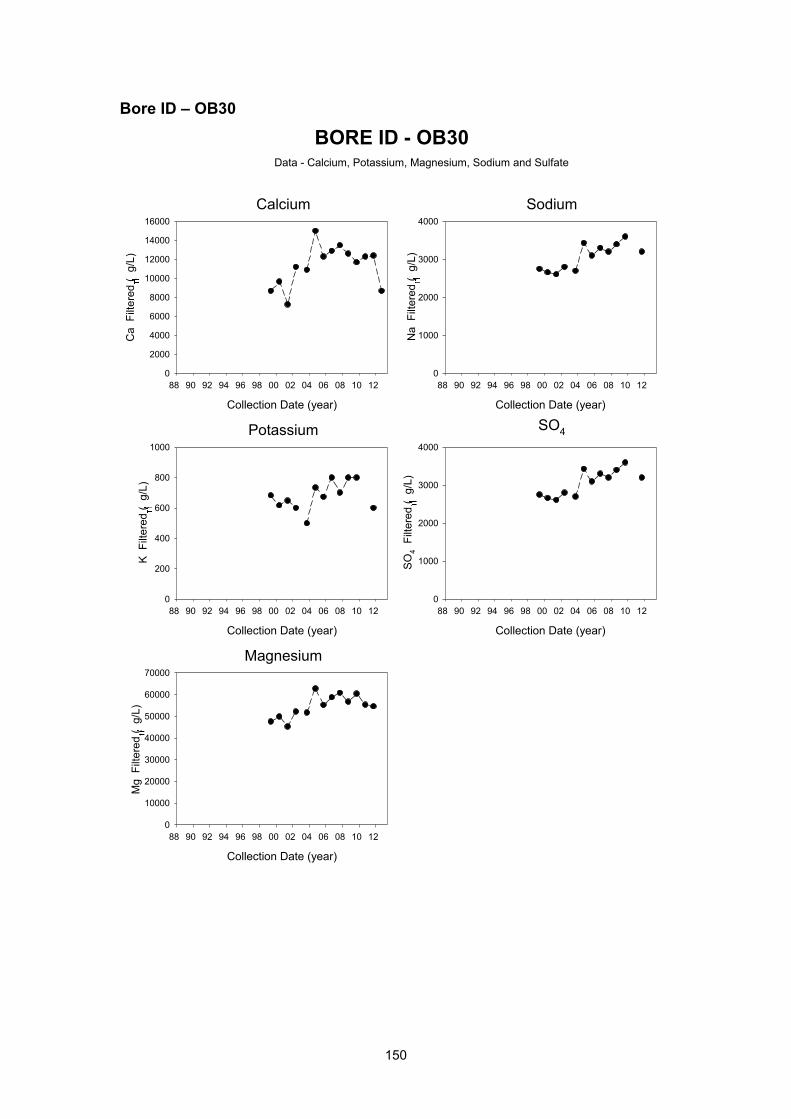
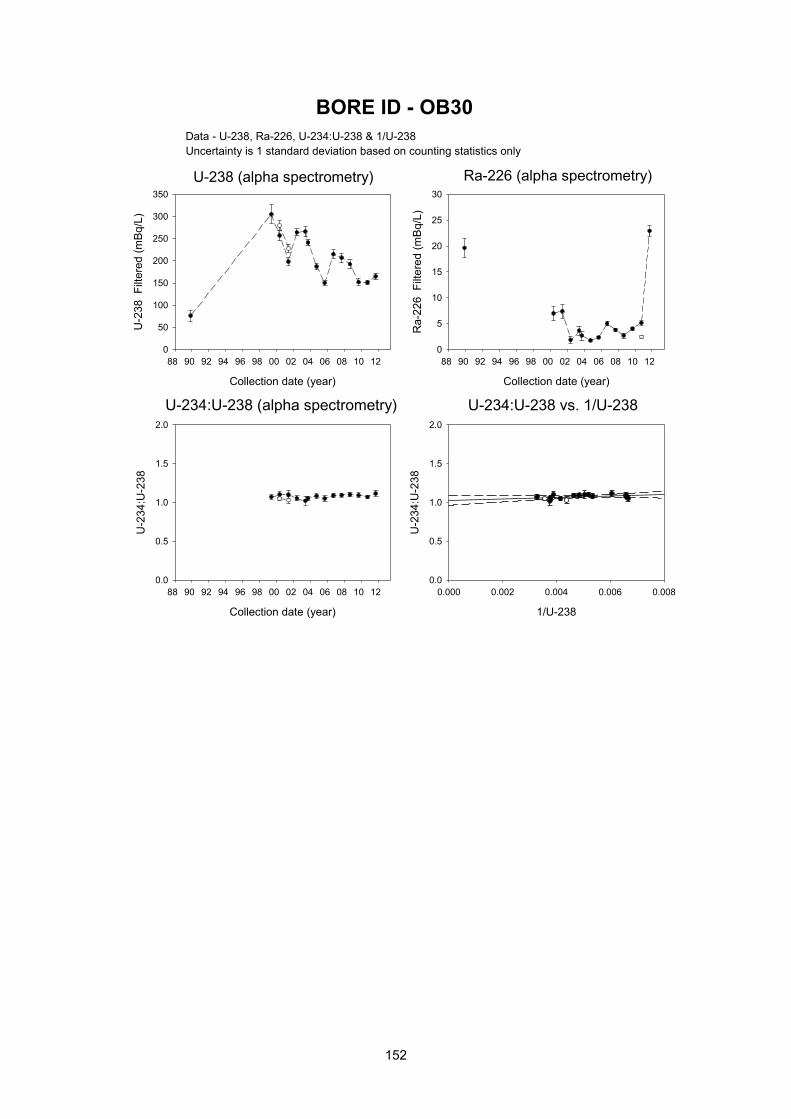
Bore ID – OB30 150
Bore ID – OB2A 153
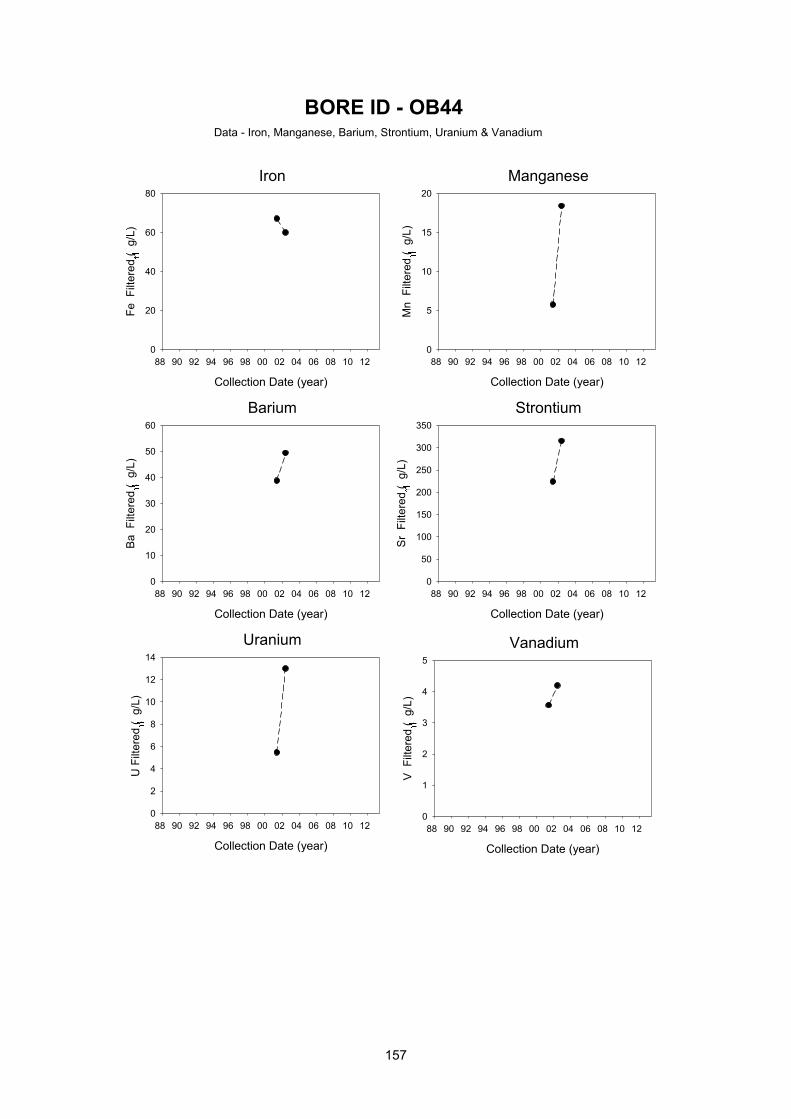
Bore ID – OB44 156
Bore ID – OB46 159
Bore ID – OB47 160
Bore ID – OB48 161
Bore ID – OB49 162
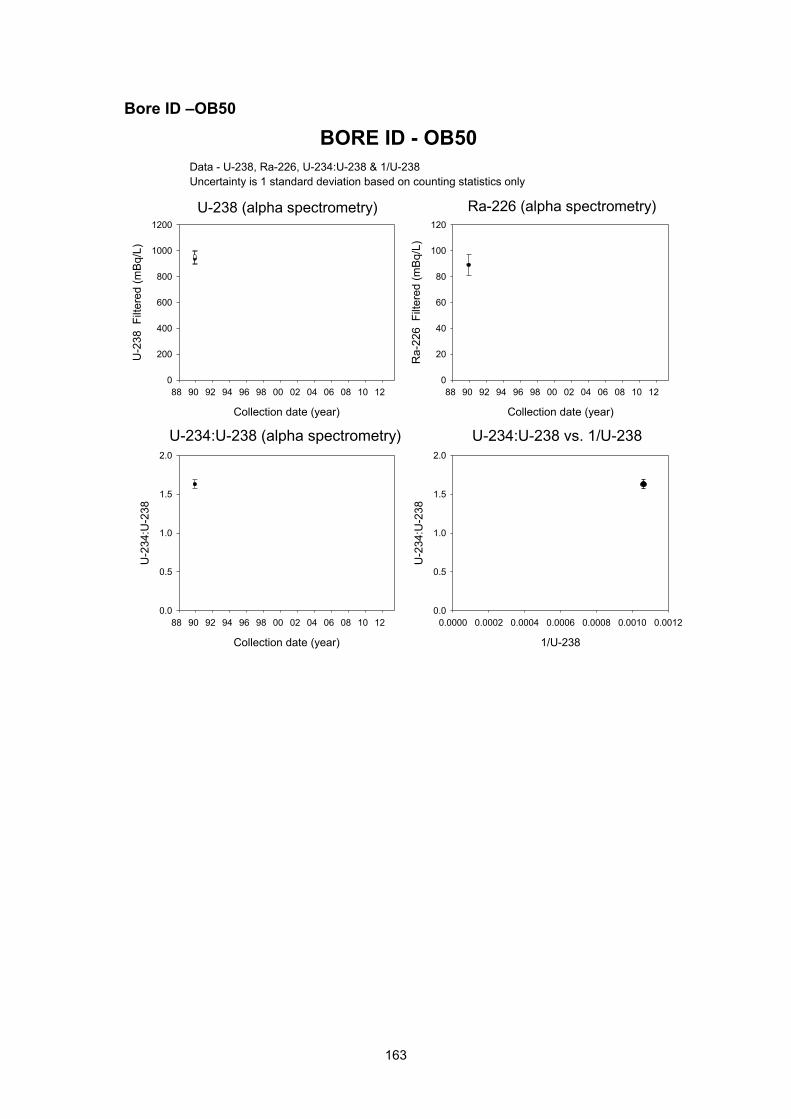
Bore ID – OB50 163
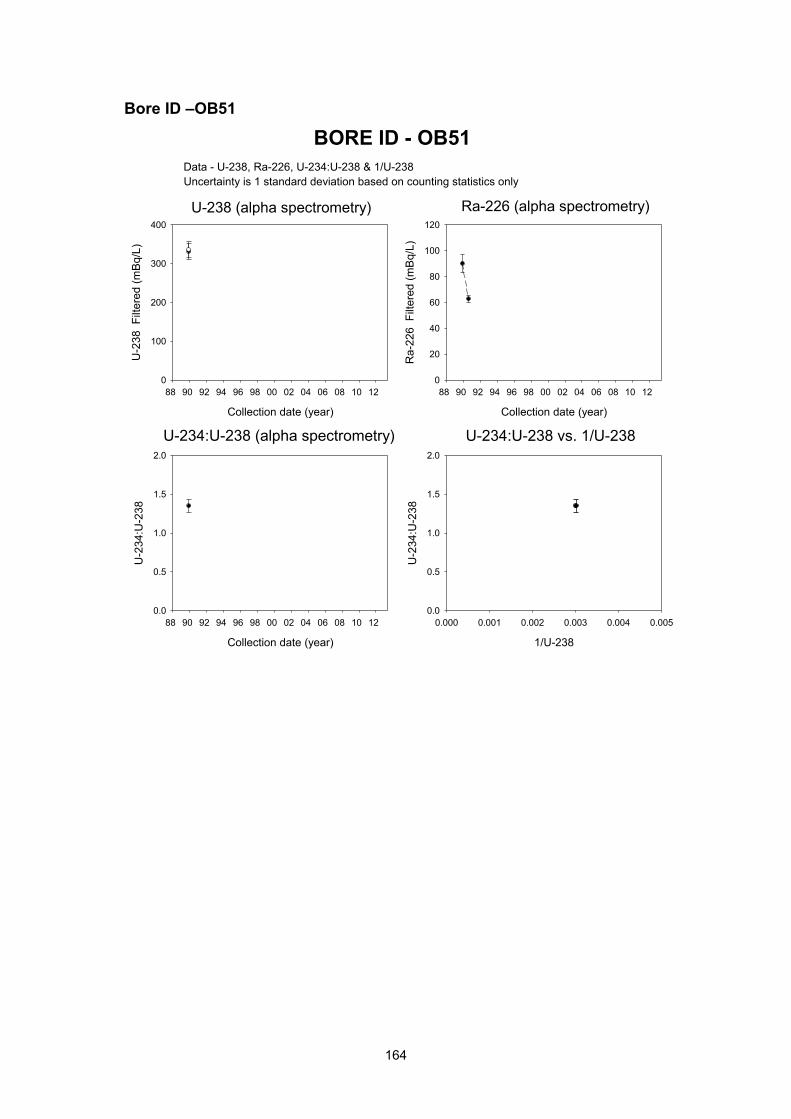
Bore ID – OB51 164
Bore ID – OB4A 165
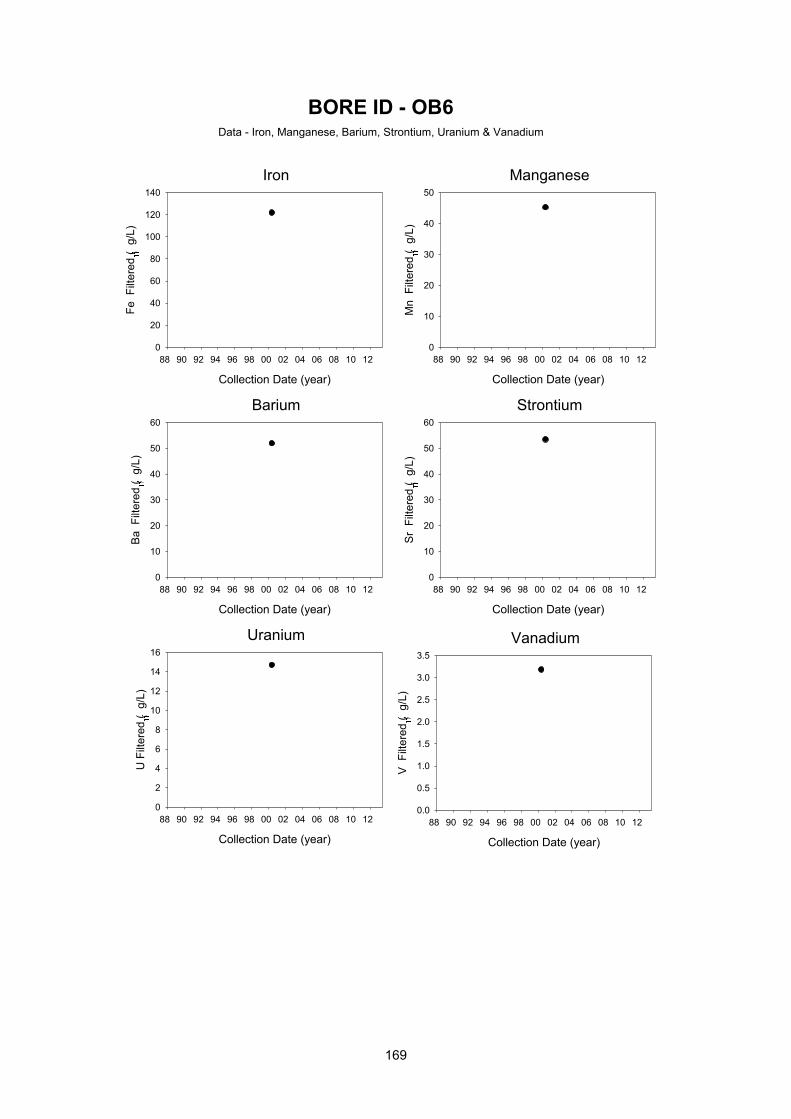
Bore ID – OB6 168
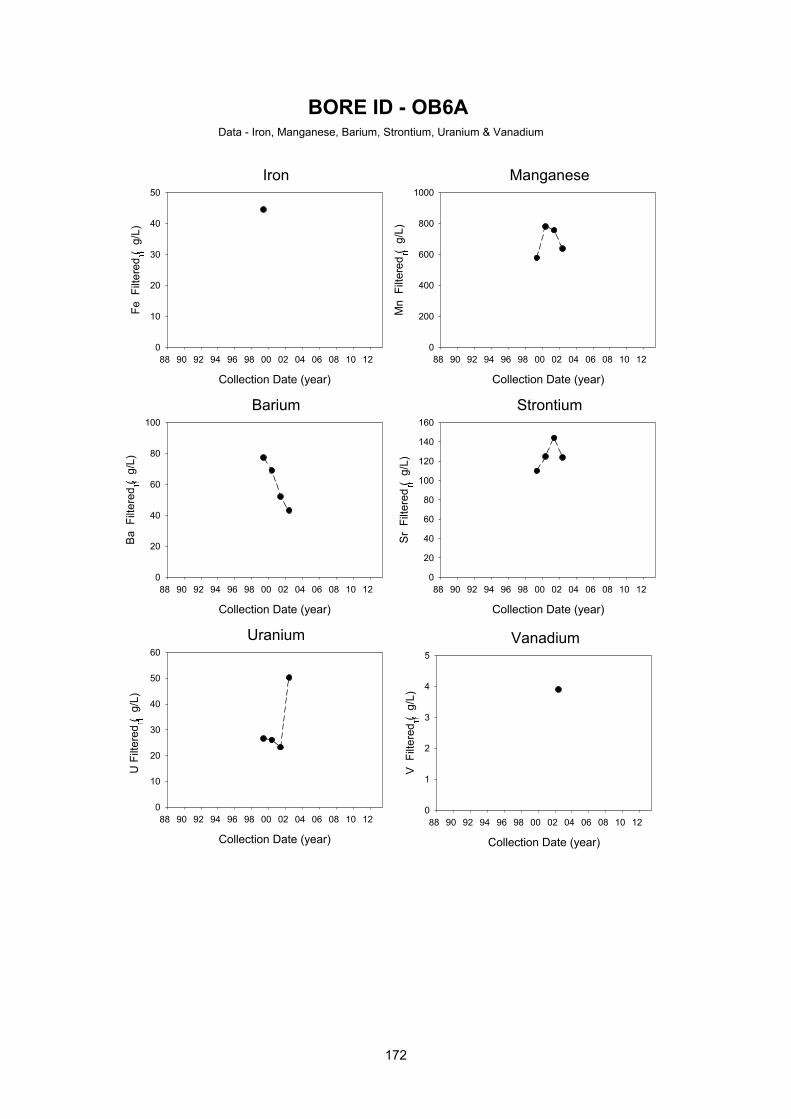
Bore ID – OB6A 171
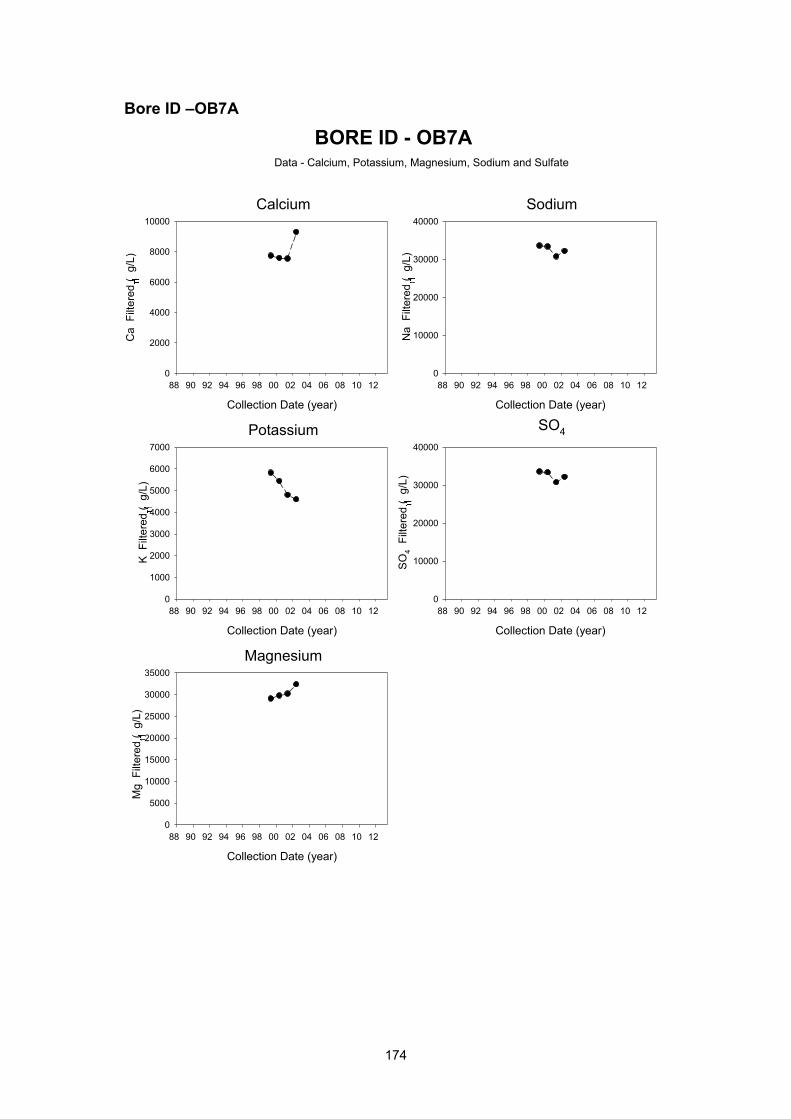
Bore ID – OB7A 174
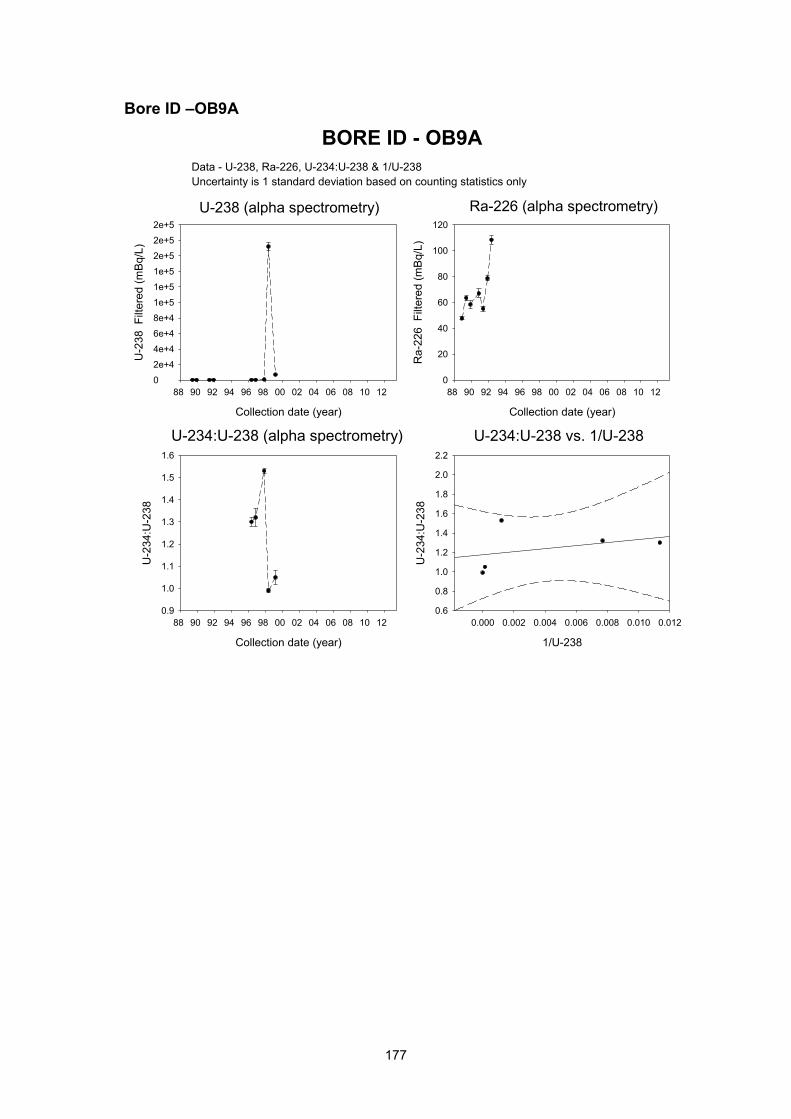
Bore ID – OB9A 177
v
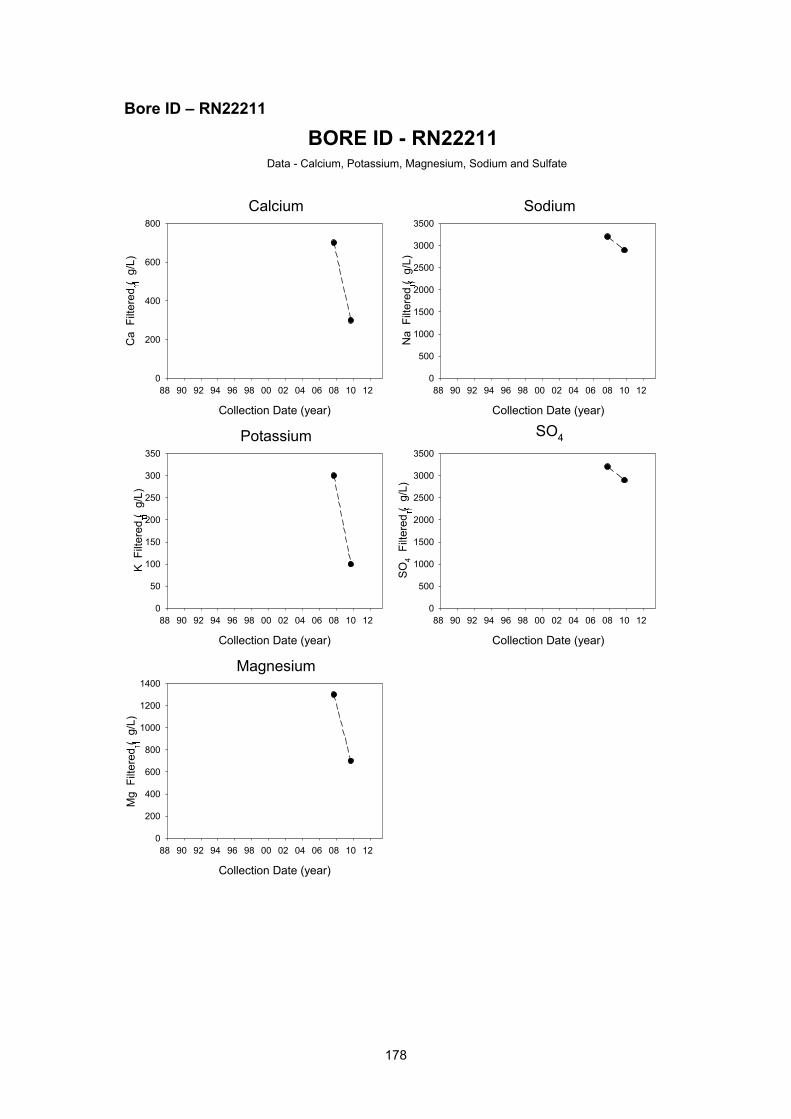
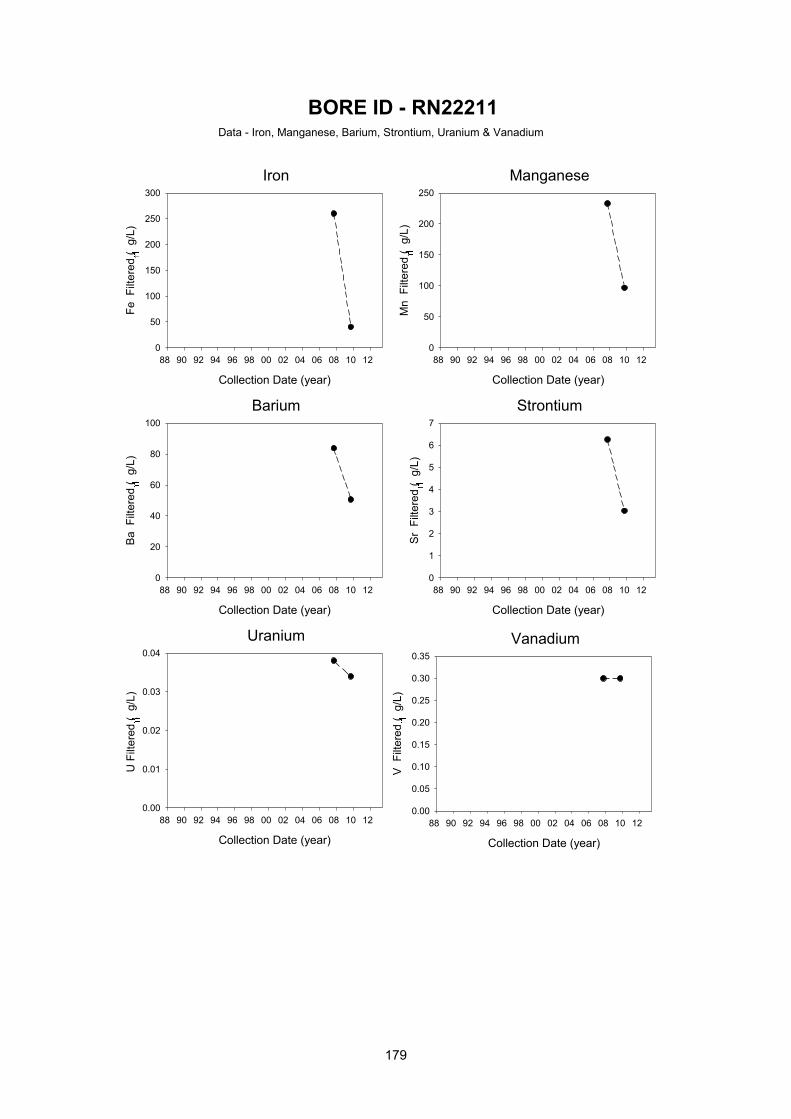
Bore ID – RN22211 178
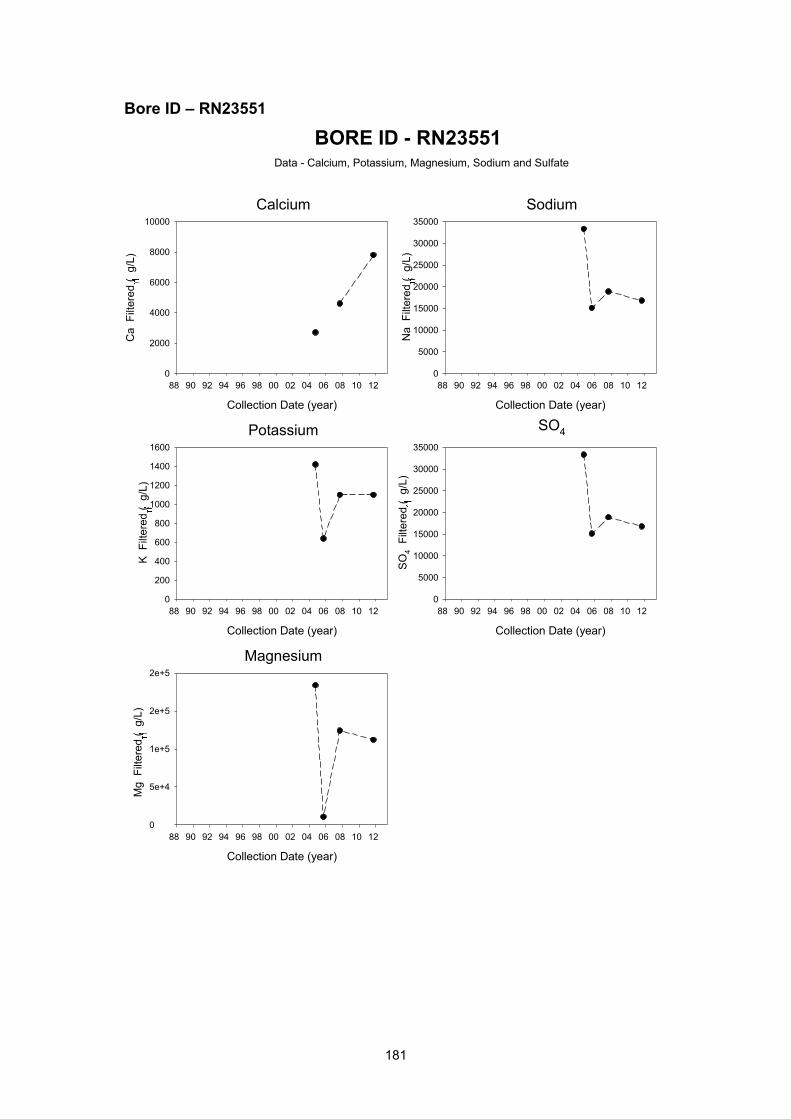
Bore ID – RN23551 181
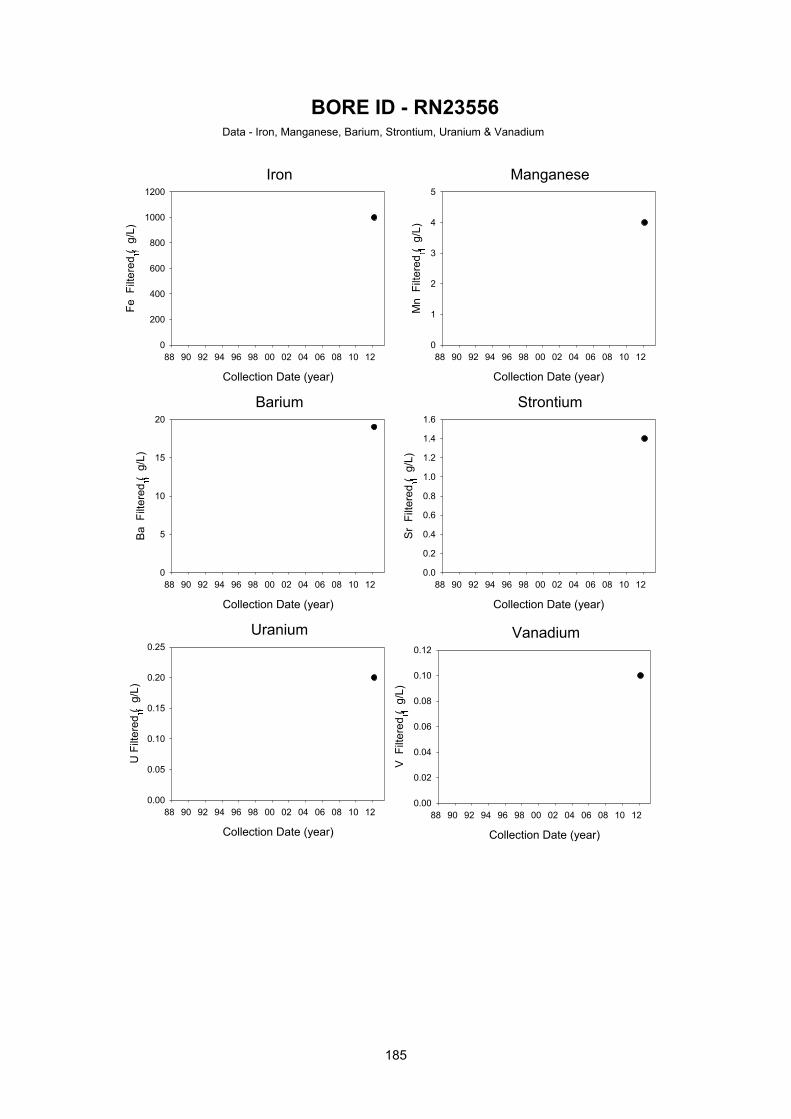
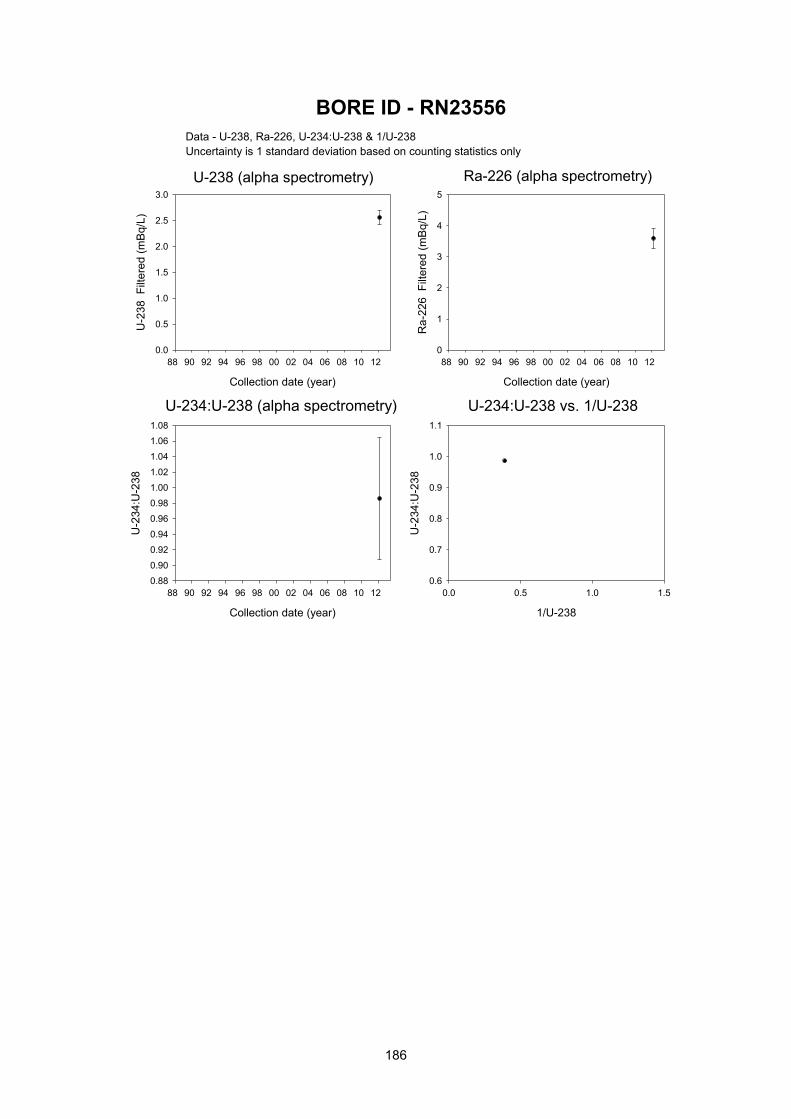
Bore ID – RN23556 184
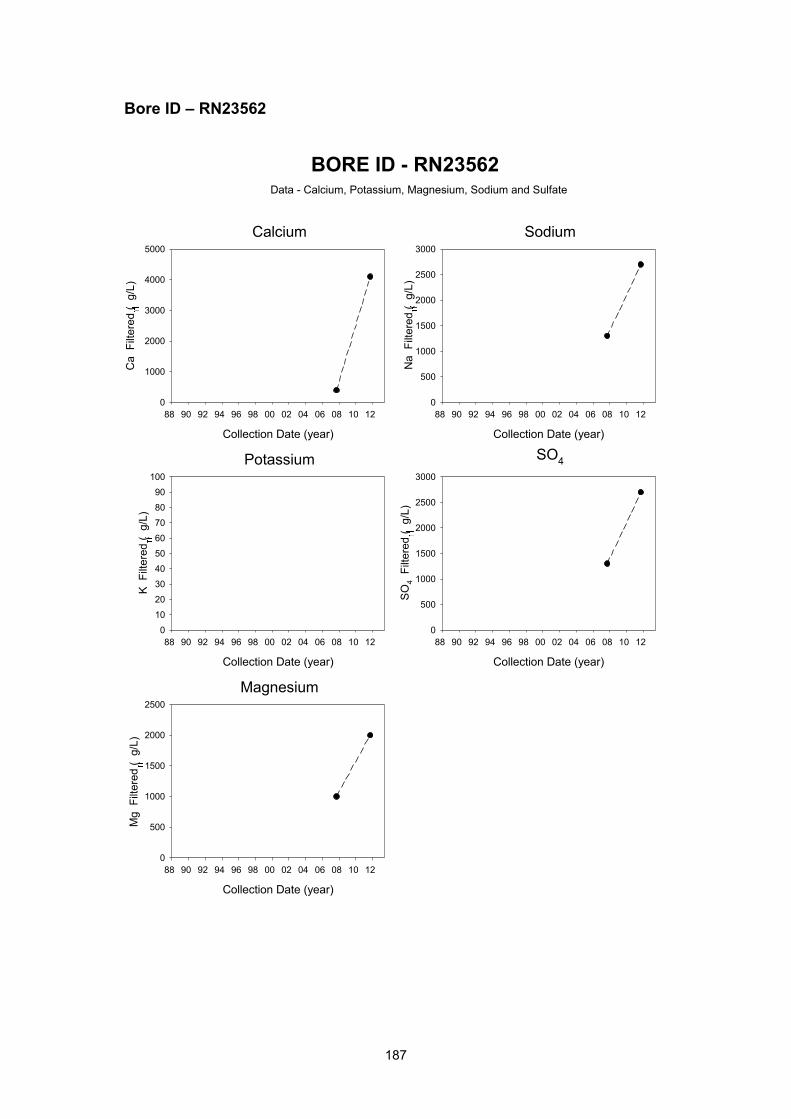
Bore ID – RN23562 187
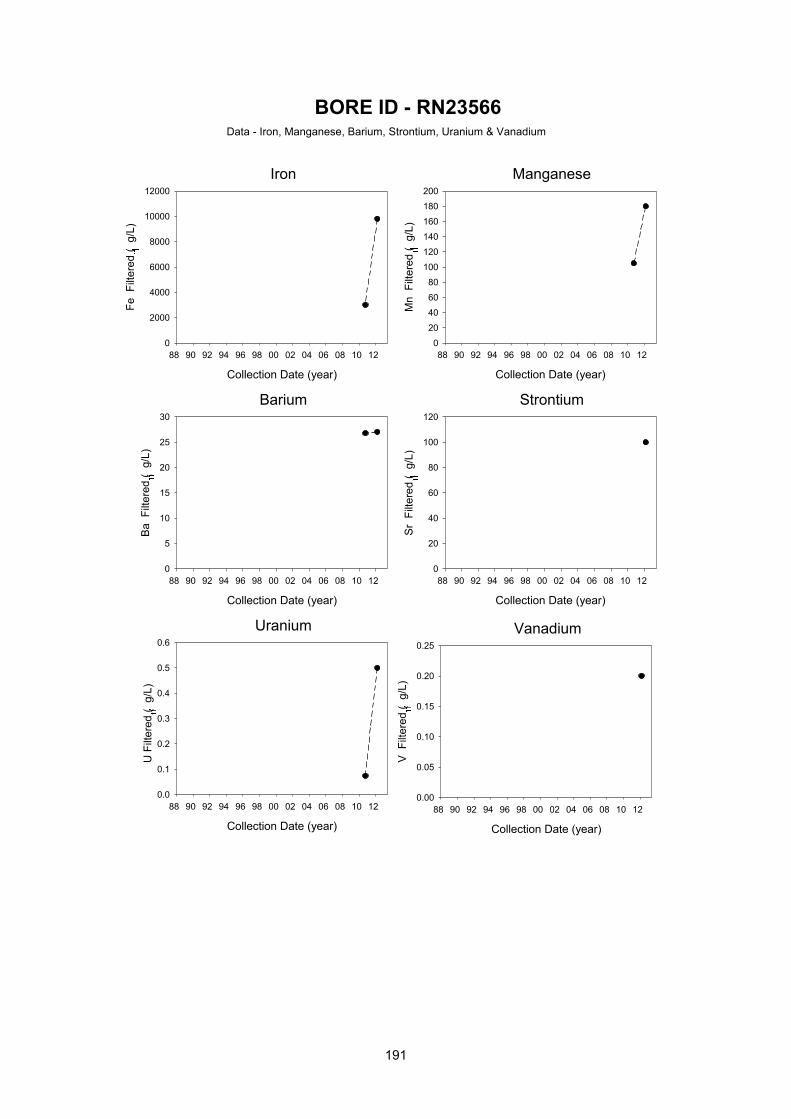
Bore ID – RN23566 190
Bore ID – RN23568 193
Bore ID – RN8708 196
Bore ID – RN9329 199
Bore ID – RP1N1 and RP1N2 202
Bore ID – OB79/6A 203
Bore ID – R.P. 79/ 2 204
Bore ID – R.P. 79/ 2 204
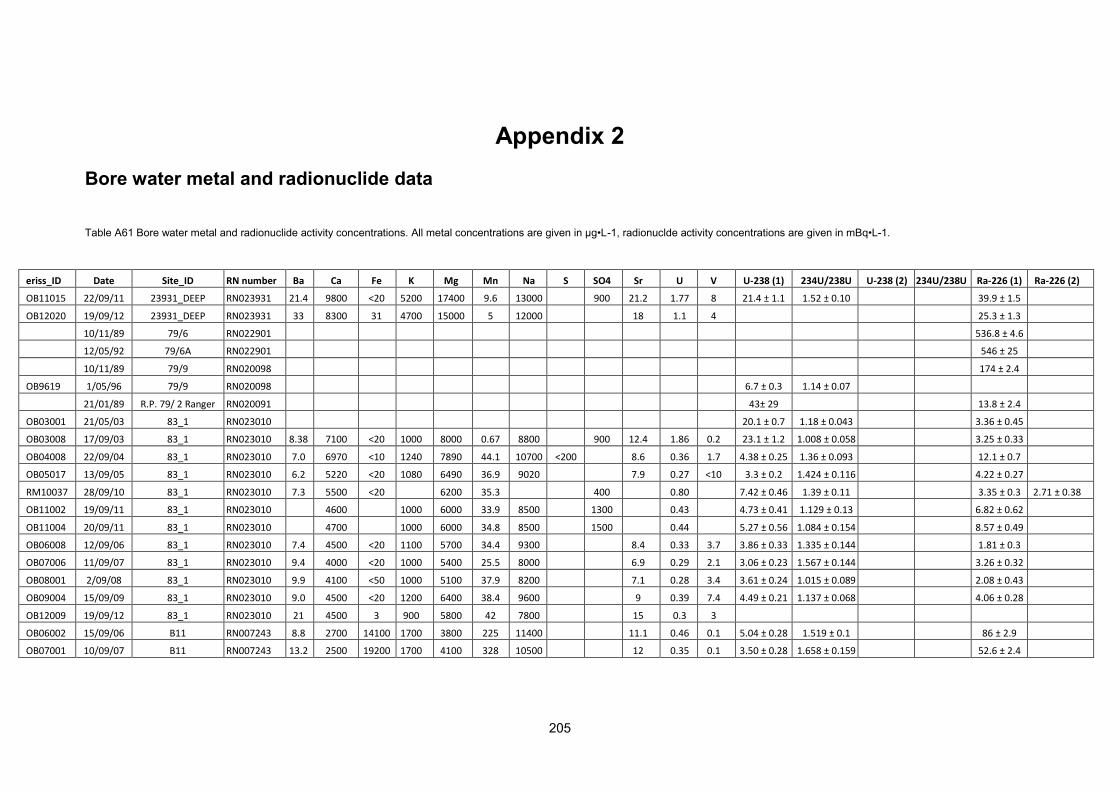
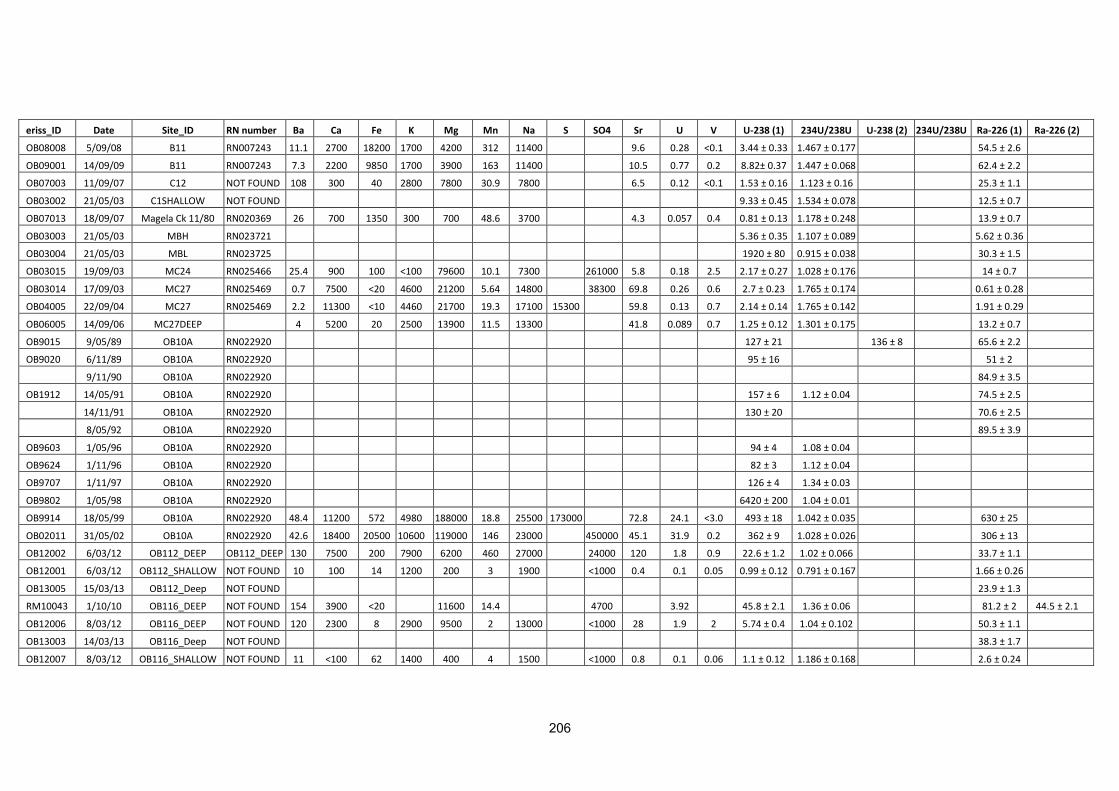
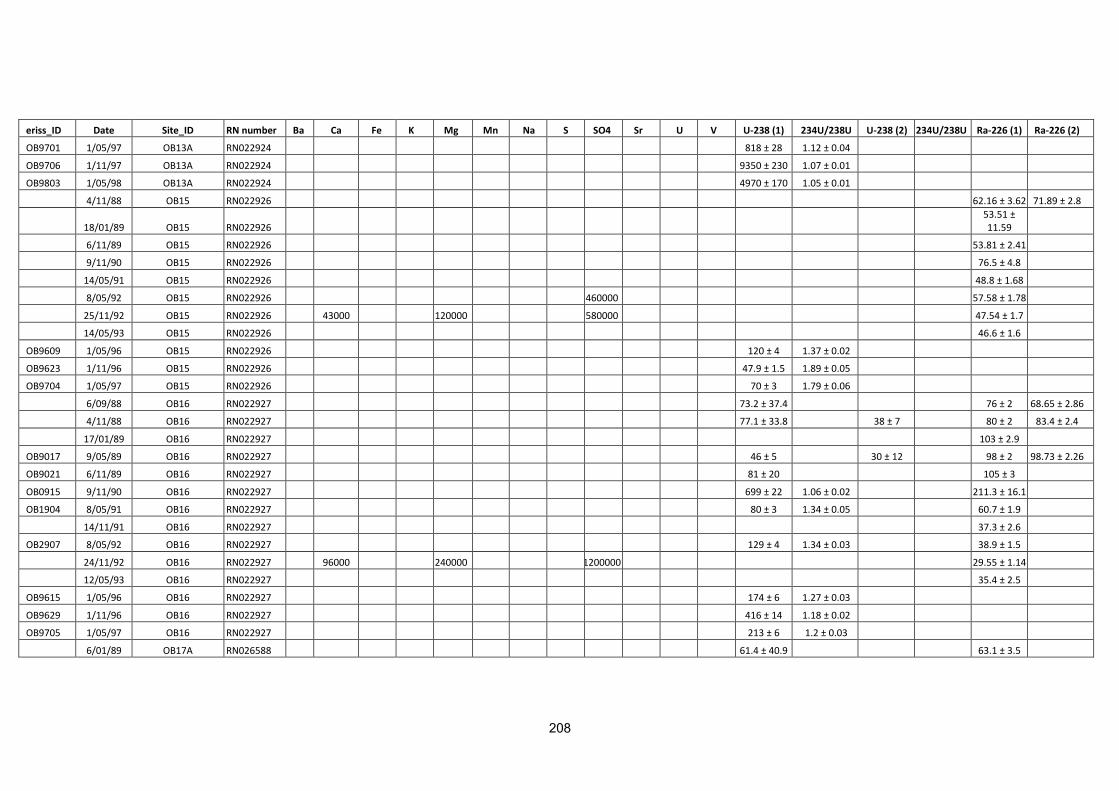
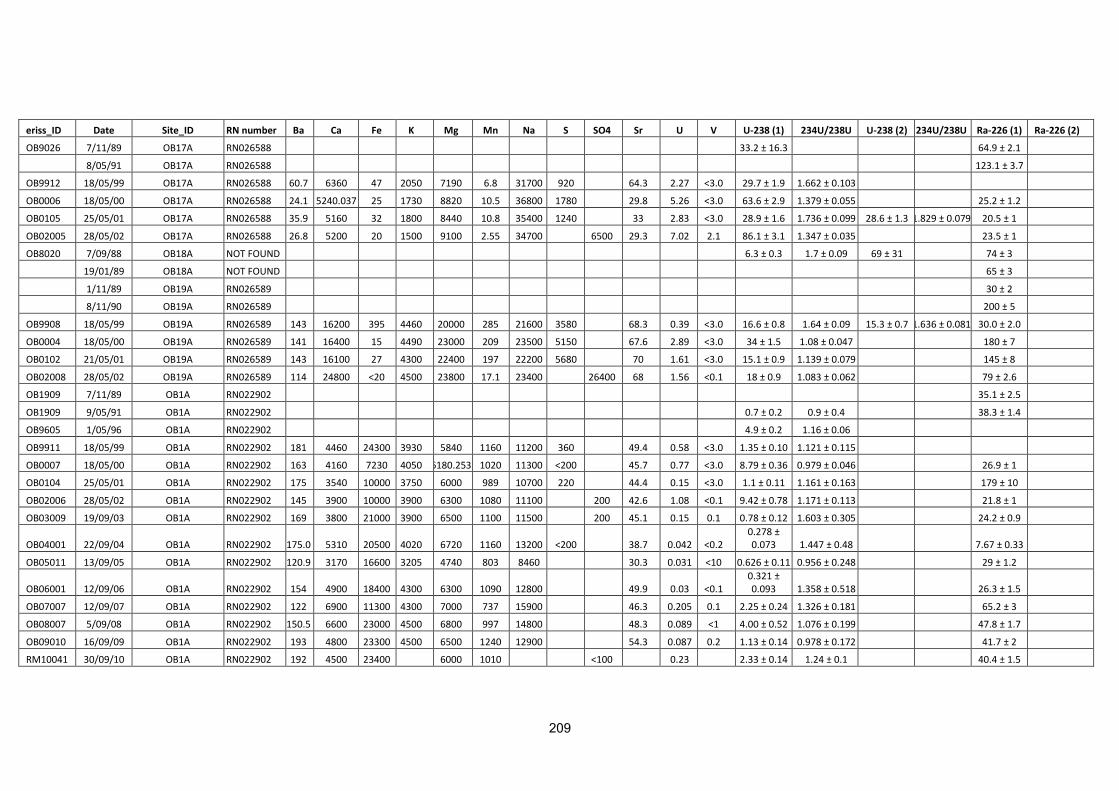
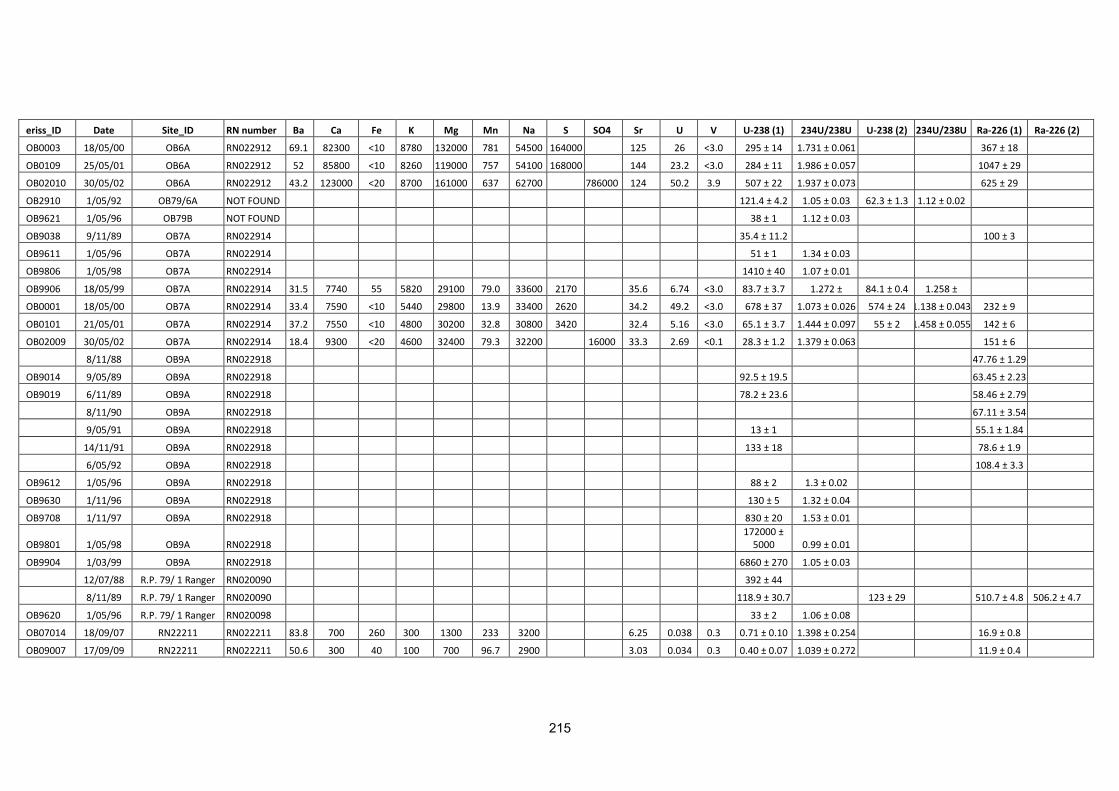
Appendix 2 205
Bore water metal and radionuclide data 205
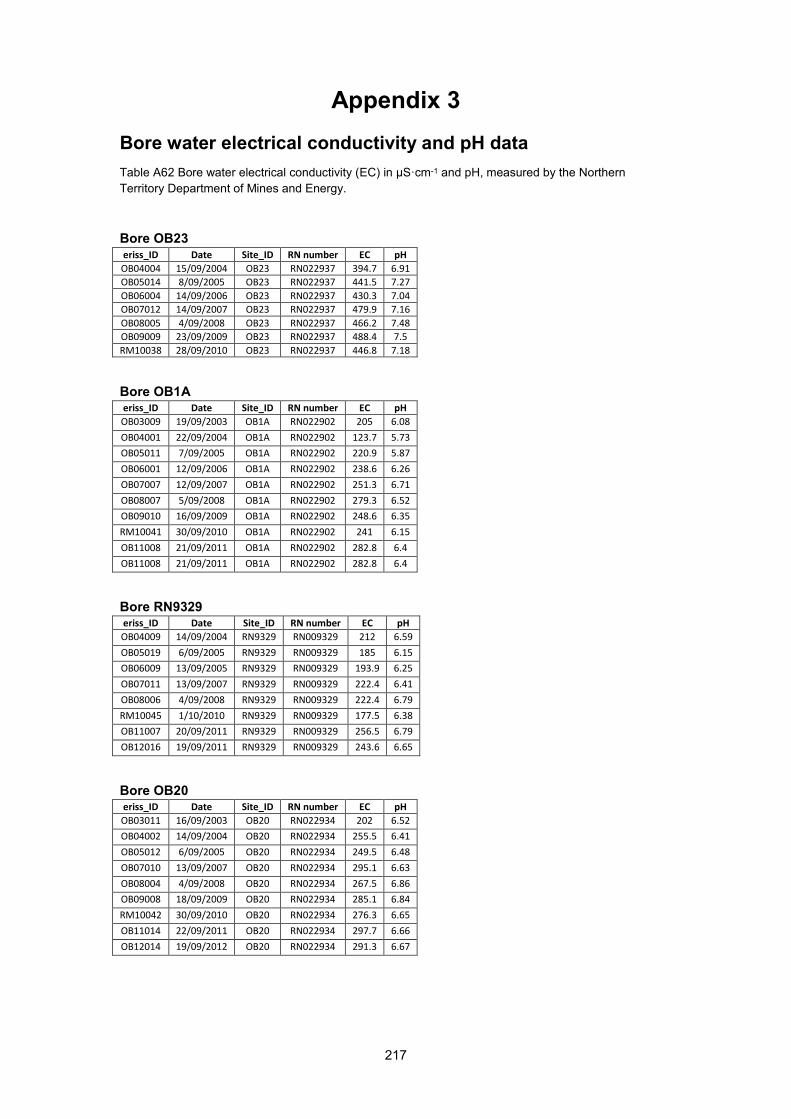
Appendix 3 217
Bore water electrical conductivity and pH data 217
6
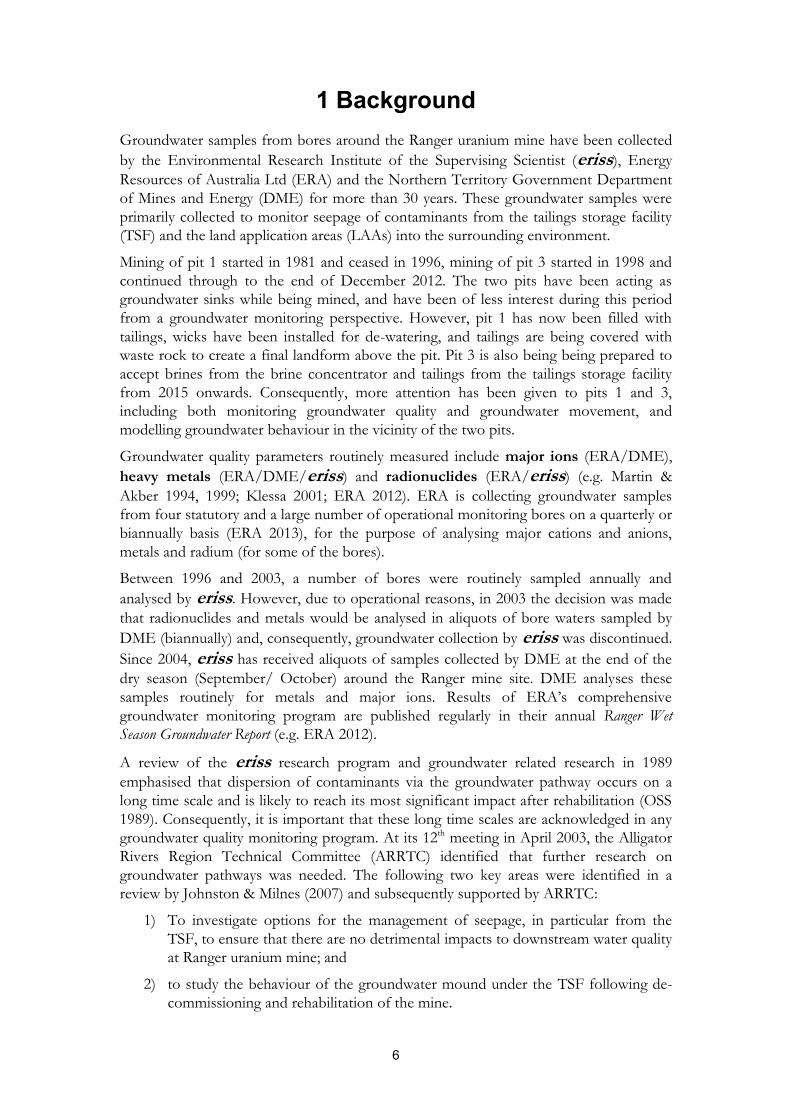
1 Background Groundwater samples from bores around the Ranger uranium mine have been collected
by the Environmental Research Institute of the Supervising Scientist (eriss), Energy
Resources of Australia Ltd (ERA) and the Northern Territory Government Department
of Mines and Energy (DME) for more than 30 years. These groundwater samples were
primarily collected to monitor seepage of contaminants from the tailings storage facility
(TSF) and the land application areas (LAAs) into the surrounding environment.
Mining of pit 1 started in 1981 and ceased in 1996, mining of pit 3 started in 1998 and
continued through to the end of December 2012. The two pits have been acting as
groundwater sinks while being mined, and have been of less interest during this period
from a groundwater monitoring perspective. However, pit 1 has now been filled with
tailings, wicks have been installed for de-watering, and tailings are being covered with
waste rock to create a final landform above the pit. Pit 3 is also being being prepared to
accept brines from the brine concentrator and tailings from the tailings storage facility
from 2015 onwards. Consequently, more attention has been given to pits 1 and 3,
including both monitoring groundwater quality and groundwater movement, and
modelling groundwater behaviour in the vicinity of the two pits.
Groundwater quality parameters routinely measured include major ions (ERA/DME),
heavy metals (ERA/DME/eriss) and radionuclides (ERA/eriss) (e.g. Martin &
Akber 1994, 1999; Klessa 2001; ERA 2012). ERA is collecting groundwater samples
from four statutory and a large number of operational monitoring bores on a quarterly or
biannually basis (ERA 2013), for the purpose of analysing major cations and anions,
metals and radium (for some of the bores).
Between 1996 and 2003, a number of bores were routinely sampled annually and
analysed by eriss. However, due to operational reasons, in 2003 the decision was made
that radionuclides and metals would be analysed in aliquots of bore waters sampled by
DME (biannually) and, consequently, groundwater collection by eriss was discontinued.
Since 2004, eriss has received aliquots of samples collected by DME at the end of the
dry season (September/ October) around the Ranger mine site. DME analyses these
samples routinely for metals and major ions. Results of ERA’s comprehensive
groundwater monitoring program are published regularly in their annual Ranger Wet
Season Groundwater Report (e.g. ERA 2012).
A review of the eriss research program and groundwater related research in 1989
emphasised that dispersion of contaminants via the groundwater pathway occurs on a
long time scale and is likely to reach its most significant impact after rehabilitation (OSS
1989). Consequently, it is important that these long time scales are acknowledged in any
groundwater quality monitoring program. At its 12th meeting in April 2003, the Alligator
Rivers Region Technical Committee (ARRTC) identified that further research on
groundwater pathways was needed. The following two key areas were identified in a
review by Johnston & Milnes (2007) and subsequently supported by ARRTC:
1) To investigate options for the management of seepage, in particular from the
TSF, to ensure that there are no detrimental impacts to downstream water quality
at Ranger uranium mine; and
2) to study the behaviour of the groundwater mound under the TSF following de-
commissioning and rehabilitation of the mine.
7
ARRTC has also identified groundwater dispersion as one of the Key Knowledge Needs
that need to be addressed from a monitoring perspective. Monitoring of groundwater
should target the TSF, pit 1 and pit 3, where tailings are stored at present and will be
stored following rehabilitation, and will have to continue during and following
rehabilitation for a timeframe suitable to assess the success of rehabilitation and the
integrity of the pits as tailings repositories in the long term.
ARRTC also recommended that a whole-of-footprint solute transport model based on a
fractured rock simulation should be developed. The hydrogeological modelling is
performed by ERA and consultants, mainly the Commonwealth Scientific and Industrial
Research Organisation (CSIRO) and INTERA, a geosciences and engineering consulting
firm based in Austin, Texas. Whereas previous model development and application has
focussed on the TSF (e.g. Puhalovich et al 2012a,b), pit 1 (Kalf & Associates 2004;
Anderson & Timms, 2009) and pit 3 (Salama et al 1998a-c; 1999) in isolation, INTERA
has developed a groundwater model for ERA including both, pits 1 and 3. Such
modelling will, ultimately, need to integrate groundwater seepage and surface water
runoff from the whole rehabilitated landform.
The focus of eriss’ groundwater monitoring and research projects has been the
measurement of groundwater radionuclide activity concentrations in various bores
around the mine, with some time records going back to the early 1980s. Whereas radium
isotopes and radium activity ratios were used as a process tracer and provided
information about adsorption and desorption mechanisms of radium in groundwater
(Martin & Akber 1996, 1999), uranium and uranium activity ratios are often used as a
source tracer to investigate the potential sources of uranium in groundwater (Ivanovich
& Harmon, 1994; Zielinski et al 1997; Iles et al 2002). However, longer time series are
needed to detect any changes in those parameters, which were not available in 2003
(Johnston & Milnes 2007). Consequently, it was decided that eriss would continue the
groundwater monitoring program around Ranger and focus on the measurement of 226Ra
and 238U activity concentrations, and the 234U/238U activity ratio in bore waters. Uranium
and radium activity concentrations have also been investigated at the rehabilitated
Nabarlek uranium mine and results of these investigations have been published in Ryan
& Bollhöfer (2007) and Ryan et al (2007).
In their conceptual pollution model for the operational phase of Ranger, Bartolo et al
(2013) identified the transport of inorganic toxicants and radionuclides via the ‘seepage
to groundwater to surface water pathway’ as a pathway of medium importance, with a
medium scientific knowledge base. Although significant progress has been made with
regards to groundwater modelling and tailings characterisation, some of the information
is still not used to its full extent, due to a disconnect between the various programs
involved in groundwater monitoring at Ranger. Groundwater quality data are currently
stored in various individual databases and formats. A meeting led by groundwater experts
from ERA was held in November 2011 to discuss a joint organisational approach, as part
of an effort to improve the Ranger groundwater knowledge base, facilitate a more
coordinated approach to the acquisition and storage of groundwater data and to progress
the development of closure criteria for Ranger. As an outcome of the meeting, eriss
radionuclide data from bores sampled by DME up to 2009 were sent to ERA for
inclusion in their comprehensive groundwater GIS.
All groundwater data available to eriss up to the end of December 2013, which include 226Ra and uranium isotopes and metals, have now been quality checked and verified and
imported into a single groundwater quality spreadsheet. The data have also been
8
migrated into the new eriss EnviroSys database. A summary of this eriss data is
provided in this report.
1.1 Aquifers at Ranger Two aquifers exist at Ranger: an unconfined shallow aquifer varying in thickness from 2
m to 20 m and associated with the soil profile and underlying laterite layer, and a
confined to semi-confined deep aquifer underlying weathered and fresh bedrock (Martin
& Akber 1996). A layer of low permeability sandy silty clay is commonly found between
the laterite and the weathered bedrock. Where it occurs, this layer forms a semi-confining
upper boundary to the deep aquifer. Ahmad and Green (1986) have divided the aquifers
in the Ranger region into three main types (rather than into a shallow and deep aquifer
only): type A is groundwater in the loose sand and gravels with high permeabilities, type
B is groundwater in the weathered profile with relatively low permeabilities and type C
groundwater occurs in the relatively fresh fractured rocks in the deep aquifer. This has
subsequently been modified by Salama & Foley (1997) who proposed a system that
recognises zonal influences and host lithologies. The aquifers are classified in their work
as alluvial (shallow) (aquifer 1a), weathered rock (upper: aquifer 1b; intermediate: aquifer
2) and deep fractured rock (aquifer 3) (Klessa 2001). The aquifers have been
characterised chemically by Salama and Foley (1997), and their classification is
reproduced in Table 1.
Table 1 Cation facies, anion facies, pH and EC (μS∙cm-1) in the three aquifer classes (Klessa 2001).
Major cations
Major anions pH EC
Superficial deposits and alluvium (aquifer1a)
Ca-Na HCO3-Cl 5.5 <50
Weathered Nanambu complex (aquifers 1b & 2)
Na-Ca-Mg HCO3-Cl 6-6.5 <200
Fractured Nanambu complex (aquifer 3)
Ca-Na HCO3 and HCO3-Cl-SO4 6.6-7.1 180-310
Figure 12 in ERA (2013) show groundwater monitoring sites and aquifer zones, together
with the specific aquifers (1a, 1b, 2 and 3) that are being intersected by some of their
groundwater monitoring bores.
1.2 Groundwater contaminants 1.2.1 Sources of groundwater contaminants Figure 1 shows an aerial photograph of the site with the main sources of groundwater
contamination highlighted.
The main sources of radionuclides in groundwater on the minesite at present are the
tailings in pit 1 and the TSF, application of radionuclides via land irrigation and the waste
rock and low grade ore stockpiles (Bartolo et al 2013). The TSF has historically been a
focus of groundwater investigations and, following a hydrogeological review of the area
surrounding the Ranger TSF, a groundwater monitoring program specifically focussed
on the TSF was developed and implemented by ERA in 2010. Results of ERA’s
groundwater monitoring program are routinely reported in ERA’s groundwater
monitoring reports (e.g. ERA 2012).
Tailings are also stored in pit 1. The RL0 level in pit 1 is at the base of the weathered
profile (and approximately 20 m below the lowest point at the edge of the pit) with
permeabilities of approximately 10-7 m/s (Haylen, 1981). This base acts like a barrier
9
between the deep aquifer, with relatively widespread groundwater occurrences, and the
shallow aquifer. The shallow aquifer has much higher permeabilities and can easily
connect to the surface water system (Mudd 2002). The MBL-aquifer (mine bore L) to the
south-east of pit 1 for example is highly permeable with permeabilities of around 10-4
m/s (Haylen 1981; Anderson & Timms, 2009) and connects to the Corridor Creek
system. A barrier has been put in place at the south-eastern wall of the pit (permeability
10-7-10-8 m/s) to prevent seepage into that layer and allow storage of tailings above RL0
(for which final approval is yet to be given). A large number of monitoring bores have
been installed in this area (ERA 2013).
Figure 1 Principal potential sources of contamination at Ranger
10
Mining in pit 3 ceased in December 2012 and backfilling of the pit with waste rock
started in 2013. Pit 3 is currently being prepared to accept tailings that will be dredged
from the TSF and deposited in the pit from 2015. Consequently, pit 3 is another area to
be targeted in any future groundwater monitoring programme, in particular the area
between the northern pit wall and Magela Creek, due to the existence of an extensive
shallow sand lens in that area that has been shown to be the major pathway for
groundwater from pit 3 into Magela Creek.
The land application areas (LAAs) within the Ranger lease are another potential source
of groundwater contamination. Since 1985, water stored in RP2 has been disposed of on-
site using land application methods during the dry season. RP2 receives seepage from all
stockpiles including ore and waste rock. The Magela LAA was the first to be established
using the spray irrigation method, and additional LAAs followed as the amount of water
to be disposed of increased over time as a result of the increasing area occupied by waste
rock and stockpiles. Starting in 1995, the RP1 and Djalkmara wetland filters were used to
polish RP2 water before being applied to the RP1 and the Djalkmara East and West
LAAs. Additional LAAs have been established in the Corridor Creek catchment and at
Jabiru East. From 2006 onwards, increasing volumes of pond water have been treated by
MF/RO water treatment plant with the clean permeate being discharged along the
Corridor Creek catchment line (Akber et al 2011a).
Land application to dispose of water is utilised because radionuclides bind strongly to the
surface horizons of soil profiles (Akber & Marten 1992; Willett & Bond 1992;
Hollingsworth et al 2005) and have limited impact on groundwater. A recently completed
project initiated by ERA has characterised the Ranger LAAs in the context of their
radiological status (Akber et al 2011 a,b,c). More conservative constituents, such as Mg and SO4, however, may seep into the ground and influence groundwater quality
downgradient of the LAAs. This has, for example, been observed at the rehabilitated
Nabarlek uranium mine that exhibited deviations from baseline nitrate, ammonium,
aluminium, cobalt and cadmium due to transport of contaminated groundwater
associated with irrigation at the forest irrigation area (Parker 2001).
1.2.2 Species of contaminants The relevant substances that may contaminate groundwater at Ranger can be divided into
three subgroups:
inorganic contaminants
organic contaminants
radionuclides
1.2.2.1 Inorganic contaminants
Noller (1991) identified nine inorganic elements in Ranger ore body 1 minerals with an
enrichment factor above 9.5 relative to typical Alligator Rivers Region rock. The most
important elements identified are gold, uranium, lead, copper, cadmium, silver and
mercury (in this context it should be noted that the ARR rocks themselves are enriched
relative to the crustal average in a variety of other elements). The milling process
introduces a number of additional other elements, mainly sulphur, magnesium and
manganese, into the process that may be present in groundwater in significant
quantities as well.
The Fox Inquiry (RUEI, 1975) predicted a number of contaminants that may influence
the Gulungul catchment, due to runoff from the waste rock used to construct the TSF
wall or via seepage from the TSF. The inorganic species specifically mentioned were
11
arsenic, cadmium, copper, lead, manganese, mercury, zinc and sulfate. Sulfate
moves freely in groundwater and is often used as an indicator for conservative mine
derived contaminants. leGras et al (1991, 1993) for instance found that tailings are the
main source of sulphur to groundwater in bores north of the TSF, where various faults
exist (Salama & Foley 1997), using sulphur isotope ratios.
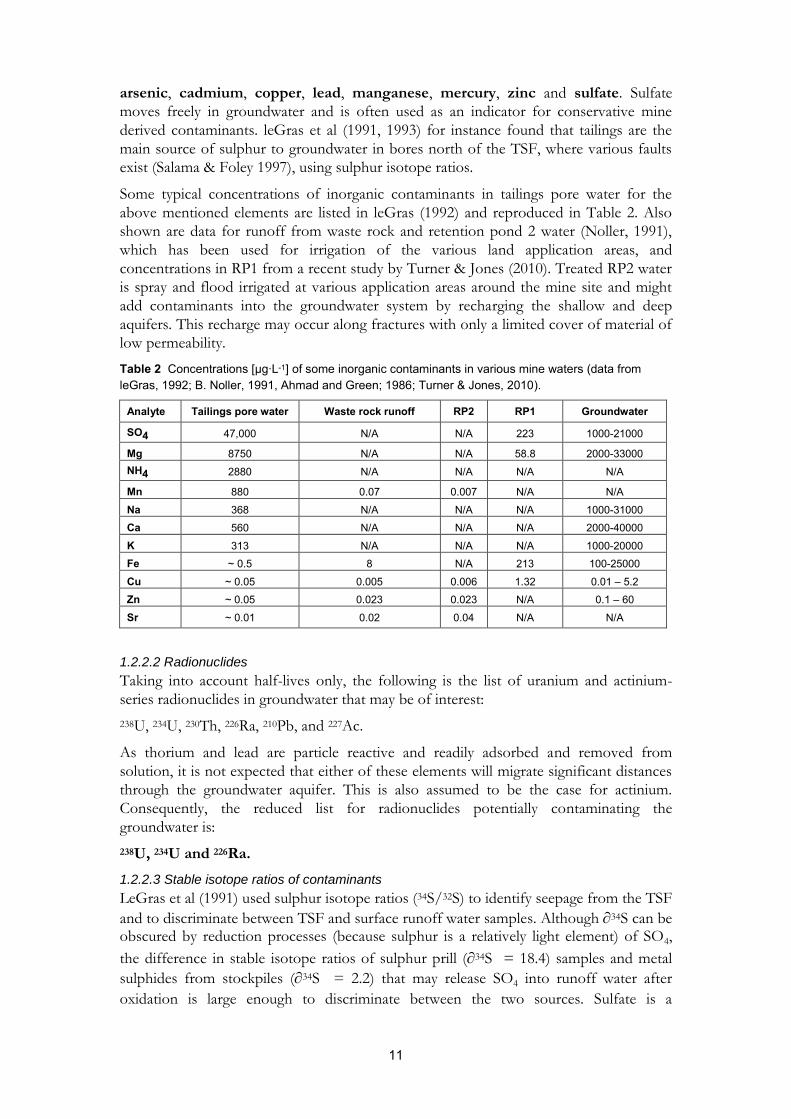
Some typical concentrations of inorganic contaminants in tailings pore water for the
above mentioned elements are listed in leGras (1992) and reproduced in Table 2. Also
shown are data for runoff from waste rock and retention pond 2 water (Noller, 1991),
which has been used for irrigation of the various land application areas, and
concentrations in RP1 from a recent study by Turner & Jones (2010). Treated RP2 water
is spray and flood irrigated at various application areas around the mine site and might
add contaminants into the groundwater system by recharging the shallow and deep
aquifers. This recharge may occur along fractures with only a limited cover of material of
low permeability.
Table 2 Concentrations [µg∙L-1] of some inorganic contaminants in various mine waters (data from leGras, 1992; B. Noller, 1991, Ahmad and Green; 1986; Turner & Jones, 2010).
Analyte Tailings pore water Waste rock runoff RP2 RP1 Groundwater
Taking into account half-lives only, the following is the list of uranium and actinium-
series radionuclides in groundwater that may be of interest:
238U, 234U, 230Th, 226Ra, 210Pb, and 227Ac.
As thorium and lead are particle reactive and readily adsorbed and removed from
solution, it is not expected that either of these elements will migrate significant distances
through the groundwater aquifer. This is also assumed to be the case for actinium.
Consequently, the reduced list for radionuclides potentially contaminating the
groundwater is:
238U, 234U and 226Ra.
1.2.2.3 Stable isotope ratios of contaminants
LeGras et al (1991) used sulphur isotope ratios (34S/32S) to identify seepage from the TSF
and to discriminate between TSF and surface runoff water samples. Although 34S can be obscured by reduction processes (because sulphur is a relatively light element) of SO4,
the difference in stable isotope ratios of sulphur prill (34S = 18.4) samples and metal
sulphides from stockpiles (34S = 2.2) that may release SO4 into runoff water after
oxidation is large enough to discriminate between the two sources. Sulfate is a
12
conservative contaminant and the sulphur isotope ratios provided a useful source tracer,
based on an existing difference between the sources of sulphur.
Furthermore, lead isotope ratios have also been used as a source tracer. Large variations
are found between lead isotope ratios in natural waters and TSF pore water for instance
(Gulson et al. 1996). Lead concentrations in bore waters are expected to be quite low, as
lead is readily adsorbed by particles in the groundwater. However, typical detection limit
for the measurement of lead via ICPMS is 0.02 ppb (parts per billion) or 20 ng per litre,
which is at least one order of magnitude lower than levels measured by Martin and Akber
(1999) or Gulson et al (1996).
1.2.2.4 Organic contaminants
Noller (1990) additionally listed the following potential organic contaminants:
alamine 336
iso-decanol
kerosene
diesel fuel
lubricants and greases
detergents
pesticides and herbicides.
In the context of groundwater at Ranger, these contaminants are relatively insignificant
compared to inorganic and radiological contaminants.
1.3 Solute transport 1.3.1 Groundwater flow at Ranger Haylen (1981) provided a description of the groundwater flows around the TSF and pit
1. The general direction of the groundwater flow in the region is towards the north along
the Ranger (Coonjimba) fault line. There are various other smaller fault lines in the
general Ranger area. One is in a north-easterly direction in the area of pit 3, and another
couple of fault lines dip towards the south-west near pit 1. Figure 2 highlights fault lines
in the vicinity of the Ranger TSF as shown in Verma & Salama (1986).
The possibility of rapid groundwater movement along fractures and cherts in the deep
aquifer, in particular in the vicinity of the TSF and RP1 area, was highlighted by Klessa
(2001). Changes in the surface topography at Ranger as a result of mining operations
have also resulted in significant changes to the characteristics of local hydrogeological
Seepage has resulted in the development of groundwater mounds under the TSF and
other water bodies on the mine site and the waste rock and ore stockpiles. Leakage is
controlled by fault zones which act as conduits, potentially transmitting contaminants to
downstream areas. However, most leakage from the TSF occurs along the fault-
controlled alignment of Coonjimba Creek and is likely to be contained within the existing
retention pond system (Puhalovich et al 2012a,b).
Recharge of the groundwater system is through infiltration of rainfall and through
infiltration from (natural and man made) water bodies, although substantial amounts of
early rainfall are lost due to evaporation (Ahmad and Green, 1986). The water from the
shallow aquifer percolates through the shallow and deep groundwater aquifer along the
higher permeability zones into the fractured rock aquifer. Haylen (1981) has also
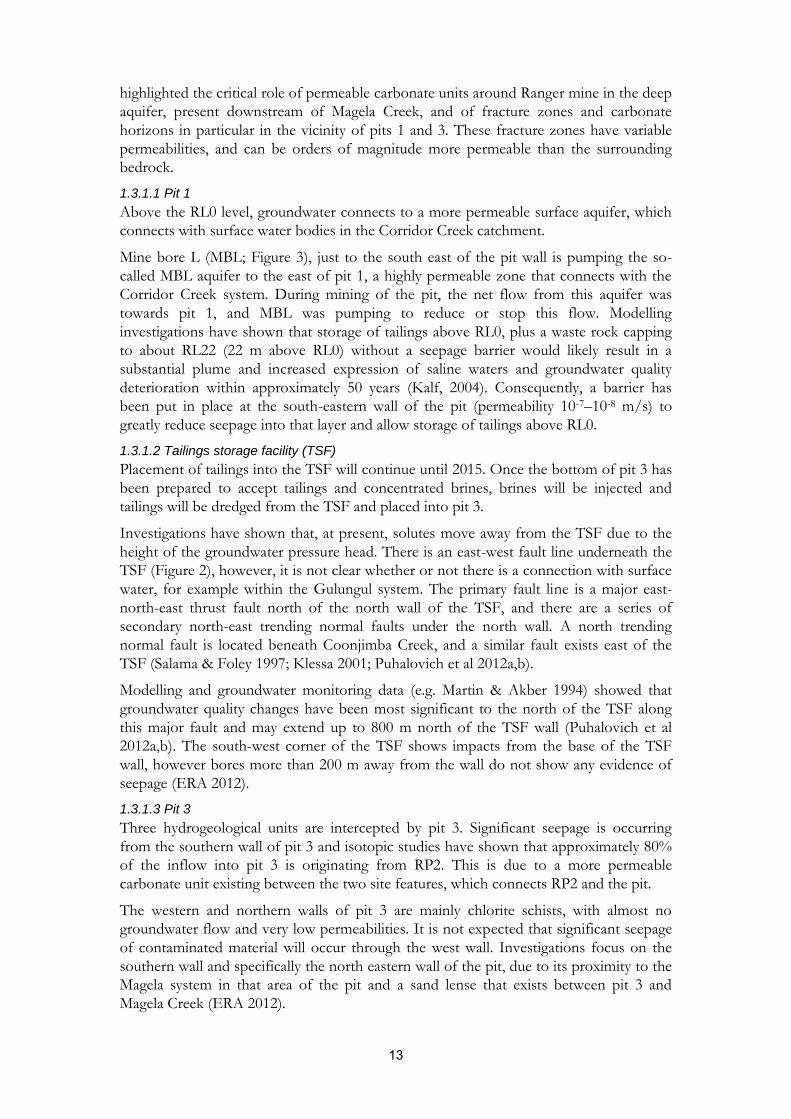
13
highlighted the critical role of permeable carbonate units around Ranger mine in the deep
aquifer, present downstream of Magela Creek, and of fracture zones and carbonate
horizons in particular in the vicinity of pits 1 and 3. These fracture zones have variable
permeabilities, and can be orders of magnitude more permeable than the surrounding
bedrock.
1.3.1.1 Pit 1
Above the RL0 level, groundwater connects to a more permeable surface aquifer, which
connects with surface water bodies in the Corridor Creek catchment.
Mine bore L (MBL; Figure 3), just to the south east of the pit wall is pumping the so-
called MBL aquifer to the east of pit 1, a highly permeable zone that connects with the
Corridor Creek system. During mining of the pit, the net flow from this aquifer was
towards pit 1, and MBL was pumping to reduce or stop this flow. Modelling
investigations have shown that storage of tailings above RL0, plus a waste rock capping
to about RL22 (22 m above RL0) without a seepage barrier would likely result in a
substantial plume and increased expression of saline waters and groundwater quality
deterioration within approximately 50 years (Kalf, 2004). Consequently, a barrier has
been put in place at the south-eastern wall of the pit (permeability 10-7–10-8 m/s) to
greatly reduce seepage into that layer and allow storage of tailings above RL0.
1.3.1.2 Tailings storage facility (TSF)
Placement of tailings into the TSF will continue until 2015. Once the bottom of pit 3 has
been prepared to accept tailings and concentrated brines, brines will be injected and
tailings will be dredged from the TSF and placed into pit 3.
Investigations have shown that, at present, solutes move away from the TSF due to the
height of the groundwater pressure head. There is an east-west fault line underneath the
TSF (Figure 2), however, it is not clear whether or not there is a connection with surface
water, for example within the Gulungul system. The primary fault line is a major east-
north-east thrust fault north of the north wall of the TSF, and there are a series of
secondary north-east trending normal faults under the north wall. A north trending
normal fault is located beneath Coonjimba Creek, and a similar fault exists east of the
TSF (Salama & Foley 1997; Klessa 2001; Puhalovich et al 2012a,b).
Modelling and groundwater monitoring data (e.g. Martin & Akber 1994) showed that
groundwater quality changes have been most significant to the north of the TSF along
this major fault and may extend up to 800 m north of the TSF wall (Puhalovich et al
2012a,b). The south-west corner of the TSF shows impacts from the base of the TSF
wall, however bores more than 200 m away from the wall do not show any evidence of
seepage (ERA 2012).
1.3.1.3 Pit 3
Three hydrogeological units are intercepted by pit 3. Significant seepage is occurring
from the southern wall of pit 3 and isotopic studies have shown that approximately 80%
of the inflow into pit 3 is originating from RP2. This is due to a more permeable
carbonate unit existing between the two site features, which connects RP2 and the pit.
The western and northern walls of pit 3 are mainly chlorite schists, with almost no
groundwater flow and very low permeabilities. It is not expected that significant seepage
of contaminated material will occur through the west wall. Investigations focus on the
southern wall and specifically the north eastern wall of the pit, due to its proximity to the
Magela system in that area of the pit and a sand lense that exists between pit 3 and
Magela Creek (ERA 2012).
14
Figure 2 Fault lines around the TSF, from Verma & Salama (1986)
1.3.2 Storage and reaction processes There are two distinctively different sources of groundwater solutes: primary and
secondary sources. Primary sources, for example, are radionuclides or more conservative solutes such as SO4 originating directly from tailings, spray- or flood irrigation, and
runoff from on-site structures or seepage from tailings. Secondary sources could be
solutes remobilised due to groundwater- rock interaction caused by pH and redox
reactions, desorption and ion-exchange processes and dissolution of minerals. These
secondary processes may have a significant effect on solute concentrations in
groundwater.
Martin and Akber (1999), for example, showed that competition for cation adsorption
sites is the primary driver of elevated Ra-226 concentrations in bores around the TSF.
This is caused by an increase in salinity, rather than from direct transport of radium from
the tailings. Overall, they concluded that remobilisation rather than direct transport is the
most important factor controlling radium concentration in ground waters. Kalf &
Dudgeon (1999) estimated that retardation factors for uranium are 5–10 times lower than
for radium in the Kombolgie and Cahill formations. Therefore, it can be expected that
uranium concentrations may be less influenced by storage processes than radium.
Contaminants can also be stored in various ‘compartments’. Akber and Marten (1992),
Willet and Bond (1992) and Akber et al (2011a,b) showed that uranium, radium and lead
applied to the land application areas are readily adsorbed in the first few centimetres of
the soil profile, and that remobilisation of these elements is small. In contrast, most soils
have a limited capacity to retain major ions such as magnesium and sulfate, and also
nitrate after oxidation of ammonia in the aerobic zone of soils (McBride 1992). Based on
these considerations, land application can most likely be excluded as a significant source
of radionuclides and most heavy metals, but it can play a major role in adding more
conservative ions to the groundwater aquifer. This has, for instance, been shown at
Nabarlek where spray irrigation has led to a significant impact on sulfate concentration
measured in groundwater bores around the site (Mudd 2002).
15
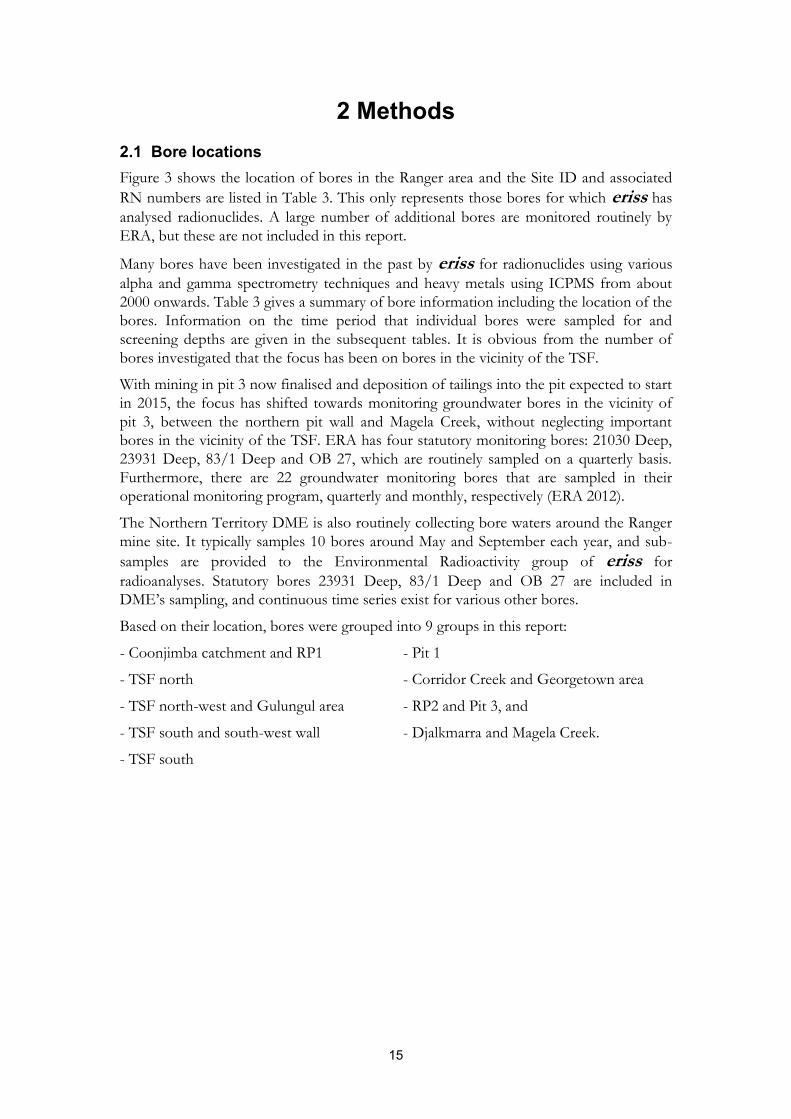
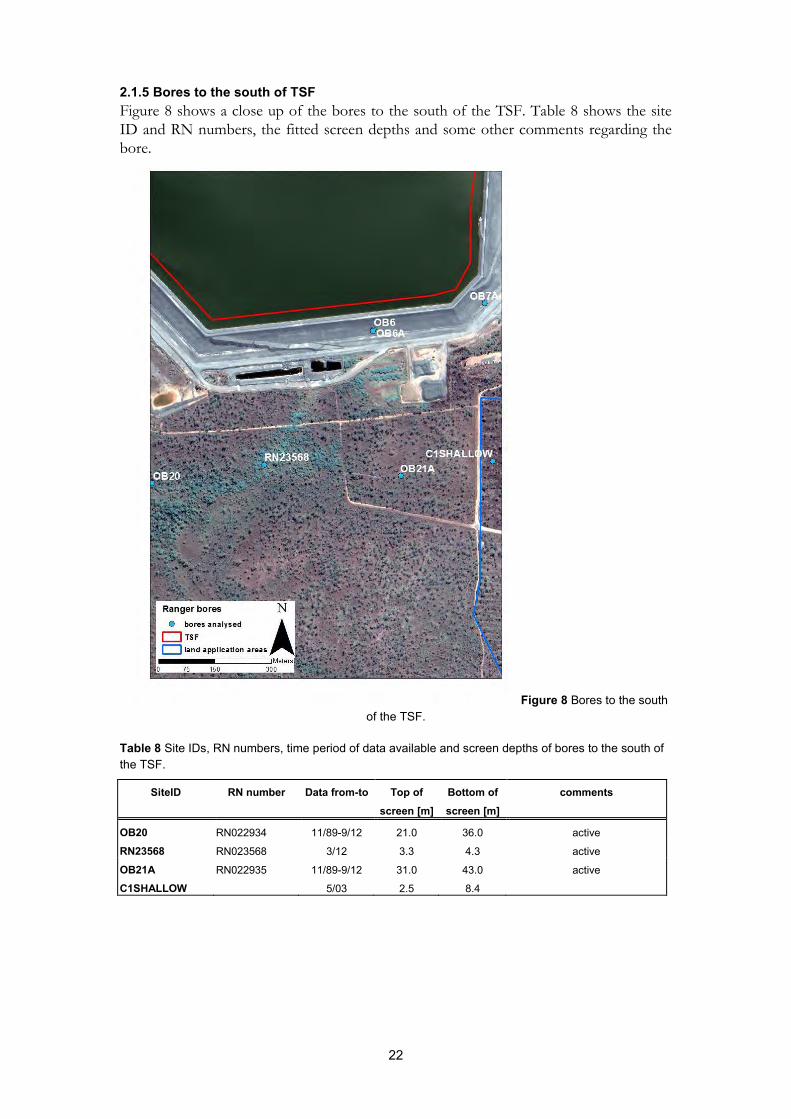
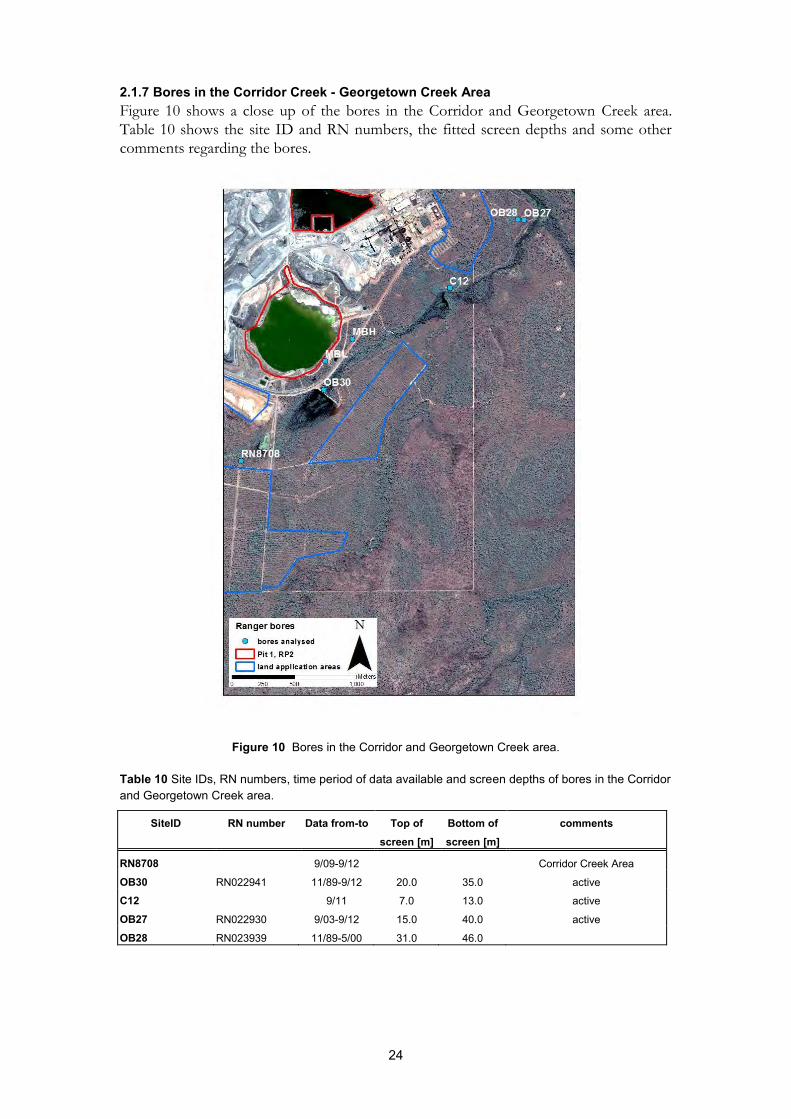
2 Methods 2.1 Bore locations Figure 3 shows the location of bores in the Ranger area and the Site ID and associated
RN numbers are listed in Table 3. This only represents those bores for which eriss has
analysed radionuclides. A large number of additional bores are monitored routinely by
ERA, but these are not included in this report.
Many bores have been investigated in the past by eriss for radionuclides using various
alpha and gamma spectrometry techniques and heavy metals using ICPMS from about
2000 onwards. Table 3 gives a summary of bore information including the location of the
bores. Information on the time period that individual bores were sampled for and
screening depths are given in the subsequent tables. It is obvious from the number of
bores investigated that the focus has been on bores in the vicinity of the TSF.
With mining in pit 3 now finalised and deposition of tailings into the pit expected to start
in 2015, the focus has shifted towards monitoring groundwater bores in the vicinity of
pit 3, between the northern pit wall and Magela Creek, without neglecting important
bores in the vicinity of the TSF. ERA has four statutory monitoring bores: 21030 Deep,
23931 Deep, 83/1 Deep and OB 27, which are routinely sampled on a quarterly basis.
Furthermore, there are 22 groundwater monitoring bores that are sampled in their
operational monitoring program, quarterly and monthly, respectively (ERA 2012).
The Northern Territory DME is also routinely collecting bore waters around the Ranger
mine site. It typically samples 10 bores around May and September each year, and sub-
samples are provided to the Environmental Radioactivity group of eriss for
radioanalyses. Statutory bores 23931 Deep, 83/1 Deep and OB 27 are included in
DME’s sampling, and continuous time series exist for various other bores.
Based on their location, bores were grouped into 9 groups in this report:
- Coonjimba catchment and RP1 - Pit 1
- TSF north - Corridor Creek and Georgetown area
- TSF north-west and Gulungul area - RP2 and Pit 3, and
- TSF south and south-west wall - Djalkmarra and Magela Creek.
- TSF south
16
Figure 3 Bores at Ranger uranium investigated by eriss, 1988-2012.
17
Table 3 Information on the bores sampled and analysed by eriss between 1988 and 2012.
OB10A RN022920 272822 8596651 TSF North Area OB11A RN022922 272538 8596823 TSF North Area OB12A RN022923 271857 8596869 TSF North Area OB13A RN022924 272233 8596813 TSF North Area OB15 RN022926 272320 8596972 TSF North Area OB16 RN022927 272292 8596818 TSF North Area
OB112_DEEP OB112_DEEP 271143 8595656 TSF Gulungul Area OB116_DEEP OB116_DEEP 271459 8595355 TSF Gulungul Area
OB116_SHALLOW 271460 8595349 TSF Gulungul Area OB17A RN026588 271745 8596882 TSF North Area OB19A RN026589 271812 8595640 TSF South Area OB1A RN022902 271561 8596865 TSF Gulungul Area OB20 RN022934 271822 8595161 TSF South Area
OB21A RN022935 272484 8595180 TSF South Area OB23 RN022937 271844 8597241 TSF North Area OB24 RN022938 272040 8597220 TSF North Area OB26 272409 8597134 TSF North Area OB27 RN022930 275523 8597063 Georgetown Area OB28 RN023939 275473 8597067 Magela LAA OB29 RN022940 274115 8597457 RP2 Area OB2A RN022904 271017 8596684 TSF Gulungul Area OB30 RN022941 273923 8595706 Corridor Creek area OB44 RN026593 272399 8597199 TSF North Area OB6 RN022911 272413 8595569 TSF South Area
OB6A RN022912 272410 8595566 TSF South Area OB7A RN022914 272707 8595639 TSF South Area OB9A RN022918 272738 8596373 TSF North Area
RN22211 RN022211 274683 8598647 Magela Ck RN23551 RN023551 272435 8597838 RP 1 Area RN23556 RN023556 271473 8597040 TSF North Area RN23562 RN023562 274404 8598253 Magela Creek RN23566 RN023566 270911 8596382 TSF Gulungul Area RN23568 RN023568 272121 8595210 TSF South Area RN8708 RN8708 273262 8595136 Corridor Creek Tails Corridor Area (DME)
and analysis techniques have been described in detail in Murray et al (1987).
Radium-226 activity concentrations were determined by alpha spectrometry after
radiochemical separation of radium from a bulk sample. For samples analysed prior to
2001 a method developed by Martin and Hancock (2004) was used. This involved co-precipitation of radium with Ba/PbSO4, anion and cation exchange separations followed
by electro deposition of radium onto a stainless steel planchet. Radium-225 was used as a
source tracer for chemical recovery determination in this technique and high resolution
of the source allowed measurement of all four naturally occurring radium isotopes. Since
2001 a new technique (Medley et al 2005) involving a dual co-precipitation of radium with Ba/PbSO4 followed by micro-filtration of the colloidal precipitate for source
preparation. Due to the poorer resolution of this source, alpha spectrometric
measurement only allows determination of 226Ra on these sources. Barium-133 was used
as a source tracer in these measurements and typical chemical recoveries should be above
85% to be confident that the assumption of similar chemical behaviour of barium and
radium in the chemical separation process is valid.
In cases where expected radium and/or uranium activity concentrations are close to the
detection limits for alpha spectrometric analysis (i.e. – less than 4 mBq/L), consecutive
analysis of radium and uranium was undertaken. This involved iron hydroxide co-
precipitation and TBP extraction. The aqueous waste solution from this solvent
extraction was heated with concentrated nitric acid to remove traces of solvent then used
for 226Ra determination using the micro-filtration technique.
Where consecutive analysis was undertaken chemical recoveries usually were lower than for samples undergoing co-precipitation of radium with Ba/PbSO4 only. It is believed
that this can be explained by massic losses during the iron hydroxide and TBP extraction
steps and that the accuracy of chemical recovery determination using the 133Ba tracer is
not adversely affected by this consecutive analysis process.
28
2.2.2 Measurement of metal concentrations Elemental and major anion analysis of filtered groundwater samples was undertaken by a
variety of isotope dilution, Inductively Coupled Plasma (ICP) spectrometry techniques.
These include ICP-Atomic emission spectrometry (ICPAES), ICP-Mass spectrometry
(ICPMS) and ICP-Optical emission spectrometry (ICPOES).
The particular suite of analytes that were measured in each batch of samples varied over
the period of sample collections, and the technique used for each element was
determined by the expected concentration of the analyte and the accuracy and precision
of the measurement technique (with ICPMS being the most sensitive method). ICP
analyses were performed at three different laboratories during the period of sample
collection; Charles Darwin University (formerly Northern Territory University) from
1999 to 2001 and 2004 to 2005, the Northern Territory Environmental Laboratories
(NTEL) from 2002 to 2003 and 2006 to 2011, and EnviroLabs in Sydney from 2012
onwards.
Samples were prepared for analysis by filtration through 0.45 µm cellulose acetate or
nitrocellulose filter papers. Samples were filtered in the eriss laboratories until 2003, at
which point filtration was undertaken in the field by DME.
Acidification of samples was done for sample preservation using either 2% concentrated
nitric acid or 0.5% concentrated hydrochloric acid (on a volume:volume basis). Typical
detection limits varied by analyte, sample volume and the technique used for analysis.
The range of detection limits for ICP analysis is shown in Table 13.
Table 13 Typical upper and lower range of detection limits for various ICP analytical techniques used for elemental and major anion analysis
2.2.3 Comparison of uranium concentrations measured via ICPMS and alpha spectrometry As uranium concentrations have been measured in some of the bore water samples by
both alpha spectrometry and ICPMS an independent quality assurance check of the
measured uranium concentration data was possible.
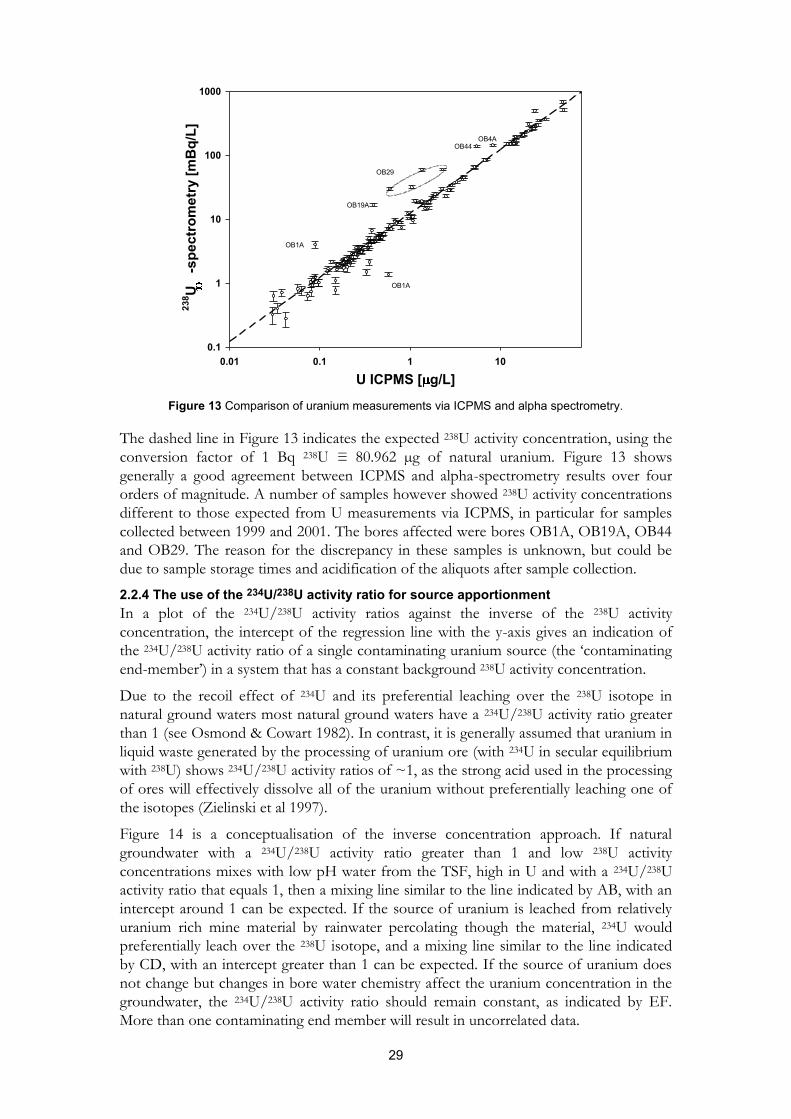
Figure 13 shows a comparison of uranium concentration results measured via ICPMS
and 238U activity concentration measurements via alpha spectrometry in the same sample,
for bore waters investigated in this study. The concentration range of these
measurements span four orders of magnitude.
29
Figure 13 Comparison of uranium measurements via ICPMS and alpha spectrometry.
The dashed line in Figure 13 indicates the expected 238U activity concentration, using the
conversion factor of 1 Bq 238U ≡ 80.962 µg of natural uranium. Figure 13 shows
generally a good agreement between ICPMS and alpha-spectrometry results over four
orders of magnitude. A number of samples however showed 238U activity concentrations
different to those expected from U measurements via ICPMS, in particular for samples
collected between 1999 and 2001. The bores affected were bores OB1A, OB19A, OB44
and OB29. The reason for the discrepancy in these samples is unknown, but could be
due to sample storage times and acidification of the aliquots after sample collection.
2.2.4 The use of the 234U/238U activity ratio for source apportionment In a plot of the 234U/238U activity ratios against the inverse of the 238U activity
concentration, the intercept of the regression line with the y-axis gives an indication of
the 234U/238U activity ratio of a single contaminating uranium source (the ‘contaminating
end-member’) in a system that has a constant background 238U activity concentration.
Due to the recoil effect of 234U and its preferential leaching over the 238U isotope in
natural ground waters most natural ground waters have a 234U/238U activity ratio greater
than 1 (see Osmond & Cowart 1982). In contrast, it is generally assumed that uranium in
liquid waste generated by the processing of uranium ore (with 234U in secular equilibrium
with 238U) shows 234U/238U activity ratios of ~1, as the strong acid used in the processing
of ores will effectively dissolve all of the uranium without preferentially leaching one of
the isotopes (Zielinski et al 1997).
Figure 14 is a conceptualisation of the inverse concentration approach. If natural
groundwater with a 234U/238U activity ratio greater than 1 and low 238U activity
concentrations mixes with low pH water from the TSF, high in U and with a 234U/238U
activity ratio that equals 1, then a mixing line similar to the line indicated by AB, with an
intercept around 1 can be expected. If the source of uranium is leached from relatively
uranium rich mine material by rainwater percolating though the material, 234U would
preferentially leach over the 238U isotope, and a mixing line similar to the line indicated
by CD, with an intercept greater than 1 can be expected. If the source of uranium does
not change but changes in bore water chemistry affect the uranium concentration in the
groundwater, the 234U/238U activity ratio should remain constant, as indicated by EF.
More than one contaminating end member will result in uncorrelated data.
U ICPMS [ g/L]0.01 0.1 1 10
238 U
-s
pect
rom
etry
[mB
q/L]
0.1
1
10
100
1000
OB19A
OB1A
OB29
OB44
OB1A
OB4A
30
Figure 14 Conceptualisation of the inverse activity concentration approach
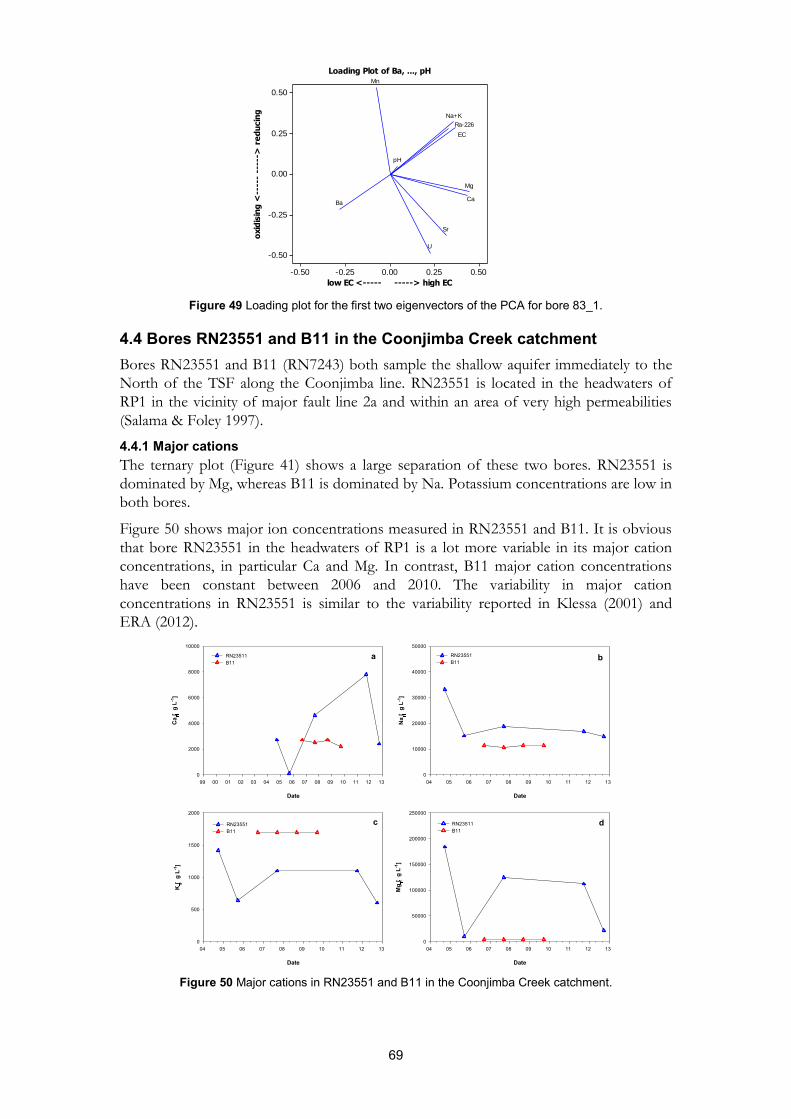
2.2.4 Statistical multivariate analysis (PCA) Groundwater quality data are summarised for the various catchments around the Ranger
mine site using Principal Components Analysis (PCA).
PCA is an eigenvector-based multivariate analysis for identifying a smaller number of
uncorrelated variables, called principal components, from a larger set of data. The general
goal of principal components analysis is to simplify a data set and explain the maximum
amount of variance with the fewest number of principal components (Jolliffe 2002;
Minitab 2015). In groundwaters, electrical conductivity (EC) or redox conditions often
are the driving factors of variability in water quality (e.g. Chen et al 2007).
Three plots are usually displayed to visualise the results of a PCA. These are the so-called
scree, loading and score plots. The scree plot displays the eigenvalues associated with
each factor from the PCA and can be used to assess the importance of each factor in
explaining the variability of the original data. The loading plot displays to what degree a
factor determined from the PCA explains the variability of a certain measured variable
and whether metal concentrations are positively or negatively correlated with the
principal components. PCA scores are calculated for each variable within a sample and
are plotted to investigate similarities between samples or sampling sites.
Minitab 16 is used for multivariate statistical analysis. Bores are grouped into various
catchments and the correlation matrix was used. Each variable is normalised to unit
variance and thus contributes equally to the PCA.
23
4U
/23
8 U a
ctiv
ity
rati
o
1/238U (L/Bq)
1
A
BC
DE F
31
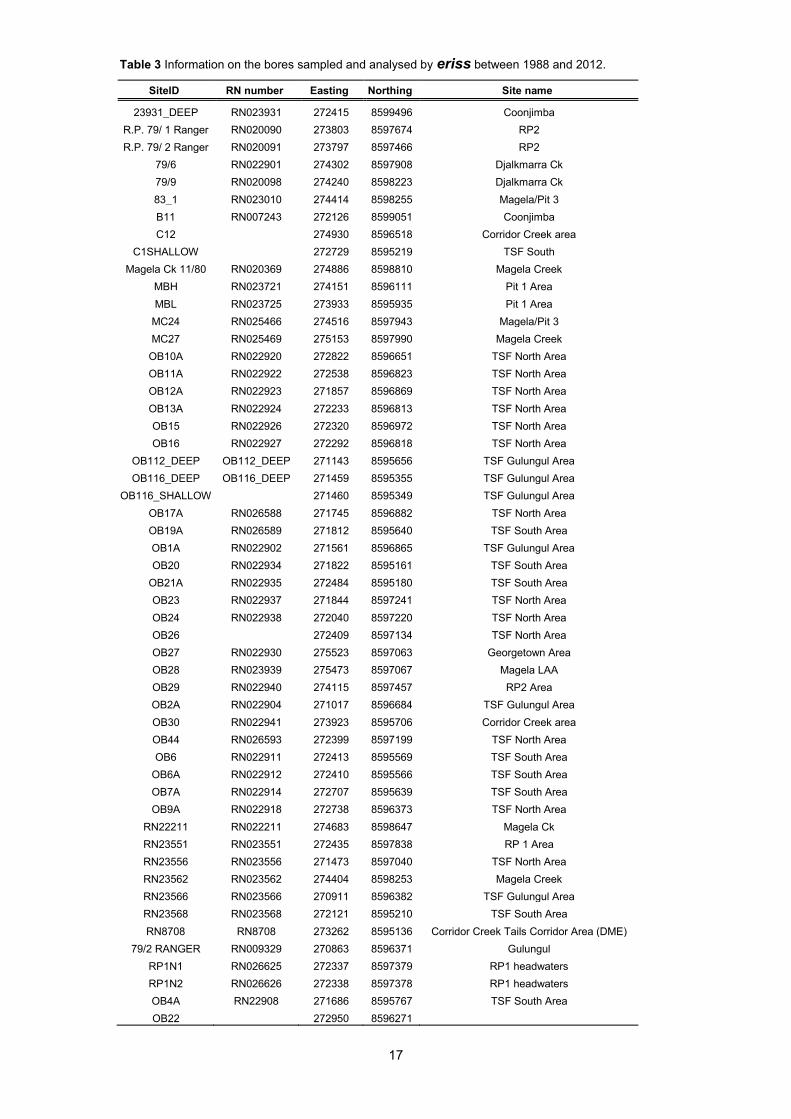
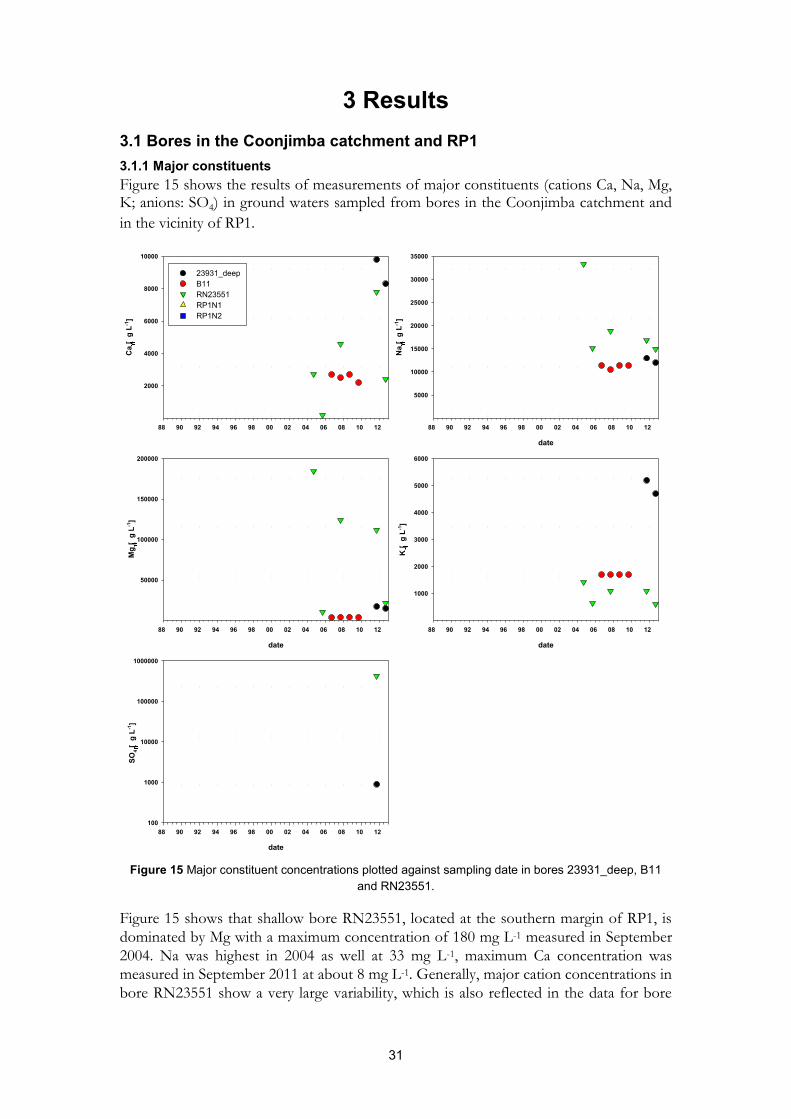
3 Results 3.1 Bores in the Coonjimba catchment and RP1 3.1.1 Major constituents Figure 15 shows the results of measurements of major constituents (cations Ca, Na, Mg, K; anions: SO4) in ground waters sampled from bores in the Coonjimba catchment and
in the vicinity of RP1.
Figure 15 Major constituent concentrations plotted against sampling date in bores 23931_deep, B11 and RN23551.
Figure 15 shows that shallow bore RN23551, located at the southern margin of RP1, is
dominated by Mg with a maximum concentration of 180 mg L-1 measured in September
2004. Na was highest in 2004 as well at 33 mg L-1, maximum Ca concentration was
measured in September 2011 at about 8 mg L-1. Generally, major cation concentrations in
bore RN23551 show a very large variability, which is also reflected in the data for bore
88 90 92 94 96 98 00 02 04 06 08 10 12
Ca
[g
L-1]
2000
4000
6000
8000
10000
23931_deepB11RN23551RP1N1RP1N2
date
88 90 92 94 96 98 00 02 04 06 08 10 12
Na
[g
L-1]
5000
10000
15000
20000
25000
30000
35000
date
88 90 92 94 96 98 00 02 04 06 08 10 12
SO4 [
g L-1
]
100
1000
10000
100000
1000000
date
88 90 92 94 96 98 00 02 04 06 08 10 12
Mg
[g
L-1]
50000
100000
150000
200000
date
88 90 92 94 96 98 00 02 04 06 08 10 12
K [
g L-1
]
1000
2000
3000
4000
5000
6000
32
RN23551 measured by ERA (ERA 2012). Sulfate in bore RN23551 was more than 400
mg L-1 in 2011.
Bore B11 is located between Coonjimba Billabong and the Jabiru East irrigation area.
Major cation concentrations show little variability, with Ca concentrations of about 2.5
mg L-1, Na about 10 mg L-1, Mg about 4 mg L-1 and K about 1.7 mg L-1.
The deep groundwater monitoring bore 23931_deep, located further downgradient of
Coonjimba Billabong, is a statutory monitoring bore of ERA. A comparison with data
from ERA shows that Ca concentrations (8-10 mg L-1) are similar to end of the dry
season measurements made by ERA, with wet season concentrations being lower at
about 5 mg L-1 (ERA 2012). Bore 23931_deep is dominated by Ca and Na, typical for
bores located in the fractured Nanambu complex (Klessa 2001).
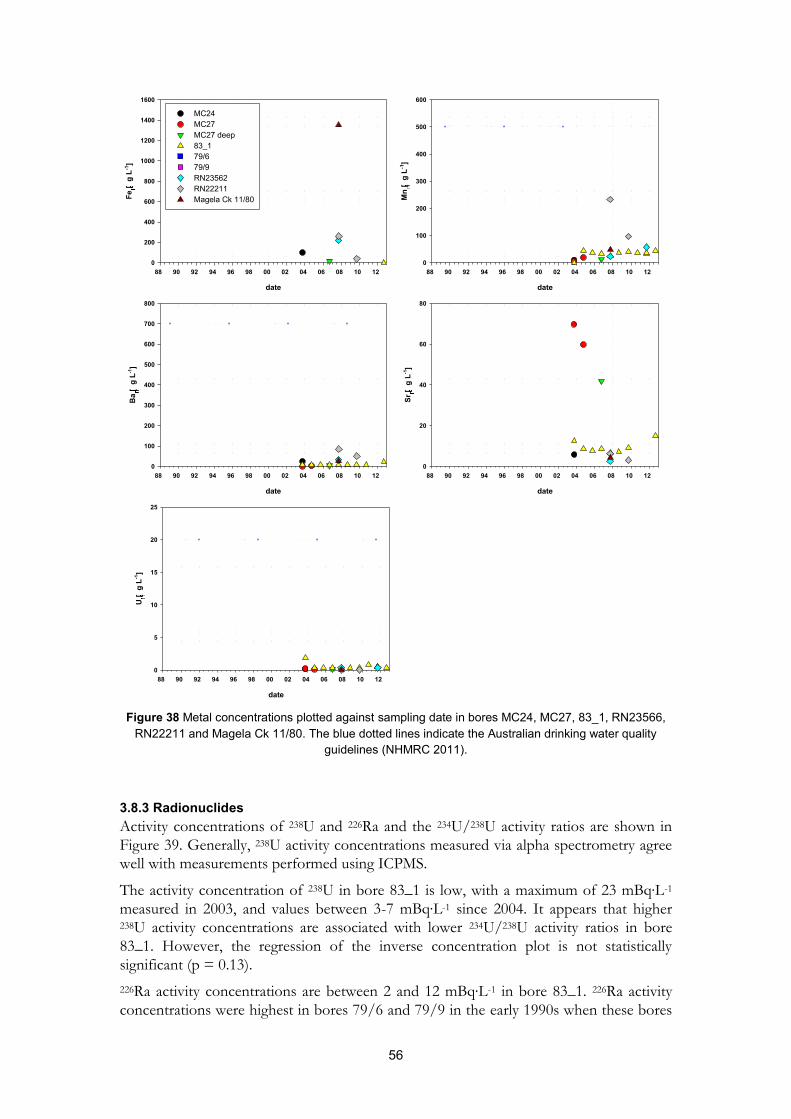
3.1.2 Metals Figure 16 shows the available results of bore water metal (Fe, Mn, Ba, Sr, U)
concentrations in bores RN23551, B11 and 23931_deep. Bores were sampled at the end
of the dry season and results are available from 2004 onwards. Metal concentrations were
generally well above detection limits.
Figure 16 Metal concentrations plotted against sampling date in bores RN23551, B11 and 23931_deep. The blue dotted lines indicate the Australian drinking water quality guidelines (NHMRC 2011).
date
88 90 92 94 96 98 00 02 04 06 08 10 12
Fe [
g L-1
]
10000
20000
30000
40000
23931_DeepB11RN23551RP1N1RP1N2
date
88 90 92 94 96 98 00 02 04 06 08 10 12
Mn
[g
L-1]
0
100
200
300
400
500
600
date
88 90 92 94 96 98 00 02 04 06 08 10 12
Ba
[g
L-1]
0
100
200
300
400
500
600
700
800
date
88 90 92 94 96 98 00 02 04 06 08 10 12
Sr [
g L-1
]
5
10
15
20
25
30
date
88 90 92 94 96 98 00 02 04 06 08 10 12
U [
g L-1
]
0
5
10
15
20
25
33
Bore RN23551 shows quite variable concentrations of Fe, Mn, Ba and Sr. Concentration
minima coincide with minima in major cations measured in this bore. Concentrations of
Fe vary by more than 2 orders of magnitude from 0.1 mg L-1 to 35 mg L-1.
Concentrations of Ba and Sr in RN23551 vary by one order of magnitude from 40 to 350
and from 2.7 to 29 µg L-1, respectively. The variability of U is much smaller, with
uranium concentration between 0.2 and 0.7 µg L-1, similar to concentrations for this bore
reported by ERA (2012).
Bore B11 shows similar Fe but slightly higher Mn concentrations compared to RN23551.
Ba concentrations are much lower, whereas U is similar again to RN23551. There is
some variability in Fe and Mn that cannot be seen in major cation concentrations
measured in this bore. However, Mn and Fe appears to be negatively correlated to U.
Bore 23931_deep has generally low Fe, Mn, Ba and Sr concentrations. Concentrations of
U are also low, but higher than concentrations measured in bores B11 and RN23551.
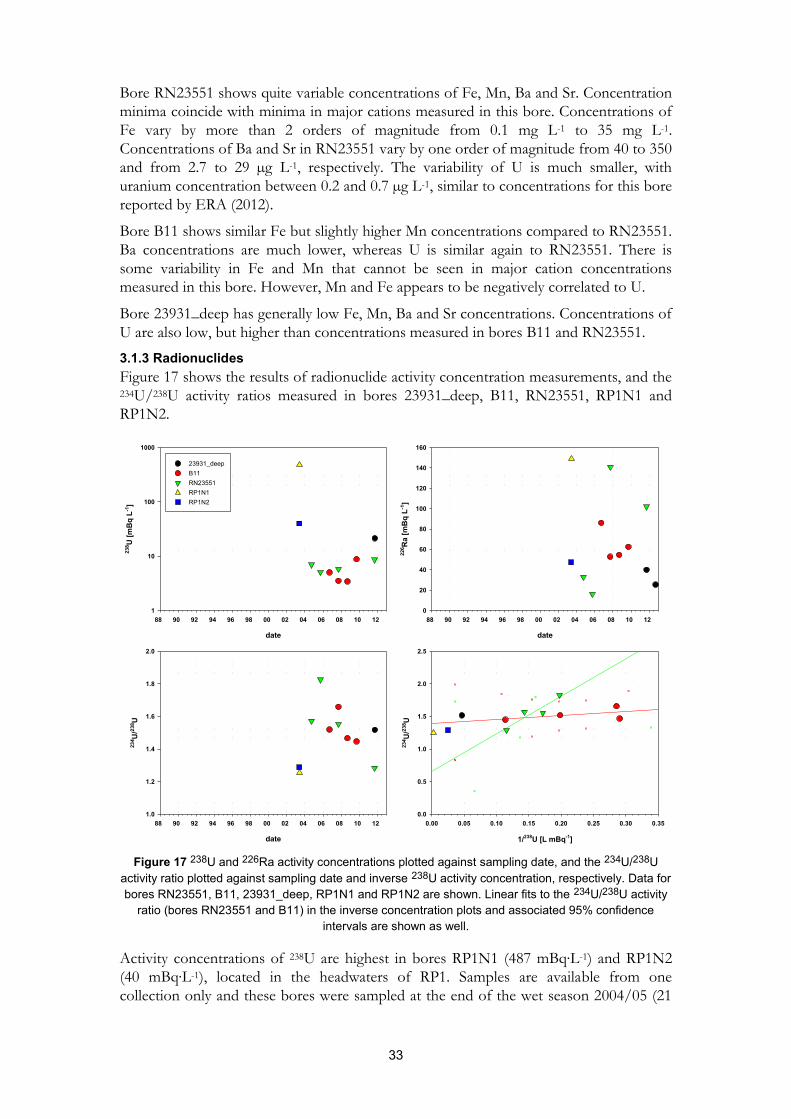
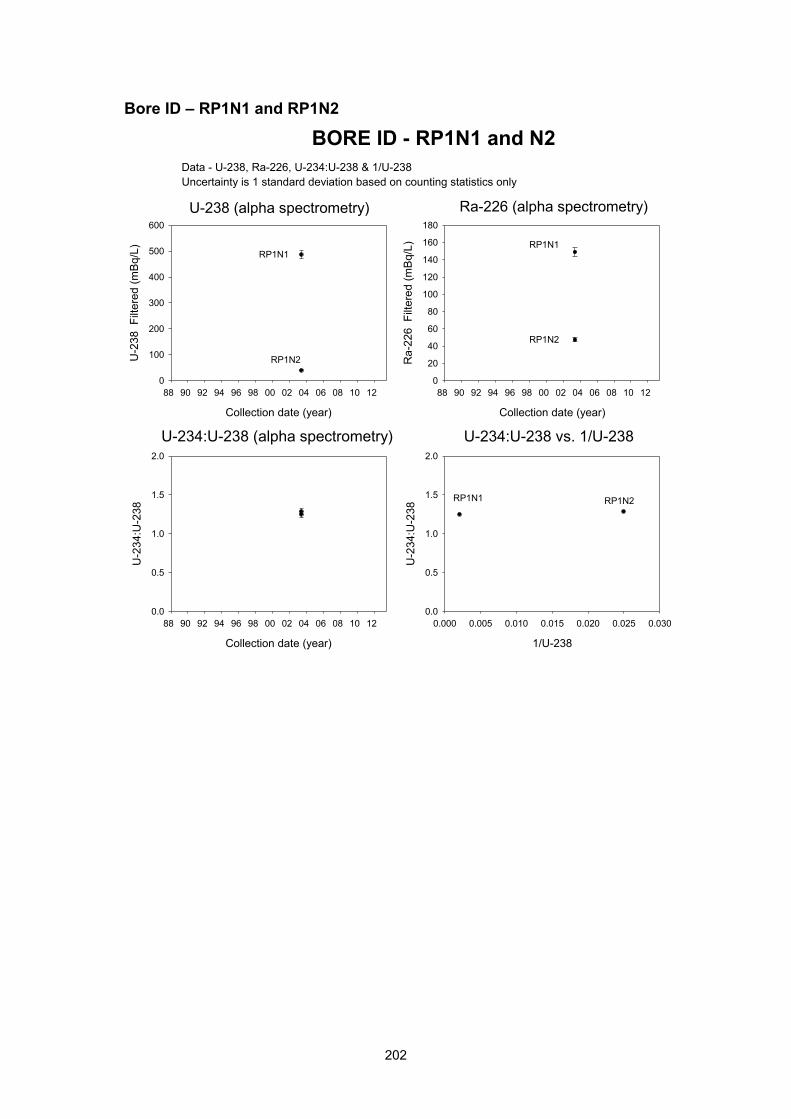
3.1.3 Radionuclides Figure 17 shows the results of radionuclide activity concentration measurements, and the 234U/238U activity ratios measured in bores 23931_deep, B11, RN23551, RP1N1 and
RP1N2.
Figure 17 238U and 226Ra activity concentrations plotted against sampling date, and the 234U/238U activity ratio plotted against sampling date and inverse 238U activity concentration, respectively. Data for bores RN23551, B11, 23931_deep, RP1N1 and RP1N2 are shown. Linear fits to the 234U/238U activity
ratio (bores RN23551 and B11) in the inverse concentration plots and associated 95% confidence intervals are shown as well.
Activity concentrations of 238U are highest in bores RP1N1 (487 mBq∙L-1) and RP1N2
(40 mBq∙L-1), located in the headwaters of RP1. Samples are available from one
collection only and these bores were sampled at the end of the wet season 2004/05 (21
date
88 90 92 94 96 98 00 02 04 06 08 10 12
238 U
[mB
q L-1
]
1
10
100
1000
23931_deepB11RN23551RP1N1RP1N2
date
88 90 92 94 96 98 00 02 04 06 08 10 12
226 R
a [m
Bq
L-1]
0
20
40
60
80
100
120
140
160
date
88 90 92 94 96 98 00 02 04 06 08 10 12
234 U
/238 U
1.0
1.2
1.4
1.6
1.8
2.0
1/238U [L mBq-1]
0.00 0.05 0.10 0.15 0.20 0.25 0.30 0.35
234 U
/238 U
0.0
0.5
1.0
1.5
2.0
2.5
34
May 2005). According to ERA (2012), bores RP1N1 and RP1N2 do not exhibit major
variability with time of year.
Activity concentrations of 238U in bore RN23551 are low and in agreement with U
concentrations measured via ICPMS. There appears to be an increase of 238U between
2005 and 2011, associated with a decrease in 234U/238U activity ratios. The range of 238U
activity concentration in this bore however is small and thus the intercept determined
from an inverse concentration plot (234U/238U activity plotted versus the inverse 238U
activity concentration) is associated with a very large error (0.65±1.11). The p-value for
the slope is 0.07, whereas the intercept has a p-value of 0.13.
Activity concentrations of 238U in shallow bore B11 are also low and in agreement with U
concentrations measured via ICPMS. They are slightly higher than concentrations
measured by ERA during and at the end of the wet season (ERA 2012). Similar to
RN23551, the intercept determined from an inverse concentration plot is associated with
a large error (1.39±0.68) and the correlation between the 234U/238U activity ratios and
inverse of the uranium concentration is not statistically significant (p = 0.45).
The variability of 226Ra activity concentration in bore RN23551 is larger than in bore
B11, and similar to the variability observed in Mg, Fe, Ba, Sr and major cations. High Mn
and Fe coincide with lower 238U in bore B11.
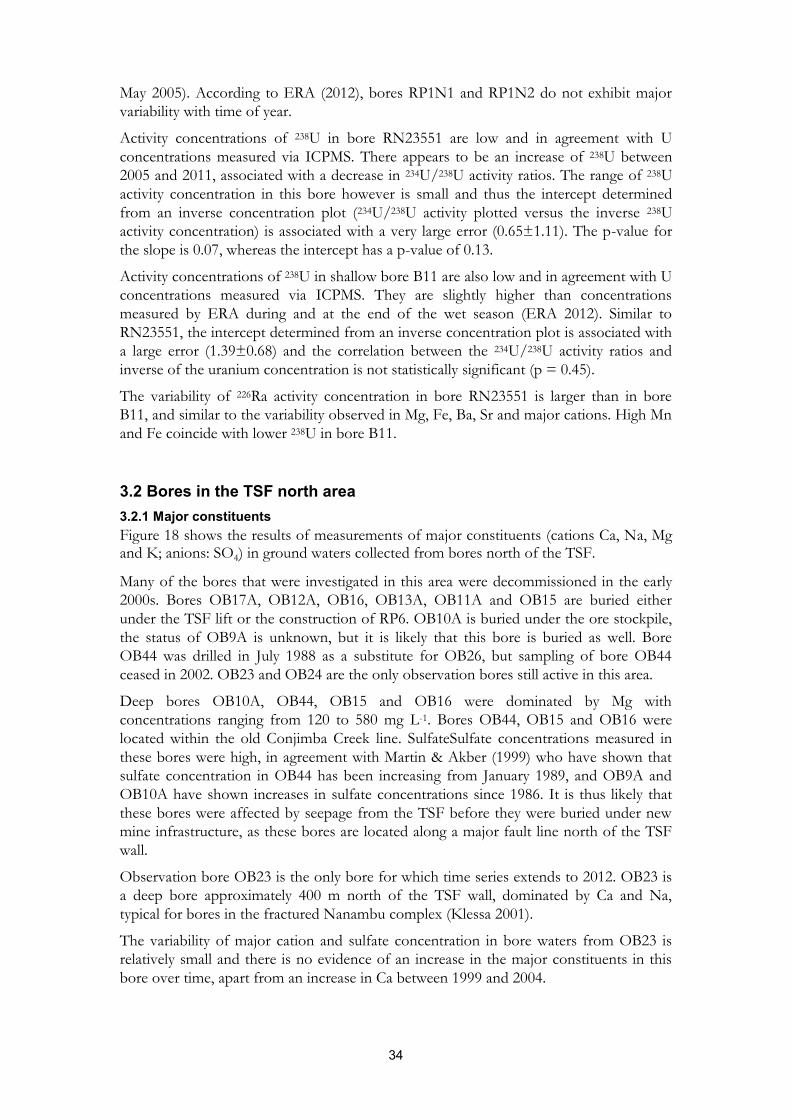
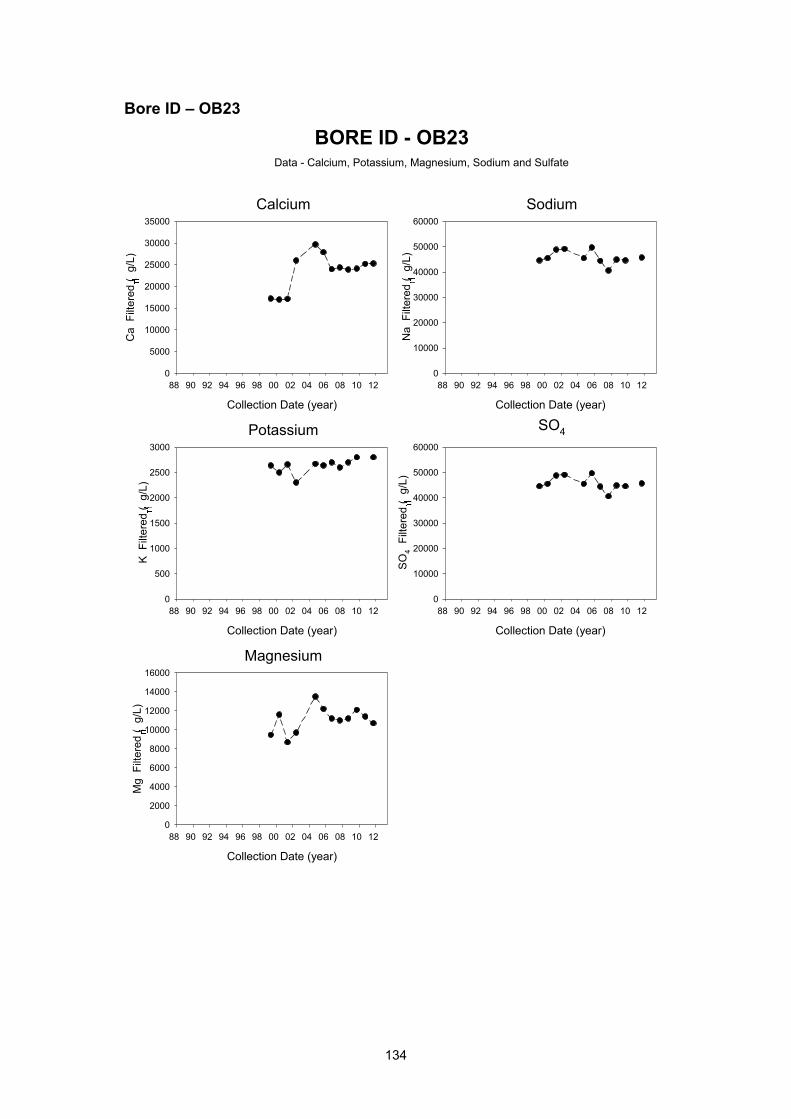
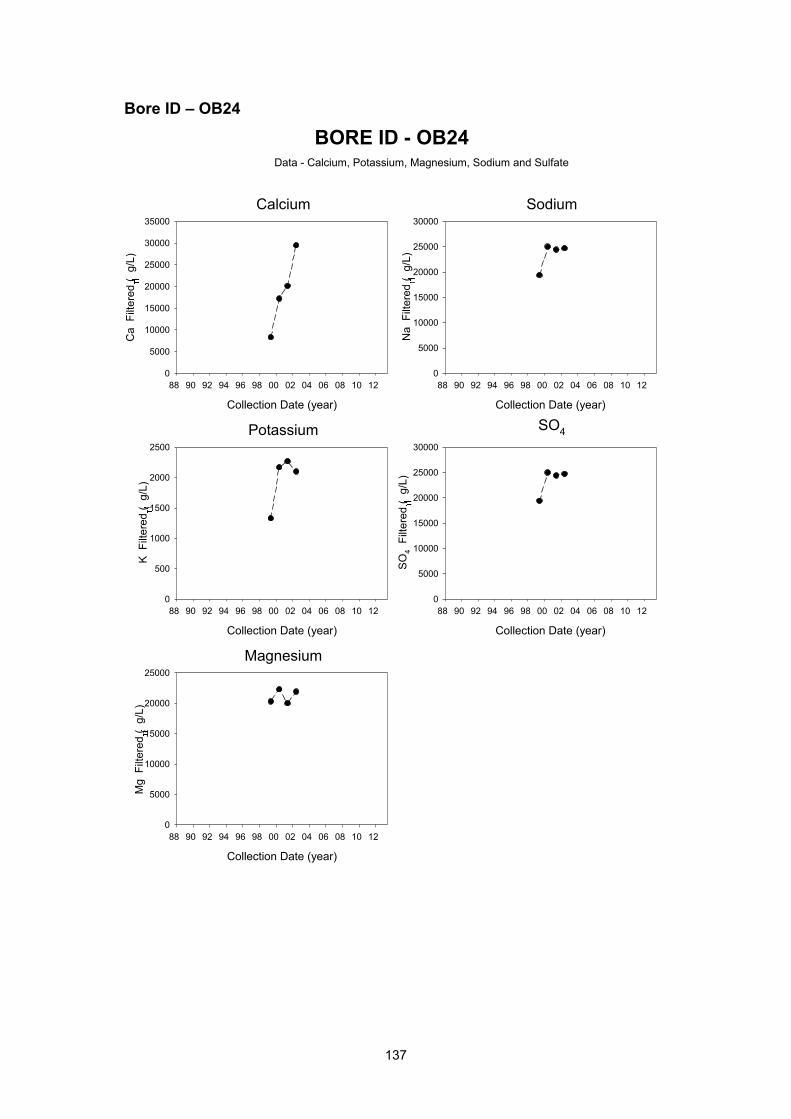
3.2 Bores in the TSF north area 3.2.1 Major constituents Figure 18 shows the results of measurements of major constituents (cations Ca, Na, Mg and K; anions: SO4) in ground waters collected from bores north of the TSF.
Many of the bores that were investigated in this area were decommissioned in the early
2000s. Bores OB17A, OB12A, OB16, OB13A, OB11A and OB15 are buried either
under the TSF lift or the construction of RP6. OB10A is buried under the ore stockpile,
the status of OB9A is unknown, but it is likely that this bore is buried as well. Bore
OB44 was drilled in July 1988 as a substitute for OB26, but sampling of bore OB44
ceased in 2002. OB23 and OB24 are the only observation bores still active in this area.
Deep bores OB10A, OB44, OB15 and OB16 were dominated by Mg with
concentrations ranging from 120 to 580 mg L-1. Bores OB44, OB15 and OB16 were
located within the old Conjimba Creek line. SulfateSulfate concentrations measured in
these bores were high, in agreement with Martin & Akber (1999) who have shown that
sulfate concentration in OB44 has been increasing from January 1989, and OB9A and
OB10A have shown increases in sulfate concentrations since 1986. It is thus likely that
these bores were affected by seepage from the TSF before they were buried under new
mine infrastructure, as these bores are located along a major fault line north of the TSF
wall.
Observation bore OB23 is the only bore for which time series extends to 2012. OB23 is
a deep bore approximately 400 m north of the TSF wall, dominated by Ca and Na,
typical for bores in the fractured Nanambu complex (Klessa 2001).
The variability of major cation and sulfate concentration in bore waters from OB23 is
relatively small and there is no evidence of an increase in the major constituents in this
bore over time, apart from an increase in Ca between 1999 and 2004.
35
Figure 18 Major constituent concentrations plotted against sampling date in bores OB23, OB24, OB44, OB17A, OB16, OB13A, OB10A and OB15.
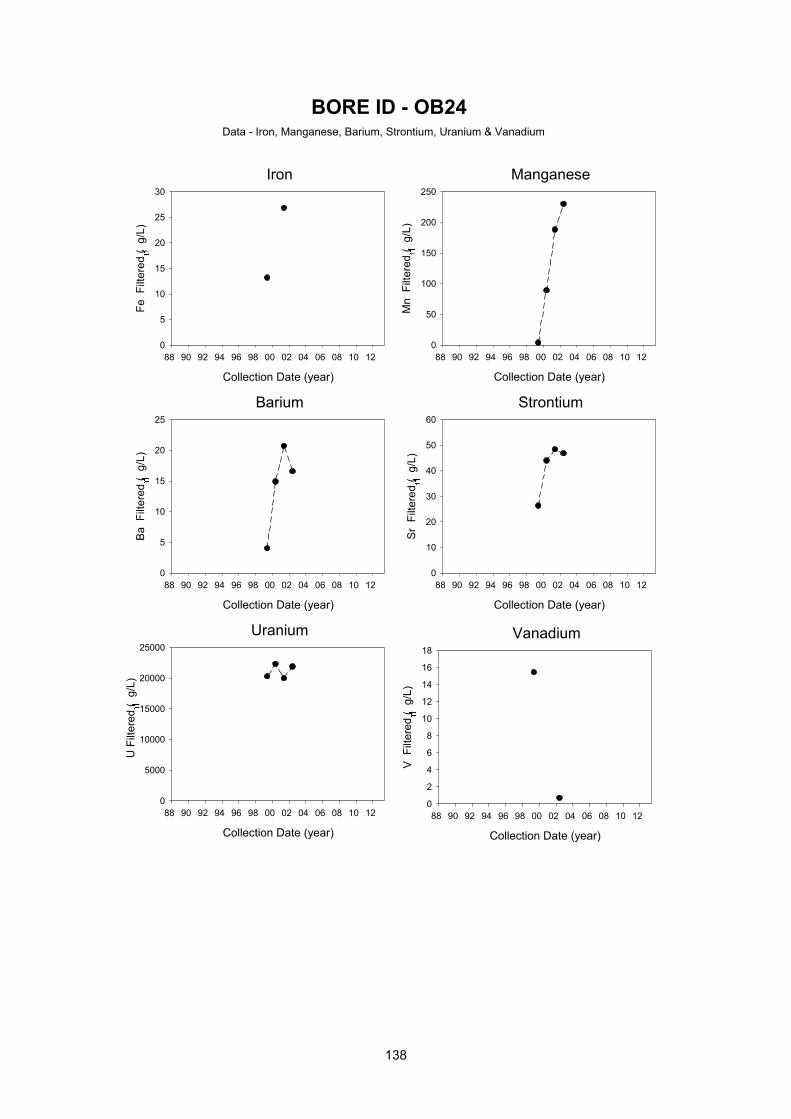
3.2.2 Metals Figure 19 shows the results of metal (Fe, Mn, Ba, Sr, U) concentration measurements via
ICPMS from 1999 onwards.
Observation bores OB24, OB44, OB17A and OB10A were analysed between 1999 and
2002, when they were buried under a TSF lift or various stockpiles. Concentrations of Fe
were highest in OB10A, Sr and U were highest in OB44.
Bore OB24 showed an increase in Fe, Ba and Mn between 1999 and 2001. Manganese
concentrations measured in this bore in 2010 (ERA, 2012) are similar to concentrations
measured in 2001. The reason for the increase in Fe and Mn between 1999 and 2001 is
unknown and does not coincide with a similar increase in U.
Metal concentrations in OB23 show some variability, in particular for Mn and Fe, with
minima for those two metals observed in September 2000 and September 2001,
respectively. Concentrations of Ba and Sr are relatively constant. Uranium concentration
is low, with maxima around 3.5 µg L-1 measured in 2001 (and 2011). There is a good
agreement between uranium concentrations measured via ICPMS and 238U activity
concentrations measured using alpha spectrometry.
Figure 19 Metal concentrations plotted against sampling date in bores OB23, OB24, OB44, OB17A and OB10A. The blue dotted lines indicate the Australian drinking water quality guidelines (NHMRC 2011).
3.2.3 Radionuclides Figure 20 shows the results of radionuclide activity concentration measurements, and the 234U/238U activity ratios measured in bores OB23, OB24, OB44, OB17A, OB12A, OB16,
OB13A, OB11A, OB9A, OB10A, OB15 and OB26, from the start of sampling in 1988
Figure 20 238U and 226Ra activity concentrations plotted against sampling date, and the 234U/238U activity ratio plotted against sampling date and inverse 238U activity concentration, respectively, in bores OB23, OB24, OB44, OB17A, OB12A, OB16, OB13A, OB11A, OB9A, OB10A, OB15 and OB26. Linear
fits to the inverse concentration data are shown in Figure 20a and 20b.
Activity concentrations of 238U in the 1990s were highest in bores OB9A, OB10A and
OB13A. Bores OB9A and OB10A were located between the TSF and pit 1. Martin &
Akber (1999) hypothesised that changes in the hydrological conditions, as the TSF was
raised and pit 1 deepened, influenced the sulfate concentrations in these two bores, and
that the two bores were affected by uranium seeping from the TSF. The 234U/238U
activity ratio in bore OB10A is low at 1.12, but is somewhat higher in OB9A (up to
1.53). Figure 20a however shows that there is no correlation between 234U/238U activity
ratios and the inverse uranium concentration in these two bores (OB9A: p = 0.54;
OB10A: p = 0.32). Consequently, more than 1 contaminating end-member may have
been responsible for elevated uranium concentrations measured in these two bores but
seepage from the TSF, in particular in bore OB9A, cannot be excluded. Investigations
showed that both, OB9A and OB10A, were influenced by earthworks between 1997 and
1999, leading to high 238U activity concentrations measured in 1998 (Iles et al 2002).
Monitoring was discontinued, bores OB9A and OB10A are now buried under the
stockpile.
Activity concentration of 238U in bore OB13A has increased substantially between the
late 1980s and late 1990s, in agreement with ERA monitoring data. Iles et al (2002)
report an increase of 238U activity concentrations of 3 orders of magnitude between the
early 1980s and late 1990s. This bore was likely influenced by uranium seeping from the
TSF or leaching of uranium from construction materials used in the raising of the TSF
wall (Martin & Akber 1996). The high sulfate concentrations measured in 1992 are
indicative of seepage. Figure 21a (and Figure A-18 in the Appendix) shows that a
significant correlation exists between 234U/238U activity ratios and the inverse uranium
concentration in this bore (p << 0.005), with a contaminating end-member 234U/238U
activity ratio of (1.08 ± 0.02).
Figure 21 a,b Inverse concentration plots for bores OB44, OB17A, OB16, OB13A, OB11A, OB9A, OB10A, OB15, OB26, OB23 and OB24. Linear fits to the 234U/238U activity ratio in the inverse
concentration plots and associated 95% confidence intervals are shown as well.
Samples from bores OB24, OB44 and OB17A have been analysed for radionuclides up
until 2002. OB24 and OB44 are approximately 500 m north of the TSF and separated by
less than 400 m. Uranium-238 activity concentration has increased by a factor of two in
OB44 between 1989 and 2002. During the same time period the U concentration has
decreased in OB24. The inverse concentration plots show that neither OB24 (p = 0.23)
nor OB44 (p = 0.32) exhibit a significant correlation between the 234U/238U activity ratios
and the inverse uranium concentration, indicating that there are multiple sources of
uranium responsible for the variability observed in these two bores. Activity ratios of 234U/238U measured in OB24 and OB44 are generally >1.3 (see Figure 21a) which makes
seepage from the TSF as a source of uranium measured in these bores unlikely. In
contrast OB17A shows a significant correlation between the 234U/238U activity ratios and
the inverse uranium concentration (p = 0.01) and the contaminating end member 234U/238U activity ratio is (1.14±0.19).
The only still active bore in this area investigated by eriss with existing time series up
until September 2012 is deep bore OB23. Analysis of samples from this bore via alpha
spectrometry has started in 1989. The bore shows variable 238U activity concentrations
between 1989 and 2012, with generally low activity concentrations between 2002 and
2010, an increase in 2011 followed by a decrease in 2012 (see Figures 19 and 20). The
variability in uranium concentration is accompanied by a variability of the 234U/238U
activity ratio. The inverse U concentration plot shows a statistically significant decrease
of the 234U/238U activity ratio (p<<0.05) with an end member ratio of (1.08±0.10) (see
Figure 21b).
Radium-226 activity concentrations were highest in OB26 in the late 1980s and the early
1990s. Activity concentration of 226Ra in OB11A increased by a factor of approximately 3
between 1988 and 1993, associated with a large increase in sulfate concentrations. This
increase has previously been associated with influence of seepage from the TSF leading
to desorption reactions in the aquifer and an increase in 226Ra (Martin & Akber 1996,
Although bore OB44 was drilled in July 1988 as a substitute for OB26 (Martin & Akber
1996), 226Ra (and 238U) activity concentrations in OB44 were significantly lower than in
OB26. However, the 226Ra activity concentration in OB44 has increased by 2002 and was
above 100 mBq L-1. Sulfate and Mg concentrations are high in OB44, indicating that 226Ra may have been mobilised by secondary processes and consequently this bore may
also be affected by seepage from the TSF. The activity concentration of 226Ra is lower in
OB24 than in OB26, but has also increased between 1990 and 2002. During the same
time period 226Ra activity concentration has decreased in OB17A.
Bore OB23 shows 226Ra activity concentrations between 58 and 285 mBq L-1. The
variability of 226Ra activity concentration is similar to the variability in Mn and Fe,
whereas U concentration behaves in the opposite way. It is possible that reduction and
dissolution processes for Mn and Fe influence the 226Ra activity concentration measured
in the bore, due to the high affinity of 226Ra with oxides of those two elements.
3.3 Bores to the north-west of the TSF and in the Gulungul catchment 3.3.1 Major constituents Figure 22 shows the results of measurements of major constituents (cations Ca, Na, Mg and K; anion: SO4) in bore waters collected north-west and west of the TSF and in the
Gulungul catchment.
Major cation concentrations for deep bores OB1A, OB2A, RN9329 and OB116 are less
than 5 mg L-1 for K, less than 10 mg L-1 for Ca and 10 to 20 mg L-1 for Na and Mg. Bore
RN23566 shows higher Mg concentrations up to 100 mg L-1. Major cation
concentrations are much lower in the shallow bores OB112 and OB116 compared to
their deep counterparts and other bores in the area.
Sulfate concentrations are highest in bore RN23566, up to 470 mg L-1. This bore is close
to bore RN9329, but the screen depth of this bore is only 4 to 5.5 m. The sulfate
concentrations measured in bore RN23566 are similar to those measured in surface water
in the Gulungul catchment in 2004-05 (Mellor, 2005). At those shallow depths it is
possible that groundwater quality is affected by the high sulfate concentrations in acid
sulfate soils commonly observed in the area (Klessa 2002).
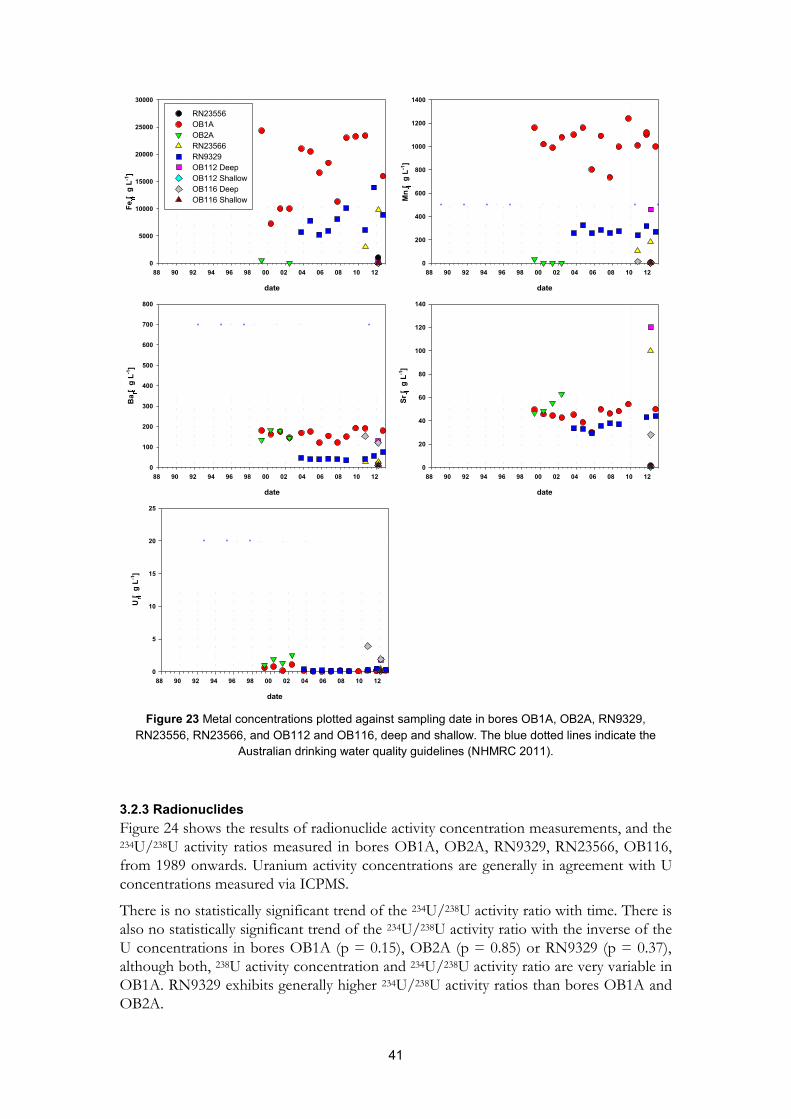
3.3.2 Metals Figure 23 shows the result of metal measurements via ICPMS in bore waters collected in
the Gulungul catchment, north-west and west of the TSF.
Metal concentrations for bore OB1A at the north-west corner of the TSF are highest
with concentrations of Fe of about 10 to 20 mg L-1, Mn about 1 mg L-1 and Ba between
0.1 and 0.2 mg L-1. The variability of U concentrations in this bore is large, with
concentrations between 0.03 and 1.08 μg L-1, but concentrations are generally low from
2003 onwards.
Fe and Mn concentrations in OB2A are significantly lower but the U concentration is
similar to the concentration measured in bore water from OB1A. RN9329 to the west of
the TSF shows Fe and Mn concentrations about half the concentrations measured in
OB1A, and U concentrations are similar to those measured in OB1A.
The high Fe and Mn results for bore OB1A has been highlighted before by Martin &
Akber (1996). They emphasised the possibility that iron and/or manganese oxide colloids
are present in the waters from OB1A that may influence trace metal and radionuclide
40
concentrations. The large variability of Ba and Sr, and in particular U in this bore may be
a result of these iron and/or manganese oxide colloids.
The highest U concentrations are measured in bore OB116 deep. This bore is located to
the south-west of the TSF, and samples groundwater from a depth of 14 m to 20 m.
Concentrations of uranium and major cations in deep bore OB112 are quite similar to
concentrations measured in OB116 deep.
Figure 22 Major constituent concentrations plotted against sampling date in bores RN23556, OB1A, OB2A, RN23566, RN9329, OB112 deep and shallow, and OB116 deep and shallow.
Figure 23 Metal concentrations plotted against sampling date in bores OB1A, OB2A, RN9329, RN23556, RN23566, and OB112 and OB116, deep and shallow. The blue dotted lines indicate the
Australian drinking water quality guidelines (NHMRC 2011).
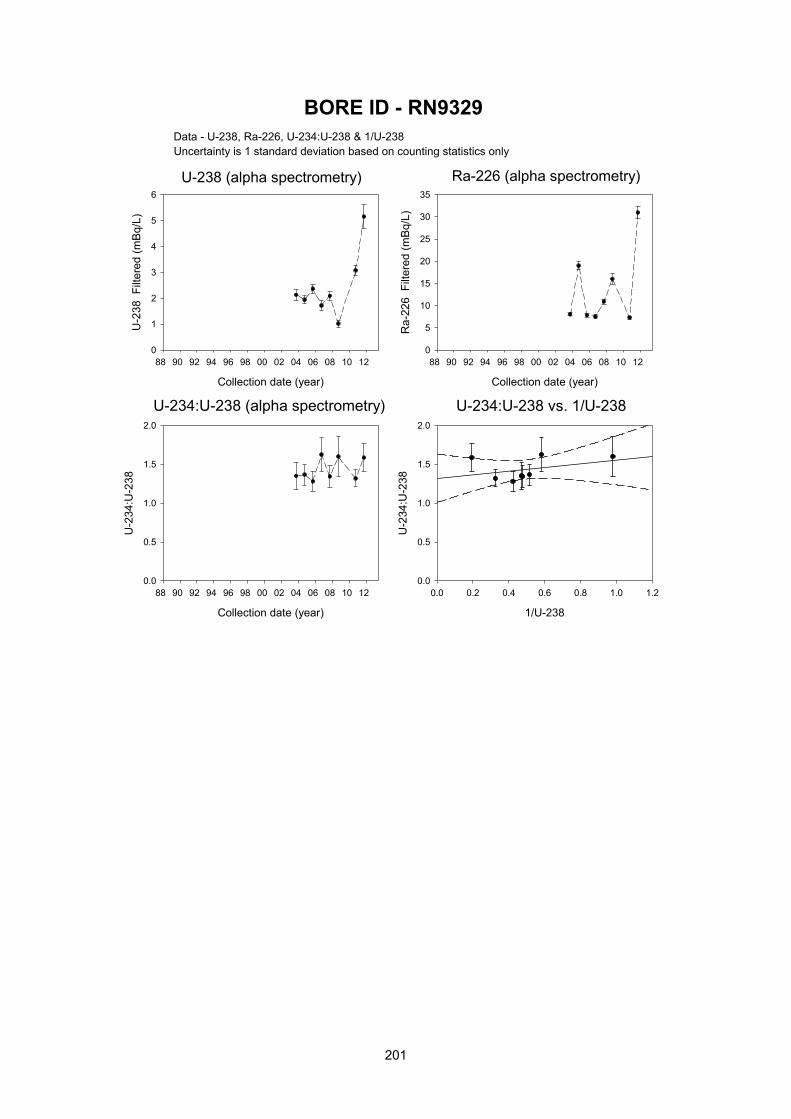
3.2.3 Radionuclides Figure 24 shows the results of radionuclide activity concentration measurements, and the 234U/238U activity ratios measured in bores OB1A, OB2A, RN9329, RN23566, OB116,
from 1989 onwards. Uranium activity concentrations are generally in agreement with U
concentrations measured via ICPMS.
There is no statistically significant trend of the 234U/238U activity ratio with time. There is
also no statistically significant trend of the 234U/238U activity ratio with the inverse of the
U concentrations in bores OB1A (p = 0.15), OB2A (p = 0.85) or RN9329 (p = 0.37),
although both, 238U activity concentration and 234U/238U activity ratio are very variable in
OB1A. RN9329 exhibits generally higher 234U/238U activity ratios than bores OB1A and
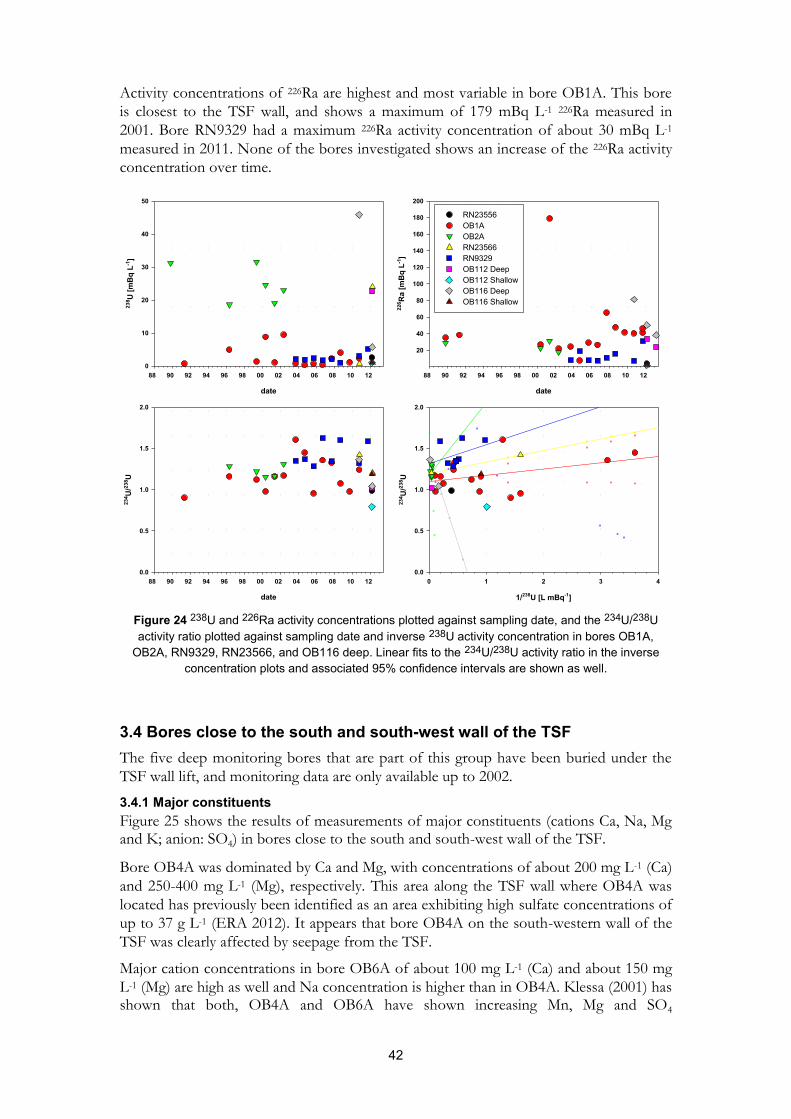
Activity concentrations of 226Ra are highest and most variable in bore OB1A. This bore
is closest to the TSF wall, and shows a maximum of 179 mBq L-1 226Ra measured in
2001. Bore RN9329 had a maximum 226Ra activity concentration of about 30 mBq L-1
measured in 2011. None of the bores investigated shows an increase of the 226Ra activity
concentration over time.
Figure 24 238U and 226Ra activity concentrations plotted against sampling date, and the 234U/238U activity ratio plotted against sampling date and inverse 238U activity concentration in bores OB1A,
OB2A, RN9329, RN23566, and OB116 deep. Linear fits to the 234U/238U activity ratio in the inverse concentration plots and associated 95% confidence intervals are shown as well.
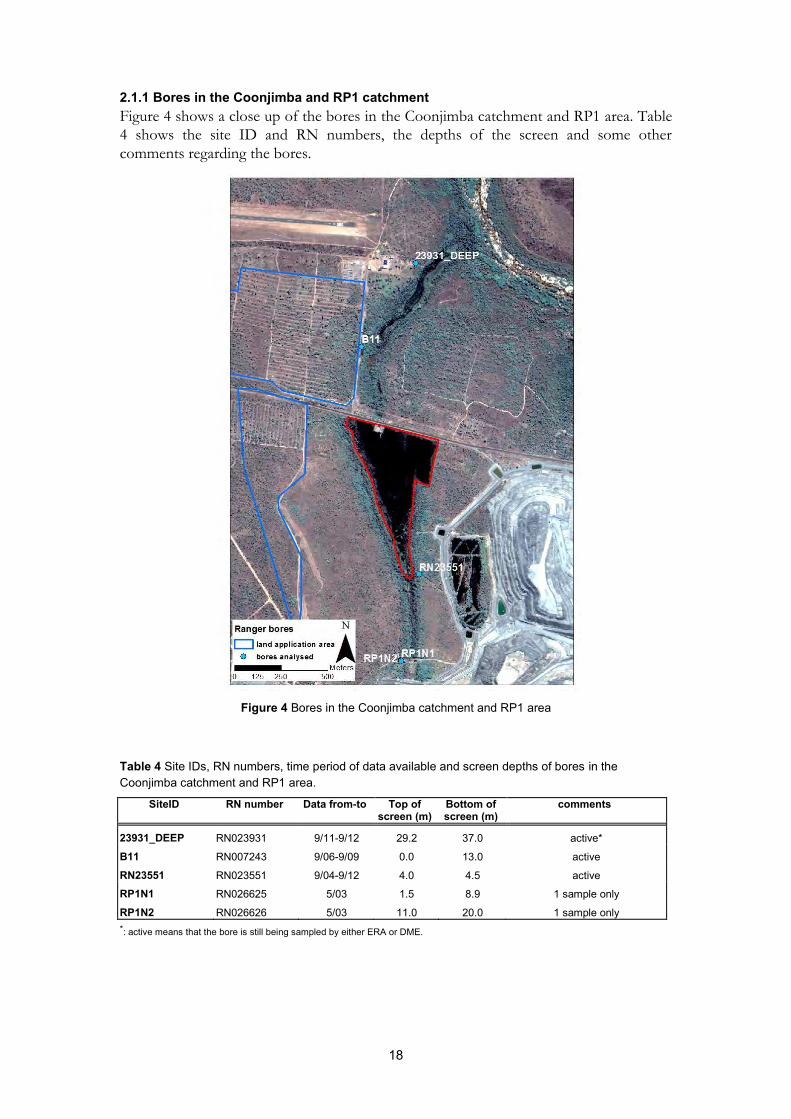
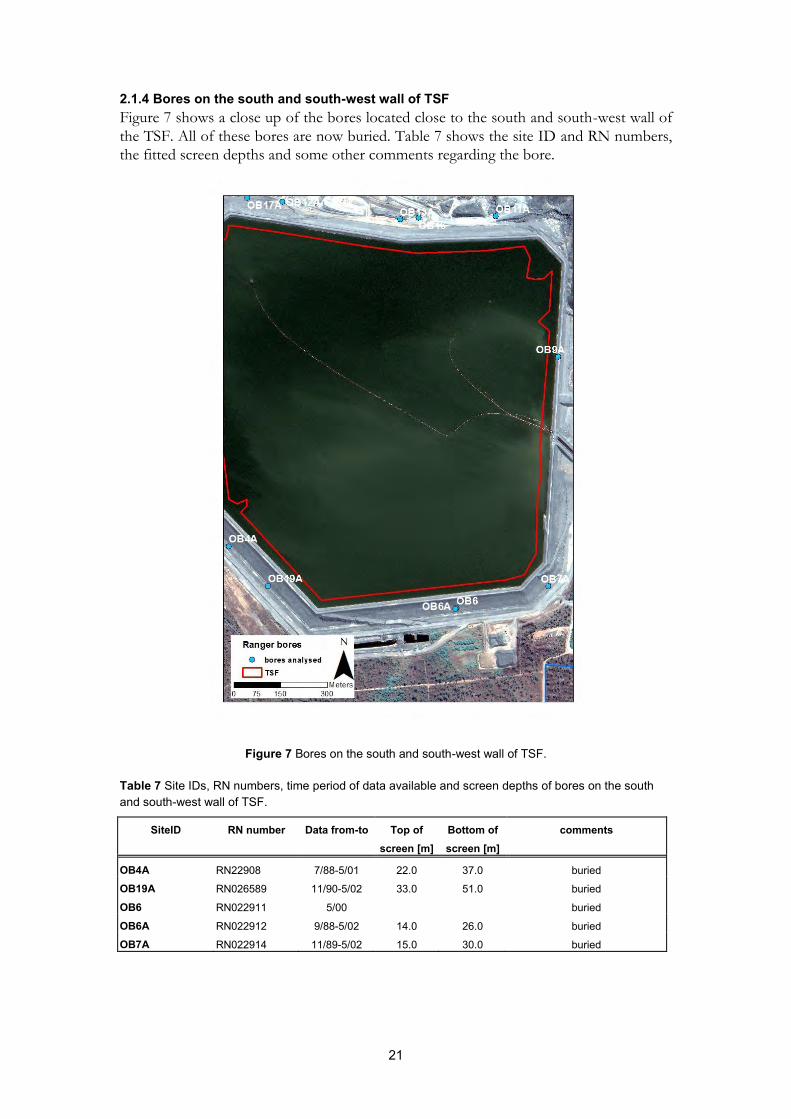
3.4 Bores close to the south and south-west wall of the TSF The five deep monitoring bores that are part of this group have been buried under the
TSF wall lift, and monitoring data are only available up to 2002.
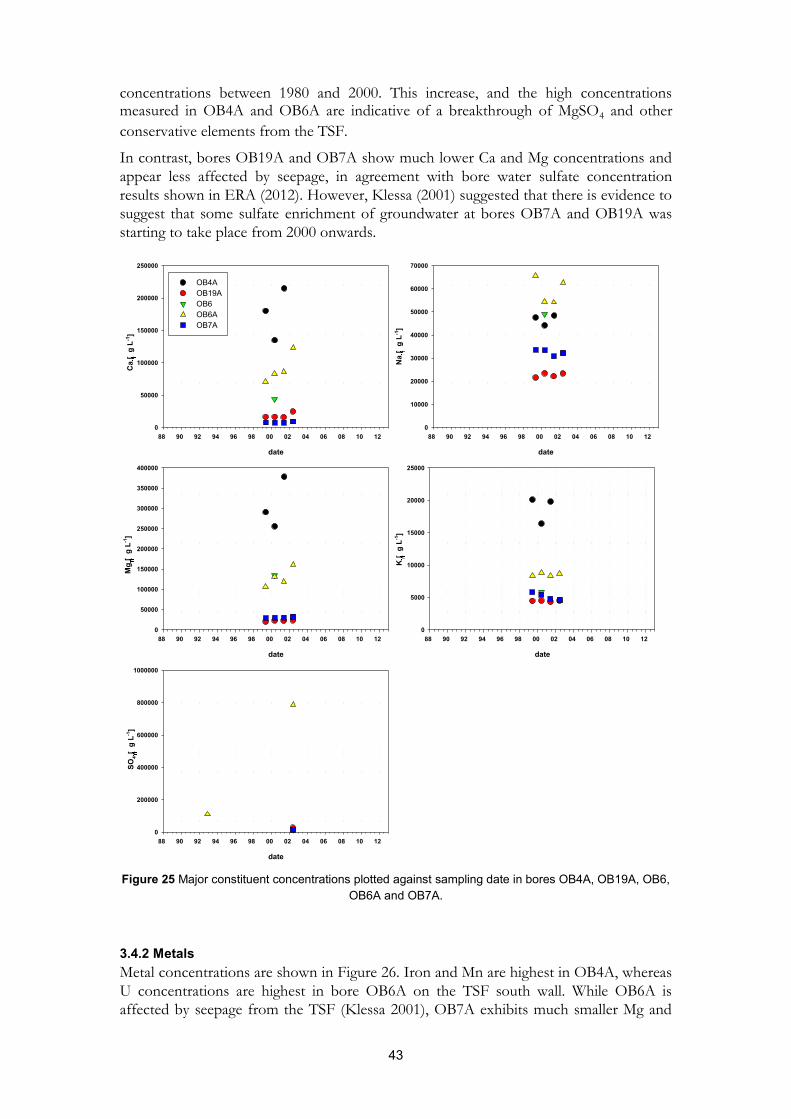
3.4.1 Major constituents Figure 25 shows the results of measurements of major constituents (cations Ca, Na, Mg and K; anion: SO4) in bores close to the south and south-west wall of the TSF.
Bore OB4A was dominated by Ca and Mg, with concentrations of about 200 mg L-1 (Ca)
and 250-400 mg L-1 (Mg), respectively. This area along the TSF wall where OB4A was
located has previously been identified as an area exhibiting high sulfate concentrations of
up to 37 g L-1 (ERA 2012). It appears that bore OB4A on the south-western wall of the
TSF was clearly affected by seepage from the TSF.
Major cation concentrations in bore OB6A of about 100 mg L-1 (Ca) and about 150 mg
L-1 (Mg) are high as well and Na concentration is higher than in OB4A. Klessa (2001) has shown that both, OB4A and OB6A have shown increasing Mn, Mg and SO4
concentrations between 1980 and 2000. This increase, and the high concentrations measured in OB4A and OB6A are indicative of a breakthrough of MgSO4 and other
conservative elements from the TSF.
In contrast, bores OB19A and OB7A show much lower Ca and Mg concentrations and
appear less affected by seepage, in agreement with bore water sulfate concentration
results shown in ERA (2012). However, Klessa (2001) suggested that there is evidence to
suggest that some sulfate enrichment of groundwater at bores OB7A and OB19A was
starting to take place from 2000 onwards.
Figure 25 Major constituent concentrations plotted against sampling date in bores OB4A, OB19A, OB6, OB6A and OB7A.
3.4.2 Metals Metal concentrations are shown in Figure 26. Iron and Mn are highest in OB4A, whereas
U concentrations are highest in bore OB6A on the TSF south wall. While OB6A is
affected by seepage from the TSF (Klessa 2001), OB7A exhibits much smaller Mg and
date
88 90 92 94 96 98 00 02 04 06 08 10 12
Ca
[g
L-1]
0
50000
100000
150000
200000
250000
OB4AOB19AOB6OB6AOB7A
date
88 90 92 94 96 98 00 02 04 06 08 10 12
Na
[g
L-1]
0
10000
20000
30000
40000
50000
60000
70000
date
88 90 92 94 96 98 00 02 04 06 08 10 12
SO4 [
g L-1
]
0
200000
400000
600000
800000
1000000
date
88 90 92 94 96 98 00 02 04 06 08 10 12
Mg
[g
L-1]
0
50000
100000
150000
200000
250000
300000
350000
400000
date
88 90 92 94 96 98 00 02 04 06 08 10 12
K [
g L-1
]
0
5000
10000
15000
20000
25000
44
sulfate concentrations, and generally lower U concentrations (with the exception of the U
concentration measured in 2000). This is indicative of lesser influence of seepage from
the TSF in bore OB7A.
Figure 26 Metal concentrations plotted against sampling date in bores OB4A, OB19, OB6, OB6A and OB7A. The blue dotted lines indicate the Australian drinking water quality guidelines (NHMRC 2011).
3.4.3 Radionuclides Radionuclide activity concentrations and 234U/238U activity ratios are available from 1988,
when investigations of bore water from bores OB4A and OB6A began (Figure 27).
Bores OB4A, OB6A and OB7A showed maximum U activity concentrations in 1998
followed by a sharp drop in U activity concentrations in 1999. The increase in the U
activity concentrations are associated with a decline in the 234U/238U activity ratios in
those bores, with ratios of about 1.07 to 1.26. The reason for the increase in U activity
concentration during that time is unknown, but may be due to major works conducted at
the TSF, when tailings were transferred from the TSF to pit 1 in 1997 – 98.
date
88 90 92 94 96 98 00 02 04 06 08 10 12
Fe [
g L-1
]
1
10
100
1000
10000
100000
1000000
OB4AOB19AOB6OB6AOB7A
date
88 90 92 94 96 98 00 02 04 06 08 10 12
Mn
[g
L-1]
0
2000
4000
6000
8000
10000
date
88 90 92 94 96 98 00 02 04 06 08 10 12
Ba
[g
L-1]
0
100
200
300
400
500
600
700
800
date
88 90 92 94 96 98 00 02 04 06 08 10 12
Sr [
g L-1
]
0
200
400
600
800
1000
1200
1400
1600
1800
2000
date
88 90 92 94 96 98 00 02 04 06 08 10 12
U [
g L-1
]
0
10
20
30
40
50
60
45
The 234U/238U activity ratios in OB4A were generally around 1, with the exception of
activity ratios measured in 1988 and 1997 (~1.5). There is no discernible trend in 234U/238U activity ratios plotted against time of sampling or inverse U concentration in
these bores, except for bore OB7A. This bore exhibits a statistically significant decrease
of the 234U/238U activity ratio when plotted against the inverse U activity concentration (p
= 0.01), with a y-intercept for the 234U/238U activity ratio of 1.13±0.12.
The activity concentration of 226Ra was highest in bore OB6A with a value of above 1 Bq
L-1 measured in May 2001. A 226Ra maximum was also observed in OB4A during that
time (0.2 Bq L-1) but none of the other analytes showed a maximum.
Figure 27 238U and 226Ra activity concentrations plotted against sampling date, and the 234U/238U activity ratio plotted against sampling date and inverse 238U activity concentration in bores OB4A,
OB19, OB6, OB6A and OB7A. Linear fits to the 234U/238U activity ratio in the inverse concentration plots and associated 95% confidence intervals are shown as well.
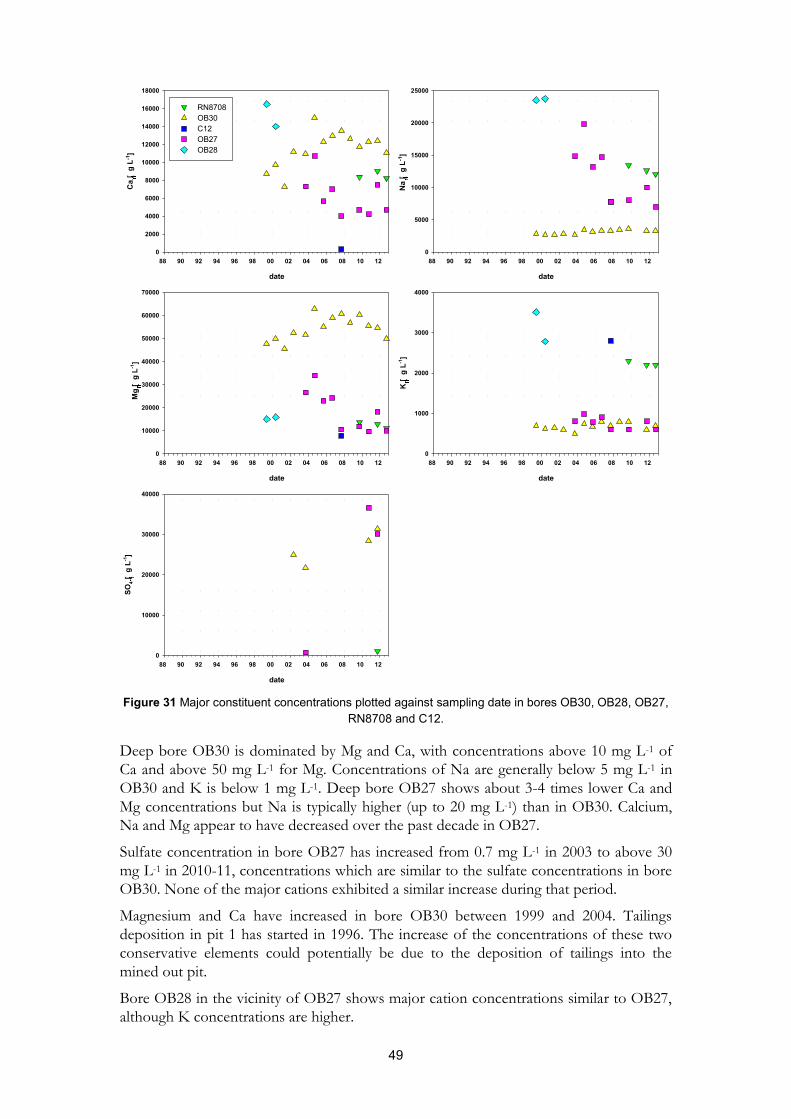
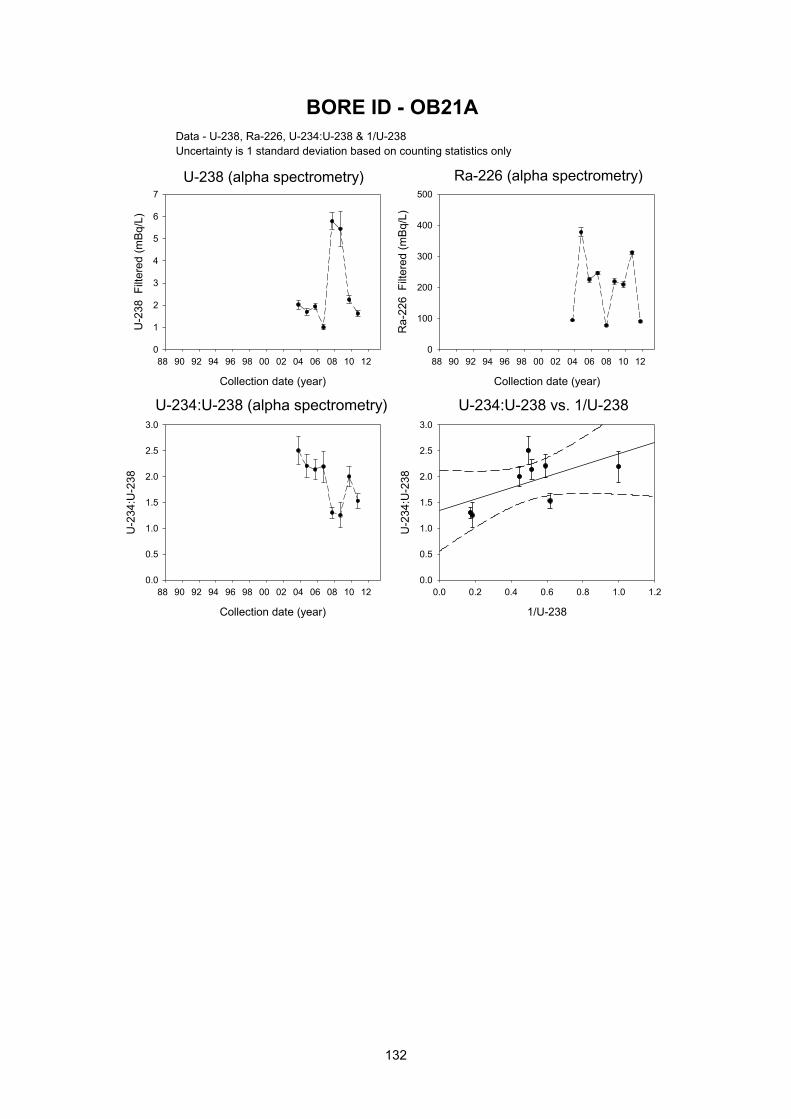
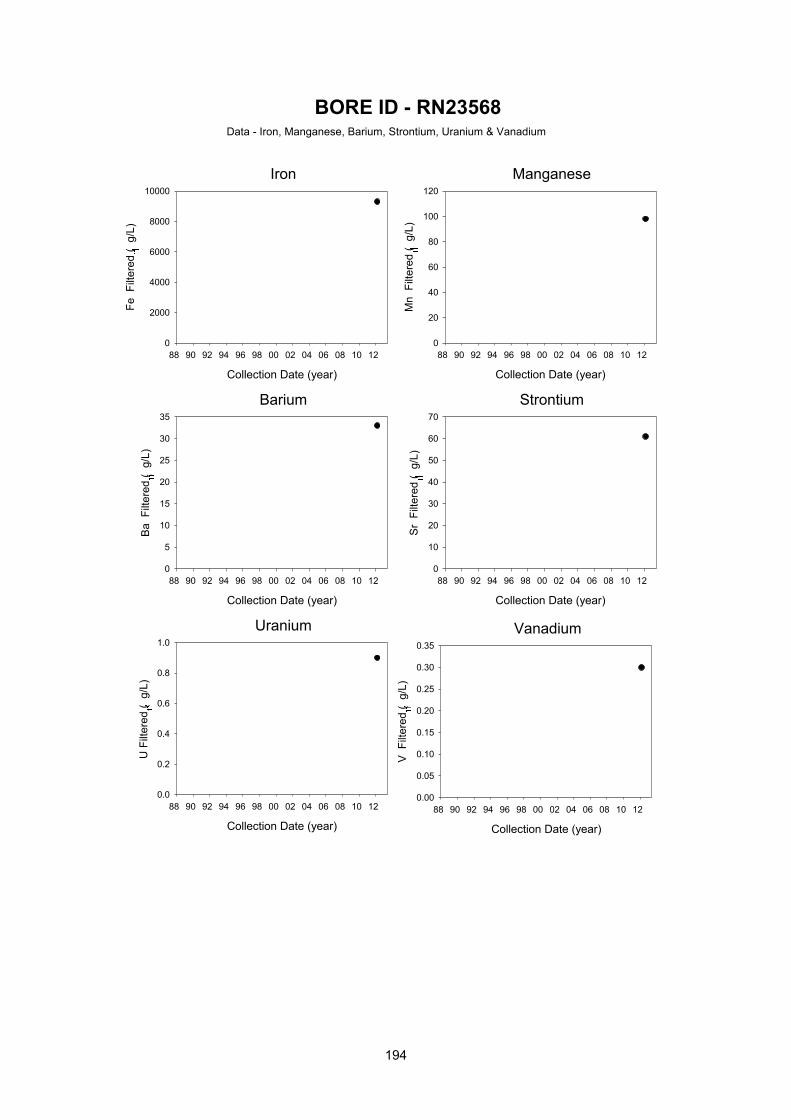
3.5 Bores south of the TSF Bores OB20, OB21A, RN23568 and C1_shallow are located approximately 400 m to the
south of the TSF wall.
3.5.1 Major constituents Figure 28 shows the results of measurements of major constituents (cations Ca, Na, Mg and K; anion: SO4) in bore waters sampled from bores located south of the TSF.
Concentrations of Ca are typically about 10 mg L-1 in OB20 and 20 mg L-1 in OB21A.
Sodium and Mg concentrations are between 10-20 mg L-1 in these two bores. The
concentrations of K are about 1 mg L-1 (OB20) and 2 mg L-1 (OB21A). The two bores
exhibit similar trends with time, with maxima measured in 2004, followed by a decline in
date
88 90 92 94 96 98 00 02 04 06 08 10 12
238 U
[mB
q L-1
]
200
400
600
800
1000
1200
1400OB4AOB19AOB6OB6AOB7A
date
88 90 92 94 96 98 00 02 04 06 08 10 12
226 R
a [m
Bq
L-1]
0
200
400
600
800
1000
1200
date
88 90 92 94 96 98 00 02 04 06 08 10 12
234 U
/238 U
0.0
0.5
1.0
1.5
2.0
2.5
1/238U [L mBq-1]
0.00 0.02 0.04 0.06 0.08 0.10 0.12 0.14 0.16
234 U
/238 U
0.0
0.5
1.0
1.5
2.0
2.5
46
concentrations and a minimum measured in 2007-2008. Sulfate concentrations are
generally low in OB20 and OB21A with concentrations measured below 3 mg L-1.
Figure 28 Major constituent concentrations plotted against sampling date in bores OB20, OB21A, RN23568 and C1_shallow.
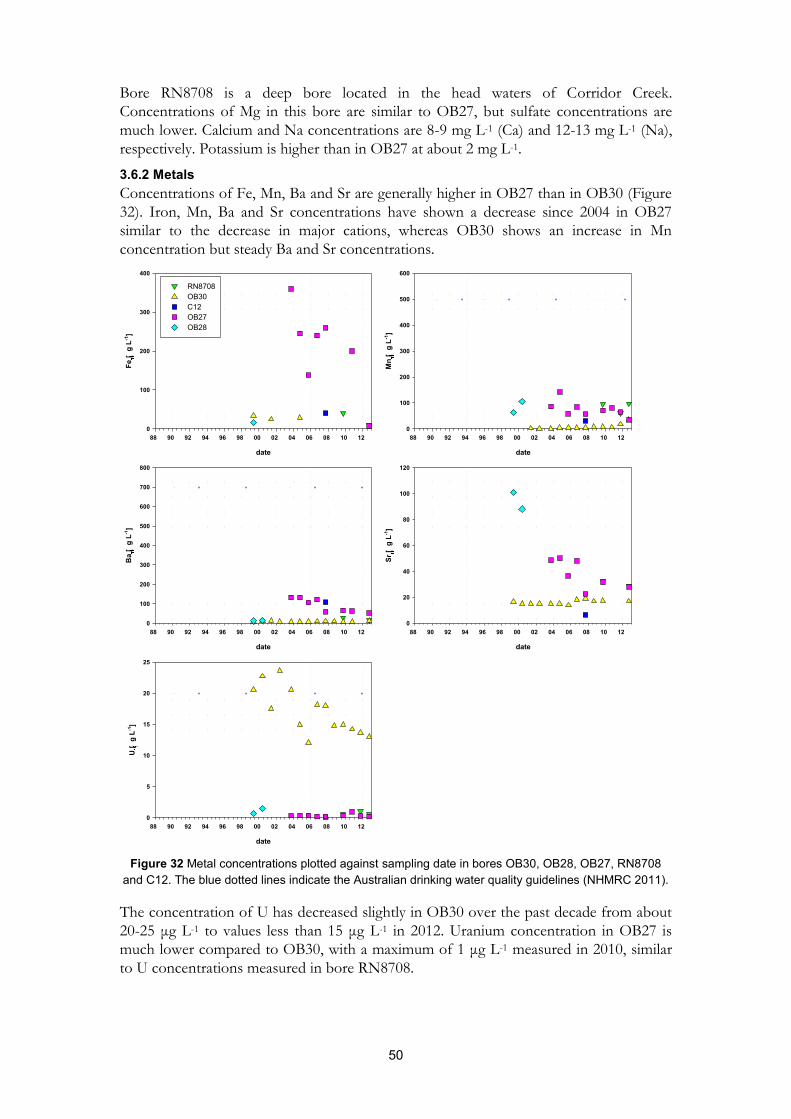
3.5.2 Metals Metal concentrations for bores OB20, OB21A, RN23568 and C1_shallow are shown in
Figure 29. Concentrations of Fe in bores OB20 and OB21A exhibit similar trends, with
OB21A following the trend observed in OB20. Klessa (2001) has reported an increasing
Mn concentration in OB21A between 1983 and 2000, when the concentration increased
from less than 150 μg L-1 to more than 400 μg L-1. Our data show that Mn
concentrations in OB21A have declined again since 2003 to levels around 300 μg L-1.
The concentrations of Mn are generally lower in OB20 but appear to be slightly
increasing since 2008 when Fe concentration was lowest.
date
88 90 92 94 96 98 00 02 04 06 08 10 12
Ca
[g
L-1]
0
5000
10000
15000
20000
25000
30000
OB20RN23568OB21AC1 shallow
date
88 90 92 94 96 98 00 02 04 06 08 10 12
Na
[g
L-1]
0
5000
10000
15000
20000
25000
30000
date
88 90 92 94 96 98 00 02 04 06 08 10 12
SO4 [
g L-1
]
0
500
1000
1500
2000
2500
3000
3500
date
88 90 92 94 96 98 00 02 04 06 08 10 12
Mg
[g
L-1]
0
5000
10000
15000
20000
25000
30000
date
88 90 92 94 96 98 00 02 04 06 08 10 12
K [
g L-1
]
0
500
1000
1500
2000
2500
3000
3500
47
U concentrations are low and show the same trend in the two bores, with OB21A
following the trend observed in OB20. Maximum U concentrations of 0.6 μg L-1 (OB20)
and 1.3 μg L-1 (OB21A) were measured in samples collected in September 2012.
Figure 29 Metal concentrations plotted against sampling date in bores OB20, OB21A, RN23568 and C1_shallow. The blue dotted lines indicate the Australian drinking water quality guidelines (NHMRC
2011).
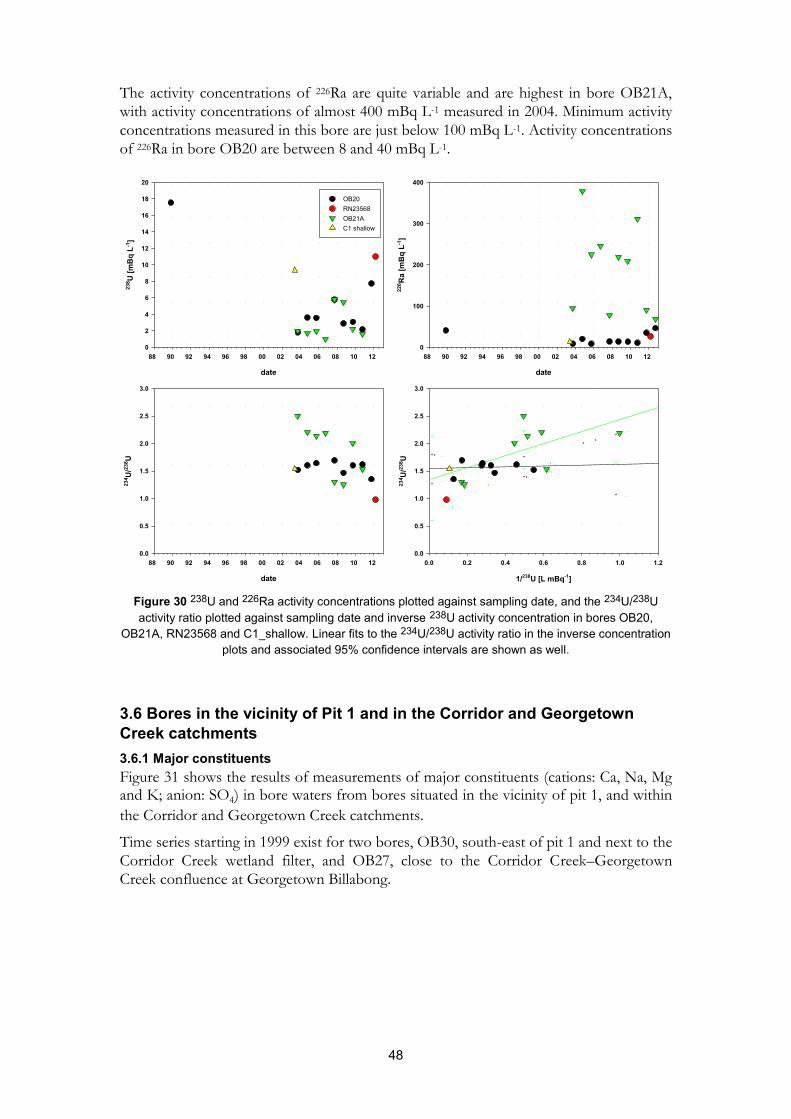
3.5.3 Radionuclides Figure 30 shows the results of the 238U activity 226Ra concentrations measured in bores
OB20, OB21A and C1_shallow, and the 234U/238U activity ratio plotted against date of
sampling and the inverse 238U activity concentration, respectively.
U activity concentrations in OB20 and OB21A are similar, and activity ratios generally
>1 in the two bores. The inverse concentration plots do not show a significant
correlation between the measured 234U/238U activity ratios and the inverse of the 238U
activity concentration measured in the bores.
date
88 90 92 94 96 98 00 02 04 06 08 10 12
Fe [
g L-1
]
0
200
400
600
800
1000
OB20RN23568OB21AC1 shallowy column vs Fe
date
88 90 92 94 96 98 00 02 04 06 08 10 12
Mn
[g
L-1]
0
100
200
300
400
500
600
date
88 90 92 94 96 98 00 02 04 06 08 10 12
Ba
[g
L-1]
0
100
200
300
400
500
600
700
800
date
88 90 92 94 96 98 00 02 04 06 08 10 12
Sr [
g L-1
]
0
20
40
60
80
date
88 90 92 94 96 98 00 02 04 06 08 10 12
U [
g L-1
]
0
5
10
15
20
25
48
The activity concentrations of 226Ra are quite variable and are highest in bore OB21A,
with activity concentrations of almost 400 mBq L-1 measured in 2004. Minimum activity
concentrations measured in this bore are just below 100 mBq L-1. Activity concentrations
of 226Ra in bore OB20 are between 8 and 40 mBq L-1.
Figure 30 238U and 226Ra activity concentrations plotted against sampling date, and the 234U/238U activity ratio plotted against sampling date and inverse 238U activity concentration in bores OB20,
OB21A, RN23568 and C1_shallow. Linear fits to the 234U/238U activity ratio in the inverse concentration plots and associated 95% confidence intervals are shown as well.
3.6 Bores in the vicinity of Pit 1 and in the Corridor and Georgetown Creek catchments 3.6.1 Major constituents Figure 31 shows the results of measurements of major constituents (cations: Ca, Na, Mg and K; anion: SO4) in bore waters from bores situated in the vicinity of pit 1, and within
the Corridor and Georgetown Creek catchments.
Time series starting in 1999 exist for two bores, OB30, south-east of pit 1 and next to the
Corridor Creek wetland filter, and OB27, close to the Corridor Creek–Georgetown
Creek confluence at Georgetown Billabong.
date
88 90 92 94 96 98 00 02 04 06 08 10 12
238 U
[mB
q L-1
]
0
2
4
6
8
10
12
14
16
18
20
OB20RN23568OB21AC1 shallow
date
88 90 92 94 96 98 00 02 04 06 08 10 12
226 R
a [m
Bq
L-1]
0
100
200
300
400
date
88 90 92 94 96 98 00 02 04 06 08 10 12
234 U
/238 U
0.0
0.5
1.0
1.5
2.0
2.5
3.0
1/238U [L mBq-1]
0.0 0.2 0.4 0.6 0.8 1.0 1.2
234 U
/238 U
0.0
0.5
1.0
1.5
2.0
2.5
3.0
49
Figure 31 Major constituent concentrations plotted against sampling date in bores OB30, OB28, OB27, RN8708 and C12.
Deep bore OB30 is dominated by Mg and Ca, with concentrations above 10 mg L-1 of
Ca and above 50 mg L-1 for Mg. Concentrations of Na are generally below 5 mg L-1 in
OB30 and K is below 1 mg L-1. Deep bore OB27 shows about 3-4 times lower Ca and
Mg concentrations but Na is typically higher (up to 20 mg L-1) than in OB30. Calcium,
Na and Mg appear to have decreased over the past decade in OB27.
Sulfate concentration in bore OB27 has increased from 0.7 mg L-1 in 2003 to above 30
mg L-1 in 2010-11, concentrations which are similar to the sulfate concentrations in bore
OB30. None of the major cations exhibited a similar increase during that period.
Magnesium and Ca have increased in bore OB30 between 1999 and 2004. Tailings
deposition in pit 1 has started in 1996. The increase of the concentrations of these two
conservative elements could potentially be due to the deposition of tailings into the
mined out pit.
Bore OB28 in the vicinity of OB27 shows major cation concentrations similar to OB27,
although K concentrations are higher.
date
88 90 92 94 96 98 00 02 04 06 08 10 12
Ca
[g
L-1]
0
2000
4000
6000
8000
10000
12000
14000
16000
18000
RN8708OB30C12OB27OB28
date
88 90 92 94 96 98 00 02 04 06 08 10 12
Na
[g
L-1]
0
5000
10000
15000
20000
25000
date
88 90 92 94 96 98 00 02 04 06 08 10 12
SO4 [
g L-1
]
0
10000
20000
30000
40000
date
88 90 92 94 96 98 00 02 04 06 08 10 12
Mg
[g
L-1]
0
10000
20000
30000
40000
50000
60000
70000
date
88 90 92 94 96 98 00 02 04 06 08 10 12
K [
g L-1
]
0
1000
2000
3000
4000
50
Bore RN8708 is a deep bore located in the head waters of Corridor Creek.
Concentrations of Mg in this bore are similar to OB27, but sulfate concentrations are
much lower. Calcium and Na concentrations are 8-9 mg L-1 (Ca) and 12-13 mg L-1 (Na),
respectively. Potassium is higher than in OB27 at about 2 mg L-1.
3.6.2 Metals Concentrations of Fe, Mn, Ba and Sr are generally higher in OB27 than in OB30 (Figure
32). Iron, Mn, Ba and Sr concentrations have shown a decrease since 2004 in OB27
similar to the decrease in major cations, whereas OB30 shows an increase in Mn
concentration but steady Ba and Sr concentrations.
Figure 32 Metal concentrations plotted against sampling date in bores OB30, OB28, OB27, RN8708 and C12. The blue dotted lines indicate the Australian drinking water quality guidelines (NHMRC 2011).
The concentration of U has decreased slightly in OB30 over the past decade from about
20-25 μg L-1 to values less than 15 μg L-1 in 2012. Uranium concentration in OB27 is
much lower compared to OB30, with a maximum of 1 μg L-1 measured in 2010, similar
to U concentrations measured in bore RN8708.
date
88 90 92 94 96 98 00 02 04 06 08 10 12
Fe [
g L-1
]
0
100
200
300
400
RN8708OB30C12OB27OB28
date
88 90 92 94 96 98 00 02 04 06 08 10 12
Mn
[g
L-1]
0
100
200
300
400
500
600
date
88 90 92 94 96 98 00 02 04 06 08 10 12
Ba
[g
L-1]
0
100
200
300
400
500
600
700
800
date
88 90 92 94 96 98 00 02 04 06 08 10 12
Sr [
g L-1
]
0
20
40
60
80
100
120
date
88 90 92 94 96 98 00 02 04 06 08 10 12
U [
g L-1
]
0
5
10
15
20
25
51
3.6.3 Radionuclides Figure 33 shows the 238U activity 226Ra concentrations and the 234U/238U activity ratio
measured in bore waters from this catchment.
Uranium activity concentration is highest in pit dewatering bore MBL. An activity
concentration of almost 2 Bq L-1 was measured in this bore in 2003 indicative of seepage
from tailings stored in the pit (data not shown in Figure 29). The next highest 238U
activity concentration was measured in bore OB30 but 238U activity concentration has
decreased from 1999 onwards. OB30 exhibits little variability in 234U/238U activity ratios,
which is close to 1 (1.08 on average) and there is no statistically significant correlation
between 234U/238U activity ratios and the inverse of the 238U activity concentration in
either OB30 or OB27.
Activity concentrations of 238U in bore OB27 are below 10 mBq L-1. 226Ra activity
concentrations in this bore are higher than in OB30, highlighting the different
geochemical characteristics of the uranium and radium radioisotopes in groundwater.
Figure 33 238U and 226Ra activity concentrations plotted against sampling date, and the 234U/238U activity ratio plotted against sampling date and inverse 238U activity concentration in bores MBH, MBL
OB30, OB28, OB27, RN8708 and C12. Linear fits to the 234U/238U activity ratio in the inverse concentration plots and associated 95% confidence intervals are shown as well.
3.7 Bores in the RP2 and Pit 3 area Three bores were investigated over the years from this area. Only bore OB29 has metal
and major ion data available. Some radionuclide data exist for R.P. 79/1 and R.P 79/2,
which were investigated by eriss in the late 80s to mid 90s. Whereas bore 79/2 in the
RP2 area is still active, bore 79/1 is most likely buried. OB29 is no longer sampled.
date
88 90 92 94 96 98 00 02 04 06 08 10 12
238 U
[mB
q L-1
]
0
50
100
150
200
250
300 MBHMBLRN8708OB30C12
OB27OB28
date
88 90 92 94 96 98 00 02 04 06 08 10 12
226 R
a [m
Bq
L-1]
0
20
40
60
80
date
88 90 92 94 96 98 00 02 04 06 08 10 12
234 U
/238 U
0.0
0.5
1.0
1.5
2.0
2.5
3.0
1/238U [L mBq-1]
0.0 0.2 0.4 0.6
234 U
/238 U
0.0
0.5
1.0
1.5
2.0
2.5
MBHMBLRN8708OB30C12OB27OB28
52
3.7.1 Major constituents Figure 34 shows the results of measurements of major constituents (cations Ca, Na, Mg and K; anion: SO4) in water from bore OB29 situated to the north of RP2.
Bore OB29 is dominated by Mg, with concentrations of 90-100 mg∙L-1. The
concentrations of Na and Mg are 6-10 mg∙L-1, K concentrations are generally below 5
mg∙L-1. Sulfate concentrations in 2002 were high at 47 mg∙L-1.
Figure 34 Major constituent concentrations plotted against sampling date in bore OB29.
3.7.2 Metals Concentrations of Fe, Mn, Ba, Sr and U in bore OB29 are shown in Figure 35. There is a
distinct increase of Fe, Mn and U concentrations in OB29 observed in 2002. ERA
reported that the groundwater level in this bore has dropped significantly between 1999
and 2001. Reasons for this drop in the groundwater level were developments of pit 3
further to the south and east that took place during that period (ERA 2001). It is likely
that the increase in Fe, Mn and U in this bore is associated with an increase in seepage of
date
88 90 92 94 96 98 00 02 04 06 08 10 12
Ca
[g
L-1]
0
2000
4000
6000
8000
10000
12000
OB29
date
88 90 92 94 96 98 00 02 04 06 08 10 12 N
a [
g L-1
]0
2000
4000
6000
8000
10000
date
88 90 92 94 96 98 00 02 04 06 08 10 12
K [
g L-1
]
0
1000
2000
3000
4000
5000
6000
date
88 90 92 94 96 98 00 02 04 06 08 10 12
SO4 [
g L-1
]
0
10000
20000
30000
40000
50000
date
88 90 92 94 96 98 00 02 04 06 08 10 12
Mg
[g
L-1]
0
20000
40000
60000
80000
100000
120000
53
water from RP2 in this bore associated with observed flow of groundwater into pit 3.
This is also indicated by the high sulfate concentrations measured in 2002.
Figure 35 Metal concentrations plotted against sampling date in bores OB29. The blue dotted lines indicate the Australian drinking water quality guidelines (NHMRC 2011).
3.7.3 Radionuclides Results of radionuclide analyses are shown in Figure 36. Activity concentrations of 238U
measured via alpha spectrometry agree well with measurements performed using ICPMS.
The activity concentrations of 238U in bores OB29 and RP 79/1 between 1989 and 2001
ranged from 30 to about 180 mBq∙L-1. In 2002, the 238U activity concentration increased.
This increase coincides with an increase in the activity concentration of 226Ra. At the
same time a decrease in the 234U/238U activity ratio to a value of 1.11 can be seen.
date
88 90 92 94 96 98 00 02 04 06 08 10 12
Fe [
g L-1
]
0
20
40
60
80
100
120
140
OB29
date
88 90 92 94 96 98 00 02 04 06 08 10 12
Mn
[g
L-1]
0
100
200
300
400
500
600
date
88 90 92 94 96 98 00 02 04 06 08 10 12
Ba
[g
L-1]
0
100
200
300
400
500
600
700
800
date
88 90 92 94 96 98 00 02 04 06 08 10 12
Sr [
g L-1
]
0
20
40
60
80
100
date
88 90 92 94 96 98 00 02 04 06 08 10 12
U [
g L-1
]
0
100
200
300
400
54
Although there is a linear correlation of the 234U/238U activity ratio with the inverse of
the 238U activity concentration in bore OB29, the decrease is not statistically significant (p
= 0.11). Nonetheless it is likely that this bore has been affected by seepage of water from
RP2, due to further developments of Pit 3 to the south and east during that time. Bore
OB29 is no longer sampled.
Figure 36 238U and 226Ra activity concentrations plotted against sampling date, and the 234U/238U activity ratio plotted against sampling date and inverse 238U activity concentration in bores OB29,
R.P.79/1 and R.P.79/2. A linear fit to the 234U/238U activity ratio in the inverse concentration plot for OB29 and the associated 95% confidence interval is shown as well.
3.8 Bores in the Djalkmarra Billabong and Magela Creek area 3.8.1 Major constituents Figure 37 shows the results of measurements of major constituents (cations: Ca, Na, Mg and K; anion: SO4) in bore water collected from bores situated in the Djalkmarra
Billabong and Magela Creek area.
Only bore 83_1 has a time series that extends over the past 10 years. Results from other
bores are sporadic, bores RN23562 and RN22211 (which is no longer active) have data
available from the last 5 years, starting in 2008.
Bore 83_1 is a deep (0-90 m) statutory bore of ERA and is located at the edge of the
Magela Land Application Area. It shows seasonal variability in major ion concentrations,
with lower concentrations generally measured during and at the end of the wet season.
The concentrations measured by eriss in samples collected at the end of the dry season
are in good agreement with those reported by ERA (ERA 2012).
Bore 83_1 is dominated by Na, Ca and Mg, with concentrations around 4-10 mg∙L-1. The
concentrations of K are around 1 mg∙L-1. Cation concentrations are generally lower in
bores RN23562 and RN22211.
date
88 90 92 94 96 98 00 02 04 06 08 10 12
238 U
[mB
q L-1
]
0
500
1000
1500
2000
2500
3000
R.P. 79/ 1R.P. 79/ 2OB29
date
88 90 92 94 96 98 00 02 04 06 08 10 12
226 R
a [m
Bq
L-1]
0
100
200
300
400
500
600
date
88 90 92 94 96 98 00 02 04 06 08 10 12
234 U
/238 U
1.0
1.1
1.2
1.3
1.4
1.5
1/238U [L mBq-1]
0.00 0.01 0.02 0.03 0.04
234 U
/238 U
0.9
1.0
1.1
1.2
1.3
1.4
1.5
1.6
1.7
55
Figure 37 Major constituent concentrations plotted against sampling date in bores MC24, MC27, 83_1, RN23566, RN22211 and Magela Ck 11/80.
3.8.2 Metals Results of metal analyses are shown in figure 38.The levels of Mn and U in bore 83_1 are
in good agreement with those reported by ERA for this bore (ERA 2012). Uranium
concentrations were highest in 2003 but seem to have decreased since. In 2010 U shows
another maximum, in agreement with the levels published in ERA (2012) for this period.
Bore RN23562 shows concentrations of Mn and U comparable to concentrations in bore
83_1. In contrast, Mn concentration is higher in bore RN22211, whereas U
concentration is much lower.
date
88 90 92 94 96 98 00 02 04 06 08 10 12
Ca
[g
L-1]
0
2000
4000
6000
8000
10000
12000
MC24MC27MC27 deep83_179/679/9RN23562RN22211Magela Ck 11/80
date
88 90 92 94 96 98 00 02 04 06 08 10 12
Na
[g
L-1]
0
2000
4000
6000
8000
10000
12000
14000
16000
18000
date
88 90 92 94 96 98 00 02 04 06 08 10 12
K [
g L-1
]
0
1000
2000
3000
4000
5000
date
88 90 92 94 96 98 00 02 04 06 08 10 12
SO4 [
g L-1
]
100
1000
10000
100000
1000000
date
88 90 92 94 96 98 00 02 04 06 08 10 12
Mg
[g
L-1]
100
1000
10000
100000
56
Figure 38 Metal concentrations plotted against sampling date in bores MC24, MC27, 83_1, RN23566, RN22211 and Magela Ck 11/80. The blue dotted lines indicate the Australian drinking water quality
guidelines (NHMRC 2011).
3.8.3 Radionuclides Activity concentrations of 238U and 226Ra and the 234U/238U activity ratios are shown in
The activity concentration of 238U in bore 83_1 is low, with a maximum of 23 mBq∙L-1
measured in 2003, and values between 3-7 mBq∙L-1 since 2004. It appears that higher 238U activity concentrations are associated with lower 234U/238U activity ratios in bore
83_1. However, the regression of the inverse concentration plot is not statistically
significant (p = 0.13).
226Ra activity concentrations are between 2 and 12 mBq∙L-1 in bore 83_1. 226Ra activity
concentrations were highest in bores 79/6 and 79/9 in the early 1990s when these bores
date
88 90 92 94 96 98 00 02 04 06 08 10 12
Fe [
g L-1
]
0
200
400
600
800
1000
1200
1400
1600
MC24MC27MC27 deep83_179/679/9RN23562RN22211Magela Ck 11/80
date
88 90 92 94 96 98 00 02 04 06 08 10 12
Mn
[g
L-1]
0
100
200
300
400
500
600
date
88 90 92 94 96 98 00 02 04 06 08 10 12
Ba
[g
L-1]
0
100
200
300
400
500
600
700
800
date
88 90 92 94 96 98 00 02 04 06 08 10 12
Sr [
g L-1
]
0
20
40
60
80
date
88 90 92 94 96 98 00 02 04 06 08 10 12
U [
g L-1
]
0
5
10
15
20
25
57
were most likely influenced by seepage from RP2. Bore 79/6 is now buried on the walls
of Pit 3 and bore 79/9 is destroyed.
Figure 39 238U and 226Ra activity concentrations plotted against sampling date, and the 234U/238U activity ratio plotted against sampling date and inverse 238U activity concentration in bores MC24,
MC27, 79/6, 79/9, 83_1, RN23566, RN22211 and Magela Ck 11/80. A linear fit to the 234U/238U activity ratio in the inverse concentration plot for 83_1 and associated 95% confidence interval is shown as well.
date
88 90 92 94 96 98 00 02 04 06 08 10 12
238 U
[mB
q L-1
]
0
5
10
15
20
25
MC24MC27MC27 deep83_179/679/9RN23562RN22211Magela Ck 11/80
date
88 90 92 94 96 98 00 02 04 06 08 10 12
226 R
a [m
Bq
L-1]
0.1
1
10
100
1000
date
88 90 92 94 96 98 00 02 04 06 08 10 12
234 U
/238 U
0.6
0.8
1.0
1.2
1.4
1.6
1.8
2.0
1/238U [L mBq-1]
0.00 0.05 0.10 0.15 0.20 0.25 0.30 0.35
234 U
/238 U
0.8
1.0
1.2
1.4
1.6
1.8
58
4 Discussion In this section, concentrations and time series will be discussed of samples from
groundwater monitoring bores that are still active and for which data is available up until
2010 and beyond.
Figure 40 shows an aerial photograph of the Ranger mine and those longer time series (>
7 years) Ranger monitoring bores (note: not all of the bores were sampled every year).
The bores show a good spatial distribution around the site, with an obvious focus on
monitoring bores around the TSF. Figure 41 shows the same map with soil classification
overlaid.
Figure 40 Groundwater monitoring bores around Ranger uranium mine and analysed by eriss for radionuclides and metals with time series > 7 years up to 2012/13.
59
Figure 41 Groundwater monitoring bores around Ranger uranium mine and analysed by eriss for radionuclides and metals with time series > 5 years up to 2012/13 with a soil map overlaid.
Ranger boresInfrastructureland application areas
SoilsRangerArea<all other values>
Id, MAP_UNIT, SOIL_DESC0, G, Deep yellowish gradational sandy loams to clay loams with gravels at depth.0, W, Djalkmara Billabong0, H, Deep greyish to yellowish brown gradational clay loams to mottled medium-heavy c0, A, Shallow yellow uniform sands with gravels throughout.0, D, Moderately deep yellowish brown uniform sand and earthy sands over gravel pan.0, W, Georgetown Billabong0, F, Moderately deep yellow gradational sands to looms over gravel pan.0, W, Coonjimba Billabong0, B, Shallow red or brown uniform sands with gravels throughout.0, C, Shallow greyish or yellowish brown uniform sands with very minor gravels.0, E, Moderately deep greyish brown uniform sands over matted clay.0, O, Very rare shallow sands mainly rock outcrops.
60
Figure 42 shows a ternary plot of the major cation concentrations (in per cent) measured
in the ten bores shown in Figure 41. Due to the lack of anion concentrations measured
in the bores a piper diagram is not provided.
Figure 42 Ternary diagram of major cation concentrations in long time series bores.
4.1 Bores around the TSF Bores OB23 (RN22937), OB1A (RN22902), RN9329, OB20 (RN22934) and OB21A
(RN22935) are deep bores located around the TSF. They sample aquifers 2 or 3, with
screen depths of 36-51 m (OB23), 16-31 m (OB1A), 17-19 m (RN9329), 21-36 m
(OB20) and 31-43m (OB21A). Element and radionuclide activity concentrations for the
individual bores are shown in Appendices A26, A27, A28, A30 and A57.
4.1.1 Major cations The ternary plot (Figure 42) shows that OB23 and OB1A to the north of the TSF are
dominated by 50-70% (Na+K) with 10-30% of both, Mg and Ca. Bore OB23 is located
in the vicinity of fault 1, north of the TSF (Salama & Foley 1997) and exhibits high Na
concentrations, typical for bores in the fractured Nanambu complex (Klessa 2001).
Calcium, Na and Mg concentrations in OB1A are lower than in OB23, whereas K is
higher (Figure 42).
Separated in the ternary plot from bores OB23 and OB1A are bores RN9392, OB21A
and OB20. These bores are situated to the west and south of the TSF and are located
more than 400 m away from the TSF wall.
Bores OB20, OB21A and RN9329 show a similar temporal variability in their cation
concentrations. RN9329 and OB20 are dominated by 40-50% (Na+K), but major cation
concentrations in bore RN9329 are lower than in OB20, except for K (Figure 43). In
contrast, OB21A shows about equal contribution from (Na+K), Mg and Ca in the water,
and the bore exhibits the highest Mg concentrations of the bores in the TSF area.
Na+K0 10 20 30 40 50 60 70 80 90 100
Mg
0
10
20
30
40
50
60
70
80
90
100
Ca
0
10
20
30
40
50
60
70
80
90
100
OB23OB1ARN9329OB20OB21AOB30OB2783_1RN23551B11
61
Figure 43 Major cation concentrations in bores around the TSF.
4.1.2 Metals and radionuclides Figure 44 shows the concentrations of metals and activity concentrations of
radionuclides, and the 234U/238U activity ratios in the five bores around the TSF, plotted
against sampling date.
Fe, Mn and Ba concentrations are highest in bore OB1A immediately north-west of the
TSF, followed by RN9329. The variation of the Fe concentration are similar in bores
OB23, OB20 and OB21A (and to a lesser extent OB1A), with low concentrations
measured in 2007 and 2012. Uranium concentrations in the bores have generally been
low throughout the last decade (< 1 μg L-1), but higher U concentrations were measured
in OB21A and OB23 in 2011 and 2012, respectively.
Klessa (2001) observed an increase in Mn from ~150 to ~400 mg·L-1 in OB21A in 1998-
2001, believed to be an effect of a succession of wetter than normal years that increased
groundwater level height leading to Mn reduction in the shallow aquifer and its migration
into the fractured aquifer. Mn concentration has remained relatively stable at 400 mg·L-1
in OB21A for the last decade, suggesting that the increase was not due to seasonal
changes and has persisted due to lasting wetter than normal years.
The similar variability in Fe concentration (and major cation concentrations in some
bores) is likely due to the time of sampling, dilution and seasonal effects (such as the
length and intensity of the preceding wet-season) and potentially associated changes in
seasonal redox conditions. These changing conditions also appear to influence the U
concentration in bores OB23, OB20 and OB21A, which exhibits a trend opposite to Fe
concentrations: high U concentrations were measured in OB23 in 2001 and 2011 and
these high concentrations are associated with low Fe. Generally, the five bores show
activity concentrations of 226Ra larger than 238U. Radium-226 and 238U activity
concentrations in the bores are in agreement with levels reported by ERA for bores in
the general areas (ERA 2012).
Date
99 00 01 02 03 04 05 06 07 08 09 10 11 12 13
Ca
[g
L-1]
0
5000
10000
15000
20000
25000
30000
35000OB23OB1ARN9329OB20OB21A
Date
99 00 01 02 03 04 05 06 07 08 09 10 11 12 13
Na
[g
L-1]
0
10000
20000
30000
40000
50000
60000
OB23OB1ARN9329OB20OB21A
Date
99 00 01 02 03 04 05 06 07 08 09 10 11 12 13
K [
g L-1
]
0
1000
2000
3000
4000
5000
OB23OB1ARN9329OB20OB21A
Date
99 00 01 02 03 04 05 06 07 08 09 10 11 12 13
Mg
[g
L-1]
0
5000
10000
15000
20000
25000
OB23OB1ARN9329OB20OB21A
a b
c d
62
Figure 44 Metal and radionuclide activity concentrations and ratios in bores around the TSF.
OB23 to the north of the TSF has the highest U concentration and shows a statistically
significant (p<0.05) decrease of the 234U/238U activity ratio when plotted against the
inverse of the 238U activity, with a contaminating end-member 234U/238U activity ratio of
1.08±0.10, i.e. high U concentrations in this bore are characterised by 234U/238U activity
ratios close to 1.0. This is indicative of seepage from the TSF. However, the large
variability of 238U and 226Ra activity concentrations may have also been caused by
extensive earthworks in the area from 2005 onwards, with several TSF wall lifts and the
construction of the trial landform in late 2008 and early 2009 in the immediate vicinity of
bore OB23.
Date
99 00 01 02 03 04 05 06 07 08 09 10 11 12 13
Fe [
g L-1
]
10
100
1000
10000
100000
OB23OB1ARN9329OB20OB21A
Date
99 00 01 02 03 04 05 06 07 08 09 10 11 12 13
Mn
[g
L-1]
1
10
100
1000
10000
OB23OB1ARN9329OB20OB21A
Date
99 00 01 02 03 04 05 06 07 08 09 10 11 12 13
Ba
[g
L-1]
0
20
40
60
80
100
120
140
160
180
200
220
OB23OB1ARN9329OB20OB21A
Date
99 00 01 02 03 04 05 06 07 08 09 10 11 12 13
Sr [
g L-1
]0
20
40
60
80
OB23OB1ARN9329OB20OB21A
Date
99 00 01 02 03 04 05 06 07 08 09 10 11 12 13
U [
g L-1
]
0.01
0.1
1
10
OB23OB1ARN9329OB20OB21A
Date
99 00 01 02 03 04 05 06 07 08 09 10 11 12 13
226 R
a [m
Bq
L-1]
1
10
100
1000
OB23OB1ARN9329OB20OB21A
Date
99 00 01 02 03 04 05 06 07 08 09 10 11 12 13
234 U
/238 U
act
ivity
ratio
0.0
0.5
1.0
1.5
2.0
2.5
3.0
3.5
OB23OB1ARN9329OB20OB21A
1/238U [L mBq-1]
0 1 2 3 4
234 U
/238 U
0.0
0.5
1.0
1.5
2.0
2.5
3.0
3.5
OB23R2=0.78; p << 0.05OB1AR2=0.16; p=0.15RN9329R2=0.14; p=0.37OB20R2=0.01; p=0.81OB21AR2=0.38; p=0.10
a b
c d
e f
g h
63
OB1A to the north-west of the TSF wall shows essentially no trend in either 226Ra or 238U activity concentrations until 2005 but there has been an increase in 226Ra and 238U
activity concentrations in 2007. The contaminating end-member 234U/238U activity ratio
is close to 1 (1.10±0.07), but the correlation between the 234U/238U activity ratio and the
inverse of the 238U activity concentration is not significant (p=0.15).
RN9329 in the Gulungul catchment shows a y-intercept of 1.32±0.13, and a slight
decrease of the 234U/238U activity ratio with increasing uranium activity concentrations
but the correlation is not statistically significant (p=0.37).
OB20 and OB21A are located to the south of the TSF and exhibited maximum 226Ra
activity concentrations in September 2004, whereas uranium peaked in 2012. OB21A 226Ra activity concentrations are higher than in OB20, in agreement with levels reported
in ERA (2012).
There is no statistically significant correlation between the 234U/238U activity ratio and the
inverse of the 238U activity concentration for OB20 (p=0.81) and the intercept with the y-
axis is significantly different from 1 (1.54±0.11). The 234U/238U activity ratio in OB21A
decreases with increasing uranium concentration although the correlation is not
statistically significant (p=0.11). It is thus unlikely that this OB21A is impacted by
seepage from the TSF. Based on the considerations above, the one bore potentially
influenced by seepage from the TSF is OB23, located close to one of the major fault
zones north of the TSF area (Figure 2).
4.1.3 Principal components analysis (PCA) Table 14 summarises the results of the PCA for the deep bores (OB1A, OB23, RN9329,
OB20 and OB21A) around the TSF, including the loadings and eigenvalues of the first
three principal components.
Electric Conductivity (EC) and pH values measured in the bores at or around the time of
sample collection were acquired from the Northern Territory DME and are included in
the PCA. EC and pH values in these bores are given in Appendix A62. Concentration
values below detection limits have been included in the PCA and a value corresponding
to half of the detection limit of that element has been assigned to the sample. In our
study, only factors with eigenvalues greater than 1 were taken into account.
The first three factors explain 88% of the total variance observed. Figure 45 shows the
scree, loading and score plots for bores OB1A, OB23, RN9329, OB20 and OB21A.
Table 14 Principal component loadings of bores around the TSF
Ryan B, Bollhöfer A & Martin P 2007. Uranium in groundwater at a rehabilitated
Uranium mine in Western Arnhem Land, Australia. International Atomic Energy
Agency (IAEA) conference, Environmental Radioactivity: From measurement and
Assessment to Regulation. 23–27 April 2007, Vienna, Austria.
Salama R & Foley GA 1997. Ranger regional hydrology conceptual model. CSIRO Land
& Water, October 1997.
77
Salama R, Kin P & Pollock DW 1999. Assessment of potential solutes migration from
Pit #3 under different capping and treatment scenarios. Consultancy report for ERA
Ranger Mine. CSIRO Land and Water Consultancy Report no 99/57, October 1999.
Salama R, Pollock D & Foley G 1998a. The impacts of final landform scenarios on the
groundwater systems of Ranger Minesite: A GIS-Hydrogeomorphic approach.
CSIRO Land and Water report no 98/17, May 1998.
Salama R, Kin P, Foley GA, Pollock D & Ellerbroek D 1998b. Groundwater interaction
with Magela Creek. CSIRO Land and Water Report no 98/18, April 1998.
Salama R, Kin P, Pollock D & Foley GA 1998c. Assessment of final tailings repositories
in Ranger minesite, tailings dam and Pit #3. Report for ERA Ranger Mine. CSIRO
Land & Water Report no 98/19, May 1998.
Timms W, Wasko C, Pells S & Miller B 2010. Ranger Pit No.1 - Groundwater Flow
Modelling of Post-Closure Conditions. Water Research Laboratory, University of
New South Wales, Report 2010/15.
Turner K & Jones D 2010. Review of solute selection for water quality and
bioaccumulation monitoring. In eriss research summary 2008–2009, eds Jones DR &
Webb A, Supervising Scientist Report 201, Supervising Scientist, Darwin NT, 66-72.
Verma M & Salama R (1986) Preliminary Groundwater Studies in the Ranger Area.
Northern Territory. Department of Mines and Energy. Report31/1986.
Willett IR, Akber R & Bond WJ 1991. The fate of water and solutes following irrigation
with Retention Pond 2 water at the Ranger Uranium Mine: Summary of the final
report. Internal report 26, Supervising Scientist for the Alligator Rivers Region,
Canberra. Unpublished paper.
Willett IR & Bond WJ 1992. Adsorption properties of the soils of the Ranger Uranium
Mine land application area for solutes in water from Retention Pond 2. In:
Proceedings of the Workshop on Land Application of Effluent Water from Uranium
Mines in the Alligator Rivers Region. Supervising Scientist for the Alligators Rivers
Region, AGPS Canberra pp 113-138.
Zielinski RA, Chafin DT, Banta ER & Szabo BJ 1997. Use of 234U and 238U isotopes
to evaluate contamination of near-surface groundwater with uranium-mill effluent: a
case study in south-central Colorado, U.S.A. Environmental Geology, 32, 2, 124–136.
78
Appendix 1 Individual bore chemistry and radiochemistry data Bore ID - RN23931
Calcium
Collection Date (year)
88 90 92 94 96 98 00 02 04 06 08 10 12
Ca
Filt
ered
(g/
L)
0
2000
4000
6000
8000
10000
12000
Sodium
Collection Date (year)
88 90 92 94 96 98 00 02 04 06 08 10 12
Na
Filt
ered
(g/
L)
0
2000
4000
6000
8000
10000
12000
14000
BORE ID - RN23931 Data - Calcium, Potassium, Magnesium, Sodium and Sulfate
SO4
Collection Date (year)
88 90 92 94 96 98 00 02 04 06 08 10 12
SO
4 Fi
ltere
d (
g/L)
0
2000
4000
6000
8000
10000
12000
14000
Potassium
Collection Date (year)
88 90 92 94 96 98 00 02 04 06 08 10 12
K F
ilter
ed (
g/L)
0
1000
2000
3000
4000
5000
6000
Magnesium
Collection Date (year)
88 90 92 94 96 98 00 02 04 06 08 10 12
Mg
Filt
ered
(g/
L)
0
2000
4000
6000
800010000
12000
14000
16000
1800020000
79
Iron
Collection Date (year)
88 90 92 94 96 98 00 02 04 06 08 10 12
Fe F
ilter
ed (
g/L)
0
5
10
15
20
25
30
35
Manganese
Collection Date (year)
88 90 92 94 96 98 00 02 04 06 08 10 12
Mn
Filt
ered
(g/
L)
0
2
4
6
8
10
12
Strontium
Collection Date (year)
88 90 92 94 96 98 00 02 04 06 08 10 12
Sr
Filte
red
(g/
L)
0
5
10
15
20
25
BORE ID - RN23931 Data - Iron, Manganese, Barium, Strontium, Uranium & Vanadium
Uranium
Collection Date (year)
88 90 92 94 96 98 00 02 04 06 08 10 12
V F
ilter
ed (
g/L)
0.0
0.2
0.4
0.6
0.81.0
1.2
1.4
1.6
1.82.0
Barium
Collection Date (year)
88 90 92 94 96 98 00 02 04 06 08 10 12
Ba
Filt
ered
(g/
L)
0
5
10
15
20
25
30
35
Vanadium
Collection Date (year)
88 90 92 94 96 98 00 02 04 06 08 10 12
V F
ilter
ed (
g/L)
0
2
4
6
8
10
80
BORE ID - RN23931 Data - U-238, Ra-226, U-234:U-238 & 1/U-238Uncertainty is 1 standard deviation based on counting statistics only
U-234:U-238 (alpha spectrometry)
Collection date (year)
88 90 92 94 96 98 00 02 04 06 08 10 12
U-2
34:U
-238
0.0
0.5
1.0
1.5
2.0
U-238 (alpha spectrometry)
Collection date (year)
88 90 92 94 96 98 00 02 04 06 08 10 12
U-2
38 F
ilter
ed (m
Bq/
L)
0
5
10
15
20
25
Ra-226 (alpha spectrometry)
Collection date (year)
88 90 92 94 96 98 00 02 04 06 08 10 12
Ra-
226
Filt
ered
(mB
q/L)
0
10
20
30
40
50
U-234:U-238 vs. 1/U-238
1/U-238
0.0 0.1 0.2 0.3
U-2
34:U
-238
0.0
0.5
1.0
1.5
2.0
81
Bore ID – R.P. 79/ 1 Ranger
BORE ID - R.P. 79/ 1 RangerData - U-238, Ra-226, U-234:U-238 & 1/U-238Uncertainty is 1 standard deviation based on counting statistics only
U-234:U-238 (alpha spectrometry)
Collection date (year)
88 90 92 94 96 98 00 02 04 06 08 10 12
U-2
34:U
-238
0.0
0.5
1.0
1.5
2.0
U-238 (alpha spectrometry)
Collection date (year)
88 90 92 94 96 98 00 02 04 06 08 10 12
U-2
38 F
ilter
ed (m
Bq/
L)
0
100
200
300
400
500
Ra-226 (alpha spectrometry)
Collection date (year)
88 90 92 94 96 98 00 02 04 06 08 10 12
Ra-
226
Filt
ered
(mB
q/L)
0
100
200
300
400
500
600
U-234:U-238 vs. 1/U-238
1/U-238
0.0 0.1 0.2 0.3
U-2
34:U
-238
0.0
0.5
1.0
1.5
2.0
82
Bore ID – R.P. 79/ 2 Ranger
BORE ID - R.P. 79/ 2 RangerData - U-238, Ra-226, U-234:U-238 & 1/U-238Uncertainty is 1 standard deviation based on counting statistics only
U-234:U-238 (alpha spectrometry)
Collection date (year)
88 90 92 94 96 98 00 02 04 06 08 10 12
U-2
34:U
-238
0.0
0.5
1.0
1.5
2.0
U-238 (alpha spectrometry)
Collection date (year)
88 90 92 94 96 98 00 02 04 06 08 10 12
U-2
38 F
ilter
ed (m
Bq/
L)
0
20
40
60
80
Ra-226 (alpha spectrometry)
Collection date (year)
88 90 92 94 96 98 00 02 04 06 08 10 12
Ra-
226
Filt
ered
(mB
q/L)
0
2
4
6
8
10
12
14
16
18
U-234:U-238 vs. 1/U-238
1/U-238
0.0 0.1 0.2 0.3
U-2
34:U
-238
0.0
0.5
1.0
1.5
2.0
83
Bore ID – 79/6
BORE ID - 79/6Data - U-238, Ra-226, U-234:U-238 & 1/U-238 Uncertainty is 1 standard deviation based on counting statistics only
U-234:U-238 (alpha spectrometry)
Collection date (year)
88 90 92 94 96 98 00 02 04 06 08 10 12
U-2
34:U
-238
0
10
20
30
40
50
60
70
80
90100
U-238 (alpha spectrometry)
Collection date (year)
88 90 92 94 96 98 00 02 04 06 08 10 12
U-2
38 F
ilter
ed (m
Bq/
L)
0
10
20
30
40
50
60
70
80
90100
Ra-226 (alpha spectrometry)
Collection date (year)
88 90 92 94 96 98 00 02 04 06 08 10 12 R
a-22
6 F
ilter
ed (m
Bq/
L)
0
100
200
300
400
500
600
U-234:U-238 vs. 1/U-238
1/U-238
0.0 0.1 0.2 0.3
U-2
34:U
-238
0.0
0.5
1.0
1.5
2.0
84
Bore ID – 79/9
BORE ID - 79/9Data - U-238, Ra-226, U-234:U-238 & 1/U-238 (All results determined via alpha spectrometry)Uncertainty is 1 standard deviation based on counting statistics only
U-234:U-238 (alpha spectrometry)
Collection date (year)
88 90 92 94 96 98 00 02 04 06 08 10 12
U-2
34:U
-238
0.0
0.5
1.0
1.5
2.0
U-238 (alpha spectrometry)
Collection date (year)
88 90 92 94 96 98 00 02 04 06 08 10 12
U-2
38 F
ilter
ed (m
Bq/
L)
0
2
4
6
8
Ra-226 (alpha spectrometry)
Collection date (year)
88 90 92 94 96 98 00 02 04 06 08 10 12 R
a-22
6 F
ilter
ed (m
Bq/
L)
0
20
40
60
80
100
120
140
160
180200
U-234:U-238 vs. 1/U-238
1/U-238
0.0 0.1 0.2 0.3
U-2
34:U
-238
0.0
0.5
1.0
1.5
2.0
85
Bore ID – 83_1
Calcium
Collection Date (year)
88 90 92 94 96 98 00 02 04 06 08 10 12
Ca
Filt
ered
(g/
L)
0
2000
4000
6000
8000
Sodium
Collection Date (year)
88 90 92 94 96 98 00 02 04 06 08 10 12
Na
Filt
ered
(g/
L)
0
2000
4000
6000
8000
10000
12000
BORE ID - 83_1Data - Calcium, Potassium, Magnesium,Sodium and Sulfate
BORE ID - RN9329Data - U-238, Ra-226, U-234:U-238 & 1/U-238Uncertainty is 1 standard deviation based on counting statistics only
U-234:U-238 (alpha spectrometry)
Collection date (year)
88 90 92 94 96 98 00 02 04 06 08 10 12
U-2
34:U
-238
0.0
0.5
1.0
1.5
2.0
U-238 (alpha spectrometry)
Collection date (year)
88 90 92 94 96 98 00 02 04 06 08 10 12
U-2
38 F
ilter
ed (m
Bq/
L)
0
1
2
3
4
5
6
Ra-226 (alpha spectrometry)
Collection date (year)
88 90 92 94 96 98 00 02 04 06 08 10 12
Ra-
226
Filt
ered
(mB
q/L)
0
5
10
15
20
25
30
35
U-234:U-238 vs. 1/U-238
1/U-238
0.0 0.2 0.4 0.6 0.8 1.0 1.2
U-2
34:U
-238
0.0
0.5
1.0
1.5
2.0
202
Bore ID – RP1N1 and RP1N2
BORE ID - RP1N1 and N2Data - U-238, Ra-226, U-234:U-238 & 1/U-238Uncertainty is 1 standard deviation based on counting statistics only
U-234:U-238 (alpha spectrometry)
Collection date (year)
88 90 92 94 96 98 00 02 04 06 08 10 12
U-2
34:U
-238
0.0
0.5
1.0
1.5
2.0
U-238 (alpha spectrometry)
Collection date (year)
88 90 92 94 96 98 00 02 04 06 08 10 12
U-2
38 F
ilter
ed (m
Bq/
L)
0
100
200
300
400
500
600
Ra-226 (alpha spectrometry)
Collection date (year)
88 90 92 94 96 98 00 02 04 06 08 10 12 R
a-22
6 F
ilter
ed (m
Bq/
L)
0
20
40
60
80
100
120
140
160
180
U-234:U-238 vs. 1/U-238
1/U-238
0.000 0.005 0.010 0.015 0.020 0.025 0.030
U-2
34:U
-238
0.0
0.5
1.0
1.5
2.0
RP1N1
RP1N2
RP1N1
RP1N2
RP1N1 RP1N2
203
Bore ID – OB79/6A
BORE ID - OB79/6AData - U-238, Ra-226, U-234:U-238 & 1/U-238Uncertainty is 1 standard deviation based on counting statistics only
U-234:U-238 (alpha spectrometry)
Collection date (year)
88 90 92 94 96 98 00 02 04 06 08 10 12
U-2
34:U
-238
0.0
0.5
1.0
1.5
2.0
U-238 (alpha spectrometry)
Collection date (year)
88 90 92 94 96 98 00 02 04 06 08 10 12
U-2
38 F
ilter
ed (m
Bq/
L)
0
20
40
60
80
100
120
140
Ra-226 (alpha spectrometry)
Collection date (year)
88 90 92 94 96 98 00 02 04 06 08 10 12
Ra-
226
Filt
ered
(mB
q/L)
0
10
20
30
40
50
60
70
80
90100
U-234:U-238 vs. 1/U-238
1/U-238
0.006 0.008 0.010 0.012 0.014 0.016 0.018
U-2
34:U
-238
0.0
0.5
1.0
1.5
2.0
BORE ID - RP1N1 and N2Data - U-238, Ra-226, U-234:U-238 & 1/U-238Uncertainty is 1 standard deviation based on counting statistics only
U-234:U-238 (alpha spectrometry)
Collection date (year)
88 90 92 94 96 98 00 02 04 06 08 10 12
U-2
34:U
-238
0.0
0.5
1.0
1.5
2.0
U-238 (alpha spectrometry)
Collection date (year)
88 90 92 94 96 98 00 02 04 06 08 10 12
U-2
38 F
ilter
ed (m
Bq/
L)
0
100
200
300
400
500
600
Ra-226 (alpha spectrometry)
Collection date (year)
88 90 92 94 96 98 00 02 04 06 08 10 12
Ra-
226
Filt
ered
(mB
q/L)
0
20
40
60
80
100
120
140
160
180
U-234:U-238 vs. 1/U-238
1/U-238
0.000 0.005 0.010 0.015 0.020 0.025 0.030
U-2
34:U
-238
0.0
0.5
1.0
1.5
2.0
RP1N1
RP1N2
RP1N1
RP1N2
RP1N1 RP1N2
204
Bore ID – R.P. 79/ 2
BORE ID - R.P. 79/ 2 RangerData - U-238, Ra-226, U-234:U-238 & 1/U-238Uncertainty is 1 standard deviation based on counting statistics only
U-234:U-238 (alpha spectrometry)
Collection date (year)
88 90 92 94 96 98 00 02 04 06 08 10 12
U-2
34:U
-238
0.0
0.5
1.0
1.5
2.0
U-238 (alpha spectrometry)
Collection date (year)
88 90 92 94 96 98 00 02 04 06 08 10 12
U-2
38 F
ilter
ed (m
Bq/
L)
0
20
40
60
80
Ra-226 (alpha spectrometry)
Collection date (year)
88 90 92 94 96 98 00 02 04 06 08 10 12
Ra-
226
Filt
ered
(mB
q/L)
0
2
4
6
8
10
12
14
16
18
U-234:U-238 vs. 1/U-238
1/U-238
0.0 0.1 0.2 0.3
U-2
34:U
-238
0.0
0.5
1.0
1.5
2.0
205
Appendix 2 Bore water metal and radionuclide data
Table A61 Bore water metal and radionuclide activity concentrations. All metal concentrations are given in µg•L-1, radionuclde activity concentrations are given in mBq•L-1.
eriss_ID Date Site_ID RN number Ba Ca Fe K Mg Mn Na S SO4 Sr U V U-238 (1) 234U/238U U-238 (2) 234U/238U Ra-226 (1) Ra-226 (2)
Appendix 3 Bore water electrical conductivity and pH data Table A62 Bore water electrical conductivity (EC) in µS·cm-1 and pH, measured by the Northern Territory Department of Mines and Energy.
Bore OB23 eriss_ID Date Site_ID RN number EC pH
OB04004 15/09/2004 OB23 RN022937 394.7 6.91
OB05014 8/09/2005 OB23 RN022937 441.5 7.27
OB06004 14/09/2006 OB23 RN022937 430.3 7.04
OB07012 14/09/2007 OB23 RN022937 479.9 7.16
OB08005 4/09/2008 OB23 RN022937 466.2 7.48
OB09009 23/09/2009 OB23 RN022937 488.4 7.5
RM10038 28/09/2010 OB23 RN022937 446.8 7.18
Bore OB1A eriss_ID Date Site_ID RN number EC pH
OB03009 19/09/2003 OB1A RN022902 205 6.08
OB04001 22/09/2004 OB1A RN022902 123.7 5.73
OB05011 7/09/2005 OB1A RN022902 220.9 5.87
OB06001 12/09/2006 OB1A RN022902 238.6 6.26
OB07007 12/09/2007 OB1A RN022902 251.3 6.71
OB08007 5/09/2008 OB1A RN022902 279.3 6.52
OB09010 16/09/2009 OB1A RN022902 248.6 6.35
RM10041 30/09/2010 OB1A RN022902 241 6.15
OB11008 21/09/2011 OB1A RN022902 282.8 6.4
OB11008 21/09/2011 OB1A RN022902 282.8 6.4
Bore RN9329 eriss_ID Date Site_ID RN number EC pH
OB04009 14/09/2004 RN9329 RN009329 212 6.59
OB05019 6/09/2005 RN9329 RN009329 185 6.15
OB06009 13/09/2005 RN9329 RN009329 193.9 6.25
OB07011 13/09/2007 RN9329 RN009329 222.4 6.41
OB08006 4/09/2008 RN9329 RN009329 222.4 6.79
RM10045 1/10/2010 RN9329 RN009329 177.5 6.38
OB11007 20/09/2011 RN9329 RN009329 256.5 6.79
OB12016 19/09/2011 RN9329 RN009329 243.6 6.65
Bore OB20 eriss_ID Date Site_ID RN number EC pH
OB03011 16/09/2003 OB20 RN022934 202 6.52
OB04002 14/09/2004 OB20 RN022934 255.5 6.41
OB05012 6/09/2005 OB20 RN022934 249.5 6.48
OB07010 13/09/2007 OB20 RN022934 295.1 6.63
OB08004 4/09/2008 OB20 RN022934 267.5 6.86
OB09008 18/09/2009 OB20 RN022934 285.1 6.84
RM10042 30/09/2010 OB20 RN022934 276.3 6.65
OB11014 22/09/2011 OB20 RN022934 297.7 6.66
OB12014 19/09/2012 OB20 RN022934 291.3 6.67
218
Bore OB21A eriss_ID Date Site_ID RN number EC pH
OB03012 16/09/2003 OB21A RN022935 282 7.01
OB04003 14/09/2004 OB21A RN022935 358.4 7.42
OB05013 7/09/2005 OB21A RN022935 357.8 6.92
OB06003 13/09/2006 OB21A RN022935 376.9 7.05
OB07008 12/09/2007 OB21A RN022935 401.3 7.54
OB08003 3/09/2008 OB21A RN022935 382.9 7.48
OB09006 16/09/2009 OB21A RN022935 387.1 7.58
RM10039 28/09/2010 OB21A RN022935 363.8 7.24
OB11009 21/09/2011 OB21A RN022935 387.5 7.17
OB12011 19/09/2012 OB21A RN022935 360 7.42
Bore OB30 eriss_ID Date Site_ID RN number EC pH
OB0108 25/05/2001 OB30 RN022941 398 7.76
OB02001 27/05/2002 OB30 RN022941 409 8.4
OB03005 21/05/2003 OB30 RN022941 391.6 7.72
OB03013 19/09/2003 OB30 RN022941 429 7.33
OB04007 22/09/2004 OB30 RN022941 478.2 6.99
OB05016 7/09/2005 OB30 RN022941 440 7.5
OB06007 15/09/2006 OB30 RN022941 531 7.38
OB07009 12/09/2007 OB30 RN022941 571 7.76
OB08002 2/09/2008 OB30 RN022941 523 7.49
OB09002 15/09/2009 OB30 RN022941 540 7.6
RM10040 29/09/2010 OB30 RN022941 524 7.43
OB11011 21/09/2011 OB30 RN022941 529 7.34
OB12013 19/09/2012 OB30 RN022941 521 7.49
Bore OB27 eriss_ID Date Site_ID RN number EC pH
OB03010 18/09/2003 OB27 RN022930 277 6.59
OB04006 17/09/2004 OB27 RN022930 363.3 6.53
OB05015 6/09/2005 OB27 RN022930 270 6.59
OB06006 11/09/2006 OB27 RN022930 322.9 6.45
OB07004 11/09/2007 OB27 RN022930 175.5 6.56
OB09003 15/09/2009 OB27 RN022930 215.4 6.16
RM10036 27/09/2010 OB27 RN022930 167.8 5.75
OB11012 22/09/2011 OB27 RN022930 241.9 6.38
OB12010 18/09/2012 OB27 RN022930 175.3 6.25
Bore 83_1 eriss_ID Date Site_ID RN number EC pH
OB03008 17/09/2003 83_1 RN023010 120.8 6.76
OB04008 20/09/2003 83_1 RN023010 139.7 6.89
OB05017 7/09/2005 83_1 RN023010 123.4 6.37
RM10037 28/09/2010 83_1 RN023010 130.8 7.03
OB11002 19/09/2011 83_1 RN023010 110.3 6.77
OB11004 19/09/2011 83_1 RN023010 110.3 6.77
OB06008 12/09/2006 83_1 RN023010 126.8 6.78
OB07006 11/09/2007 83_1 RN023010 122.8 7.31
OB08001 2/09/2008 83_1 RN023010 116.7 6.9
OB09004 15/09/2009 83_1 RN023010 130.4 7.11
OB12009 17/09/2012 83_1 RN023010 123.6 6.71
219
Bore RN23551 eriss_ID Date Site_ID RN number EC pH