52
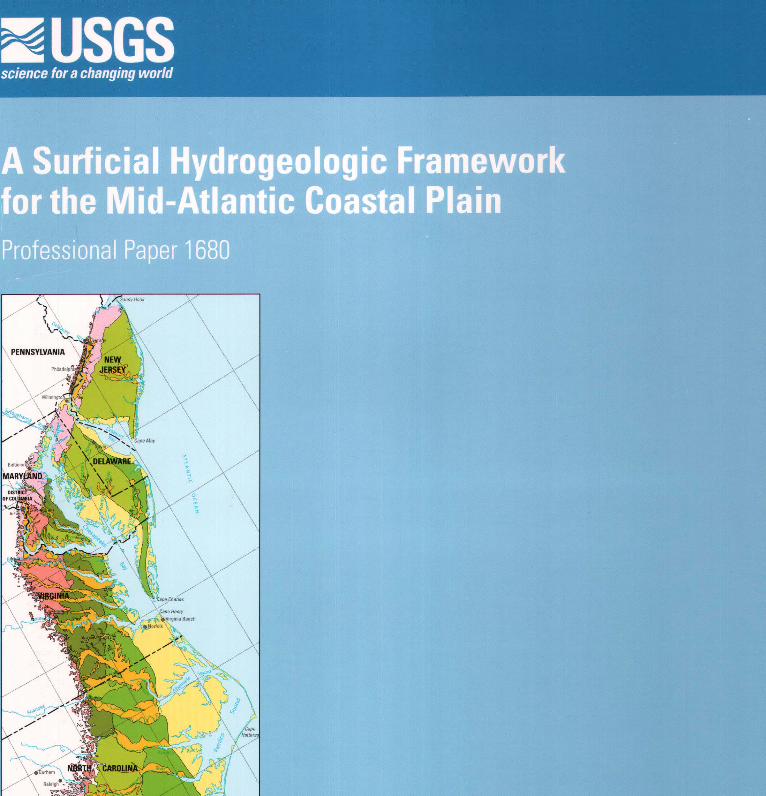


A Surficial Hydrogeologic Framework for the Mid-Atlantic Coastal Plain
By Scott W. Ator, Judith M. Denver, David E. Krantz, Wayne L. Newell, and Sarah K. Martucci
Professional Paper 1680
U.S. DEPARTMENT OF THE INTERIOR
GALE A. NORTON, Secretary
U.S. GEOLOGICAL SURVEY P. Patrick Leahy, Acting Director
Any use of trade. product, or firm names in this report is for identification purposes only and does not constitute endorsement by the U.S. Government.
Reston, Virginia 2005
Library of Congress Cataloging-in-Publications Data
A surficial hydrogeologic framework for the Mid-Atlantic coastal plain I by Scott W. Ator ... [et al.]. p. em.- (Professional paper; 1680)
Includes bibliographic references. ISBN 0-607-95745-1 1. Hydrogeology-Middle Atlantic States (U.S.) 2. Hydrogeology-Atlantic Coast (U.S.)
I. Ator, Scott W. II. U.S. Geological Survey professional paper; 1680.
GB1016.6S87 2005 551.49'0975-dc22
For sale by U.S. Geological Survey, Branch of Information Services Box 25286, Federal Center Denver, CO 80225
2005047878

Foreword
The U.S. Geological Survey (USGS) is committed to serve the Nation with accurate and timely scientific information that helps enhance and protect the overall quality of life. and facilitates effective management of water, biologicaL energy, and mineral resources. Information on the quality of the Nation's water resources is of critical interest to the USGS because it is so integrally linked to the long-term availability of water that is clean and safe for drinking and recreation and that is suitable for industry. irrigation, and habitat for fish and wildlife. Escalating population growth and increasing demands for the multiple water uses make water availability. now measured in terms of quantity and quality, even more critical to the long-term sustainability of our communities and ecosystems.
The USGS implemented the National Water-Quality Assessment (NAWQA) Program to support nationaL regionaL and local information needs and decisions related to water-quality management and policy. Shaped by and coordinated with ongoing efforts of other FederaL State, and local agencies, the NA WQA Program is designed to answer: What is the condition of our Nation's streams and ground water? How are the conditions changing over time? How do natural features and human activities affect the quality of streams and ground water. and where are those effects most pronounced? By combining information on water chemistry, physical characteristics. stream habitat, and aquatic life. the NAWQA Program aims to provide science-based insights for current and emerging water issues. NA WQA results can contribute to informed decisions that result in practical and effective water-resource management and strategies that protect and restore water quality.
Since 1991. the NA WQA Program has implemented interdisciplinary assessments in more than 50 of the Nation's most important river basins and aquifers. referred to as Study Units. Collectively, these Study Units account for more than 60 percent of the overall water use and population served by public water supply, and are representative of the Nation's major hydrologic landscapes, priority ecological resources. and agricultural, urban, and natural sources of contamination.
Each assessment is guided by a nationally consistent study design and methods of sampling and analysis. The assessments thereby build local knowledge about water-quality issues and trends in a particular stream or aquifer while providing an understanding of how and why water quality varies regionally and nationally. The consistent. multi-scale approach helps to determine if certain types of water-quality issues are isolated or pervasive, and allows direct comparisons of how human activities and natural processes affect water quality and ecological health in the Nation's diverse geographic and environmental settings. Comprehensive assessments on pesticides, nutrients, volatile organic compounds. trace metals, and aquatic ecology are developed at the national scale through comparative analysis of the Study-Unit findings.
The USGS places high value on the communication and dissemination of credible. timely. and relevant science so that the most recent and available knowledge about water resources can be applied in management and policy decisions. We hope this NAWQA publication will provide you the needed insights and information to meet your needs, and thereby foster increased awareness and involvement in the protection and restoration of our Nation's waters.
The NA WQA Program recognizes that a national assessment by a single program cannot address all water-resource issues of interest. External coordination at all levels is critical for a fully integrated understanding of watersheds and for cost-effective management, regulation, and conservation of our Nation's water resources. The Program, therefore, depends extensively on the advice. cooperation, and information from other FederaL State. interstate. TribaL and local agencies, non-government organizations, industry. academia, and other stakeholder groups. The assistance and suggestions of all are greatly appreciated.
Robert M. Hirsch
Associate Director for Water


CONTENTS
Foreword ................................................................................................................................................................................ III Abstract.................................................................................................................................................................................. 1 Introduction . . . . . . . . . . . . . . . . . . . . . . . . . . . . . . . . . . . . . . . . . . . . . . . . . . . . . . . . . . . . . . . . . . . . . . . . . . . . . . . . . . . . . . . . . . . . . . . . . . . . . . . . . . . . . . . . . . . . . . . . . . . . . . . . . . . . . . . . . . . . . . . . . . . . . . . . . . . . . . . . . . . . . . . . . . . 2
Purpose of a hydrogeologic framework....................................................................................................................... 2 Limitations of previous data for regional investigations .. .. .. .. .. .... .. .. .. .. .. .. .. .. .. .. .. .... .. .. .. .. .... .. .. .. .... .. .. .. .. .... .. .. .. .... .. .. .. .. . 4 The Mid-Atlantic Coastal Plain................................................................................................................................... 5 Acknowledgements ...................................................................................................................................................... 6
Development of the regional surficial hydrogeologic framework .. .. .. .......... ............ ............ ............ ............ ........ ........ ...... ... 7 Delineation of regional physiography ............ ......... ..... ...... . . . . .......... ....... ..... . ............ ............ ... ..... . ............. ....... .... . .... 7 Delineation of regional geology ... . . ............ ............ ....... .... . . . ............ ....... ... . . . .......... .............. ......... ............. ....... .... . .... 8 Delineation of hydrogeologic subregions .................................................................................................................... 10
The regional surficial hydrogeologic framework ................................................................................................................... lO Subregion 1: Coastal Lowlands ................................................................................................................................... 10 Subregion 2: Middle Coastal Plain- Mixed Sediment Texture .................................................................................. 13 Subregion 3: Middle Coastal Plain - Fine Sediments ................................................................................................. 13 Subregion 4: Middle Coastal Plain- Sands with Overlying Gravels .......................................................................... 14 Subregion 5: Inner Coastal Plain- Upland Sands and Gravels ................................................................................... 16 Subregion 6: Inner Coastal Plain- Dissected Outcrop Belt.. ...................................................................................... 17 Subregion 7: Alluvial and Estuarine Valleys ............................................................................................................... 19
Evaluation of the regional framework at the local scale ........................................................................................................ 19 Subregion 1: Coastal Lowlands ................................................................................................................................... 22 Subregion 2: Middle Coastal Plain- Mixed Sediment Texture .................................................................................. 23 Subregion 3: Middle Coastal Plain- Fine Sediments ................................................................................................. 23 Subregion 4: Middle Coastal Plain- Sands with Overlying Gravels .......................................................................... 24 Subregion 5: Inner Coastal Plain- Upland Sands and Gravels ................................................................................... 25 Subregion 6: Inner Coastal Plain - Dissected Outcrop Belt.. ...................................................................................... 26 Subregion 7: Alluvial and Estuarine Valleys ............................................................................................................... 26
Framework application .......................................................................................................................................................... 27 Intended uses ............................................................................................................................................................... 27 Limitations ................................................................................................................................................................... 27
Summary ................................................................................................................................................................................ 28 References., ............................................................................................................................................................................. 29 Appendix 1: Technical notes ................................................................................................................................................. 36
by Sarah K. Martucci
Geology coverages ....................................................................................................................................................... 36 Physiography coverage ................................................................................................................................................ 36 Hydrogeologic framework coverage ............................................................................................................................ 36 Reference ..................................................................................................................................................................... 36
Appendix 2: Geologic setting of the Mid-Atlantic Coastal Plain .......................................................................................... 38 by David E. Krant:::
Physiography ............................................................................................................................................................... 38 Structure ....................................................................................................................................................................... 39 Geologic history .......................................................................................................................................................... 40 The Piedmont - Coastal Plain transition (The Fall Zone) .......................................................................................... .42 Weathering of surficial units ........................................................................................................................................ 42 References ................................................................................................................................................................... 42
Contents V

PLATES (in pocket at end of report)
Plates 1--4. Maps showing: 1. Physiography of the Mid-Atlantic Coastal Plain 2. Surficial and subcropping geology of the Mid-Atlantic Coastal Plain 3. Predominant texture of surficial geologic units in the Mid-Atlantic Coastal Plain 4. Hydrogeologic subregions of the Mid-Atlantic Coastal Plain
FIGURES
I. Map showing the Mid-Atlantic Coastal Plain ..................................................................................................................... 3 2. Generalized geologic section through eastern Virginia showing the eastward-thickening sedimentary wedge
typical of the Mid-Atlantic Coastal Plain ................................................................................................................. 6 Figures 3-8. Generalized hydrogeologic section showing idealized flow through:
3. Subregion 1, the Coastal Lowlands, on the Delmarva Peninsula in Virginia .......................................................... 12 4. Subregion 3, the Middle Coastal Plain- Fine Sediments, along the James River in southern Virginia ................. 14 5. Subregion 4, the Middle Coastal Plain- Sands with Overlying Gravels, on the Delmarva Peninsula ................... 15 6. Subregion 5, the Inner Coastal Plain- Upland Sands and Gravels, in southern Maryland .................................... 16 7. Subregion 6, the Inner Coastal Plain- Dissected Outcrop Belt, in southern Maryland and northern Virginia ...... 18 8. Subregion 7, the Alluvial and Estuarine Valleys, near Washington, D.C ................................................................ 20
9. Map showing the location of selected local-scale studies within the Mid-Atlantic Coastal Plain .................................... 21
TABLES
1. Comparison of physiographic subprovinces developed for New Jersey to those in the remainder of the Mid-Atlantic Coastal Plain north of the Potomac River ..................................................................................... 8
2. Hydrogeologic subregions within the Mid-Atlantic Coastal Plain ................................................................................... 11
CONVERSION FACTORS AND ABBREVIATIONS
Multiply
meter (m)
kilometer (km)
square kilometer (km2 )
centimeter per year (em/year)
By
3.281
0.621
0.368
0.3937
To obtain
foot
mile
square mile
inch per year
Sea level: In this report, ''sea level" refers to the National Geodetic Vertical Datum of 1929-a geodetic datum d:-rived from a general adjustment of the first-order level nets of the United States and Canada, formerly called Sea Level Datum of 1929.
VI Contents

A Surficial Hydrogeologic Framework for the Mid-Atlantic Coastal Plain
by Scott W. Ator, Judith M. Denver, David E. Krantz, Wayne L. Newell, and Sarah 1<. Martucci
ABSTRACT
A surficial hydrogeologic framework was developed for the Mid-Atlantic Coastal Plain, from New Jersey through North Carolina. The framework includes seven distinct hydrogeologic subregions within which the primary natural physical factors affecting the flow and chemistry of shallow ground water and small streams are relatively consistent. Within most subregions, the transport of chemicals from the land surface to ground water and streams can be described by a fairly uniform set of natural processes; some subregions include mixed hydrogeologic settings that are indistinguishable at the regional scale. The hydrogeologic framework and accompanying physiographic and geologic delineations are presented in digital and printed format.
The seven hydrogeologic subregions that constitute the framework were delineated prin1arily on the basis of physiography and the predominant texture (typical grain size) of surficial and (where surficial sediments are particularly thin) subcropping sediments. Physiography for the Mid-Atlantic Coastal Plain was constructed by standardizing and extrapolating previously published interpretations for the Coastal Plain of South Carolina and New Jersey, based on sin1ilar work in the other States. Surficial and subcropping geology were similarly compiled from previous publications by resolving inconsistencies in nomenclature, interpretation, and scale, and interpolating across unmapped areas. A bulk sediment
texture was determined for each mapped geologic unit on the basis of published descriptions.
Fundamental differences among the seven hydrogeologic subregions are described on the basis of hypotheses about surficial and shallow subsurface hydrology and water chemistry in each, as well as variable land use, soils, and topography. On the regional scale, the Coastal Lowlands (Subregion 1), the Middle Coastal Plain- Fine Sediments (Subregion 3 ), the Middle Coastal Plain -Sands with Overlying Gravels (Subregion 4 ), and the Inner Coastal Plain- Upland Sands anc1 Gravels (Subregion 5) are relatively homogeneo•1s in terms of hydrogeology, although an examiration of results from small-scale studies within tl'~ Coastal Plain demonstrates that even these areas are quite variable, locally. Moderate topographic relief and primarily permeable surficial sediments promote good drainage of the land surface in Subregion 4, for example, but drainage is comnonly poor in the Coastal Lowlands (Subregion 1) due to flat topography and low elevations. Agriculture is cotnmon in both subregions, although artificial drainage is typically required to support cultivation in Subregion 1. Important physiographic differences are evident among the remaining three subregions, although sediment textures witl'in the Middle Coastal Plain - Mixed Sediment Texture (Subregion 2), the Inner Coastal Plain- Dissected Outcrop Belt (Subregion 6), and the Alluvial and Estuarine Valleys (Subregion 7) are variable even at the regional scale.
Abst1·act
INTRODUCTION
Many features of the modem landscape are related to the underlying geology. Interrelated geologic and hydrologic processes directly or indirectly affect the spatial patterns seen in ecological communities, water quality and availability, soils, and land use. Defining and illustrating the spatial variability of hydrogeologic processes is fundamental to many environmental studies.
A regional surficial hydrogeologic framework was developed for the Mid-Atlantic Coastal Plain of New Jersey, Pennsylvania, Delaware, Maryland, Virginia, North Carolina, and the District of Columbia (fig. 1 ). Seven distinct hydrogeologic subregions with relatively consistent physical properties for the surficial aquifer or other shallow sediments were defined. Within most framework subregions, the occurrence, fate, and transport of chemicals in the shallow groundwater system and stream base flow can be described and predicted on the basis of a fairly uniform set of natural conditions. The seven subregions represent areas of similar geology (primarily unconsolidated siliciclastic sediments) along a continuum of sediment textures (grain sizes) and physiography. The framework is designed to help explain spatial variability in regional water quality and provide a template for synthesizing water-quality data. The hydrogeologic framework could also be useful for explaining the spatial distribution of other landscape variables or in the design of regional environmental studies. Combined with other spatial data (such as soils or topography), the framework illustrates the basic physical setting in the MidAtlantic Coastal Plain.
The framework represents a summary of the variable hydrogeology in the Mid-Atlantic Coastal Plain on a regional scale; generalized descriptions of the environmental setting of different subregions become less applicable for progressively smaller areas. This limitation is a result of the generalizations, interpolations, and similar approaches used in the subregion delineations, as well as real variability in physiography and geology in the Coastal Plain. A review of results and data from local investigations within the study area can be useful for defining and describing this heterogeneity.
The surficial hydrogeologic framework presented and discussed in this report was developed primarily from physiographic, stratigraphic, and
sediment -texture data compiled in a digital format. These data are also presented. The hydrozeologic framework, with the physiographic and g~ologic coverages, is intended to extend hydrogeologic understanding from recent mapping and other hvestigations in a consistent manner over a multi-state region.
The purpose, development, intended uses, and limitations of the hydrogeologic framework are described in this report. Hypotheses about surficial and shallow subsurface hydrology and water chemistry are described and contrasted among the seve'l hydrogeologic subregions defined by the framework. Other spatial landscape variables (such as soils and land use) are used to illustrate and explain differences among and within the Coastal Plain subregions defin~d in the framework. Hypotheses that relate the physical properties of the framework subregions to water quality are compared with results from local investigations to demonstrate the applicability and limitations of the framework at different spatial scales. Nutrient data were used in many of these evaluations b~cause they are widely available and are sensitive to oxic or reducing conditions and therefore a more general indicator of geochemistry. Technical notes about tl'~ available digital versions of the framework, physiography, and geology are included in Appendix 1. A discussion of the regional physiography and geology 0'1 which the framework is based is presented in Appendix 2.
Purpose of a Hydrogeologic Framewr ... k
A regionally consistent hydrogeologic framework describes key components of the physical setting for environmental studies. The texture anrl chemical composition of surficial and near-surface geologic materials affect the moven1ent of water, '"hich in tum affects the formation of soils and topographic features, land-use patterns, and the structure of ecological communities. Soils are related to the physical and chemical properties of the sediments or rocks frorr which they formed and the drainage characteristics of the area. The size and shape of valleys and upland~ are controlled by geology and the movement of water, which is the primary erosive agent in humid ten1perate areas such as the eastern United States. The spatial distribution of geologic and water resources also helps determine patterns of land use by humans and other organisms. In the Mid-Atlantic Coastal Plain, for example, broad, flat, well-drained areas ere typically
2 A Surficial Hydrogeologic Framework for the Mid-Atlantic Coastal Plain

PHYSIOGRAPHIC PROVINCES
25°~~~====~==--_j Base modified from U.S. Geological Survey, National Atlas of the United States, 1970, 1:7,500,000, Albers equal-area projection
Modified from Feneman, 1938; Feneman and Johnson, 1946
Figure 1. The Mid-Atlantic Coastal Plain.
Base map from U.S. Geological Survey 0 digital data; 1:100,000; Lambert conic I conformal projection; North American I Datum of 1983 25
25 50 I I
I I 50 75
I
75 I
"0 100 MILES"' I
100 KILOMETERS
Introduction 3
used for agriculture; more poorly drained lowlands commonly remain forested wetlands, unless ditched or otherwise artificially drained for cultivation.
The physical properties of near-surface geologic materials are particularly important in water-quality studies because they directly affect the flow and quality of streams and ground water. The permeability of surficial deposits affects ground-water recharge and the formation of stream-drainage networks. Dense stream networks tend to form in areas where impermeable deposits limit infiltration and surface runoff is generated during precipitation. This runoff may enhance soil erosion and the transport of surficial contaminants such as fertilizers, pesticides, and volatile organic compounds (VOCs) directly to streams, estuaries, and the ocean. In contrast, stream networks are typically more dispersed in areas of thick permeable surficial sediments, and a greater percentage of precipitation percolates through the unsaturated zone to recharge the water table. Because water is an effective solvent, natural water quality is related to the chemical composition of the rocks and sediments through which it flows (Freeze and Cherry, 1979; Hem, 1985). Ground-water chemistry is also largely determined by the length of ground-water flowpaths and the extent to which overlying strata allow for contact with oxygen in the atmosphere. For example, nitrate is stable and may travel long distances in well-oxygenated ground water (Freeze and Cherry, 1979), but may be lost to denitrification where impermeable overlying deposits (confining layers) produce reducing conditions in the aquifer.
The surficial hydrogeologic framework for the Mid-Atlantic Coastal Plain was developed as a tool for understanding regional water quality and directing future regional water-quality assessments. As part of the National Water-Quality Assessment (NAWQA) program (Gilliom and others, 1995), the U.S. Geological Survey (USGS) has been collecting water-quality data in different areas of the Coastal Plain since the late 1980s. Data from these and other studies are periodically compiled and analyzed for regional or national assessments of water quality and to direct future NAWQA sampling efforts. The hydrogeologic framework provides a template for analyzing existing waterquality data and for planning environmental sampling in the Mid-Atlantic Coastal Plain. The hydrogeologic variability described by the framework can be compared to previous data or results from NAWQA and other regional programs to identify any significant gaps
in the current understanding of Coastal Plain water quality and to help guide future sampling in the region.
Limitations of Previous Data for Regional Investigations
Previously available spatial geologic and hydrologic data for the Mid-Atlantic region often were of limited use for regional water-quality studies due to insufficient detail, incomplete coverage, or inconsistencies among sources. In regional or national classifications, the Coastal Plain is sometimes considered to be generally homogeneous compared to other geologic regions or physiographic provinces (Ator and Ferrari, 1997). This characterization is due in part to the lack of a regionally consistent database of geologic and hydrologic properties for the Coastal Plain. Regional spatial data sets typically lack the resolution necessary for indepth analyses and can be used only to relate water quality to broadly defined rock types. For example, digital geologic data are available for the entire United States at a scale of 1 :2,500,000 (King and Beikman, 1974; Schruben and others, 1994). At this scale, locally heterogeneous areas like the Coastal Plain are necessarily combined into a few comprehensive mapping units. An analysis of ground-water quality in the Mid-Atlantic region using this approach showed nitrate concentrations were particularly variable in the Coastal Plain (Ator and Ferrari, 1997).
Regions of similar surficial hydrogeologic properties have been previously delineated for selected parts of the Mid-Atlantic Coastal Plain. Available local geologic mapping at the level of individual formations is commonly used in these studies, although scales, methods, and nomenclature may vary among the different maps that are usually required to cover relatively large areas. "Hydrogeomorphic regions" have been defined for the Delmarva Peninsula on the basis of surficial geology, geomorphology, soils, and physiography to help explain spatial variability in shallow groundwater quality (Hamilton and others, 1989). A similar approach has been used to evaluate base-flow nitrate concentrations in non-tidal streams of the entire Chesapeake Bay Watershed; 11 distinct regions were delineated for this study, including three within the Coastal Plain (Bachman and others, 1998). Similar hydrogeologic areas within the Coastal Plain of Virginia have been delineated on the basis of geology and soil drainage, the two most significant variables in an empirical
4 A Surficial Hydrogeologic Framework for the Mid-Atlantic Coastal Plain

model constructed to predict ground-water discharge (Richardson, 1994 ). Geologic data from multiple publications have been compiled to support water-quality investigations within the Potomac River Basin (Gerhart and Brakebill, 1996) and the Albemarle-Pamlico Drainages (McMahon and Lloyd, 1995).
Previous conceptual frameworks of the hydrogeology of the entire Mid-Atlantic Coastal Plain have focused mainly on the confined aquifer system. In studies of the entire aquifer system, Coastal Plain surficial deposits (commonly including post-Miocene sediments) are often combined into comprehensive "surficial" aquifers (Brown and others, i972; Trapp, 1992). This convention is useful when considering the entire extent and depth of Coastal Plain aquifers, but often excludes important textural and geochemical variability among surficial deposits.
The Mid-Atlantic Coastal Plain
The Coastal Plain Physiographic Province is a broad, relatively low relief terrace along the Atlantic Ocean and Gulf of Mexico margins of the United States (Fenneman, 1938; Fenneman and Johnson, 1946) (Appendix 2, this report). The Mid-Atlantic Coastal Plain includes areas of the Coastal Plain Physiographic Province in New Jersey, Pennsylvania, Delaware, Maryland, Virginia, North Carolina, and the District of Columbia (fig. 1). The 114,000-km2 (square kilometer) area is bordered by the Fall Zone to the west and the Atlantic Ocean to the east, and ranges in width from about 24 km (kilometers) in northern New Jersey to 240 km in central North Carolina. The Mid-Atlantic Coastal Plain is gently inclined from altitudes of 80 to 100 m (meters) at the Fall Zone down to sea level, and the land surface varies from nearly fiat to deeply incised, with as much as 100 m of local relief. Most areas are less than 55 m above sea level. The maximum altitude for the Coastal Plain in the Mid-Atlantic Region exceeds 175m along the Fall Zone in southcentral North Carolina. The Coastal Plain is cut by the valleys of major rivers and their tributaries that are currently flooded as estuaries, such as Chesapeake Bay, Delaware Bay, and Albemarle Sound. Slopes are typically steepest near the Fall Zone and along incised valleys of major streams (Verdin, 1997).
The climate on the Mid-Atlantic Coastal Plain is humid and temperate to subtropical. Annual precipitation varies spatially, but is estimated at 120 em/year
(centimeters per year) for the entire study area. Most of this precipitation (about 51 percent) evaporates or is transpired by plants; the remainder recharges ground water or runs off directly to streams, depending on the permeability and saturation of the land surface (Leahy and Martin, 1993).
The Coastal Plain is underlain by a heterogeneous wedge of unconsolidated and semi-consolidated sediments that overlies a crystalline basement that dips steeply toward the Atlantic Ocean (fig. 2, Appendix 2). Most of the sediments are siliciclastic, and are derived from the erosion of the hard rocks of the Piedmont and the Blue Ridge and Appalachian Mountains; however, a band of Eocene and Oligocene carbonate rocks (limestone) crops out in south-central North Carolina. In the Mid-Atlantic Region of the United States, the wedge of Coastal Plain sediments thickens from a few meters at the Fall Zone to more than 3,000 m beneath Cape Hatteras, North Carolina (Owens and Gohn, 1985; Gohn, 1988; Winner and Coble, 1996). Depositional environments range from fluvial to marine, resulting from the many marine transgressions and regressions across the Coastal Plain since the Cretaceous Period (Appendix 2). Surficial units are nearly fiat-lying in most areas, and are generally Miocene or younger in age.
Coastal Plain geologic units form a vertical series of alternating aquifers and leaky confining units. Unconsolidated units contain various amounts of gravel, sand, silt, and clay, depending on their depositional environments (Trapp, 1992). Although most units yield at least some usable water, permeable gravel and sand deposits and carbonate rocks are generally the most productive aquifers. Most ground water is recharged to an unconfined surficial aquifer and discharges to a nearby surface-water body. A small percentage (approximately 3 percent) of ground water from the surficial aquifer recharges confined aquifers and follows long regional fiowpaths with accordingly long travel times to discharge to larger rivers, estuaries, or the ocean (Leahy and Martin, 1993). Ground water that is not withdrawn for consumption will ultimately discharge to streams as base flow or to other surfacewater bodies. Base flow accounts for about 40 to 95 percent of streamflow in the Mid-Atlantic Coastal Plain (Sinnott and Cushing, 1978; Leahy and Martin, 1993).
In general, the surficial aquifer in the Mid-Atlantic Coastal Plain includes the upper approximately 30 m of the Coastal Plain sedimentary sequence; however, this thickness varies considerably depending upon the
Introduction 5

WEST EAST
METERS ::... METERS "' 300
CQ 300 Q)
<::: ~
Quaternary sedime
Sea level Sea level
-l L1J
> L1J -l
<( -300 - 300 L1J (I)
5: 0 -l L1J co a:
-600 -600 0 L1J > 0 co <( (I) a: L1J -900 - 900 I-L1J
:2 ~ w' 0 :::> -1,200 -1,200 I-
5 <(
-1,500 - 1,500
-1,800 -1,800
- 2,100 Vertical scale greatly exaggerated
- 2,100
Figure 2. Generalized geologic section through eastern Virginia showing the eastward-thickening sedimentary wedge typical of the Mid-Atlantic Coastal Plain (modified from Meng and Harsh, 1988).
thickness, bedding, and lithology of the sediments (Trapp, 1992). For example, on the Delmarva Peninsula near the Delaware-Maryland border, a thick sequence of lagoonal silt-clay is an effective confining unit within a few meters of the land surface (Shedlock and others, 1999). In contrast, in southern New Jersey, the combined sands of the Kirkwood and Cohansey Formations overlain by the coarse gravelly sands of the Bridgeton Formation (Newell and others, 1995, 2000; Owens and others, 1999) creates a hydraulically connected surficial aquifer that approaches 150 m in thickness (Zapecza, 1989).
Acknowledgments
The hydrogeologic framework was developed through a joint effort of the NAWQA program and the Geologic Discipline of the USGS. Thoughtful comments on the framework and/or the manuscript for this paper were provided by Harry Hansen of the Mary land Geological Survey; Kelvin Ramsey of the Delaware Geological Survey; and Marian Berndt, William Cunningham, George Harlow, Andrew LaMotte, David Powars, Seymour Subitzky, Kelly Warner, and Otto Zapecza of the USGS.
6 A Surficial Hydrogeologic Framework for the Mid-Atlantic Coastal Plain
DEVELOPMENT OF THE REGIONAL SURFICIAL HYDROGEOLOGIC FRAMEWORK
The Mid-Atlantic Coastal Plain is subdivided into seven hydrogeologic subregions, primarily on the basis of physiography and the predominant texture of near-surface sediments. These are primary natural physical factors that affect the flow and quality of ground water in the surficial aquifer and the base flow of small streams. Physiography and sediment texture are related to the overall geologic history and setting in the Coastal Plain, which are summarized in Appendix 2. The initial step in creating the framework was to compile physiographic and geologic data from published and unpublished sources. This step was facilitated by the various geologic mapping and similar investigations that have occurred in the region in recent decades (see below). Relatively contiguous hydrogeologic regions were delineated on the basis of the combination of physiography and surficial sediment texture (Appendix 1).
Delineation of Regional Physiography
Physiography for the Mid-Atlantic Coastal Plain (plate 1) was constructed by standardizing and extrapolating previous physiographic interpretations for areas within and adjacent to the region. Prominent regional scarps and similar topographic features define the three major divisions (Inner, Middle, and Outer Coastal Plain) and the Alluvial and Estuarine Valleys; the further delineations of subprovinces within these divisions are defined by more subtle topographic or geomorphic differences. Physiography for North Carolina and Virginia was largely extrapolated from earlier work in South Carolina. Physiographic subprovinces in Maryland and Delaware were delineated by extrapolation from earlier work in New Jersey. Delineation of regional physiography was guided by the work of Colquhoun and others ( 1991 ), who produced a comprehensive regional view of physiography in their map of the Quaternary history of the Atlantic Coastal Plain from New Jersey through Georgia.
The physiography of the Virginia and North Carolina Coastal Plain was based largely on the physiography developed by Colquhoun ( 1969, 197 4) for the Coastal Plain of South Carolina. The broad platform of the Coastal Plain can be divided into three physiographic subprovinces with similar land-surface characteristics (Appendix 2). Colquhoun (1969, 1974)
defined the Upper, Middle, and Lower Coastal Plain in South Carolina; these designations were extended northward to the Potomac River as the Inner, Middle, and Outer Coastal Plain (respectively) with the aid of various local studies (Oaks and Coch, 1973; DuBar and others, 1974; Daniels and Gamble, 1974; Johnson and Peebles, 1986; Cleaves and others, 1987; Mixon and others, 1989; Owens, 1989). A fourth physiographic subprovince includes the alluvial and estuarine valleys of the major rivers that cut across the Coastal Plain, which were delineated largely on the basis of topography. The Inner Coastal Plain was further subdivided into the Inner Coastal Plain - Dissected Outcrop Belt, the outcrop area of the deeply weathered, oldest Coastal Plain sediments, and the Inner Coastal Plain -Upland Sands and Gravels, including the discontinuous coarse fluvial sediments that cap hilltops along the inner margin of the Coastal Plain.
The Suffolk Scarp (plate 1, Appendix 2) marks the landward extent of the Outer Coastal Plain in this interpretation. Spruill and others (1998) applied this physiographic division to North Carolina and southern Virginia. This boundary coincides with a major hydrologic difference on either side of the scarp; the hydrologic change across the Surry Scarp (Colquoun and others, 1991) is generally less pronounced. In the Outer Coastal Plain east of the Suffolk Scarp, the land surface is exceptionally fiat (Verdin, 1997) and poorly drained, and the creeks are almost entirely tidal. Because of the low slope of the land surface, the water table is generally close to the land surface and has a very low gradient. This area contains abundant depressional wetlands (pocosins and Carolina Bays) that are wet seasonally or perennially, whereas in the Middle Coastal Plain (west of the Suffolk Scarp), many of these depressions have been drained by headward cutting of streams. In addition, the stream drainage network in the Outer Coastal Plain is poorly developed because the land surface is generally younger than approximately 120,000 years (Wehmiller and others, 1988). In contrast, the land surface of the Middle Coastal Plain is 200,000 to approximately 3 million years old, and the stream drainage network has been entrenched and extended during numerous glacial low stands of sea level (Mixon and others, 1989).
The physiographic classification of the Coastal Plain by Colquhoun (1969, 1974) is not easily applicable north of the Potomac River (Appendix 2). Much of the Coastal Plain in Mary land, the northern and central
Development of the Regional Surficial Hydrogeologic Framework 7
Delmarva Peninsula, and New Jersey has been located at a higher elevation than the Coastal Plain to the south since the late Pliocene Epoch (Colquhoun and others, 1991), and deposition of Pleistocene marginal-marine units has been minimal outside of the broad valleys of Chesapeake and Delaware Bays. Consequently, much of the land surface of the northern Coastal Plain has been exposed longer than that of the Middle and Outer Coastal Plain to the south. Also, the Coastal Plain north of the Potomac River has been subjected to a different set of weathering processes, including cryoturbation and other periglacial soil processes (Newell and others, 2000).
A previous physiographic classification for New Jersey was extended southward and applied to the Coastal Plain of Delaware and Maryland. Newell and others (1995, 2000) defined five physiographic subprovinces for the New Jersey Coastal Plain: the Interior Plateau, Central Upland, Southern Upland, Interior Lowlands, and Coastal Lowlands. These subprovinces were modified slightly or renamed for consistency with the remainder of the study area (table 1; plate 1). The Interior Plateau of New Jersey is equivalent to the Inner Coastal Plain - Dissected Outcrop Belt in this interpretation; this subprovince also includes the subcrop areas of the Lower Cretaceous units in Delaware, Maryland, northern Virginia, and southern North Carolina. The Southern Uplands in New Jersey are equivalent to the Inner Coastal Plain- Upland Sands and Gravels, including the areas of Central Delmarva and southern
Maryland covered by similar coarse, upland deposits. The Coastal Lowlands (New Jersey) are equivalent to the Outer Coastal Plain in this physiographic interpretation, with the exception of an upper terrace, which is included in the Middle Coastal Plain. Within the Middle Coastal Plain, the Central Upland of New Jersey (Newell and others, 1995, 2000) and a similar area of southern Maryland between the Patuxent River and Chesapeake Bay were further delineated as the Middle Coastal Plain- Dissected Uplands. These areas are more incised than the remainder of the Middle Coastal Plain (hereafter referred to as the Middle Coastal Plain - Terraces) (McCartan, 1990; McCartan and others, 1995; Newell and others, 1995, 2000), although extremely permeable sands underlie the area in New Jersey (Zapecza, 1989), while the area in Maryland contains relatively impermeable silts (Glaser, 1976).
Delineation of Regional Geology
Surficial and subcropping geology for the MidAtlantic Coastal Plain (plate 2) were compiled and interpreted from available published (Maryland Geological Survey, 1933; Owens, 1967; Cleaves and others, 1968; Owens and Denny, 1978; Owens and Denny, 1979; Mixon, 1985; North Carolina Geological Survey, 1985; Owens and Denny, 1986; Mixon and others, 1989; Ramsey and Schenck, 1990; Oertel and Foyle, 1995; New Jersey Department of Environmental Protection, 1996; Winner and Coble, 1996) and unpub-
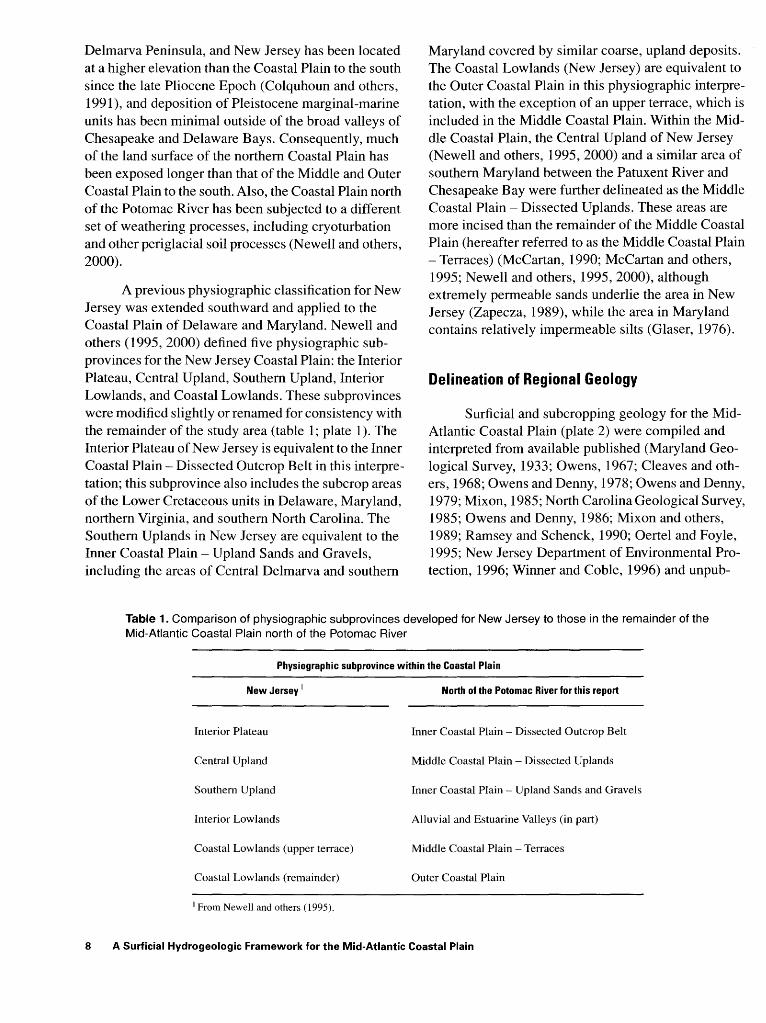
Table 1. Comparison of physiographic subprovinces developed for New Jersey to those in the remainder of the Mid-Atlantic Coastal Plain north of the Potomac River
Physiographic subprovince within the Coastal Plain
New Jersey 1 North of the Potomac River for this report
Interior Plateau Inner Coastal Plain- Dissected Outcrop Belt
Central Upland Middle Coastal Plain- Dissected Uplands
Southern Upland Inner Coastal Plain -Upland Sands and Gravels
Interior Lowlands Alluvial and Estuarine Valleys (in part)
Coastal Lowlands (upper terrace) Middle Coastal Plain - Terraces
Coastal Lowlands (remainder) Outer Coastal Plain
1 From Newell and others (1995).
8 A Surficial Hydrogeologic Framework for the Mid-Atlantic Coastal Plain

lished sources. Surficial geology was extracted from mapping for a wider area of the Atlantic Coastal Plain, from Long Island, New York through Georgia (W.L. Newell, U.S. Geological Survey, co-author of this paper). Formation contacts were interpolated across unmapped areas and inconsistencies in nomenclature, interpretation, and scale were resolved to the extent possible. The greatest available detail from each original map was typically preserved when resolving differences among sources, regardless of the detail in adjacent areas. For this reason, the edges of some original sources remain obvious on plate 2. On the Delmarva Peninsula, for example, the individual units of the Chesapeake Group are delineated in Delaware (Ramsey and Schenck, 1990) but not in Maryland. The regional correlation of stratigraphic units is based largely on those of Jordan and Smith (1983) and the USGS Regional Aquifer-System Analysis Program (Meng and Harsh, 1988; Zapecza, 1989; Vroblesky and Fleck, 1991; Trapp, 1992; Winner and Coble, 1996).
Predominant sediment texture for each geologic unit (plate 3) was derived from the descriptions of the sediments in original publications (see plate 2, Appendix 2) and the stratigraphy in key locations, such as the Oak Grove corehole (Virginia Division of Mineral Resources, 1980) and the Haynesville corehole (Mixon, 1989) in Virginia. The predominant sediment texture reflects the dominant overall texture of each geologic unit at the regional scale and may not accurately reflect local conditions in all areas. Many important small-scale facies changes among and within mapped units were omitted. The Cape May Formation, for example, is primarily sandy (as shown on plates 2 and 3), although it contains an estuarine clay up to 38 m thick that serves as a local confining unit (Gill, 1962). Additionally, the boundaries between adjacent units as mapped do not necessarily represent abrupt textural changes; lateral changes in sediment texture may be gradational. The Omar Formation on the southem Delmarva Peninsula is predominantly sandy in the east, but becomes gradually more fine-grained towards the Chesapeake Bay.
Mapped geologic units are grouped largely into three textural classes: sands and gravels, mixed sediments, and silts and clays (plate 3). Sands and gravels are coarse-grained, typically very permeable deposits indicative of relatively high-energy depositional areas such as beaches, high-gradient streams, or dunes. The medium and coarse quartz sands and gravels of the
Columbia Formation1 on the Delmarva Peninsula were deposited as bedload from a braided river system (Jordan, 1964; Hansen, 1971, Groot and Jordan, 1999); fine sands of the Choptank Formation were deposited in a marine inner-shelf setting (Cleaves and others, 1968; Glaser, 1971; Vroblesky and Fleck, 1991). Finergrained, less permeable silts and clays are generally deposited in more sluggish environments such as estuaries, swamps, marshes, or the deeper continental shelf. The Bacons Castle Formation contains clayey silt and silty fine sand deposited in a shallow bay or estuary (Meng and Harsh, 1988; Ramsey, 1988; Mixon and others, 1989). Geologic units with neither coarse nor fine bulk texture are labeled as "mixed sediments." These units represent transitional environments (such as fluvial deltas) or contain lateral or vertical facies changes indistinguishable at the regional scale. The Windsor Formation contains a fining-upward sequence including sand with gravel, silt, and clay (Oaks and Coch, 1973; Mixon and others, 1989).
In addition to the three major textural classes, the geologic maps also include other lithologies that are less common to the Coastal Plain. Because of the geochemical importance of organic deposits (Drever, 1997), peat is included in the lithologic description of modem swamps and marshes. The subcrop map (plate 2) includes the only consolidated rocks in the study area. The River Bend and Castle Hayne Formations in North Carolina form an extremely productive aquifer typically comprising alternating beds of marine limestone, sandy limestone, and sand (Winner and Coble, 1996). Selected subcropping older rocks of the Piedmont Province are shown along the Fall Zone on plate 2, where they are unconformably overlain by unconsolidated Coastal Plain sediments.
The geology presented in plate 2 represents the lithostratigraphy of the Mid-Atlantic Coastal Plain, while the accompanying map of predominant sediment texture (plate 3) approximates hydrostratigraphy. Lithostratigraphic units are defined on the basis of sediment size, sorting, internal structure, age, mineralogy, boundary surfaces (such as unconformities), or other properties deemed significant by the original investigators. Conversely, hydrostratigraphic units are delin-
1 The term "Columbia Formation" is used herein for consistency with current usage of the Delaware Geological Survey (see, for example, Ramsey and Schenck, 1990, and Groot and Jordan, 1999). These and equivalent deposits are also known as the "Columbia Group" (Jordan and Smith, 1983).
Development of the Regional Surficial Hydrogeologic Framework 9

eated primarily on the basis of texture or related hydrologic properties such as permeability or hydraulic conductivity; adjacent lithostratigraphic formations with similar hydrologic properties are generally included in the same hydrostratigraphic unit. The delineation of geologic units in publications compiled for this study varied; in many areas, only lithostratigraphy or hydrostratigraphy was available. These differences were resolved as much as possible in delineating the regional geology, although some inconsistencies remain in plate 2 (such as the difference in mapping resolution among different states). These inconsistencies likely have a minimal effect on the regional hydrologic framework, which is based largely on the maps of predominant sediment texture and physiography.
Delineation of Hydrogeologic Subregions
Hydrogeologic subregions within the MidAtlantic Coastal Plain (plate 4) were defined from a combination of the physiography (plate 1) and the predominant texture of surficial geologic units (plate 3). Some of the hydrogeologic subregions correspond directly to the physiographic subprovinces; others were generalized within subprovinces based on sediment texture (table 2).
Physiographic subprovinces (plate 1) with relatively consistent surficial sediment texture were translated directly to hydrogeologic subregions, including the Outer Coastal Plain (as the Coastal Lowlands, Subregion 1) and the Alluvial and Estuarine Valleys (Subregion 7). The Inner Coastal Plain- Dissected Outcrop Belt physiographic subprovince corresponds to the hydrogeologic subregion of the same name (Subregion 6), with the addition of a part of the northern Delmarva Peninsula. The upland sands and gravels overlying the lower Tertiary and Cretaceous formations of the Inner Coastal Plain are particularly thin in this area, so the top of the subcropping Vincentown Formation (Owens, 1967) was used as the southern edge of Subregion 6 in this area. This boundary marks the southeastern (downdip) limit of near-surface (subcropping) Lower-Tertiary and Cretaceous formations on the Delmarva Peninsula (plate 2).
The remaining hydrogeologic framework subregions within the Coastal Plain were defined on the basis of predominant surficial sediment texture (plate 3). The Middle Coastal Plain was subdivided into Subregions 2, 3, and 4 with predominantly mixed, fine, and
coarse surficial sediments, respectively. The Middle Coastal Plain- Dissected Uplands in New Jersey and Maryland were included with Subregions 4 and 3, respectively, because of similar geomorphology and sediment textures. These deposits include the sandy and extremely permeable Kirkwood and Cohansey Formations in New Jersey and the silty, generally impermeable Calvert Formation in Maryland (plate 2). For similar reasons, the relatively contiguous broad uplands within the Inner Coastal Plain - Upland Sands and Gravels on the Delmarva Peninsula and in southern New Jersey were included in Subregion4, as well. The largely discontinuous upland sand and gravel deposits near the Fall Zone within the Inner Coastal Plain became Subregion 5.
THE REGIONAL SURFICIAL HYDROGEOLOGIC FRAMEWORK
The hydrogeologic framework (plate 4) represents a summary of the surficial and near-surface hydrogeology of the Mid-Atlantic Coastal Plain on a regional scale. The seven hydrogeologic subregions are described in terms of variable physiography (plate 1) and geology (plates 2 and 3 ), the two variables used to define the framework. Soils (Schwarz and Alexander, 1995), topography (Verdin, 1997), land use (from the early 1990s; Vogelmann and others, 1998), and hypotheses about the hydrology and chemistry of small streams and shallow ground water (table 2) are also compared and contrasted among hydrogeologic subregions; these environmental conditions are related to the underlying hydrogeologic setting.
Subregion 1: Coastal Lowlands
The Coastal Lowlands form the low-relief platform of the Outer Coastal Plain, including the margins of the Atlantic Ocean and major estuaries. The land surface is flat and low-lying, with altitudes generally less than 8 m (fig. 3). The surficial sediments were deposited in estuarine and near-shore marine environments during the Holocene and late Pleistocene Epochs, and are primarily fine-grained, except for linear ridges of sand associated with ancient shorelines.
The Coastal Lowlands are extremely poorly drained because of their flat topography and low elevation. There are numerous tidal wetlands and pocosins.
10 A Surficial Hydrogeologic Framework for the Mid-Atlantic Coastal Plain

Table 2. Hydrogeologic subregions within the Mid-Atlantic Coastal Plain [km2, square kilometers]
Land use, early 1990s1 (percent)
Barren Summary of hypothesized hydrology Hydrogeologic subregion Area (km2) Physiographic extent Agriculture Urban Forest land Wetland and water quality
1 Coastal Lowlands 22,000 Outer Coastal Plain 27 6 20 46 Poor drainage due to low elevation and little relief. Shallow water table and abundant wetlands; streams sluggish or tidal. Ground water and small streams poorly oxidized.
2 Middle Coastal Plain - 21,000 Middle Coastal Plain - 27 3 48 2 21 Drainage and oxidation varies with geology. Mixed Sediment Texture Terraces Moderate topographic relief.
3 Middle Coastal Plain - 8,000 Middle Coastal Plain - 25 4 60 2 9 Fine sediments and moderate relief promote Fine Sediments Terraces and Maryland part runoff and limit infiltration. Essentially no
of Middle Coastal Plain - unconfined aquifer; most ground water Dissected Uplands confined and poorly oxidized.
4 Middle Coastal Plain - 26,000 Middle Coastal Plain - 39 7 38 15 Coarse sediments promote infiltration and Sands with Overlying Gravels Terraces, New Jersey part of oxidation in surficial ground water. Runoff
Middle Coastal Plain - possible in areas of steep slope. Dissected Uplands, and Inner Coastal Plain- Upland Sands and Gravels on Delmarva Peninsula and in southern New
-f Jersey ::r C1l
:c 5 Inner Coastal Plain - 6,000 Inner Coastal Plain- Upland 23 10 59 2 6 Coarse sediments promote oxidation in C1l
CQ c;· Upland Sands and Gravels2 Sands and Gravels, except on shallow ground water and infiltration, through :I
Delmarva Peninsula and in runoff is great due to large topographic relief. !. CJ) southern New Jersey Streams typically incised through to older 5. geologic units; this may be reflected in stream (;'
!: chemistry. ::::1: < 6 Inner Coastal Plain - 11,000 Inner Coastal Plain - Dissected 28 16 46 3 7 Large relief promotes runoff, particularly in c.. 0 Dissected Outcrop Belt3 Outcrop Belt areas of fine sediment. Drainage and oxidation CQ C1l of ground water varies with geology. 0 0
CQ (;' 7 Alluvial and Estuarine Valleys 19,000 Alluvial and Estuarine Valleys 22 5 39 32 Poor drainage common due to flat topography ::t' and fine surficial sediments. Wetlands are t»
3 common. These are often ground-water C1l ~ discharge areas. ~ ;II;'
1Vogelmann and others (1998). Percentages are rounded to the nearest whole number and may not sum to 100. 2Previously called Middle Coastal Plain- Deeply Dissected Sands with Overlying Gravels (Ator and others, 2000). 3Previously called Inner Coastal Plain (Ator and others, 2000).
WEST EAST
METERS METERS
5 5 Wetland Wetland Saltwater marsh
_, L.U
> Sea level Sea level L.U _, <t L.U (/)
5 0 _, L.U C) -5 - 5
/ c:c: 0 Leaky confining unit L.U
/ > 0 C)
<t (/)
____-/' c:c: -10 - 10 L.U I-L.U J ~
Confining unit z L.U-
Cl ~ - 15 -15 I-
~ <t
- 20 Vertical scale x 20
EXPLANATION
~~;-~-=~ -:~ Wetland or marsh
Brackish water
- Generalized groundwater flow
-- - - - Water table
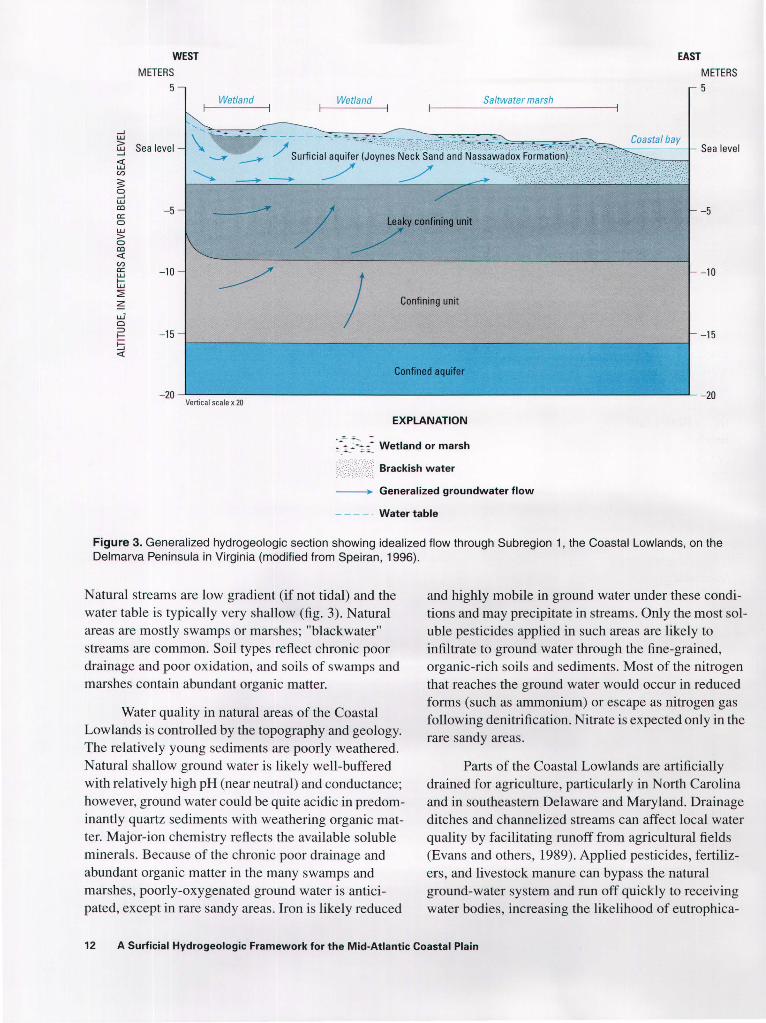
Figure 3. Generalized hydrogeologic section showing idealized flow through Subregion 1, the Coastal Lowlands, on the Delmarva Peninsula in Virginia (modified from Speiran, 1996).
Natural streams are low gradient (if not tidal) and the water table is typically very shallow (fig. 3). Natural areas are mostly swamps or marshes; "blackwater" streams are common. Soil types reflect chronic poor drainage and poor oxidation, and soils of swamps and marshes contain abundant organic matter.
Water quality in natural areas of the Coastal Lowlands is controlled by the topography and geology. The relatively young sediments are poorly weathered. Natural shallow ground water is likely well-buffered with relatively high pH (near neutral) and conductance; however, ground water could be quite acidic in predominantly quartz sediments with weathering organic matter. Major-ion chemistry reflects the available soluble minerals. Because of the chronic poor drainage and abundant organic matter in the many swamps and marshes, poorly-oxygenated ground water is anticipated, except in rare sandy areas. Iron is likely reduced
and highly mobile in ground water under these conditions and may precipitate in streams. Only the most soluble pesticides applied in such areas are likely to infiltrate to ground water through the fine-grained, organic-rich soils and sediments. Most of the nitrogen that reaches the ground water would occur in reduced forms (such as ammonium) or escape as nitrogen gas following denitrification. Nitrate is expected only in the rare sandy areas.
Parts of the Coastal Lowlands are artificially drained for agriculture, particularly in North Carolina and in southeastern Delaware and Maryland. Drainage ditches and channelized streams can affect local water quality by facilitating runoff from agricultural fields (Evans and others, 1989). Applied pesticides, fertilizers, and livestock manure can bypass the natural ground-water system and run off quickly to receiving water bodies, increasing the likelihood of eutrophica-
12 A Surficial Hydrogeologic Framework for the Mid-Atlantic Coastal Plain
tion and bacterial contamination. Streams in such areas may carry greater loads of nutrients and pesticides than would be expected under natural drainage conditions.
Land use and land cover in the Coastal Lowlands reflect the chronic poor drainage. Nearly half (46 percent) of the area is wetlands; another 21 percent is forested or barren (table 2). Only 27 percent of the Coastal Low lands is used for agriculture and 6 percent is urban, mostly in the Norfolk-Virginia Beach area of Virginia and in resort areas along the Atlantic Ocean.
Subregion 2: Middle Coastal Plain - Mixed Sediment Texture
Subregion 2 includes the broad platform of the Middle Coastal Plain just inland of the Coastal Lowlands across most of the Coastal Plain south of Delaware Bay. Surficial sediments were deposited during Pleistocene sea-level highstands. Physiographic boundaries within this area are typically scarps (such as the Suffolk Scarp) or other time-indicator elevation breaks that were also formed during Pleistocene transgressions. The land surface is moderately dissected by streams, and local relief generally ranges from 5 to 10 m. The surficial sediments of the Middle Coastal Plain were deposited in near-shore marine and estuarine environments. Sediment texture varies laterally and vertically with changes in depositional systems from littoral marine to estuarine and deltaic environments. Sediment grain sizes are mixed, and range from coarse sands associated with shorelines to clays and silts deposited in back-barrier lagoons and estuaries.
Variable hydrologic and water-quality conditions are expected in Subregion 2, reflecting the variable geology. In well-drained sandy areas, the water table is expected to be relatively deep. If the sediments are extensively weathered and well-drained, natural ground water is probably very dilute and slightly acidic. Nitrate or pesticides would have a strong potential to infiltrate to the well-oxygenated shallow ground water if applied in such areas. Conversely, poorer drainage is anticipated in areas of Subregion 2 with finer surficial sediments. As in the Coastal Lowlands (Subregion 1 ), abundant organic matter and anoxic ground water are expected in such areas. Pesticides are less likely to infiltrate to ground water and nitrogen species in ground water would be mostly reduced (such as in ammonium or organic forms). Iron in ground water of such areas is expected to be mobile and may
precipitate when discharged to streams. Artificial ditching is used for agriculture in some poorly drained parts of Subregion 2 (such as southeastern Delaware and Maryland), with similar hydrologic effects as in the Coastal Lowlands.
The distribution of land uses in Subregion 2 is similar to the overall distribution for the Mid-Atlantic Coastal Plain (table 2). About two-thirds of the subregion is forested (48 percent) or wetlands (21 percent). Another 27 percent is used for agriculture, probably in areas with relatively good drainage or artificial ditching. Only 3 percent of Subregion 2 is urbanized.
Subregion 3: Middle Coastal Plain -Fine Sediments
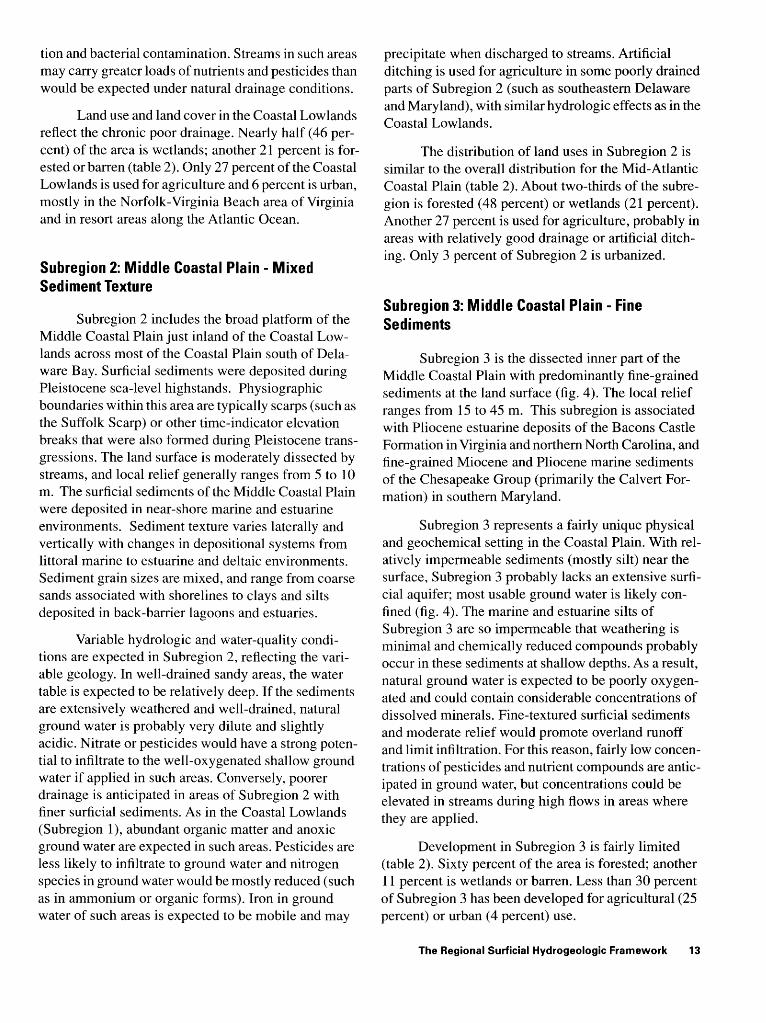
Subregion 3 is the dissected inner part of the Middle Coastal Plain with predominantly fine-grained sediments at the land surface (fig. 4 ). The local relief ranges from 15 to 45 m. This subregion is associated with Pliocene estuarine deposits of the Bacons Castle Formation in Virginia and northern North Carolina, and fine-grained Miocene and Pliocene marine sediments of the Chesapeake Group (primarily the Calvert Formation) in southern Maryland.
Subregion 3 represents a fairly unique physical and geochemical setting in the Coastal Plain. With relatively impermeable sediments (mostly silt) near the surface, Subregion 3 probably lacks an extensive surficial aquifer; most usable ground water is likely confined (fig. 4). The marine and estuarine silts of Subregion 3 are so impermeable that weathering is minimal and chemically reduced compounds probably occur in these sediments at shallow depths. As a result, natural ground water is expected to be poorly oxygenated and could contain considerable concentrations of dissolved minerals. Fine-textured surficial sediments and moderate relief would promote overland runoff and limit infiltration. For this reason, fairly low concentrations of pesticides and nutrient compounds are anticipated in ground water, but concentrations could be elevated in streams during high flows in areas where they are applied.
Development in Subregion 3 is fairly limited (table 2). Sixty percent of the area is forested; another 11 percent is wetlands or barren. Less than 30 percent of Subregion 3 has been developed for agricultural (25 percent) or urban ( 4 percent) use.
The Regional Surficial Hydrogeologic Framework 13

--' UJ
~ --'
~ Cl)
NORTHWEST
METERS
60 -Relatively impermeable surface sediments
SOUTHEAST
METERS
' 60
5 0 --' UJ co a: 0 UJ > 0 co <! Cl) a:
promote surface runoff rather than infiltration to Undifferentiated surficial deposits ground water Most ground water is confined -\
30 L- / ·s Bacons Castle Forma~ an~ Yorktown Formation (fine member)~ _ .------""-,___--,t-
30 - - ?-" l. - ~ 7:-- -~----- ·-
UJ 1-LJ.J
-------"" -- Stream ///___ ! \,, .// / Sea _ '-...__ ~ " } \ Eastover Formation./nd sand~aco~s Castle-F~rmation ~ _ Sea
:2 z LJ.J-0 ::::> t-
level 1---________ __: ____ -;..,.....,'-~..---:o-~----;--.--.--c-....,~:-:-c-:-;::-=~~----------t level St Marys Formation and clay facies of Eastover Formation
Calvert Formation
5 Lower Tertiary formations, undivided -30-L--------------------------------~__: ____ __: ______________________________ -L _30
<! Vertical scale x 20
EXPLANATION
Predominantly sand-Relatively high permeability
Silty clay and fine sand-Relatively low permeability
---- Generalized flow
---- - Water table
Figure 4. Generalized hydrogeologic section showing idealized flow through Subregion 3, the Middle Coastal Plain - Fine Sediments, along the James River in southern Virginia (modified from Meng and Harsh, 1988).
Subregion 4: Middle Coastal Plain - Sands with Overlying Gravels
Subregion 4 is defined by the superposition of upper-delta-plain sands and gravels that overlie marine inner-shelf sands on the Middle Coastal Plain. This stratigraphic setting occurs in New Jersey, the Delmarva Peninsula, southern Maryland, and central and southern North Carolina. The underlying sediments are typically Miocene and Pliocene units of the Chesapeake Group, such as the Choptank Formation in southern Maryland, the Yorktown Formation in North Carolina, and the Cohansey Formation in New Jersey. The original broad, flat upland surface has not been completely dissected by developing stream networks. Local relief is generally less than 30m, but the land surface is more deeply incised near the major rivers that cut across the Middle Coastal Plain.
Good drainage is anticipated in Subregion 4 due to the moderate topographic relief and underlying sands and gravels (fig. 5). Coarse surficial sediments promote infiltration of water and oxidation in the surficial aquifer, which is more than 100 m thick in parts of New Jersey. Limited overland runoff is anticipated, but may be significant in some developed or unusually
steep areas. Stream channels are expected to be generally sandy, but may contain considerable amounts of organic matter. Because sediments in this subregion are composed primarily of relatively insoluble quartz, natural water quality probably reflects the chemistry of precipitation. Streams and ground water in natural areas may be fairly dilute with relatively low conductance and pH.
Streams and ground water in Subregion 4 are expected to be particularly vulnerable to anthropogenic effects. The coarse permeable sediments of the area generally provide little protection to ground water from chemical applications at or near the land surface. Nitrate is the dominant anticipated nitrogen species in areas of fertilizer or manure application and may travel a considerable distance from its source in the well-oxygenated ground water. Nitrate concentrations also could be quite high in streams, but may be lower due to biological uptake or denitrification in streambed organic matter. Applied pesticides also may move fairly easily into and through the aquifers of this subregion, although pesticide mobility may be limited by organic matter in streambeds or the soil.
Land use and land cover in Subregion 4 reflect the excellent drainage. Nearly 40 percent of the subre-
14 A Surficial Hydrogeologic Framework for the Mid-Atlantic Coastal Plain

... U1
....J w > UJ ....J WEST <(
~ METERS 5 30 0 ....J UJ co c:: Sea level 0 UJ
> 0 co <(
(/) 0:: UJ 1-UJ
::2 z
-30
- 60
-90
Vertical scale x 20
Shallow ground water is typically well oxygenated along entire flowpath to stream
EXPLANATION
Aquifer sediments-Relatively high permeability
Confining layer-Relatively low permeability
- Generalized flow
----- Water table
EAST
--
METERS
30
- 30
- 60
- 90
Figure 5. Generalized hydrogeologic section showing idealized flow through Subregion 4, the Middle Coastal Plain- Sands with Overlying Gravels, on the Delmarva peninsula (modified from Bachman and Wilson, 1 984) .

gion is used for agriculture (table 2); no other subregion is more than 28 percent agricultural. Another 38 percent of Subregion 4 is forested and 15 percent is wetland (mostly along streams). Seven percent of Subregion 4 is urban; much of the urbanization is in New Jersey near Philadelphia and New York City.
Subregion 5: Inner Coastal Plain- Upland Sands and Gravels
Subregion 5 includes parts of the innermost Coastal Plain near the Fall Zone, which are overlain by a sheet of fluvial sands and gravels and are generally deeply dissected. Local relief ranges from 30 to 45 m. The upland gravels range in age from Miocene to Pliocene and overlie nearshore marine sands or saprolite of crystalline rocks (fig. 6). Surficial units are commonly completely incised and frequently there is no hydrologic connectivity between upland deposits on adjacent hills (fig. 6).
_J UJ > UJ _J
<{ UJ (/)
s 0 _J
UJ ell cr: 0 UJ > 0 ell <{ (/)
cr: UJ 1-UJ
::2 z
NORTHWEST
METERS
60
45
30
Ground water is typically well-oxygenated in upland
sand and gravel
' ' \
This subregion also includes the sand and gravel caps on adjacent Piedmont hills, which are erosional remnants of a previously wider area of Coastal Plain sediments that overlay the outer margin of the Piedmont. Because the sands and gravels are very permeable, they are difficult to erode; rainwater percolates through the sands rather than eroding them. In many areas, the surrounding saprolite of the Piedmont is eroding faster than the gravel caps, which further enhances the local relief.
The hydrology of Subregion 5 is similar to that of Subregion 4. Surficial sediments are extremely permeable and promote rapid infiltration to well-oxygenated ground water, although surface runoff could be considerable in areas with steep slopes. Unlike conditions in Subregion 4, however, these sediments are laterally discontinuous and relatively thin (fig. 6). Ground water within the fluvial sands and gravels might travel only relatively short distances before encountering much older underlying geologic units, with very differ-
SOUTHEAST
METERS 60
Ground-water chemistry may change with flow to stream through
less permeable sediment
45
30
15~--------------------------------------------------------J_15 Vertical scale x 20
EXPLANATION
Coarse, fluvial upland sand and gravel-High permeability (Brandywine Formation)
- Marine silty sand-Intermediate to high permeability (Choptank Formation)
Marine silt and clay-Low permeability (Calvert Formation)
- Generalized flow
- - -- Water table
Figure 6. Generalized hydrogeologic section showing idealized flow through Subregion 5, the Inner Coastal Plain- Upland Sands and Gravels, in southern Maryland (modified from Krantz and Powars, 2000).
16 A Surficial Hydrogeologic Framework for the Mid-Atlantic Coastal Plain

ent geochemical environments. The chemistry of stream water can be affected by any transformations that occur as the ground water passes through these older units.
Ground-water quality within the upland gravels of Subregion 5 is expected to reflect local land uses, although the chemistry of even small streams may reflect geochemical alterations in older underlying geologic units. Fairly dilute and slightly acidic natural ground-water quality is anticipated within the upland sands and gravels. The predominantly quartz sediments are deeply weathered and would provide few soluble minerals to alter the chemistry of infiltrating precipitation. As in Subregion 4, ground water within the upland gravels of Subregion 5 is particularly vulnerable to contamination from surficial sources. Nitrate is likely the dominant nitrogen species in the well-oxygenated ground water of the upland gravels, but may be lost to denitrification if the water flows through older sediments with reducing conditions on the way to streams. Pesticides are likely transported relatively easily to ground water in the upland gravels. Pesticides in streams may be mostly attributable to surface runoff; much of the ground-water discharge to streams will be from older, possibly confined aquifers. Streams also may contain iron mobilized in the reducing conditions of confined aquifers.
Much like adjacent Subregion 3, Subregion 5 is dominantly forested (59 percent) and about 25 percent agricultural (table 2). Subregion 5 is also one of the most urbanized subregions (10 percent). Most of the urban land is near Richmond, Virginia, or the small part of Subregion 5 in Pennsylvania. Sand and gravel pits are common in parts of Subregion 5.
Subregion 6: Inner Coastal Plain- Dissected Outcrop Belt
Subregion 6 is the outcrop and subcrop belt of lower Tertiary and Cretaceous formations along the Fall Zone (fig. 7). Locally, these older units may be covered with upper Tertiary or Quaternary sands and gravels, particularly in the northern Delmarva Peninsula (fig. 7). Tertiary and Cretaceous units have generally been exposed at or near the land surface for millions of years, and are typically deeply weathered. Some units are leached and oxidized to depths of tens of meters. The permeability and geochemistry of units in Subregion 6 are widely variable due to original dif-
ferences in sediment texture in complex depositional environments and post -depositional alteration of the sediments (leaching and weathering). For example, quartz sand is dominant in fluvial formations, and glauconite is common in marine units. These lithologic contrasts affect aquifer recharge and water-quality characteristics. The landscape is deeply dissected with 75 to 90 m of relief, and streams typically cut into the subcropping units.
Variable hydrologic characteristics are expected in Subregion 6, reflecting the variable permeability and lithology of underlying geologic units. In areas with permeable sand or gravel units at the land surface, infiltration is more likely than surface runoff, and well-oxygenated ground water is likely in a shallow surficial aquifer. These areas also provide most of the recharge to the lower Tertiary and Cretaceous formations as they become major regional confined aquifers toward the east and south (Leahy and Martin, 1993). Conversely, in areas with surficial silts or clays, most precipitation probably runs off across the land surface. Most of the ground water in these areas is likely confined and under reducing conditions. Although infiltration rates vary, runoff could be an important transport mechanism for nutrients, pesticides, or other surficial contaminants to streams in areas of the subregion with steep slopes, regardless of sediment texture.
In North Carolina, Subregion 6 includes the Sand Hills (fig. 1), with flat-topped or rounded hills that range from 150 to 200 m in elevation and up to 100 m of local relief. The hills are capped by loose eolian and fluvial sand overlying a fluvial-deltaic deposit of intercalated clay and clay-silt lenses with layers of hematite-cemented sandstone of the Middendorf Formation (Lyke, 1992). Both units are completely incised by stream valleys, which restrict the movement of water to deeper, confined parts of these units. Despite the relatively steep slopes in some areas, infiltration and recharge rates to these sandy areas are particularly high and some wells yield more than 100 gallons of water per minute (Robison and Mann, 1977).
Water quality in the Inner Coastal Plain - Dissected Outcrop Belt is also expected to vary with geology. Natural ground water in sandy areas is likely dilute and acidic (as in Subregions 4 and 5); iron may be common, particularly in glauconitic units. Although concentrations are expected to vary with land use, nitrate would dominate nitrogen speciation in ground water of sandy areas, but could be lost to denitrification
The Regional Surficial Hydrogeologic Framework 17

... co
WEST
METERS w >
90 o_.
60 tOw <(> CI)W a:-' 30 W<( 1-w WCI)
Sea level ~$: Zo --' -30 ujw ooo ~a: -60 t::o ~ <( -90
Vertical scale x 20
Water may infiltrate readily and ground water may be well
oxygenated in permeable deposits
Ground-water quality varies with variable EAST geology. Impermeable deposits and steep METERS
slopes may pro surface runoff 90
60
30 Potomac River
"-,.. _..,.Q~2:=:::::::::==~~iii~~;~~~~1 Sea level
- 30
-60 Potomac Group ......_ -----~--------------------------------------------------------------~-90
EXPLANATION
Aquifers-Relatively permeable
.. Primarily clay and silt-Relatively impermeable
- Generalized flow
---- - Water table
Figure 7. Generalized hydrogeologic section showing idealized flow through Subregion 6, the Inner Coastal Plain- Dissected Outcrop Belt, in southern Maryland and northern Virginia (modified from Otton, 1955).
as aquifers become confined. Pesticide transport to ground water in these areas may be mitigated by loamy soils. Water quality in confined aquifers will likely be less affected by local land use, as in Subregion 3, and more affected by land use in upgradient recharge areas.
The Inner Coastal Plain - Dissected Outcrop Belt is the most urbanized of the seven hydrogeologic subregions; 16 percent of the area has been developed for residential, commercial, or industrial purposes (table 2). This relatively large percentage of urbanization is due to the position of the subregion along the Fall Zone, where most major Mid-Atlantic cities (such as Baltimore, New York, Philadelphia, Richmond, and Washington) are located. Much (28 percent) of the remainder of the subregion is agricultural, although, as in most subregions, more than half of the Inner Coastal Plain - Dissected Outcrop Belt remains forested ( 46 percent) or wetlands (7 percent).
Subregion 7: Alluvial and Estuarine Valleys
Subregion 7, the Alluvial and Estuarine Valleys, includes the incised valleys of the major rivers that cut across the Coastal Plain, commonly southeastward, perpendicular to the regional strike. The sediments that fill the valleys range in age from Pliocene to Holocene, although most are middle Pleistocene or younger. The deeper parts of the valleys are filled by coarse-grained alluvial sediments; the upper section of the infill sequence is typically composed of fine-grained, organic-rich sediments deposited in alluvial floodplain or estuarine environments (fig. 8). Sediment in the larger rivers generally contains a rich suite of minerals transported from the Piedmont and the Blue Ridge and Appalachian Mountains.
The surficial hydrology of the Alluvial and Estuarine Valleys is controlled by the relatively impermeable uppermost sediments and flat topography. The minor relief and shallow slopes within the valleys promote infiltration instead of surface runoff, in spite of the fine-grained surficial sediments. Wetlands are common. The abundance of organic matter and fine-grained silt and clay in the surficial deposits can lead to reducing conditions in shallow ground water, although welloxygenated ground water is expected within sandy surficial sediments. Ground-water flowpaths in subregion 7 are probably relatively short, particularly in the narrower valleys to the north (fig. 8).
Given the variable hydrologic conditions and land use, water quality in the Alluvial and Estuarine Valleys is most likely variable, but largely reflects the generally poor drainage and reducing conditions. Infiltrating precipitation is expected to be well buffered by the available soluble minerals in the relatively young, poorly drained sediments. Natural ground water in such areas could have relatively high conductance and pH (near neutral), but ground water in relatively insoluble quartz sediments would more likely be acidic. In flat areas with fine-grained surficial sediments, ammonia and organic nitrogen are the dominant expected nitrogen species. Pesticide mobility is likely limited in such areas by the fine-grained sediment, low gradient, and abundant organic matter. In areas with sandy, more permeable sediments, nitrate or pesticides may be readily transported to ground water. Overland transport of nutrients, pesticides, and other potential surficial contaminants is limited in the valleys by the flat topography.
Nearly one third (32 percent) of the Alluvial and Estuarine Valleys is wetlands, reflecting the chronic poor drainage (table 2). Another 39 percent of the subregion is forested, while only 22 percent is used for agricultural purposes and 5 percent is urban.
EVALUATION OF THE REGIONAL FRAMEWORK AT THE LOCAL SCALE
Numerous local-scale water-quality and hydrologic studies have been conducted recently throughout the Mid-Atlantic Coastal Plain (fig. 9). Results of these local studies were examined within the context of the hypotheses presented in the previous section about predominant processes controlling regional chemical transport and transformations in each subregion. Although the regional framework is not intended for application at the local scale, comparisons to localscale hydrogeology in different areas. demonstrate the range of hydrogeologic conditions in some subregions. An understanding of this hydrogeologic variability will help to determine the limitations on water-quality or hydrologic hypotheses at different scales in the context of the regional framework.
Variable redox conditions and permeability caused by differences in geomorphology and depositional environments are the major natural processes affecting the transport and transformation of chemicals in ground water and surface water throughout the
Evaluation of the Regional Framework at the Local Scale 19

-' UJ > UJ -' ~ UJ U)
s 0 -' UJ CJ cr: 0 UJ > 0 CJ ~ U) cr: UJ I-UJ
~
~ UJ-
0 ::::> I-
~ ~
WEST
METERS
15
Sea level
- 15
- 30
--45
' ' ' ~
Sand and
gravel
Ve rtical scale x 20
Alluvial and Estua rine Valleys (Subregion 7)
Potomac River
'-.......
s;• '""'"'"' 1
Potomac Group
EXPLANATION
---+ Generalized groundwater flow
--- -- Water table
Sand and gravel
EAST
METERS
15
Sea level
- 15
- 30
--45
Figure 8. Generalized hydrogeologic section showing idealized flow through Subregion 7, the Alluvial and Estuarine Valleys. near Washington, D.C. (modified from Owens. 1967).
20 A Surficial Hydrogeologic Framework for the Mid-Atlantic Coastal Plain

0 n
"' .,. 2.
L_--~~~~~~~~--L-------~----------_j~ Base map from U.S. Geological Survey digital data; i~ 1:100,000; Lambert conic conformal projection; North American Datum of 1983
EXPLANATION
Hydrogeologic subregions
c::::::::J Subregion 1-Coastal Lowlands
IIIIIIIMI IIII ® © @
® ® @
® CD Q)
®
© ® ® @
® @
:t®.:~:~
® (f)
~ ® @
® ® ®
Subregion 2-Middle Coastal Plain- Mixed Sediment Texture
Subregion 3-Middle Coastal Plain- Fine Sediments
Subregions 4-Middle Coastal PlainSands with Overlying Gravels
Subregion 5-lnner Coastal Plain- Upland Sands and Gravels
Subregion 6--lnner Coastal Plain Dissected Outcrop Belt
Subregion 7-AIIuvial and Estuarine Valleys
Local study sites
25
Spruill and others, 1997, 1998
Richardson and Brockman, 1992
Speiran, 1996
Speiran, 1996; Hamilton and others, 1993
Werkheiser, 1990
Johnson, 1999
Evans and others, 1989
Evans and others, 1989
Evans and others, 1989
Evans and others, 1989
Denver, 1986; Denver, 1993; Hamilton and others, 1993; Koterba and others, 1993
Hamilton and others, 1993
Correll and others, 1992
Gilliam and others, 1996
Gilliam and others, 1996
Hamilton and others, 1993; Bohlke and Denver, 1995
Denver, 1993
Stackelberg and others, 1997; Kauffman and others, 2001
Wilson and Fleck, 1990
Bachman and Ferrari, 1995
Vowinkel and Battaglin, in press
Harlow and Bell, 1996
Froelich and others, 1978
McFarland, 1995
McFarland, 1997
Brown, 1958
50 75 100 MILES
0 25 50 75 100 KILOMETERS
Figure 9. The location of selected local-scale studies within the Mid-Atlantic Coastal Plain.
Evaluation of the Regional Framework at the Local Scale 21

Coastal Plain. Although one chemical environment may dominate, each subregion exhibits a range of redox conditions. Where variability in the physical setting is lowest (as in Subregions 1, 3, 4, and 5), variability in the redox conditions is likewise hypothesized to be low, and differences in water chemistry may be closely related to differences in land use or chemical applications. Where the physical setting is more variable (as in Subregions 2, 6, and 7), a greater variability is expected in the chemical environments that develop.
Subregion 1: Coastal Lowlands
Local studies indicate that ground-water quality in the Coastal Lowlands (Subregion 1) is predominantly influenced by reducing conditions in poorly drained shallow aquifer sediments. Ground water is well-oxygenated, however, in isolated areas of Subregion 1 with well-drained sandy soils and aquifer sediments, such as in beach-ridge or dune deposits.
In North Carolina, ground-water quality in agricultural areas of Subregion 1 is related to soil drainage and organic content. In 1994 and 1995, nitrate concentrations in ground water of the surficial aquifer in these areas with poorly drained soils (fig. 9, site A) had a median concentration of only 0.05 mg/L 2 (milligrams per liter) (Spruill and others, 1997). Low concentrations of nitrate were attributed to reducing conditions in shallow ground water that develop because of the poor soil drainage and the high organic content of surficial sediments. Concentrations of ammonia and organic carbon in these samples were relatively high, compared to other nearby parts of the Coastal Plain. Where soils are moderately well-drained, the median nitrate concentration was slightly higher (0.2 mg/L); water from one well had a concentration of nitrate greater than 7 mg/L. Overall, nitrate concentrations in ground water were inversely correlated with the organic content of the water; water with more than 2 to 3 mg/L of dissolved organic carbon generally had less than 2 mg/L of nitrate. Atrazine was detectable in some shallow wells, although rarely at concentrations exceeding 0.1 !lg/L (micrograms per liter) (Ator and Ferrari, 1997).
Similar ground-water quality is also attributed to soil drainage and organic content in other areas of Sub-
2 Contrations of nitrogen species cited in this report are in equivalent concentrations of elemental nitrogen.
region 1. In York County, Virginia (fig. 9, site B) in 1990, nitrate concentrations in ground water from 21 wells were as high as 16 mg/L, although the median was less than 0.1 mg/L. While reducing conditions prevailed in the surficial aquifer, nitrate was stable in some well-drained sandy zones (Richardson and Brockman, 1992). In an agricultural field at Leatherberry Creek in Accomack County, Virginia (fig. 9, site C) in 1993, nitrate was not detectable and dissolved oxygen was less than 1 mg/L in ground water recharged through fine-grained sediments with high organic content. In ground water from sandy sediments with low organic content, however, nitrate concentrations ranged from 9.9 mg/L to 14 mg/L, and dissolved oxygen was greater than 4 mg/L (Speiran, 1996). Subregion 1 near Townsend, Virginia (fig. 9, site D) contains forests and salt marshes underlain by mixed coarse and fine sediments with abundant organic matter; ground water contains little dissolved oxygen. Speiran ( 1996) found that nitrate concentrations in ground water flowing through this area from an adjacent agricultural field decreased with increasing distance from the field due to denitrification. In Somerset County, Maryland (fig. 9, site E), dissolved iron (present under reducing conditions) was the most common water-quality problem reported in the surficial aquifer; nitrate contamination has been reported in small areas of well-drained soils (Werkheiser, 1990). Iron and sulfur are also widespread in the ground water of Virginia Beach, Virginia (fig. 9, site F) (Johnson, 1999).
Tile drains and ditches that intercept the water table have been installed to promote soil drainage for agriculture throughout Subregion 1. In North Carolina, they are considered significant sources of nitrate delivery to streams as they oxidize the surface layer of the soils and promote localized nitrification (Evans and others, 1989). Nitrate is lost to denitrification at depth in the surficial aquifer beneath artificial drainage systems at four water-management research sites (fig. 9, sites G, H, I and J), although it is present in the ditches that drain the top of the soil layer (Evans and others, 1989). In Subregion 1 within the Albemarle-Pamlico Drainages in 1994 and 1995 (fig. 9, site A), nitrate was barely detectable in ground water discharging to streams, and concentrations were slightly higher in the streams themselves (Spruill and others, 1998).
22 A Surficial Hydrogeologic Framework for the Mid-Atlantic Coastal Plain

Subregion 2: Middle Coastal Plain- Mixed Sediment Texture
The variable depositional environments and sediment textures in Subregion 2 are reflected in the variability of local water quality. Aquifer and stream conditions in the coarse-grained areas of this subregion resemble conditions in parts of Subregion 4. Where finer-grained sediments predominate, however, conditions are similar to those in Subregion 1.
The variable hydrogeology of Subregion 2 is particularly evident on the Delmarva Peninsula (Hamilton and others, 1993). Near Fairmount, Delaware (fig. 9, site K), Subregion 2 is underlain by a thick sequence (more than 27 m) of predominantly sandy sediments. Ground water is well-oxygenated throughout the surficial aquifer and the chemical composition of the water reflects the predominance of agriculture in aquifer recharge areas. Nitrate (at concentrations as high as 41 mg/L) and other chemicals associated with fertilizer, manure, and lime applications are present throughout the flow system, including at the base of the aquifer, and in a small local stream system (Denver, 1986). Pesticides commonly used on com and soybean crops were also detected in ground water at low concentrations during the late 1980s (Denver, 1993). Pesticides were most common in shallow parts of the system associated with agriculture and were less common at depth (Koterba and others, 1993).
Near Townsend, Virginia (fig. 9, site D), the surficial aquifer of Subregion 2 ranges from about 7 to 14 m thick, and includes permeable sand and gravel with some shells. As in Fairmount, land use is predominantly agricultural and ground water is well-oxygenated. Nitrate concentrations in ground-water samples collected during the late 1980s and early 1990s were as high as 34 mg/L (Hamilton and others, 1993; Speiran, 1996).
Near Willards, Maryland (fig. 9, site L), Subregion 2 is very similar to Subregion 1. The area is mostly flat and poorly drained with woodlands and swamps. Agriculture is common, although most of the fields are artificially drained. All of the natural streams in this area and the Pocomoke River have been artificially channelized. Surficial sediments in this area of Subregion 2 include a relatively thin (about 3- to 9-m thick) sandy layer with high organic content underlain by clay, silt, peat, and sand that form a discontinuous confining layer over more sand. Sand dunes with residen-
tial and agricultural land use occur on the surface in some areas. In the early 1990s, chemical conditions in ground water of the surficial sandy aquifer ranged from well-oxygenated (with nitrate concentrations as high as 9.8 mg/L) to reducing (with undetectable nitrate) (Hamilton and others, 1993). Small-scale changes in redox conditions were evident in water from some shallow wells where both nitrate (indicating oxygenated conditions) and dissolved iron (indicating reducing conditions) were detected. Concentrations of nitrate in surface water from the area varied seasonally from about 5 mg/L to undetectable. The highest concentrations occurred in the winter and spring (when drainage from ditch systems is greatest) and the lowest occurred in the summer (when the water table is lower and ditch systems are dry or stagnant).
Subregion 3: Middle Coastal Plain- Fine Sediments
Subregion 3 has no continuous unconfined aquifer; fine-grained estuarine and marine sediments dominate the surficial deposits in most areas. Most ground water used in this region is withdrawn from confined aquifers, although some shallow unconfined wells may be used for domestic supply (Meng and Harsh, 1988). Elevated concentrations of nitrate have been measured in a few shallow wells near agricultural areas of Subregion 3 within the Patuxent River watershed (McFarland, 1995).
Nutrient concentrations in streams of Subregion 3 in Mary land indicate that nitrate is not transported to streams in base flow, possibly due to denitrification prior to ground-water discharge. Synoptic surveys of nutrient concentrations in small tributaries of the Patuxent River during base flow were conducted in 1994 and 1995 (Preston, 1996). Although sampled streams drain watersheds comprising up to 70-percent agriculture, the median nitrate concentrations in stream water never exceeded 0.5 mg/L, and concentrations were greater than 2.0 mg/L in only 2 percent of the samples. The fine-grained surficial sediments of this area of Subregion 3 have a high potential for denitrification (Krantz and Powars, 2000).
In the Rhode River watershed in Anne Arundel County, Maryland (fig. 9, site M), Subregion 3 is underlain by approximately 4 m or less of permeable sediments overlying a shallow confining layer. The confining layer forces ground water from upland agri-
Evaluation of the Regional Framework at the Local Scale 23

cultural areas to flow through an anoxic zone beneath a riparian forest prior to discharging to the river. Nitrate concentrations in ground water decrease from as high as 10.5 mg/L to below 1 mg/L as water flows beneath the forest, likely due to denitrification (Correll and others, 1992).
Subregion 4: Middle Coastal Plain- Sands with Overlying Gravels
The surficial aquifer in Subregion 4 is very thick and permeable; ground water and streams of Subregion 4 are particularly vulnerable to contamination from chemicals applied to the land surface. Nitrate contamination, for example, has been documented throughout the subregion (Bachman, 1984; Denver 1986; Andres, 1991; Stackelberg and others, 1997; Spruill and others, 1998; Clawges and others, 1999). Although relatively high concentrations of contaminants are typical in shallow ground water in areas of application, concentrations in stream base flow are more variable and generally lower. Base flow represents a mixture of ground water from the entire watershed, including any areas with little or no chemical application. Also, ground water from longer flowpaths is often relatively old and reflects historical application rates. Once discharged to the stream, water can undergo a variety of chemical changes, including denitrification, biologic nutrient uptake, sorption or desorption of charged ions, or degradation of organic compounds.
In areas of Subregion 4 in North Carolina (fig. 9, sites Nand 0), excess nitrogen was detected in ground water beneath well-drained soils even when farmers applied recommended amounts of nitrogen (Gilliam and others, 1996). The surficial aquifer ranges from 3 to 10 m thick beneath these sites. The mean concentration of nitrate in some wells was greater than 10 mg/L; the concentration at one well near animal-waste application was 190 mg/L. Nitrate concentrations decreased with depth in the surficial aquifer at both sites, although nitrate was present at the base of the surficial aquifer. Concentrations of nitrate in the streams adjacent to these sites ranged from 3 to 12 mg/L, although these samples may reflect contributions from overland runoff as well as base flow.
Some hydrogeologic variability is evident within Subregion 4 on the Delmarva Peninsula. Across the Peninsula, the spatial distribution of nitrate in Subregion 4 in areas of thick, sandy surficial sediments is
related to land use, drainage patterns, and soil (Shedlock and others, 1999). Areas with well-drained soils and incised streams (the Well-Drained Upland of Hamilton and others, 1993) typically had the highest median concentrations of nitrate in ground water, despite relatively long ground-water flowpaths. These areas also had the greatest concentration of agriculture, however. Areas where forests and forested wetlands were interspersed with agricultural fields and poorly incised streams (the Poorly Drained Upland) had lower median nitrate concentrations. The spatial distribution of nitrate in stream base flow was similar, although median surface-water concentrations were lower than median ground-water concentrations in both areas.
Near Locust Grove, Maryland (fig. 9, site P) (in the Well Drained Upland), variable ground-water quality is primarily related to variable chemical application rates rather than chemical changes within the aquifer. The surficial aquifer of Subregion 4 in this area ranges from about 7 to 22 m thick; land use is more than 95 percent agricultural (Hamilton and others, 1993). Ground water in the surficial aquifer system is aerobic throughout much of the flow system, although some evidence of denitrification was found near the base of the aquifer at the contact with the deeper confining bed. In the early 1990s, concentrations of nitrate in ground water ranged from 1.3 to 15 mg/L, and decreased with depth and age of water in the flow system. Differences in ground-water nitrate concentrations throughout most of the aquifer system were related to changes in fertilizer application rates over time, and not denitrification (Bohlke and Denver, 1995). Nitrate concentrations during base flow in Chesterville Branch, a local stream, were between 9 and 10 mg/L during this period. Chemical and isotopic data indicate that ground-water discharges relatively unaltered to Chesterville Branch through sandy streambed sediments, bypassing any potential chemical changes in the riparian zone.
Near Vandyke, Delaware (fig. 9, site Q) (in the Poorly Drained Upland), local reducing conditions and denitrification occur near a wetland within Subregion 4. This area is mostly agricultural with a wooded depressional wetland containing a seasonal pond (Denver, 1993). The surficial aquifer ranges from 10 to 14 m thick. Topography is hummocky and the water table ranges from above land surface near the depressional wetland during a period of high water table to 2 m below the depression during a dry period. The water
24 A Surficial Hydrogeologic Framework for the Mid-Atlantic Coastal Plain
table ranged from 1 to 3 m below land surface beneath local topographic highs. Surficial sediments are generally sandy except near the depression where they are finer-grained and organic-rich. Ground-water flowpaths are short and localized and vary temporally, particularly around the depressional wetland. During wet periods, when the pond contains water, slow infiltration through pond sediments recharges the surficial aquifer and forn1s a mound on the water table. During dry periods, the water table is below the pond depression and relatively fiat. From 1988 through 1990, concentrations of nitrate were as high as 9 n1g/L beneath topographic highs, and ranged from less than 0.1 to 5 mg/L near the depression. Seasonal water-quality analyses were similar in upland wells and varied near the depression where reducing conditions affected water chemistry during periods of high water table and pondwater infiltration.
Subregion 4 in New Jersey is underlain by highly permeable sands and gravels that range in thickness frmn less than 15m in the northwest to more than 150 m in the southeast (Zapecza, 1989 ). The water table is generally shallow and ranges from 0 to 14 m below land surface. In the Glassboro area (fig. 9. site R), concentrations of nitrate in shallow ground water in 1996 were highest in san1ples from agricultural areas (median, 13 mg/L ), reflecting intensive agriculture and well-drained, well-aerated soils. Concentrations were lower in new and older urban areas (n1edians, 2.6 and 3.5 mg/L, respectively) and consistently below 1 n1g/L in undeveloped (forested) areas. Pesticides were found in both urban and agricultural areas in samples from 7 5 to 80 percent of the wells, generally at levels below applicable Federal drinking-water standards. VOCs were most common in water from urban areas. With tin1e, contaminants in the surficial aquifer may tnove deeper into the system and into surface water (Stackelberg and others, 1997 ). Ground-water flow modeling of the Glassboro region indicates that water recharged at a ground-water divide in the thicker parts of this system may be in the flow system for over 200 years before discharging to local strean1s (Kauffman and others, 2001 ). In thinner parts of the system, base flow includes ground water that recharged less than 10 years ago. Modeling estimated that nitrate concentrations in streatns were reduced about 40 percent below groundwater discharge concentrations, probably because of denitrification in streambed sediments or in-stream loss (Kauffn1an and others, 2001, Stackelberg and others, 2001). Szabo and others (1994) found that concentra-
tions of nitrate and pesticides decreased with depth in the Kirkwood-Cohansey aquifer system, but that these chemicals have not yet penetrated to deep parts of the system.
In undeveloped areas of Subregion 4, water quality is very similar to that of precipitation. A large part of Subregion 4 in New Jersey is covered by pine forests and swamps. Surface-water chemistry in these areas is very similar to that of precipitation, as surficial sediments are predmninantly quartz sand and precipitation is the major source of dissolved constituents in ground and surface water (Fusillo and others, 1980). Groundand surface-water chemistry are similar, although ground water has higher pH. bicarbonate, and dissolved iron concentrations, especially in swamoy areas. Oxidation of iron as it discharges to sur~ace water and drainage from organic-rich swan1py areas around streams results in a decreased pH in surface water to a median value of 4.5.
Subregion 5: Inner Coastal Plain- Upland Sands and Gravels
Limited information available for Subregion 5 indicates that the permeable sands and gravels of this subregion yield usable quantities of well-oxygenated water. Hand-dug domestic wells have been installed in the upland sands and gravels (mapped as the Brandywine Formation) of the Maryland part of this subregion with sufficient saturated thickness (Otton, 195:). Recent mapping of zones of denitrification potential indicate that surficial geologic conditions and soils would promote nitrification in ground water in these upland deposits (Krantz and Powars, 2000).
Near Waldorf, Maryland (fig. 9, siteS), ~nbregion 5 contains mostly sand and gravel overlying the silt and clay of the Calvert Formation. In four l~')reholes, these include up to 12 n1 of medium to c':larse, orange or tan feldspar-bearing sands and (commonly iron-stained) gravel. At one site. these sediments are overlain by 3m of silt and fine sand. These sediments form a surficial aquifer with a saturated thickness of 3 to 14 n1. One ground-water sample frmn this aquifer in 1961 was "soft" (hardness= 59 mg/L)3 with 430 J..Lg/L of iron~ another was "hard" (hardness= 150 mg/L),
3 Hardness values are expressed as equivalent concentrations of calcium carbonate.
Evaluation of the Regional Framework at the Local Scc-'e 25

with 490 J..tg/L of iron and 110 mg/L of sulfate (Wilson and Fleck, 1990).
Subregion 6: Inner Coastal Plain- Dissected Outcrop Belt
The variable geology of Subregion 6 is reflected in its variable ground-water and stream chemistry. In many areas. the surficial deposits of this subregion are dominated by deeply weathered permeable sands and gravels, and ground-water quality largely reflects overlying land use. In some areas, however, reducing conditions occur in less permeable sediments. In North Carolina. for example, variable nitrate and iron concentrations in water indicate variable redox conditions (North Carolina Department of Natural Resources and Community Development. 1979).
The Morgan Creek watershed, near Locust Grove. Maryland (fig. 9, site P), provides an example of ground- and surface-water chemistry in a part of Subregion 6 where the stream valley is completely incised through the surficial aquifer into a deeper confining unit (Bohlke and Denver. 1995 ). This watershed is adjacent to Chesterville Branch (fig. 9, site P) and shares the same agricultural land use and sandy aquifer conditions. However, the confining bed beneath the unconfined surficial aquifer is at a much shallower depth beneath Morgan Creek than Chesterville Branch. Nitrate concentrations are elevated in shallow ground water, but much of the nitrate is lost to denitrification prior to discharge into Morgan Creek. Chemical and isotopic evidence indicate that much of the denitrification occurs where ground-water flowpaths pass through an anoxic zone at the top of the confining bed near the discharge area into Morgan Creek. Nitrate concentrations range from 2 to 3 mg/L in Morgan Creek, and from 9 to 10 mg/L in Chesterville Branch.
In the Upper Cretaceous Englishtown-Mt. Laurel and Tertiary Rancocas aquifer systems in southern New Castle County, Delaware (fig. 9, site T), water chemistry in Subregion 6 is affected by different redox environments in unconfined and confined parts of the systems. Water samples from wells in unconfined parts of each system had nitrate concentrations above 0.4 mg/L (an estimated threshold for natural nitrate concentrations in the area; Han1ilton and others, 199 3) and as high as 15 mg/L (Bachman and Ferrari, 1995). In confined parts of these aquifer systems, nitrate was undetectable (less than 0.02 mg/L) and concentrations
of dissolved iron, an indicator of reducing conditions, were generally greater than 300 J..tg/L. Nitrate and iron concentrations were generally inversely correlated.
In the Potomac-Raritan-Magothy aquifer system in Subregion 6 along the Fall Zone in New Jersey (fig. 9. site U), the vulnerability of the aquifer to nitrate and pesticide contamination is similarly greater in outcrop areas relative to confined parts of the aquifers. Vowinkel and Battaglin (in press) found that the median nitrate concentration in ground water of unconfined outcrop areas was 0.3 mg/L; the median concentration in confined areas was less than 0.1 mg/L. Pesticides were also detectable (at low concentrations) in outcrop areas.
Subregion 7: Alluvial and Estuarine Vr'lleys
Depositional environments in the alluvial and estuarine sediments associated with rna jo"" rivers in the Coastal Plain (Subregion 7) are highly variable: ground water may exhibit reducing conditions as~ociated with organic matter and fine-grained sediments, or oxidizing conditions associated with sandy surficial sediments. The scale of these depositional environments varies with the scale of the river valley, gP.nerally decreasing from south to north. Because much of Subregion 7 is along brackish and saline water bodies, saltwater intrusion into aquifer sediments is dso possible. Local-scale data from along the Potomac, Patuxent, Pocomoke, James, and Cape Fear Rivers (fig. 1) denlonstrate some of the variability in geology and water quality in Subregion 7.
The alluvial deposits along the Potomac River range from coarse to fine and commonly contain organic matter. At Dahlgren, Virginia (fig. 9, site V) these sediments are predominantly sandy with local silt, clay, gravel, and organic matter. They range from 2 to 10 m thick and contain a water-table aquifer (Harlow and Bell, 1996). The geochemical ervironment in these sediments varies from well-oxygenated to reducing, with iron and manganese concentrati<Jns inversely correlated with dissolved oxygen. Some ground-water samples contained elevated sodium and chloride concentrations, likely from road salt applications, and (possibly) from brackish-water intrusion in a narrow zone along the river. Upstream, near Wasl'ington, D.C., (fig. 9, site W), valley sediments include thick fluvial sand and gravel at the base, grading upward to silt, clay, and organic matter (Froelich and others, 1978). Current
26 A Surficial Hydrogeologic Framework for the Mid-Atlantic Coastal Plain

deposition in the estuarine Potomac River in this area and downstream includes an organic-rich gray and black clay or silty clay ( Callendar and others, 1984; Hiortdahl, 1997).
Local-scale ground-water flow and water quality were studied in relation to nutrient transport in Subregion 7 along the Patuxent River in an area with predominantly sandy surficial sediments (fig. 9, site X) (McFarland, 1995 ). This unconfined flow systen1 is predominantly oxygenated, with nitrate concentrations generally ranging fron1 6 to 10 mg/L, although denitrification may occur in ground water beneath a forested lowland adjacent to the Patuxent River.
In the Pocomoke River Valley near Willards, Maryland (fig. 9, site L), sediments are comprised of fine-grained alluvium and under reducing conditions. Alluvium includes sand, peat, clay, and gravel (Owens and Denny, 1979). Ground water in the alluvium of Green Run, a tributary to the Pocomoke River, contained iron concentrations as high as 61,000 J..Lg/L in 1990 (Hamilton and others, 1993).
Valleys in the southern part of the study area contain a similar mix of sedin1ents. The James River Valley near the Fall Zone (fig. 9, site Y) is underlain by "very poorly sorted sand, gravel, cobbles, and boulders with noncohesive silt and clay" (McFarland, 1997). Lithologic logs are available from two wells near the Cape Fear River in Sampson County, North Carolina (fig. 9, site Z). At one well, the upper 6 m of sediment includes a tight, red clay with about 20 percent fine to very fine angular quartz sand. This is underlain by another 6 m of tan medium to coarse sand. At the other well location, the upper clay layer is missing and the surficial deposits include 7 m of rust -colored medium and coarse sand (Brown, 1958).
FRAMEWORK APPLICATION
Several characteristics of the surficial hydrogeologic framework presented in this report n1ake it more or less useful for various purposes. Although limitations in scale and resolution are inherent, the framework can be a valuable tool for sumn1arizing regional hydrogeologic conditions for the purpose of analyzing data, designing sampling networks, or general environmental investigations. Conclusions drawn from examination of the framework at the local scale, however, can
be misleading or incorrect, and should be used with caution.
Intended Uses
The surficial hydrogeologic framework represents a regional sumn1ary of variable physical properties (physiography and surficial sediment textu~e) that affect the flow and chemistry of streams and sb allow ground water in the Mid-Atlantic Coastal Plain. Within each subregion, a fairly unifom1 set of natural conditions affects the occurrence, fate, and transport of chemicals from the land surface through the shallow ground-water system to streams. The framework is intended for use for any purpose for which sue, a regional summary of environmental conditions might be necessary or helpful. In regional environmental investigations, the framework can be useful for explaining the spatial distribution of different land uses, soil types, topographic features, mineral deposits, wetlands, freshwater availability, or ground-water quality. The distribution of hydrogeologic features described by the framework might also be conf1dered in the design of future environmental studies. The fran1ework could be useful as a predictive tool for preliminary environmental assessment, as well, although additional information would be needed to define the hydrogeology of local areas.
Limitations
The greatest limitations on the use of the framework are those of scale and resolution. The fran1ework is intended for use as a tool for regional hydrogeologic assessments; the uncertainty in the hydrogeolo:sic interpretations increases quickly as the framework is applied to sn1aller and smaller areas. The sever subregions defined by the framework represent areas of similar geology (primarily unconsolidated siliciclastic sediments) along a continuun1 of hydrogeologis characteristics (sediment textures and physiography). Although real differences are hypothesized to exist among these subregions on an aggregate basis, the local hydrogeologic variability within each subregion is such that the framework provides only general guidelines about the physical setting in small areas. Examination of the results of local hydrogeologic anc1 waterquality investigations in the Mid-Atlantic Coastal Plain demonstrate that even within the subregions pn~dicted
Framework Application 27
to be the most homogeneous, conditions are variable at the local scale. Subregion L for example. contains some well-drained areas with oxygenated ground water (Spruill and others, 1997), and smne areas of Subregion 4 are poorly drained with reducing conditions (Denver, 1993).
The regional scale and resolution of the hydrogeologic framework are artifacts of the methods used in its development as well as real local-scale hydrogeologic differences among areas of the Mid-Atlantic Coastal Plain. Though mostly unconsolidated, sediments of the Coastal Plain are very diverse with respect to texture, which is very important to permeability and other hydrogeologic properties. A complex sequence of sediments ren1ains as a result of the drastic sea-level fluctuations and the consequent multiple marine transgressions across the Coastal Plain since the Early Cretaceous, particularly in the Pleistocene and Holocene Epochs (Appendix 2). Son1e fmmations grade laterally or vertically through a continuum of sediment sizes from gravel to clay. These variable deposits are combined by necessity into a set of comprehensive mapping units in geologic investigations, particularly those published at the state or regional scale. In creating the framework, a predominant sediment texture was defined for each of these variable comprehensive units (plates 2 and 3); the units were then further combined in delineating the seven hydrogeologic subregions (plate 4 ).
The widely scattered distribution of data from field investigations also affects the accuracy of hydrogeologic delineations in son1e areas. Although the framework is not intended for use at the local scale, exan1ination of data and results fron1local-scale studies provides smne insight into the real hydrogeologic variability within each delineated subregion of the Coastal Plain. The lack of available local information for some areas (including much of Subregions 3 and 5, for example) affects the certainty of the hydrogeologic hypotheses described in this repm1.
Some inherent limitations also should be considered when using the physiographic data (plate 1) and geologic data (plates 2 and 3 ). Although these n1aps represent a step toward regional uniformity, some inconsistencies among mapped areas remain to be resolved. The variable scale and resolution of original data sources remain evident in some areas, particularly for subcropping units on the Deln1arva Peninsula (plate 2). Original sources also may differ in non1enclature
and geologic interpretations; some geolog~sts consider different controls (such as biostratigraphy, depositional setting, or sediment size) when mapping lithostratigraphic units. Given the variability in seal~ and interpretations in published geologic data acros" the Coastal Plain (particularly for the surficial formati0ns), future regional compilations of this type will undoubtedly benefit from further investigations into the distribution and physical properties of near-surface Coastal Plain deposits and the processes responsible for their formation.
SUMMARY
A regional surficial hydrogeologic framework was developed for the Mid-Atlantic Coastal Plain, from New Jersey through North Carolina. A regionally consistent summary of the hydrogeology is a useful foundation for environmental investigations at tnany scales. The properties of near-surface geologic n1aterials are particularly fundamental to water-quality studies because they directly affect the flow and quality of strean1s and ground water. Previously available spatial geologic and hydrologic data for large areas are often of limited use for regional investigations d·1e to insufficient detail, incomplete coverage, or inconsistencies among sources. The hydrogeologic framework for the Mid-Atlantic Coastal Plain includes seven distinct hydrogeologic subregions within which the primary physical properties affecting the flow and chemistry of shallow ground water and small streams are relatively consistent, or rather, consistently heterogeneous. Within most subregions, the moven1ent of chemicals from the land surface to shallow ground water and strean1s can be described by a fairly uniform set of natural processes; some subregions include n1ixed hydrogeologic settings indistinguishable at the regional scale. The seven subregions represent arers of similar geology (mainly unconsolidated siliciclastic sediments) along a continuum of physiography and sediment textures.
The seven hydrogeologic subregions that comprise the framework were delineated prin1arily on the basis of physiography and the predominart texture of near-surface sediments, the primary natural factors that affect the flow and quality of shallow ground water and small streams. Physiography was constructed by extrapolating and standardizing previously published physiographic interpretations for the Coastal Plain of
28 A Surficial Hydrogeologic Framework for the Mid-Atlantic Coastal Plain

South Carolina and New Jersey. Surficial and subcropping geology for the Mid-Atlantic Coastal Plain were similarly defined through a con1pilation of previously published data: contacts and correlations between formations were interpolated across unmapped areas, and inconsistencies in nomenclature, interpretation, and scale were resolved to the extent possible. A predominant sediment texture for each mapped geologic unit was derived from published descriptions of the sediments and stratigraphy at selected locations. Relatively contiguous hydrogeologic subregions were delineated on the basis of the con1binations of physiography and surficial geology: subcropping geology was used in a few cases where the surficial sedin1ents are particularly thin.
Fundamental differences among the seven hydrogeologic subregions are defined in terms of variable soils, land-use distributions, topography. and hypotheses about the dominant hydrologic processes in the area. The Coastal Lowlands (Subregion 1) are extren1ely flat. low-lying, and poorly drained: wetlands are comtnon. Streams are mostly sluggish or tidaL and ground water is typically poorly oxygenated. Agriculture is common in Subregion 1. although most fields are artificially drained. With relatively impermeable surficial sediments, the Middle Coastal Plain - Fine Sedin1ents (Subregion 3) lacks an extensive surficial aquifer; n1ost usable ground water is confined and moderate relief promotes runoff of precipitation directly to strean1s. Subregion 3 is mostly forested. In the Middle Coastal Plain- Sands with Overlying Gravels (Subregion 4) and the Inner Coastal Plain- Upland Sands and Gravels (Subregion 5). extremely petmeable surficial sediments promote infiltration to well-oxygenated ground water, and water quality commonly reflects surficial land uses. The surficial aquifer of Subregion 4 is generally very thick: in Subregion 5. however, it is typically completely incised by streams. The Middle Coastal Plain- Mixed Sediment Texture (Subregion 2). the Inner Coastal Plain- Dissected Outcrop Belt (Subregion 6), and the Alluvial and Estuarine Valleys (Subregion 7) contain mixed hydrogeologic settings indistinguishable at the regional scale. Each represents a unique topography and physiography important to the flow and chemistry of streams and shallow ground water.
Although the seven subregions that constitute the fran1ework represent distinct hydrogeologic settings on a regional scale. geologic variability within the Coastal
Plain lin1its the usefulness of the framework at local scales. A review of the results of local investigations demonstrates that even the subregions hypothefized to be most homogeneous (such as Subregions 1 and 4) can be quite variable locally. On the local scale, the seven subregions defined by the framework must be interpreted along the continuum of natural settings tr at exist within the Mid-Atlantic Coastal Plain.
REFERENCES
Andres. A.S., 1991. Results of Coastal Sussex County, Delaware. ground-water quality survey: Delaware Geological Survey Report of Investigations No. 49. 28 p.
Andres. A.S. and Ramsey, K.W .. 1995, Geologic Map of the Seaford Area: Delaware Geological Survey Ge'Jlogic Map Series No. 9, 1 sheet. scale 1:24,000.
Ator. S.W., Denver. J.M., and Hancock, T.C., 2000, Pelating shallow ground-water quality to surficial hydrogeology in the Mid-Atlantic Coastal Plain: Proceedings of the National Water-Quality Monitoring Council Conference, Austin. Texas, April 25-27, 2000, p. 409-423.
Ator, S.W. and Ferrari, M.J .. 1997. Nitrate and selected pesticides in ground water of the Mid-Atlantic Region: U.S. Geological Survey Water-Resources Investigations Report 97-4139. 8 p.
Bachman. L.J., 1984, Nitrate in the Columbia Aquifer, Central Delmarva Peninsula, Maryland: U.S. Geological Survey Water-Resources Investigations Report 84-4322.51 p.
Bachman. L.J., and Ferrari, M.J., 1995, Quality and geochemistry of ground water in Southern New Castle County, Delaware: Delaware Geological Survey Report of Investigations No. 52, 31 p.
Bachman. L.J., Lindsey, B.D., BrakebilL J.W., and Powars, D.S .. 1998. Ground-water discharge and base-flow nitrate loads of nontidal streams, and their relation to a hydrogeomorphic classification of the Chesapeake Bay Watershed. Middle Atlantic Coast: U.S. Geological Survey Water-Resources Investigations Report 98-4059, 71 p.
Bachman. L.J., and Wilson. J.M., 1984, The Columbia Aquifer of the Eastern Shore of Maryland: Maryland Geological Survey Report of Investigations No. 40, 144 p.
Benson, R.N. (ed.), 1990, Geologic and hydrologic studies of the Oligocene-Pleistocene section near Lewr:s, Delaware: Delaware Geological Survey Report of Investigations 48, 34 p.
Benson, R.N., and Spoljaric, Nenad, 1996, Stratigrauhy of the post-Potomac Cretaceous-Tertiary rocks of central Delaware: Delaware Geological Survey Bulletin No. 20,28 p.
Referenc.,s 29

Bohlke, J.K., and Denver, J.M., 1995, Combined use of groundwater dating, chemical, and isotopic analyses to resolve the history and fate of nitrate contamination in two agricultural watersheds, Atlantic Coastal Plain, Maryland: Water Resources Research, v. 31 no. 9, p. 2,319-2,339.
Brown, P.M., 1958, Well logs from the Coastal Plain of North Carolina: North Carolina Department of Conservation and Development Bulletin No. 72, 96 p.
Brown, P.M., Miller, J.A., and Swain, F.M., 1972, Structural and stratigraphic framework, and spatial distribution of permeability of the Atlantic Coastal Plain, North Carolina to New York: U.S. Geological Survey Professional Paper 796, 79 p.
Callendar, Edward, Carter, Virginia, Hahl, D.C., Hitt, Kerie, and Schultz, B.I., eds., 1984, A water-quality study of the tidal Potomac River and Estuary - an overview: U.S. Geological Survey Water Supply Paper 2233,46 p.
Clawges, R.M., Stackelberg, P.E., Ayers, M.A., and Vowinkel, E.F., 1999, Nitrate, volatile organic compounds, and pesticides in ground water- a summary of selected studies from New Jersey and Long Island, New York: U.S. Geological Survey Water-Resources Investigations Report 99-4027, 32 p.
Cleaves, E.T., Edwards, Jonathan, and Glaser, J.D., 1968, Geologic map of Maryland: Maryland Geological Survey, 1 sheet, scale 1 :250,000.
Cleaves, E.T., Glaser, J.D., Howard, A.D., Johnson, G.H., Wheeler, W.H., Sevon, W.D., Judson, Sheldon, Owens, J.P., and Peebles, P.C., 1987, Quaternary geologic map of the Chesapeake Bay 4 degrees x 6 degrees quadrangle, United States, in Richmond, G.M., Fullerton, D.S., and Weide, D.L., eds., Quaternary geologic atlas of the United States: U.S. Geological Survey, Miscellaneous Investigations Series Map I -1420 (NJ -18 ), 1 sheet, scale 1:1,000,000.
Colquhoun, D.J., 1969, Geomorphology of the Lower Coastal Plain of South Carolina: Columbia, South Carolina, State Development Board, Division of Geology, Map Series No. 15, 36 p., 1 map sheet, scale 1:500,000.
__ 1974, Cyclic surficial stratigraphic units of the Middle and Lower Coastal Plains, central South Carolina, in Oaks, R.Q., Jr., and DuBar, J.R., Post-Miocene Stratigraphy, Central and Southern Atlantic Coastal Plain: Logan, Utah, Utah State University Press, p. 179-190.
__ 1986, The geology and physiography of the Orangeburg Scarp, in Neathery, T.L., ed., Southeastern Section of the Geological Society of America, Centennial field guide Volume 6: Boulder, Colorado, Geological Society of America, p. 321-322.
Colquhoun, D.J., Johnson, G.H., Peebles, P.C., Huddlestun, P.F., and Scott, Thomas, 1991, Quaternary geology of the Atlantic Coastal Plain: New Jersey, Delmarva Peninsula, western shore of Maryland, Virginia, and North
Carolina, Cape Fear Arch, northeastern So'lth Carolina, central South Carolina, Georgia, Florida, in Morrison, R.B., ed., Quaternary nonglacial geology; Conterminous U.S., The Geology ofNorthAmerica Volume K-2: Boulder, Colorado, Geological Society of America, p. 629-650.
Cooke, C.W., Martin, R.O.R., and Meyer, Gerrld, 1952, Geology and water resources of Prince Georges County: Maryland Department of Geology, Mines, and Water Resources Bulletin 10, 270 p.
Correll, D.L., Jordan, T.E., and Weller, D.E., 1992, Nutrient flux in a landscape- Effects of coastallani use and terrestrial community mosaic on nutrient transport to coastal waters: Estuaries, v. 15, no. 4, p. 431-442.
Daniels, R.B., and Gamble, E.E., 1974, Surficial deposits of the Neuse-Cape Fear divide above the Surry Scarp, North Carolina, in Oaks, R.Q., Jr., and DuBar, J.R., Post-Miocene Stratigraphy. Central and S0uthern Atlantic Coastal Plain: Logan, Utah, Utah State University Press, p. 88-101.
Denny, C.S., Owens, J.P., Sirkin, L.A., and Rubin, Meyer, 1979, The Parsonsburg Sand in the Centrrl Delmarva Peninsula, Maryland and Delaware: U.S. Geological Survey Professional Paper 1067-B, 16 p.
Denver, J.M., 1986, Hydrogeology and geoche'llistry of the unconfined aquifer, west-central and soutl'western Delaware: Delaware Geological Survey Report of Investigations No. 41. 100 p.
__ 1993, Herbicides in shallow ground water at two agricultural sites in Delaware: Delaware Geokgical Survey Report of Investigations No. 51, 28 p.
Drever, J .I., 1997, The geochemistry of natural waters, 3 d
ed., Upper Saddle River, New Jersey, Prentice-Hall, Inc., 436 p.
DuBar, J.R., Johnson, H.S., Jr., Thorn, B.G., and Hatchell, W.O., 1974, Neogene stratigraphy and morphology, south flank of the Cape Fear arch, North and South Carolina, in Oaks, R.Q., Jr., and DuBar, J.R., PostMiocene Stratigraphy, Central and Southern Atlantic Coastal Plain: Logan, Utah, Utah State University Press, p. 139-173.
Evans, R.O., Gilliam, J.W., and Skaggs, R.W., 1989, Effects of agricultural management on drainage water quality: Water-Resources Research Institute, Raleigh, North Carolina, North Carolina State University, Report No. 237,87 p.
Fenneman, N.M., 1938, Physiography of the eastern United States: New York, McGraw-Hill, 714 p.
Fenneman, N.M., and Johnson, D.W., 1946, Pl'ysical divisions of the United States: U.S. Geological Survey Map, 1 sheet, scale 1:7,000,000.
Freeze, C.W., and Cherry, J.A., 1979, Groundwater: Englewood Cliffs, N.J., Prentice Hall, 604 p.
Froelich, A.J., Johnston. R.H., and Langer, W.P., 1978, Preliminary report on the ancestral Potomac River deposits
30 A Surficial Hydrogeologic Framework for the Mid-Atlantic Coastal Plain
in Fairfax County, Virginia, and their potential hydrogeologic significance: U.S. Geological Survey OpenFile Report 78-544, 37 p.
Fusillo, T.V., Schomick, J.C., Jr., Koester, H.E., and Harriman, D.A., 1980, Investigation of acidity and other water-quality characteristics of Upper Oyster Creek, Ocean County, New Jersey: U.S. Geological Survey Water-Resources Investigations Report 80-10, 30 p.
Gerhart, J.M., and Brakebill, J.W., 1996, Design and implementation of a sampling strategy for a water-quality assessment of the Potomac River Basin: U.S. Geological Survey Water-Resources Investigations Report 96-4034, 31 p.
Gill, H.E., 1962, Ground-water resources of Cape May County, New Jersey-- salt-water invasion of principal aquifers: New Jersey Department of Conservation and Economic Development Special Report 18, 171 p.
Gilliam, J.W., Huffman, R.L., Daniels, R.B., Buffington, D.E .. Morey, A.E., and LeClerc, S.A., 1996, Contamination of surficial aquifers with nitrogen applied to agriculturalland: Water-Resources Research Institute, Raleigh, North Carolina, North Carolina State University, Report No. 306, 80 p.
Gilliom, R.J.,Alley, W.M .. and Gurtz, M.E., 1995, Design of the National Water-Quality Assessment programOccurrence and distribution of water-quality conditions: U.S. Geological Survey Circular 1112, 33 p.
Glaser, J.D., 1971, Geology and mineral resources of Southem Maryland: Maryland Geological Survey Report of Investigations No. 15, 85 p.
___ 1976, Geologic map of Anne Arundel County: Maryland Geological Survey, 1 sheet, scale 1:62,500.
Gohn, G.S., 1988, Late Mesozoic and early Cenozoic geology of the Atlantic Coastal Plain: North Carolina to Florida, in Sheridan, R.E., and Grow, J.A., eds., The Atlantic Continental Margin, U.S.: Boulder. Colorado, Geological Society of America, Geology of North America, v. 1-2, p.l07-130.
Goodwin, B.K., 1980, Geology of the Bon Air Quadrangle. Virginia: Charlottesville, Virginia. Virginia Division of Mineral Resources, 1 sheet. scale 1 :24,000.
Groot, J.J., and Jordan. R.R., 1999. The Pliocene and Quaternary Deposits of Delaware - Palynology, ages. and paleoenvironments: Delaware Geological Survey Report of Investigations 58, 36 p.
Hack. J.T., 1955, Geology of the Brandywine Area and origin of the upland of Southern Maryland: U.S. Geological Survey Professional Paper 267 -A, 63 p.
Hamilton, P.A., Denver, J.M., Phillips, P.J., and Shedlock, R.J .. 1993, Water-quality assessment of the Delmarva Peninsula, Delaware, Maryland, and Virginia- Effects of agricultural activities on, and the distribution of. nitrate and other inorganic constituents in the surficial aquifer: U.S. Geological Survey Open-File Repmt 93-40,87 p.
Hamilton, P.A., Shedlock, R.J., and Phillips, P.J., 1989, Ground-water-quality assessment of the Delmarva Peninsula, Delaware, Maryland, and Virginia- Anal?sis of available water-quality data through 1987: U.S. Geological Survey Open-File Report 89-34, 71 p.
Hansen, H.J., 1971, Transmissivity tracks in the Coa5'tal Plain of Maryland: Southeastern Geology, v. 13, no. 3, p. 127-149.
__ 1996, Hydrostratigraphic framework of the Piney Point- Nanjemoy aquifer and Aquia aquifer in Calvert and St. Mary's Counties, Maryland: Maryland G~ological Survey Open-File Report No. 96-02-8, 45 p.
Harlow, G.E., and Bell, C.F., 1996, Hydrogeology and water quality of the shallow aquifer system at the Mainside, Naval Surface Warfare Center, Dahlgren site, Dal·lgren, Virginia: U.S. Geological Survey Water-Resources Investigations Report 96-4055, 34 p.
Hem, J.D., 1985, Study and interpretation of the cheoical characteristics of natural water (3d ed. ): U.S. Ge.ological Survey Water-Supply Paper 2254, 263 p.
Hiortdahl, S.N .. 1997, Geologic framework, hydroge'Jlogy, and ground-water quality of the Potomac Group Aquifer System, Northwestern Charles County, Maryland: U.S. Geological Survey Water-Resources Invesfgations Report 91-4059, 111 p.
Johnson, G.H., and Peebles, P.C., 1986, Quaternary geologic map of the Hatteras 4 degrees x 6 degrees quadrangle, United States, in Richmond, G.M., Fullerton, D.S., and Weide, D.L., eds., Quaternary geologic atlas of the United States: U.S. Geological Survey Miscellaneous Investigations Series, Map I-1420 (NI-18), scale 1: 1 ,000,000.
Johnson, H.M., IV, 1999, The Virginia Beach shallow ground-water study: U.S. Geological Survey Fac .. Sheet 173-99, 2 p.
Jordan, R.R., 1964, Columbia (Pleistocene) Sediments of Delaware: Delaware Geological Survey Bulletin No. 12, 69 p.
Jordan, R.R., and Smith, R.V., (comp.). 1983, Atlanti-:Coastal Plain region -- Correlation of Stratigraphic Units of North America (COS UNA) Project- Tulsa, Oklahoma: American Association of Petroleum Geologists, 1 sheet.
Kauffman, L.J., Baehr, A.L., Ayers. M.A., and Stackdberg, P.E., 2001, Effects of land use and travel time on the distribution of nitrate in the Kirkwood-Cohansey Aquifer System in southern New Jersey: U.S. Geological Survey Water-Resources Investigations Report 01-4117, 49 p.
King, P.B., and Beikman. H.M., 1974, Geologic map of the United States: U.S. Geological Survey, 3 sheets, scale 1 :2,500,000.
Koterba, M.T., Banks, W.S.L., and Shedlock, R.J., 1993, Pesticides in ground water in the Delmarva Peninsula:
Reference~ 31
Journal of Environmental Quality, v. 22, no. 3, p. 500-518.
Krantz, D.E., and Powars, D.S., 2000, Hydrogeologic setting and potential for denitrification in ground water, Coastal Plain of Southern Maryland: U.S. Geological Survey Water-Resources Investigations Report 00-4051, 19 p.
Leahy, P.P., and Martin, Mary, 1993, Geohydrology and simulation of ground-water flow in the Northern Atlantic Coastal Plain Aquifer System: U.S. Geological Survey Professional Paper 1404-K, 81 p.
Lyke, W.L., 1992, Hydrologic controls on ground-water flow in the Sand Hills Area, near Aberdeen, North Carolina: American Water Resources Association Technical Publications Series, v. 92-1, p. 151-162.
Maryland Geological Survey, 1933, Map of Maryland showing geological formations: 1 sheet, scale 1:380,160.
McCartan, Lucy, 1989a, Geologic map of Charles County: Maryland Geological Survey Geologic Map, 1 sheet, scale 1 :62,500.
___ 1989b, Geologic map of St. Mary's County: Maryland Geological Survey Geologic Map, 1 sheet, scale 1:62,500.
___ 1990, Geologic map of the Coastal Plain and upland deposits, Washington West quadrangle, Washington D.C., Maryland and Virginia. U.S. Geological Survey Open-File Report 90-654, scale 1:24,000.
McCartan, Lucy, Newell, W.L., Owens, J.P., and Bradford, G.M., 1995, Geologic map and cross sections of the Leonardtown 30 x 60-minute quadrangle, Maryland and Virginia: U.S. Geological Survey Open-File Report 95-665, 1 sheet, scale 1:100,000.
McFarland, E.R., 1995, Ground-water flow, geochemistry, and effects of agricultural practices on nitrogen transport at study sites in the Piedmont and Coastal Plain Physiographic Provinces, Patuxent River Basin, Maryland: U.S. Geological Survey Open-File Report 94-507, 78 p.
__ 1997, Hydrogeologic framework, analysis of groundwater flow, and relations to regional flow in the Fall Zone near Richmond, Virginia: U.S. Geological Survey Water-Resources Investigations Report 97-4021, 56 p.
McMahon, Gerard, and Lloyd, O.B., Jr., 1995, Water-quality assessment of the Albemarle-Pamlico Drainage BasinNorth Carolina and Virginia - Environmental setting and water-quality issues: U.S. Geological Survey Open-File Report 95-136, 72 p.
Meng, A.A., and Harsh, J.F., 1988, Hydrogeologic framework of the Virginia Coastal Plain: U.S. Geological Survey Professional Paper 1404-C, 82 p.
Mixon, R.B., 1978, The Thornburg Scarp- A late Tertiary marine shoreline across the Stafford fault system: in Mixon, R.B., and Newell, W.L. (eds.), Tenth Annual Virginia Geology Field Conference, October 13-14, 1978, Reston, Virginia, p. 41-43.
__ , 1985, Stratigraphic and geomorphic framework of uppermost Cenozoic deposits in the soutb~rn Delmarva Peninsula, Virginia and Maryland: U.S. Geological Survey Professional Paper 1067-G, 53 p.
__ (ed.), 1989, Geology and paleontology of the Haynesville cores: Northeastern Virginia Coastal Plain: U.S. Geological Survey Professional Paper 1489, [variously paged.]
Mixon, R.B., Berquist, C.R., Newell, W.L., Johnson, G.H., Powars, D.S., Schindler, J.S., and Rader, E.K., 1989, Geologic map and generalized cross sections of the Coastal Plain and adjacent parts of the p:~dmont, Virginia: U.S. Geological Survey Miscellaneous Investigations Series Map I-2033, 2 sheets, scale 1:250,000.
Mixon, R.B., Pavlides, L., Powars, D.S., Froelich, A.J., Weems, R.E., Schindler, J.S., NewelL W.L., Edwards, L.E., and Ward, L.W., 2000, Geologic map of the Fredericksburg 30'x 60' quadrangle, Virginia and Maryland. U.S. Geological Survey Investigations S~ries Map I-2607, scale 1:100,000, 2 sheets, pamphlet, 34 p.
New Jersey Department of Environmental Protection, Bureau of Geographic Information Systf'ms, 1996, State of New Jersey geographic information system resources data: Trenton, New Jersey, CD Series 1, v. 1 and 2.
Newell, W.L., Powars, D.S., Owens, J.P., and ~<'hindler, J.S., 1995, Surficial geological map of New Jersey: southern sheet (primary map): U.S. Geological Survey OpenFile Report 95-272, scale 1:100,000.
Newell, W.L., Powars, D.S., Owens, J.P., Stanford, S.D., and Stone, B.D., 2000, Surficial geologic mar of central and southern New Jersey: U.S. Geological Survey Miscellaneous Investigations Series Map I-2450-D, 3 sheets, 1 pamphlet, scale 1:100,000.
North Carolina Department of Natural Resou~ces and Community Development, 1979, Ground water resources of the Southern Pines area: Raleigh, North Carolina, Office of Water Resources, State of North Carolina, 41 p.
North Carolina Geological Survey, 1985, Geologic map of North Carolina: North Carolina Departrrent of Natural Resources and Community Development, 1 sheet, scale 1:500,000.
Oaks, R.Q., Jr., and Coch, N.K., 1973, Post-Miocene stratigraphy and morphology, southeastern Viq:inia: Virginia Division of Mineral Resources Bulletin No. 82, 135 p.
OerteL G.F., and Foyle, A.M., 1995, Drainage displacement by sea-level fluctuation at the outer margin of the Chesapeake Seaway: Journal of Coastal Research, v. 11, p. 583-604.
Otton, E.G., 1955, The water resources of the Southern Maryland Coastal Plain: Maryland Depzrtment of Geology, Mines, and Water Resources Bl1lletin 15, 347 p.
32 A Surficial Hydrogeologic Framework for the Mid-Atlantic Coastal Plain

Owens, J.P. (comp.), 1967, Engineering geology of the Northeast Corridor- Washington, D.C. to Boston, Massachusetts- Coastal Plain and surficial deposits: U.S. Geological Survey Miscellaneous Geologic Investigations Map I-514-B, 9 sheets, scale 1:250.000.
__ 1989, Geologic map of the Cape Fear region, Florence 1 degree x 2 degrees quadrangle and northern half of the Georgetown 1 degree x 2 degrees quadrangle, North Carolina and South Carolina: U.S. Geological Survey Miscellaneous Investigations Series Map I-1948-A, 1 sheet scale 1:250,000.
Owens, J.P. and Denny, C.S., 1978, Geologic map of Worcester County, Maryland: Maryland Geological Survey, 1 sheet scale 1 :62,500.
__ 1979, Geologic map of Wicomico County, Maryland: Maryland Geological Survey, 1 sheet scale 1:62,500.
__ 1986, Geologic map of Dorchester County, Maryland: Maryland Geological Survey, 1 sheet, scale 1:62,500.
Owens, J.P., and Gohn, G.S .. 1985, Depositional history of the Cretaceous Series in the United States Atlantic Coastal Plain: Stratigraphy, paleoenvironments, and tectonic controls of sedimentation, in Poag, C.W. (ed.), Geological Evolution of the United States Atlantic Margin: New York, Van Nostrand Reinhold, p. 25-86.
Owens, J.P., and Minard, J.P., 1979, Upper Cenozoic sediments of the lower Delaware Valley and the northern Delmarva Peninsula, New Jersey, Pennsylvania, Delaware, and Maryland: U.S. Geological Survey Professional Paper 1067-D, 47 p.
Owens, J.P., Sugarman, P.J., Sohl, N.F., Parker, R.A., Houghton, H.F., Volkert, R.A., Drake, A.A., and Orndorff, R.C., 1999, Bedrock geologic map of central and southern New Jersey: U.S. Geological Survey Miscellaneous Investigations Series Map I-2540-B, 2 sheets, scale 1:100.000.
Pazzaglia, F.J., 1993, Stratigraphy, petrography, and correlation of late Cenozoic Middle Atlantic Coastal Plain deposits: Implications for late-stage passive-margin geologic evolution: Geological Society of America Bulletin, v. 105, no. 12, p. 1,617-1,634.
Powars, D.S., and Bruce, T.S., 1999, The effects of the Chesapeake Bay impact crater on the geological framework and correlation of hydrogeologic units of the lower York -James Peninsula, Virginia: U.S. Geological Survey Professional Paper 1612, 82 p.
Preston, S.D., 1996, Study of nonpoint nutrient loading in the Patuxent River Basin, Maryland: U.S. Geological Survey Water-Resources Investigations Report 96-4273.6 p.
Ramsey, K.W., 1988, Stratigraphy and sedimentology of a late Pliocene intertidal to fluvial transgressive deposit: Bacons Castle Formation, Upper York-James Peninsula, Virginia: Newark, Delaware, University of Delaware, Ph.D. dissertation, 399 p.
__ 1997, Geology of the Milford and Mispillion River Quadrangles: Delaware Geological Survey Repxt of Investigations No. 55, 40 p.
Ramsey, K.W., and Schenck, W.S., 1990, Geologic Map of Southern Delaware: Delaware Geological Survey Open-File Report No. 32, 1 sheet, scale 1:100,000.
Richardson, D.L., 1994, Ground-water discharge from the Coastal Plain of Virginia: U.S. Geological Survey Water-Resources Investigations Report 93-4191, 15 p.
Richardson, D.L., and Brockman, A.R., 1992, Hydrogeology and water quality of the shallow ground-water system in eastern York County, Virginia: U.S. Geologi~al Survey Water-Resources Investigations Report 92-4090, 41 p.
Robison, T.M., and Mann, L.T., Jr., 1977, Public water supplies of North Carolina- Part 5, Southern Coastal Plain: Raleigh, North Carolina, North Carolina Department of Natural Resources and Community Development 341 p.
Schruben, P.G., Arndt, R.E., and Bawiec, W.J., 1994, Geology of the Conterminous United States at 1:2,500,000 Scale-- A Digital Representation of the 1974 P.B. King and H.M. Beikman Map: U.S. Geological Sun'ey Digital Data Series DDS-11, scale 1:2,500,000.
Schwarz, G.E., and Alexander, R.A., 1995, State soil geographic ( STATSGO) database for the conterminous United States: U.S. Geological Survey Open-File Report 95-449.
Shedlock, R.J., Denver. J.M., Hayes, M.A., Hamilto'l, P.A., Koterba, M.J., Bachman, L.J., Phillips, P.J., and Banks, W.S.L., 1999, Water-quality assessment of the Delmarva Peninsula, Delaware, Maryland, and Virginia-Results of investigations, 1987-91: U.S. Geological Survey Water-Supply Paper 2355-A, 41 p.
Sinnott, Allen, and Cushing, E.M., 1978, Summary appraisals of the Nation's ground-water resources- MidAtlantic region: U.S. Geological Survey Profes~ional Paper 813-I, 32 p.
Sohl, N.F., and Owens, J.P., 1991, Cretaceous stratigraphy of the Carolina Coastal Plain, chap. 11 ofHorton, J.W., Jr., and Zullo, V.A., eds., The Geology of the Carolinas: University of Tennessee Press, p. 191-220.
Soller, D.R., and Mills, H.H., 1991, Surficial geology and geomorphology, chap.17 £ifHorton, J.W., Jr., and Zullo, V.A., eds., The Geology of the Carolinas: University of Tennessee Press, p. 290-308.
Speiran, G.K., 1996, Geohydrology and geochemist~y near coastal ground-water-discharge areas of the Eastern Shore, Virginia: U.S. Geological Survey Water-Supply Paper 2479. 73 p.
Spruill, T.B., Eimers, J.L., and Morey, A.E .. 1997, Nitrate nitrogen concentrations in shallow ground wate ... of the Coastal Plain of the Albemarle - Pamlico Drainage Study Unit, North Carolina and Virginia: U.S. Geological Survey Fact Sheet FS-241-96, 4 p.
Referenc,1s 33

Spruill, T.B., Hamed, D.A., Ruhl, P.M., Eimers, J.L., McMahon, Gerard, Smith, K.E., Galeone, D.R., and Woodside, M.D., 1998, Water quality in the AlbermarlePamlico Drainage Basin, North Carolina and Virginia, 1992-95: U.S. Geological Survey Circular 1157, 36 p.
Stackelberg, P.E., Hopple, J.A., and Kauffman, L.J., 1997, Occunence of nitrate, pesticides, and volatile organic compounds in the Kirkwood-Cohansey Aquifer System, Southern New Jersey: U.S. Geological Survey Water-Resources Investigations Report 97-4241, 8 p.
Stackelberg, P.E., Kauffman, L.J., and Ayers, M.A., 2001.An integrated modeling approach for use in regional ground-water-quality assessments: [abs.] in Eos, Transactions of the American Geophysical Union, v. 82, no. 20, p. S164.
Szabo, Zoltan, Rice, D.E., Ivanhenko, Tamara, and Vowinkel, E.F., 1994, Delineation of the distribution of pesticides and nitrates in an unconfined aquifer in the New Jersey Coastal Plain by flow-path analysis, in Weigman, D.L., ed., New directions in pesticide research, development, management, and policy: Proceedings of the Fourth National Conference on Pesticides, Nov. 1-3, 1993, Blacksburg, Virginia, Virginia Water Resources Research Center, p. 100-119.
Trapp, Henry, 1992, Hydrogeologic framework of the northem Atlantic coastal plain in parts of North Carolina, Virginia, Maryland, Delaware, New Jersey, and New York: U.S. Geological Survey Professional Paper 1404-G,59p.
Verdin, K.L., 1997, HYDRO 1K Elevation derivative database: U.S. Geological Survey, accessed January 12, 1998 at URL http://edcwww.cr.usgs.gov/landdaac/ gtopo30/hydro/namerica.html.
Virginia Division of Mineral Resources, 1980, Geology of the Oak Grove core: Virginia Division of Mineral Resources Publication No. 20, 88 p.
Vogelmann, J.E., Sohl, T.L., Campbell, P.V., and Shaw, D.M., 1998, Regional land cover characterization using Landsat and ancillary sources: Environmental Monitoring and Assessment, v. 51, p.415-428.
Vowinkel, E.F., and Battaglin, W.A., in press, Analysis of nonpoint source ground-water contamination in relation to land use: Chapter D, Relation of ground-water quality to hydrogeology in the Coastal P'ain of New Jersey: U.S. Geological Survey Water-Supply Paper 2381-D, 110 p.
Vroblesky, D.A., and Fleck, W.B., 1991, Hyd-ogeologic framework of the Coastal Plain of Maryland, Delaware, and the District of Columbia: U.S. Geological Survey Professional Paper 1404-E, 45 p.
Ward, L.W., Bailey, R.H., and Carter, J.G., 19!1, Pliocene and Early Pleistocene stratigraphy, depositional history, and Molluscan paleobiogeography of the Coastal Plain: chap.16 ofHorton, J.W., Jr., and Zullo, V.A., eds., The Geology of the Carolinas: Knoxville, Tennessee, University of Tennessee Press, p. 274-289.
Ward, L.W. and Blackwelder, B.W., 1980, Stratigraphic revision of Upper Miocene and Lower Plioce'1e beds of the Chesapeake Group, Middle Atlantic Coastal Plain: U.S. Geological Survey Bulletin 1482-D, 61 r-. 5 pls.
Wehmiller, J.F., Belknap, D.F., Boutin, B.S., ~1irecki, J.E., Rahaim, S.D., and York, L.L., 1988, A review of the aminostratigraphy of Quaternary mollusks from United States Atlantic Coastal Plain sites, in Easterbrook, D.L., ed., Dating Quaternary sediments: Geological Society of America Special Paper 227, p. 69-110.
Werkheiser, W.H., 1990, Hydrogeology and g-ound-water resources of Somerset County, Maryland: Maryland Geological Survey Bulletin 35, 156 p.
Wilson, J.M., and Fleck, W.B., 1990, Geology and hydrologic assessment of Coastal Plain aquifers in the Waldorf Area, Charles County, Maryland: Maryland Geological Survey Report of Investigations No. 53, 138 p.
Winner. M.D., Jr., and Coble, R.W., 1996, Hydrogeologic framework of the North Carolina Coastal Plain: U.S. Geological Survey Professional Paper 1404-I, 106 p.
Zapecza, O.S., 1989, Hydrogeologic framewo~k of the New Jersey Coastal Plain: U.S. Geological Survey Professional Paper 1404-B, 49 p.
34 A Surficial Hydrogeologic Framework for the Mid-Atlantic Coastal Plain

APPENDIX 1 Technical Notes

APPENDIX 1 -TECHNICAL NOTES
by Sarah K. Martucci
Four digital geographic data sets (coverages)
were developed for the Mid-Atlantic Coastal Plain using Environmental Systems Research Institute
(ESRI) Arc/Info Geographic Information System (GIS)
software (version 7.2.1) on Microsoft Windows NT 4.0.
All data are presented in the Albers Equal-Area Conic projection with a central meridian of 96 degrees in the
NorthAn1erican Datum (NAD) of 1983 (Snyder, 1987).
These data are not intended for use at scales greater
than approximately 1: 1 ,000,000. The coverages are dis
tributed for general use in Arc/Info export files and Spatial Data Transfer Standard (SDTS) format; metadata
for each coverage are also presented in digital format.
Geology Coverages
Available published and unpublished data (see
metadata and Delineation of Regional Geology, above)
were appended to generate the surficial and subcropping geology coverages. Some of these data were previously available in digital format others were
digitized from printed maps. All original data were projected to a common datum and clipped to the study area, as necessary.
Attribute items (variables) included in the surfi
cial and subcropping geology coverages are: formation, name, and lith. Formation is an abbreviation of the
geologic formation name (noted in the item, name) and age. For example, formation "Tc" is the Tertiary-aged
Calvert Formation. The item, Lith, describes the pre
dominant sediment texture of each unit, as shown for the surficial geology on plate 3.
The surficial geology coverage and its metadata are available from http://md.water.usgs.gov/publica
tions/prop-1680/surfgeol.html. The subcropping geol
ogy coverage and its metadata are available from http:/ /md. water. usgs.gov /publications/prop-1680/subcrops.html.
Physiography Coverage
The surficial geology coverage was generalized to generate the physiography coverage. The arcs (geologic contacts) from the surficial geology that correspond to physiographic boundaries (mostly scarps) were selected and copied to a new coverage. This coverage was then built with polygon topology and attributed. Six physiographic subprovinces aF~ delineated in the physiographic coverage, in the item, prov.
The physiographic coverage and accompanying metadata may be obtained from http:// md. water.usgs.gov /publications/prop-1680/phys.html.
Hydrogeologic Framework CoveragE
The physiography and geology coverages were combined and generalized to develop th~ hydrogeologic framework coverage. The surficial geology coverage was dissolved on lith and intersected with the physiography coverage. The resulting coverage was plotted at a scale of 1:1,000,000 and the s~ven relatively contiguous subregions were outlined by hand on the basis of physiography and predominant sediment texture. The arcs corresponding to these sul~;egion boundaries were copied from the intersected c 'Jverage to a new coverage; a few boundaries were al~o copied from the subcropping geology coverage or digitized on screen. Polygon topology was built and attributes were added to this new coverage to generate the hydrogeologic framework coverage. The hydroge'"llogic framework coverage includes seven distinct subregions identified by the items, fcode (an integer from 1 to 7) and name (table 2).
The complete metadata and this dataset may be obtained from http:/ /md. water. usgs.gov /publications/ prop-1680/framework.html.
Reference
Snyder. J.P., 1987, Map projections -a working manual: U.S. Geological Survey Professional Paper 1395, 383 p.
36 A Surficial Hydrogeologic Framework for the Mid-Atlantic Coastal Plain
APPENDIX 2 Geologic Setting of the Mid-Atlantic Coastal Plain

APPENDIX 2- GEOLOGIC SETTING OF THE MID-ATLANTIC COASTAL PLAIN
by David E. Krantz
On a regional scale, the geometry and character of the shallow aquifer system in the Mid-Atlantic Coastal Plain is controlled by large-scale structural and depositional systems, and geologic processes operating over millions of years. The surficial aquifer, as the uppermost part of the hydrostratigraphic system, has variable but predictable properties inherited from this geologic setting and modified by local processes that shaped the land surface and chemically altered the surficial sediments.
Physiography
Each of the physiographic subprovinces (plate 1) has a characteristic geomorphology that is related to its geologic history. This geomorphic variability is critical to the development of stream networks, ground-water resources, and other hydrologic properties that control the shape and use of the land.
The Inner Coastal Plain (plate 1) includes the greatest topographic relief in the study area. The Dissected Outcrop Belt includes some of the oldest landscapes in the Mid-Atlantic Coastal Plain. From the Washington, D.C. area to the north, this includes the deeply weathered Potomac Group (plate 2) and equivalent deposits along the Fall Zone. In North Carolina, this includes the area west and northwest (landward) of the Orangeburg Scarp (plate 1 ), and east of the Fall Zone across the crest of the Cape Fear arch (plate 2). The Inner Coastal Plain has a deeply incised drainage network, and is underlain primarily by Lower Tertiary and Cretaceous sediments. The land surface has been exposed for at least 5 million years, is deeply weathered, and has been extensively modified by colluviation (Newell and others, 1980).
The Lower Cretaceous units of the Inner Coastal Plain are overlain locally by remnants of a broad veneer of upper Tertiary coarse sediments (the Upland Sands and Gravels). In many areas, these deposits are largely discontinuous and confined to isolated hilltops (Mixon and others, 1989). In New Jersey and the Delmarva Peninsula, however, this subprovince includes broad plains that slope gently to the southeast and are capped by deeply weathered fluvial coarse sands and gravels
(the Bridgeton and ColumbiaFormationr, respectively) (Zapecza, 1989; Vroblesky and Fleck, 1991, Newell and others, 2000). The rolling upland is dissected by underfit streams in wide valleys; the moiern streams are much smaller than the alluvial valleys, which suggests that the drainage systems previously carried much more sediment eroded from the land surface (Newell and others, 2000).
The Middle Coastal Plain - Terrac:es is a broad, seaward-sloping plain bounded to the ncihwest (landward) by the Orangeburg, Coates, and Broad Rock Scarps, and by the Suffolk Scarp to the routheast (seaward) (plate 1). Several less prominent scarps such as the Surry Scarp divide the Middle Coastal Plain into a series of stair-step terraces with progressively lower elevations moving seaward (Oaks and Coch, 1973, Colquhoun and others, 1991). The deposits of this subprovince include fluvial sediments that correlate with estuarine and shallow marine sequences seaward; these deposits are Pliocene and Early to Middle Pleistocene in age, and were produced by repeated s~a-level transgression and regression cycles (sea-level rises and falls, respectively). The land surface has been exposed longer than that of the Outer Coastal Plain, and has undergone moderate erosion and moderately deep weathering. Some original coastal landforms (such as barrier-island complexes) are preserved and recognizable in the younger sections of the Middle Coastal Plain- Terraces, particularly in North Carolina (Cclquhoun and others, 1991 ).
The Middle Coastal Plain- Dissected Uplands (plate 1) are similar to the rest of the Middle Coastal Plain, with slightly greater stream incisiC''l. In New Jersey, this includes a highly dissected area of low hills and broad alluvial valleys. The land surface is largely covered by coarse colluvial sands and gravels. In Maryland, the geomorphology of this subprovince is similar, however, the area is underlain by the relatively impermeable silt and clay of the Calvert Form::ttion (McCartan and others, 1995).
The Outer Coastal Plain (plate 1) encompasses the lowland areas generally within 16 to 24 km (kilometers) of the modern coastline, including the modern barrier islands and lagoons along the Atlantic Ocean
38 A Surficial Hydrogeologic Framework for the Mid-Atlantic Coastal Plain

and the extensive tidal marshes along the coastal bays. This subprovince also includes the estuarine terraces that parallel the lower reaches of the major rivers crossing the Coastal Plain. Its boundaries in North Carolina and Virginia are the Suffolk Scarp on the landward side and the modem Atlantic coastline. The Outer Coastal Plain is very flat with low relief, and has an immature (poorly developed) stream-drainage network. Much of the land surface is inherited from coastal landforms created during Late Pleistocene highstands of sea level, such as barrier island complexes and estuarine embayments (Colquhoun and others, 1991).
The Alluvial and Estuarine Valleys of major rivers cross the Coastal Plain, generally toward the southeast (plate 1 ). These are typically broad, flat bottomlands and terraces parallel to the modem river channels; the area is poorly drained and perennially wet from ground-water discharge. Scarps along the river valleys were created when the valleys were flooded to form estuaries during the Pleistocene, and are connected to contemporary coastal scarps. The valleys in North Carolina are typically broader with greater volumes of alluvial fill than are valleys to the north that drain to the Chesapeake and Delaware Bays. The northern river valleys are more deeply incised, and the rivers transport a significantly lower suspendedsediment load than the southern rivers. The James River and the major rivers to the north are tidal and estuarine to the Fall Zone, whereas the rivers in North Carolina are fluvial (nontidal) half way across the Middle Coastal Plain (Fenneman, 1938). Weathering and erosion are dominated by physical processes to the north and chemical processes to the south. These changes in alluvial valley fill and weathering correspond to the transition from a humid temperate to a humid subtropical climate in southern Virginia and northern North Carolina (Soller and Mills, 1991 ).
Structure
The distribution of geologic units (plate 2) and hydrogeologic subregions (plate 4) in the Mid-Atlantic Coastal Plain reflects two large-scale geologic structures. The orientation and thickness of the entire Coastal Plain sedimentary sequence is controlled by the undulating surface of basement rocks upon which it rests. A crater in the lower Chesapeake Bay (plate 2) resulted from an itnpact that radically altered the entire
geologic section and distribution of fresh ground water in eastern Virginia.
Independent of the monoclinal seaward dip of the entire Mid-Atlantic Coastal Plain sequence, the distribution and thickness of the sedimentary units are controlled on the spatial scale of tens to hundreis of kilometers by a series of positive- and negative-relief structures (Owens and Gohn, 1985; Ward and others, 1991; Trapp, 1992; Winner and Coble, 1996) Crlate 2, this report). From north to south, the depositional basins are the Raritan Embayment in northern New Jersey, the Salisbury Embayment in Maryland, Delaware, and Virginia, and the Albemarle Embayment in northeastern North Carolina. These basins are separc:ted by the South New Jersey Arch, the Norfolk Arch, c:T\d the Cape Fear Arch, which is the most prominent of the arches. The Neuse Arch is a smaller-scale feature on the northern flank of the Cape Fear Arch. These positive structures are believed to be associated with largescale tectonic features in the crystalline baseme'lt, and may have offsets of 300m (meters) relative to tl'~ adjacent basin. Differential vertical movement of t]'~Se structures throughout the Cretaceous and Cenozoic has created alternating sequences of thicker and thinner Coastal Plain strata along the regional strike, which is generally south-southwest to north-northeast, roughly parallel to the Atlantic coastline (Owens and Gohn, 1985; Ward and others, 1991; Trapp, 1992; Winner and Coble, 1996).
These regional structures mostly affect tte geometry of the deeper, confined aquifers, but th~y also influence the character of the surficial aquifer. For example, across the crest of the Cape Fear Arch, conlpacted and partially indurated (cemented) Cretr~eous sediments that were previously deeply buried lia. directly beneath a thin cover of Pliocene and Pla.istocene shallow-marine sediments that are comn1only less than 10m thick. The geometry of the surfisial aquifer is vastly different in the Albemarle Eml'ayment, where the combined thickness of the Pliocene and Pleistocene sequence approaches 180 m under the Outer Coastal Plain (Winner and Coble, 1996). Another effect of the Cape Fear Arch is the fonnation of a band of Lower Tertiary limestone and marls in the shallow subsurface along the flank of the arch in southeastern North Carolina, bounded approximately by the Northeast Cape Fear River to the west and the p.~mlico River to the north (plate 2). This area is one of the few
APPENDIX 2 - Geologic Setting of the Mid-Atlantic Coastal Pia~,., 39
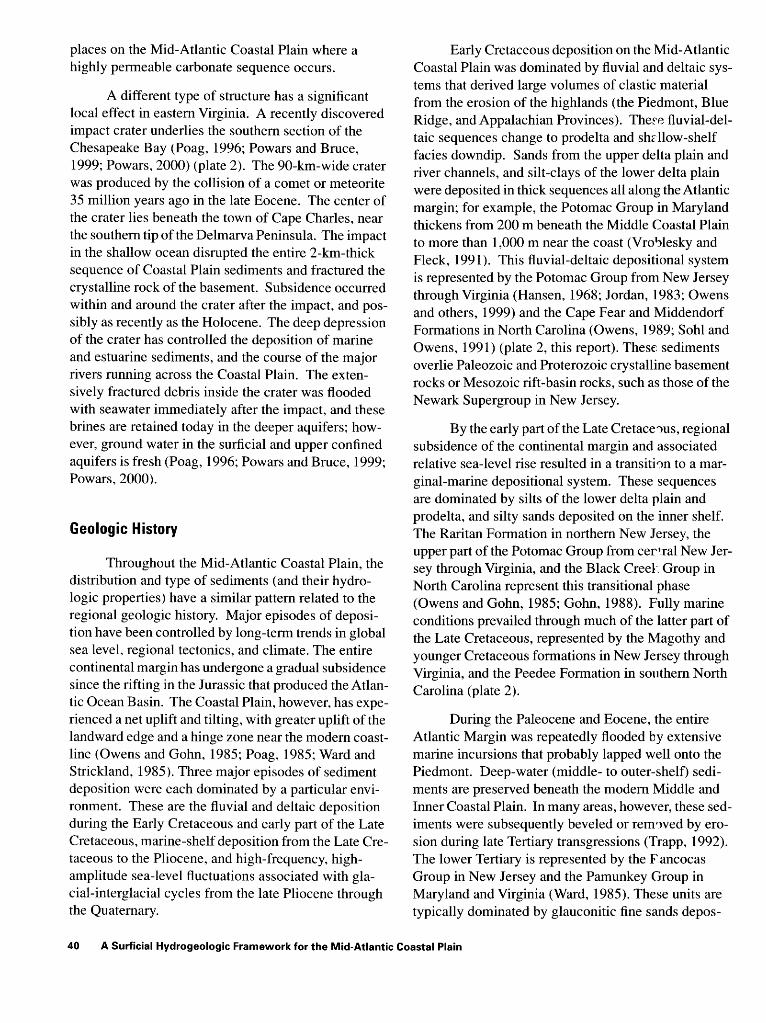
places on the Mid-Atlantic Coastal Plain where a highly permeable carbonate sequence occurs.
A different type of structure has a significant local effect in eastern Virginia. A recently discovered impact crater underlies the southern section of the Chesapeake Bay (Poag, 1996; Powars and Bruce, 1999; Powars, 2000) (plate 2). The 90-km-wide crater was produced by the collision of a comet or meteorite 35 million years ago in the late Eocene. The center of the crater lies beneath the town of Cape Charles, near the southern tip of the Delmarva Peninsula. The impact in the shallow ocean disrupted the entire 2-km-thick sequence of Coastal Plain sediments and fractured the crystalline rock of the basement. Subsidence occurred within and around the crater after the impact, and possibly as recently as the Holocene. The deep depression of the crater has controlled the deposition of marine and estuarine sediments, and the course of the major rivers running across the Coastal Plain. The extensively fractured debris inside the crater was flooded with seawater immediately after the impact, and these brines are retained today in the deeper aquifers; however, ground water in the surficial and upper confined aquifers is fresh (Poag, 1996; Powars and Bruce, 1999; Powars, 2000).
Geologic History
Throughout the Mid-Atlantic Coastal Plain, the distribution and type of sediments (and their hydrologic properties) have a similar pattern related to the regional geologic history. Major episodes of deposition have been controlled by long-term trends in global sea leveL regional tectonics, and climate. The entire continental margin has undergone a gradual subsidence since the rifting in the Jurassic that produced the Atlantic Ocean Basin. The Coastal Plain, however, has experienced a net uplift and tilting, with greater uplift of the landward edge and a hinge zone near the modern coastline (Owens and Gohn, 1985; Poag, 1985; Ward and Strickland, 1985 ). Three major episodes of sediment deposition were each dominated by a particular en vironment. These are the fluvial and deltaic deposition during the Early Cretaceous and early part of the Late Cretaceous, marine-shelf deposition from the Late Cretaceous to the Pliocene, and high-frequency, highamplitude sea-level fluctuations associated with glacial-interglacial cycles from the late Pliocene through the Quaternary.
Early Cretaceous deposition on the Mid-Atlantic Coastal Plain was dominated by fluvial and deltaic systems that derived large volumes of clastic material from the erosion of the highlands (the Piedmont, Blue Ridge, and Appalachian Provinces). Thefe fluvial-deltaic sequences change to prodelta and shdlow-shelf facies downdip. Sands from the upper delta plain and river channels, and silt -clays of the lower delta plain were deposited in thick sequences all along the Atlantic margin; for example, the Potomac Group in Maryland thickens from 200 m beneath the Middle Coastal Plain to more than 1,000 m near the coast (Vrol:llesky and Fleck, 1991). This fluvial-deltaic depositional system is represented by the Potomac Group fron1 New Jersey through Virginia (Hansen, 1968; Jordan, 1983; Owens and others, 1999) and the Cape Fear and Middendorf Formations in North Carolina (Owens, 1989; Sohl and Owens, 1991) (plate 2, this report). These sediments overlie Paleozoic and Proterozoic crystalline basement rocks or Mesozoic rift-basin rocks, such as those of the Newark Supergroup in New Jersey.
By the early part of the Late Cretace'"lus, regional subsidence of the continental margin and associated relative sea-level rise resulted in a transiti0n to a marginal-marine depositional system. These sequences are dominated by silts of the lower delta plain and prodelta, and silty sands deposited on the inner shelf. The Raritan Formation in northern New Jersey, the upper part of the Potomac Group from certral New Jersey through Virginia, and the Black Creet Group in North Carolina represent this transitional phase (Owens and Gohn, 1985; Gohn, 1988). Fully marine conditions prevailed through much of the latter part of the Late Cretaceous, represented by the ~1agothy and younger Cretaceous formations in New Jersey through Virginia, and the Peedee Formation in southern North Carolina (plate 2).
During the Paleocene and Eocene, the entire Atlantic Margin was repeatedly flooded by extensive marine incursions that probably lapped well onto the Piedmont. Deep-water (middle- to outer-shelf) sediments are preserved beneath the modern Middle and Inner Coastal Plain. In many areas, however, these sediments were subsequently beveled or rem'Jved by erosion during late Tertiary transgressions (Trapp, 1992). The lower Tertiary is represented by the F ancocas Group in New Jersey and the Pamunkey Group in Maryland and Virginia (Ward, 1985). These units are typically dominated by glauconitic fine sands depos-
40 A Surficial Hydrogeologic Framework for the Mid-Atlantic Coastal Plain

ited in a poorly oxygenated shelf environment. Some units contain shallower water deposits, including nearshore well-sorted sands, and interbedded silts and muddy sands fron1 deltas. The Early Tertiary shelf south of central North Carolina was dominated by carbonates and marls (mixed carbonate and siliciclastic sedin1ents). The Eocene and Oligocene units in southem North Carolina are the Castle Hayne, River Bend, and Belgrade Formations (Ward and others, 1978) (plate 2, this report).
A prolonged period of regression in the late Oligocene was followed by a significant global rise in sea level beginning in the early Miocene and continuing in cycles through most of the middle and late Miocene. Several large regional transgressive pulses deposited the marine sediments of the Kirkwood and Cohansey Formations in New Jersey (Newell and others, 1995, 2000), the Chesapeake Group in Delaware, Maryland, and Virginia (Cleaves and others, 1968; Mixon and others, 1989), and the Pungo River Formation in the Albemarle Embayment of North Carolina (North Carolina Geological Survey, 1985 ). The marine sediments of these formations are typically shallow-shelf silty sands, commonly with abundant carbonate shells, and silts or silty fine sands deposited in partially protected coastal embayments or in deeper shelf settings. Coastal deposits, such as barrier-island sands, are generally not preserved in the Miocene sequences in Maryland and Virginia. In New Jersey, however, the Cohansey Formation and updip parts of the Kirkwood Formation have cotnplexly interbedded sediments fron1 fluvialdeltaic, coastal, and inner-shelf depositional environments. Several of the component members of the Miocene sequences are thick marine silts that act as confining layers; for example, in southern Maryland, the Calvert Formation is predominantly a tight clay that may be 60 m thick beneath parts of the Middle Coastal Plain (Otton, 1955) (plates 2 and 3, this report).
The most extensive marine flooding of the MidAtlantic Coastal Plain in the last 5 million years occurred in the early Pliocene Epoch. This regional transgressive event deposited the marine sediments of the Yorktown Formation in Virginia and the Albemarle Embayn1ent of North Carolina and the correlative Duplin Formation across the crest of the Cape Fear Arch in southern North Carolina (Ward and Blackwelder, 1980). During this time. however. the Coastal Plain in Maryland, the central Delmarva Peninsula, and New Jersey was elevated, possibly by tectonic uplift, and
lower Pliocene marine sediments were not derosited (or were not preserved) in these areas. Upper F,iocene fluvial-deltaic, marine-deltaic, and estuarine tc shallow-marine deposits are represented by the Beaverdam Formation on the Delmarva Peninsula (Owens and Denny, 1979), the Bacons Castle and Chowan River Formations in Virginia and northern North Carolina (Mixon and others, 1989), and the Bear Bluff Fom1ation in southern North Carolina (Owens, 1989). The Windsor Formation that extends from Virginia into North Carolina (Oaks and Coch, 1973) and the Waccamaw Formation in southern North Carolina (D~1Bar and others, 1974; Owens, 1989) straddle the boundary between late Pliocene and early Pleistocene (plate 2).
Several periods of deposition of coarse fluvial material onto the Coastal Plain were interspersed among the marine flooding events of the last 10 million years; these include the Bridgeton Formation (upper Miocene) in southern New Jersey, the Brandywine (or Upland) Gravels (Upper Miocene/Lower Plioc~ne) in southern Maryland, and the Columbia Formathn (upper Pliocene /lower Pleistocene) in Delaware (plate 2). Although the Mid-Atlantic Coastal Plain was not glaciated, some of these large fluvial deposits were probably derived from the outwash of continertal glaciers transported down the major rivers and de~osited as extensive sheets of sands and gravels (Owens and Denny, 1979; Owens and Minard, 1979; Newell and others, 1995, 2000).
A general lowering of sea level and high -amplitude glacial-interglacial cycles started in the late Pliocene and continued through the Quaternary (essentially the last 2.5 million years). Most of the tnodem land surface of the Coastal Plain was created and modified at this tin1e. During sea-levellowstands associated with glacial events, fluvial erosion was enhanced, and rivers and stream-drainage networks were incised (cut down). Colluviation, or the down slope transport of sediments, was active. In New Jersey and the central Delmarva Peninsula, cryoturbation- the defonnation of near-surface sediments by the formation of ke structures, such as ice wedges and permafrost- tum~d over the surficial sediments and restructured the land surface (Owens and Minard, 1979; Newell and others, 2000). Periods of aridity allowed inland dunes and dune fields to fonn where sandy soils were not held in place by vegetation (Owens and Minard, 1979; Trapp, 1992)
APPENDIX 2 - Geologic Setting of the Mid-Atlantic Coastal PIC~in 41

During the initial phase of each sea-level rise,
river base levels rose and alluvial sediments aggraded
to partly fill the incised valleys. As the transgression
progressed, the valleys flooded to form estuaries; the
ocean shoreline moved landward and shoreface erosion
planed off and redistributed the sediments of the previ
ously exposed Coastal Plain. At the peak of each high
stand, the landward advance of the ocean shoreline was
halted, the barrier islands prograded seaward to form
wide sand ridges, and the inner shelf aggraded. The
estuaries filled with organic-rich muds, with local
deposits of muddy sands in shallow water, and
expanded by lateral erosion of the banks to form the
river-parallel scarp and terrace sets. If the river systems draining the Piedmont and the Blue Ridge and Appala
chian Mountains transported sufficient sediment, flu
vial deltas prograded into the heads of the estuaries.
Delta progradation occurred repeatedly during the
Pliocene and Pleistocene in North Carolina, forming a
series of deltas that are preserved in topographic relief
on the Middle Coastal Plain; examples include the
Pliocene Roanoke Delta immediately south of the Vir
ginia-North Carolina border, and the upper Pliocene I lower Pleistocene Tar River Delta, which is the large
wedge-shaped feature in central North Carolina that is
bisected by the modem Tar River.
The Piedmont-Coastal Plain Transition (The Fall Zone)
The transition between the Coastal Plain and
Piedmont Provinces along the Fall Zone is characterized by relatively old, deeply weathered sediments.
Precipitation typically infiltrates and flows quickly
along short ground-water flowpaths to local streams in
this area of highly permeable sands and gravels and
considerable relief (McFarland, 1997). Isolated coarse
sands and gravels cap the interfluves (hills that are ero
sional remnants between stream drainage systems) just
west of the Fall Zone along much of the Mid-Atlantic Coastal Plain (Pazzaglia, 1993). The oldest of these
remnant gravels are estimated to be middle Miocene
and Pliocene in age (Mixon and others, 1989); any
older deposits appear to have been completely removed
by erosion.
Weathering of Surficial Units
The character of the surficial aquife~ is related to the original lithology and post -deposition weathering of its composite sediments. The leaching and alteration of surficial sediments to form less-reactiv~ hydrated and oxidized minerals is critical to the geochemical and hydrologic characteristics of the aquifer. Regional trends in the depth and extent of weatherirg are related to modem climate, paleoclitnate (particularly clin1atic extremes such as cryoturbation during pe:--iglacial conditions and the formation of inland dunes during extreme aridity), and the age and length of exposure of the sediments. Surficial sediments are generally more deeply weathered in the southern part of the MidAtlantic Coastal Plain and in areas with greater relief. The modem climatic transition in northern North Carolina from humid temperate (to the north) to humid subtropical coincides with an increase in weathering. In the Southeast, streams typically carry gre"'ter loads of suspended sediments and soil profiles are generally deeper than in units of equivalent age farther north (Owens and others, 1983).
References
Cleaves, E.T., Edwards, Jonathan, and Glaser, J.D .. 1968, Geologic map of Maryland: Maryland G~ological Survey, 1 sheet, scale 1:250,000.
Colquhoun, D.J., Johnson, G.H., Peebles, P.C., Huddlestun, P.F., and Scott, Thomas, 1991, Quaternary geology of the Atlantic Coastal Plain: New Jersey, G~lmarva Peninsula, western shore of Maryland, Virginia, and North Carolina, Cape Fear Arch, northeastern South Carolina, central South Carolina, Georgia, Florida, in Morrison, R.B., ed., Quaternary nonglacial geology; Conterminous U.S., The Geology ofNorthAmerica Volume K-2: Boulder, Colorado, Geological Society cf America, p. 629-650.
DuBar, J.R., Johnson, H.S., Jr., Thorn, B.G., r.11d Hatchell, W.O., 1974, Neogene stratigraphy and morphology, south flank of the Cape Fear arch, North and South Carolina, in Oaks, R.Q., Jr., and DuBar, J.R., PostMiocene Stratigraphy, Central and Soutrern Atlantic Coastal Plain: Logan, Utah, Utah State University Press, p. 139-173.
Fenneman, N.M., 1938, Physiography of the eastern United States: New York, McGraw-Hill, 714 p.
Gohn, G.S., 1988, Late Mesozoic and early Cenozoic geology of the Atlantic Coastal Plain: North Carolina to Florida, in Sheridan, R.E., and Grow, J.A., eds., The Atlantic Continental Margin, U.S.: Boulder, Colorado,
42 A Surficial Hydrogeologic Framework for the Mid-Atlantic Coastal Plain

Geological Society of America, Geology of North America, v. 1-2, p.l07-130.
Hansen, H.J., 1968, Geophysical log cross-section network of the Cretaceous sediments of southern Maryland: Maryland Geological Survey Report of Investigations No.7, 46 p.
Jordan, R.R., 1983, Stratigraphic nomenclature of nonmarine Cretaceous rocks of inner margin of Coastal Plain in Delaware and adjacent states: Delaware Geological Survey Report of Investigations No. 37, 43 p.
McCartan, Lucy, Newell, W.L., Owens, J.P., and Bradford, G .M., 1995, Geologic map and cross sections of the Leonardtown 30 x 60-minute quadrangle, Maryland and Virginia: U.S. Geological Survey Open-File Report 95-665, 1 sheet, scale 1: 100,000.
McFarland, E.R., 1997, Hydrogeologic framework, analysis of ground-water flow, and relations to regional flow in the Fall Zone near Richmond, Virginia: U.S. Geological Survey Water-Resources Investigations Report 97-4021, 56 p.
Mixon, R.B., Berquist, C.R., Newell, W.L., Johnson, G.H., Powars, D.S., Schindler, J.S., and Rader, E.K., 1989, Geologic map and generalized cross sections of the Coastal Plain and adjacent parts of the Piedmont, Virginia: U.S. Geological Survey Miscellaneous Investigations Series Map I-2033, 2 sheets, scale 1:250,000.
Newell, W.L., Pavich, M.J., ProwelL D.C., and Markewich, H.W., 1980, Surficial deposits, weathering processes, and evolution of an inner Coastal Plain landscape, Augusta, Georgia, in Frey, R.W., ed., Excursions in southeastern geology: Falls Church, Virginia, American Geological Institute, p. 527-544.
Newell, W.L., Powars, D.S., Owens, J.P., and Schindler, J.S., 1995, Surficial geological map of New Jersey: southern sheet (primary map): U.S. Geological Survey OpenFile Report 95-272, scale 1:100,000.
Newell, W.L., Powars, D.S., Owens, J.P., Stanford, S.D., and Stone, B.D., :WOO, Surficial geologic map of central and southern New Jersey: U.S. Geological Survey Miscellaneous Investigations Series Map I-2450-D, 3 sheets, 1 pamphlet, scale 1:100,000.
North Carolina Geological Survey, 1985, Geologic map of North Carolina: North Carolina Department of Natural Resources and Community Development, 1 sheet, scale 1:500,000.
Oaks, R.Q., Jr., and Coch, N.K., 1973, Post-Miocene stratigraphy and morphology, southeastern Virginia: Virginia Division of Mineral Resources Bulletin No. 82, 135 p.
Otton, E.G., 1955, The water resources of the Southern Maryland Coastal Plain: Maryland Department of Geology, Mines, and Water Resources Bulletin 15, 34 7 p.
Owens, J.P., 1989, Geologic map of the Cape Fear region, Florence 1 degree x 2 degrees quadrangle and northern half of the Georgetown 1 degree x 2 degrees quadran-
gle, North Carolina and South Carolina: U.S. Geological Survey Miscellaneous Investigations Series Map I-1948-A, 1 sheet, scale 1:250,000.
Owens, J.P. and Denny, C.S., 1979, Upper Cenozoic ceposits of the central Delmarva Peninsula, Maryland ard Delaware: U.S. Geological Survey Professional Paper 1067-A, 28 p.
Owens, J.P., and Gohn, G.S., 1985, Depositional his'"<Jry of the Cretaceous Series in the United States Atlantic Coastal Plain: Stratigraphy, paleoenvironments, and tectonic controls of sedimentation, in Poag, C.Vl. (ed.), Geological Evolution of the United States Atlantic Margin: New York, Van Nostrand Reinhold, p. 25-86.
Owens, J.P., Hess, M.M., Denny, C.S., and Dwornik. E.J., 1983, Postdepositional alteration of surface anc nearsurface minerals in selected Coastal Plain formations of the Middle Atlantic States: U.S. Geological Survey Professional Paper 1067-F, 45 p.
Owens, J.P., and Minard, J.P., 1979, Upper Cenozoic sediments of the lower Delaware Valley and the northern Delmarva Peninsula, New Jersey, Pennsylvania, Delaware, and Maryland: U.S. Geological Survey p~ofessional Paper 1067-D, 47 p.
Owens, J.P., Sugarman, P.J., Sohl, N.F., Parker, R.A., Houghton, H. F., Volkert, R.A., Drake, A.A., and Orndorff, R.C., 1999, Bedrock geologic map of central and southern New Jersey: U.S. Geological Survey Miscellaneous Investigations Series Map I-2540-B, 2 sheets, scale 1: 100,000.
Pazzaglia, F.J., 1993, Stratigraphy, petrography, and correlation of late Cenozoic Middle Atlantic Coastal Fl ain deposits: Implications for late-stage passive-mrrgin geologic evolution: Geological Society of America Bulletin, v. 105, no. 12, p. 1,617-1,634.
Poag, C.W., 1985, Depositional history and stratigraphic reference section for central Baltimore Canyon trcugh, in Poag, C.W. (ed.), Geological Evolution of the United States Atlantic Margin: New York, Van Nostran1. Reinhold, p. 217-264.
__ 1996, Structural outer rim of Chesapeake Bay impact crater- Seismic and borehole evidence: Meteoritics and Planetary Science, v. 31, p. 218-226.
Powars, D.S., 2000, The effects of the Chesapeake Fay impact crater on the geologic framework and the correlation of hydrogeologic units of southeastern Virginia, south of the James River: U.S. Geological Survey Professional Paper 1622, 53 p. Also at http:// pubs. usgs.gov /prof/p 1622/.
Powars, D.S., and Bruce, T.S., 1999, The effects oftre Chesapeake Bay impact crater on the geological franework and correlation of hydrogeologic units of the lower York -James Peninsula, Virginia: U.S. Geological Survey Professional Paper 1612, 82 p.
Sohl, N.F., and Owens, J.P., 1991, Cretaceous stratigraphy of the Carolina Coastal Plain, chap. 11 ofHorton, J.W., Jr.,
APPENDIX 2 - Geologic Setting of the Mid-Atlantic Coastal Plein 43
and Zullo, V.A., eds., The Geology of the Carolinas: University o( Tennessee Press, p. 191-220.
Soller, D.R., and Mills, H.H., 1991, Surficial geology and geomorphology, chap.17 ofHorton, J.W., Jr., and Zullo, V.A., eds., The Geology of the Carolinas: University of Tennessee Press, p. 290-308.
Trapp, Henry, 1992, Hydrogeologic framework of the northem Atlantic coastal plain in parts of North Carolina, Virginia, Maryland, Delaware, New Jersey, and New York: U.S. Geological Survey Professional Paper 1404-G, 59p.
Vroblesky. D.A .. and Fleck, W.B., 1991, Hydrogeologic framework ofthe Coastal Plain of Maryland, Delaware, and the District of Columbia: U.S. Geological Survey Professional Paper 1404-E, 45 p.
Ward, L.W., 1985, Stratigraphy and characteristic mollusks of the Pamunkey Group (Lower Tertiary) and the Old Church Fonnation of the Chesapeake Group - Virginia Coastal Plain: U.S. Geological Survey Professional Paper 1346, 78 p.
Ward, L.W., Bailey, R.H., and Carter, J.G., 1991, Pliocene and Early Pleistocene stratigraphy, depositional history, and Molluscan paleobiogeography of the Coastal Plain:
chap.16 ofHorton, J.W., Jr., and Zullo, V.A., eds., The Geology of the Carolinas: Knoxville, Tennessee, University of Tennessee Press, p. 274-289.
Ward, L.W. and Blackwelder, B.W., 1980, Stratigraphic revision of Upper Miocene and Lower Pliocene beds of the Chesapeake Group, Middle Atlantic Coastal Plain: U.S. Geological Survey Bulletin 1482-D, 61 p., 5 pls.
Ward, L.W., Lawrence, D.R., and Blackwelder, B.W., 1978, Stratigraphic revision of the middle Eocer~. Oligocene and lower Miocene -Atlantic Coastal Plain of North Carolina: U.S. Geological Survey Bulletin 1457-F, 23 p.
Ward, L.W., and Strickland, G.L., 1985, Outline of Tertiary stratigraphy and depositional history of tre U.S. Atlantic Coastal Plain, in Poag, C.W. (ed. ), Geological Evolution of the United States Atlantic Margh: New York, Van Nostrand Reinhold, p. 87-123.
Winner, M.D., Jr., and Coble, R.W., 1996, Hyc1'"ogeologic framework of the North Carolina Coastal Plain: U.S. Geological Survey Professional Paper 1404-1, 106 p.
Zapecza, O.S., 1989, Hydrogeologic framework of the New Jersey Coastal Plain: U.S. Geological Survey Professional Paper 1404-B, 49 p.
44 A Surficial Hydrogeologic Framework for the Mid-Atlantic Coastal Plain
G:l}: u.s. GOVERNMENT PRINTING OFFICE: 2005-534-552


