Louisiana State University LSU Digital Commons LSU Historical Dissertations and eses Graduate School 1968 A Survey and Analysis of the Taxation of Basic Natural Resources in the States of Arkansas, Louisiana, Michigan and Texas. James Frederick Butler Louisiana State University and Agricultural & Mechanical College Follow this and additional works at: hps://digitalcommons.lsu.edu/gradschool_disstheses is Dissertation is brought to you for free and open access by the Graduate School at LSU Digital Commons. It has been accepted for inclusion in LSU Historical Dissertations and eses by an authorized administrator of LSU Digital Commons. For more information, please contact [email protected]. Recommended Citation Butler, James Frederick, "A Survey and Analysis of the Taxation of Basic Natural Resources in the States of Arkansas, Louisiana, Michigan and Texas." (1968). LSU Historical Dissertations and eses. 1473. hps://digitalcommons.lsu.edu/gradschool_disstheses/1473
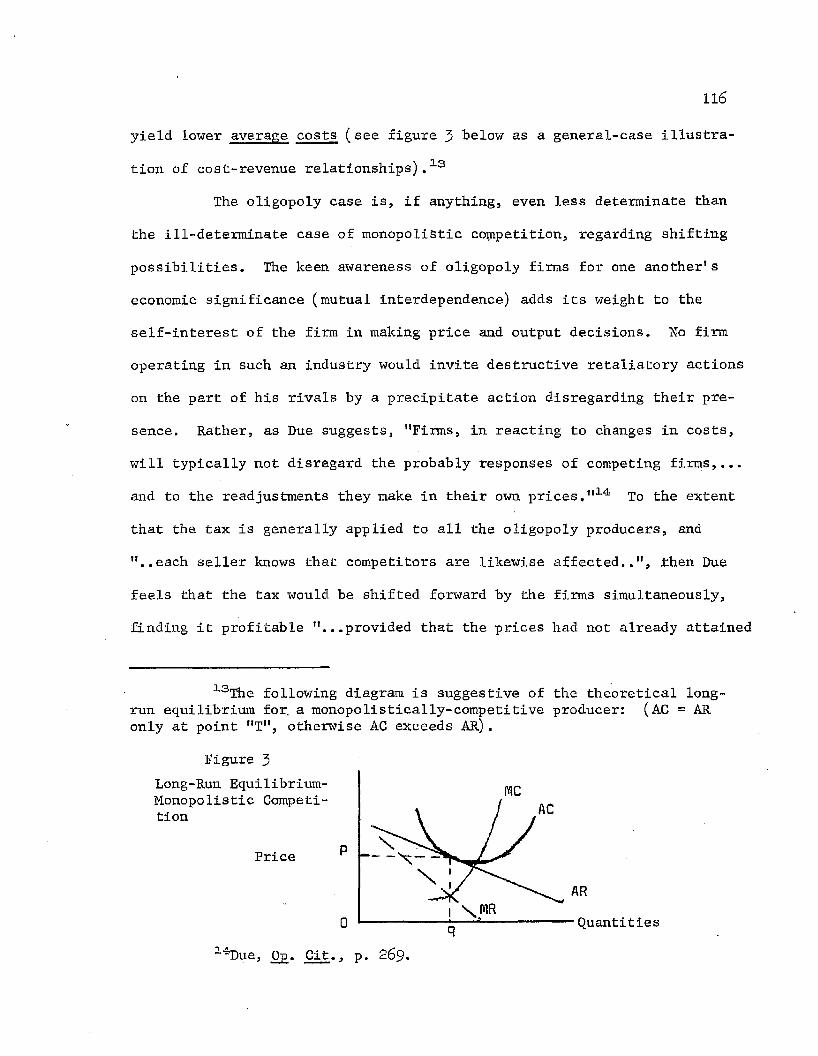
Transcript
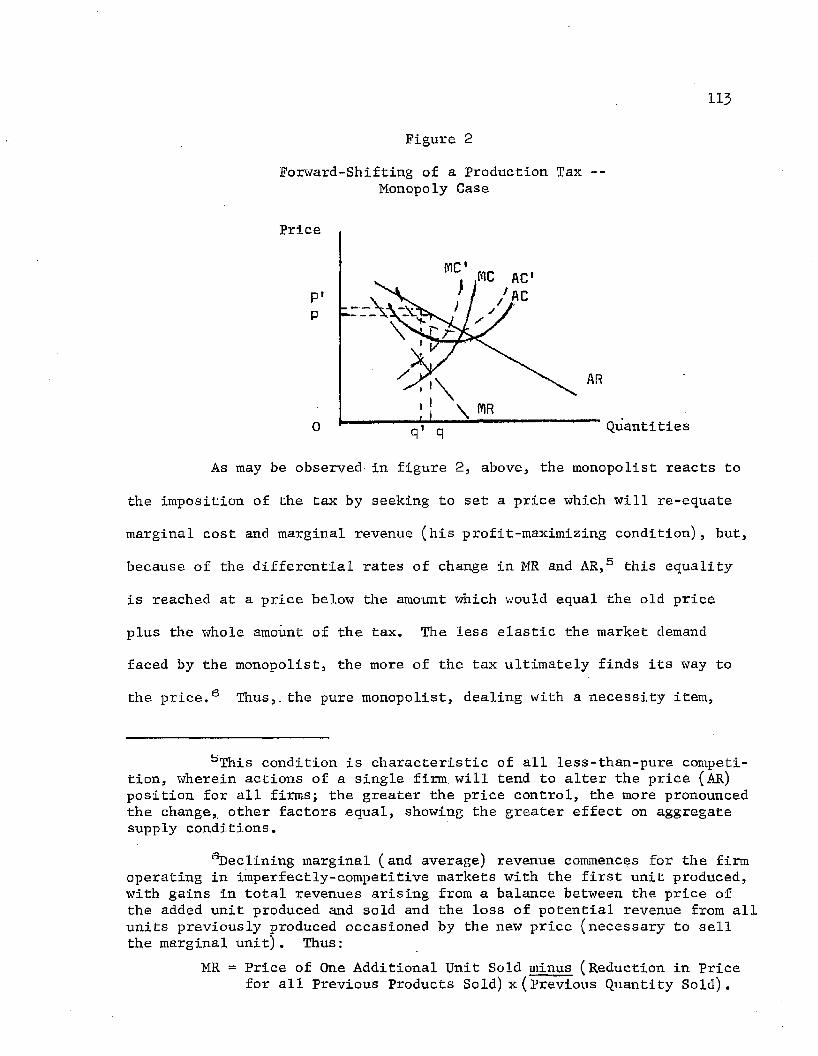
Louisiana State UniversityLSU Digital Commons
LSU Historical Dissertations and Theses Graduate School
1968
A Survey and Analysis of the Taxation of BasicNatural Resources in the States of Arkansas,Louisiana, Michigan and Texas.James Frederick ButlerLouisiana State University and Agricultural & Mechanical College
Follow this and additional works at: https://digitalcommons.lsu.edu/gradschool_disstheses
This Dissertation is brought to you for free and open access by the Graduate School at LSU Digital Commons. It has been accepted for inclusion inLSU Historical Dissertations and Theses by an authorized administrator of LSU Digital Commons. For more information, please [email protected].
Recommended CitationButler, James Frederick, "A Survey and Analysis of the Taxation of Basic Natural Resources in the States of Arkansas, Louisiana,Michigan and Texas." (1968). LSU Historical Dissertations and Theses. 1473.https://digitalcommons.lsu.edu/gradschool_disstheses/1473
This dissertation has been microfilmed exactly as received 69-4456
BUTLER, James Frederick, 1934- A SURVEY AND ANALYSIS OF THE TAXATION OF BASIC NATURAL RESOURCES IN THE STATES OF ARKANSAS, LOUISIANA, MICHIGAN AND TEXAS.
Louisiana State University and Agricultural andMechanical College, Ph.D., 1968 Economics, finance
University Microfilms, Inc., Ann Arbor, Michigan
A SURVEY AND ANALYSIS OF THE TAXATION OF BASIC NATURAL RESOURCES IN THE STATES OF ARKANSAS, LOUISIANA, MICHIGAN AND TEXAS
A Dissertation
Submitted to the Graduate Faculty of the Louisiana State University and
Agricultural and Mechanical College - - in partial fulfillment of the
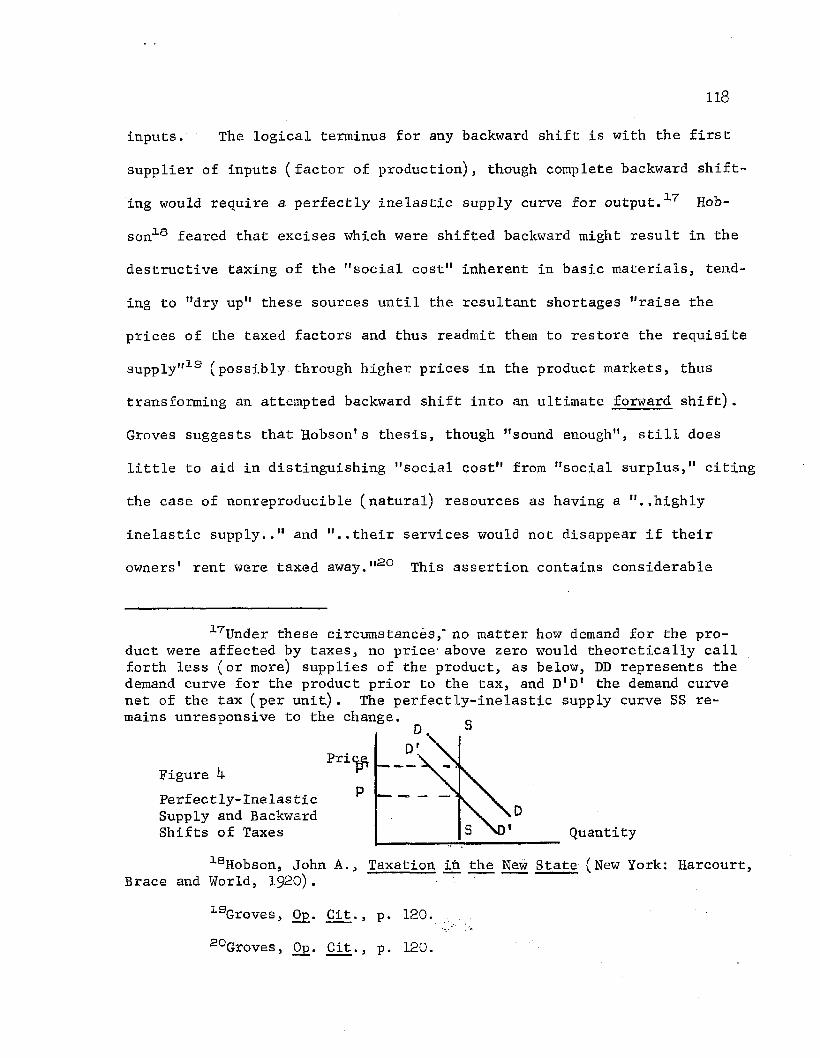
requirements for the degree of Doctor of Philosophy
in
The Department of Economics
byJames Frederick Butler
B.A., Arkansas State Teachers College, 1955 M.B.A., University of Arkansas, 1958
August, 1968
ACKNOWLEDGMENTS
Special appreciation is expressed to Dr. Bernard F. Sliger,
Dean of Academic Affairs, and formerly Chairman of the Department of
Economics, Louisiana State University, Baton Rouge, for his inspirational
direction in the conception and development of the subject of the study.
His expression of confidence in the writer was largely responsible for
the successful completion of the task.
Grateful acknowledgment is also expressed to Professor W. J.
Truitt for his unselfish and invaluable aid in- the preparation of the
work throughout its development. The suggestions and counsel provided
by Professor Truitt frequently provided both challenge and meaning for
the various phases of the study.
Appreciation is also expressed to the remaining members of the
dissertation committee: Dr. Jan Duggar, Dr. P. F. Boyer, Dr. James P.
Payne, and Dr. R. F. Smith. In all matters surrounding the preparation
of the study, these gentlemen were both helpful and generous at all times.
Finally, the writer wishes to thank the officials of the var
ious public agencies in the survey states for their cooperation and
assistance in providing records, reports and information used in the
preparation of this study,, Without their cooperation, much practical
insight into operations and problems of policy would have been lost to
the study.
ii
FOREWORD
Although the following study is intended to have general appli
cations to the subject of resource taxation, four states are selected
for detailed consideration -- Arkansas, Louisiana, Michigan and Texas.
The bases for these selections should be noted for the information of the
reader.
Michigan appears, not because she is a leader in the collection
of resource taxes, but because she was a pioneer in the development of
special forest taxation. Her system of forest taxation represents one
of the most sophisticated structures of special taxes in this resource
area.Arkansas and Louisiana exemplify those states who have adopted
extensive applications of resource taxes, especially severance taxes.
Texas and Louisiana are the leading states in volume of re-
source-tax yields, and are among the few states in which resource taxes
account for a substantial percentage of total tax collections.
A varied portrayal of resouree-tax applications and policicies
is gained from the consideration of these states. Although the four
states could be hardly called a "cross-section” of states applying re
source taxes, their cases do run a broad spectrum of applications and
yields for this type of tax.
iii
TABLE OF CONTENTS
Chapter Page
I. Introduction: Special Aspects and Policy Problemsof Resource Taxation.................................... 1
Taxes Levied Against Natural ResourcesPolicy Problems: Some Significant Considerations
II. Economic Significance of Resource Industries for theSurvey States................ pO
Timber and Forest Products Mineral Resources Fisheries
III. Taxation I: Renewable Resources........................... J2
Forest Taxation Fisheries Taxation
IV. Taxation II: Mineral Taxation............................. 89
Mineral FuelsMetals and Other MineralsNontax Revenues: Leases and Royalties
V. Notes on Shifting, Incidence and Effects................ 109
Basis for Tax Shifting Property-Tax Shifting and Incidence Severance-Tax Shifting and Incidence Effects of Resource-lax Shifting
VI. Summary, Evaluations and Conclusions........................ 14^
Fiscal Significance of Resource Taxes Policy Effectiveness Examined Suggestions for Modification of Taxes General Summary
1. State Severance Tax Collections, 19^5................... k
2. Land Areas in the Survey States.......................... 31
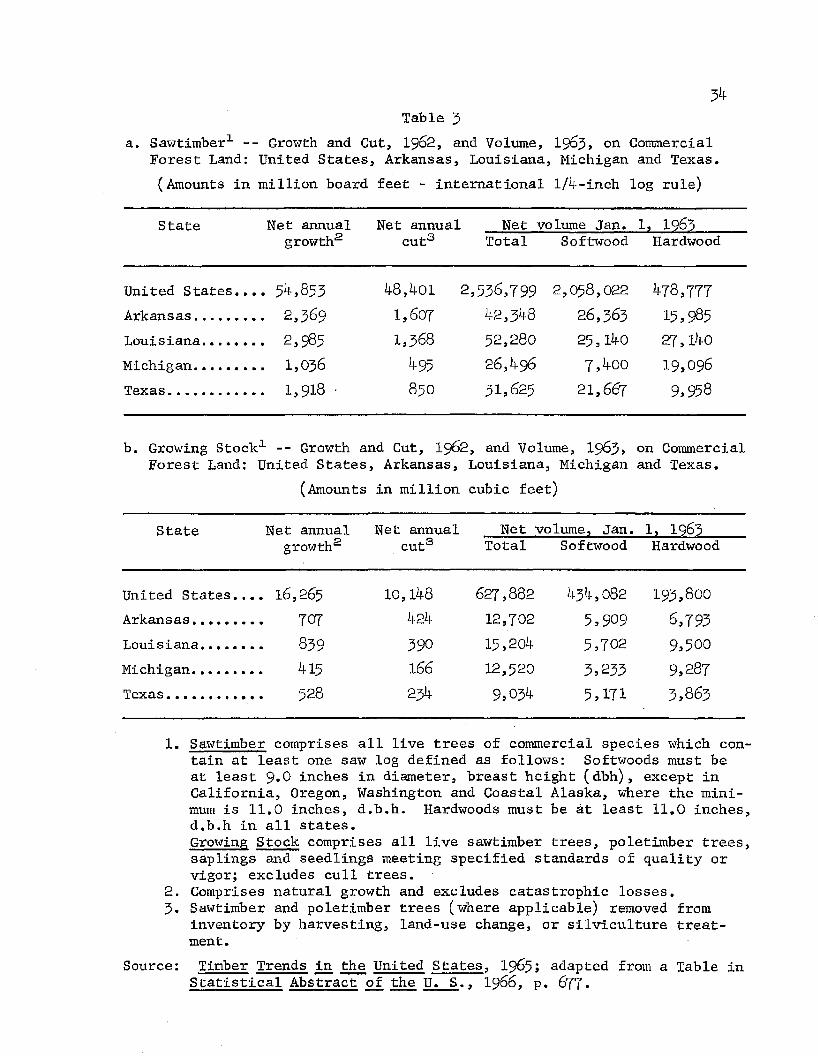
3 . Sawtimber and Growing Stock in the Survey States:Growth and Cut, 1962, and Net Volume, I963.a. Sawtimber............................................ 3kb. Growing Stock........................................ 3kc. Growth and Cut Compared............................. k3
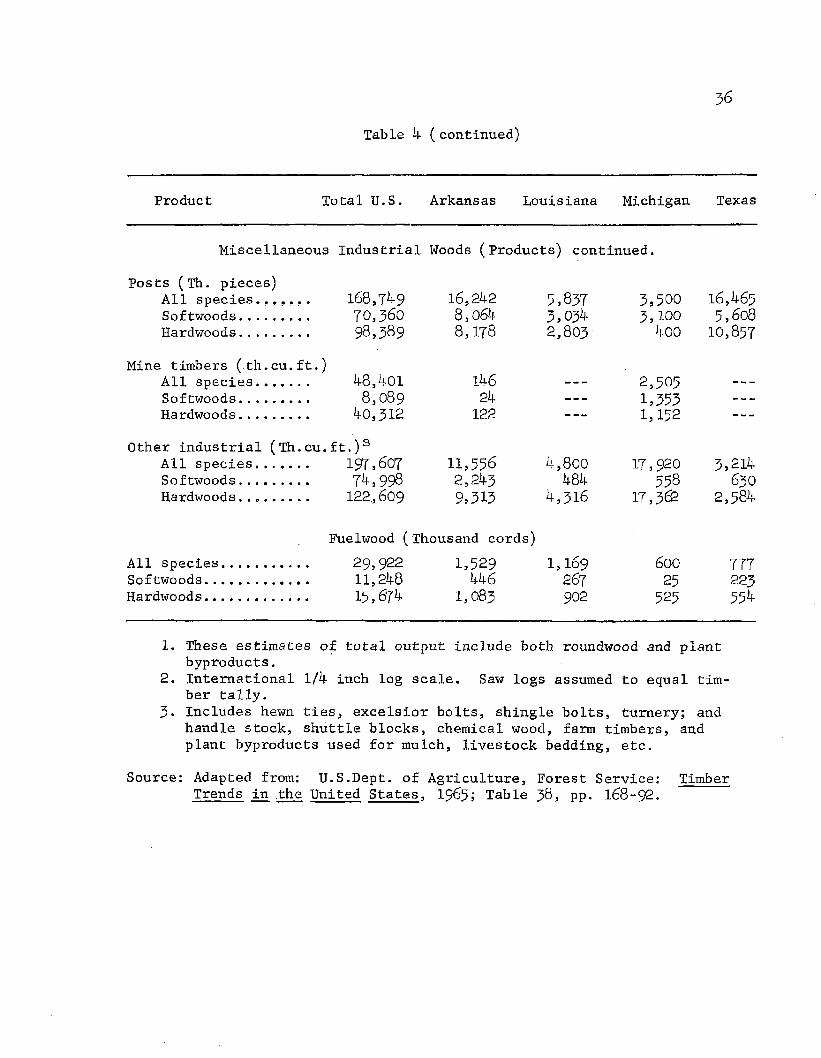
k. Output of Timber Products in the Survey States, 1962..... 35
3 . Forest-Land Ownership by Class of Owner, SurveyStates and United States Total, 1962................... 39
5b.Percentage Distribution of Ownerships.................... kO
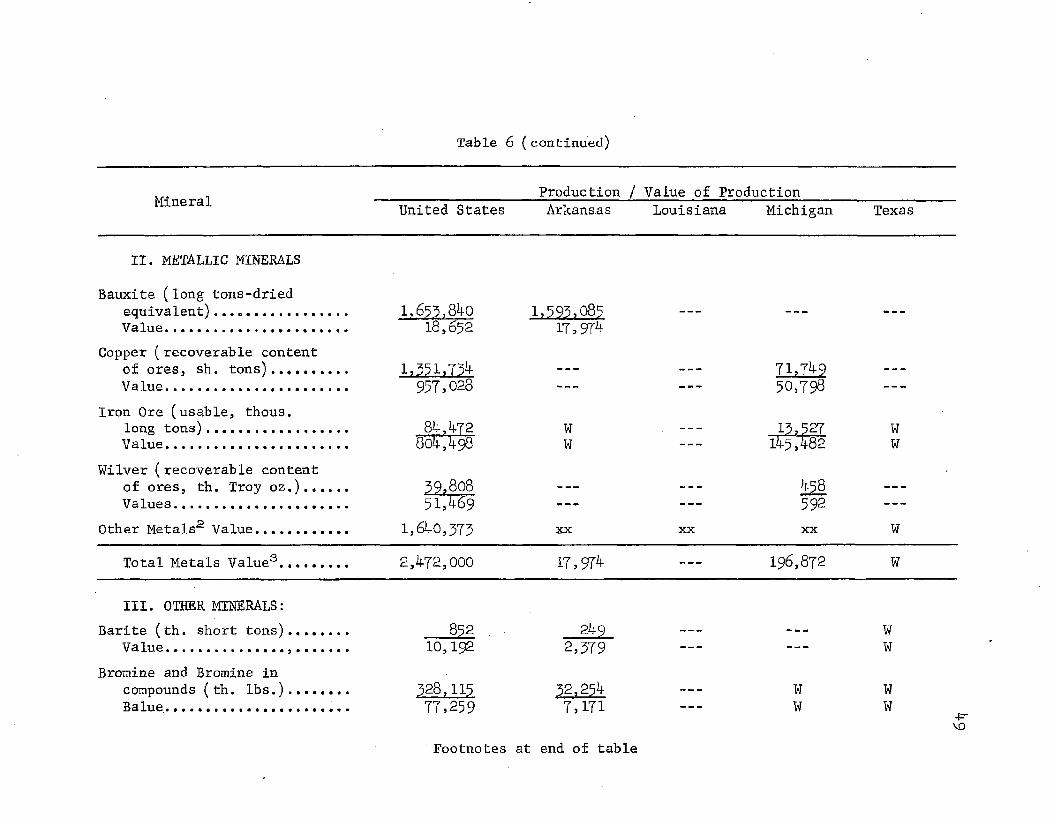
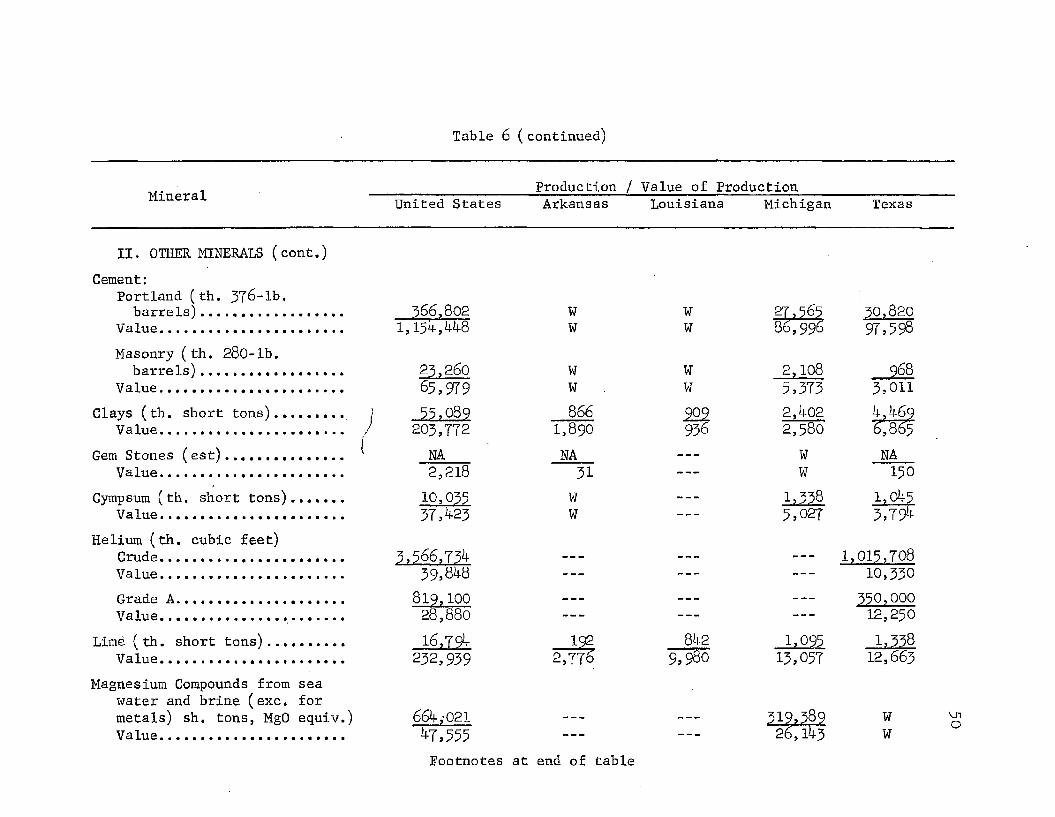
6. Mineral Production: U.S. and Survey States, 1965......... k87 . Estimated Proved Recoverable Reserves of Natural Gas:
Survey States and United States, 1965.................. 55
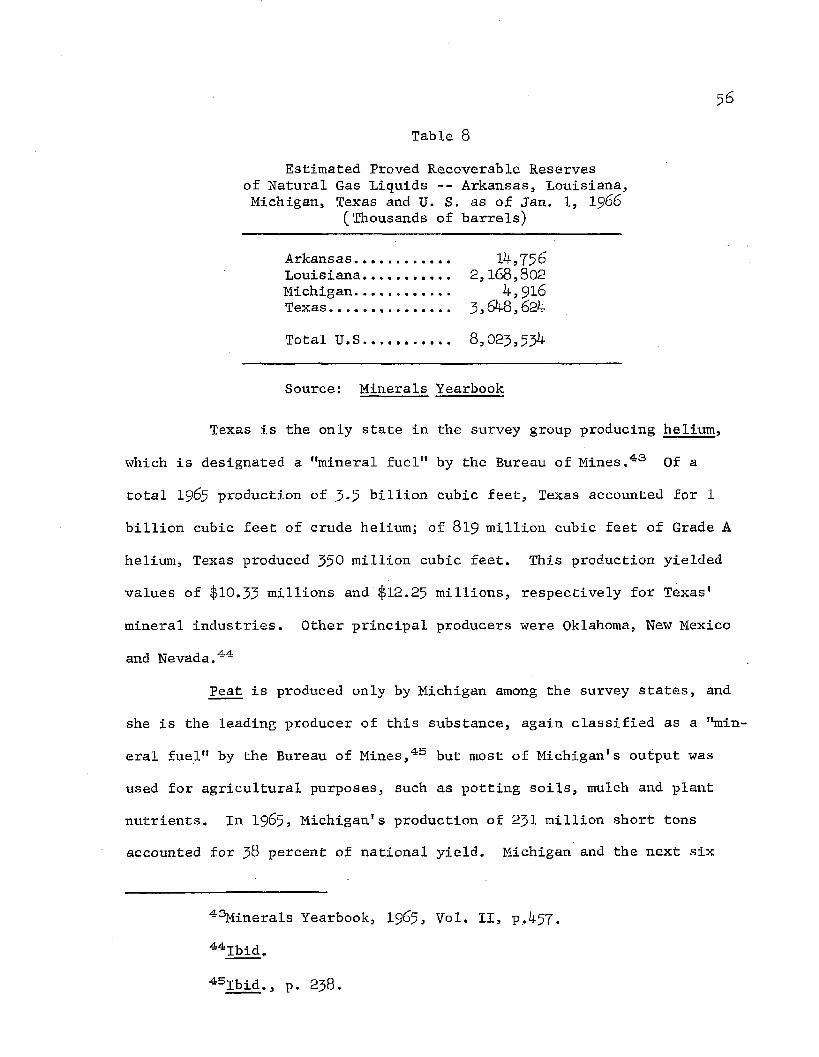
8. Estimated Proved Recoverable Reserves of Natural-GasLiquids: Survey States and United States, 19&5........ 56
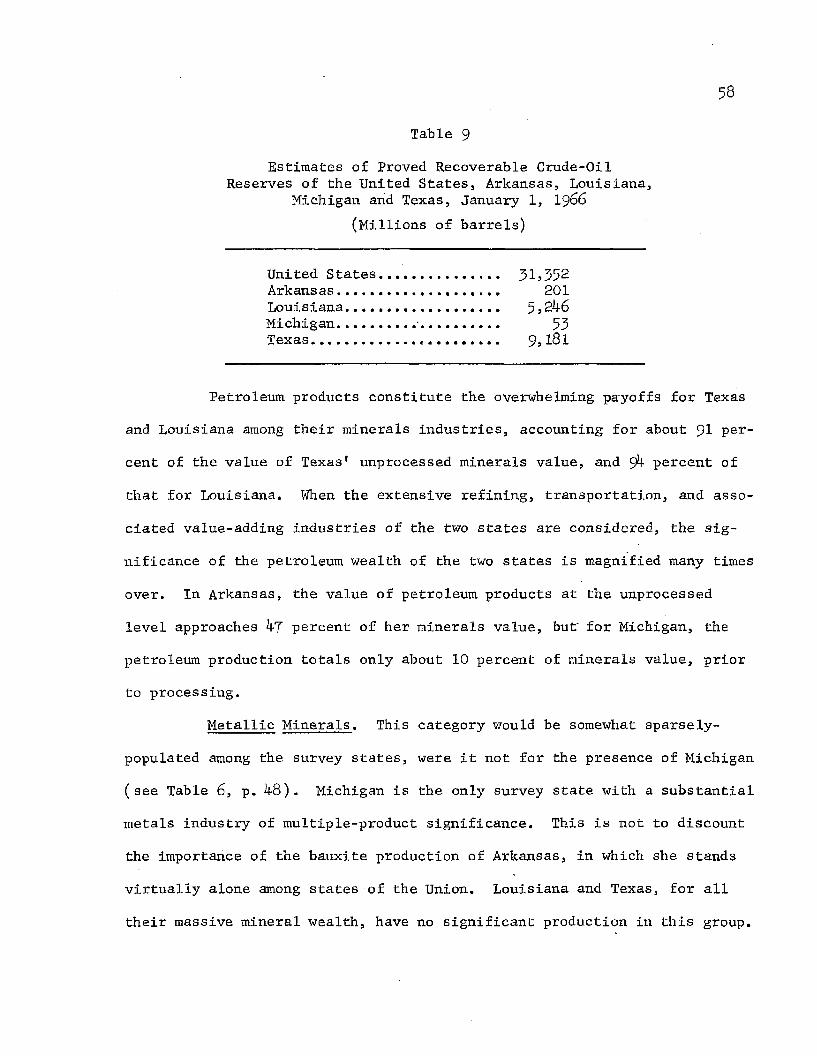
9- Estimated Proved Recoverable Reserves of Crude Oil:Survey States and United States, 19&5.................. 58
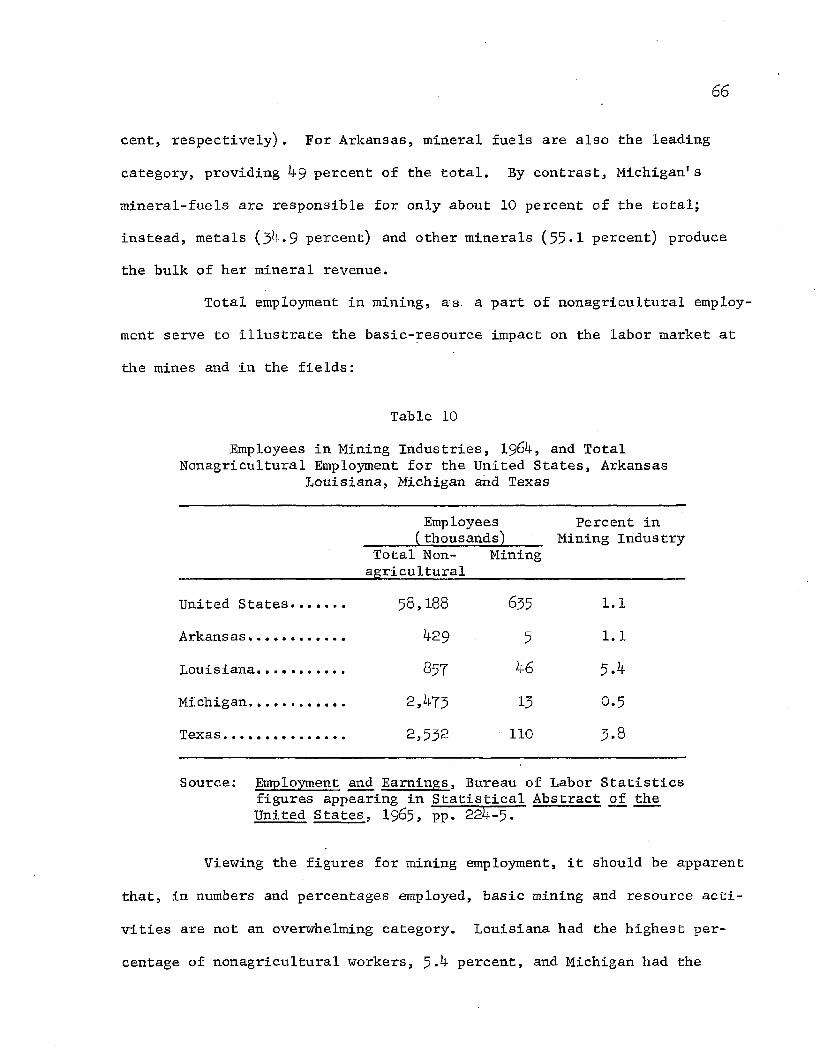
10. Employees in Mining Industries, 196k, and Total Non-agricultural Employment: U.S. and Survey States....... 66
11. Summary of Fisheries Operations, 198k, for the SurveyStates.............. ..... .............................. 69
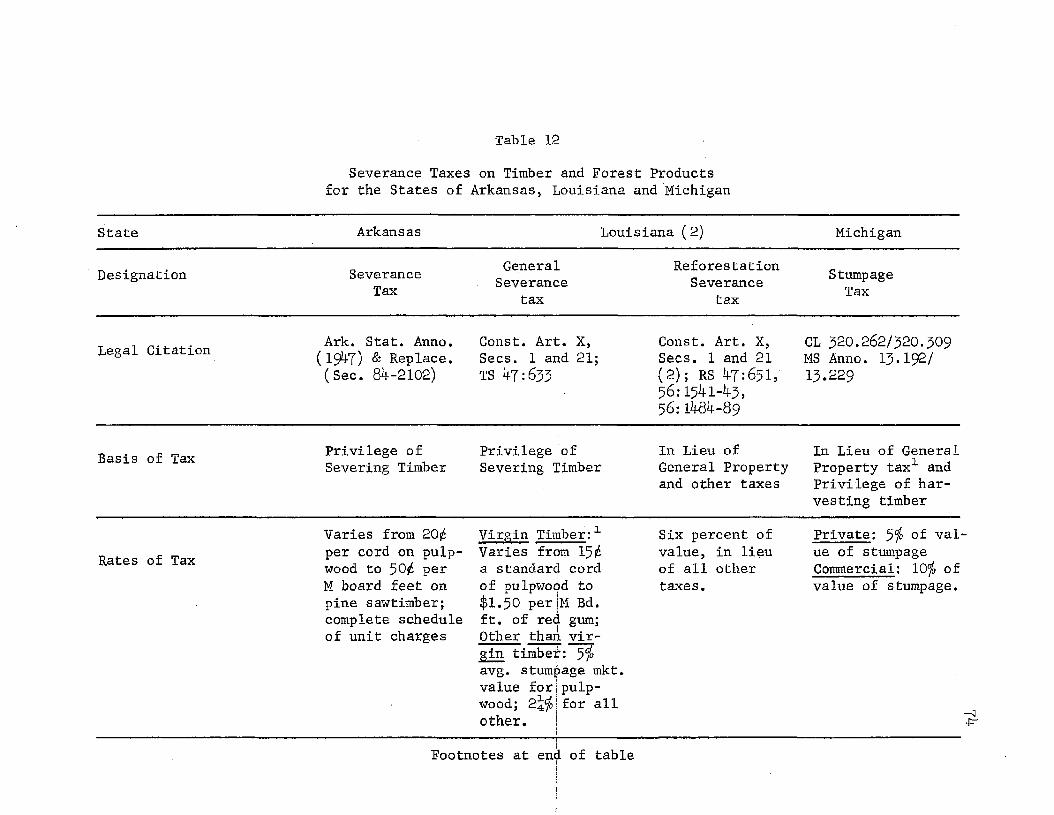
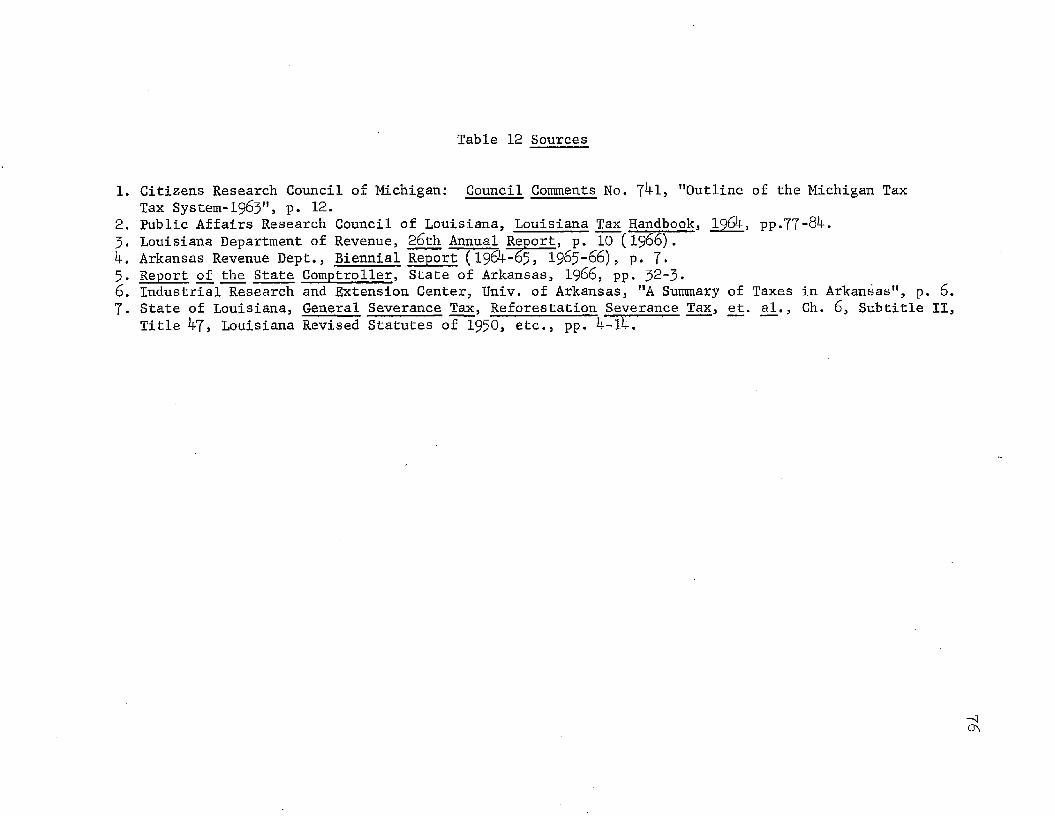
12. Severance Taxes on Timber Compared for the SurveyStates.................................................. 7k
The taxation of natural resources raises questions of policy
and application which are unique among taxes levied on production.
This is especially true at the level of basic extraction of the re
sources, and it is this level of resource taxation which is the sub
ject of this study. In addition to the usual questions of repressive
effects upon enterprise, taxation of basic resources raises questions
of conservation and the orderly exploitation of commodities which are,
by nature, subject to depletion, and often not subject to renewal by
human effort.Concern for the special problems of natural resources dates
from the Nineteenth Century in the United States, but the adoption of
special forms of taxation for basic-resource industries dates from about
1911, with the development of special types of forest taxation in the
state of Michigan, and in other areas where the timber industry has
suffered the ravages of uncontrolled logging. The so-called "yield-
tax" variation on property taxes, by which the timber owner is relieved
of part or all the annual burden of the ad valorem property tax, paying
instead a specified sum (or percentage of value) at time of harvest of
the timber, was largely developed at this time. The aim of this form
of tax was to relieve the timber owner of harsh burdens of property tax
until he was best able to pay.
Severance taxes (privilege taxes on the act of removing natural
resources from the soil or water) were developed during the 1920's, and
vii
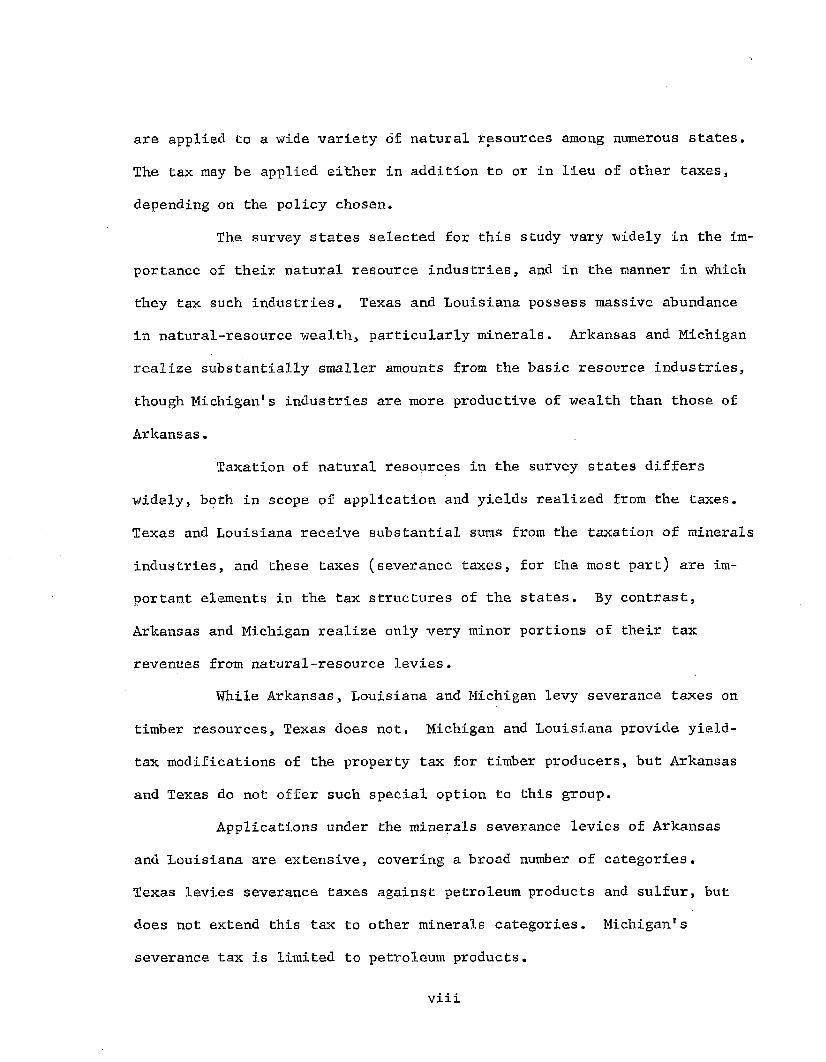
are applied to a wide variety of natural resources among numerous states.
The tax may be applied either in addition to or in lieu of other taxes,
depending on the policy chosen.
The survey states selected for this study vary widely in the im
portance of their natural resource industries, and in the manner in which
they tax such industries. Texas and Louisiana possess massive abundance
in natural-resource wealth, particularly minerals. Arkansas and Michigan
realize substantially smaller amounts from the basic resource industries,
though Michigan's industries are more productive of wealth than those of
Arkansas.
Taxation of natural resources in the survey states differs
widely, both in scope of application and yields realized from the taxes.
Texas and Louisiana receive substantial sums from the taxation of minerals
industries, and these taxes (severance taxes, for the most part) are im
portant elements in the tax structures of the states. By contrast,
Arkansas and Michigan realize only very minor portions of their tax
revenues from natural-resource levies.While Arkansas, Louisiana and Michigan levy severance taxes on
timber resources, Texas does not. Michigan and Louisiana provide yield-
tax modifications of the property tax for timber producers, but Arkansas
and Texas do not offer such special option to this group.
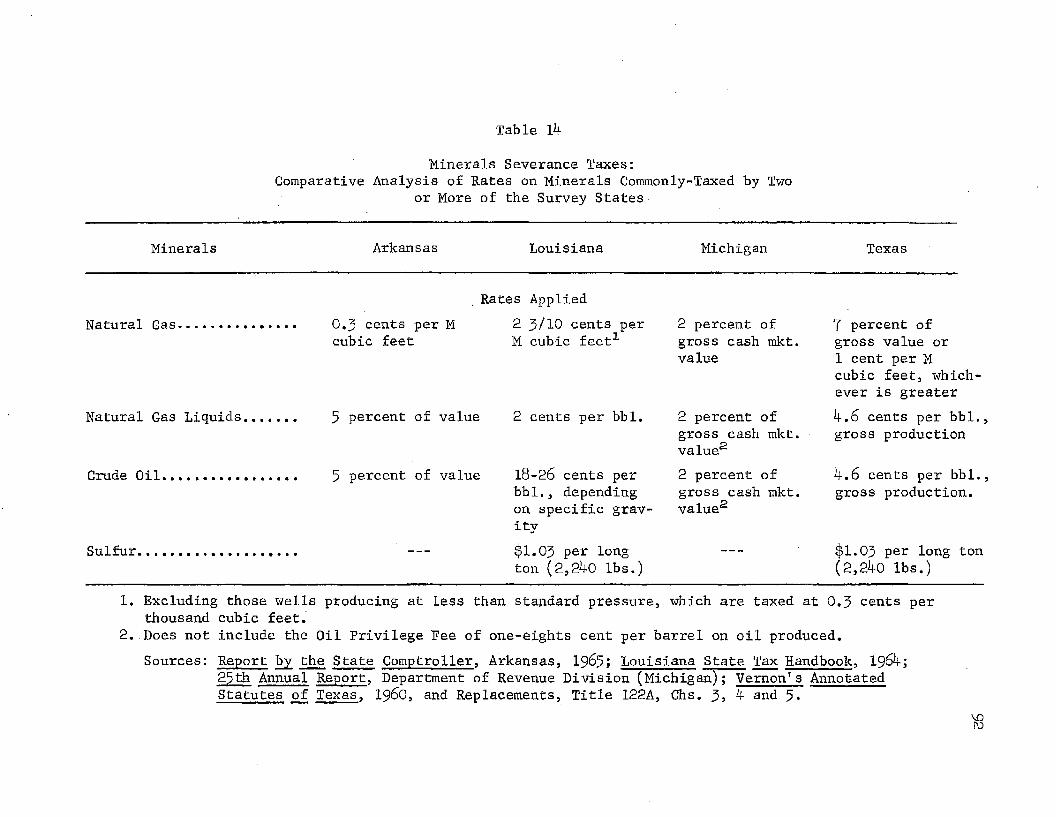
Applications under the minerals severance levies of Arkansas
and Louisiana are extensive, covering a broad number of categories.
Texas levies severance taxes against petroleum products and sulfur, but
does not extend this tax to other minerals categories. Michigan's
severance tax is limited to petroleum products.
viii
The study seeks to analyze patterns of shifting, incidences
and effects for severance taxes, noting the nature of market structures
in which the products are traded, and the economic power of owners,
developers and processors as pertinent factors in determining these
patterns.
CHAPTER I
INTRODUCTION: SPECIAL ASPECTS AND POLICY PROBLEMSIN THE TAXATION OF NATURAL RESOURCES
"The value of land....expresses the exchange value of monopoly. It is not in any case the creation of theindividual who owns the land; it is created by the growthof the community. Hence, the community can take it allwithout in any way lessening the production of wealth." 1
Thus did Henry George describe the appropriateness of a "single tax" on
the value of "land" and the economic rents derived therefrom, to the ex
clusion of all other forms of taxation. 2 The suggestion of Mr. George
notwithstanding, the tax structures of modern nations comprise a variety
of tax sources, although land taxation does appear to be virtually univer
sal as a basis for taxation. For the purposes of this study, it will be
desirable to utilize the expanded definition of "land" used by the econo
mist: that is, a term embracing all natural resources. At the same time,
it is desired to exclude the consideration of man-made improvements to the
land, such as structures, augmentations to land fertility and other things
arising out of the expended efforts of individuals. In embarking on a
study of the taxation of natural resources for the four survey states —
Arkansas, Louisiana, Michigan, and Texas — it would appear proper to
develop some criteria for judging the effectiveness of such taxation in
achieving policy goals regarded as appropriate by consensus of students
in the field of resource taxation.
1George, Henry, Progress and Poverty, Book VIII, Ch. Ill
gIbid., Book I, Ch. III.
2
With the above consideration in mind, the present chapter is de
voted to a survey of the special character of resources taxation as dis
tinguished from other taxes, and to the unique problems associated with
this form of taxation. The subject of "land" taxation, as it applies to
natural resources, has become substantially more complex and difficult in
practice than Mr. George may have anticipated when he said:3
"...With perhaps the exception of certain licenses and stamp duties...which can be relied on for only a trivial amount of revenue, a tax upon land values can, of all taxes, be most easily and cheaply collected. For land cannot be hidden or carried off, its value can be readily ascertained, and the assessment once made, nothing but a receiver is required for collection."
A. Taxes Applied to Natural Resource Industries:Severance, Yield and Related Levies
Natural resources possess a unique character, and, therefore,
have given rise to unique forms of taxation. To the extent that they are
to be considered a part of the common and social wealth of a region, so
has society demanded that a portion of the value arising from their exploi
tation and development is due to the community. This is partly recompense
for the loss of this wealth, and partly for the purpose of furthering
public projects to replace and/or conserve such resources. This duality
of motive in the taxation of natural resources should become apparent in
the examination which follows.
Severance Taxes. These levies constitute the most active and
most productive of revenue among the taxes on resources, though their
3George, 0£. Cit., Book VIII, Ch. Ill, p. 4l4.
3yield among all tax sources for states is quite modest (of $48.8 billions
of total state revenue, and $2 6 .1 billions in tax revenues for the states
in 1965, severance taxes accounted for only $503 millions).4 For a hand
ful of states, however, the severance tax is a major source of tax reve
nue, and, indeed, of total state revenue. In 1965) for example, of total
tax revenues in the state of Louisiana of $581 millions, severance taxes
accounted for $179 millions, or 3 0 .8 percent; for Texas, the totals were
$1,187 millions, $202 millions and 17 percent; for New Mexico, $188 mil
lions, $28 millions and about 15 percent. These, however, are exceptions;
most states levying severance taxes do not depend upon them heavily as a
source of tax revenue. Table I following gives more detailed evidence of
this generalization for those states levying severance taxes, and report
ing revenues from them in 1965*
The severance tax is customarily levied on the act of severing
natural resources from the earth, principally when the objective is clear
ly connected with a commercial purpose. The levy of the tax is generally
upon the "severer" of the resource, not necessarily upon the owner (though,
by implication, the owner may bear all or part of the burden if the severer
is successful in shifting the tax backward. See Chapter V on shifting and
incidence of the tax). Marquis5 characterizes the severance taxes as prop
erly "...privilege taxes imposed additional to other taxes..."6 and not
4Compendium of State Government Finance, Bureau of the Census,U.S. Dept, of Commerce, 1965, pp. 19* 21: Table 7 --Revenue by Source, I965.
Marquis, Ralph W., "Severance Taxes on Forest Products and Their Relation to Forestry", Land Economics, Vol. 25, No. 3, August, 19^9, p. 318, col. 1.
sIbid.
4
Table I
Severance Tax Collections in Dollars for 1965 and Rank in Dollar Volume of Collections1
(Thousands of Dollars)
Dollar Volume Severance TaxRank State Collections in 1965
1. Adapted from: Compendium of State Finances, Bureau of the Census, U.S. Department of Commerce, 1965- Table J -- Revenue by Source, p. 21, col. 6.
2. Figures do not add to total due to rounding.
as a substitute for other taxes. The tax "...operates as a lein on the
severed...products until paid, or, in some states, until the products are
sold."7 Williams8 identifies the severance tax as an "...occupation,
privilege, or license tax..."9 not to be confused with a property tax,
as it is charged against the act of severing, and not the severed property
itself.10 Thus, the apparent intent is to assess the social cost inherent
in the removal of natural resources, in part at least, against the person -
or firm actually removing them. There is no assurance, however, that the
severer will ultimately bear all or even part of this burden directly, as
the commercial nature of his activity provides a basis for tax shifting.
The subject of shifting of taxes on natural resources will be considered
more fully in the chapter devoted to that subject (Ch. V), but it may be
appropriate to briefly consider the possibilities open to the severer
attendant to the severance tax.
The severer, as an exploiter of the natural resource, frequently
secures his rights to such exploitation from the owner of the resource
lands by leasehold claims to the mineral or other resources, paying the
owner a consideration for the privilege. To the extent that a severance
tax reduces the net expectations of the severer negotiating such leasehold
(and attendant royalty agreements), he may seek to "capitalize" the burden
7Ibid., Col. 2.
8Williams, Ellis.. T., "Trends in Forest Taxation", National Tax Journal, Vol. XIV, No. 2, June, 19&1, PP- 113“ -•
9Ibid., p. 129.
10Williams, 0p_. Cit. , Loc. Cit.
6of the tax by a reduction in the amounts offered for the resources; i.e.,
based on the expected reduction in net proceeds for all materials he may
remove during the entire recovery period. To the extent that the owner
has no comparably-remunerative use for the lands, and few bidders appear
for the resources, the extent of the backward shift tends to be magnified.
Backward shifting of a severance tax presents a potentially-damaging pros
pect when fully or largely implemented, as suggested by Marquis:11
"...while a severance tax of as much as 50s£ on lumber selling at$60 per M at the mill might not seem exhorbitant, it assumesgreater relative importance when shifted to the timber owner selling stumpage for $10."
Conceivably, such a levy might render only marginal resource lands unecono
mic, but there are also implications for conservation, which will be ex
amined in the subsequent section of this chapter devoted to that subject.
Gronouski12 notes that the application of severance taxes to
mineral fuels (e.g., oil, natural gas, coal) and to timber is most common,
although "...a few states, notably Arkansas and Louisiana, use this method
for taxing a wide variety of natural resources."13
Yield Taxes. This category of tax is not cus-tomarily an addi
tional form of taxation, but rather constitutes a form of property taxation
in lieu of the traditional ad valorem property tax—levied annually. Basi
cally, the yield tax is a property tax, but one which is levied so that it
falls due at the time the resource property is converted (or harvested).
110E . Cit., p. 31 7, Col. 2.
12Gronouski, John A., et. al., "Taxation of Mineral Resources," Michigan Tax Study Staff Papers, Lansing, Mich. 1956, pp. 3^3-60.
13Ibid., p. 3^8.
Thus, properties classified under the yield tax would be taxable only
once; the resource owner is relieved of the annual burden of a tax on
property which is either not ready for harvest (as in the case of stand
ing, immature timber), or cannot most economically be marketed due to
present conditions of demand ( as in the case of petroleum or other mineral
reserves). The yield tax has not been a generally big producer of reve
nues, either for the states1 general funds or for the local governments'
property-tax collectors, and, indeed, appears not to have been intended
for this purpose. Williams14 suggests that the early concern for the
"problems of forestry" was a principal underlying cause for the develop
ment of the yield-tax concept.15 A study conducted under the sponsorship
of the Forestry Service of the U. S. Department of Agriculture, and pub
lished in 1933 details special forest tax laws existing at that time, and
reveals that most yield taxes only reduced the burden of property taxation,
or, at the very least, provided for more favorable timing.16
The most extensive application of the yield-tax principle has
been in the area of forest and timber products, and much of the form of
yield taxes is derived from the specific needs of forests and forestry.
Development and conservation, rather than fiscal yield, appear to have
been the overriding considerations throughout the development of yield
taxes on timber. Williams dates the development of the yield-tax concept
140p. Cit.
15Ibid., ,p. 113.
lsFairchild, Fred Rogers, and Associates, "Forest Taxation in the United States", USDA Misc. Publication Mo. 218, Forestry Service, U. S. Department of Agriculture, Washington, 1939* Table 120; pp. 39^“99*
8
from a "movement for timber exemption" from ad valorem property levies in
the state of Nebraska during the years IQ59-6I, though "..occasional
attempts to deal with forest problems... had been made previously.1117 The
"Fairchild Report" identified lb laws designated "yield-tax" in 13 states
(Michigan had two such laws) as of July 1, 1933j with 33 states in all pro
viding some special property-tax benefits to forest owners.18
Numerous differences prevailed among the tax laws noted by the
Fairchild Report, though one point of rather general similarity was the
levy based on ad valorem rates against the market values of products sold.19
Elegibility requirements differed widely: Some, such as that for Alabama,
were quite liberal and inclusive, allowing "...land suited for forest cul
ture; use must not be incompatible with forestry.1,20 Other yield-tax laws,
such as that for Massachusetts were much more highly restrictive:21
"Property assessed at not more than $25 per acre and including not over 20 cords per acre, but so stocked with trees as to promise a specified minimum stand per acre."
The state of Oregon had a similarly-restrictive law, seeming to categori
"All land in the state classified by (the) Board of Forestry on its own initiative and accepted by the tax commissioner as chiefly suitable for forestry which does not contain any mature forest crops in merchantable quantities."
17"Trends in Forest Taxation", p. 113
lsFairchild, et. al., 0|>. Cit., Loc. Cit.
19Ibid.
2°Ibid.
21Ibid.
^Fairchild, et. al., 0£. Cit., Loc. Cit.
These latter stipulations were quite characteristic of many of the early
attempts at yield-tax application. Their purpose, clearly, was to en
courage the rehabilitation of cut-over lands and to foster management of
new stands of young timber. What they decidedly did not do was to offer
incentive or encouragement to the more-or-less recent practice of select
ive cutting and simultaneous replantings in commercial tracts so as to
assure continuing harvest. The laws attacked the consequences of poor
forestry practices, rather than the causes; the statutes were remedial,
but not preventive.
The extent of relief from the ad valorem property tax also was
subject to wide variations as between states, with some exempting only the
trees themselves from annual assessment and leaving the bare land fully
liable to the tax, while others retained annual payment schedules, but
reduced the ad valorem levy to a very nominal figure; still others merely
deferred the ad valorem levy on trees until the year in which harvested,
at which time the full, accrued taxes were applicable.23 Some states
without a yield tax as such also granted some relief or deferral privi
leges in special legislation for forestry industries.24
Once the forest owner has qualified his tract for listing, and
has been placed under yield tax classification, the option of declassify
ing or removing such property from classification (as he might desire to do in the event of some opportunity for commercial exploitation) is sub
ject to considerable differences as between the several states. Some
23Ibid.
24Ibid.
plans, such as that of Mississippi, are largely or fully voluntary, with
declassification at the owner's option rather easy; others, such as those
of Kentucky and Louisiana, are construed as contractual obligations.25
These latter plans frequently included penalty fees or taxes provided
when withdrawal occurred prior to the maturity date of the contracts,
which were designated to run for as few as five, or as many as fifty
years, or more.26 Perhaps this ”locking-in" effect, as well as other
features of the yield-tax laws helps to explain why the participation
under these laws has fallen short of expectations, based on actual versus
potential classification. This result will be pursued in the section on
"Policy Problems" following next in this chapter.
Other Tax Exceptions and Preferences. Although the yield-tax
concept has met its most extensive application in the case of timber,
other natural resource operations are sometimes allowed relief or special
treatment under the property tax. One such set of special regulations is
described by Gronouski27 as applied in the state of Michigan. For Michi
gan1 s metallic (iron and copper) mines, the value of underground metallic
deposits is assessed, not by the local tax assessor, but by the Geological
Survey Division of the Michigan Department of Conservation. This assess
ment is forwarded to the local assessor, who is required to enter the
figure on the tax books.28 This procedure has the twofold purpose of
11
forestalling exhorbitant assessments (or inaccurate ones, due to the lack
of technical know-how of local assessors in determining mine values) by
the localities, and that of assuring uniform tax treatment for companies
in competition with one another within the state. The Geological Survey
Division does not, however, seek to set valuation on the bare land on
which the mine is situated,nor, necessarily upon the equipment and other
improvements to the property.29
In the case of nonmetallic minerals, no similar provision for
GSD appraisal exists, the assumption being that such deposits are of
"massive abundance" and that their discovery adds little to the value of
the property.30 Gronouski takes exception to this view, contending that
taxation of the richer deposits on such an assumption of "massive abun
dance" is to belie their ability to "...add substantially to the value of
the property."31
The rather obvious discrimination in favor of metallic mines in
the state of Michigan is perhaps better understood when this preoccupation
is considered in the context of its leadership position and competitive
situation among producers of these metals. Michigan is consistently a
high-ranking producer (No. 1 in 19^5) of domestic iron ores, but subject
to intense and increasing competitive pressure from neighboring producers
and from Canada.32 In copper production, Michigan is one of the lesser
29Gronouski, 0£. Cit., p. $k-6.
3°Ibid.
31Ibid.
32Minerals Yearbook, 19f>5> Vol. I, Bureau of Mines, U.S. Department of Interior, 196^!
12
producers (6th of 8 producers in 1956), and is beset by competitive dis
advantage of relatively modest quality of ores.33 Logically, other states
would stress those minerals that yield substantial values in much the same
way.Michigan also provides incentive through exemption from property
taxes for a maximum of ten years to any newly-discovered metallic mineral
ore (but not to the land in which it is located), "..when it is not part
of an operating mine..", or, if it jLs a part of an operating mine, the
exemption may be claimed "...until the mine comes into a 10-year (terminal)
recovery period as determined by the mine's average annual rate of extrac
tion."341 Such a practice would appear to materially dilute the property-
tax base, but it should be recognized that the exemption comes before the
value of the minerals had been subject to inclusion on the tax rolls, and
thus much resistance (though by no means all) by local officials may be
forestalled.
The existing variances and exceptions among the several states
of the nature described above would not serve the purposes of maximum
annual yield from the property tax, and their policy application does not
appear to contemplate this. They are, instead, more likely to act as promotive and/or conservation measures. The motivation may be similar to that
which produced the federal "percentage depletion allowance" for natural
resource owners, and those whose income is largely derived from the develop-
33Ibid.
34Gronouski, Ojd. Git., Loc. Cit.
13
merit of natural resources, though one critic35 suggests that the percen
tage depletion allowance provided only the opportunity for short-run,
tax-sheltered profits for vertically-integrated producers (through rais
ing crude oil prices as high as possible, and taking most of their profits
at that tax-sheltered level), or, as a long-run, speculative boon to the
owners of (oil bearing) properties,36
B. Policy Problems in Natural Resources Taxation:Some Significant Considerations
As suggested in the preceding discussion, much of the taxation
of natural resources is heavily permeated with policy considerations. In
this section of the study, attention will be given to some important ele
ments of policy, and their relation to taxation. Results of some tax
policies will be studied, and some critical proposals for improving policy
will also be examined. For purposes of the discussion, policy problems
have been grouped under two principal headings: policy differences in
dealing with renewable and non-renewable resources; and considerations of
conservation, incentives to production and fiscal yield.
Renewable versus Non-renewable Resources. A significant aspect
of the taxation of natural resources which contributes to its complexity
is the basic difference in the needs and ends associated with the treat
ment of renewable resources as distinguished from those which are exhaust
ible but not renewable. Implicit in the tax policies for timber and forest
35Davidson, Paul, "Public Policy Problems of the Domestic CrudeOil Industry", American Economic Review, Vol.LIII, March, 1963, pp.85_108.
36Ibid., pp. 103-7.
products, and the limited number of cases in which the products of river
and seacoast are taxed, is the imperative of replacement and regeneration
as the products are removed, and in all too many cases, the need also pre
vails for rebuilding depleted stocks. Thus, not only is the forest yield
tax a means of deferring the burden of tax upon the owner of immature
forests, or cut-over land replanted to new growth, but the revenues from
this tax are, in most states, dedicated to the purposes of conservation
and forestry. 37 Increasingly, it is the practice to allocate timber
severance tax revenues to purposes of forestry, also. 38 The ultimate
yardstick of the success or failure of policies designed to foster pre
servation of renewable resources, or to rebuild stocks of such resources
if depleted, are the actual data on the accessions or depletions of the
resource stocks, coupled with data on the scope, growth and economic
success of the enterprises engaging in the exploitation of the affected
resources. That is, it is not enough to say that the volume of timber,
or acreage of timber land are stable, increasing or diminishing; additional
data regarding the scope and vigor of timber operations, and their econo
mic significance to the state or region are necessary to complete the
determination of the effectiveness of policies designed to engender the
perpetuation of useful stocks of timber resources. 39
Non-renewable resources, though they are incapable of replace
ment by man, have been the subject of conservation and orderly exploitation
^Fairchild, 0£. Cit., and Williams, 0j>. Cit.
38Williams, Oja. Cit. , and Marquis, Oj). Cit.
39To be considered in the section immediately following.
through special tax treatment, publicly-sponsored or financed research
into improved methods of exploitation, and other policy applications.40
The success or failure of policy in this area is not so readily deter
mined as in the case of, say, forestry; however, the economics of the
industry -- costs, technology, wastes, returns, etc. -- may serve to indi
cate whether optimum conditions of conservation and orderly exploitation
prevail. Public monies spent on research in schools of mines, geological
research agencies of state and federal governments, and in other areas
may return rich dividends in prolonging the life of limited resource
stocks, and in the utilization of stocks previously-uneconomic qualities.
Conservation, Incentives and Fiscal Yield. In the taxation of
natural resources, three rather distinct guiding (and often conflicting)
benchmarks for policy have presented themselves. First, when one thinks
of the term "tax" the most obvious conclusion is that this is a basis for
raising public revenue, and so it should be. However, in the case of
taxes affecting any productive sector of the economy ( a feature, it may
be argued, of any tax), an equally-important consideration is the assur
ance of minimum repressive effects to the orderly conduct and basic effi
ciency of the industry yielding the tax. Finally, and because of the
exhaustible nature of most resources, the motive of conservation — assuring optimum utilization of scarce, often irreplaceable wealth -- is a
strong consideration. Because of its great import, the motive of conser
vation will be studied first.
40See Gronouski, Op. Cit.
16
An area in which conservation has traditionally been interwoven
with the tax structure is that of timber and forestry resources. Williams41
dates the '’modern" period in forest taxation from the movement in the
state of Nebraska previously mentioned (p. 8 above). The final develop
ment of the yield tax to serve in lieu of basic ad valorem property taxes
dates from about 1910 in Nebraska and several other states, as a means of
relieving the owner of standing timber from an annual tax bill, deferring
property taxation until the timber "crop" is harvested. 42 Forest sever
ance taxation developed along somewhat similar lines, with one of the
earliest being a Louisiana tax enacted in 1910 as "An Act to Create a
Conservation Fund.." by an annual levy "...upon those engaged in severing
timber and minerals from the soil" (Act 196 of I9IO) . 43 The legislation
under which most severance taxes are now levied on timber generally pro
vides for the allocation of part or all of the collections to forestry
purposes, 44
As a comprehensive and effective conservation measure, the yield
tax can hardly be described as an unqualified success, if judged on the
basis of experience in classification of eligible forest tracts. In the case of Louisiana, for example, classification proceeded on a slow, rather
disappointing scale prior to the passage of a mandatory provision in 195 ->
4l"Trends in Forest Taxation".
4 2Ibid., p. 113.
43Farris, Theodore Newton, "Severance Taxation in Louisiana", Louisiana Business Bulletin, Vol. 2, No. 1, Baton Rouge, La., April, 1938>p. 3 8 .
44Marquis, "Severance Taxes on Forest Products..", p. 317j and Williams, "Trends in Forest Taxation", p. 130-
17
after which classifications increased to the extent that, by 1959 it was
estimated that -0 percent of the forest land in Louisiana was classified
under the amended set of classifications. 45 Establishing communication
with forest owners provides a more compatible base for "selling" the yield
tax to those who desire to qualify their land under such laws. Programs
involving the yield-tax concept conducted on a largely- or wholly-volun
tary basis have tended to fare rather poorly in enlisting participations
and mandatory programs have met with some resistance, as well. Marquis46
cites several basic causes for the lack of success for forest-land parti
cipation under yield taxes:47
1. Lack of Knowledge on the part of forest-land owners, either of the existence or substantive features of the laws;
2. Administrative Restraints ("red tape"), especially in the "voluntary" programs -- a mass of reports, forms, investigations, etc.;
5* Excessive Restrictions on the use of classified lands (e.g., prohibition of grazing)and misunderstandings about imagined restrictions;
1*-. Lack of Sympathy of, or outright opposition by, local officials-- spiteful raising of bare-land assessments, etc.;
5. Overly-Restrictive Eligibility Requirements, such as limitation to very small tracts only, exclusion from use as resorts, etc., and;
6 . Absence of Tax Advantage -- Immediate plans for substantial removals of timber; underassessment at local levels or low millage rates, etc.
Answering these criticisms requires substantial overhaul of current yield tax laws, in Marquis' opinion. He proposes the following answers in cor
recting the shortcomings of current laws: a) broadening and liberalizing
45Hayes, Ralph W., "Progress in Land Classification in Louisiana Under the 195 - Forest Tax Law", LSU Forestry Mote Mo. 40, August, i960,p. 5 .
46”Forest Yield Taxes", USDA Circular Mo. 8893 Forest Service,U.S.Department of Agriculture, Washington, D.C., April, 1952, PP- 1-50*
47Ibid., pp. 10-12.
18
coverage; b) modernizing the plans in accordance with present forestry
practice (especially the allowance of selective cutting -- "thinning" --
on tracts with immature trees); c) striving for equitable tax treatment
of classified lands (by local assessors); and, finally, d) the enlisting
of popular support for the programs. 48
Based on the observations above, it would appear that the ex
clusion by yield-tax programs of any coverage for forest lands in process
of actual commercial exploitation is an area deserving of some serious
attention. Especially in the case of smaller, privately-owned tracts, the
owner is virtually forced to consider the "harvesting" of his timber as a
short-run venture, with no incentive to engage in forest management while
the cutting is actually going on. Rather, the ad valorem levy constitutes
a valid reason to exploit his stand quickly. The modern practice of "sus-
tained-yield" forestry, wherein new plantings are made simultaneously with
the cutting of mature trees, and attendant care for growing trees not yet
ready for harvest, is much to be preferred from the standpoint of timing
over the rapid denuding of the land, with the ultimate necessity to "start
from scratch" on production of a new forest. The latter course may require as much as -fifty years or more to produce trees suitable for lumber and
building products; in the meantime, the land produces neither income nor
appreciable taxes.
It was noted earlier that severance taxes on timber are devoted
in large part to providing funds for carrying on forestry and conservation
projects,"but the effects of a tax on the operation of forestry enterprises
48Ibid., pp. kl-50.
are also a proper subject for policy study. One possible effect of a
severance tax suggested by Marquis is that, if it makes the marginally-
productive resource less attractive, it may result in foregoing develop
ment of the poorer deposits or tracts in favor of an increased rate of
exploitation for the higher-grade, more profitable resource supplies. 49
While this may contribute to a more efficient level of exploitation in the
case of some resources, the implication for forestry may be the neglect
of many beneficial, but lightly remunerative, forest practices, such as
the necessary thinning (as pulpwood) of trees in an immature stand, or
"salvage cutting” in a producing commercial forest. 50 Care in setting
rates should also be exercised in view of the very real possibility that
the tax may be shifted back to the owner, possibly discouraging his opera
tion, or causing him to conduct operations contrary to conservation needs.
Conservation among the non-renewable resources infers policies
which will make most attractive the exploitation of resource supplies with
minimum waste and maximum recovery of resource supplies. Incentives to the
active exploration, discovery and efficient exploitation of new resources
would also be indicated as desirable policy attributes. On the one hand,
many severance tax laws for non-renewable resources seek a mixture of dif
ferential rates in accordance with the economic recovery value of the
resource (for example, the Louisiana rates of severance tax for crude
petroleum of varying specific gravities, and differing recovery methods),
while on the other hand, tax exemption may be offered, or deferral of tax
49Marquis, "Severance Taxes on Forest Products..1', p. 318, col. 1.
5°Marquis, "Severance Taxes on Forest Products..”, p. 318, cols.1 and 2.
20
application granted for new operations (e.g., the metallic mines property
tax deferral in the case of Michigan). Taxes levied against non-renewable
resource wealth may best serve the needs of conservation if they neither
discourage the orderly development of resources, nor produce a climate in
which the producer feels compelled to extract what he can in the shortest
possible time, abandoning the desolated lands to no further economic use
fulness, and having wasted much of their formerly-abundant wealth.
A rather controversial question dealing with conservation and
the economics of resource industries not directly connected with taxation,
but having peculiar application to the crude petroleum and natural gas
industries may be worthy of attention at this point. The characteristics
of these two mineral fuels, the one a liquid, the other either a gaseous
or liquid substance in its natural state, possess the potential of simul
taneous recovery from a single pool or "dome" by several operators in the
same field. Under these circumstances, an operator who removes the oil or
gas from one of these deposits thus denies that portion to the others pro
ducing from the same field. This "first come, first served" characteristic
is given legal stature under the so-called "common law rule of capture",
which upholds the right of any legitimate claimant to any quantities which
he may withdraw. 51
Obviously, if all the developers in a given pool were to pursue
their self-interest independently, the temptation would exist to engage in
a contest with one another to determine which producer could pump the most
product at the expense- of his rivals, so long as the reserves lasted.
51Davidson, Op. Cit., pp. 88-91.
21
This characteristic is termed by Davidson to be the negative "user cost
of the rule of capture"; that is, the user cost is associated with notcppumping, as distinguished from those which are associated with pumping.
The interests of conservation obviously dictate the finding of a solution
to this potentially-wasteful situation, and the solutions chosen by sever
al oil- and gas-producing states (notably Texas, Oklahoma, Louisiana and
California) employ the practice of "prorationing" or establishing "oil
allowables" for most normally-producing fields. The aim of prorationing
is to assure that no producer in a producing field will extract more than
his "fair share" of the production from existing wells. 53 The relevant
state statutes are reenforced by the federal "Connally Hot Oil Act", which
"prohibits interstate commerce in oil and oil products produced in viola
tion of state prorationing laws." 54
Davidson contends that prorationing is an inferior solution to
the problem, and that the interests of conservation would be better served
by the practices of "unitization", that is, of forcing the leaseholders of
a given field to form a unified management "..for the specific purposes of
operating the wells as a single production unit. 55 This solution, says
Davidson, would not only overcome the "negative user cost" imposed by the
5£Ibid., p . g!+ .
53Ibjd., p. 8 5.
54Ibid.
55Ibid.
22
rule of capture, but would allow the other user costs56 to regulate the
operation of each field for attaining optimum efficiency in production
and marketing. 57 Adelman58 echoes Davidson's criticism of prorationing,
asserting that the practice produces "...a systematic bias...in favor of
drilling more wells than necessary; the more wells drilled in any pool,
the greater the allowables for the pool."59 An additional premium is
placed on the more expensive, deeper wells, which enjoy a higher allow
able. 60
Adelman sees as a further ill engendered by prorationing the
preference accorded by the state of Texas to the "so-called 'stripper1
or marginal wells", which are exempted from prorationing restrictions,
and thus have achieved a dominant role in establishing cost structures
for crude petroleum in that state. 61 He suggests that eliminating pro
rationing (under the system of unitization proposed by Davidson) would
result in improved efficiency for the industry by removing from production
many of the marginal wells (which Adelman felt should not have been
56Davidson characterizes the other user costs as a) "the user costs inherent in all raw materials"--the return on presently-used materials, weighed against possible future returns had the materials not been used now; and, b) the "user cost of ultimate recovery" — weighing the actual rate of recovery against that rate which would yield the greatest ultimate recovery from the pool. (0]3. Cit., pp. ^1-2).
57Ibid.
5SAdelman, M.A., "Efficiency of Resource Use in Crude Petroleum", Southern Economic Journal, Vol. XXXI, No. 2; October, 196k, pp. 101-22.
5 9Ibid., p. 104.
soIbid.
61Ibid.
developed in the first place), along with the inflated costs associated
with such wells. 62 Clearly, there is much substance in the criticisms of
Davidson and Adelman, and the purposes of conservation would be well-
served by a serious review of the consequences of prorationing on the
total structure of crude oil and gas production techniques. If, as these
two critics suggest, prorationing is responsible for both a wasteful rate
of extraction in the better wells, and a cost structure inflated by the sheltered presence of marginal wells, then obviously prorationing is not
achieving the purpose of conservation (nor even operating efficiency from
the standpoint of cost), and new solutions should be sought -- perhaps
the use of unitized management suggested by Davidson, Needless to say,
the same types of solution would be equally-applicable to the natural gas
producers as to crude oil producers.
The matter of Incentives to Production would seem to have, by
inference, been suggested in many of the policies consistent with conser
vation aims discussed above. Any measure affecting expectations in the
development of natural resources, either by owners or producer-developers,
must necessarily have ramifications for conservation, and vice versa. The
words of Henry George concerning the positive effect which a tax levied
upon the "whole of rents" of land may have "...by compelling those who
hold land on speculation to sell or let for whatever they can get . . . " 63 do not appear to contemplate the total abandonment of lands producing modest,
but acceptable returns, such properties often reverting to the state
62Ibid., p. 105 and Appendix 2 , p. 117•
S3George, 0£. Cit. , Book VIII, Ch. Ill, p. *1-16.
2k
through tax delinquency. Neither does George seem to consider the possi
bility that the owner (and/or developer) would be goaded into a quick,
wasteful and destructive exploitation, often culminating in the abandon
ment of the ravaged lands to the state. 64 Thus, a sound tax policy for
incentives would encourage orderly exploitation of resources, neither
producing conditions tantamount to confiscation, nor generating a climate
conducive to the rape of resources in a feverish attempt to realize a
quick profit and abandon the lands to the state's guardianship after they
are desolated beyond economically-productive yield.
Finally, there is the question of fiscal yield of resource
taxes. It is perhaps appropriate that this policy question was deferred
for last consideration, inasmuch as dollar yields on resource taxes have
often been virtually incidental to the other policy goals. 65 A tax which
yields the maximum short-run revenues may, in the long run, be poorest in
benefits to the community if it causes the other goals of conservation and
incentive to be disregarded. Five or ten, or even twenty years of fat
receipts from property or severance levies, followed by the exodus of the
industry, loss of payrolls and other benefits, and perhaps even the ulti
mate decline and fall of the very community, is not a desirable end result. Granted that for many communities tied to non-renewable resources the ulti
mate loss of the resource industry is an inevitability, even the eventual
64For a discussion of "mining out from under" a tax, see Groves, Harold, Financing Government, 6th ed., Holt, Rinehart and Winston (New York: 196^), p. 305-
65Especially so in the case of forestry taxation, with yieldbeing literally "ploughed back" into the development of the industry (seeWilliams, "Timber Trends.." and Marquis, "Severance Taxes..”).
25
loss of the principal industry need not be hastened by a climate of oppres
sive taxes. For the community supported by renewable resources, such as
forest and timberlands, sound management may assure that the loss of this
support will never occur.
Still, the question may well be raised: For a locality in a
principal natural resource region, with little or no other property or
commercial basis for local tax support, and faced with rising costs of
government and community services, how may such an area possibly forego
the increasing demands for revenue from the only practical available
source -- i.e., the resource industry? There appears to be no simple,
panacea-like solution to this truly perplexing by-product of conservation
and production-incentive resource-tax policy. The most obvious (and most
difficult) solution would be for the region so affected to diversity the
tax base, attracting new industries, both subsidiary to and nonrelated to
the resource supply, as a means of making the community more fiscally
"shock-proof". Thus, a timber producing area could logically host a fur
niture or wood products manufacturer; a mining region might logically
attract a processing or fabricating plant, especially if it is blessed
with a location near a principal market. Subsidiary and/or service indus
tries would logically follow the basic plants, once the breakthrough had
been made. Examples of this type of activity may be taken from the loca
tion of furniture manufacturers in Michigan, 66 petroleum refining and dis-
asAn interesting footnote to this situation is the fact that Michigan, having declined in significance as a timber producer, must now import raw materials from other states for her furniture industry (See Barlowe, Raleigh, "Forest Yield Taxes," Michigan Tax Study Staff Papers, Lansing, Mich., 1958, p. 361). Here is a case in which the "back-up" industry has paid real dividends.
26
tribution plants in Louisiana, Texas and other oil-producing states, and
metals processors in Michigan, Indiana and Arkansas.
A second solution to the problem of deficient local revenues
which may be and has been applied is the cooperative support by other levels of government, involving supplemental payments to replace revenues
which might have been forthcoming in the absence of yield or other tax
modification in support of resource policy. Such programs have been oper
ated in varying degrees in several states, with a plan in New Hampshire
being one of the most interesting, if not particularly blessed with fiscal
soundness.67 The New Hampshire yield tax as applied in a 19^9 Act exempted
standing timber from taxation under the ad valorem property tax, but guar
anteed "...that the towns would lose no revenue as a result..." of the
law.68 Perhaps the localities have not been the losers under this plan,
but, by 195k the proceeds of a relief fund created by a special revenue
bond issue were "...nearly at an end..." due to "...rising tax rates
(local) over the state..." and a decline of timber cutting, which was to
have retired the bond issue.69 Although most transfer payments would
possibly have a less risky, even speculative, character (it may be noted
at this point that New Hampshire showed some g.aming spirit by passing the
first modern state lottery), they do in fact constitute transfers, not the production of added tax revenues. The claim against the state's revenue
67Hill, H. W., "Timber Taxes in New Hampshire", Papers and Proceedings of the -7th Annual Conference, National Tax Association, 195^>pp. llj-8-53.
6sIbid., pp. 151-2.S9Ibid.
27
sources simply displaces the claim against local sources, and the general
task of finding adequate revenues to finance public services remains. The
federal government also participates in a transfer program to localities
(to replace property taxes which would have arisen from forest preserves
located in the assessment area), and also payments of severance taxes on
timber taken from public lands are made to state and local governments.70
Problems in the allocation of revenues from resource taxes as
between the various levels of government are a natural consequence of the
multi-level administration of government in this country, and the social
viewpoint regarding ownership claims to natural resources. The local
governments -- townships, counties, school districts and parishes -- are
prone to demand a share in revenues, especially those derived from custom
ary sources of local-government support, such as the ad valorem property
tax. Further, where the local government is authorized to levy license
or occupational fees, gross receipts or income taxes, sales taxes, and
other, less common local-government taxes, these units will be prone to
exploit this power among the resource industries along with others. The
increasing pressure on local government finance for more and more expensive
services is likely to make these units even less inclined to forego taxes
which they feel are their due.
The State, on the other hand, views a more complex, larger pic
ture of the tax treatment of natural resource industries than the mere
7°Williams, Ellis T., "National Forest Contributions to Local Governments", Land Economics, Vol. Jl, No. 3» August, 1955> PP* 20^-14.The severance tax can be collected on such cutting without Constitutional questions, largely because the tax is laid upon the severer, not the owner, and is not a property tax (Marquis, "Severance Taxes on Forest Products..", pp. 315“ This right was affirmed in Wilson, et. al. v. Cook (19^6)327, U.S. 4 7 4.
28
raising of revenue. While the locality in which resources are located
tends to take a somewhat proprietary view of such resources, the state
is apt to regard them as a part of the total largess of the commonwealth;
that is, not as belonging solely to the locality in which an accident of
nature and geography has lodged them. Further, the state has tradition
ally taken a greater concern for the conservation and husbanding of scarce
resources, although policies directed to this end may, and often do,
reduce the short-run fiscal "payoff” in the form of tax revenues.71
The basis thus exists for debate between the privileges of the
locality and the state regarding resource matters. The various states
may resolve this problem in different -ways', but the State is likely to
prevail in most instances, if for no other reason than its customary
sovereignty in tax matters over the local units, and the fact that legis
lators from other parts of the state have the power to outvote those from
the affected area. Admittedly, there may be some exceptions to this rule,
but, in the main, the state has the balance of political'power. Some con
cession to the localities is apparent, however, in the return of a portion
of state-collected revenues to the locality in which the collections origi
nated,72 and under other arrangements.The objections to allocation formulae have by no means been
stilled by actions of the state intended to placate the localities, but
71ln the case of forest yield taxes, the deferral of property levies on immature timber stands, ultimately to be collected as the timber is harvested.
72For example, the turnback of a portion of the severance tax in Louisiana to the Parish from which the minerals or timber were severed ("Severance Tax-General", Legal Dedication, Louisiana State Tax Handbook, p. 8l) .
there seems reason to believe that no revolutionary changes in the rela
tive power positions of the two levels of government will be forthcoming
soon, especially with the concentration of population in the urban areas,
and the reapportionment of many state legislatures to reflect this trend
in political structure. The opposite view — that disproportionate poli
tical influence held by sparsely-settled, resource-rich areas will dimin
ish rapidly -- appears to be more in keeping with the true trend direction.
To say that this will impose undue hardships on the resource-rich areas
does not appear proper, however. Perhaps it may be more accurate to say
that, resource policy will now tend to be conducted on a more objective,
socially-oriented basis, rather than on a locally-oriented (which has
often meant "narrowly-oriented") basis.
CHAPTER II
ECONOMIC SIGNIFICANCE OF NATURAL RESOURCES FOR THE FOUR SURVEY STATES
The impact of natural resources on the economies of the four
survey states -- Arkansas, Louisiana, Michigan and Texas -- is the subject
of this chapter. It is the principal aim of this discussion to provide a
more complete knowledge of the role of resources within the several states,
and to compare the magnitude of resource industries as between the states.
This knowledge will help to place in more meaningful perspective the en
vironments in which the taxation of natural resources for the four states
occurs. Further, more insight into the ends and goals to be sought
through resource taxation policies should result from this knowledge.
For purposes of classification, the study will give separate consideration
to timber and forest products, mineral resources, and fisheries and other
resources, in successive sections.
A. Timber and Forest Products
Areas, products and Volume. All four states are active in the
production of timber and forest products, although the size of forest area
and magnitude of harvest varies, as does the relative importance of the
industry to each state. Area in commercial forests for the State of Arkan
sas constitutes 6^.3 percent of the state's total land area (see Table 2
on the following page), in Louisiana, the percentage is in Michigan
about 5^ percent, but in Texas the total forest area constitutes only
about 14.3 percent of the vast ( l68 million acres) area of that state. In
absolute terms, the forest area in Arkansas is 21.6 million acres; Michigan
31Table 2
Land Areas by Major Class of Land for the United States, Arkansas, Louisiana, Michigan and Texas -- Jan. 1, I9631
(Thousands of Acres)
State Total Land Area2 Total
ForestCommercial
Land Productive Re- s erved
Unproductive
CropLand
Other3
U. S. . 2,271,3^3 758,865 508,845 16,880 234,012 448,305 1,064,173Ark... 33,599 21 ,591 21 ,530 61 -- 8,436 3,572
1. Partial data from a summary of all states2. From 1959 Census of Agriculture3 . Includes pasture and rangeland, swampland, industrial and
urban areas, and other nonforest areas.
Source: Timber Trends in the United States, I965, Forest Service, U.S. Department of Agriculture. Table 1, pp. l40-4l.
has 19*7 million acres in forest; Louisiana a bit more than 16.7 million;
and Texas almost 24 million acres of forest land. All except Texas have a
favorable ratio of commercial forest land to total forest acreage; that is,
forest land which is physically capable of producing usable timber and is
available for that purpose. 1 As suggested by this rather broad basis of
classification, the commercial forest area may vary widely in the actual
amounts of merchantable timber available for various uses in any given
1Iimber Trends in the United States, 1965, Forest Service, U. S. Department of Agriculture. Appendix 2 -- "Definitions of Terms."
year. The poor ratio of Texas' total forest land to commercial forest
land is better understood when placed in the context of climate differences
across that giant state. The bulk of Texas' commercial forest land is
located in East Texas (accounting for all but about 500*000 of her 12 mil
lion acres in commercial forest lands), in a region roughly bounded by the
prairies adjacent to the gulf coast on the South, northward to the Red
River, and on the East by the Louisiana border, extending to a western
limit varying between 80 and 120 miles distance "..to the point where rain
fall becomes generally insufficient to support good commercial forests." 2
Apart from the so-called "lost pines" section of West-central Texas, there
are no contiguous timber stands of any great magnitude outside the Eastern
region. 3 In view of the above situation, the discussion of Texas' timber
resources will be devoted to the East-Texas area.
The survey states are in very different stages of development of
their forest industries. While Michigan was one of the earlier states
outside the Northeast to develop her forest industries, ranking firstnationally in lumber production during much of the decade ended in 1889,
the excesses of this period resulted in a rapid depletion of her most
favored wood species -- white pine -- and her fortunes were subject to a
rapid decline.4 At her peak production In 1889, the annual sawtimber cut
2"Forests of East Texas", Forest Survey Release 77, Southern Forest Experiment Station (Philip A. Briegleb, dir.), June, 1956, p.
3Ibid.
4Findell, Virgil E., et. al., "Michigan's Forest Resources," Station Paper No. 82, Lakes States Experiment Station, Forest Service,U. S. Department of Agriculture, Sept., i960, p. 1.
33
(see definitions. Table 3 on following pages) at sawmills was approximate
ly 5 .5 billion board feet; the decline to a low ebb in 1932 was precipi
tous, with the cut in that depression year only 160 million board feet . 5
As may be noted in Table 3a> sawtimber cut in 1962 was a modest 495 million
board feet. Meanwhile, the pulpwood industry has become more and more im
portant in the timber picture, the cut for this purpose rising from 7 97
thousand cords in 195^ to 1*09 million cords in 1962.® Veneer production
is in decline, with cooperage apparently having become insignificant ( less
than 1,000 board feet in 1962), as indicated in Table 4.
The timber industries of Arkansas, Louisiana and Texas, in con
trast to the case of Michigan, appear either not to have reached a climax,
or to evidence a rejuvenated status compared to prior periods. In the
State of Arkansas, the 1958 harvest exceeded one billion board feet of
sawlogs for the first time,7 and by I962 the harvest was 1.2 billion board
feet (Table 4). Pulpwood, the second-leading industrial wood, accounted
for 1.2 million cords in 1959j8 and had increased substantially to a cut
of a little more than 1.7 million cords in 1962 (Table 4). The pulp and
paper industry has grown rapidly in Arkansas since World War II, and is
now one of the leading industries using forest products. Together, saw
timber and pulpwood account for about 90 percent of the industrial output
5Ibid.
sFindell, 0£. Git., p. 20.
7Stemitzke, Herbert S., "Arkansas Forests", Forest SurveyRelease No. 8 5, 19&1, Forest Service, U. S. Dept, of Agriculture, p. 13 (So. Forest Experiment Sta.).
aIbid., p. 14.
Table 3a. Sawtimber1 -- Growth and Cut, 1962, and Volume, 1963, on Commercial
Forest Land: United States, Arkansas, Louisiana, Michigan and Texas.(Amounts in million board feet - international 1/4-inch log rule)
State Net annual Net annual Net volume Jan. 1, 1963growth2 cut3 Total Softwood Hardwood
Sawtimber comprises all live trees of commercial species which contain at least one saw log defined as follows: Softwoods must beat least 9*0 inches in diameter, breast height (dbh), except in California, Oregon, Washington and Coastal Alaska, where the minimum is 11.0 inches, d.b.h. Hardwoods must be at least 11.0 inches, d.b.h in all states.Growing Stock comprises all live sawtimber trees, poletimber trees, saplings and seedlings meeting specified standards of quality or vigor; excludes cull trees.Comprises natural growth and excludes catastrophic losses.Sawtimber and poletimber trees (where applicable) removed from inventory by harvesting, land-use change, or silviculture treatment .
Source: Timber Trends in the United States, 1965; adapted from a Table inStatistical Abstract of the U. S., I966, p. 677*
2 .3.
35Table 7
Total Output of Timber Products for the United States, Arkansas, Louisiana, Michigan and Texas, I9621
Product Total U.S. Arkansas Louisiana Michigan Texas
1. These estimates of total output include both roundwood and plant byproducts.
2. International 1/4 inch log scale. Saw logs assumed to equal timber tally.
3. Includes hewn ties, excelsior bolts, shingle bolts, turnery; and handle stock, shuttle blocks, chemical wood, farm timbers, and plant byproducts used for mulch, livestock bedding, etc.
Source: Adapted from: U.S.Dept, of Agriculture, Forest Service: Timber Trends in the United States, 1965; Table 3 8, pp. 168-92.
37
for Arkansas forests, with the remainder being accounted for by veneer
logs, cooperage bolts (mainly tight cooperage for such things as whiskey- aging casks) and pilings and posts. 9
Louisiana's forest-industry output of sawtimber in 1953 amounted
to l.k billion board feet, and, by I962 the cut was down markedly to 9^1
million board feet (Table , possibly due in part to the slack building
activity in the state at this time. In the case of pulpwood, however,
the expansion continued to an excess of 2 million cords in 1962 (Table k).
Pulpwood cutting is the dominant wood use in the forests of the Northwest
ern and Northcentral parts of the state, comprising about two-thirds of
the cut, and in other regions pulpwood accounts for virtually half the
timber cut. 10 Other products sharing in the timber cut are veneer logs,
cooperage bolts, poles, piling and posts.
In Texas forests, sawlogs are the principal timber product, but
pulpwood, especially pine pulpwood, is a high-ranking and growing cate
gory. 11 Trees cut for lumber are also largely pine, virtually all second-
growth stock, and for the most part cut in the Southeastern region.1 2 . The
lumber cut in East Texas appears to be declining among the small, portable-
mill operations, in favor of permanent, stationary mills, with the 1962 cut
of sawlogs at a level of 605-5 million board feet. 13 Pulpwood production
9Ibid.
louporests of Louisiana", Forest Survey Release No. 751 Southern Forest Experiment Station, Forestry Service, U.S.Department of Agriculture, p. lk.
lluForests of East Texas", p. 14.
12Ibid.
13Ibid. and Table i(-.
accounted for one-third of the 195 - softwood cut, with much of the cut
shipped to paper mills in Louisiana and Arkansas (about 40 percent).14
Texas is a leading producer of poles and piling. She ships the
cut trees principally to East Texas wood-preserving plants,15 with pro
duction in 1962 of 2.7 million linear feet of piling and 652 thousand
pieces of pole production, virtually all softwoods in both cases (Table i(-) .
Her production of cooperage, in line with other states' experience in
loose cooperage (for crates and boxes), has declined, amounting to less
than one million board feet in 1962.
The importance of forest and wood-products industries for the
states of Louisiana and Arkansas is readily apparent when it is noted
that the lumber and wood-products industries account for about 26 percent
of the total manufacturing employment in each state. 16 For Arkansas, this
represents a relative decline from the 1950 percentage of ^1.6 , but this
has been largely caused, not by a decline in timber activity, but by the
expanding industrial base in that state. Although their number is inde
terminate, and varies widely, woods workers not included in the above
figures should swell the numbers of workers supported through forest in
dustries even more. Texas' smaller output of wood products would suggest
a lesser employment percentage, and the much smaller scale of timber and
wood-products production in Michigan in comparison to vast manufacturing
base, would indicate a very small percentage employment.
14Ibid., p . lh-.
15Ibid., p. 15.
lsuporests of Louisiana", p. 15, and Accelerating Economic Growth in Arkansas, Arkansas Economic Expansion Study Commission, report (196k ),p . 22
Table 5
Forest Land Area and Ownership of Commercial Forest Land, United States, Arkansas, Louisiana and Michigan: I9631
1. Partial reproduction of a table including data for all states.2. Comprises all land which was a) producing, or physically capable of producing
usable crops of wood, b) economically available on date shown or prospectively, and c) not withdrawn from timber utilization.
Source: Department of Agriculture, Forest Service: Timber Trends in the United States, 1965Appearing in Statistical Abstract of the United States, 1966, p. 676.
vo
4o
Ownership, Reserves a n d M a n a g e m e n t . Although the bulk of forest
lands are in the hands of individual owners, such as farm operators, and
others not connected directly with the forest industries, public owner
ship, and ownership by wood-using industries have become quite significant
in the commercial forests of the survey states, as indicated by the sum
mary table below, and by Table 5 on the preceding page. The relative
shares of each type of owner are indicated as follows;
Table 5b
Ownership Percent of Commercial Forest Owned , by Classclass U.S. Arkansas Louisiana Michigan Texas
Several observations are in order regarding the distributions
of forest-land ownership in the four states. First, it should be apparent
that ratios of public-to-private ownership are below the national average
for the states of Arkansas, Louisiana and Texas, markedly below for the
latter two states, and higher than the national average for Michigan.
Michigan1s public ownership of forest lands is somewhat unique, in that
kl
state and local governments account for the majority of acres ( 19*7 per
cent of the total of 33 percent for all public owners), while nationally
the preponderant public owner is the federal government. These state and
local holdings are mostly state-owned tracts held in the Northern Lower
Michigan area. 17 For the State of Arkansas, publicly-held lands are pri
marily in the Ozark and Ouachita National Forests, and in the state's
parks system. For Texas, public lands are located principally in the
Southeastern region, and managed so as to build up the growing stock. 18
As noted, both Texas and Louisiana have very small percentages of commer
cial forest land in publicly-owned holdings (respectively, 6 .3 and
percent).
The very substantial portion of commercial forest area in all
the survey states owned by nonfarm, non-wood-industry owners reflects
both the incidence of reversion of abandoned farmlands to forests, and
the absentee ownership characteristic of such holdings which has manifested
itself in spotty forest management. Forest management has been most con
spicuously practiced on the public lands and those held by the wood-using
industries, with most of the balanced growth and yields appearing on those lands. 19
17Findell, et. al., Op. Git., p. 9*
ls"Forests of East Texas”, p. J.
19For example, Findell (Op. Cit., p. 8) noted that by 1955j 70 percent of the replanted area in the State of Michigan was publicly-owned; Sternitzke (Op. Git., p. 6) identified the Ozark and Ouachita regions (half publicly-owned) and the Southwestern region (2/5 owned by forest industries) as leading in both reforestation and pine volume.
k-2
In terms of volume of standing live timber, a comparison shows
Louisiana to be the leader of the four survey states ( see Tables 3a an<3
3b) in both the sawtimber and growing-stock measures. Arkansas and
Michigan are in a virtual tie for second-place in volume of growing stock,
with Texas last by a considerable margin. In sawtimber volume (mature
trees) however, Texas is ahead of Michigan, reflecting the rebuilding
task facing the latter state's forest industry. 20 Michigan's softwood
production is a problem area, dating back to the last century, when ruth
less logging operations in their heyday all but eliminated her famed white
pines. Many of the former white-pine stands have been supplanted by vol-Onunteer growth of aspen, a wood less-desired by the wood-using industries.
In East Texas, the Southeastern region appears to be progressing much more
than the Northeastern region, the former held in principally-large tracts
by private owners and wood-using industries, while the Northeast is char
acterized by small holdings by farmers and others. 22
One characteristic of forestry industries among the states which
has both predictive and descriptive values for the quality of forest man
agement, and the probable future expectations for sustained (or increasing,
or decreasing) yields is the ratio of net annual growth to net annual cut
for sawtimber and growing stock. These ratios are portrayed below:
2oSee Findell, 0j>. Cit., pp. 9“!^ for a discussion of the problem of balance in Michigan's growing stock, especially the lack of middle- sized timber.
21Findell, Ojj. Cit. , p.2.
22"Forests of East Texas", pp. 1,2.
Table 3c
Ratio of Net Annual Growth to Net Annual Cut, l$)62: Sawtimber and Growing Stock
U.S. Arkansas Louisiana Michigan Texas
Sawtimber....... 1.13 l.kj 2 .1 8 2.09 2 .2 6
Growing Stock.... 1.60 1.67 2.15 2 .5 0 2 .2 6
Source: Tables 3a and 3 b
The above ratios do not, however, portray some significant
qualitative and quantitative characteristics of the forest volume within
the states. In the State of Arkansas, for example, softwoods have been
gaining in volume steadily, with 80 percent of the gain in softwood tim
ber occurring on tracts held either by public agencies or by the wood-
using industries, largely in Western Arkansas.23 At the same time,' hard
wood volume has been declining in the sawtimber-sized classes for the
state, both as a result of overcut (with the cut exceeding growth by as
much as 69 percent in 1958) and the removal of hardwood trees (either as
a silviculture measure in lands better suited to pines or other softwoods,
or clearing of farm lands, especially in the Delta Regions) from forest
land s.24
23Sternitzke, Ojd. Cit., pp. T_9*
24Ibid., p. 9.
44Louisiana's forest land is rated as 50 percent well-stocked25
(containing at least 70 percent of the number of good trees, including
seedlings and saplings, required for full stocking), as compared to about
two-thirds of Arkansas’ forest land,26 and an area approaching 70 percent
for Michigan.27 and 59 percent for the East Texas forests.28 The South
western section of Louisiana is in process of rebuilding (though not
infrequently without direct management) following a heavy cutting during
the 1930's.29 Finally, although Louisiana's hardwood stands are nearly
half of sawtimber size, the largest concentration lies in the bottomland
stands (three-fifths of total volume) along the Pearl River, Mississippi
River, and elsewhere where logging operations are "difficult".30
Michigan1s forest problems, in addition to the dearth of good-
quality softwood sawtimber,include an unbalanced volume in softwoods, with
saplings and seedlings in abundance, but a dearth in poletimber-sized
trees to serve both the current needs of the pulpwood industry, and the
necessary subsequent growth to sawtimber size, a category which is already deficient.31 Finally, balance in the cutting of trees has been cited as
lacking, with some trees (especially yellow birch, sugar maple, spruce and
25"Forests of Louisiana”, p. 6.
2sStemitzke, 0£. Cit. , p. 4.
^Findell, 0£. Cit., pp. 2,3«2s»Forests of East Texas", p. 5*
29"Forests of Louisiana", p. 8.
3QIbjd., p. 4.
31Findell, Ojd. Cit., p. 7-
5balsam fir) being overcut, and others (such as oak, aspen, paper birch
and soft maple) undercut to the extent that even necessary selective
thinning is inadequate.32
In the East Texas forests, the Northeastern region comprises a
problem area, consisting of numerous small-sized tracts notable for the
absence of sound forest management. Chronic overcut of softwoods between
1935 and 1955 resulted in a 39 percent decrease in softwood volume in this area, while the Southeastern region showed a 23 percent gain in this
category.33 The fact that the Southeast is characterized by larger
tracts, and numerous tracts owned and managed by government or wood-using
industries, gives some indication as to why this two-sided picture exists
for East Texas forests. Thus, the Northeast contains less than 50 percent
well-stocked stands, while the Southeast shows better than 63 percent
well-stocked stands.34
To summarize, it appears that timber and forest products are, and will continue to be significant for each of the states' manufacturing
and employment (perhaps a good deal more for the three Southern states,
if present indications may be credited, than for Michigan). Some forest
problems are common to all the states (need for education in scientific
forest management, problems with insects, fire and disease, and presence
of cull trees, for example), while others, such as Louisiana's "difficult"
logging in the swamplands, or the competition between rich Delta farming
32Ibid., pp. 9s 1033,,Forests of East Texas", Table 3> P* 6.34Ibid., pp. 5, 6.
If 6
potential and needed hardwood stands occupying the land in Arkansas, are
unique to each state.
It appears that efforts are being made to expand methods of
sound forestry management by government, industry and private agencies
in each state, but the success has been larger with those groups who might be expected to grasp opportunities for more efficient forest operations --
the public agencies (as an example to private owners, to some extent) and
the wood-using industries. Small tracts should provide a steadily-dimin
ishing contribution to total volume and cutting for the timber industry,
continuing the trend that emerges in each of the four forest surveys con
sulted for this study.
The conditions and expectations surrounding the conduct of
forest operations should provide helpful perspective for adjudging the
effectiveness and appropriateness of forest tax policy, and rates of tax
ation, to be examined in Chapter III of this study. The way in which such
taxes have been shaped by, and at the same time have contributed to the
shaping of, forest practices and conditions in each of the several survey
states should now be somewhat easier to ascertain.
B. Mineral Resources
Mineral resources, as non-renewable by nature, present not only the questions of conservation and efficient use, but additionally raise the
considerations of available reserves and the depletion period at current
production rates. Some attention will be given to these matters, as well
as the production, employment and economic impact of mineral resource in
dustries to the survey states. For purposes of classification, mineral
production has been scheduled in three classifications: mineral fuels,
metallic minerals, and other minerals. Summary data on minerals produc
tion for the survey states, and for the United States, for the year 19^5
are presented on the pages immediately following (Table 6), and frequent
reference will be made to these descriptive figures.
Mineral Fuels. The significance of mineral fuels to the states
of Texas and Louisiana is very evident from an examination of Table 6,
with the two states ranking first and second, respectively in value of
mineral fuels production in the nation. This is based largely on the
strength of crude petroleum, but also includes natural gas and natural gas
liquids leadership. These substances are also very important to Arkansas'
minerals yield, accounting for almost half her total for minerals. By
contrast, Michigan's mineral-fuels production accounts for only about 10
percent of the total value of her minerals value. In absolute terms,
Texas1 mineral fuels accounted for almost 4.3 billions of dollars for
I965, and comprised about 37 percent of production value for the entire
nation in that year. Louisiana1s 2.8 billion-dollar yield placed her
second to Texas, and accounted for about 20 percent. Among the survey
states, Arkansas was third with 88 million dollars from mineral fuels, and
Michigan last with 56 millions, neither being significant nationally.Arkansas was the only one of the four survey states to record
coal production in 19&5j though Texas' production of some lignite was noted
among the "items whose value cannot be disclosed" for security purposes
(Table 6, p. 48). Arkansas apparently had some lignite produced under
somewhat similar conditions, but the bulk of her production was bituminous
coal. The producing coal mines (six were-active in 1963) were located in
Table 6Mineral Production in the United States, Arkansas, Louisiana,
Michigan and Texas for the Year I965
(Value in thousands of dollars; Quantities as indicated)
Mineral Production / Value of ProductionUnited States Arkansas Louisiana Michigan Texas
I. MINERAL FUELS:Coal (Bituminous and Lignite)
Th. short tons............. 512,088 226 — -- wValue...................... 2 ,276,022 1,643 — -- w
Natural Gas (millions of cubic feet)...................... 82 ,831 4,466,786 34,558 6 ,636,555Value............ .......... 2,494,542 12,922 812,955 8,674 858,396
Magnesium Compounds from sea water and brine (exc. for metals) sh. tons, MgO equiv.) 664 ,-021 319,38.9 W )>Value....................... ^7,555 -- — 26,143 w
Footnotes at end of table
Table 6 (continued)
Mineral Production / Value of ProductionUnited States Arkansas Louisiana Michigan Texas
III. OTHER MINERALS (cont.)Perlite (short tons)..........
Value......................392,384
3,352---
... ...1,000
8Salt (Th. short tons).........
Value......................37,687215,699 ...
8 ,12641,812
4,17136,087
6 ,964 30,771
Sand and Gravel (th. shorttons).... ..................Value.... ..................
908,04-94-57,416
12,80615,836
14,29816,405
37,54527,296
32,64936,075
Stone4 (Th. short tons).......Value......................
780,0121,203,618
21,80626,778
7 ?45210,905
34,71336,438
39? 320 53,659
Sulfur (Frasch-processmines - long tons).........Value...................... 146,921
--- 3? 577 71,9&
— 3,67483,282
Talc and Soapstone (sh. tons).. Value......................
862,8756,343
WW
— — 64,211204
Value of other Minerals notlisted above, U.S.......... 82,138 --- — — —
Total Value Other Minerals3 . 4,117,000 56,861 152,004 238,997 357,660Value of Items withheld from disclosure, incl. items designated "W11..... ................ X X 16,019 23,350 53,490 78,328
TOTAL VALUE ALL MINERALS...... 21,433,000 179,HO 2,978,855 565,560 4,718,129
Footnotes following page
Table 6 (concluded)NA: Not Available xx: Not Applicable W: Withheld to avoid disclosure of indi
vidual company confidential data; included with "value of items that cannot be disclosed."
1. Figures are for bituminous coal production in Arkansas, lignite production in Arkansas and Texas are withheld to avoid disclosure of confidential data.
2. Refers in each case to the minerals not produced by the four survey states.3. Total is incomplete, due to the withholding of value data on confidential items.
"Stone" in this case excludes abrasive stone, bituminous limestone, and ground soapstone. These items appear elsewhere, or in the "items that cannot be disclosed" data.
5. In addition to the "W" items, the following are included in the "items that cannot be disclosed" column:
For Arkansas: Abrasive stone, phosphate rock, soapstone, tripoli, and lignite;For Louisiana: stone (crushed miscellaneous);For Michigan: Bromine, calcium-magnesium chloride, iodine, potassium aalts;For Texas: Native asphalt, graphite, magnesium chloride (for metal), pumice,
sodium sulfate, and uranium ore.
Source: Bureau of Mines, Minerals Yearbook, 1965s Vol. 1, Table 1, pp. 9T-8, andTable 5s PP* 103~12.
53Western and Westcentral areas of the state, primarily in three counties --
Franklin, Johnson and Sebastian. Total production was only about 226
thousand tons, with Johnson county mines accounting for about 129 thou
sand, Franklin about 87 thousand, and Sebastian about 10 thousand.35
Goal-mining in the state accounted for only an average of 109 employees
in the mine, working an average of I85 days, or a total of about 20 ,000
man-days, with most operations being surface of "strip" mines ( less than
4,000 tons came from underground operations in 1965).3S Arkansas' total
production accounted for less than 0.5 percent of the national output,
and yielded $1.6 millions in value (Table 6).
Although only Arkansas and Texas were identified as producers
in I965 among the survey states, the state of Michigan also has some known
coal deposits of possible commercial value in the Central portion of Lower
Michigan, but.apparently the exploitation of these deposits is not economic
ally- feasible at this time.37 Most of the Texas and Arkansas production
currently goes to gas and coke plants, with small quantities to retail
dealers and other users.38 Recently, speculation has arisen concerning
the possible effects of the Arkansas River Navigation Project upon the
coal mines located in the vicinity of the river, with rumors of tentative
contracts between mine owners and Japanese industrial interests for delivery
35Minerals Yearbook, 19&5, Vol. II - Mineral Fuels, Bureau of Mines, U. S. Department of Interior, p. 118.
36Ibid., Loc. Cit. and p. 123.
37Coal Facts, 1966, National Coal Association (Washington,D. C., 1967), p. 42.
of coal to that nation (a major coal-user in recent years) in the 1970's,
when the Navigation Project is scheduled for completion. Arkansas' coal
reserves are calculated at only about 2..b billion tons as of i960, and
only about half of that is recoverable, according to industry norms.39
Michigan's known reserves were only 205 million tons, with about 102
million recoverable by the industry standard. These figures compare with
national figures of 1,660 billion tons total, or 830 billion tons recover
able.40
In the production of natural gas, Texas leads not only the sur
vey states, but the nation as well, in the volume and value of production,
with Louisiana second in both categories. Texas' production of 6.6 tril
lion cubic feet in 19^5 accounted for about 4l percent of national produc
tion, with Louisiana's k.5 trillion cubic feet comprising just short of
28 percent of the national total. Thus, between the two states, more than
two-thirds of the total output of natural gas is accounted for. Arkansas
is a distant third among the survey states, with 83 billion feet, and
Michigan's production was a modest >b.6 billion cubic feet. Natural gas
is found abundantly in many areas of Louisiana and Texas, sometimes in
wells producing dry gas, and virtually always is found in conjunction with crude oil deposits.41 Arkansas's gas fields lie in the Southern, South
western and Western parts of the states, presently, and Lower Michigan's
39Minerals Yearbook, 19^5» Vol. I, p. M j-.
4QIbid.
41The Oil Producing Industry in Your State, I967 ed., Independent Petroleum Association of America, pp. 33> 70.
55
oil lands also contain many of her natural gas deposits.42 The production,
especially, of Louisiana, and to a considerable degree, that of Texas have
been augmented substantially by offshore discoveries. The reserves of nat
ural gas proved as of the end of 1965 are indicated below:
Table 7Estimated Proved Recoverable Reserves of Natural Gas -- Arkansas, Louisiana, Michigan, Texas and
Texas is the only state in the survey group producing helium,
which is designated a "mineral fuel" by the Bureau of Mines.43 Of a
total 1965 production of 3*5 billion cubic feet, Texas accounted for 1
billion cubic feet of crude helium; of 819 million cubic feet of Grade A
helium, Texas produced 350 million cubic feet. This production yielded
values of $10.33 millions and $12.25 millions, respectively for Texas'
mineral industries. Other principal producers were Oklahoma, New Mexico
and Nevada.44
Peat is produced only by Michigan among the survey states, and
she is the leading producer of this substance, again classified as a "min
eral fuel" by the Bureau of Mines,45 but most of Michigan's output was used for agricultural purposes, such as potting soils, mulch and plant
nutrients. In 19653 Michigan's production of 231 million short tons accounted for 38 percent of national yield. Michigan and the next six
43Minerals Yearbook, I9653 Vol. II, p,k57.
44Ibid.
45Ibid., p. 238.
57
producers account for three-fourths of the national total, though some 26
states reported production. 46
Finally, and by no means least, Crude petroleum is produced by
each of the survey states. Again, Texas was the undisputed leader in 1965,
with production of 1,000 million barrels, more than JO percent of the na
tional total. Louisiana was second, both in the survey group and nation
ally, with a total of 595 million barrels, or about 2 1 .6 percent of national
yield. Arkansas' production of 26 million barrels ranked her 15th among J1
identified producing states, and Michigan's 15 million barrels placed
18th . 47
In addition to inland producing areas of considerable magnitude,
Texas and Louisiana also draw considerable crude oil from offshore drilling
in the Gulf of Mexico. Producing wells may be found in numerous locations
over much of the area of the states of Texas and Louisiana, but Arkansas'
production takes place mostly in the Southern and Southwestern portion of
the state, in a limited number of fields at present. Michigan's Lower
Peninsula area produces oil in central and Southwestern sections.
Estimated proved reserves for crude petroleum are indicated in
the following summary:
4sIbid.
47Petroleum Facts and Figures, 1965, American Petroleum Institute: New York, p. 4o.
58
Table 9
Estimates of Proved Recoverable Crude-Oil Reserves of the United States, Arkansas, Louisiana,
Michigan and Texas, January 1, 1966
(Millions of barrels)
United States............... 31,352Arkansas.................... 201Louisiana................... 5 >246Michigan......... •.......... 53Texas............. 9>l8l
Petroleum products constitute the overwhelming payoffs for Texas
and Louisiana among their minerals industries, accounting for about 91 per
cent of the value of Texas' unprocessed minerals value, and 94 percent of
that for Louisiana. When the extensive refining, transportation, and asso
ciated value-adding industries of the two states are considered, the sig
nificance of the petroleum wealth of the two states is magnified many times
over. In Arkansas, the value of petroleum products at the unprocessed
level approaches k-J percent of her minerals value, but' for Michigan, the
petroleum production totals only about 10 percent of minerals value, prior
to processing.
Metallic Minerals. This category would be somewhat sparsely-
populated among the survey states, were it not for the presence of Michigan
(see Table 6, p. 48). Michigan is the only survey state with a substantial
metals industry of multiple-product significance. This is not to discount
the importance of the bauxite production of Arkansas, in which she stands
virtually alone among states of the Union. Louisiana and Texas, for all
their massive mineral wealth, have no significant production in this group.
59
Arkansas, as indicated, has a virtual monopoly on the domestic
production of bauxite ore, the greyish, claylike base for aluminum. Of
total domestic production, Arkansas accounts for over 95 percent annually
( the two other domestic producing states are Alabama and Georgia). This
also describes her position in known reserves of bauxite ore for the U.S.
It should be noted, however, that the production of bauxite ore in Arkan
sas, and in the nation (1,595 and 1,654 thousand long tons in 1965, res
pectively) represent a pittance of world production (56 ,530 thousand long
tons in I965)-4s The U» S. aluminum-manufacturing industry thus finds it
necessary to import substantial amounts of bauxite and alumina (semi
processed ore) to meet its needs. Jamaica led the world in bauxite pro
duction in 1965, with 8,514 thousand long tons, and several South American
countries (Venezuela and Surinam, for example) led the United States in
production. 49 In Arkansas, bauxite ore is found principally in three
counties in the central part of the state: Pulaski, Saline and Garland.
In addition to the basic mining operations, two of the principal aluminum
producing firms operate reduction and alumina plants in Saline and Garland
counties. No plant to produce- finished aluminum metal has ye . been built
in the state.As a percent of value of Arkansas' minerals industries at the
resource level, the $18 millions realized from bauxite constitute almost
10 percent, though it should be apparent that the processing and related activities would substantially enhance its total value to the state's
4sMinerals Yearbook, 1965a Vol. I. "Metals and Minerals", p. 229.
49Ibid.
6o
economy. Although they do not produce bauxite ore, the states of Texas
and Louisiana are involved in the aluminum industry, with processing plants
in each state for ores imported into Gulf ports from South America, prin
cipally alumina and other treatment plants.
Copper ore is produced only by Michigan among the survey states,
and she does not rank among the leading producers (she was sixth in 1965>
and for most years preceding, among eight producing states).50 Her 1965
production of J2 thousand short tons yielded a value of $51 millions (less
than 0.5 percent of total output value for the U.S.), according to Table 6,
p. 48. Copper production is carried on in mines in the Western Upper Pen
insula, located in three counties: Houghton, Keweenaw and Ontonagon.51
Michigan is also virtually exclusive among the survey states in
her production of iron ore, ranking generally 1 - 2 with Minnesota in na
tional production.52 Michigan’s 1965 output was 13*5 million long tons of
usable iron ore, out of a total industry production of 84.5 millions, or
about 16 percent of the total. The yield of $145-5 millions of dollars
constitutes Michigan's largest mineral payoff, and the largest resource-
industry yield in value of product, as well. Michigan1s iron-ore produc
tion, like her copper production, arises from ranges in the Upper Peninsula, centered in the counties of Marquette, and Menominee in the central portion,
and Gogebic in the West.53 The volume is roughly accounted for in the order
5°Minerals Yearbook, 1965s Vol. X, p. 2 32.
5Michigan Yearbook, i960, Democratic Business and Professional Committee of Michigan, (Detroit, Mich. -- I96I) pp. 183.
52Minerals Yearbook, 19^5? Vol. I., Loc. Cit.
53Michigan Yearbook, Loc. Cit.
indicated, though all are fairly well-balanced in output. Modest opera
tions attempting to extract iron ore from low-grade pyrites have been
undertaken in Arkansas and Texas, but no value or quantity figures are
available at this time.54Silver production is carried on in Michigan's Upper Peninsula
on a small scale by a limited number of firms.55 The value of this pro
duction in 1965 of 592 thousand dollars places it in a minor category.
In assessing metals production, Michigan clearly has the great
est stake in this minerals category, with about 3^*7 percent of her total
I965 minerals value consisting of metals production. With the exception
of Bauxite, which comprises about 10 percent of the minerals value for
Arkansas, metals are not a major contributor to the minerals industries
of that state. Nor does the small iron-ore development in Texas appear
to present the likelihood of substantial volume in the near future.
Louisiana has no commercial metals-ore production, though both that state
and the state of Texas do have metals-processing activities.
Other Minerals. Because this category is so numerous, and con
tains many items produced in only very small quantities, attention will be
given in the following discussion only to those minerals in which one or
more of the survey states is a leading producer. One observation at the
outset is that Texas produces the largest variety of minerals other than
metals and mineral fuels, and derives the largest total value from this
group. Next in order is Michigan, with a similarly-diverse variety and
54Minerals Yearbook, 19^5j Vol. I, p. ^80.
55Minerals Yearbook, 19&5, Vol. I, p. 112, p. 83 2.
62
a substantial value, followed by Arkansas in number of categories, but
Louisiana in values (largely on the basis of her rich salt and sulfur
production). Percentage importance of the "other minerals” category to
the four states is as follows: Texas, J .6 percent; Louisiana, 5 percent;
Arkansas, J1.6 percent; and Michigan, 42 percent, which is striking evi
dence of the tremendous importance of mineral fuels in Louisiana and
Texas, and of the balanced minerals production for Arkansas and Michigan.
Arkansas was second nationally in I965 production of barite, a
material whose major use has been as an abrasive component in drilling
"mud" used for drilling oil and gas wells.56 Missouri ranked ahead of
Arkansas in 1965} but the lead had changed hands between these two states
frequently for several years, with neither enjoying a clear quantity
advantage. Texas also produces this substance, but no figures were dis
closed for 1965} to protect confidential company records. (Table 6, p.48)•
Total production for Arkansas in 1965 was 249 thousand tons, or 29 percent
of the national production of 852 thousand tons. Value of the Arkansas
production was about $2.4 million. Texas is not among the leaders in
barite production, but. Nevada and Georgia are major producers.57
In the production of Bromine and bromine in compounds, Michigan
led the nation in I965, followed by Texas, but, due to requirements for
security of company data, no figures were made public for either state.50
Arkansas ranked third in production in 1965} with J2, t h o u s a n d pounds,
5SMinerals Yearbook, 1965, Vol. I, p. 213*
57Ibid.
58Ibid., pp. 257-8.
63
or about 10 percent of total U. S. production of 328,115 thousand pounds,
and produced a value of more than $7 millions.
Among producers of all types of cement, Texas ranked third
nationally in 1965a with Michigan fourth.58 Texas' advantage over Michi
gan was in the production of Portland cement, with 30.8 million barrels
producing $97 millions, compared to Michigan's 27.6 million barrels, pro
ducing $87 millions. In masonry cement, Michigan had a definite edge,
with 2 million barrels and $5*4 millions, compared to Texas' 968 thousand
barrels, producing $3 millions (Table 6, p. 48). Both Arkansas and Louisi
ana produced cement of both types, but data were withheld to protect com
pany identities and records.
.Michigan is the second-leading producer nationally of gypsum, an
alkaline, talc-like substance used in such things as cement-making (masonry),
dry wallboard, and some paint-making processes.60 Texas is fourth nation
ally, close behind Michigan's 1965 total of 1.3 million short tons and 13 percent of the total, with about 1 million tons and 10 percent of the
national output. Arkansas also had production of gypsum in 1965j but data
were withheld for protection of company records.
In the production of lime, Texas and Michigan are third and fourth
nationally with the lead changing from time to time. In 1965? Texas' production was higher, with about 1 .3 million short tons to Michigan's 1.1
million. Louisiana was not far behind with 842 thousand short tons, and Arkansas produced a modest 192 thousand short tons. Lime production is
59Ibid., pp. 273, 2 7 6.
soMinerals Yearbook, 1965j Vol. I, p. 463-
64
rather generalized, with the majority of states contributing to the totals,
so that the rankings are subject to frequent change.61 Texas, for example,
accounted for only about 8 percent of the national total in 1965s Louisi
ana for about 6.5 percent, even though they were high-ranking states.
Michigan leads the nation in the production of magnesium com
pounds synthesized from sea water and brines, and Texas was third in 1965.
Almost half the total for 1965 was produced by Michigan (see Table 6).
Arkansas and Louisiana had no recorded production of these compounds.
Louisiana ranked first nationally in the production of salt in
1965, with a production of about 8 million short tons. Texas was second
with about 7 million short tons. Michigan was also a substantial contri
butor with 4 million short tons. Arkansas did not record production of
salt, and apparently has no commercially-significant deposits. The three
survey states which did record production together account for half the
national total (Table 6).
Michigan ranks second nationally in the production of sand and
gravel, with 37*5 million short tons in 1965*62 but, because of the almost-
universal production of these materials, her share is only about 4 percent
of the total. Her 37-5 million short tons was closely-matched by 32.6
million for Texas, followed among the survey states by Louisiana's 14.3
million and Arkansas' 12.8 million.
Texas led the nation in production of sodium sulfate in 1965,
but production figures were not made public for reasons of company
alIbid., pp. 557-601.
aaMinerals Yearbook, 1965j Vol. I, p. 8o4.
65security.63 Two other states produce natural sodium sulfate: California
and Wyoming.Production of sulfur by the Frasch process (involving hydraulic
recovery) is shared exclusively by two states: Texas and Louisiana, and
their positions are virtually in a tie; Texas led with 5*7 million long
tons in 1965> or about 51 percent, and Louisiana had 3*6 million long tons,
or k-9 percent. Production yielded $83 millions to Texas in 1965, and about
$72 millions to Louisiana.
A summary of minerals production for the four states offers
several significant characteristics indicative of the differential impor
tance of these industries. First, it should be noted that Texas and
Louisiana, with, respectively, $4.7 billions and $3 billions in values
of product at the mine or well, of a national total of approximately $21
billions, are the two most significant resource-producers in the nation.
Taken together, the two states alone account for one-third of all mineral
values in 1965* Michigan's mineral value of 565*6 million dollars con
stitutes a bit more than 2.6 percent, while Arkansas' total of 179 million
dollars constitutes only about O .83 percent of the national total. Viewed
in terms of the fifty states, the resource industries of Texas and Louisiana
are much-greater-than-proportionate in their share of the total, Michigan
is slightly more-than-proportional, and Arkansas is decidedly less-than-
proportional to the average.As previously noted, mineral fuels constitute the bulk of value
for the minerals industries‘for both Louisiana and Texas (9 4 and 91 per-
63Ibid., pp. 855-7.
66
cent, respectively). For Arkansas, mineral fuels are also the leading
category, providing k-9 percent of the total. By contrast, Michigan1s
mineral-fuels are responsible for only about 10 percent of the total;
instead, metals (3^-«9 percent) and other minerals (55-1 percent) produce the bulk of her mineral revenue.
Total employment in mining, as a part of nonagricultural employ
ment serve to illustrate the basic-resource impact on the labor market at
the mines and in the fields:
Table 10
Employees in Mining Industries, 196k, and Total Nonagricultural Employment for the United States, Arkansas
Source: Fishery Statistics of the United States, 1964, Fish and Wildlife Service,U. S. Department of the Interior, Washington, D. C.
O nVO
70In numbers of fishermen and craft, the preeminent positions of
Texas and Louisiana are given further documentation, with Louisiana hav
ing nearly 12 thousand fishermen, and Texas more than 6 thousand, as
compared to 1,300 in Michigan and 1,000 in Arkansas. The apparent sim
ilarity between the fishing employment in Arkansas and Michigan is dis
pelled when it is seen that Michigan1s fishermen utilize not only smaller
boats, but substantial numbers of larger lakes vessels. For Arkansas,
most boats are of the flat-bottom type, variously called "john-boats”,
"bateaus", and other names, suited to use on relatively-small rivers
and streams.
Mainstays of the Louisiana fishing industry are the menhaden,
accounting for 2 3 .6 percent of the value of the 196^ catch, the shrimp,
accounting for 56 percent, and the oyster, accounting for nearly 9 per
cent of the value. The three species combined totaled almost 92 percent
of the total value.64 For Texas, also, the menhaden and shrimp were the
species producing the major share of value of the catch; in this case,
the shrimp alone accounted for almost 90 percent ($31*2 millions of
$35-6 millions) of the total.65
Michigan's value leader in 196^ was the whitefish, comprising
just less than 27 percent of the total. Next in order were the yellow
perch (2^. 5 percent of value) and chubs (20. - percent). The three leading
species, then, account for about 72 percent of the total value of the
catch.66
^ Fishery Statistics of the U. S., p . 363 •
65 Ibid.
66Fishery Statistics of the U.S., p. 321.
71
Arkansas1 leading commercial fish is the buffalofish, with 61.8
percent of the 1964 catch's value. Second-ranking catfish (and bullheads)
account for an additional 25-6 percent, and the two species together form
more than 8j percent of the value of catch, for the year 1964.67
This brief view of the fisheries industires has sought to place
in perspective the comparative importance in scale and value of the acti
vities of the survey states, as well as to denote some qualitative and
quantitative contrasts among the states. This may provide some basis of
understanding which will be helpful in the study of taxation for this in
dustry, which will be considered in Chapter III. As will be observed,
Louisiana has the most extensive system of taxes on fishery products,
though Texas, rather surprisingly, does not tax fisheries extensively.
In view of the size and scale of the industry of both these states, some
question may be raised about that particular lack. For the other two
states, the tax structure scarcely considers fisheries, perhaps due to
their relatively minor significance.
67Ibid., p. 268.
CHAPTER III
TAXATION OF NATURAL RESOURCES I:RENEWABLE RESOURCES -- TIMBER AND FISHERIES
Chapters III and IV deal with the taxation of natural resources
by the four survey states -- Arkansas, Louisiana, Michigan and Texas. The
present chapter is concerned with taxes levied on those resources of a.
renewable nature: timber and forest products, fisheries and other living
resources. The following chapter (Chapter IV) considers the taxation of
nonrenewable resources -- minerals and other resources extracted from the
soil or water, and not subject to regeneration by human effort or manage
ment. This division of the study is intended not only to dramatize the
essential differences between the two classifications of resources, but
also to illustrate the different character of tax policies applied to the
two categories.
A. Forest Taxation
Consistent with the secondary importance assigned to the revenue-
producing function of timber taxes, and the concern for conservation and
reforestation goals, the forest taxes of the survey states do not dramati
cally add to the general-fund revenues of those states. A most striking
contrast to three of the states is the practice followed by the state of
Texas, which levies neither a severance tax on timber nor a special yield-
tax formula.
The disposition of revenues from special forest-applied levies
differs for the three survey states applying such measures. Arkansas re
tains a practice once quite common for these taxes -- devoting timber-tax
73
revenues to the forestry fund. Michigan and Louisiana take a different
approach to disposition of revenues, combining tax relief to timber owners
through "in lieu" tax plans with a return of a portion of timber-tax receipts to the localities. The apparent intent is to replace a part of the
resultant loss of ordinary property-tax revenues. The state of Michigan
distinguishes between small, farm-type woodlots and commercial-sized hold
ings, providing different schedules of taxation for for the two categories.
Property-tax concessions are made by both Michigan and Louisiana to timber
owners under reforestation agreements with the State, but this is not the
case in either Arkansas or Texas.
Severance Taxes. Three of the states levy a tax of the sever-
“ance type (Texas, as previously indicated, does not), though the features
of the taxes differ widely. Michigan and Louisiana1 levy their taxes on
value-based rates (ad valorem), while Arkansas assesses a specific (unit-
measure) charge, varying with species of timber and type of timber pro
duct. Michigan's "stumpage" tax charges different rates for private and
commercial severers. Alternative to the general timber-severance tax in
Louisiana, all tracts under reforestation contracts with the State are
taxed only under the state's "reforestation severance tax", a measure
heavily flavored with the "yield-tax" principle. This latter tax ex
cludes the standing timber under reforestation contracts from any and all
other taxation, including ad valorem property levies of state or local
1Though Louisiana prescribed a schedule of specific unit levies, practice of the Revenue Department currently is to apply the alternative percentage rates instead (see footnote 1 of Table 12).
Table 12
Severance Taxes on Timber and Forest Products for the States of Arkansas, Louisiana and Michigan
Const. Art. X, Secs. 1 and 21 (2); RS 47:651,56:1541-43,56:1484-89
CL 380.262/320.309 MS Anno. 13.192/ 13.229
Basis of Tax Privilege of Severing Timber
Privilege of Severing Timber
In Lieu of General Property and other taxes
In Lieu of General Property tax1 and Privilege of harvesting timber
Rates of TaxVaries from 20(6 per cord on pulp- wood to 50^ Per M board feet on pine sawtimber; complete schedule of unit charges
Virgin Timber:1 Varies from 15^ a standard cord of pulpwood to $1.50 per M Bd. ft. of red gum; Other than virgin timber: 5% avg. stumpage mkt. value for|pulp- wood; 2^ | for all other. j
i
Six percent of value, in lieu of all other taxes.
Private: 5$ of value of stumpage Commercial: 10^ of value of stumpage.
Footnotes at end of tableI
Table 12 ( continued)
State Arkansas Louisiana Michigan^ General Reforestation StumpageDesignation Severance tax Saveranoe Tax Severance Tax TaxAdministration
Assess:
Collect:
Revenue dept. (Misc. tax div.)Revenue dept.
Collector of Revenue
Collector of Revenue
Collector of Revenue
Collector of Revenue
PrivateTownship
SupervisorTownshipTreas.
Commercial State Conservation Dept.State Conservation Dept.
Reports and Payments
Reports and Payments monthly -- Producers by 25th and purchasers and processors by 20th.
Reports and payment due monthly, on or before the last day.
Taxes to be paid when forest products are severed.
Private: Tax due to township Dec. 1, as with gen. property tax;Commercial: Semi-ann. report of cutting 5/15 and 10/15; tax due $0 days after Cons. Dept, determines tax.
DispositionClassified as special revenues; payable to state Forestry fund,.
Dedicated 75$>2 to parish in which timber is cut; 25$ to Cen. Fund.
Same as for the General Severance tax
Private: Local units Commercial: Half to county to be distributed by co. Treasurer in ratio in which 15-mill (assessment) is allocated among units.
Fiscal 1966 Yield $884,8^9.25 $^8 , 965.15 $108,^4.45 Private: Local --Not avail Commercial: less than $10,000 each to state and counties. 3
1. An attorney generals's opinion dated Jan. 12, 1955 asserted that there is little virgin timber remaining in the state, and, in practice Department of Revenue only applies "other" rates.
2. From Met proceeds after Collector of Revenue receives $^00,000 from all combined severance-tax proceeds for cost of collection (RS k-J:6kk).
5- Estimated.. Exact figure to be obtained when possible.
Table 12 Sources
1. Citizens Research Council of Michigan: Council Comments No. jkl, "Outline of the Michigan TaxTax System-1963"} p. 12.
2. Public Affairs Research Council of Louisiana, Louisiana Tax Handbook, 196 -, pp.77~8^-*3 . Louisiana Department of Revenue, 26th Annual Report, p. 10 (I966). k. Arkansas Revenue Dept., Biennial Report (196^-65, 1965-66), p. J.5 . Report of the State Comptroller, State of Arkansas, I966, pp. 32-3-6. Industrial Research and Extension Center, Univ. of Arkansas, "A Summary of Taxes in Arkansas", p. 6.7 . State of Louisiana, General Severance Tax, Reforestation Severance Tax, et. al., Ch. 6, Subtitle II,
Title Vf, Louisiana Revised Statutes of 1950, etc., pp. 4-l f-.
-0o\
TTgovernments. Table 12 characterizes special timber taxation measures of
the severance type as to their salient features.
In each of the taxes portrayed in Table 12, there are indica
tions of the concern for establishment of good forestry practice, and the
recognition of the special needs of forest owners. Arkansas commits tim
ber- tax revenues to the forestry fund, a practice which was operative in
Louisiana prior to a change in dedication in 195 -- N°w both Michigan and
Louisiana rely on general-fund and other bases of support for their for
estry services. Perhaps the logic of this separation of severance reve
nues and forestry-fund supports is best described by Marquis, when he as
serts that a "..strict dependence on only severance revenues.." to finance
needed services rendered by the state's forestry agency is not wise, due
to the fact that "..annual revenues are tied to the level of log produc
tion. .", which may fluctuate from year to year, not necessarily in unison
with conservation needs . 2 Thus, the revenues for both Louisiana's gene
ral severance tax and. her reforestation severance tax are allocated
three-fourths to the parish from which they are harvested and one-fourth
to the state general fund.
In Michigan, the revenues from stumpage levies against the pri
vate (woodlot) forest reserves — to be discussed more fully under "yield
taxes" later in this chapter -- are payable to the treasurers of the town
ships from which severance was made, while commercial owners pay their
taxes through the state's Conservation Department, one-half going to the
county of origin, and one-half to the state's general fund. These pay
2"Severance Taxes on Forest Products", p. 317 > col. 2.
ment schedules are partially in recognition of, and in payment for,
property-tax losses incurred by the locality in conjunction with classi
fication of the lands for forestry purposes.Although Arkansas and Louisiana realize more in dollar terms
from their timber-severance taxes than Michigan, in no case is the gene
ral fund conspicuously fattened. As previously stated, the Arkansas re
ceipts go directly to the State1s Forestry Fund, and Louisiana returns
three-fourths of her proceeds to the parishes from which the timber was
severed. Financing of forestry functions very probably more than absorbs
an amount equal to the one-fourth left to the state general fund.
Yield Taxes. Two of the survey states, Louisiana and Michigan,
have developed timber property tax structures embodying the yield-tax
principle (See Ch. I). As noted in the earlier discussion, yield taxes
are basically designed to provide a measure of relief from the extra
ordinary burden placed upon owners or resources, expecially timber owners
during the time between establishment of forest growth and the ultimate
harvest, by an annual ad valorem property tax. Barlowe, for example,
summarizes the status of the timber owner thus:3
...It is generally conceded that the average forest property which produces one crop of forest products every 25, 50 or 100 years is taxed much higher relative to the value of this product than the farm, which harvests a crop every year, or the commercial and industrial property which turns its inventory over several times during the course of a single tax period.
3Barlowe, 0£. Cit., p. 372-
79
The need for modification of property-tax timing and burden, therefore,
presents itself, even if, as Barlowe suggests, an "element of subsidy"
accompanies it . 4
Michigan applied the earlier yield approach, with its "woodlot
law" enacted in 1911 ( CL 320.251-62; MSA 13.181-92), which, in the ori
ginal form authorized landowners of "up to 160 acres, half of which is
improved and devoted to agriculture.." to designate up to one-eight
(20 acres) "..as private forest reserves."5 The law was amended in 1917
to raise the proportion designated to one-fourth (40 acres), and the 5
percent stumpage tax was continued; the minimum forest stand requirement
was raised from 170 to 1,200 trees of approved species per acre. 6 The
property tax assessment on listed lands was restricted to $1 per acre
valuation by the same act (virtually making the measure an "in-lieu" tax,
eliminating ad valorem liability) . 7 The latter Act yet serves as the
basic authorization under which the private forest reserves program oper
7.411 (7)) was enacted in 1925 for the purpose of providing yield-tax
benefits similar to those enjoyed by woodlot owners to the commercial
4Ibid.
5Ibid., p. 362.
6Ibid.
7Barlowe, 0£. Cit., p. 364.
80forest developers. 8 This Act authorized classification, after examination
by the Department of Conservation, of: 9
...land containing no material natural resources other than forest growth, no portion of which is used for agricultural, mineral, grazing, industrial, recreational or resort purposes, and upon which the owner proposes to develop and maintain a forest either through planting of natural production or both...
Stipulations were also imposed regarding the fitness of the land for for
est growth and its present condition as forest land. 10 This obviously-
restrictive law failed to achieve the rehabilitation of much of the land
most in need of it, actually excluding much of it from qualification (such
as cut-over lands, badly-eroded lands best suited to forests, etc.).
In 1939, the act was amended to approve the listing of:11
...selectively logged lands, land carrying a stand of forest growth well advanced toward maturity, or lands carrying insufficient forest growth, but essential to the proper development of other forest property accepted for listing.
This liberalizing of the statute appears to have been a forthright recog
nition of the practical needs of modern commercial forest management, and
enabled many of the most-needy forest lands to qualify.
The rates of ad valorem bare-land taxes charged to commercial
owners has been subject to considerable indecisiveness of action by the
lawmakers, with the original stipulation calling for an annual tax of five
cents per acre on pine lands and 10 cents per acre on hardwood lands; this
8Ibid.9Ibid.
10Ibid.
11Ibid.
81
was changed by a 1927 amendment to a uniform 10 cents per acre for all
classified lands, and in 1935 reduced to 3 cents uniformly.12 The present
rates are based on a 1958 amendment which provided for a sliding scale of
charges, dependent on the millage rate of assessment applied to other
property locally:13
5 cents per acre if the local rate is less than 20 mills;6 cents per acre if the local rate is between 20 and 25 mills;7 cents per acre if the local rate is between 25 and 30 mills;8 cents per acre if the local rate is between 30 and 35 mills;9 cents per acre if the local rate is between 35 ^0 mills; and10 cents if the rate is 40 or more mills.
Inasmuch as the land levy is paid to the locality, this sliding scale
would have the potential of tempting local assessors to raise the millage
rates to 1+-0 mills or more in areas characterized by large numbers of
classified acres, but perhaps the return would be so nominal that it is
hardly remunerative to do so. At any rate, a uniform, but reasonable,
charge would be less subject to this sort of manipulation by local asses
sors, and would avoid unfair competitive advantage to owners lodged in
low-millage areas.
The Michigan private and commercial forest reserves programs
are both of a "voluntary" character, with no stipulated contractual term
specified, and with no fixed agreement as to substantive provisions, other
than those general conditions noted above. Although this means that "..the
state may change the terms at any time, ...the owner who is adversely
affected.." may withdraw his lands from listing without penalty.14
12Barlowe, Op. Cit., p. 38 2.
13Ibid.
14Ibid., p. 365.
82Barlowe suggests that, although voluntary listing is desirable, some
stipulated contractual applications should be included in the interests
of security to the timber owners.15 Further, the suggestion is made that
the woodlot (private forest reserves) laws be modified, and their coverage
enlarged, so that more listings will be encouraged.16 Presumably, this
could be accomplished through increasing the allowable percentage of
tracts which may be classified (to, perhaps 50 percent of the total
acreage, or more), and liberalizing the requirement for cultivation of
the part of the tracts which are not eligible for classification.
Louisiana first authorized state reforestation contracts in the
constitution of 1921 (Art. X, Section l), with enabling legislation en
acted in 1922 (Act 90).17 A severance tax on reforested products was
authorized by a 1926 constitutional amendment (Act 162), in lieu of other
taxes, and with proceeds allocated three-fourths to the parish in which
timber was severed, one-fourth to the state general fund.18 This was
superceded by the 1948 amending act mentioned previously (Act 546) , which
dedicated timber severance taxes to the Louisiana Forestry Commission.19
The Act of 1954 (Act 759> a constitutional amendment) returned the allo
cation of revenues to the distribution provided by the 1926 law (Act 162),
15Ibid., p. 573.
lsBarlowe, 0j>. Cit., p. 373-
17Louisiana State Tax Handbook, 1964, p. 83.
18Ibid.
19Ibid.
and this is the present basis for distribution -- three-fourths to the
parish of origin, one-fourth to the state's general fund. 20
The reforestation contracts in Louisiana are mandatory and
binding in their provisions, with such contracts not to exceed 40 years.
Timber produced on lands under contract is subject only to the reforesta
tion severance tax, and may not be taxed under the ad valorem property
tax. Though the land is not so exempted, it may be taxed only at a fixed,
relatively nominal rate. 21
Louisiana's mandatory land classification under Act 759 of 19^k
has provided for, in addition to land under reforestation contracts, four
other classifications of forest land: "tidewater cypress", "hardwood
lands", "long-leaf pine lands", and "other pine lands" .22 The taxation
of timber on the classified lands is now based on rates of 2-J percent on
all timber except pulpwood, and 5 percent on pulpwood (average stumpage
value in each case). The bare land in each case is subject to property
taxation at the local level, with the stipulation of uniform assessment
for all lands within a particular classification. 23 Thus, no property
within, say, the tidewater cypress classification, may be assessed at a
different valuation than other lands in this same classification, regard
less of differences in local assessment practices. This has the effect
20Ibid.
21Williams, "Trends in Forest Taxation", p. 127.
22Hayes, Op. Cit., p. 2.
23Williams, "Trends in Forest Taxation", p. 128.
of leveling assessments statewide on bare-land values for all timber
tracts in the same classification.
The states of Arkansas and Texas have no counterparts to the
yield-tax measures of Michigan and Louisiana, and, largely due to histori
cally- low assessments in timber areas, timber owners probably have not
been harmed appreciably by this lack. However, with the expansion of
urban areas into previously-agricultural regions, it is probable that
assessments will continue to be upgraded (as, for example, the general
attempt to standardize the assessment ratios statewide in Arkansas at a
minimum 20 percent ratio to actual value, dating from 1955)? and the sit
uation may demand some relief for timber owners in the foreseeable future.
The perfect approach to yield-tax or "in-lieu" tax treatment of
forest resources quite obviously has not been found as yet, judging by the
mixed policy results under those statutes presently applied. However, the
unique character of this resource area deserves recognition, and the
measures taken thus far to seek a more equitable and palatable tax treat
ment of the timber resource may be productive of salutary result. Con
tinued study of the problem is clearly incumbent on students of forestry
and taxation alike.
B. Fisheries Taxation
As implied previously, this section must be devoted largely to
the system of fisheries taxation developed by the State of Louisiana,
inasmuch as the other survey states have only a limited application of
taxes which are directed at fisheries. This is not to say, however, that
the states do not collect substantial revenues by other means, such as
licenses, fees and permits. As an example, the Wildlife Division of the
Texas Parks and Wildlife Department collects a wide variety of fees and
license charges from the extensive fisheries industry of that state,
licensing such activities as commercial fishing, guide services, bait
dealerships, processing-plant operations, boat operations for commercial
purpose, and a variety of others.24 Sales of shell, sand and gravel by
the Division in fiscal 1963 netted almost $2 millions, as a related acti
vity.25 Similar activities by the Michigan Conservation Department's
Fish Division, and Arkansas1 Game and Fish Commission may be expected to
yield non-tax revenues much in proportion to the scales of activity in
commercial fisheries of those two states. However, none of the three
states have developed extensive systems of taxes, of the severance variety
or other, applied to fisheries.
Louisiana, in addition to the usual fees, licenses and permits,
levies a variety of tax measures of the severance type upon fisheries
activities, and is unique among the survey states in the number and variety
of such levies. Louisiana's General Severance tax (Art. X, Sec. 1; RS
47:631) levies a tax on the commercial severance of shells. This tax
accounted for a total revenue of $307,723*23 in fiscal I9 6 6 .26 Arkansas
has only one application under her severance tax relating to fisheries --
a tax on mussel shells -- which has become inoperative with the decline of
24Data are from the Wildlife Division, Parks and Wildlife Department of Texas, Annual Report, Fiscal years 1962-6 3.
25Ibid„
26Louisiana State Tax Handbook, pp. 77-80, and 26th Annual Report, 1965-66, Louisiana Department of Revenues, p. 10.
86
the shell industry (which manufactured buttons and other things prior to
the advent of plastics, but has been dormant as an industry roughly since
World War II), and no revenue has been reported for some time.
Oysters are taxed in Louisiana under a special severance tax
(Art. X; RS 56:10), administered by the Wildlife and Fisheries Commission
of Louisiana, paid by "oystermen, boatmen, or individuals removing oysters
from leased grounds or natural reefs or when sold by packers, canners,
commissionmen, dealers or firms."27 The rate is 2^ cents on each barrel
of oysters taken from leased bottoms; 3 cents if taken from natural reefs.28
The yield on this tax for fiscal 1965 was $11,145.60, and the receipts
have varied within the range of $10 thousand to $20 thousand for the past
several fiscal periods.29 Texas levies a nominal oyster tax through the
Wildlife Division, but the yield was less than $200 for fiscal 1963.3°
Louisiana's Oyster Severance Tax is dedicated to the Conservation Fund,
with surplus funds, if any, at the year's end to be transferred to the
state General Fund.31
Louisiana levies a severance tax on salt-water shrimp of 15 cents
per barrel for shrimp taken from the waters of the state, and 50 cents a
barrel on out-of-state shipments other than by common carrier (Art. X;
27La. State Tax Handbook, 1964, p. 82.
2sIbid.
29llth Bienniel Report, 1964-65) Louisiana Wildlife and Fisheries Commission, p. l4,
3°Annual Report, 1962-63, Wildlife Division, Parks and Wildlife Dept, of Texas.
31La. State Tax Handbook, 1964, p. 8 3.
RS 5^:10, 5 6:5 0 5 ) .32 The original levy was passed in 1940 (Act 143), end
amended in 1946 to reflect the present rates (Act 7 8 ) *33 The tax is to
be paid by the "first purchaser, processor, wholesaler or other dealer
who deals in buying, selling or handling salt water shrimp."34 The tax
is collected monthly by the Wildlife and Fisheries Commission, and yielded
$44,627.22 in fiscal 1965,3S down some considerable amount from normal
collections, which run between $50 and $60 thousands, and perhaps the
result of adverse conditions at "harvest" time. The tax is payable into
the Conservation Fund, with annual ending surplusses, if any, payable to
the General Fund.36
It is perhaps belaboring the obvious to say that Louisiana has
the most sophisticated tax structure for fisheries; she has virtually the
only one among the survey states. It is somewhat surprising that Texas
and Michigan have no severance-tax systems for fisheries products, con
sidering the substantial size of their fishing trade. In the former case,
It appears that Texas uses the fee system and licenses instead of sever
ance levies, as such, and perhaps this is also the case for Michigan. If
so, the purposes of public revenues are served, and the social interest in
resources upheld, in the absence of taxes, as such. For Arkansas, it is
32Louisiana State Tax Handbook, 1964, pp. 84-5.
33Ibid., p. 84.
34Ibid.
35llth Biennial Report,1964/1965, La. Wildlife and Fisheries Comm., p. 14.
3sLa. State Tax Handbook, 1964, p. 8 5 .
88not surprising that her public revenues from commercial fisheries are,
like the private returns, quite modest.
CHAPTER IV
TAXATION OF NATURAL RESOURCES II:MINERAL RESOURCES
Having examined the taxation of renewable resources, the impres
sion may have been left with the reader that little, if any, substantial
fiscal significance attaches to tax revenues from natural-resource acti
vities. Rather, the implication thus far has been that, in the interests
of conservation and promotion, revenue from taxation is sacrificed or
"ploughed-back" into the industries in question. The present chapter
should dispel much doubt as to the productivity of fiscal benefits from
resource taxes, as the non-renewable resources are much more abundant
revenue producers.Several features of the natural resources industries studied in
Chapter II suggest the probable results of taxation of mineral resources,
with the reader already having a pretty good idea as to the major revenue
producers. Some surprises are in store, however, regarding the extent
and rates of application of taxes to various minerals industries in the
survey states. Texas and Louisiana, for example, with their abundant
petroleum and natural gas wealth logically would, and do, obtain the
lion's share of severance revenues from this industrial group. Similar
ly, Arkansas might be expected to derive much of her resource-tax revenue
from the same industries, and, indeed, she does. A major surprise arises
however, when Michigan's resource-tax applications are examined. With
abundance in a variety of minerals categories, and with petroleum indus
tries accounting for only 10 percent of minerals value, one would suppose
90that the bulk of her resource-tax revenues would be derived from sources other than petroleum. Michigan, however, does not levy severance taxes
on any minerals industry other than the oil and natural-gas industries.
Her rich metallic-minerals industries and others are not taxed on the
basis of severance, either by specific-rate or ad valorem measure. Cer
tainly, this practice is a strangely-selective approach to minerals taxa
tion, and one which mitigates against one particular natural-resource
industry in a rather discriminatory, even arbitrary manner. More will
be said regarding this feature of Michigan1s natural resource tax struc
ture in the final chapter of this study. Table 1J on the following page
presents the totals for severance-tax collections from minerals indus
tries in the four-state group for fiscal 1965-66, and Table lip compares
rates on minerals commonly taxed.
A. Mineral Fuels Taxation
Because of their overwhelming importance to three of the four
survey states (Arkansas, Louisiana and Texas) and because the remaining
state (Michigan) levies severance taxes only on this classication, first
consideration will be given to the manner in which the states tax the
mineral fuels. The following discussion will center primarily on sever
ance taxes, but will also examine selected other special features of
resource taxation in the four states, as to applications, rates and yields.
Oil and Natural Gas Severance Taxes. Arkansas taxes oil and
natural gas under her general severance tax (Ark. Stat. Ann., 19^7 and
Repl.; Sec. 84-2102). These revenues, and all severance-tax revenues
91Table 13
Mineral Severance Tax Collections -- Arkansas, Louisiana, Michigan and Texas -- Fiscal 1965-66
(Thousands of dollars)
Mineral Arkansas Louisiana Michigan Texas
Bauxite............ $ 340 $ $ — $ —
Natural Gas........ (1) 8 l, 978
Nat. Gas Liquids.... (1) 14,862 1,0993 74,l853
Oil................. 2,854 103,421 131,217Oil and Gas Regul... -- — — 1,810Salt................ 255 —
Sand and Gravel..... ( 1) 467 — --
Stone........ ...... (1) 5 — --
Sulfur............. -- 2,714 — 3,350
Miscellaneous,...... 692 — — --
Total Severance (minerals) $ 3,885 $204,484 $ 1,099 $210,762
Total Tax Coll.(state)....... $252,917 $658,571 $1,467,654 $1,267,084
Percent of Total from Mineral Sev.... 1 .6 3 1 .1 0.1 16.7
1. Detailed figures not given for fiscal 1965-66; these items are included in the "miscellaneous" total.
2. No separate figures given for Natural Gas and Natural Gas Liquids.3. Total not detailed for Natural Gas, Natural Gas Liquids and Oil;
composite total.
Source: "State Tax Collections", Governmental Finance, GF No. 16,1966, Bureau of the Census, U.S. Department of Commerce. Data are from Table 9 " "State Tax Collections in Detail".
Table 14
Minerals Severance Taxes:Comparative Analysis of Rates on Minerals Commonly-Taxed by Two
or More of the Survey States
Minerals Arkansas Louisiana Michigan Texas
Rates AppliedNatural Gas............ . 0.3 cents per M
cubic feet2 3 /1 0 cents per M cubic feet1
2 percent of gross cash mkt. value
T percent of gross value or 1 cent per M cubic feet, whichever is greater
Natural Gas Liquids..... 5 percent of value 2 cents per bbl. 2 percent of gross cash mkt. value2
4.6 cents per bbl.. gross production
Crude Oil.............. , 5 percent of value 18-26 cents per bbl., depending on specific gravity
2 percent of gross cash mkt. value2
4.6 cents per bbl. , gross production.
Sulfur................. • • — — — $1.03 per long ton (2,240 lbs.)
— — — $1.03 per long ton (2,240 lbs.)
1. Excluding those wells producing at less than standard pressure, which are taxed at 0.3 cents per thousand cubic feet.
2. Does not include the Oil Privilege Fee of one-eights cent per barrel on oil produced.Sources: Report by the State Comptroller, Arkansas, I965; Louisiana State Tax Handbook, 1964;
29th Annual Report, Department of Revenue Division (Michigan); Vernon1s Annotated Statutes of Texas, i960, and Replacements, Title 122A, Chs. 4 and 5*
93other than those for timber (see Ch. Ill), are distributed three-fourths
to the State General Fund, and one-fourth to the County Aid Fund for dis
tribution to the counties of origin.1 The tax on natural gas is 0.3
cents per thousand cubic feet of natural gas severed, and the tax on oil
(crude) is 3 percent of market value "at time and point of severance",
except that wells producing 10 barrels or less per day are taxed at the
rate of 4 percent.2 Additional credits are allowed to oil and gas pro
ducers for "amortized cost of construction, and expense of operating,
underground salt water disposal systems", and the producer may be allowed
a credit of 75 percent of the severance tax otherwise due "for a speci
fied time after the discovery of a new pool".3 Natural gas liquids are
not subject to a stipulated levy, but would likely be included under the
"all other natural resources" category, taxed at a rate of 5 percent.4
Yield for oil severance taxes was $2.8 millions in fiscal 1965-6 6, and,
although not specified separately, natural gas and gas liquids probably
accounted for somewhat less than $300 thousand during the same period.5
Louisiana taxes oil, natural gas and natural gas liquids under .
her General Severance Tax (Art. X, Sec. 1 and 21), Natural gas is taxed
•'•Distribution is authorized among the counties one-half to the County General School Fund, and one-half to the County Road Fund (Sec. 84-2112). From the Report By the State Comptroller, State of Arkansas, 1965, P. 33.
2Sec. 84-2102 (e), from Report by the State Comptroller, 1965 (Arkansas) p. 32.
3Ibid.
4Ibid. (Sec. 84-2102 (h).
5Biennial Report, Commissioner of Revenues, Arkansas, 1964-65,1965-66, p. 27.
at 2 3 /1 0 cents per thousand cubic feet at standard pressure (15.025
pounds pressure per square inch at 6o°F), with marginal wells, including
those in which the gas accompanies oil production taxed at 0 .3 cents per
thousand. 6 The tax on oil varies according to specific gravity, from
18 cents per barrel for 22 gravity and below to 26 cents for oil over
43 gravity. Wells incapable of producing more than an average of six
barrels per day are taxed at half the regular rates. 7 Natural gas
liquids are taxed at 2 cents per barrel for distillate, condensate and
all other liquids severed with either oil or gas. 8
Fiscal I966 yields were as follows: gas -- $82 millions;
27"0il and Gas Law", Texas Law Review, Supplement, Vols. 52-57 ( 195^-59). Article quoted is "State Taxation of Oil and Gas - Current Developments and Problems" by Lee Hill (Vol. 55j PP* 855“72), TLR p. 86 5; Suppl. p. 2*4-59.
28Validity in application of the Texas statute was successfully challenged in Michigan-Wisconsin Pipeline Co. v. Calvert (547 U.S. 157 1954)), which frustrated the State's attempt to tax gas collected for transmission by the pipeline (L. Hill, 0£. Cit., p. 865; Suppl. p. 2*1-59) • Louisiana's statute was ruled unconstitutional in Eel Oil Corp. v. Fontenot by the State Supreme Court on grounds of violation of the "commerce clause, of the U.S. Constitution (La. State Tax Handbook, 19^4j P* 44).
100
on the gas-gathering tax "..until the question of whether such taxes are
valid and constitutional...has been settled. ." 29 Gas-severance rates
were increased at the same Extra Session by 2 cents per thousand cubic
feet (the amount which the gas-gathering tax had levied) as a replace
ment . 30 After the gas-gathering tax was invalidated, the 2-cent charge
was extended to June JO, 196k, after which time it was reenacted as a
permanent rate. 31
Louisiana's Liquified Petroleum Gas Permits are levied on the
basis of a 19 -2 Act (Act 99; RS 40:18^*9) to apply to "persons, firms or
corporations desiring to store, sell or transport liquified petroleum
gases over state highways, or to install storage tanks...for use of
liquified petroleum gas." 32 The minimum amount applied is $75 and the
maximum $J,000,based on 0.25 percent of gross annual sales of the per
mit holder, and the tax yielded $55,551-25 in fiscal 1965-6 6, all allo
cated to the general fund. 33
The Royalty Gas Excise Tax is a levy which Louisiana utilizes to
assure that the producer returns to the royalty owner an amount equal to
the price received by the producer for the royalty owner1s interest in
gas products sold; the tax is levied as the (total) difference between
29La. State Tax Handbook, 19^4, p. M k
3°Ibid.31Ibid.
32Ibid., pp. 60-6 l.
33Ibid., Loc. Git., and Ann. Report, 1965-66, La. Comm, of Revenue s, p. l5T
101
the price paid to the producer and the price forwarded to the royalty
owner. 34 This is largely a preventive measure designed to assure fair
treatment of royalty owners, and the fiscal yield of $631.12 reflects
the fact that this tax is not calculated as a revenue-producer.
A relatively-similar intent to assure fair treatment of inter
ested parties to leaseholds appears to manifest itself in Texas' Severance
Beneficiary Tax (TSA Title 122A; Art. 22.01), which seeks to levy the
severance taxes on the "severance beneficiary", whether he be the pro
ducer, or someone who contracts with the producer for all or part of the
production of gas or oil for a stipulated period. 35 The intent of this
statute is apparently to lay the tax on the one who actually benefits
from the production by receiving the value on the resource commodity,
whether he is the actual severer or not. This is not to say that the
burden of the tax falls either on the "beneficiary" or on the producer
(or operator) . 36 This tax was not detailed as to revenues for 1966, but
its application and rates are the same as for the "occupation taxes"(Arts. 3*02 and k.02, and 3*H) previously noted, and their yield is in
cluded in the totals for oil and gas in Table 13.
Michigan, in addition to the regular oil and gas severance tax,
levies an Oil Privilege Fee, imposed on oil producers by the Oil and Gas
34La. State Tax Handbook, 196^, p. 71.
35VAST 122A, Ch. 22.
36The process of tax shifting, wherein the burden of a tax is transferred to someone other than the one on whom it is levied will be discussed in Ch. V.
102
Conservation Act of 1939 (Sec. 22, Act 61, P.A. 1939)•37 The oil privi
lege fee is payable on the same dates as the oil and gas severance tax,
at the rate of one-eighth cent per barrel of oi..l- .-produced, with its pro
ceeds going to the state General Fund . 38 The yield on this tax was
$18,270 in fiscal 1966, down from its higher yields of about $20 thou
sands, but apparently continuing a trend beginning in 1964 for smaller
yields. 39 Figures for this tax were included in the consolidated figures
for oil and gas severance in Table 13.
B. Taxation of Other Minerals
Leaving the subject of mineral-fuels taxation, the tax picture
becomes a bit more spotty, with different minerals being subject to spe
cial tax treatment in the several states. As previously noted, Michigan
limits her severance taxation to oil and natural gas, and applies no such
levies to other minerals. The only other mineral subject to severance
taxation in Texas is sulfur, but Arkansas and Louisiana levy several
taxes of the severance type on a variety of other minerals. In consider
ing the remaining minerals, it may be convenient to examine their taxation
by the individual states which impose them.Other Minerals Taxes -- Arkansas. Arkansas taxes all the mine
rals classifications other than minerals fuels under the general severance
3729th Annual Report, Department of Revenue Division, p. 79-
38Ibid.
39Ibid., p. 80.
103tax previously noted, with the disposition of revenues three-fourths to
the state1s general fund and one-fourth to the county of origin. Barite,
bauxite, titanium ore, manganese and manginiferous ores, zinc ore, cin
nabar and lead are all taxed at the rate of 15 cents per ton of 2,000
pounds.40 Of this group, the fiscal 1965-66 yields are detailed only
for bauxite, which yielded ^k0,^>62.6Q in taxes.41 Recent figures sug
gest that barite yields would be about $35-$^0 thousands, and the yields
of tax on the other listed ores would be very nominal.42
The severance tax applied to gypsum other than that used for
manufacturing in the State of Arkansas or sold for that purpose, and for
chemical-grade limestone, silica sand and dimension (building) stone is
one-and-one-half cents per ton of 2,000 pounds.43 The 1965-66 fiscal-
year report details none of these products as to taxes collected, but
some observations may be in order regarding probably collections. First,
gypsum used in manufacture in Arkansas is exempt from the severanee-tax
levy, and most or all of that produced in the state is devoted to these
purposes, principally the production of cement, wallboard and related
products. The other products are included in the "miscellaneous severence
4°Report by State Comptroller, Arkansas, I965, P* 52-41Biennial Report, Fiscal years 196^-65, 1965-66, Commissioner
Revenues, Arkansas, p. 2 7.
42Report by State Comptroller, Arkansas, 1965, p- 33*
43Ibid., p. 3 2.
104
category, and their individual totals are not available, but it appears
relatively certain that their significance, individually and collectively,
is very slight. 44
Finally, on crushed stone, sand of construction grade, gravel,
clay, chalk, shale and marl the rate is one cent per ton of 2,000 pounds.45
These items were included in the "miscellaneous severance" category and
are not subject to separate determination.
Other Minerals Taxes -- Louisiana. Louisiana's severance taxes
on minerals are somewhat more detailed and complex than those of Arkansas,
in that not only is the general severance tax applied to a variety of
minerals, but a special severance tax on sand and gravel is applied by
the Wildlife and Fisheries Commission ( RS 9:1101). First, the general
severance taxes will be considered.
The general severance tax applies the rate of $1.03 Per long
ton (2,240 lbs.) on sulfur, with the fiscal 1965-66 collections totaling
$2,714,645.34. 46 The rate on salt (common) is 6 cents per ton of 2,000
pounds, with 1965-66 collections of $231,418.07; salt in brine used in
manufacture of other products is taxed at one-half cent per ton of
2,000 pounds, and the yield in fiscal 1963-66 was $23,185-75*47 Louis
iana also levies a tax of 10 cents per ton on coal and ores, and a
44The bulk of the "miscellaneous" yields has been accounted for by gas and barite (see preceding pages).
45Report of State Comptroller, Arkansas, 1965, p. 32.
46La. State Tax Handbook, 1964, p. 80 and 26th Annual Report,La. Department of Revenue, I965-66, p. 10.
47Ibid.
105
tax of 20 cents a ton on marble, but no revenues were reported on these
substances for fiscal I965-6 6 .48 The same distribution of revenues from
the severance tax on the above minerals applies as that for general
severance-tax receipts from oil and natural gas.
The special severance tax on sand and gravel administered by
the Wildlife and Fisheries Commission is imposed on "persons receiving
permission from the...Commission to take sand or gravel from the water
bottoms of the State."49 The rates applied are: screened sand -- 5 1/2
cents per cubic yard; gravel, screened or washed -- 15 cents per cubic
yard; sand and gravel mixed and unscreened — 10 cents per cubic yard;
and fill material -- 2 1/2 cents per cubic yard. 50 An exception is pro
vided for materials taken from the Pearl River forming the boundary be
tween Louisiana and Mississippi, where a rate of one-half the above
schedule applies, 51 apparently a recognition of mixed jurisdictions.
Collections from this tax are retained by the Commission and placed in
the State Conservation Fund, with collections amounting to about $13 -
thousand in fiscal 1965-6 6. The bulk of these collections (est. $100
thousand in fiscal 1965-66) comes from fill material. 52
48La. State Tax Handbook, 19^-> P* 80, and 26th Annual Report, La. Dept, of Revenue, p. 10,
49La. State Tax Handbook, 196^, p. 8 5.
5°Ibid.
5lIbid., p. 86.
52llth Biennial Report, 196^-65, Louisiana Wild Life and Fisheries Comm., p. 14.
106Other Minerals Taxes -- Texas. In the "other minerals" cate
gory, Texas levies only one severance tax, an "Occupational Tax on the
Production of Sulphur" (Title 122A, Arts. J.Ol-J.Ok),53 This tax is
levied on sulfur producers at the rate of $1,03 per long ton (2 ,2k0 lbs.),
and is subject to basically the same provisions as the other "occupation
taxes" discussed previously. The yield on this tax for fiscal 1965-66
was $3 ,330,0 0 0 .54
C. Leases and Royalties
Although these collections are not, strictly-construed, taxes
on mineral industries, they do represent a sometimes-considerable source
of public support from such industries, and thus are deserving of exami
nation in this study. The State of Arkansas collects royalty and lease
hold payments under stipulations of the severance tax law, which authorizes
the Commissioner of Revenue "..to enter into contracts with producers pro
viding for the severing of resources from the beds or bars of navigable
rivers and lakes, and other lands held in the name of the state."55 The
leasehold payment is determined by negotiation, and the royalty payments
are provided for under the following rates:56
53VAST; Title 122A; Ch. 5 .
54Report of the State Comptroller of Public Accounts, State of Texas, I966, Part la, Table No. 1.
55Report by the State Comptroller, 1965? p- 32.
56Ibid., pp. 32-33.
107
...on sand, 2 1 /2 <£, per cubic yard; on gravel, 5f£ Pet cubicyard; on coal, 6$6 per ton; on oil, gas and casinghead gas,1/8 of value; and on other natural resources, such amounts as may be agreed to by the contracting parties, with the advice and approval of the Attorney General (Sec. 10-1101).
For fiscal 1965-66, revenues from all oil and gas leases amounted to$8 ,7 2 6.7 6, and royalties from sand, gravel and oil amounted to $109,O8O.6 3 .57
All royalties and leasehold payments are classified as general revenues,
payable into the state1s General Fund. 58
The State of Louisiana collects massive sums from leaseholds
and royalties, particularly for petroleum and natural gas production in
state-owned and controlled lands in the tidelands and coastal areas,
along with some inland operations in game refuges, parks and inland water
ways. The total from oil and gas leases for fiscal 1965-66, combined with
royalty receipts amounted to an estimated $102.9 millions. 59 These pay
ments for leaseholds and royalties are classified as both general and
special revenues, and their disposition is to various agencies; in I966
the General Fund received an estimated $72.8 millions, the highway fund
was allocated $15 millions, and the remainder was allocated to the Conser
vation Fund. 60 Some revenues were reserved to the use of agencies asso
ciated with the lands from which severance occurred. 61
57Biennial Report, 1964-65, 1965-6 6. Commissioner of Revenues ( Arkansas), p. 6 .
5eReport by the State Comptroller, I965, P- 33-59State of Louisiana Executive Budget, Fiscal 1965-66, pp. 4,
6 ; Sched. 5 7 .
6°State of Louisiana, Executive Budget, I966, Loc. Cit.
6lIbid.
108Texas also realizes considerable sums of revenues from leases,
rentals and royalties on resource lands she owns or controls, though not
so much as is true of Louisiana. Identifiable sources of such royalties
in fiscal 1965-66 were: oil, gas and mineral royalties, about $36 mil
lions; sand, shell and gravel sales, about $‘1.5 million; mineral leases;
rentals, and bonuses, about $15 millions.62 All sources of sale, rental
and royalty transactions were estimated to yield about $95 millions in
1966, but other, public properties than resource lands were apparently in
volved. 63 The items which could be identified as resource-connected
accounted for nearly $52 millions, in any case.
Thus, about $260 millions of the state's revenue comes directly
from the basic-resource-development industries, either in the form of
severance levies or other payments. This constitutes about 11 percent of
the total state revenues for fiscal 1966 of $2 ,335 millions. 64
62Report of the State Comptroller of Public Accounts, State ofTexas, 1966, Part la, Table No. 1.
S3Ibid.
S4Ibid.
CHAPTER V
SOME NOTES ON SHIFTING, INCIDENCE AND EFFECTS OF NATURAL RESOURCE TAXATION
Taxes levied upon business are seldom willingly retained as a
burden of the enterprise. Rather, they are subjected to the process
called "tax shifting", in which an attempt is made to transfer the burden
of payment to someone other than the enterprise upon which the tax was
levied. 1 The final disposition of burdens arising from taxes levied upon
resource industries may have substantial implications for policy goals
(previously discussed in Chapter I of this study), either furthering or
frustrating them. Therefore, some attempts will be made to analyze the
most probable disposition of the tax in the light of policy aims, to
determine whether existing forms of levy contribute to the proper "mix"
of conservation, incentive to production, and reliable yields of revenue
within the limitations imposed.
A. Structural Basis for Tax Shifting: Commodity-Tax versus Property-Tax Approaches
Economic Basis for Shifting. A prime requisite for tax shift
ing is that the tax be levied against, or associated with, a commodity or
service which is subject to a price transaction; that is, the capability
10ne helpful distinction in understanding tax shifting is the characterization of the point at which the tax is levied (and collected) as the point of "impact", while the final resting place for the burden (payment) is called the point of'incidence". Sharp, Ansel M., and Bernard F. Sliger, Public Finance, (Homewood, Illinois: The Dorsey Press, 196 -,p. 210) .
110
must exist to assign the cost of the tax bill to one or more items pro
duced and/or exchanged for value by the person or firm taxed. 2 Not all
taxes are assumed to be subject to shifting however, and the above case
contrasts with the case in which shifting is thought to be virtually im
possible: when the tax is levied on property reserved to personal use, on
pure profits (economic surplus), and generally when a tax is levied on
personal income. 3 Taxation of commercially-exploited natural resources
would, of course, lie within the scope of tax-shifting possibility.
Taxes assessed against resource industries may generally be
classified as comprising two overall categories: those assessed against
resource-producing properties, and those which bear directly upon the
resource commodity in one or more stages of its production and distribu
tion. The former category would include ordinary ad valorem property-
tax levies, and, to a lesser extent, special yield-tax variations on the
ad valorem convention (the manner in which this tax is assessed and col
lected renders it very much like a commodity tax, though it is technically
designated a property tax). The latter group would apply, as a practical
matter, to severance levies (although these are nominally "privilege"
taxes levied on the act of severing, the severed commodity becomes, in
2Ibid., pp. 211-212.
sThis last generalization is not universally held, however, when the "person" is a business corporation, and the tax imposed is the corporate income tax. Many students of tax shifting contend that, as the tax actually touches elements of capital, rent and other contributions than "profits" alone, some backward shifts may take place (to workers, bond-holders and others) or some forward shifts through higher prices to consumers (See Groves, 0£. Cit. p. 150-51).
Ill
practice, the object of the taxation). Because of the existence of a
price transaction associated with exploitation of resources for commercial
purposes, the nominal capacity for shifting exists in either type of levy.
Given the presence of a price transaction, the extent and direc
tion of tax shifts are dictated by market conditions; not only those pre
vailing at the origin of the basic resource, but throughout the distri
bution system for the resource and its ultimate products. Perhaps most
commonly, the forward shifting of a tax is the mode first thought of as
a possibility. Attempts to shift taxes forward from the point of impact
are largely based on the degree of inelasticity, real or presumed, in the
demand for the product of the person or firm taxes; the success of such
shifts is dependent upon the actual degree of market elasticity and the
long-run supply conditions of the firm or industry attempting the shift. 4
4The consequences of long-run supply conditions to the extent of tax-shifting under competitive conditions may be illustrated by two elementary cases: constant long-run average costs (fig. 1-a) and increasing long-run average costs (fig. 1-b) ,
Figure 1 - Tax Shifting: Constant vs. Increasing Costs.a. Constant costs b. Increasing costs
_ S 1
Quant0qo
D = imperfectly-elastic demand for product
SG = Industry Supply curve before tax - (constant- cost)
Si = Industry Supply curve after tax
P0 - Price before tax Pi = Price after tax
(continued on following page).
D
0 Quant
= demand curve similar to
So*that in fig. 1-a Industry Supply curve before tax (increasing cost)
Si1 = Industry Supply Curve after tax (increasing cost)
Po* = Price before tax Pi' = Price after tax
In a purely-competitive market, the individual firm must be largely con
trolled in his shifting options by the consequences of the tax upon
aggregate supply conditions for the industry ( see note below) .
In a case of complete monopoly, the monopoly producer may seek
to shift the tax, and would be successful to the extent necessary to re-
equate marginal cost and marginal revenue. However, inasmuch as his mar
ginal revenue would rise more rapidly than his average revenue, the
resultant price increase would be somewhat less than the sum of the ori
ginal price plus the (unit) tax. This may be most readily illustrated
in the case of a tax assessed on the basis of a given amount per unit ot
output (a specific levy). In figure 2 below, let AR and MR represent,
respectively, the average revenue ( "price-line") and marginal revenue
functions for a monopoly firm (not necessarily the classic "pure mono
poly", but a single seller in a given product market). Functions AG and
MC may be taken to represent average cost (total) and marginal cost curves
prior to the imposition of the tax, and AC1 and MG' the same data after
imposition of the tax. The disparities between the vertical heights of
AC and AC1, and MC and MC1 designate the amounts of the tax per unit.
The Price before the tax is denoted by P, and the resultant tax after the
monopolist attempts to shift the tax by P1.
4(cont'd).It will be observed that, in the case of increasing long-run average costs, the price after the tax (Pi1) is less than that for constant cost (Pi), which was equal to the original price (P0) plus the entire amount of the tax. In the case of increasing average costs, a portion of the tax was shifted to price, and a portion absorbed in lower cost data ( lower payments to productive factors employed). The greater the slope of the long-run supply curve (i.e., the less elastic), the lesser the shifting of the tax to price. Adapted from Sharp and Sliger, Op. Cit., pp. 214-15, an-d Due, 0j>. Cit., pp. 264-66.
113
Figure 2
Forward-Shifting of a Production Tax -- Monopoly Case
Price
MC
\ MRQuantities
As may be observed in figure 2, above, the monopolist reacts to
the imposition of the tax by seeking to set a price which will re-equate
marginal cost and marginal revenue (his profit-maximizing condition), but,
because of the differential rates of change in MR and AR , 5 this equality
is reached at a price below the amount which would equal the old price
plus the whole amount of the tax. The less elastic the market demand
faced by the monopolist, the more of the tax ultimately finds its way to
the price. 6 Thus,, the pure monopolist, dealing with a necessity item,
5This condition is characteristic of all less-than-pure competition, wherein actions of a single firm, will tend to alter the price (AR) position for all firms; the greater the price control, the more pronounced the change, other factors equal, showing the greater effect on aggregate supply conditions.
sDeclining marginal (and average) revenue commences for the firm operating in imperfectly-competitive markets with the first unit produced, with gains in total revenues arising from a balance between the price of the added unit produced and sold and the loss of potential revenue from all units previously produced occasioned by the new price (necessary to sell the marginal unit). Thus:
MR = Price of One Additional Unit Sold minus (Reduction in Price for all Previous Products Sold) x (Previous Quantity Sold).
114would be expected to transmit a larger part of any tax through price in
creases than, say, a monopolist producing a luxury good, or a good with
many close substitutes.
As a practical matter, it is doubtful that many products are
produced or sold under either conditions of pure competition or monopoly
of the total degree suggested above. Rather, the more usual case may in
volve conditions of imperfect competition ( characterized by a considerable
number of producers, operating more or less independently of one another).
This condition (often called "monopolistic competition”) gives rise to
some degree of price power, either due to special advantages of location7
or product differentiation,8 but no firm enjoys more than slight pricing
power. A second practical alternative is oligopoly, a market structure
characterized by a few powerful sellers who dominate the industry, with
each firm keenly aware of the power possessed by his rivals. In this
latter type of market structure, the policies and actions of each firm
would be largely conditioned by expectations as to the possible reactions
of rival firms.
Due9 suggests that, under conditions of imperfect competition
where the firms operate independently of one another, they would attempt
to adjust prices upward in an attempt to recoup the cost of the tax increase, but, having little price power individually they would ”... trans
7Defined by Mrs. Joan Robinson in The Theory of Imperfect Competition (London: The Macmillan Company, ltd., 1933)•
sConcept of E. H. Chamberlin, Theory of Monopolistic Competition (Cambridge: Harvard University Press, 1933)*
90p. Cit.
115
fer little of the burden to the customers, and most would rest temporar
ily upon the owners of the business firms"10 (through loss of profits
given the prevailing demand and supply data). The exodus of some sub
marginal firms would be necessary to re-align average cost and price
data for the surviving firms (i.e., to increase the share of market de
mand enjoyed by each of the survivors -- to shift the Average Revenue
curve upward to accomodate the higher average costs).11 If, as a result
of the exodus of some of the firms, the demand curve facing firms sur
viving becomes less elastic than before, then the final prices will re
flect a greater amount of increase than the tax, theoretically; if
greater elasticity results (as each producer may expand his scale of
operation and enjoy economies of scale, for example), then the final
price may reflect less than the full amount of the tax.12 The implica
tion of the above generalizations is that the monopolistically-competitive
producers are producing initially at less-than-optimum scale, both in the
long- and short-run senses (i.e., at greater-than average costs), and
that any cutback in output is possible only average and marginal costs;
similarly, any increase in scale or quantity of output may be expected to
10Due, 0£. Cit., p. 268.
i;LIbid.
12Ibid.
/
116
yield lower average costs (see figure 3 below as a general-case illustra
tion of cost-revenue relationships) . 13
The oligopoly case is, if anything, even less determinate than
the ill-determinate case of monopolistic competition, regarding shifting
possibilities. The keen awareness of oligopoly firms for one another's
economic significance (mutual interdependence) adds its weight to the
self-interest of the firm in making price and output decisions. No firm
operating in such an industry would invite destructive retaliatory actions
on the part of his rivals by a precipitate action disregarding their pre
sence. Rather, as Due suggests, "Firms, in reacting to changes in costs,
will typically not disregard the probably responses of competing firms,...
and to the readjustments they make in their own prices." 14 To the extent
that the tax is generally applied to all the oligopoly producers, and
"..each seller knows that competitors are likewise affected..", then Due
feels that the tax would be shifted forward by the firms simultaneously,
finding it profitable "...provided that the prices had not already attained
13The following diagram is suggestive of the theoretical long- run equilibrium for. a monopolistically-competitive producer: (AC = ARonly at point "T", otherwise AC exceeds AR) .
the levels which would maximize profits for the firms as a group."15 Note
that it is considered of first importance that it be known that all firms
will respond to the price change, a factor which might prevent or curtail
shifting of taxes imposed upon only one or a few oligopoly firms operat
ing in one area or state, but not all firms in the industry. In a case
such as this, unless one of the taxed firms were dominant (a "price lead
er") , forward shifting might be forestalled.
The alternative to forward shifting is, of course, backward
shifting, in which the attempt is made to transmit the burden back to
a supplier, or to an earlier stage of production. As has been noted
above, some backward shifting accompanies implementation of forward shift
ing (i.e., as a consequence of the lesser quantities of product sold, de
mand for inputs is affected). When forward shifting is prevented, such
as in the presence of a highly-elastic demand for the product, highly
competitive conditions among producers,16 etc., then the only shifting
alternative is backward shifting. Just as forward shifting depended to
a considerable degree upon inelasticities (either in product demand or
due to market control, or both) in the demand curve faced by the seller,
so backward shifting depends heavily on an inelastic supply schedule for
15Ibid.
inputs. The logical terminus for any backward shift is with the first
supplier of inputs ( factor of production), though complete backward shift
ing would require a perfectly inelastic supply curve for output. 17 Hob
son18 feared that excises which were shifted backward might result in the
destructive taxing of the "social cost" inherent in basic materials, tend
ing to "dry up" these sources until the resultant shortages "raise the
prices of the taxed factors and thus readmit them to restore the requisite
supply"19 (possibly through higher prices in the product markets, thus
transforming an attempted backward shift into an ultimate forward shift).
Groves suggests that Hobson's thesis, though "sound enough", still does
little to aid in distinguishing "social cost" from "social surplus," citing
the case of nonreproducible (natural) resources as having a "..highly
inelastic supply.." and "..their services would not disappear if their
owners' rent were taxed away."20 This assertion contains considerable
l7Under these circumstances," no matter how demand for the product were affected by taxes, no price' above zero would theoretically call forth less (or more) supplies of the product, as below, DD represents the demand curve for the product prior to the tax, and D'D1 the demand curve net of the tax (per unit). The perfectly-inelastic supply curve SS remains unresponsive to the change. Q
PriFigure ^Perfectly-inelastic Supply and Backward Shifts of Taxes
lsHobson, John A., Taxation in the New State (New York: Harcourt, Brace and World, 1920).
19Groves, 0£. Cit., p. 120.
20Groves, 0£. Cit., p. 120.
P
Quantity
119
moment for the policy results of taxes at their final resting place { in
cidence) . Although backward shifting traditionally is not considered to
be as widespread as forward shifting, there do appear to be important
possibilities for this mode associated with basic natural resource devel
opment .Having considered the mechanics of tax shifting in order to
provide a basis for understanding the phenomenon, the following sections
will make some generalizations regarding possible patterns of shifting
for taxes levied on basic natural resources.
B. Property and Yield Taxes on Natural Resources:Some Probable Patterns of Shifting and Incidence.
Property taxes of various forms, as has previously been asserted,
constitute the principal locally-generated levy against natural-resource
industries. It has also been noted (Ch. I) that modifications of the
ordinary ad valorem property levy have been instituted in a number of
states to fit the burden of such tax to the economics of resource-exploit
ing industries. Still, property taxes are levied and collected from nat
ural resource industries. The question to be pursued in this section is:
who pays these taxes, and what are the means by which they are transferred
to the point of incidence? The answers may provide some insight into the
policy effectiveness of such taxes, and offer some bases for further modi
fications in the property-tax structure.
Property Taxes on Timber Resources. Seeking to assign general
rules-of-thumb to shifting and incidence for timber taxation is to deny
both the variety of levies applied, and the differing market structures
120
associated with timber suppliers and owners of timber tracts. The timber
owner may be a farmer, a nonfarm owner of a small private tract, a large
tract-owning speculator, a firm engaged in the wood-products industry,
or a government owner. 21 Necessarily, the manner in which property taxes
(including yield taxes) bear upon these owners differs with each classification. For our purposes, timber owners will be broken into the classes
of small private tractholders, large private tractholders, and wood-prod
ucts industrial holdings (government owners, of course, not being subject
to the property taxes, as such).
The small tractholder has probably received a disproportionately-
large share of attention of students of property taxation, historically
( see Chapter I and Chapter II above), The burden of the property tax on
timberlands held in small tracts seems to be a particularly onerous one,
especially on those tracts not actively in process of cutting. Thus, the
earliest efforts at reform of the property-tax laws were largely directed
at seeking relief for this classification of timber owner. 22 Viewed from
the standpoint of the possibilities available to the small tractowner,
the economics of tax shifting encompass a rather narrow range, at best.
The elasticity of the supply function for timber products of
the small tract owner is likely to be very slight; especially so if his
property is located in an area unsuited to competitive uses, or the quality
of the land is such as to be unsuited to other agricultural application.
At the same time, competition for the exploitation of small tracts is
21For the survey states, and for the nation, see the distribution of ownerships noted in Table 5, Chapter II.
22See the discussion of yield taxes in Chapter I.
121
likely to be limited, with no more than one or two potential developers
for the timber "crop". Under these conditions, and based on the infre
quent occasions on which timber may be "harvested", the small timber
owner may be forced to absorb a good portion, if not all, of the property
taxes levied annually.
The small tract holder may fare somewhat better under the yield-
tax exception to the property levy, but only by delaying the assumption
of burden of this tax, levied against the timber at time of cutting. Again,
his poor economic position relative to buyers is likely to mean the absorb-
tion of the bulk of any stumpage levies assessed in connection with the
yield tax. The general existance of poor quality in small-tract stands
(see Ch. II above), will further prejudice the market power of the small
owner.
The large tract owner fares somewhat better in economic power
than the small owner, in that his ability to influence the prices of tim
ber in the locality is bolstered somewhat by the scale of his operation.If relatively small sawmills, poleyards, or even pulp mills in the area
consider his tract significant enough for their total needs, the large
tract owner may be able to shift at least a part of property taxes to
them. One difficulty in shifting the ordinary ad valorem levy is the
problem of calculation of a per-unit charge applicable to the timber crop. Where the yield tax is assessed in lieu of the regular tax, this calcula
tion may be made considerably easier and the (normally) percentage levy
either included in the price or as a separate contract item payable by
the buyer.
122
Whereas the small tract owner had operated either in a highly-
competitive or at best monopolistically-competitive market in which he
was virtually without power, the large tract owner is likely to have, if
not a monopoly in the area, at least the position of an influential oli
gopolist in this generally-localized industry. The shifting possibilities
for taxes levied against the forest property are to be determined accord
ingly.The forest-industries owner represents a growing category of
timber ownership, and seems destined to continue this growth for the fore
seeable future, accounting for 13 percent of timberland ownership nation
ally, and nearly 20 percent of timberland in Arkansas and Louisiana, 26n £3percent in Texas, but only o percent in Michigan. These lands, owned
and managed by forest industries, are generally in medium-sized-to-large
tracts, often comprising the bulk of timberlands in the locality. Taxes
assessed against this property classification would be subject to attempts
at forward shifting. Vertically-integrated, diversified corporations
(such as the Georgia-Pacific and Dierks Forests operations in Arkansas,
Louisiana, Texas and other states), possess sufficient market power to
exert considerable price power in markets extending to the final sales of
lumber, paper products, poles and posts, etc. Giant firms, though numeri
cally a minority in the wood-products industry (with the possible except
ion of the paper industry, which requires such capital outlays for plant
and equipment as to exclude very small operations), exert considerable in
fluence in wide markets, and this influence should continue to grow. Both
ooSee Chapter II, Table 5b.
123
the conventional ad valorem tax and, where applicable, yield taxes are
quite likely to be shifted forward under either near-monopoly or oli
gopoly conditions.
The existance of policies established by various trade asso
ciations and "rating" boards (such as the Southern Pine Inspection Board)
may help in standardizing prices at the final product market, and thus
aid in forward shifting of the tax. This is a potential aid to large
tract owners as well as to wood-industries owners. It is unlikely that
such organizations provide a similar service to many small-tract owners
or to the mills using their products to produce "unrated" lumber.
Finally, in comparing the ad valorem property tax with the
yield-type levy, Professor James Yoho24 suggests that, when not unreason
ably high, the ad valorem (annual) tax tends to mitigate in favor of the
"all-age" type of timber operation, in which the products are more-or-less
continuously harvested.25 The yield-type levy, which may be deferrable
until harvest, tends to favor the "even-age" stand1 or at least to make
it feasible, in his opinion.26 In any event, excessive ad valorem levies
may be expected to work to discourage increasing the density and/or quality of stands, as the taxes (if assessment is kept up to date) would be in
creased with each stand improvement.27
24Yoho, James C., "Economic Impact of Local Taxes and Death Taxes on Timber Resources," Timber Tax Journal, Vol. I, No. 1 (July, 1965), pp. 50-65.
25Ibid., pp. 56-7 *
26Ibid.
^Ibid., p. 53-
12k-
' In the harvesting of a mature stand, also, the annual levy
would constitute a valid reason for withdrawing timber as rapidly as pos
sible, thus reducing the exposure of the stand to tax assessment, and pro
ducing a cost saving. The yield-type levy produces no such urgency, and
it is precisely this quality which prompted its initial adoption as a
conservation expedient.
Which type of measure, then, is best suited to modern forestry
objectives? This is a difficult question to answer in absolute terms, as
the considerations center on whether it is preferable that the forest
yield an annual product, or that it be allowed to mature as a single unit
("even-age" forest). Much of modern forestry leans toward the former
application, though Professor Yoho associates high quality with the latter.28
It may be necessary to provide an option between the election of an annual
tax or a deferred, yield-type levy for different tracts and for different
purposes (e.g., sawtimber is somewhat more amenable to the extended, "even-
age" tract method; pulpwood might readily come from the "all-age" stand).
In any event, rates applied through the ad valorem tax should be reasonable.
Professor Yoho suggests that "frozen" rates might be utilized; that is, a
ceiling may be set on the assessment and/or rate for property taxes col
lected against timber tracts.29 In this way, the owner would not be penalized for stand improvement, and, as long as the rates were sufficiently
high to prevent pure speculations, they would occasion no great advantage
28Ibid., p. 57.
29Yoho, Op. Cit., p. 57.
125
or disadvantage for either approach to timber management over the
other.30
Property Taxes on Mineral Properties. The exploitation of
mineral properties entails a complex and mixed set of ownerships and
industrial structures even more varied than that for timber. In order
to encompass the entire range of market structures, one must include
small, localized operations for the excavation of sand and gravel, or
clay for local brickyards, along with the gigantic and powerful complex
of exploration, drilling, pipeline transport and refining of the oil in
dustry. For purposes of this analysis, taxation of mineral lands will be
considered on the basis of localized versus interregional production; and
ownerships on the basis of small, large and industrial categories.
Small ownerships of such common minerals as sand and gravel,
stone and clay, and other minerals of no particularly unique qualities
would likely be operating in markets in which price is largely determined
by the level of demand for the product. That is, local or regional acti
vity in such areas as residential and commercial construction, roadbuild-
ing, brickmaking and related activities would set standards for prices
received. To the extent that development of these materials does not
compete with such other activities as farming, residential use or other
economic applications (e.g., the case of excavation of sand and gravel
from creek and river beds), supply would tend to be highly inelastic. For
the small-tract owner, there is a general likelihood that he will be unable
to shift the property tax forward in any significant or predictable degree.
30Ibid.
126
An exception would arise in the case of a particularly-rich, or parti
cularly-well-located deposit which might command a premium price, com
pared to other sources of supply. In the case of inferior deposits, it
is possible that no development offers may be made to the owner, or
offers made may not be considered worthwhile, even given the more-or-less
"surplus" value in such deposits.
Even when the small tract owner commands deposits of minerals
with an interregional or national market, such as petroleum or natural
gas, he may enjoy few opportunities for shifting the property tax forward.
Having insufficient capital and/or technical knowledge to develop such
deposits, and given the high fixed costs associated with oil and gas pro
duction, the small-tract owner is generally forced to deal with profes
sional developers ("wildcat" speculators or pipeline or petroleum companies).
These developers, in turn, seek to execute leasehold agreements with
several tractowners in a given locality, in order to achieve economic
scale of operations (a leasehold agreement with any individual small
tractowner may even include an "escape" clause, to be exercised in the
event that sufficient numbers of leases, or sufficient area for develop
ment, are not secured by the developer to make production worthwhile).
Thus, in the case of the small minerals tractholder, as in the case of
the small timber owner, the possibilities for shifting the burden of pro
perty taxes are very limited.
Owners of large tracts (or even medium-sized tracts of unique
advantages of richness or favorable location) would be likely to fare
better, to the extent that they have the capacity to affect supply appre
ciably in local markets. Even in interregional or national markets, the
127
size of their holdings alone may give these owners some advantage among
regional developers. Because large leaseholds negotiated with a single
owner tend to insulate the owner from "whipsawing" (setting one owner
against another in negotiating the lease), and may be attractive to seve
ral developers bidding against one another, the owner may be able to shift
a portion of the property taxes forward to the developer eventually awarded
the lease. This presumes, of course, that the owner has some basis for
estimating the cost of such taxes for purposes of incorporating them into
the leasehold and royalty agreements.31 A minimum of records-keeping, however, should make this feasible.
Large tractowners should find agreements on resources traded in
the less-competitive markets (e.g., petroleum, natural gas, metals, etc.)
less subject to wide variations in both numbers of prospective developers
and terms which such developers are willing to accept than for the more
competitive or localized markets (such as for sand and gravel, stone and
other materials generally used in the locally-oriented construction in
dustries) . This may be due to the fact that the former group possess a
greater capacity to shift the taxes through monopoly price power to a
later production stage.32
31If, for example, a tax on a given tract amounts to, say, $500 per year, the owner would adjudge the rate of earnings on a lease net of this amount, as follows:
rate = L( leasehold amt/term of lease) + avg. royalty-] - $500 Market Value of Leased Lands (est.)
32As long as the industry may be able easily to include the shifted tax in an administered price structure, resistance to the shift would tend to be considered unimportant; a "markup" on this part of cost may even be possible (see Groves, 0j). Cit., pp. 285-6: "pyramiding" of taxes).
128
Industrial tractowners will view shifting possibilities largely
on the basis of their price power in the markets, which may be extensive
in the case of large, vertically integrated concerns in industries pro
ducing and selling in oligopoly or virtual monopoly markets (e.g., the
petroleum, metals, salt, and sulfur industries nationally; the cement,
glass, brick and other industries locally or regionally). In these in
dustries the property tax is viewed as a cost of production, and the
attempt to recoup this cost through the price of products is a foregone
conclusion.
As in the case of other industries, excessive property taxes on
natural resource holdings of industries may exert a repressive effect.
This would be especially true of a firm operating interstate or inter-
regionally in a market characterized by highly-competitive conditions.
In the bulk of resource industries operating on a national scale (oil
production and distribution, metals, sulfur, salt, gypsum, etc.), however,
the rule is oligopoly organization virtually throughout the production,
distribution and marketing processes. In oligopoly the practice of "bulk-
line cost" pricing, in which market price is administered either covertly
or more-or-less overtly to accommodate the least efficient (highest-cost)
member of the oligopoly in a position of at least minimum profits.33
Under such an arrangement, the highest state or local tax rate paid by
one of the oligopoly producers may actually become a substantial element in price-fixing for the entire industry, in addition to allowing the
33Backman, Jules, Government Price-Fixing (New York: Pitman Publishing Corp., 1938)» pp* 31j 3^~5*
129producer in question to shift the entire amount of the property tax from
the point of impact to the point of ultimate sale. Conceivably, then,
the final effect to the private sector of the economy is a shift of much,
much more than the very highest property tax assessed by any state or
locality, with the more-favored firms enjoying a substantial monopoly
profit as a consequence,
A study of property taxation would be incomplete without a con
sideration of the subject of tax capitalization. This is a special case
of tax shifting in which the perpetual burden of any newly-imposed prop
erty tax is theoretically permanently shifted backward to the owner of
the property at the time the tax is imposed.34 This phenomenon, of course,
would be most applicable to property devoted to commercial purposes, but,
in a sense, it may be applicable even to residential property to the ex
tent that real property taxes are a consideration in the decision of a'
householder to buy. The requirement of a price transaction to enable
shifting is met by what Sharp and Sliger35 describe as "a simulated one between the current property owner and the future buyer of the property”.36
For the owner of natural resource lands, especially for the small-tract
owner, this is likely to mean a capitalization of not only the bare-land
tax on his property, but the capitalization of yield-tax charges in the
case of timber or other materials whose realization for production is sub
ject to taxation at time of conversion. If a corrollary may be apended to
34For an excellent discussion of tax capitalization, see Groves, Op. Cit., Ch. 6, pp. lk-2-h .
35Sharp and Sliger, Ojd. Cit.,
360£. Cit., Supra note no. J, p. 212,
130
the concept of tax capitalization, it would be that an area characterized
by very low tax rates applied to real property may find the sellers at
taching a "negative capitalization" to this virtue. That is, inflated
property values may be the result of property taxation which is signi
ficantly lower than that for otherwise-competitive properties. Thus, the
property owners at time of the enactment of special property-tax deferrals
or exemptions may actually enjoy a speculative economic surplus associated
with the capitalized value of such tax relief. 37
37The extent of this "negative capitalization" is by no means certain, but it may be described by the following formula:
t*p = A + S11 r
where
P = Market price,A = Net Annual return in an adjacent ( or similar) competitive
area with a higher tax rate (net rent),S = difference in ad valorem (or other) property taxes favoring
the region in question, and, r = average return for similar properties deemed sufficient
to induce purchase and development.
Thus, if the average net rental return on a parcel of property in a higher-tax area, sufficient to induce development at a rate of, say 5 percent were $300; then the value of such a property would be (capitalized) :
P = — = — ^ 05— ” $6,000; while for the favored (negative capitalization) region, the value would be:
- -fooo ti.100 „ $8,000,* Upwhen the tax advantage (St)for the favored region is $100 (less) compared to the tax in the less-favored region.
C. Severance Taxes on Natural Resources:Patterns of Shifting and Incidence
The unique application of the severance tax to the equally-
unique natural resources industries contains the elements necessary for
shifting of the tax (price transaction, component of cost structure of
commodity, differing elasticities of demand and supply in the markets,
etc.), and constitutes, in operation, a commodity tax. Though the tax
is variously applied as a "privilege" tax (Arkansas, Louisiana, Michigan,
et. al.), or as an "occupation" tax (Texas), or on some other basis of
nominal designation, the fact that the tax involves the extraction, pro
duction and distribution of commodities in trade would lead those in
volved to regard the severance tax as applying to the commodity. As In
the case of property taxes, the analysis will be made on the basis of the
ability to shift the tax by various classes of resource owners and devel
opers, and for various types of resource industries. Special attention
will again be given to the timber and wood-producing resources as distin
guished from minerals industries, representing,respectively, renewable
and nonrenewable resource classifications.
Timber Severance Tax Shifting and Incidence. As should be appar
ent by now, little reliance is placed by the survey states upon timber
severance taxes for public revenue; rather the bulk of such taxes is de
voted to the interests of conservation and forest management (See Ghs. I,
III). The presence of the tax, however, has the same immediate implica
tions for shifting and incidence as if it were disposed in the conventional
manner of distribution for revenues, and the incidental benefits received*
by forest owners and developers from forest improvements financed by the
132
tax have little, if any, bearing upon the desires of owners and developers
alike to 'shift the burden of the tax.
Timber severance taxes are levied upon the ’’severer" or developer
of the resource property, whether he be the owner of the lands, or someone
with assigned leasehold rights conferred by the owner. The final resting
place of the tax, however, may or may not lie with the severer: his capa
city to shift the burden of the levy to others will determine the final
resting place for the tax.
Severers dealing with small tract owners are likely to have the
option of the direction of shifting which they will choose -- backward
shifting to the tract owner (capitalization, as it were, of the diminished
net value of timber after the tax), or forward shifting to the processor
(this would be of more practicality if the severer had several alternative
customers for his product] the likelihood of success would be reduced in
proportion to the economic power of the processor, increased with larger
numbers of processors). As in the case of the property tax, the small
tract owner would have little price power (due to his insignificant con
tribution to supply) to influence the price received from severers, and
thus would be in no position to protect himself from a backward shift of
the burden of the severance tax, save for diverting his lands to alternative uses. The option would largely lie with the severer.
The developer (either owner or lessee) of timber resources on
small tracts would face forward-shifting possibilities largely based on
the numbers and economic power of would-be processors or manufacturers of
wood products in the locality or region. Thus, if the severer were for
tunate enough to deal with a number of small competing sawmills in an
area, elasticities of supply faced by any one of these sawmills might
cause the acceptance of at least a partial forward shift of the tax.
Similarly, a choice between sawmills, pulpmills, postyards and other
wood-users competing with one another might ease forward shifting, espe
cially if there were a limited number of suppliers. However, if the
severer were only one of a large number of suppliers to, say, a monopson-
istic paper mill, dominating the area, then it is quite unlikely that the
severance tax would be accepted as a part of the supply contract unless
the mill were able to transmit the cost to the ultimate market. A further disadvantage for severer and/or owner prevails when the timber crop
is limited in its market applications (e.g., smaller, poletimber-sized
tress on second-growth stands would be suited only to either pulpwood or
post production). In these latter cases, the small tract owner and/or
severer may expect, between them to bear a large part of, if not all, the
burden of payment for the severance tax.
When timber is developed in large tracts, the timber owner may
be accorded some protection against backward-shifting of the severance tax due to the likelihood that his tract will be more attractive to a
larger number of development possibilities and developers. He may now
command more price power in dealing with developers, and, perhaps, even
with subsequent processors. If, as is frequently the case, the timber on
the large tract is well situated and of higher quality for development,
then the inelasticity of his demand function is further enhanced, and the
shifting possibilities expand.
The severer other than the owner, seeking to develop a large
tract, may be placed in a "squeeze" between the influential owner and the
13k
dominant processor of wood products, in which case, he may have to absorb
all or a large part of the severance levy burden. To the extent that his
rights to large tracts comprise a substantial part of the local supply,
the severer may be at least partially successful in shifting a portion
of the tax to processors in the negotiated price. This latter possibility
is made more tenable if the processor has some confidence that he, in turn,
may shift the tax to subsequent buyers.The industrial owner/developer of timber tracts, as in the case
of the property tax, tends to regard the severance tax as a part of the
cost structure, and is ill-inclined to absorb its burden. Again, to the
extent that the commercial owner is economically-influential in the wood-
products industry, regionally or nationally, his power to incorporate sev
erance taxes in price is substantial. Should competitive or other condi
tions (such as product substitutes like plastics, masonry materials or
others) deprive the wood-industries owner-producer of price power in the
final market, his alternative are to transmit the burden of the tax to his
labor force, capital-equipment suppliers or others, or, finally, to absorb
the cost of the tax from profits. The possibilities for a backward shift
of severance levies, though difficult to ascertain empirically, would be
especially favorable if the wood-products producer is an oligopsonistic
or monopsonistic buyer of labor in the area, or is a similarly-dominant
customer for timber and wood-processing equipment and materials.
The forward shift of the severance tax still appears to be the
more likely course of action for the vertically-integrated forest-owner-
processor, and this possible course of action may be aided materially by
the trade associations and boards previously mentioned, with their atten-
135
dant power to fix prices and marketing policies. If the elements for
conscious oligopoly market structure were lacking before, such associa
tions lend decisive support.One development by the wood-products industry which, in recent
years, may have eased the dilemma faced by the small-tract owner relative
to the severance tax burden is the so called "American Tree Farm System",
sponsored by the American Forest Products Industries organization.38 This
program enlists private forest owners, often small-tract farm or family
operations in providing sources of supply to the local wood-using industry,
in return for which the industry offers advice, services and other con
siderations to the tract owner in order to produce conditions of scienti
fic, sustained-yield management.39 By I96I, acreage under the System
amounted to about 5^.8 million acres, with 3*8 million acres in Texas,
3»T5 million in Louisiana, 3*6 million in Arkansas, and 1.2 million in
Michigan.40 Aside from the obvious conservation benefits to be derived
for forestry, the participation by the forest industries may also enable
the small tract owner to enjoy, by association, the price-power of the
industry, and cause the forward shifting of severance-tax burdens other
wise likely to have been shifted back to the owner, or absorbed by the
developer. The extent of forward-shifting might be deduced by comparing the prices received on such "Tree Farm" contracts with the valuations placed on timber cut on its own tracts by the forest industry itself.
(
38"American Tree Farm System", March, 1961, American Forest Products Industries, Conservation Yearbook, 19^1, pp. 117.
39Ib id.
4°Ibid.
136Severance Taxes and Shifting in Minerals Industries. Unlike
the severance tax on forest products, the minerals severance tax may be
considered to produce respectable (if not spectacular) revenues, and to
be largely treated as a revenue source. As in the case of the severance
tax on timber, however, the severance tax on minerals may be regarded by
the severers as a commodity tax on the minerals realized. Again, market
structures facing severers, owners, and producers are decisive in patterns
of shifting which may emerge. The analysis which follows will be based
on a consideration of these factors.
Again, as in the case of property taxes, where the minerals are
quite common, and held in small deposits, the tax on severance may be
expected to hold few possibilities for forward shifting, and to include
the possibilities for backward shifts from the severer to the owner. This
stipulation may not apply in the case of some minerals of unique or very
limited supply, for which the demand by developers and producers is great
(e.g., certain gem stones, platinum and other precious metals, etc.).
Severers and/or developers operating in industries of relatively
common and highly competitive products will seek to shift the tax, but
forward shifting may be largely unprofitable due to the market competition,
and/or existence of numbers of substitute products. The alternative, then,
is a backward shift to the owner, who is similarly disadvantaged in market
price power. The success of such attempted shifts will depend, then, on
the relative powers of the owner and severer; it is quite probably that
both will ultimately shoulder some of the burden of the tax.
For certain industries whose production is localized (such as
the salt and sulfur industries), and who operate in oligopoly-oriented
137
production and distribution markets (such as the above, plus oil, natural
gas and metals), forward shifts are sufficiently easy that they may be
come a matter of policy, without regard to the possibility of backward
shifts. Thus, the severer of petroleum products, even if not a verti
cally-integrated concern, such as a pipeline company or producer-refiner,
may be successful in gaining a forward shift of severance taxes. Price-
fixing by the oligopoly firms in the area may offer an incidental benefit
to the independent developer who deals in the same market. 41
Vertically-integrated owner-severer-producer firms, or simply
severer-producers, in industries organized in oligopoly-market forms will
be strongly disposed to transmit the tax as a cost of production to the
final price of products. Here, again, trade associations and boards may
aid in maintaining parallel price policies for the oligopoly firms. In
the case of petroleum, the state and federal governments have been of
substantial (even if unintended) help in market control, through the osten
sible pro-conservation practice of prorationing and the economic "assist
ance to orderly marketing" of Bureau of Mines estimates of monthly crude
production. 42 Industry-sponsored guideline practices are available to
other oligopoly-oriented minerals industries.
41For a survey of landmark proportions regarding market organization of the domestic crude petroleum industry, see Rostow, Eugene V.,A National Policy for the Oil Industry, Part II, Chs. 4-6.
42Rostow, 0£. Cit., pp. 27-9.
138D. Effects of Resource Taxation: Some
Observations
The incidence of the tax is the end result of shifting; the
effects of a tax are far more widespread in nature, and pertain to the
social as well as the economic costs inherent in the tax- Some general
effects of taxes on resources will be suggested in this discussion, and,
in the concluding chapter (Ch. Vi), specific observations regarding re-
source-tax effects will be made.
Effects on Timber Industries. Tax policies, and the mechanisms
for shifting of taxes on timber industries have been studied very care
fully by public policymakers as they affect conservation, incentives and
production in the modern period (since the 1930's). Modification of the
ad valorem property tax has been accomplished through the yield-tax con
cept in many states in an attempt to encourage (or at least, to avoid
discouraging) sound forest management. Substantial amounts (in some cases
virtually all) of the yields from both severance and yield taxes on timber
have been "ploughed back" into the agencies and programs promoting sound
forestry.
The results of forest-tax policies thus far do not provide evi
dence that conservation has been either helped or hindered by the modern
approaches to forest taxation, though the industry has certainly benefited
from the tax-supported public education, information and research programs.
The ad valorem tax may have taken some toll in the ruthless cutting prac
tices of the 1930's and previously (though the economic conditions of the
great depression may have contributed to much of this waste), but partici
pation in yield-tax programs has not, thus far, indicated that there is an
139
overwhelming desire to escape the burden of the conventional levy. Con
servation and scientific methods of good forestry practice have been in
evidence most on the publicly-held lands, followed in order by those
owned by the forest industry and large, privately-held tracts (see Ch. ll).
These are the areas in which improvements would have been expected in any
case, and the areas controlled by the latter two types of owner have grown,
and will probably continue growing, at the most rapid rate. While the
small woodlot may not disappear completely, such holdings will assume a
lesser and lesser significance to the forest industry. Perhaps those re
maining will frequently be connected directly with the wood-using indus
tries as suggested by the "tree farm” approach, said to be growing at the
rate of about 3 million acres per year . 43
Minerals taxation appears to have been largely accomodated into
the cost structures of those resource producers operating in markets
characterized by lack of strong competition. The ultimate resting-place for many of these property and severance taxes, or large parts thereof, is the ultimate marketplace for the finished product. Thus, the taxes in
volved become consumption taxes, paid through prices for goods produced
by the taxed industries. The tax may have few ill effects, and, indeed
may be something of a tax on "benefits received" for the consumer who enjoys the end product of society's common largess.
Again, many of the minerals industries are characterized by
large, often vertically-integrated, concerns; but this need not be an
effect of the tax structure, so much as of the industries' requirements
43Conservation Yearbook, I96I, Loc. Cit.
lAo
for large capital outlays, or, for some industries, the fact that the
subsequent stages of production and distribution are populated with large,
powerful firms. Mining, like manufacturing, is often most efficiently
conducted on large-scale operations, and this may better serve conserva
tion and output goals than the attempt to limit the size of enterprises
arbitrarily.
If it appears that the success in shifting taxes on resource
industries subverts the intent of such levies, perhaps the real intent
of production taxes should be viewed in the light of the following state
ment :44
...it is commonly believed that a cigarette tax paid directly by a manufacturer in North Carolina ends as a burden on the smoker.... In fact, we are so confident of the shifting in this case that we label the tax a consumption tax.
Thus, the purposes of public policy may be served, even if, as is very
frequently the case, business taxes become, at length, personal taxes.
In this aspect, taxes on businesses ( or persons) engaged in the resource
industries are not materially-different from taxes on any industry.
E. Summary
In the foregoing discussion, attention has been given to the
probable patterns of shifting and incidence for resource taxes; that is,
the manner in which the initial levy is ultimately disposed of, and the
probable final resting-place for the burden of payment. The mechanics of
shifting suggest that, in order for a tax to be shifted, it must involve
44Groves, Op. Cit., p. 116.
lkl
a commodity or process which is subject to exchange for value ("price
transaction"), and, in this particular, taxes levied against natural
resources qualify.
Taxes levied against resource industries constitute two general effective applications: those which may be considered as attaching to
the resource lands and wealth (property taxes), and those which may be
associated with the production or processing of the resource commodity
(severance taxes). The yield-tax variation on ad valorem property taxes
constitutes something of a "hybrid" levy in effect, containing as many
(or more) attributes of the commodity tax as of the property tax. This
is due to the timing of its collection with the harvesting or mining of
the resource.
Property taxes constitute the most difficult type for shifting in
the conventional sense when they are applied on an annual basis to re
source lands which yield a product only periodically, sometimes over sub
stantial periods of time, as, for example, those pertaining to standing-
timber tracts. When shifting is possible, the capacity to shift the ad
valorem tax is probably greater among large-tract owners than small-tract
owners, due to the greater price power of the former, and easier for in
dustrial owners than for other private owners, due to the greater degree
of vertical integration with the processing and final markets for this class of owners. This is generally true for both timber and minerals
properties. The presence of yield-type, "in lieu" taxes on the resource
commodity only, or on both the lands and commodity, simplifies the process
of tax shifting, providing a timing of the tax with the actual trading in
the resource commodity. Under these circumstances, the computation of
Ik-2-
the tax on the basis of the resource commodity is virtually automatic,
and the possibilities for shifting will be virtually all based on the dif
ferential market influences of owners, severers and processers, proceed
ing in the direction and degree dictated by the dominant member of this
group.
Severance taxes, constituting commodity taxes in effect, are sub
ject to shifting according to the degree of price-power possessed by
owners, developers and processors, with the small-scale owners being least
able to avoid a backward shift by severers, and smaller-scale severer-
developers being least able to transmit the burden forward to processors,
other factors equal. The composition of the industry utilizing the re
sources will have a substantial bearing upon the degree and direction of
tax shifts, with those who operate in oligopoly or near-monopoly product
markets being more disposed and able to shift taxes forward toward the
ultimate consumer. The more competitive the product market, the fewer the
forward-shifting possibilities. Industrial owners in vertically-integrated
resource industries would be most likely to seek forward-shifting possibil
ities, given sufficient price power in product markets.
The final disposition of the burden of resource taxes, where for
ward shifts have been successful, lodges largely with the ultimate customer
for the resource product. Despite the basic designations of both property
and severance levies, there is an implicit acceptance (even intent) of the
consumer's shouldering the burden of resource taxes, as in the case of all
production-oriented taxes, in the drafting of such taxes. These taxes are
often popularly called "consumption" taxes when more overtly transferred
to the consumer, as in the case of tobacco taxes levied originally upon
lk-3
the manufacturer. Thus, forward shifting of the taxes on natural re
sources provides both a rationing function for their use, and a basis
for collection, in various stages of their development, of society's
demand for compensation for the loss of these resources.
From the standpoint of final effects, the pattern of shifting
assumed by commodity taxes has a very real bearing upon the consequences
of a tax to the state or region in which it is levied. That is, if a
commodity-type tax such as that described in the preceding paragraph is
successfully shifted forward to consumers markets diffused throughout
several regions, then the state or area in question will actually have
relieved itself of substantial portions of the burden of the tax. There
fore, if a petroleum severance tax in, say, Texas or Louisiana, is trans
mitted to the final sale of products by a national corporation, purchasers
in Iowa or Florida may actually be made to shoulder some of the burden of
taxes levied on removals of resources from the former states. In effect,
the states of Texas and Louisiana have levied taxes to be paid, in part
at least, by persons in other states. This is much in keeping with the
concept that persons benefiting from the enjoyment of resource products
should be assessed the social (as well as market) cost of such enjoyment.
CHAPTER VI
SUMMARY, EVALUATION AND CONCLUSIONS
In the preceding chapters, the reader has pursued an examination
of the roles of resource industries at the basic-production level in the
economies of the survey states, and the manner in which they are subjected
to special forms of taxation by those states. In the course of the study,
the similarities and differences among the four states, both as to resource
wealth and the approach to its taxation, have been portrayed to afford the
reader insight into the question, and to provide a basis for comparison
and evaluation.
The present chapter will have three fundamental objectives:
first, an analysis of the fiscal significance of natural-resource taxation
for the four states; secondly, an examination of the policy effectiveness
of resource taxes, in line with the policy objectives suggested in Chapter
I; and, finally, some suggestions will be offered for modification of tax
structure for more effective results from both the policy and revenue
standpoints.
A. Fiscal Significance of Natural Resource Taxes Compared for the Four States
Probably the most obvious characteristic observed from the study
thus far is the vastly-differing fiscal significance of resource taxes for
the survey states. Two of these states, Texas and Louisiana, collect mas
sive revenues from resource taxes, principally those on mineral resources,
and most of the latter from petroleum products. Arkansas and Michigan
stand in an entirely different class, realizing only modest revenues from
145
taxation, of resource industries, though the petroleum industry is the
mainstay for resource-tax collections in these states, also.
As a basis for analyzing the differential fiscal significance
of resource taxes to the several states, it may be appropriate to examine
each state in the survey separately, giving attention to each classifica
tion of resource industry separately, also. The contrasts provided are
quite striking, and may aid in understanding both the degree of importance
associated with resource industries for each state and the comparative
yields of various resource industries to the revenue base.
Texas. The treasury of natural-resource wealth for Texas is
vast, and places the state at the very top of this category, both in terms
of the value of resources products, and public revenues obtained from
taxes levied upon them. Texas' minerals production is, of course, the
principal basis for her preeminent position in natural resources. The
value of her minerals production accounts for about 22 percent of the
total minerals value produced in the entire nation, a figure which is
well ahead of that for any other state (Louisiana was second in production
in 1965 with 14 percent, California third with about 7*5 percent).1 The
values obtained from her forest and fisheries industries also contributes
significant, if not such spectacular amounts.
As might be expected, in the light of the above observations,
Texas led the nation in resource-severance tax collections in fiscal I965-
66, with almost $211 millions, the bulk of this figure ($205 millions)
coming from her severance taxes on petroleum products (See Table 13, Ch. IV).
Minerals Yearbook, Vol. I, I965, p. 102.
146As a percent of her total tax collections, the combined severance tax
receipts accounted for about 16.5 percent, second only to sales and gross
receipts at $786 millions and 62 percent of the total $1,267 millions. 2
A portion of the gross receipts revenue arose from processing industries
dealing with natural-resource products, and this, it should be pointed
out, would add to the fiscal significance of resources at stages of their
development above the basic level.
In addition to tax revenues gained from natural-resource in
dustries, the State also collected substantial amounts of money from
leases, sales and royalties on products severed from public lands, or
lands under public jurisdiction.
Louisiana. Louisiana, like Texas, possesses vast natural-
resource wealth. Her second-ranking position among resource producers
(14 percent of 1965 value in minerals industries) makes her, in many
characteristics, very similar to Texas in the role which resource taxes
play in her publie-revenue picture. Unlike Texas, Louisiana levies spe
cially-designed taxes against her forest and fisheries industries, along
with the minerals-resource industry. Louisiana, then, has the most com
prehensive structure of resource-tax application among the survey states.
Consistent with the great significance of her natural-resource
industries, Louisiana derives a major proportion of her tax and nontax
revenues from this area of tax application. The severance-tax, in its
various applications, is the leading tax for the state, with the $205
millions in fiscal 1966 accounting for almost one-third of total tax
aReport of the State Comptroller of Public Accounts, State of Texas, Part 1, Fiscal I965-66, Table No. 1.
lbj
revenues ($620 millions} . 3 The overwhelming bulk of severance-tax col
lections come from minerals ($204 millions in fiscal 1966), and of mine
rals taxes, oil and gas products account for the virtual total sum($200
millions and 98 percent in fiscal 1966).4 Timber severance taxes during
the same period accounted for about $630 thousands, or only about 0 .3
percent of the total severance-tax revenues, and fisheries severance taxes have characteristically accounted for a very small part of the total sev
erance revenue (less than $400 thousand in fiscal 1965) the latest year
for which data were available in detail) , 5
The impact of Louisiana’s natural resources upon her fiscal
revenues is not limited to the yields from severance taxes. She also
realizes large sums from mineral leases and royalties on resource pro
ducts taken from state lands, territorial waters and streams of the state,
as evidenced by the estimate for fiscal 1965-66 of $103 millions from such leases and royalties. 6 Combined with severance tax revenues, the
total estimated returns of about $306 millions approaches one-third of
total budgeted state revenues of about $1 billion for the fiscal year
I965-6 6.7 Thus, viewed from the context of either taxes or total state revenues, natural resources possess a critical significance to the state's
fiscal well-being.
326th Annual Report,Fiscal 1965-66, La. Dept, of Revenues,pp. 15.
4Ibid., p. 10.
511th Biennial Report, 1964/1965) Louisiana Wild Life and Fisheries Commission, p. 14.
6State of Louisiana, Executive Budget, Fiscal 1965-66, p. 4.
7Ibid.
148The disposition of severance-tax revenues is of considerable
interest, also, as these revenues constitute a vital base of support for
several necessary public functions. As previously noted (Ch. IV), with
the exception of timber severance tax revenues, (limited in returns to
any parish of $200,000, or three-fourths of the total, whichever is
smaller), the majority of severance revenues are retained by the State
for the benefit of the free school textbook program and for the Public
School Fund. 8 This latter fund has been the principal beneficiary of
the revenues, as the textbook program has required only a small part of
the total. Fisheries severance taxes have primarily nourished the Con
servation Fund, though the amounts have hardly been adequate to any sub
stantial support in themselves.
The returns on mineral leases and royalties for 1965-66 fiscal
year were budgeted for the General Fund ( about 70 percent) and to the Highway Fund (about 14 percent), and the balance was allocated among a
number of special-fund accounts. 9
Arkansas. The significance of severance taxes to the support
of fiscal budgets in the State of Arkansas is in striking contrast to the
leading roles such taxes occupy in Texas and Louisiana. Severance tax
revenues are a minor part of the total collected by the Revenue Department,
with the 1965-66 fiscal-year collections of $4.8 millions accounting for
8La. State Tax Handbook, 1964, pp. 8 l, 82.
9Executive Budget, p. 6.
149
only about 2 percent of the tax receipts handled by that agency ($253
millions).10 The $253 millions in collections by the Revenue Department
accounted for about 95 percent of total tax and other collections of $267
millions in fiscal 1965-66.
When the $8 ,72 6 .7 6 derived from oil and gas leases and the $109
thousand from royalty payments (principally sand and gravel) are added to
the total from severance taxes, the relative importance of resource-based yields is not changed materially, still falling somewhat short of 2 per
cent of the total tax collections from all sources. 11 In terms of a total
state budget of about $400 millions, the total support from natural re
source taxes and other collections from the industry accounts for about
1 .2 percent. 12
Of the total from severance taxes, the largest contributor is,
and has been, the petroleum industry. Oil severance taxes have recently
averaged about $3 millions annually ($2 .85 millions in fiscal I965-66 is
somewhat below figures obtained in preceding years), or about 6 2 .5 per
cent of total severance taxes. 13 Next in value were timber severance col
lections, with $885 thousands collected in fiscal 1965-66, and reflecting
a sustained rise in recent years. 14
lQBiennial Report, 1964-65, Wild Life and Fisheries Commission,pp. 6, 8.
treatment for timber, these are presently said to account for about 500
thousand acres.24
But what of the physical gains made in forest acreage in the
past several years? The total forest area has, indeed, been expanded
within each of the four survey states. Qualitatively, however, the addi
tions to the forest land in many cases are simply abandoned farmlands
which have reverted to timber by natural reseeding, often without produc
ing stands of sufficient density, or having less desirable species mixed
with the more desirable ones. Cull trees present a continuing problem,
retarding the production of marketable ones.25 A report in 1955 showed
that Louisiana's forest lands were only about 50 percent well-stocked,
mainly in the Southeastern region, and by i96 0, Michigan's forest lands
were TO percent well-stocked, while in 19 6l, Arkansas1 forest lands were
estimated at about two-thirds well-stocked.26
23R. Hayes, 0£. Cit., p. 3.
24Ibid.
25See Ch. II.
2sFindell, 0£. Cit., pp. 2,3, and Sternitzke, Ojd. Cit. , p. 4.
155With reference to forest management and active maintenance of
good forestry practices, the most abundantly-clear feature is the spotty
record of farm owners and individuals not connected with the wood-using
industries. The Michigan study27 noted that Michigan led the nation in
replanting of forest acreage in 1957* with over 1 .2 million acres re
planted between 1935 an(l 1957? hut of this total JO percent of the plantings occurred on publicly-owned lands, although this classification
accounted for only about 28 percent of the total ownership acreage. 28 In
Arkansas, the 1961 report noted that the recent gains in desirable species,
especially softwoods, were "largely on public and industrially-owned
tracts." 29 In East Texas forests, the chronic problem area for forest
management and quality of stands has been the Northeastern region, which
is largely populated by farm woodlots and small tracts held by non-indus
trial owners. 30 Perhaps the most general defection is among the absentee
owners and other individuals not connected with the wood-using industries,
with practices of farm owners varying from good silviculture to none at
all.
The record of policy success, with special reference to conser
vation and promotion of forest management, appears to have been something
less than complete, with the most encouraging results from industrially-
^Findell, 0£. Cit.
2aIbid., p . 8 .
29Sternitzke, 0£. Cit., p. 1.
30"Forests of East Texas", p. 6 .
156owned tracts, and the most dismal from the private, nonassociated owners.
A hopeful sign of some policy success may be deduced from the condition
in Michigan, an area which had been victimized by shortsighted cutting
practices until the mid-1930's. Michigan shows a substantial involve
ment in new plantings entailing a high percentage in seedlings and sap
lings among the growing stock. 31 This suggests that Michigan, in the
1950's, had commenced to lay the basis for poletimber and sawtimber vol
ume consistent with a balanced-yield potential, something which she did
not have at that time. 32
The property-tax situation in the states of Arkansas and Texas
is due some very prompt attention. The increasing population, and the
expansion of competing uses for land which it entails, may threaten
forest areas in those states, and the existence of no "shelter" from the
regular ad valorem property tax may contribute materially to the threat.
It cannot be assumed that historically-low assessments for forest lands
will be continued indefinitely in the face of the expansion of urban pop
ulations into these areas, accompanied by factories, residential-land
expansions, and other improvements which may tend to raise assessment
ratios. The long market period for forest products, particularly from
those tracts characterized by substantial immature stands, mitigates
against the owner's ability to sustain the burden of high assessments and
annual collection. It would appear then, that Texas' and Arkansas' timber
slFindell, Op. Git., pp. 9"1^*
32Ibid.
157
industries are headed for trouble unless some yield-tax or other modifi
cation of the property tax is executed within the near future.
Minerals and Other Resources. For the most part, the policy
applications to minerals taxation appear to have been designed to meet
requirements for orderly production with minimum repressive effects, and
in some cases to produce substantial public revenues, as well. Perhaps
it is not so much the taxes themselves, but the absence of taxes which
describes policy applications in many cases. For example, the applica
tion of petroleum and natural gas severance tax rates differs substan
tially for the states of Texas, Louisiana and Arkansas compared to that
levied by Michigan on the same industry. The rates for Michigan's oil
and gas industry are substantially lower, effectively, than those applied
in the other three states. 33 This may be partly explained by the minor
role played by the petroleum industry in Michigan, as compared to the
other three states, however, and may be a public-policy consequence of a.
desire for continued well-being and expansion. Reference has previously
been made to the fact that Michigan does not levy a severance tax on its
metallic-minerals industry (Ch. IV), and to the concessions that she makes
relative to the property tax on metallic-minerals values (Ch. I, pp.10,ll).
These concessions appear to reflect the concern of public policy for the
industry's ability to compete with adjacent states' metallic industries,
and with Canadian competition in this area. 34
33Given a price of crude oil of, say, $5*00 per barrel, a tax of 18 cents amounts to 6 percent; a 26-cent tax would amount to 8 .6 percent (Louisiana's rates); Texas taxes oil at 4.6 percent of value,* Arkansas at 5 percent; and Michigan at 2 percent.
34See Gronouski, 0£. Cit., pp. j553“57j in which competitive pressures are detailed.
158
In similar fashion, Texas does not levy severance taxes over
the entire group of her minerals industries, nor on forest industries.
Instead, she concentrates her efforts upon the petroleum products and
sulfur (see Ch. IV). Whether this limited application of taxes is pro
ductive, from a policy standpoint, of more efficient production and lar
ger total economic benefits, is unclear. It may be that Texas simply
considers the application of severance taxation to presently-untaxed
areas productive of insufficient potential revenues to make it worth
while, considering the administrative burdens.
The taxation of fisheries by Louisiana appears to reflect a
means of internally-generated finances for services to this industry, and
seems to work no extreme hardship on the taxpayers, while aiding in assur
ing the perpetuation of the industry. Texas apparently has utilized fees,
licenses and other assessments rather than severance taxes to accomplish
her public-policy goals in this resource area, as do Arkansas and Michi
gan. The small scale of the fisheries industry in Arkansas does not
appear likely to yield revenues of any consequence, and special taxes may
operate to discourage marginal operations to the extent as to erode the
tax base. For Texas and Michigan, it appears a matter of choice as to
which application, taxes or fees and licenses, is most productive of de
sired results, and both have apparently chosen the latter course.
Summary. As indicated previously, the critical policy applica
tion of resource taxation appears to have been historically devoted to
timber and forest products, conservation having been among the earliest
concerns associated with tax measures in this area. Policy for other
resources appears to have been a pragmatic balance between revenue poten
159
tial and orderly conduct of the enterprises, without wasteful exploitation.
More than taxation policies, it still appears that the principal problem
of conservation is the finding of the most economically-sound methods for
exploitation of the mineral resources; in the case of petroleum and nat
ural gas, the dilemma of the "rule of capture" (see Ch. I) and the appar-
ently-wasteful and contradictory practice of "prorationing", wherein
neither the geologically-optimum nor economically-optimum rate of recov
eries seems to be served. 35 This problem should be subjected to disinter
ested and dispassionate study toward a satisfactory solution, perhaps
along the lines suggested by Davidson. 36
C. Suggestions for Modifying Resource Taxation
The discussions just concluded have examined the fiscal signi
ficance and policy result of resource taxation in the survey states. Now,
some attention will be given to suggestions for changes in the taxes which
will be directed at improving one or both of the above results. No
attempt will be made to overhaul the entire structure of resource taxes
in any of the states, but rather suggestions will be made for improving
the coverage and policy effectiveness within the present framework of the
existing structure in each case.
Timber Taxes. Apart from the rather obvious suggestion that the
states of Arkansas and Texas should give high priority to the development of a system of yield-tax levies for their forest industries, in advance of
35Davidson, 0£. Cit. (See Ch. I, pp. 17-23).36lbid.
l6o
hardships which are likely to accrue to timber owners as assessments are
raised, a number of general observations of possible improvements in both
severance and yield tax systems present themselves. As suggested in the
previous discussion, the degree of success in conservation and management
improvements in those states levying special taxes for forest owners has
been somewhat limited. In all the states, the private, non-industry-
associated owners comprise the problem group. Louisiana's success in
gaining private participation in forestry programs seems to date from her
imposition of mandatory classification requirements for forest lands, as
previously suggested. Based on this development, perhaps it is fair to
say that the "voluntary" character of Michigan's private and commercial
forest reserve laws has contributed to the low incidence of participation,
and the restrictive aspects of the language in the acts37 may have dis
couraged numbers of owners who might have otherwise participated.
To improve the effectiveness of Michigan's timber-tax laws, a
first suggestion would be to liberalize the requirement for maintaining forest lands in the reserve, to permit other uses of the land not incom
patible with forestry (hunting is already permitted), such as for recrea
tional and camping use, along with limited grazing. The recognition of
mixed-forestry activity, already partially recognized for "selectively-
logged" tracts, and the allowance of either tax-free or reduced-rate
taxing of necessary cutting for optimum stand density would also be helpful. 38 Perhaps as much as anything else, Michigan needs a general timber-
37See Ch. I for examples of restrictions which have been, or arecurrently applied.
3BSee Ch. III.
l6l
severance tax, applied to those lands outside the commercial and private
reserves, and approaching the rates of the present stumpage levies for
reserved lands, to remove any tax advantage in cutting on such lands.
These measures would work toward increasing the listings under both pri
vate and commercial reserves.
A general incentive to participation in forest-improvement pro
grams in all the states might embody rewards for new plantings and for
active silviculture programs by private owners. Such a program might
include, in addition to reduced prices for seedlings for replanting (al
ready available in Michigan), a partial remission of severance taxes
otherwise due, on proof of replanting, or in cases of removal of trees
adjudged consistent with a stand-improvement program (such as the thin
ning of trees for maximum growth, or removal of less-desirable species
from a managed tract). This remission might be as little as ten percent
of taxes otherwise due, or perhaps as much as fifty percent or more. A
sliding scale, based on the extent of forestry improvement, might be most
productive if its administration is feasible. 39 Although such a program
is almost certain to reduce tax revenues initially, the improvements aris
ing as a result may very possibly cause more abundant revenues within a
decade or two, and would aid in assuring the continuation of yields. Co
incidentally, the volume and value of forest products would improve, and
this might bring substantially more benefits than any taxes foregone in
the short run.
39Some of the burden of verification might be eased by utilizing county agricultural agents, local sheriffs or other officials as inspectors, within the limitations imposed by lack of technical knowledge.
162
The fact that Texas and Arkansas have no present basis for dif
ferentiating between timberland and other properties for property-tax
purposes may become a real problem soon, as suggested above. With this
factor in mind, it may be considered wise to adopt some measure of modi
fication of the property tax to recognize the special character of forest
lands. Possibly a fixed valuation such as that applicable to Louisiana's
classified forest land (see Ch. Ill) would be sufficient, or "freezing"
the assessments at their present relatively-low levels in most areas may
be desirable. If this is not adequate or feasible, then some application of the "in-lieu", yield-tax principle may be necessary. With her tradi
tionally rural character, Arkansas's property taxes have been generally
lower in farm and forest areas than in urban or mixed areas, but the days
of this practice are definitely numbered, with the case of Northern Lower
Michigan providing an indication of what may be in store for her as pop
ulation density increases. Similar results may be forecast for East Texas.
If it appears that the modifications suggested for timber taxa
tion tend to be dilutive of the tax base and yield, as indeed they may
be, it may be well to remember that forestry will be, and to a consider
able extent already is, an industry which has a minimal application of
the "free gift of nature" argument for taxation. 40 Most forest holdings
now are not virgin stands, but the result of second-growth and even third-'
growth regeneration. To a considerable degree, replacement growth has been the result of the forest-owner's initiative. This is especially true
4°Marquis ("Severance Taxes on Forest Products") suggests a "..loss of force..to ....this (free-gift) argument" when the development effort is considered (p. 317)■
163
when a balanced forest results from careful management and good forestry
methods. To this extent, the forest owner is a partner of nature, and
should not be taxed as if he received only a windfall gain from her
bounty. Especially the incentive-based reductions of severance taxes
suggested above would offer recognition and reward for good forestry.
Other Resource Taxes. In the changes recommended for other
resource taxes, the emphasis is primarily on means of either improving
fiscal yields, or in providing more equitable tax treatment for the re
source owners. Some recommendations also will be made for enlarging the
coverage, especially that of the severance tax.
Petroleum and natural gas products taxation occupies the domi
nant position in the severance-tax structures of all the survey states,
and represents Michigan's only "pure" severance tax. Rates on severance
taxes are varied as to basis and rates of application; Louisiana uses a
specific (measure) basis for the taxation of petroleum products, while
the other states use ad valorem bases. This writer tends to lean toward
the ad valorem rate application as more immune to comprimise through price
inflation or, alternatively, imposing hardships on producers during de
flation of prices received. For example, the present rates applied to
petroleum products in Louisiana were enacted in 19 -8, and since that time,
the price of, especially crude petroleum, has increased substantially, in
effect reducing the rates of taxation paid by Louisiana's petroleum pro
ducers. Further, a percentage-rate scale would maintain yields on a par with other features of the general price level, with dollar amounts tied
to prices received by the industry. Of course, the argument might be made
that declining prices would cut tax yields with falling prices, but it
16kshould be apparent that recession conditions would have reduced produc
tion-tied revenues in this case, anyway. Similar percentage rates might
readily be applied to other mineral categories for all states without
increasing (in fact, in many cases reducing) the administrative burden.
As previously indicated Michigan's 2 percent levy against oil
and natural gas products is the lowest effective rate against resource
products in the mineral-fuels category among the survey states. Con
sidering the very potent capacity of the petroleum industry for forward-
shifting of tax burdens, (see Ch. V), it would appear that the levy is
based on needlessly-low rates. However, without data on the comparative
costs of production and technical problems, arbitrarily suggesting new,
higher rates would be presumptive. Still, the matter would appear de
serving of study.
Another observation is quite evident in Michigan1s taxation of
resources through severance-tax measures: the fact that most of her nat-
ural-resources industries "ride free"; that is, they are not subject to
severance taxes. This, it would seem, is inequitable and unfairly dis
criminate ly against the oil and natural-gas producers, as well as consti
tuting omission of potential tax sources whose taxation has been success
fully undertaken in other states. Therefore, it is suggested that a
generalizing of severance taxes might well be studied, with possible ap
plication either of the taxes currently applied to oil and gas, or a
separate schedule of rates, to such industries as the metallic minerals,
cement, sand and gravel, peat and such other areas as appears appropriate.
Similarly, the levies of the State of Texas might also be generalized to
include more of her minerals industries.
165If the "free gift of nature" argument has any credibility at
all, it is certainly applicable to the case of minerals-resource indus
tries, wherein a portion of the value received is due in no measure to
the effort expended in developing the properties, but rather to the acci
dent of nature which caused the owner to command the wealth buried in the
soil or waters under his control. Society has a stake in these resources,
and their taxation is consistent with the public interest, and perhaps
even incumbent upon government, if the social value of this natural wealth
is to have the general benefits which it should yield. The issue, then,
would appear to be not whether the resource-exploitation should be taxed,
but the degree of taxation needed to assure society's claim, without the
confiscation of that part of value attaching to the enterprise of the
developer.
D. General Summary
As a climax to the study of resource taxation in the states of
Arkansas, Louisiana, Michigan and Texas, this chapter has sought to pro
duce some keener insight into the importance of natural-resources indus
tries to the fiscal support of their respective states; the policy appli
cations in resource taxation, and their apparent success or failure; and,
finally, to offer some general recommendations for the improved operation
of resource' taxation. Efforts have been made to describe the successful
aspects of operation, and to point out some apparent shortcomings. For
estry taxation historically has been, and continues to be, a real problem
area in taxation, as is apparent from the volume of study devoted to means
of coping with the taxation of forest properties. The ideal tax for
166
forest lands and products has not been found, and still defies solution.
If some light has been shed on this problem by this study, then that alone
may serve to justify it.Other resource taxes and the problems surrounding them appear
to be less subject to general classification, rather being unique in each
case to the state or region (or industry) in which they are situated.
Some resources are common to all the survey states; others are unique in
their own areas (e.g., sulfur in Louisiana and Texas; bauxite in Arkansas;
peat, copper and iron ore of commercial quality in Michigan). Whether
common or unique, the taxation of these resources is subject to very defi
nite conditions of markets, abundance of reserves, political makeup of
the state, nature of competition, and other considerations which have a
bearing upon the manner in which resource taxation is applied. For these
reasons, it should come as no great surprise that tax structures have
developed quite differently among the states.
The discussion just ended, it is hoped, has placed some of these
differences in perspective, and has concentrated on problem-solving fol
lowing the policy benchmarks of conservation, incentives to efficient
production, and optimum fiscal yield in the public interest. With the
seeking of answers to some problems, others are made more apparent, and the cycle may be expected to go on indefinitely. In the pursuit of know
ledge, our appreciation of problems is heightened and expanded, so that
more questions are raised than answered. That is the price of inquiry,
and a price which the seeker of knowledge must be willing, even eager to
pay. Others who wish to pursue this fascinating area of resource taxation
will find abundant rewards for their pains.
SELECTED BIBLIOGRAPHY
A, Books
Backman, Jules. Government Price Fixing. New York: Pitman Publishing Corporation. 1938.
Chamberlin, Edward H. Theory of Monopolistic Competition. Cambridge: Harvard University Press. 1933*
Due, John F. Government Finance: An Economic Analysis. 3rd edition. Homewood, 111.: Richard D. Irwin Co., Inc. 1963*
George, Henry. Progress and Poverty. New York: Robert Schalkenback Foundation. 1938.
Groves, Harold. Financing Government. 6th edition. New York: Holt, Rinehart and Winston. 196 -.
Hobson, John A. Taxation in the New State. New York: Harcourt, Brace & World, Inc. 1920.
Mac Avoy, Paul W. Price Formation in Natural Gas Fields: A Study ofCompetition, Monopsony and Regulation. New Haven: Yale University Press. 1962.
Robinson, (Mrs.) Joan. The Economics of Imperfect Competition. London: The Macmillan Company, ltd. 1933-
Rostow, Etigene V. A National Policy for the Oil Industry. New Haven: Yale University Press. 19 -8.
Sharp, Ansel M., and Sliger, Bernard F. Public Finance. Homewood, 111.: The Dorsey Press. 196^.
B. Periodicals
Adelman, M.A. "Efficiency of Resource Use in Crude Petroleum." Southern Economic Journal. Vol. XXXI, No. 2. (October, 196^) 101-22.
Davidson, Paul. "Public Policy Problems of the Domestic Crude OilIndustry." American Economic Review. Vol. LIII, No. 1 (March,1963). 8 5-108.
Hill, H. W. "Timber Taxes in New Hampshire." Papers and Proceedings of the 47th Annual Conference. National Tax Association.195^• llj-8-53.
167
B. Periodicals -- continued
Hill, Lee. "State Taxation of Oil and Gas: Current Developments andProblems." Texas Law Review. Vol. 3 3 . 855~72. Texas Law Review Supplement. Vols. 32-37 ( 195^“59) • 2^51-68.
Marquis, Ralph W. "Severance Taxes on Forest Products and Their Relation to Forestry". Land Economics. Vol. 25, No. 3 (August, 19^9)-315-319-
Williams, Ellis T. "Has the Time Come for a Fresh Look at Forest Taxation?" Papers and Proceedings of the 5 -th Annual Conference. National Tax Association. I96I. 516-26!
"National Forest Contributions to Local Governments."Land Economics. Vol. 31* No. 3 (August, 1955)- 201+-14.
"Trends in Forest Taxation." National Tax Journal.Vol. XIV, No. 2 (June, 1961). 113~kb.
Yoho, James G. "Economic Impact of Local Taxes and Death Taxes onTimber Resources." Timber Tax Journal. Vol. I, No. 1 (July, 1965)• 50-65'.' ~
C. State and Federal Government Publications
Barlowe, Raleigh. "Forest Yield Taxes." Michigan Tax Study StaffPapers. Special Legislative Committee. Michigan House of Representatives. Lansing, Michigan. 1958- 321-73■
Fairchild, Fred Rogers, et. al. "Forest Taxation in the United States" USDA Miscellaneous Publication No. 218. Forest Service, U. S. Department of Agriculture. Washington, D. C. (1939)*
Findell, Virgil E., et. al. "Michigan's Forest Resources." Station Paper No. 82. Lakes States Experiment Station. Forest Service,U. S. Department of Agriculture. St. Paul, Minnesota. September,i960.
Gronouski, John, et. al. "Taxation of Mineral Resources." MichiganTax Study Staff Papers. Special Legislative Committee. Michigan House of Representatives. Lansing, Michigan. 1958. 3^5“6o.
State of Arkansas. .Department of Revenue. Biennial Report of theCommissioner of Revenues, Fiscal 1964-65, 1965-66^Little Rock, , Arkansas. (19^).
_________________. Office of the State Comptroller. Report by the StateComptroller, 1965. Little Rock, Arkansas ( 1966).
168
C. Government Publications -- continued.
_. Report by the State Comptroller, 196 6. Little Rock,Arkansas ( 19677* ~
State of Louisiana. Department of Revenue. "General Severance Tax, Reforestation Severance Tax, Gas-Gathering Tax, Royalty Excise Tax." Taxes on Natural Resources. Chapter 6 , Subtitle II, Title kj, Louisiana Revised Statutes of 1^0, as Amended by Act 4-4-9 of 1950» Baton Rouge, Louisiana.
State of Louisiana. Department of Revenue. Twenty-Sixth Annual Report, Fiscal 1965-6 6. Baton Rouge, Louisiana (I967)•
_. Office of the Governor. Executive Budget,Fiscal1965-6 6. Baton Rouge, Louisiana ( 1965).
Louisiana Wild Life and Fisheries Commission.Eleventh Biennial Report, I964/I965. New Orleans, Louisiana ( I966).
State of Michigan. Department of Conservation, Lands Division. Twenty- Third Biennial Report, 1965-6 6. Lansing, Michigan (1967).
Department of Revenue Division, Michigan Department of Treasury. 25th Annual Report, Fiscal 1966. Lansing, Michigan ( 1966).
State of Texas. Office of the State Comptroller of Public Accounts.Report of the State Comptroller of Public Accounts, State of Texas, 1966. Part la -- "Receipts and Disbursements of State Funds." Austin, Texas ( I967)•
_________________. Wildlife Division, Parks and Wildlife Department ofTexas. Annual Report, Fiscal Year 1962-6 5. Austin, Texas (1963).
Sternitzke, Herbert S. "Arkansas Forests." Forest Survey Release No.8 5. Southern Forest Experiment Station. Forest Service, U.S. Department of Agriculture. New Orleans, Louisiana (i960).
U. S. Department of Agriculture. Fish and Wildlife Service. Fisheries Statistics of the United States, 1964. Statistical Digest No. 58* Washington, D. C. ( 1965)•
_________________. Forest Service. Southern Forest Experiment Station."Forests of East Texas". Forest Survey Release No. 77« New Orleans,
_________________. "Forests of Louisiana." Forest Survey Release No.75* New Orleans, Louisiana (April, 1955)*
169
C. Government Publications -- continued.
U. S. Department of Commerce. Bureau of the Census. Compendium of State and Local Finance, 19&5• Washington, D. C. ( I966).
U. S. Department of Commerce. Bureau of the Census. "Property Taxation in I962." State and Local Government Special Studies No. kj.Washington, D. C. (November, 196^).
_________________. "State Government Finances in 1966." GovernmentalFinances, GF No. _11. Washington, D. C. (I967).
_________________. "State Tax Collections in 1966". GovernmentalFinances, GF No. 8 . Washington, D. C. ( 1967)•
U. S. Department of the Interior. Bureau of Mines. Minerals Yearbook,1969. Vol. I -- "Metals and Minerals." Washington, D. C. (1966).
_________________. Minerals Yearbook, 19&5» Vol. II -- "Mineral Fuels".Washington, D. C. (
D. Industry Publications
American Petroleum Institute. Petroleum Facts and Figures, 1965•New York (I966).
Independent Petroleum Association of Am5YS<a. The Oil Producing Indus- try in Your State, 1967 ad. Tulsa, Oklahoma( I967).
National Coal Association. Coal Facts, 1966. Washington, D. C. ( 19&7)•
E. Miscellaneous
Arkansas Economic Expansion Study Committee. Accelerating Economic Growth in Arkansas, a Report. Little Rock, Arkansas ( 196^).
Citizens Research Council of Michigan. "Outline of the Michigan Tax System, 1965." Council Comments No. 882. Detroit, Michigan( 1965)•
Democratic Business and Professional Committee of Michigan. Michigan Yearbook, i960. Detroit, Michigan (I96I)•
Farris, Theodore Newton. "Severance Taxation in Louisiana". Louisiana Business Bulletin. Vol. 2, No. 1. (April, 1938). Louisiana State University Press. Baton Rouge, Louisiana.
170
E. Miscellaneous -- continued.
Hayes, Ralph W. "Progress in Land Classification in Louisiana Under the 195^ Forest Tax Law." LSU Forestry Note No. lj-0 (May, i960) . School of Forestry, Louisiana State University. Baton Rouge, Louisiana.
Kauffman, Erie (ed.). Conservation Yearbook, 1961-62. The Conservation Yearbook. Washington, D. C. ( I962).
Public Affairs Research Council of Louisiana. Louisiana State Tax Handbook, 196^-■ Baton Rouge, Louisiana ( 196k) .
University of Arkansas. Industrial Research and Extension Center. "A Summary of Taxes in Arkansas, 1967". Publication _1 -Vb, Little Rock, Arkansas ( I967)•
Vernonr s Annotated Statutes of Texas, i960 and Replacements. Vol. 20, Title 122A - "Taxation-General". Kansas City, Missouri: VernonLawbook Company. i960.
171
VITA
James Frederick Butler was born in Conway, Arkansas on March
19j 193^} the son of Mrs. G. S. Butler, Sr., and the late Mr. Butler.
He is married to the former Sally Bonsell. They have no children.
Mr. Butler was educated in the public schools of Arkansas,
and was graduated from Conway High School in May, 1952. He received
the Bachelor of Arts degree from the Arkansas State Teachers College
(how State College of Arkansas) in August, 1955* His undergraduate
major was economics and sociology, and his minor was history. Mr. Butler
was awarded the degree of Master of Business Administration by the
University of Arkansas in January, 1958} with a major in business ad
ministration and a minor in economics.
Prior to commencing his studies toward the Ph.D. degree,
Mr. Butler held the positions of Assistant Professor of Economics at
Harding College, Searcy, Arkansas (1956-57) an^ Instructor of Economics
at Central State College, Edmond, Oklahoma (1957-59)*Mr. Butler enrolled in the Graduate School of Louisiana State
University, Baton Rouge, in June, 1959j and completed coursework for
the Ph.D. degree in January, I96I. Language requirements were completed
in March, I96I, and general examinations for admission to candidacy
were completed in May, I96I.
After leaving residency at Louisiana State University in
January, I96I, Mr. Butler accepted the position of Assistant Professor
of Economics at Louisiana Polytechnic Institute, Ruston, Louisiana, a
position he held until August, 1963* In September, 1963} Butler
172
173
accepted the position of Assistant Professor of Economics at Little Rock
University, Little Rock, Arkansas, which post he still occupies. He is
presently serving as Chairman of the Department of Economics and Finance
at Little Rock University.
EX AM IN A TIO N A N D T H E SIS R E PO R T
Candidate:
Major Field:
Title of Thesis:
James Frederick Butler
Economics
A Survey and Analysis of the Taxation of Basic Natural Resources in the States of Arkansas, Louisiana, Michigan and Texas