36
Meeting the Needs of the Changing Workforce Workplace Flexibility in the 21st Century A Survey Report by the Society for Human Resource Management
Meeting the Needs of the Changing Workforce
Workplace Flexibility in the 21st Century
A Survey Report by the Society for Human Resource Management
About SHRM
The Society for Human Resource Management (SHRM) is the world’s largest professional association devoted to human resource management. Our mission is to serve the needs of HR professionals by providing the most current and comprehensive resources, and to advance the profession by promoting HR’s essential, strategic role. Founded in 1948, SHRM represents more than 250,000 individual members in over 125 countries, and has a network of more than 575 affiliated chapters in the United States, as well as offices in China and India. Visit SHRM at www.shrm.org.
About This Survey Report
In November 2008, the Society for Human Resource Management (SHRM) conducted the SHRM 2008 Workplace Flexibility Survey. The purpose of the survey was to identify 1) the prevalence and types of flexible work arrangements (FWAs) that employers offer; 2) employee utilization of FWAs; 3) employers that collect metrics/analytics on FWAs; 4) successful FWAs, as well as success factors; 5) the impact of FWAs on both employees and employers; and 6) the challenges associated with FWAs.
Media Contact Julie [email protected](703) 535-6273
USASHRM1800 Duke StreetAlexandria, VA 22314Phone: (800) 283-7476Fax: 703-535-6432E-mail: [email protected]
ChinaBeijing Representative OfficeSHRM Corporation5/F, South Block, Tower CRaycom Info Tech ParkNo.2, Kexueyuan South RoadZhongguancun, Haidian DistrictBeijing, 100190Tel: +86-10-59822093 / 59822146Fax: +86-10-59822588
IndiaSHRM India702, 7th FloorRaheja TowersPlot C-62, G BlockBandra Kurla Complex, Bandra (E)Mumbai 400051MaharashtraTel: +91-22-42472000Fax: +91-22-42472010
Online SHRM Online: www.shrm.orgSHRM Research: www.shrm.org/researchSHRM Survey Findings: www.shrm.org/surveys
To order printed copies of this report, visit www.shrmstore.shrm.org or call 1-800-444-5006.
Contents2 Workplace Flexibility and Its Impact on the Workplace
3 Executive Summary: Control Over Where and When Work Gets Done
5 SHRM’s Proposed Public Policy Statement
6 Survey Results6 What Are the Drivers of Flexible Work Arrangements?7 Are FWAs Being Used?10 Are FWAs Available to All Employees?12 FWAs’ Impact on Employees and Employers14 Measuring for Success15 Does Face Time Equate to Productivity or Results?17 Telecommuting: The Way of the Future19 The Evaluation Team20 What Makes Flexible Work Arrangements Successful?21 What Are the Obstacles to FWAs?24 HR Perspective
26 Conclusions
28 Methodology
30 About the Respondents
31 Endnotes
31 Recently Published SHRM Survey Products
2 Workplace Flexibility in the 21st Century: Meeting the Needs of the Changing Workforce
Workplace Flexibility and Its Impact on the WorkplaceThe traditional workplace with a nine-to-five schedule is fast becoming a thing of the past. This can be attributed to several reasons:
Technological advances (e.g., PDAs/smart phones, x
VPN access, virtual desktops, etc.).
Increase in global competition/economy. x
Dual-income households. x
Increased number of employees with caring re- x
sponsibilities (e.g., child care, elder care).
Varying needs of the different generations in the x
workplace (e.g., employees under 35 years of age tend to value greater workplace flexibility).
Single-parent families. x
Sustainability (e.g., an organization’s ability to x
balance financial performance with contributions to the quality of life of its employees, the local com-munity and society at large).
Changes all around us, including economic factors, are forcing organizations to re-evaluate the way they do business and develop alternative approaches to work. For example, climbing gas prices in 2008 brought flexible work arrangements into the mainstream media and at the forefront of organizations’ business decisions. Some employers have turned to flexible work arrangements as one of the cost-saving strategies to assist their employees while at the same time meeting business goals. In 2008, SHRM conducted two polls on what organizations did to assist their employees with rising gas prices. From May 2008 to September 2008, there were marked increases in the percentage of organizations that provided flexible work schedules (e.g., compressed work schedule, flextime, etc.) and telecommuting to help employees deal with climbing gas prices.1
Another SHRM study, the Workplace Forecast, found that an increased demand for work/life balance was among the demographic and social trends most likely to have a major strategic impact on the workplace in the coming years, according to 57% of HR professionals. In addition, other demographic and social trends believed to have an impact on the workplace in the coming years included the retirement of the Baby Boomers, an aging population, worker shortages as a result of demographic shifts and an increase in the number of employees with caring responsibilities, potentially leading to greater demands for work/life balance.2
In another study by SHRM, difficulty balancing work/life issues was perceived by HR professionals as a moderate or large threat (41%) to employee retention. It was considered a greater threat to retention in large organizations than in small and medium organizations. Publicly owned for-profit organizations were more likely to perceive difficulty balancing work/life issues as a threat to retention compared with those in the privately owned for-profit sector.3
In light of these data, this report examines the flexible work arrangements employers commonly offer. Also examined in this report are the use of these benefits by employees, challenges associated with flexible work arrangements and factors that make flexible work arrangements successful, among other topics.
Workplace Flexibility in the 21st Century: Meeting the Needs of the Changing Workforce 3
Executive Summary: Control Over Where and When Work Gets DoneAccording to this research, reasons that prompted organizations to offer flexible work arrangements range from employee requests to organizational reasons and technological advances in teleworking. Employers tend to offer both formal and informal flexible work arrangements, such as part-time work schedules, telecommuting and flextime. Part-time schedules are the most prevalent FWA, with nearly six out of 10 (58%) organizations offering this arrangement to their employees. Large-staff-sized organizations (63%) were more likely than small-staff-sized organizations (45%) to formally offer part-time schedules.
Although organizations in the United States are not required to offer FWAs, findings from this research show that formal FWAs have a positive impact on both employees and employers.
The quality of employees’ personal/family life is x
positively affected as a result of implementing flexible work arrangements, according to two-thirds of HR professionals (68%).
Ninety-one percent of HR professionals believe imple- x
mentation of formal FWAs had a positive impact on employee morale (job satisfaction and engagement).
Retention of employees (89%) was also reported to x
have been affected positively by the implementation of flexible work arrangements.
The most common obstacle organizations experienced with formal FWAs is suitability of job for flexible work (i.e., the type of work performed by an employee). One in three (36%) HR professionals cited business needs as a constraint to FWAs. Publicly owned for-profit organizations (39%) are more likely to experience this obstacle than nonprofit organizations (18%).
Compared with previous years, 37% of organizations indicated an increase in the number of requests for FWAs by employees. Majority of HR professionals (85%) reported that in the next five years, telecommuting would likely (somewhat likely and
very likely) be more commonplace for organizations in general than it is today. And 43% of HR professionals believed that in the next five years, a larger proportion of the workforce at their organization will be telecommuting. Companies with formal FWAs have seen increased productivity rates of telecommuters at their organizations and a drop in absenteeism.
What Do These Findings Mean for Businesses?
Understand Your Business Needs: x Have your organization’s needs changed? Are your customers demanding services 24/7? If so, your organization could benefit by implementing FWAs that best meet your business needs. Organizations can use FWAs to achieve their business goals and at the same time meet employees’ need to do their work outside of tradition-al work hours. Employee requests (68%) were the top reason that prompted organizations to offer formal FWAs. Organizations reported that their ability to at-tract and retain employees and an increase in employee productivity were among factors positively affected by flexible work arrangements. During economically chal-lenging times, when many organizations are searching for ways to cut costs, FWAs—for example, job-sharing or part-time positions—may be an alternative to downsizing through layoffs.
Flexible work arrangements
Flexible work arrangements (FWAs) for the purpose of this research mean greater flexibility in the place of work, the scheduling of hours worked and the amount of hours worked. Such arrangements give employees greater control over where and when work gets done and over how much time they choose to work, leading to greater opportunities for employees to be able to enjoy an optimal balance between work and life responsibilities.
4 Workplace Flexibility in the 21st Century: Meeting the Needs of the Changing Workforce
Open Communication: x Do employees under-stand how your FWA program works? Are FWAs appropriate for all of your business units? Are line managers involved in the design and implementa-tion of FWAs? Including line managers in the design of FWAs creates buy-in. Line managers who do not understand their organizations’ FWAs policy and program may have a negative impact on how FWAs are administered within the organiza-tion. One-third of organizations saw inconsistency in policy and program implementation as one of the obstacles to FWA programs. Communication between line managers and their direct reports is vital to the success of an organization’s FWAs. Open communication helps line managers under-stand their direct reports’ needs. This will assist the managers in suggesting and supporting FWAs that best meet both the employer’s and employ-ees’ needs. Creating a flexible work culture where employees know that management wants them
to succeed at work and in their personal lives will help employers design and implement effective FWAs that are mutually beneficial.
Gauge the Success of FWAs: x Does your organi-zation have a way of measuring the success of its FWAs? It is important to be able to assess the suc-cess of such programs, especially during economi-cally challenging times when budgets are receiving greater scrutiny. Overall, only 13% of organizations that formally offered FWAs reported measuring the success of these programs. If adequate information is not available to demonstrate the value of a pro-gram to the organization, that program may not get the support of top management. Organizations can use easy-to-administer tools such as employee surveys to measure their program participation rate and employee satisfaction with the program.
Workplace Flexibility in the 21st Century: Meeting the Needs of the Changing Workforce 5
SHRM’s proposed public policy position supports the following key workplace flexibility principles:
Flexible Paid Leave: SHRM supports a new approach to providing employees with paid leave that reflects different work environments, industries and organizational size. This paid leave approach should support employees in balancing their work and family obligations and at the same time provide certainty, predictability and stability to employers in sponsoring the program. This program would operate much like a PTO plan, with an employer providing the employee with a guaranteed standard block of flexible paid leave that can be used for any leave purpose. Under this proposal, leave would be subject to the notice requirements and parameters of the employer’s policy, including requirements for employees to use their annual leave. Alternatively, an employer may permit an employee to roll over a capped portion of the unused accrued leave benefits from one year to the next or receive the benefits in the form of a contribution to a retirement or flexible spending account. An employer that met the requirements of this program would be exempt from mandated federal, state and local leave requirements.
Flexible Work Arrangements: Flexible work arrangements (FWAs) allow an employee to alter
the time and/or place when/where work is conducted on a regular basis, consistent and predictable with the employer’s operations. SHRM believes public policy should encourage and support employer efforts to create and implement FWAs.
Telecommuting: Allowing employees to telecommute can be beneficial for both employers and employees. SHRM recognizes that while telecommuting will not be practical for all employees or all employment situations, SHRM believes that public policy should support and encourage telecommuting. However, employers should have the right to determine which employees or em-ployment situations make telecommuting practical.
Paid Leave Mandates: SHRM generally opposes any form of government mandate for paid leave ben-efits, including benefits funded through state insurance funds, as the Society believes that employers, not the government, know the benefit preferences of their employees. HR professionals traditionally work to tailor leave programs to meet the needs of their employees and employers. SHRM has concerns with proposals that implement a “one-size-fits-all” paid leave mandate.
Family and Medical Leave Act: SHRM believes that improvements to the Act’s definitions and notice requirements would reduce administrative and compli-ance problems for employers and HR professionals who are complying with FMLA requirements. Although supportive of the goals of the FMLA, the Society opposes expansion of the Act at this time.
Compensatory Time: The Fair Labor Standards Act limits employee flexibility because it prohibits private-sector employers from offering paid time off as compen-sation for working overtime hours. SHRM believes that private-sector employees should be afforded the same flexibility that public-sector employees have in being able to choose compensatory time or overtime pay.
SHRM’s Proposed Public Policy Statement
www.shrm.org/SHRMisHR
6 Workplace Flexibility in the 21st Century: Meeting the Needs of the Changing Workforce
What Are the Drivers of Flexible Work Arrangements?
With flexible work arrangements growing in incidence and receiving interest, what is prompting employers to offer FWAs to their employees? According to this research, the factors varied. Employee requests were the top reason, as reported by almost seven out of 10 HR professionals. Child care was the most frequently cited reason that prompted employee requests for FWAs. This finding is not surprising because the number of dual-income households and single-parent families has increased since 1975, although the proportion leveled off in 1995.4
“Child care certainly is an issue that many employees, and their employers, must address. However, elder care issues in the workplace are also growing in prevalence. More and more employees must address the needs of one or more parents either living independently with support at home or in facilities such as assisted living or nursing homes. As our population ages, and more individuals need to work longer due to the economic climate, I expect to see elder care grow in prominence as a reason for requesting a FWA,” remarked Jennifer C. Loftus, SPHR, CCP, CBP, GRP, national director at Astron Solutions and member of SHRM’s Total Rewards/Compensation and Benefits Special Expertise Panel. In a SHRM study titled 2009 Employee Benefits, the most frequently offered elder care family-friendly benefit was elder care referral service, which 11% of HR professionals indicated was available to employees at their organizations.5
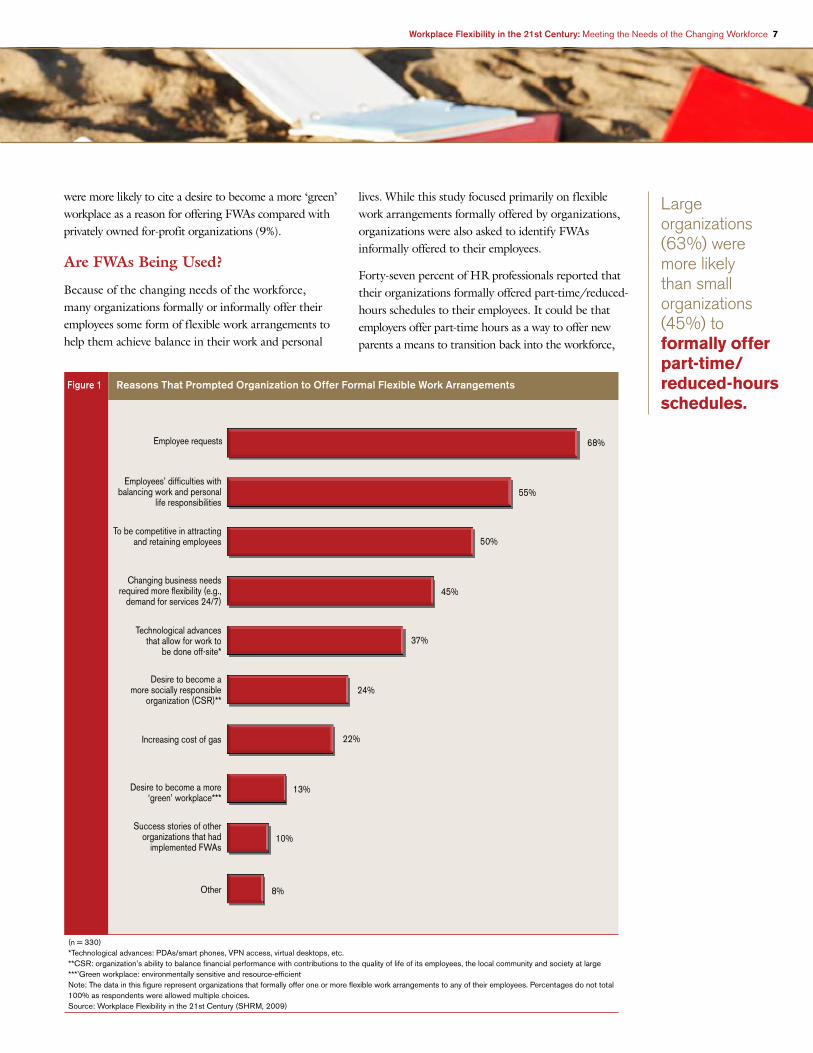
The second and third most frequently cited reasons that organizations offered FWAs were employees’ difficulties with balancing work and personal life responsibilities (55%) and the organization’s desire to be competitive in attracting and retaining employees (50%). These data are depicted in Figure 1. During times of economic uncertainty, employees may feel the need to work longer hours or take less time off from work because they want their employers to see them
as valuable assets. In addition, due to reduced staff at their organizations, employees may find themselves with increased workload and feel pressured to put in longer hours. These situations can lead to imbalance in employees’ work and personal lives.
“In my experience, some applicants were willing to be paid less as long as they could have a flexible work arrangement,” commented Rajiv Burman, GPHR, SPHR, CCP, CEB, member of SHRM’s Total Rewards/Compensation and Benefits Special Expertise Panel and owner of Change2Succeed. This suggests that for some employees, having the flexibility to control their schedules is an extremely desirable benefit. SHRM’s survey report titled 2009 Employee Job Satisfaction found that particularly for women, workplace flexibility is one of the most important contributors to job satisfaction.6
At Community Legal Services of Philadelphia, an employee requested and was approved for
a change in schedule that would coordinate with the employee’s child care arrangements.
Rounding off the top five reasons that employers offer FWAs were changing business needs that required more flexibility (e.g., demand for services 24/7) and technological advances that allowed for work to be done off-site (e.g., PDAs/smart phones, VPN access, virtual desktops, etc.).
There were differences based on respondents’ organization staff size and sector. Competitiveness in attracting and retaining employees was reported more often by large-staff-sized organizations (67%) as a reason they offer FWAs compared with small-(44%) and medium-staff-sized organizations (47%). Technological advances were reported more often by government agencies (67%) than by privately owned for-profit organizations (32%). Publicly owned for-profit organizations (24%) and government agencies (39%)
Employee requests were the top reason employers offer flexible work arrangements, as reported by almost seven out of 10 HR professionals.
FWAs in Practice
Survey Results
Workplace Flexibility in the 21st Century: Meeting the Needs of the Changing Workforce 7
were more likely to cite a desire to become a more ‘green’ workplace as a reason for offering FWAs compared with privately owned for-profit organizations (9%).
Are FWAs Being Used?
Because of the changing needs of the workforce, many organizations formally or informally offer their employees some form of flexible work arrangements to help them achieve balance in their work and personal
lives. While this study focused primarily on flexible work arrangements formally offered by organizations, organizations were also asked to identify FWAs informally offered to their employees.
Forty-seven percent of HR professionals reported that their organizations formally offered part-time/reduced-hours schedules to their employees. It could be that employers offer part-time hours as a way to offer new parents a means to transition back into the workforce,
Figure 1 Reasons That Prompted Organization to Offer Formal Flexible Work Arrangements
(n = 330)*Technological advances: PDAs/smart phones, VPN access, virtual desktops, etc.**CSR: organization’s ability to balance financial performance with contributions to the quality of life of its employees, the local community and society at large***’Green workplace: environmentally sensitive and resource-efficientNote: The data in this figure represent organizations that formally offer one or more flexible work arrangements to any of their employees. Percentages do not total 100% as respondents were allowed multiple choices.Source: Workplace Flexibility in the 21st Century (SHRM, 2009)
Employee requests
Employees’ difficulties with balancing work and personal
life responsibilities
To be competitive in attracting and retaining employees
Changing business needs required more flexibility (e.g.,
demand for services 24/7)
Technological advances that allow for work to
be done off-site*
Desire to become a more socially responsible
organization (CSR)**
Increasing cost of gas
Desire to become a more ‘green’ workplace***
Success stories of other organizations that had
implemented FWAs
Other
68%
55%
50%
45%
37%
24%
22%
13%
10%
8%
Large organizations (63%) were more likely than small organizations (45%) to formally offer part-time/reduced-hours schedules.

8 Workplace Flexibility in the 21st Century: Meeting the Needs of the Changing Workforce
manage peak work hours and overtime costs or offer internship programs. One benefit to employees is that they can reduce their hours, retain some benefits and be able to meet personal obligations. Other flexible work arrangements formally offered by organizations include telecommuting from other locations (38%), flextime with “core hours” (35%) and compressed workweek (26%). Data are illustrated in Table 1.
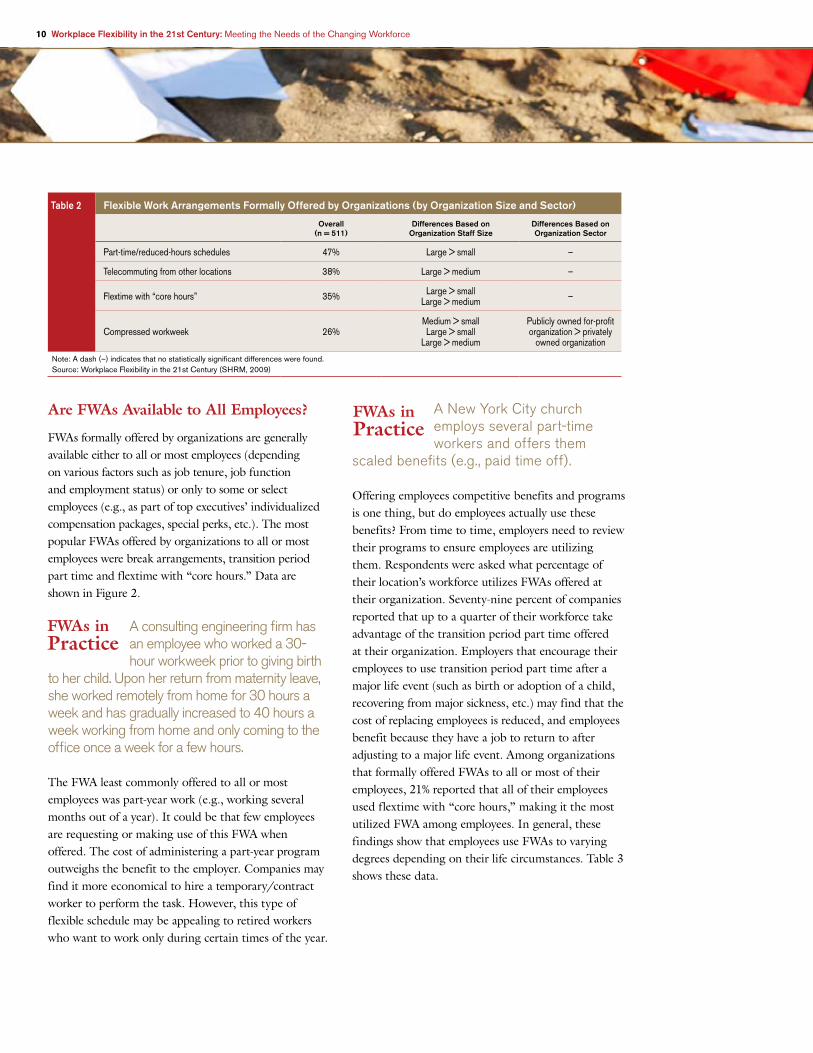
Large organizations (63%) were more likely than small organizations (45%) to formally offer part-time/reduced-hours schedules (see Table 2).
“I am not surprised that part-time schedules and telecommuting from other locations are more prevalent in larger organizations,” notes Jennifer Loftus. “In smaller organizations, there are fewer people available to complete the necessary work. As such, part-time schedules may hamper an organization’s ability to succeed. On the other hand, I found it surprising that flextime and compressed workweeks are more prevalent in larger organizations. Both approaches can bolster an organization’s total rewards package with relatively low cost while still ensuring that appropriate numbers of staff are available to complete the necessary work.”
The Inn at Palmer Divide in Colorado used part-time FWA to retain its restaurant manager,
an experienced individual who is going to school. The reduced hours provide him time to attend class and meet work obligations.
“In absence of formal policies, FWA requests, when treated on a one-off basis rather than a policy-based approach, can lead to feelings of disparate treatment and inequality,” commented Rajiv Burman. “In such a situation, other employees may not be aware of the reduced earnings impact or the need to work from home to make up the lost office time. Instead, they may feel that they were denied a special workplace accommodation.”
Break arrangements are used by Freehold Cartage, Inc., in Freehold, NJ, to allow
employees to attend to their medical needs.
Table 1 Flexible Work Arrangements Offered by Organizations
Formally Informally Neither
Part-time/reduced-hours schedules 47% 11% 42%
Telecommuting from other locations 38% 22% 40%
Flextime with “core hours” 35% 16% 49%
Compressed workweek 26% 12% 62%
Transition period part time 21% 15% 64%
Break arrangements 15% 16% 69%
Shift flexibility 14% 9% 77%
Flextime, “core hours” do not apply 13% 17% 70%
Telecommuting from a satellite location 12% 14% 74%
Job-sharing 8% 3% 89%
Phased retirement 8% 7% 85%
Part-year work 7% 2% 91%
Alternating location 3% 4% 93%
(n = 511)Note: The data in this table represent organizations that formally or informally offer flexible work arrangements to any of their employees.Source: Workplace Flexibility in the 21st Century (SHRM, 2009)
FWAs in Practice
FWAs in Practice
“In absence of formal policies, FWA requests, when treated on a one-off basis rather than a policy-based approach, can lead to feelings of disparate treatment and inequality.”Rajiv Burman, GPHR, SPHR,
CCP, CEB, Change2Succeed
Workplace Flexibility in the 21st Century: Meeting the Needs of the Changing Workforce 9
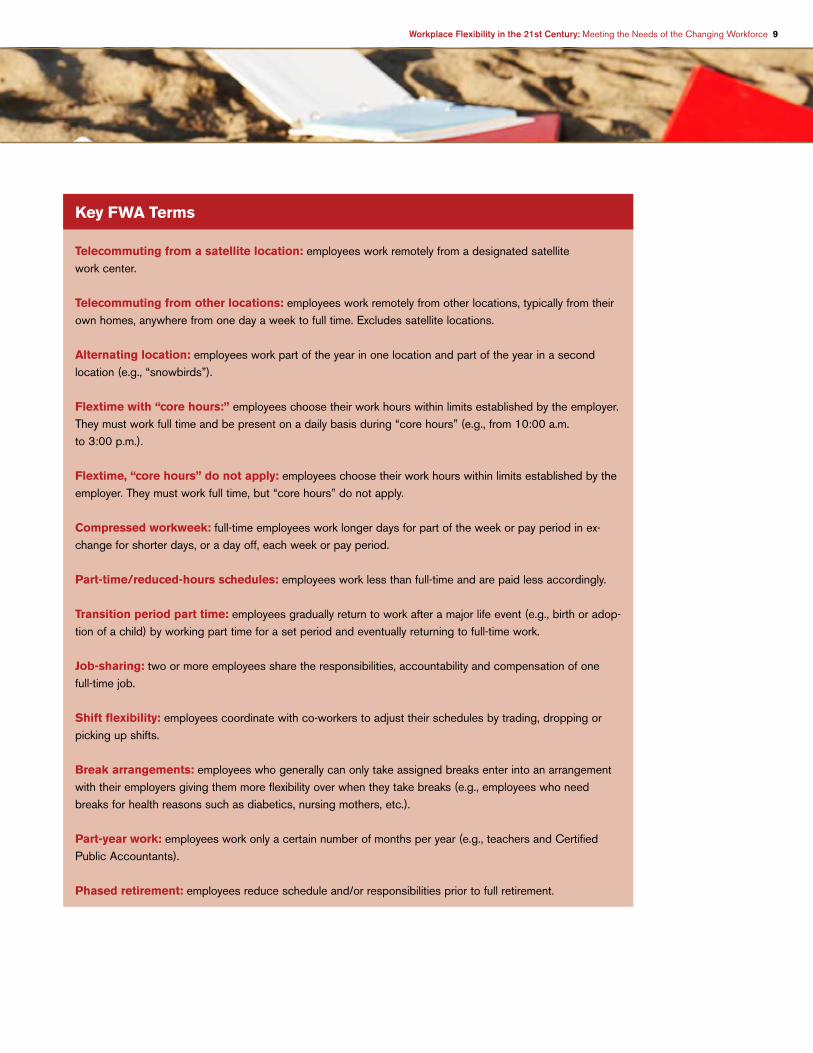
Key FWA Terms
Telecommuting from a satellite location: employees work remotely from a designated satellite work center.
Telecommuting from other locations: employees work remotely from other locations, typically from their own homes, anywhere from one day a week to full time. Excludes satellite locations.
Alternating location: employees work part of the year in one location and part of the year in a second location (e.g., “snowbirds”).
Flextime with “core hours:” employees choose their work hours within limits established by the employer. They must work full time and be present on a daily basis during “core hours” (e.g., from 10:00 a.m. to 3:00 p.m.).
Flextime, “core hours” do not apply: employees choose their work hours within limits established by the employer. They must work full time, but “core hours” do not apply.
Compressed workweek: full-time employees work longer days for part of the week or pay period in ex-change for shorter days, or a day off, each week or pay period.
Part-time/reduced-hours schedules: employees work less than full-time and are paid less accordingly.
Transition period part time: employees gradually return to work after a major life event (e.g., birth or adop-tion of a child) by working part time for a set period and eventually returning to full-time work.
Job-sharing: two or more employees share the responsibilities, accountability and compensation of one full-time job.
Shift flexibility: employees coordinate with co-workers to adjust their schedules by trading, dropping or picking up shifts.
Break arrangements: employees who generally can only take assigned breaks enter into an arrangement with their employers giving them more flexibility over when they take breaks (e.g., employees who need breaks for health reasons such as diabetics, nursing mothers, etc.).
Part-year work: employees work only a certain number of months per year (e.g., teachers and Certified Public Accountants).
Phased retirement: employees reduce schedule and/or responsibilities prior to full retirement.
10 Workplace Flexibility in the 21st Century: Meeting the Needs of the Changing Workforce
Are FWAs Available to All Employees?
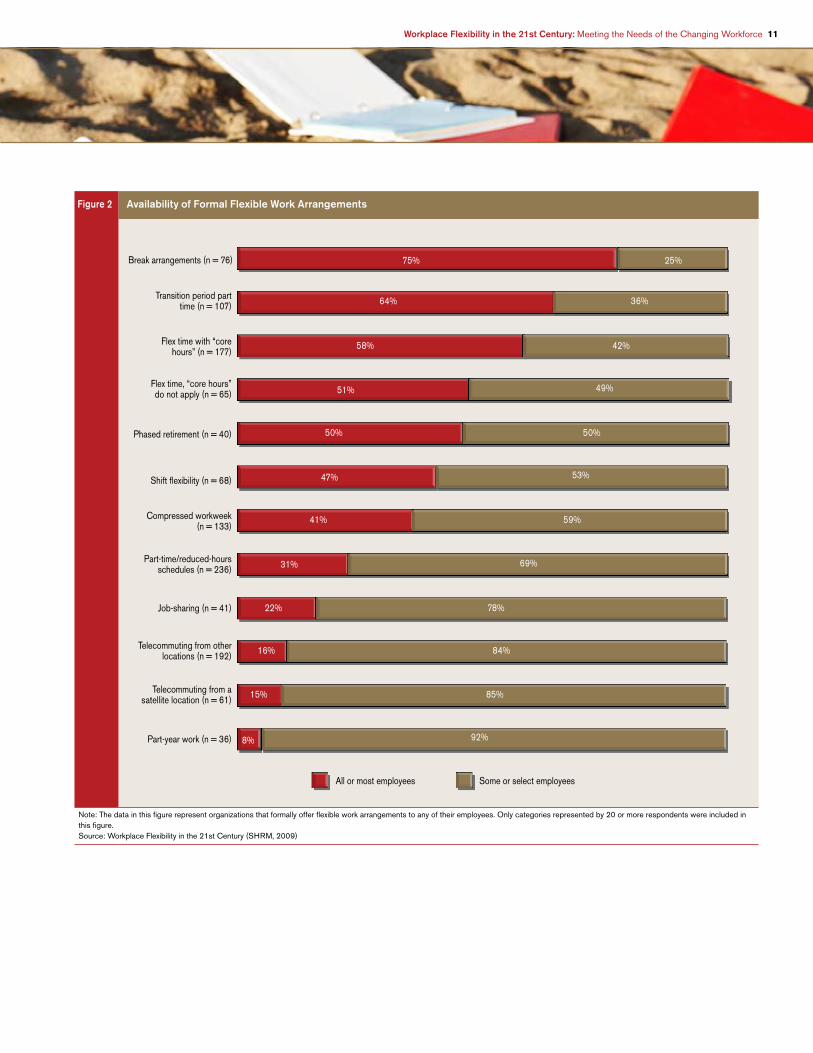
FWAs formally offered by organizations are generally available either to all or most employees (depending on various factors such as job tenure, job function and employment status) or only to some or select employees (e.g., as part of top executives’ individualized compensation packages, special perks, etc.). The most popular FWAs offered by organizations to all or most employees were break arrangements, transition period part time and flextime with “core hours.” Data are shown in Figure 2.
A consulting engineering firm has an employee who worked a 30-hour workweek prior to giving birth
to her child. Upon her return from maternity leave, she worked remotely from home for 30 hours a week and has gradually increased to 40 hours a week working from home and only coming to the office once a week for a few hours.
The FWA least commonly offered to all or most employees was part-year work (e.g., working several months out of a year). It could be that few employees are requesting or making use of this FWA when offered. The cost of administering a part-year program outweighs the benefit to the employer. Companies may find it more economical to hire a temporary/contract worker to perform the task. However, this type of flexible schedule may be appealing to retired workers who want to work only during certain times of the year.
A New York City church employs several part-time workers and offers them
scaled benefits (e.g., paid time off).
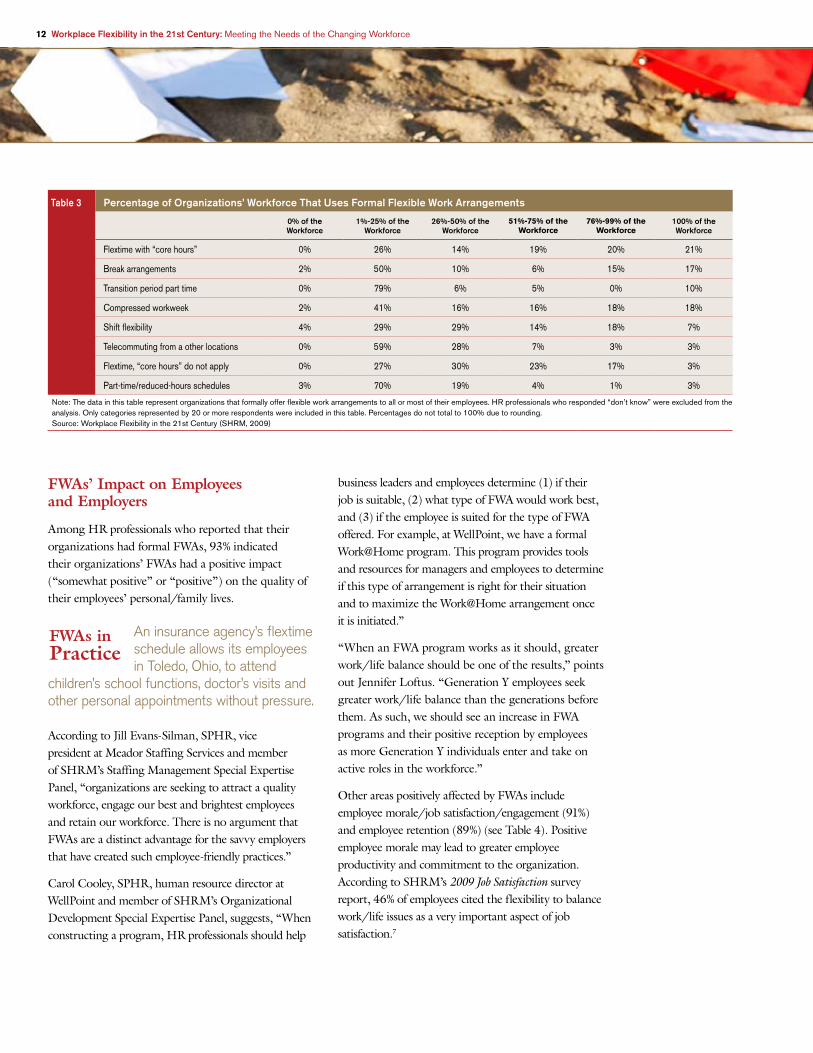
Offering employees competitive benefits and programs is one thing, but do employees actually use these benefits? From time to time, employers need to review their programs to ensure employees are utilizing them. Respondents were asked what percentage of their location’s workforce utilizes FWAs offered at their organization. Seventy-nine percent of companies reported that up to a quarter of their workforce take advantage of the transition period part time offered at their organization. Employers that encourage their employees to use transition period part time after a major life event (such as birth or adoption of a child, recovering from major sickness, etc.) may find that the cost of replacing employees is reduced, and employees benefit because they have a job to return to after adjusting to a major life event. Among organizations that formally offered FWAs to all or most of their employees, 21% reported that all of their employees used flextime with “core hours,” making it the most utilized FWA among employees. In general, these findings show that employees use FWAs to varying degrees depending on their life circumstances. Table 3 shows these data.
Table 2 Flexible Work Arrangements Formally Offered by Organizations (by Organization Size and Sector)
Overall (n = 511)
Differences Based on Organization Staff Size
Differences Based on Organization Sector
Part-time/reduced-hours schedules 47% Large > small —
Telecommuting from other locations 38% Large > medium —
Flextime with “core hours” 35% Large > small Large > medium —
Compressed workweek 26%Medium > small Large > small
Large > medium
Publicly owned for-profit organization > privately
owned organization
Note: A dash (–) indicates that no statistically significant differences were found. Source: Workplace Flexibility in the 21st Century (SHRM, 2009)
FWAs in Practice
FWAs in Practice
Workplace Flexibility in the 21st Century: Meeting the Needs of the Changing Workforce 11
Figure 2 Availability of Formal Flexible Work Arrangements
Note: The data in this figure represent organizations that formally offer flexible work arrangements to any of their employees. Only categories represented by 20 or more respondents were included in this figure.Source: Workplace Flexibility in the 21st Century (SHRM, 2009)
Break arrangements (n = 76)
Transition period part time (n = 107)
Flex time with “core hours” (n = 177)
Flex time, “core hours” do not apply (n = 65)
Phased retirement (n = 40)
Shift flexibility (n = 68)
Compressed workweek (n = 133)
Part-time/reduced-hours schedules (n = 236)
Job-sharing (n = 41)
Telecommuting from other locations (n = 192)
Telecommuting from a satellite location (n = 61)
Part-year work (n = 36)
75% 25%
36%
42%
49%
50%
53%
59%
69%
78%
84%
85%
92%
64%
58%
51%
50%
47%
41%
31%
22%
16%
15%
8%
All or most employees Some or select employees
12 Workplace Flexibility in the 21st Century: Meeting the Needs of the Changing Workforce
FWAs’ Impact on Employees and Employers
Among HR professionals who reported that their organizations had formal FWAs, 93% indicated their organizations’ FWAs had a positive impact (“somewhat positive” or “positive”) on the quality of their employees’ personal/family lives.
An insurance agency’s flextime schedule allows its employees in Toledo, Ohio, to attend
children’s school functions, doctor’s visits and other personal appointments without pressure.
According to Jill Evans-Silman, SPHR, vice president at Meador Staffing Services and member of SHRM’s Staffing Management Special Expertise Panel, “organizations are seeking to attract a quality workforce, engage our best and brightest employees and retain our workforce. There is no argument that FWAs are a distinct advantage for the savvy employers that have created such employee-friendly practices.”
Carol Cooley, SPHR, human resource director at WellPoint and member of SHRM’s Organizational Development Special Expertise Panel, suggests, “When constructing a program, HR professionals should help
business leaders and employees determine (1) if their job is suitable, (2) what type of FWA would work best, and (3) if the employee is suited for the type of FWA offered. For example, at WellPoint, we have a formal Work@Home program. This program provides tools and resources for managers and employees to determine if this type of arrangement is right for their situation and to maximize the Work@Home arrangement once it is initiated.”
“When an FWA program works as it should, greater work/life balance should be one of the results,” points out Jennifer Loftus. “Generation Y employees seek greater work/life balance than the generations before them. As such, we should see an increase in FWA programs and their positive reception by employees as more Generation Y individuals enter and take on active roles in the workforce.”
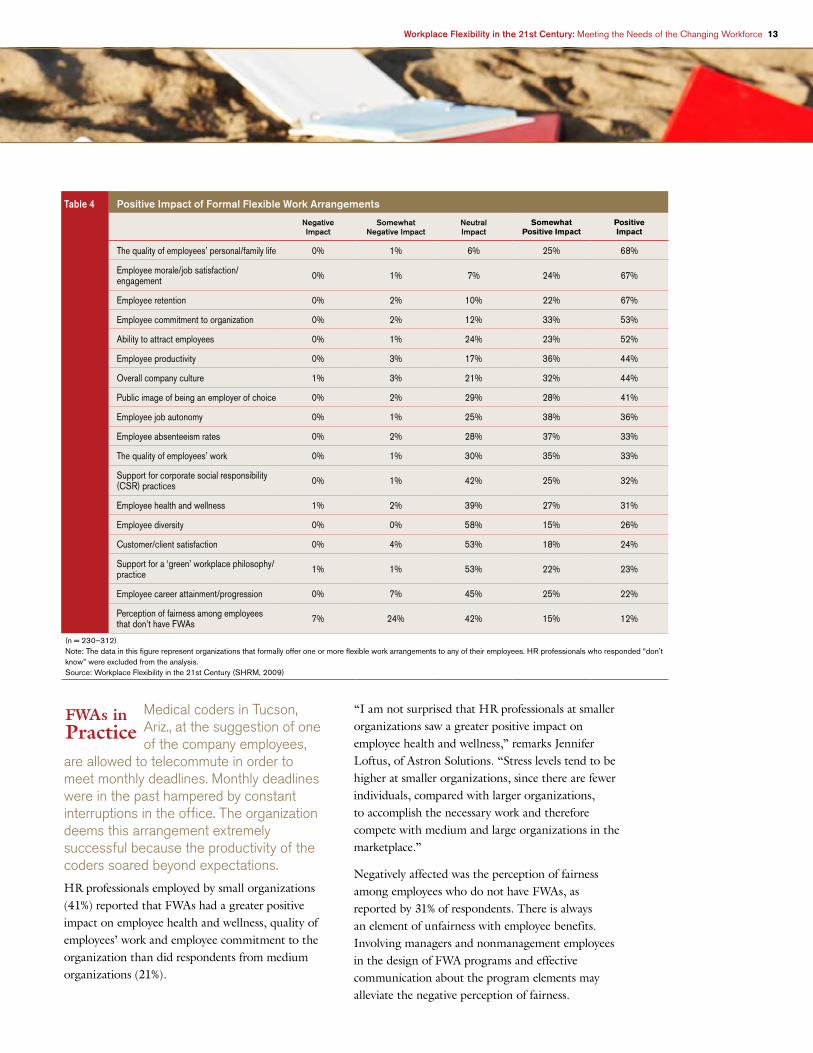
Other areas positively affected by FWAs include employee morale/job satisfaction/engagement (91%) and employee retention (89%) (see Table 4). Positive employee morale may lead to greater employee productivity and commitment to the organization. According to SHRM’s 2009 Job Satisfaction survey report, 46% of employees cited the flexibility to balance work/life issues as a very important aspect of job satisfaction.7
Table 3 Percentage of Organizations’ Workforce That Uses Formal Flexible Work Arrangements
0% of the Workforce
1%-25% of the Workforce
26%-50% of the Workforce
51%-75% of the Workforce
76%-99% of the Workforce
100% of the Workforce
Flextime with “core hours” 0% 26% 14% 19% 20% 21%
Break arrangements 2% 50% 10% 6% 15% 17%
Transition period part time 0% 79% 6% 5% 0% 10%
Compressed workweek 2% 41% 16% 16% 18% 18%
Shift flexibility 4% 29% 29% 14% 18% 7%
Telecommuting from a other locations 0% 59% 28% 7% 3% 3%
Flextime, “core hours” do not apply 0% 27% 30% 23% 17% 3%
Part-time/reduced-hours schedules 3% 70% 19% 4% 1% 3%
Note: The data in this table represent organizations that formally offer flexible work arrangements to all or most of their employees. HR professionals who responded “don’t know” were excluded from the analysis. Only categories represented by 20 or more respondents were included in this table. Percentages do not total to 100% due to rounding.Source: Workplace Flexibility in the 21st Century (SHRM, 2009)
FWAs in Practice
Workplace Flexibility in the 21st Century: Meeting the Needs of the Changing Workforce 13
Medical coders in Tucson, Ariz., at the suggestion of one of the company employees,
are allowed to telecommute in order to meet monthly deadlines. Monthly deadlines were in the past hampered by constant interruptions in the office. The organization deems this arrangement extremely successful because the productivity of the coders soared beyond expectations.
HR professionals employed by small organizations (41%) reported that FWAs had a greater positive impact on employee health and wellness, quality of employees’ work and employee commitment to the organization than did respondents from medium organizations (21%).
“I am not surprised that HR professionals at smaller organizations saw a greater positive impact on employee health and wellness,” remarks Jennifer Loftus, of Astron Solutions. “Stress levels tend to be higher at smaller organizations, since there are fewer individuals, compared with larger organizations, to accomplish the necessary work and therefore compete with medium and large organizations in the marketplace.”
Negatively affected was the perception of fairness among employees who do not have FWAs, as reported by 31% of respondents. There is always an element of unfairness with employee benefits. Involving managers and nonmanagement employees in the design of FWA programs and effective communication about the program elements may alleviate the negative perception of fairness.
Table 4 Positive Impact of Formal Flexible Work Arrangements
Negative Impact
Somewhat Negative Impact
Neutral Impact
Somewhat Positive Impact
Positive Impact
The quality of employees’ personal/family life 0% 1% 6% 25% 68%
Employee morale/job satisfaction/engagement 0% 1% 7% 24% 67%
Employee retention 0% 2% 10% 22% 67%
Employee commitment to organization 0% 2% 12% 33% 53%
Ability to attract employees 0% 1% 24% 23% 52%
Employee productivity 0% 3% 17% 36% 44%
Overall company culture 1% 3% 21% 32% 44%
Public image of being an employer of choice 0% 2% 29% 28% 41%
Employee job autonomy 0% 1% 25% 38% 36%
Employee absenteeism rates 0% 2% 28% 37% 33%
The quality of employees’ work 0% 1% 30% 35% 33%
Support for corporate social responsibility (CSR) practices 0% 1% 42% 25% 32%
Employee health and wellness 1% 2% 39% 27% 31%
Employee diversity 0% 0% 58% 15% 26%
Customer/client satisfaction 0% 4% 53% 18% 24%
Support for a ‘green’ workplace philosophy/practice 1% 1% 53% 22% 23%
Employee career attainment/progression 0% 7% 45% 25% 22%
Perception of fairness among employees that don’t have FWAs 7% 24% 42% 15% 12%
(n = 230–312)Note: The data in this figure represent organizations that formally offer one or more flexible work arrangements to any of their employees. HR professionals who responded “don’t know” were excluded from the analysis.Source: Workplace Flexibility in the 21st Century (SHRM, 2009)
FWAs in Practice
14 Workplace Flexibility in the 21st Century: Meeting the Needs of the Changing Workforce
West Michigan Community Mental Health has a senior, seasoned infant mental health
specialist who is nearing retirement and a younger but seasoned infant mental health specialist who returned from maternity leave and is pregnant again. The two employees are sharing one job that meets both of their needs and the needs for their clients. It provides for a phased retirement opportunity for the senior staff member and a family-friendly schedule for the other staff member.
This study finds that employees in flexible organizations are more likely to be engaged in helping their organizations succeed, more likely to be satisfied with their jobs, more likely to stay with their employer and more likely to be in better physical and mental health.
Measuring for Success
How can organizations determine if their flexible work arrangements are effective? It is important for
organizations to collect data on which FWAs are working and not working in their organizations. Evaluating and monitoring the effectiveness and utilization of flexible work arrangements helps employers in the assessment of the costs and benefits of these programs. In addition, evaluating and monitoring programs can help companies promote benefits to their employees and clients.
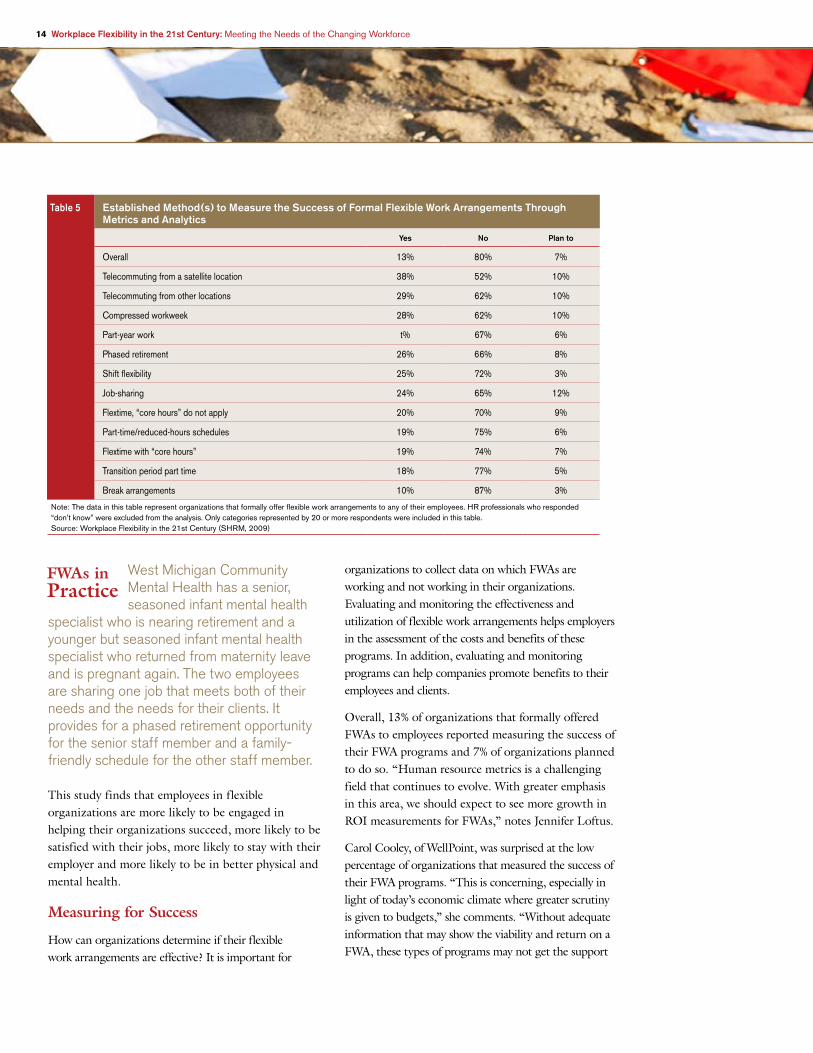
Overall, 13% of organizations that formally offered FWAs to employees reported measuring the success of their FWA programs and 7% of organizations planned to do so. “Human resource metrics is a challenging field that continues to evolve. With greater emphasis in this area, we should expect to see more growth in ROI measurements for FWAs,” notes Jennifer Loftus.
Carol Cooley, of WellPoint, was surprised at the low percentage of organizations that measured the success of their FWA programs. “This is concerning, especially in light of today’s economic climate where greater scrutiny is given to budgets,” she comments. “Without adequate information that may show the viability and return on a FWA, these types of programs may not get the support
Table 5 Established Method(s) to Measure the Success of Formal Flexible Work Arrangements Through Metrics and Analytics
Yes No Plan to
Overall 13% 80% 7%
Telecommuting from a satellite location 38% 52% 10%
Telecommuting from other locations 29% 62% 10%
Compressed workweek 28% 62% 10%
Part-year work t% 67% 6%
Phased retirement 26% 66% 8%
Shift flexibility 25% 72% 3%
Job-sharing 24% 65% 12%
Flextime, “core hours” do not apply 20% 70% 9%
Part-time/reduced-hours schedules 19% 75% 6%
Flextime with “core hours” 19% 74% 7%
Transition period part time 18% 77% 5%
Break arrangements 10% 87% 3%
Note: The data in this table represent organizations that formally offer flexible work arrangements to any of their employees. HR professionals who responded “don’t know” were excluded from the analysis. Only categories represented by 20 or more respondents were included in this table.Source: Workplace Flexibility in the 21st Century (SHRM, 2009)
FWAs in Practice
Workplace Flexibility in the 21st Century: Meeting the Needs of the Changing Workforce 15
of top management. I expected that there would be more emphasis on measuring ROI of these programs—for example, some basic cost-benefit analysis at a minimum.”
An employer in Stamford, Conn., developed a policy on FWAs. The program was
piloted to employees in the information systems department and an off-site team based at a customer’s location. Options were to work remotely or to use flex hours with core hours. About 10% of employees applied to participate in the pilot program, and permission was granted to 8%. Every 30 days, surveys were conducted among three separate populations (employees, teammates, management), with the objective to assess impact on productivity and on teammates and to evaluate managers’ reactions. Data from the survey were used to refine the policy/procedures and to help “sell” the program elsewhere. It has been a resounding success. The company rolled out the FWA program to the remainder of the company in January 2009.
Telecommuting from a satellite location, telecommuting from other locations and compressed workweek were the top three FWAs measured by organizations to determine their success (see Table 5). This may be because telecommuting is the most commonly FWA offered by companies—60% of organizations offer telecommuting formally or informally (see Table 1). Large organizations (20%) were more likely than medium organizations (8%) to have an established method to measure the success of FWAs through metrics and analytics.
Further analysis of the data found that flexible work arrangements were perceived as more successful among organizations that have an established method to measure FWAs than among those that did not measure/plan to measure FWAs.
Does Face Time Equate to Productivity or Results?
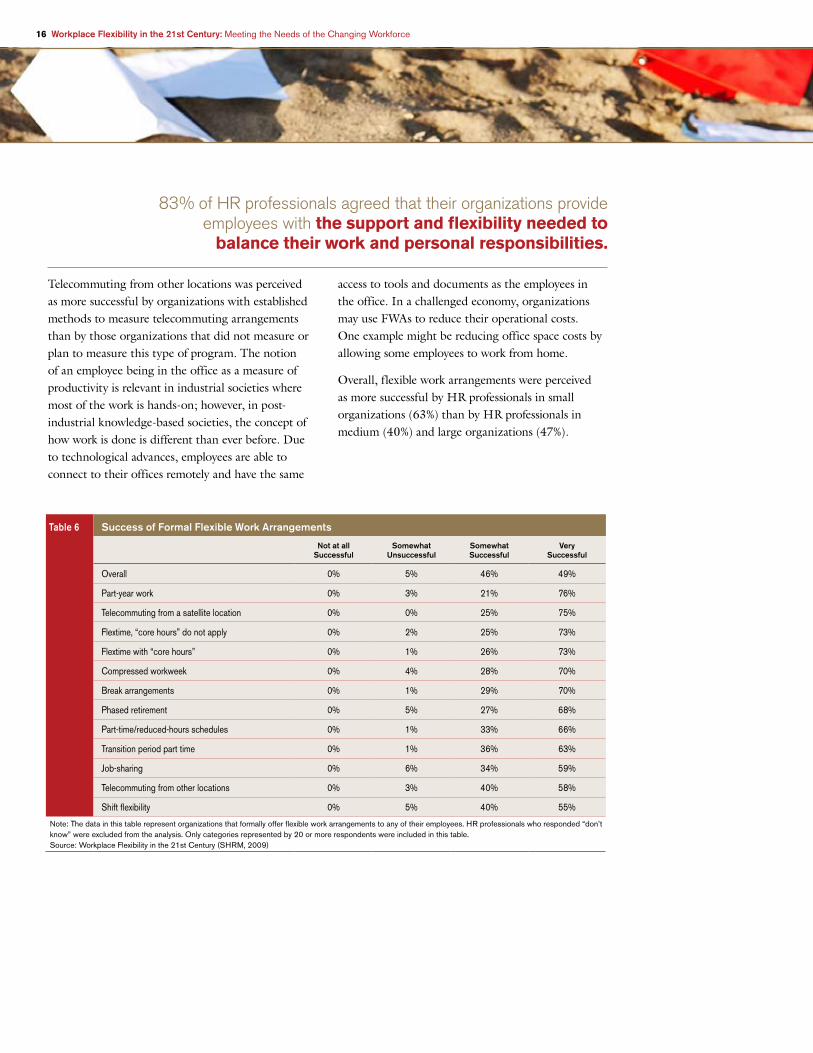
Overall, among the organizations that formally offer FWAs, almost all consider the arrangements to be somewhat or very successful. As shown in Table 6, among the organizations that formally offer flexible work arrangements to any of its employees, those FWA deemed to be very successful were part-year work (76%), telecommuting from a satellite location (75%), flextime where “core hours” do not apply (73%), flextime with “core hours” (73%) and compressed workweek (70%).
In light of the high success of FWAs, why are more organizations not offering employees greater workplace flexibility options? It could be that employers without an established method of measuring the success of their FWA program may still be equating face time with productivity. Employees perceive businesses as generally supportive of flexible work options. In a survey of full- and part-time employees conducted by SHRM, only 27% of the responding employees reported feeling concerned (“somewhat concerned” or “concerned”) that they would be perceived as less committed to their job if they used flexible work options. Twenty percent were concerned that taking advantage of FWAs would jeopardize their job security, and 19% were concerned that their career advancement opportunities would be jeopardized.8 Among the companies that offer workplace flexibility options, 83% of HR professionals agreed (responded “somewhat agree” or “strongly agree”) that their organizations provide employees with the support and flexibility needed to balance their work and personal responsibilities, while eight out of 10 HR professionals agreed that top management and line managers/supervisors supported employees’ efforts to balance their work and personal responsibilities.9 These findings reveal the importance of alignment between the company culture and the programs offered to employees. FWA programs without organizational support are likely to fail and be underutilized by employees.
Flexible work arrangements were perceived as more successful among organizations that have an established method to measure FWAs than among those that did not measure/plan to measure FWAs.
FWAs in Practice
16 Workplace Flexibility in the 21st Century: Meeting the Needs of the Changing Workforce
Telecommuting from other locations was perceived as more successful by organizations with established methods to measure telecommuting arrangements than by those organizations that did not measure or plan to measure this type of program. The notion of an employee being in the office as a measure of productivity is relevant in industrial societies where most of the work is hands-on; however, in post-industrial knowledge-based societies, the concept of how work is done is different than ever before. Due to technological advances, employees are able to connect to their offices remotely and have the same
access to tools and documents as the employees in the office. In a challenged economy, organizations may use FWAs to reduce their operational costs. One example might be reducing office space costs by allowing some employees to work from home.
Overall, flexible work arrangements were perceived as more successful by HR professionals in small organizations (63%) than by HR professionals in medium (40%) and large organizations (47%).
83% of HR professionals agreed that their organizations provide employees with the support and flexibility needed to
balance their work and personal responsibilities.
Table 6 Success of Formal Flexible Work Arrangements
Not at all Successful
Somewhat Unsuccessful
Somewhat Successful
Very Successful
Overall 0% 5% 46% 49%
Part-year work 0% 3% 21% 76%
Telecommuting from a satellite location 0% 0% 25% 75%
Flextime, “core hours” do not apply 0% 2% 25% 73%
Flextime with “core hours” 0% 1% 26% 73%
Compressed workweek 0% 4% 28% 70%
Break arrangements 0% 1% 29% 70%
Phased retirement 0% 5% 27% 68%
Part-time/reduced-hours schedules 0% 1% 33% 66%
Transition period part time 0% 1% 36% 63%
Job-sharing 0% 6% 34% 59%
Telecommuting from other locations 0% 3% 40% 58%
Shift flexibility 0% 5% 40% 55%
Note: The data in this table represent organizations that formally offer flexible work arrangements to any of their employees. HR professionals who responded “don’t know” were excluded from the analysis. Only categories represented by 20 or more respondents were included in this table.Source: Workplace Flexibility in the 21st Century (SHRM, 2009)
Workplace Flexibility in the 21st Century: Meeting the Needs of the Changing Workforce 17
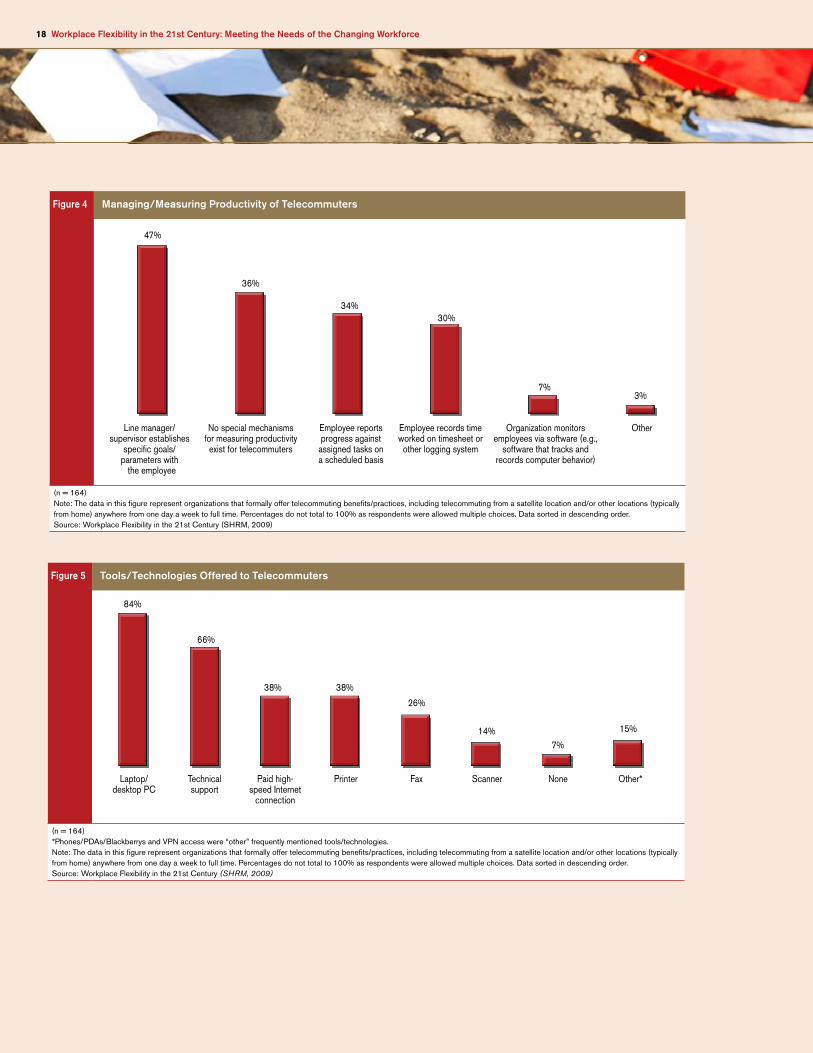
Organizations that formally offer telecommuting from a satellite location or telecommuting from other locations deem this flexible work arrangement to be very successful (see Table 6). As illustrated in Figure 3, of the organizations that formally offer telecommuting benefits/practices, 32% cited an increased productivity rate for telecommuters. It could be that employees who telecommute work the hours that are convenient for them and consequently go the extra mile for their organizations. Nearly half of organizations reported that they use specific goals or parameters established by line managers and supervisors as methods of managing and measuring the productivity of telecommuters. These data are shown in Figure 4, on page 18.
Forty-two percent of HR professionals reported that absenteeism rate of telecommuters dropped. Some organizations are uncertain about how to measure the productivity and absenteeism of telecommuters, as reported by almost one out of three HR professionals.
Advances in technology have enabled more organiza-tions to offer their employees telecommuting benefits. Eighty-four percent of HR professionals reported that their organizations provided their telecommuters with laptops or desktop computers. Organizations also pro-
vided technical support, high-speed Internet and printers. These data are shown in Figure 5, on page 18.
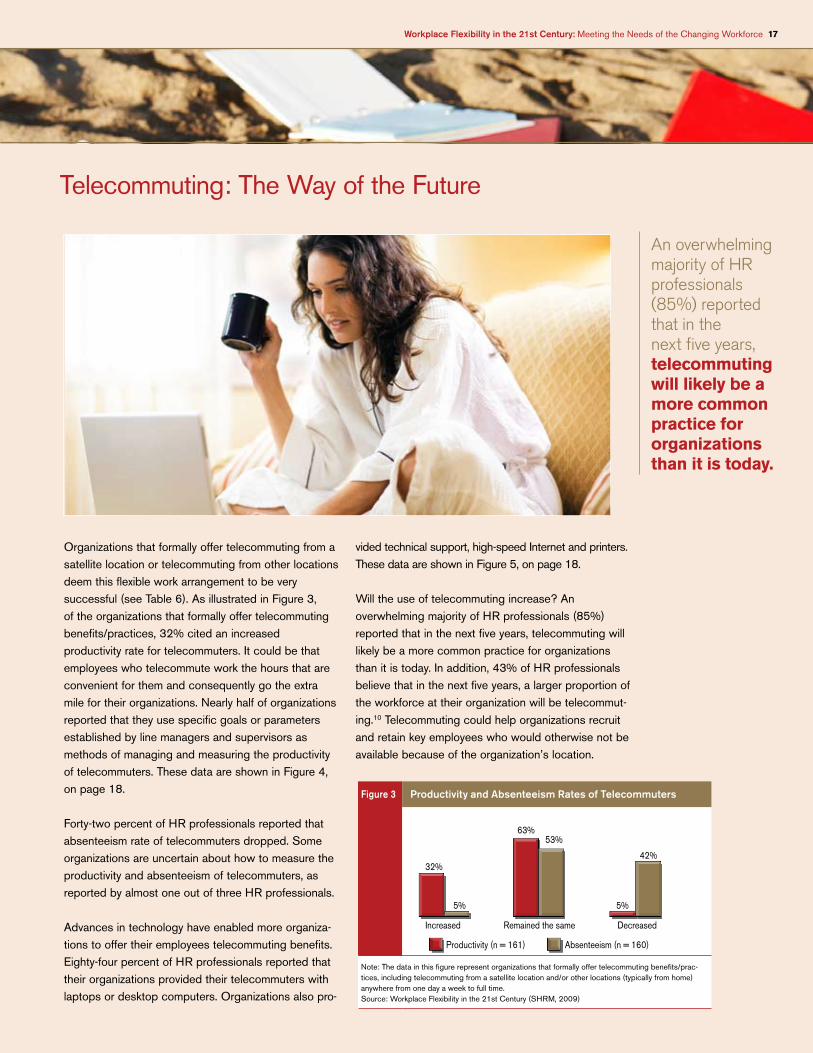
Will the use of telecommuting increase? An overwhelming majority of HR professionals (85%) reported that in the next five years, telecommuting will likely be a more common practice for organizations than it is today. In addition, 43% of HR professionals believe that in the next five years, a larger proportion of the workforce at their organization will be telecommut-ing.10 Telecommuting could help organizations recruit and retain key employees who would otherwise not be available because of the organization’s location.
Telecommuting: The Way of the Future
Figure 3 Productivity and Absenteeism Rates of Telecommuters
Note: The data in this figure represent organizations that formally offer telecommuting benefits/prac-tices, including telecommuting from a satellite location and/or other locations (typically from home) anywhere from one day a week to full time.Source: Workplace Flexibility in the 21st Century (SHRM, 2009)
42%
5% 5%
DecreasedIncreased
32%
Remained the same
63%53%
Productivity (n = 161) Absenteeism (n = 160)
An overwhelming majority of HR professionals (85%) reported that in the next five years, telecommuting will likely be a more common practice for organizations than it is today.
18 Workplace Flexibility in the 21st Century: Meeting the Needs of the Changing Workforce
Figure 5 Tools/Technologies Offered to Telecommuters
(n = 164)*Phones/PDAs/Blackberrys and VPN access were “other” frequently mentioned tools/technologies.Note: The data in this figure represent organizations that formally offer telecommuting benefits/practices, including telecommuting from a satellite location and/or other locations (typically from home) anywhere from one day a week to full time. Percentages do not total to 100% as respondents were allowed multiple choices. Data sorted in descending order.Source: Workplace Flexibility in the 21st Century (SHRM, 2009)
Laptop/desktop PC
84%
Technical support
66%
Paid high-speed Internet
connection
38%
Printer
38%
Fax
26%
Scanner
14%
None
7%
Other*
15%
Figure 4 Managing/Measuring Productivity of Telecommuters
(n = 164)Note: The data in this figure represent organizations that formally offer telecommuting benefits/practices, including telecommuting from a satellite location and/or other locations (typically from home) anywhere from one day a week to full time. Percentages do not total to 100% as respondents were allowed multiple choices. Data sorted in descending order.Source: Workplace Flexibility in the 21st Century (SHRM, 2009)
Line manager/supervisor establishes
specific goals/parameters with
the employee
No special mechanisms for measuring productivity
exist for telecommuters
Employee reports progress against
assigned tasks on a scheduled basis
Employee records time worked on timesheet or
other logging system
Organization monitors employees via software (e.g.,
software that tracks and records computer behavior)
Other
36%
47%
34%30%
7%3%
Workplace Flexibility in the 21st Century: Meeting the Needs of the Changing Workforce 19
The Evaluation Team
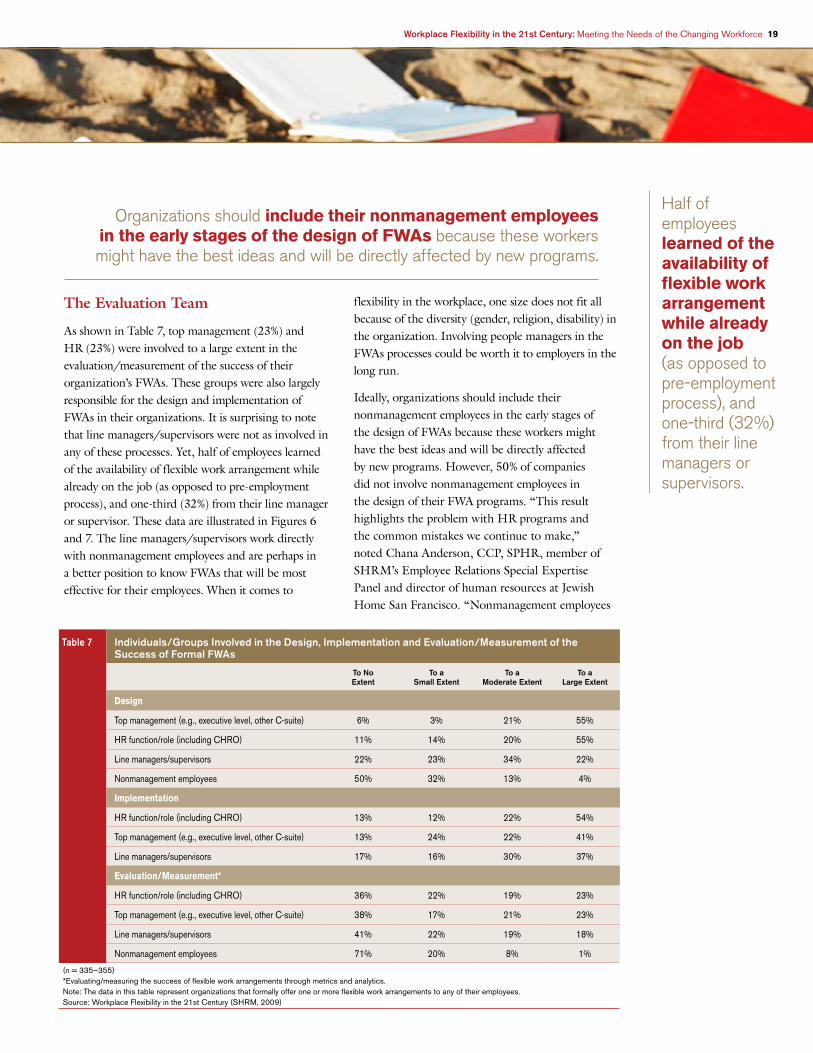
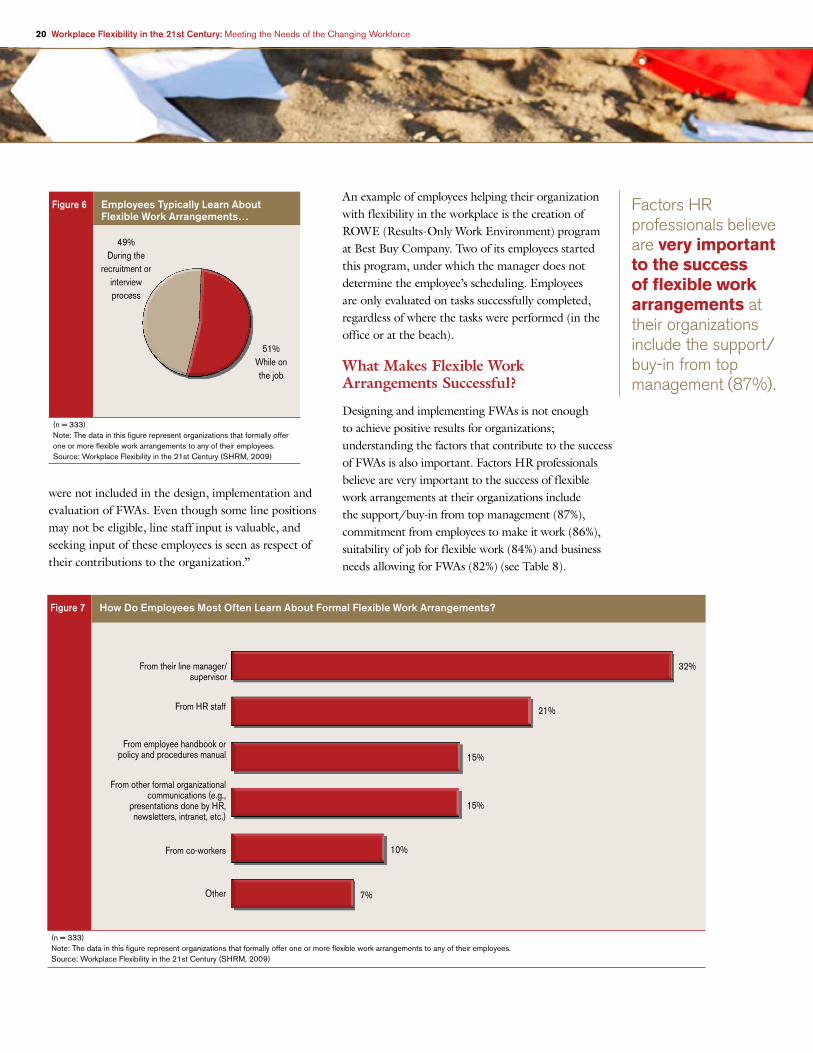
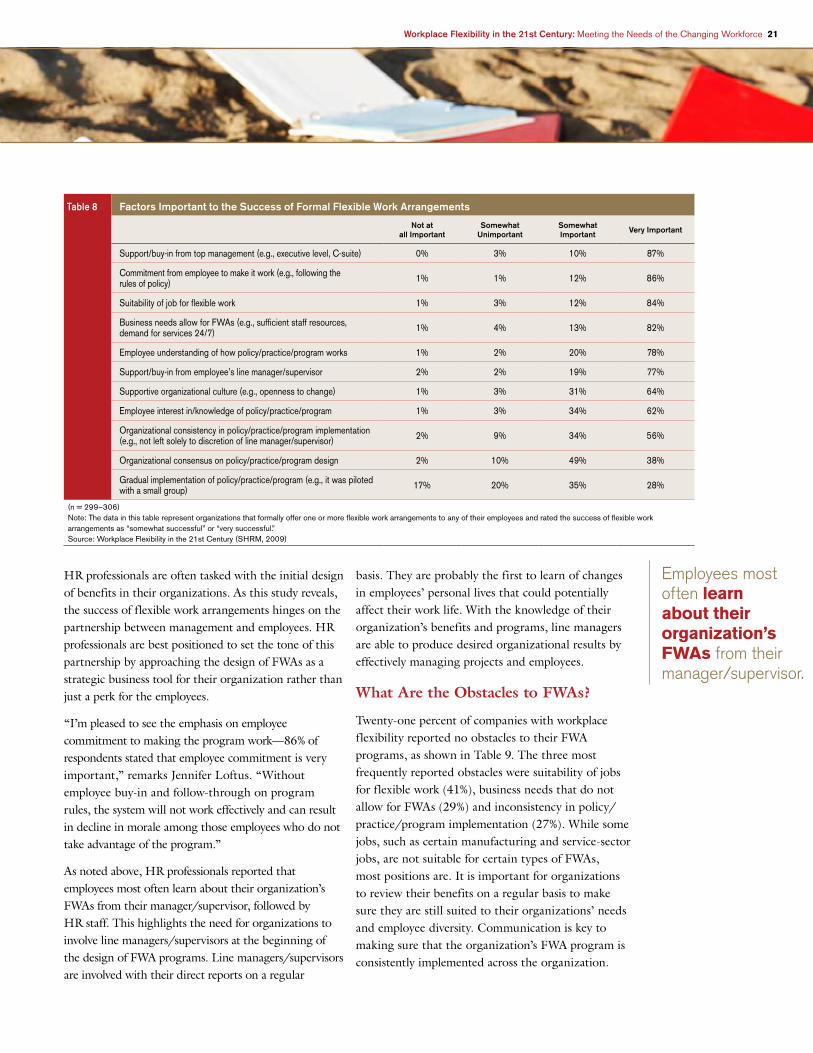
As shown in Table 7, top management (23%) and HR (23%) were involved to a large extent in the evaluation/measurement of the success of their organization’s FWAs. These groups were also largely responsible for the design and implementation of FWAs in their organizations. It is surprising to note that line managers/supervisors were not as involved in any of these processes. Yet, half of employees learned of the availability of flexible work arrangement while already on the job (as opposed to pre-employment process), and one-third (32%) from their line manager or supervisor. These data are illustrated in Figures 6 and 7. The line managers/supervisors work directly with nonmanagement employees and are perhaps in a better position to know FWAs that will be most effective for their employees. When it comes to
flexibility in the workplace, one size does not fit all because of the diversity (gender, religion, disability) in the organization. Involving people managers in the FWAs processes could be worth it to employers in the long run.
Ideally, organizations should include their nonmanagement employees in the early stages of the design of FWAs because these workers might have the best ideas and will be directly affected by new programs. However, 50% of companies did not involve nonmanagement employees in the design of their FWA programs. “This result highlights the problem with HR programs and the common mistakes we continue to make,” noted Chana Anderson, CCP, SPHR, member of SHRM’s Employee Relations Special Expertise Panel and director of human resources at Jewish Home San Francisco. “Nonmanagement employees
Table 7 Individuals/Groups Involved in the Design, Implementation and Evaluation/Measurement of the Success of Formal FWAs
To No Extent
To a Small Extent
To a Moderate Extent
To a Large Extent
Design
Top management (e.g., executive level, other C-suite) 6% 3% 21% 55%
HR function/role (including CHRO) 11% 14% 20% 55%
Line managers/supervisors 22% 23% 34% 22%
Nonmanagement employees 50% 32% 13% 4%
Implementation
HR function/role (including CHRO) 13% 12% 22% 54%
Top management (e.g., executive level, other C-suite) 13% 24% 22% 41%
Line managers/supervisors 17% 16% 30% 37%
Evaluation/Measurement*
HR function/role (including CHRO) 36% 22% 19% 23%
Top management (e.g., executive level, other C-suite) 38% 17% 21% 23%
Line managers/supervisors 41% 22% 19% 18%
Nonmanagement employees 71% 20% 8% 1%
(n = 335—355)*Evaluating/measuring the success of flexible work arrangements through metrics and analytics.Note: The data in this table represent organizations that formally offer one or more flexible work arrangements to any of their employees.Source: Workplace Flexibility in the 21st Century (SHRM, 2009)
Half of employees learned of the availability of flexible work arrangement while already on the job (as opposed to pre-employment process), and one-third (32%) from their line managers or supervisors.
Organizations should include their nonmanagement employees in the early stages of the design of FWAs because these workers might have the best ideas and will be directly affected by new programs.
20 Workplace Flexibility in the 21st Century: Meeting the Needs of the Changing Workforce
were not included in the design, implementation and evaluation of FWAs. Even though some line positions may not be eligible, line staff input is valuable, and seeking input of these employees is seen as respect of their contributions to the organization.”
An example of employees helping their organization with flexibility in the workplace is the creation of ROWE (Results-Only Work Environment) program at Best Buy Company. Two of its employees started this program, under which the manager does not determine the employee’s scheduling. Employees are only evaluated on tasks successfully completed, regardless of where the tasks were performed (in the office or at the beach).
What Makes Flexible Work Arrangements Successful?
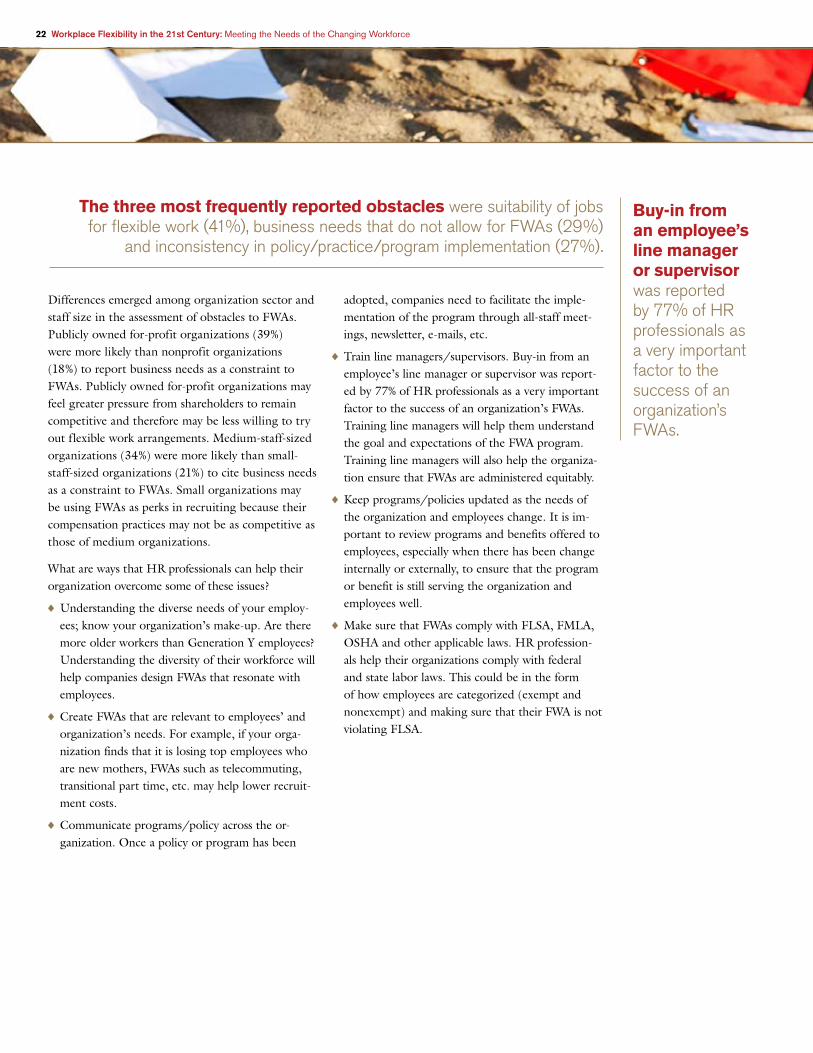
Designing and implementing FWAs is not enough to achieve positive results for organizations; understanding the factors that contribute to the success of FWAs is also important. Factors HR professionals believe are very important to the success of flexible work arrangements at their organizations include the support/buy-in from top management (87%), commitment from employees to make it work (86%), suitability of job for flexible work (84%) and business needs allowing for FWAs (82%) (see Table 8).
Figure 7 How Do Employees Most Often Learn About Formal Flexible Work Arrangements?
(n = 333)Note: The data in this figure represent organizations that formally offer one or more flexible work arrangements to any of their employees.Source: Workplace Flexibility in the 21st Century (SHRM, 2009)
From their line manager/supervisor
From HR staff
From employee handbook or policy and procedures manual
From other formal organizational communications (e.g.,
presentations done by HR, newsletters, intranet, etc.)
From co-workers
Other
21%
32%
15%
15%
10%
7%
Factors HR professionals believe are very important to the success of flexible work arrangements at their organizations include the support/buy-in from top management (87%).
Figure 6 Employees Typically Learn About Flexible Work Arrangements…
(n = 333) Note: The data in this figure represent organizations that formally offer one or more flexible work arrangements to any of their employees.Source: Workplace Flexibility in the 21st Century (SHRM, 2009)
51%While on the job
49%During the
recruitment or interview process
Workplace Flexibility in the 21st Century: Meeting the Needs of the Changing Workforce 21
HR professionals are often tasked with the initial design of benefits in their organizations. As this study reveals, the success of flexible work arrangements hinges on the partnership between management and employees. HR professionals are best positioned to set the tone of this partnership by approaching the design of FWAs as a strategic business tool for their organization rather than just a perk for the employees.
“I’m pleased to see the emphasis on employee commitment to making the program work—86% of respondents stated that employee commitment is very important,” remarks Jennifer Loftus. “Without employee buy-in and follow-through on program rules, the system will not work effectively and can result in decline in morale among those employees who do not take advantage of the program.”
As noted above, HR professionals reported that employees most often learn about their organization’s FWAs from their manager/supervisor, followed by HR staff. This highlights the need for organizations to involve line managers/supervisors at the beginning of the design of FWA programs. Line managers/supervisors are involved with their direct reports on a regular
basis. They are probably the first to learn of changes in employees’ personal lives that could potentially affect their work life. With the knowledge of their organization’s benefits and programs, line managers are able to produce desired organizational results by effectively managing projects and employees.
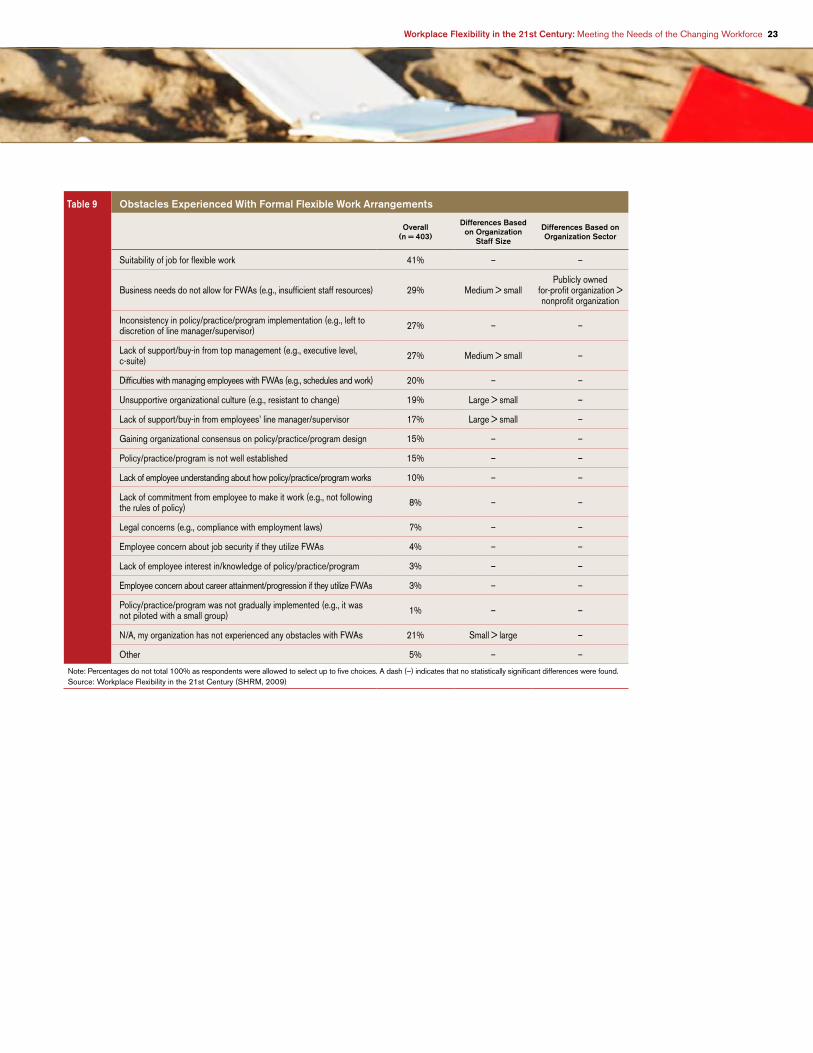
What Are the Obstacles to FWAs?
Twenty-one percent of companies with workplace flexibility reported no obstacles to their FWA programs, as shown in Table 9. The three most frequently reported obstacles were suitability of jobs for flexible work (41%), business needs that do not allow for FWAs (29%) and inconsistency in policy/practice/program implementation (27%). While some jobs, such as certain manufacturing and service-sector jobs, are not suitable for certain types of FWAs, most positions are. It is important for organizations to review their benefits on a regular basis to make sure they are still suited to their organizations’ needs and employee diversity. Communication is key to making sure that the organization’s FWA program is consistently implemented across the organization.
Table 8 Factors Important to the Success of Formal Flexible Work Arrangements
Not at all Important
Somewhat Unimportant
Somewhat Important Very Important
Support/buy-in from top management (e.g., executive level, C-suite) 0% 3% 10% 87%
Commitment from employee to make it work (e.g., following the rules of policy) 1% 1% 12% 86%
Suitability of job for flexible work 1% 3% 12% 84%
Business needs allow for FWAs (e.g., sufficient staff resources, demand for services 24/7) 1% 4% 13% 82%
Employee understanding of how policy/practice/program works 1% 2% 20% 78%
Support/buy-in from employee’s line manager/supervisor 2% 2% 19% 77%
Supportive organizational culture (e.g., openness to change) 1% 3% 31% 64%
Employee interest in/knowledge of policy/practice/program 1% 3% 34% 62%
Organizational consistency in policy/practice/program implementation (e.g., not left solely to discretion of line manager/supervisor) 2% 9% 34% 56%
Organizational consensus on policy/practice/program design 2% 10% 49% 38%
Gradual implementation of policy/practice/program (e.g., it was piloted with a small group) 17% 20% 35% 28%
(n = 299–306)Note: The data in this table represent organizations that formally offer one or more flexible work arrangements to any of their employees and rated the success of flexible work arrangements as “somewhat successful” or “very successful.”Source: Workplace Flexibility in the 21st Century (SHRM, 2009)
Employees most often learn about their organization’s FWAs from their manager/supervisor.
22 Workplace Flexibility in the 21st Century: Meeting the Needs of the Changing Workforce
Differences emerged among organization sector and staff size in the assessment of obstacles to FWAs. Publicly owned for-profit organizations (39%) were more likely than nonprofit organizations (18%) to report business needs as a constraint to FWAs. Publicly owned for-profit organizations may feel greater pressure from shareholders to remain competitive and therefore may be less willing to try out flexible work arrangements. Medium-staff-sized organizations (34%) were more likely than small-staff-sized organizations (21%) to cite business needs as a constraint to FWAs. Small organizations may be using FWAs as perks in recruiting because their compensation practices may not be as competitive as those of medium organizations.
What are ways that HR professionals can help their organization overcome some of these issues?
Understanding the diverse needs of your employ- x
ees; know your organization’s make-up. Are there more older workers than Generation Y employees? Understanding the diversity of their workforce will help companies design FWAs that resonate with employees.
Create FWAs that are relevant to employees’ and x
organization’s needs. For example, if your orga-nization finds that it is losing top employees who are new mothers, FWAs such as telecommuting, transitional part time, etc. may help lower recruit-ment costs.
Communicate programs/policy across the or- x
ganization. Once a policy or program has been
adopted, companies need to facilitate the imple-mentation of the program through all-staff meet-ings, newsletter, e-mails, etc.
Train line managers/supervisors. Buy-in from an x
employee’s line manager or supervisor was report-ed by 77% of HR professionals as a very important factor to the success of an organization’s FWAs. Training line managers will help them understand the goal and expectations of the FWA program. Training line managers will also help the organiza-tion ensure that FWAs are administered equitably.
Keep programs/policies updated as the needs of x
the organization and employees change. It is im-portant to review programs and benefits offered to employees, especially when there has been change internally or externally, to ensure that the program or benefit is still serving the organization and employees well.
Make sure that FWAs comply with FLSA, FMLA, x
OSHA and other applicable laws. HR profession-als help their organizations comply with federal and state labor laws. This could be in the form of how employees are categorized (exempt and nonexempt) and making sure that their FWA is not violating FLSA.
The three most frequently reported obstacles were suitability of jobs for flexible work (41%), business needs that do not allow for FWAs (29%)
and inconsistency in policy/practice/program implementation (27%).
Buy-in from an employee’s line manager or supervisor was reported by 77% of HR professionals as a very important factor to the success of an organization’s FWAs.
Workplace Flexibility in the 21st Century: Meeting the Needs of the Changing Workforce 23
Table 9 Obstacles Experienced With Formal Flexible Work Arrangements
Overall (n = 403)
Differences Based on Organization
Staff Size
Differences Based on Organization Sector
Suitability of job for flexible work 41% – –
Business needs do not allow for FWAs (e.g., insufficient staff resources) 29% Medium > smallPublicly owned
for-profit organization > nonprofit organization
Inconsistency in policy/practice/program implementation (e.g., left to discretion of line manager/supervisor) 27% – –
Lack of support/buy-in from top management (e.g., executive level, c-suite) 27% Medium > small –
Difficulties with managing employees with FWAs (e.g., schedules and work) 20% – –
Unsupportive organizational culture (e.g., resistant to change) 19% Large > small –
Lack of support/buy-in from employees’ line manager/supervisor 17% Large > small –
Gaining organizational consensus on policy/practice/program design 15% – –
Policy/practice/program is not well established 15% – –
Lack of employee understanding about how policy/practice/program works 10% – –
Lack of commitment from employee to make it work (e.g., not following the rules of policy) 8% – –
Legal concerns (e.g., compliance with employment laws) 7% – –
Employee concern about job security if they utilize FWAs 4% – –
Lack of employee interest in/knowledge of policy/practice/program 3% – –
Employee concern about career attainment/progression if they utilize FWAs 3% – –
Policy/practice/program was not gradually implemented (e.g., it was not piloted with a small group) 1% – –
N/A, my organization has not experienced any obstacles with FWAs 21% Small > large –
Other 5% – –
Note: Percentages do not total 100% as respondents were allowed to select up to five choices. A dash (–) indicates that no statistically significant differences were found.Source: Workplace Flexibility in the 21st Century (SHRM, 2009)
24 Workplace Flexibility in the 21st Century: Meeting the Needs of the Changing Workforce
Mini-Case Study: Workplace Flexibility—A Competitive Advantage Whether in times of prosperity or in a tight economy, organizations with workplace flexibility in their employer brand are attractive to many, particularly to the younger generations—Generation X and Y. SHRM’s 2008 Workplace Forecast highlights that the increased demand for work/life balance—a demographic and social trend—is likely to have a major strategic impact on the workplace. The following mini-case study portrays a medium-sized Midwestern organization that implemented a workplace flexibility initiative. This action was part of a broad corporate initiative to transform the company culture from an environment of rigid rules to a workplace of positive employee morale, engagement and productivity.
SituationFounded in the early 1980s, this insurance company was grounded in a strong hierarchical culture, where long-term tenure was the expectation and workplace policies, such as work hours, were inflexible. In the past three months, the company had been going through a change management
initiative, with the goals to be more competitive in the insurance sector and become an employer of choice in the community. Historically, turnover had been stable and low. However, over the past three years, turnover rate had gradually increased from 5% to 11%. Further, companies in the community were competing for local talent. HR decided to include employee retention as an important element under the umbrella of the company’s culture change initiative.
ActionOver a two-day period, the HR department met to address the increasing turnover. The goal was to understand the root causes of the turnover and brainstorm actions to strategically improve retention. With the support of a facilitator, HR professionals began by focusing on the corporate culture and factors contributing to organizational success and identifying those that can be detrimental. Workplace inflexibility was found to be a key reason for turnover, as observed by younger members of the team. The meeting resulted in a three-step action plan: 1) network with HR professionals from other industries for organizational success stories of
HR Perspective
Workplace Flexibility in the 21st Century: Meeting the Needs of the Changing Workforce 25
flexible workplace arrangements and the resulting impact on retention, 2) survey the workforce to learn the needs for work/life balance and what programs would be of interest, and 3) develop workplace flexibility programs that would support both the organizational goals and the needs of employees.
The HR department met three weeks later to dis-cuss the findings and create a plan to move forward. Based on the results of internal and external surveys, the group developed a workplace flexibility plan with two parts: telecommuting (one to two days a week) and flextime with core business hours—with mana-gerial approval for each employee request. Since most positions at the insurance company involved computer work, many employees could work off-site, and thus telecommuting was a viable option as a flexible work arrangement. To gain buy-in from management, known to be conservative, the HR director discussed the reasons for adding workplace flexibility arrangements and the anticipated benefits. The management team agreed, understanding that proactive change was essential for the organization to grow and be sustainable in today’s competitive marketplace.
The workplace flexibility initiative was developed based on the company’s newly established core values, as well as the intention to provide employ-ees with more autonomy in their jobs and work/life balance, two key factors identified in the internal employee survey:
1. Respect all employees.2. Foster open communication.3. Treat employees as if each has excellent ideas.4. Expect high-quality work at all times.5. Provide a learning environment for personal and
professional fulfillment.6. Acknowledge and reward employees for
accomplishments.
Formal written policies were established for the workplace flexibility programs, with guidelines for both managers and employees. In addition, a com-
munication structure was put in place to improve overall communication between employees and man-agement: 1) weekly follow-up e-mails with managers on projects and goals; 2) bi-weekly conference calls with project teams; 3) face-to-face monthly employ-ee/manager meetings; and 4) monthly departmental meetings.
ResultsOver the next year, the HR department carefully tracked the turnover rate. After six months, the turnover rate decreased from 11% to 9%, and another six months later, turnover was at 7%. Additionally, the new communication structures were well-received. Employee morale and productivity improved, as reflected in a 15% increase in the number of new clients and a 20% increase in employee referrals of job candidates. To gather additional employee feed-back, HR will establish an annual employee survey and consider further changes to improve the work-place environment. Depending on the success of the program, the number of telecommuting days may be increased and other options added for reduced hours or part-time work. With continuing positive results in the next year, the company plans to apply for a com-munity award as an “employer of choice.”
This mini-case study illustrates a successful workplace flexibility initiative. The HR department identified a key cause of the increasing turnover, learned about workplace flexibility successes in other organizations, considered workplace flexibility options based on feedback from employees, gained management buy-in for workplace flexibility arrange-ments, and then took a calculated risk by establish-ing new policies that employees wanted. To support the success of these new programs, guidelines were provided within formal policies and a new organiza-tional communication structure was developed. The key to the success of this initiative was the willing-ness of HR to acknowledge the issue, find solutions and trust managers and employees to be respon-sible and make these policies effective, manageable and engaging.
26 Workplace Flexibility in the 21st Century: Meeting the Needs of the Changing Workforce
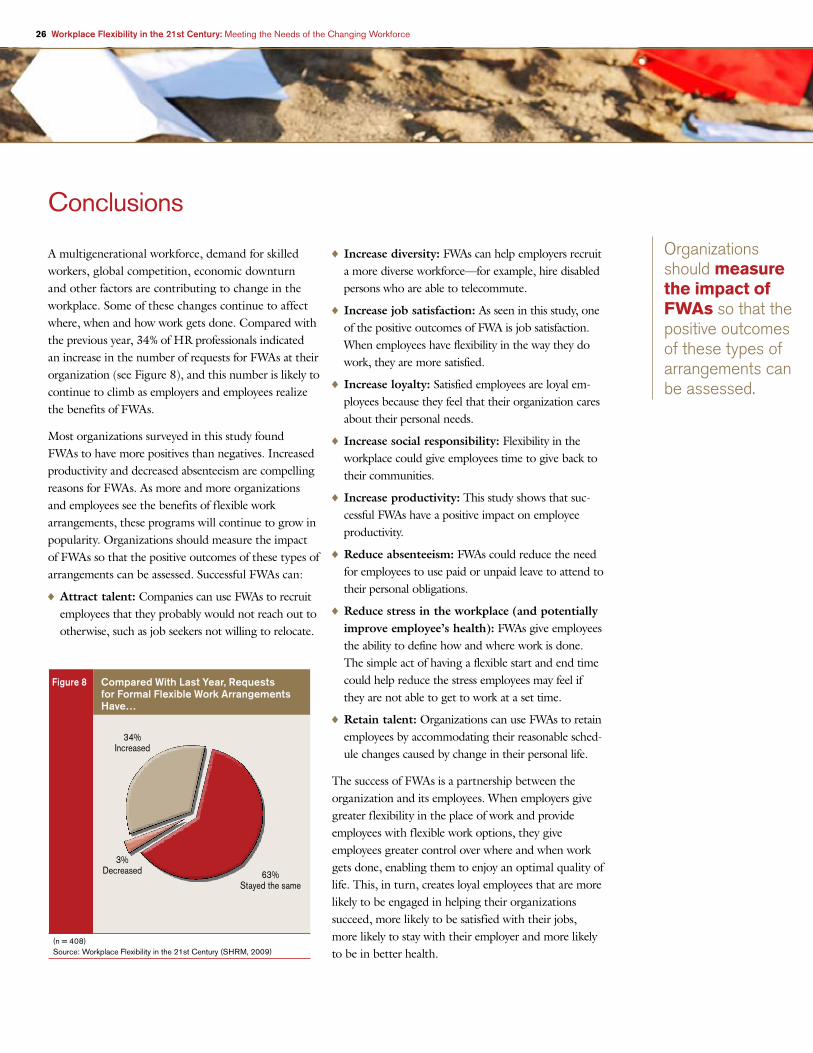
A multigenerational workforce, demand for skilled workers, global competition, economic downturn and other factors are contributing to change in the workplace. Some of these changes continue to affect where, when and how work gets done. Compared with the previous year, 34% of HR professionals indicated an increase in the number of requests for FWAs at their organization (see Figure 8), and this number is likely to continue to climb as employers and employees realize the benefits of FWAs.
Most organizations surveyed in this study found FWAs to have more positives than negatives. Increased productivity and decreased absenteeism are compelling reasons for FWAs. As more and more organizations and employees see the benefits of flexible work arrangements, these programs will continue to grow in popularity. Organizations should measure the impact of FWAs so that the positive outcomes of these types of arrangements can be assessed. Successful FWAs can:
Attract talent: x Companies can use FWAs to recruit employees that they probably would not reach out to otherwise, such as job seekers not willing to relocate.
Increase diversity: x FWAs can help employers recruit a more diverse workforce—for example, hire disabled persons who are able to telecommute.
Increase job satisfaction: x As seen in this study, one of the positive outcomes of FWA is job satisfaction. When employees have flexibility in the way they do work, they are more satisfied.
Increase loyalty: x Satisfied employees are loyal em-ployees because they feel that their organization cares about their personal needs.
Increase social responsibility: x Flexibility in the workplace could give employees time to give back to their communities.
Increase productivity: x This study shows that suc-cessful FWAs have a positive impact on employee productivity.
Reduce absenteeism: x FWAs could reduce the need for employees to use paid or unpaid leave to attend to their personal obligations.
Reduce stress in the workplace (and potentially x
improve employee’s health): FWAs give employees the ability to define how and where work is done. The simple act of having a flexible start and end time could help reduce the stress employees may feel if they are not able to get to work at a set time.
Retain talent: x Organizations can use FWAs to retain employees by accommodating their reasonable sched-ule changes caused by change in their personal life.
The success of FWAs is a partnership between the organization and its employees. When employers give greater flexibility in the place of work and provide employees with flexible work options, they give employees greater control over where and when work gets done, enabling them to enjoy an optimal quality of life. This, in turn, creates loyal employees that are more likely to be engaged in helping their organizations succeed, more likely to be satisfied with their jobs, more likely to stay with their employer and more likely to be in better health.
Figure 8 Compared With Last Year, Requests for Formal Flexible Work Arrangements Have…
(n = 408) Source: Workplace Flexibility in the 21st Century (SHRM, 2009)
63%Stayed the same
34%Increased
3%Decreased
Organizations should measure the impact of FWAs so that the positive outcomes of these types of arrangements can be assessed.
Conclusions
Workplace Flexibility in the 21st Century: Meeting the Needs of the Changing Workforce 27
“Time is indeed the new currency,” remarked Jill Evans-Silman, of Meador Staffing Services. “The demands on each of the generations represented in today’s workforce are such that we are all in need of time we didn’t have before. Organizations
that recognize the value of using flexible work arrangements to give back time to their employees—on a schedule that benefits both the employee and the employer—will be the organizations to win in the new economy.”
FWAs could reduce the need for employees to use paid or unpaid leave to attend to their personal obligations.
“Organizations that recognize the value of using flexible work arrangements to give back time to their employees—on a schedule that benefits both the employee and the employer—will be the organizations to win in the new economy.”
Jill Evans-Silman, SPHR, Meador Staffing Services
28 Workplace Flexibility in the 21st Century: Meeting the Needs of the Changing Workforce
A sample of HR professionals was randomly selected from SHRM’s membership database, which included approximately 250,000 individual members at the time the survey was conducted. Only members who had not participated in a SHRM survey or poll in the last three months and whose job function area was compensation, benefits or generalist were included in the sampling frame. Members who were students, located internationally or had no e-mail address on file were excluded from the sampling frame. In November 2008, an e-mail that included a hyperlink to the SHRM 2008 Workplace Flexibility Survey11 was sent to 3,000 randomly selected SHRM members. Of these, 2,686 e-mails were successfully delivered and 511 HR professionals responded, yielding a response rate of 19%. The survey was accessible for a period of three weeks, and three e-mail reminders and a fax reminder were sent to nonrespondents in an effort to increase the response rate.
The sample of HR professionals was generally representative of the SHRM membership population, although there were some differences by industry and staff size of respondents’ organizations.12
Notations
Analysis: In some cases, the data are not depicted in corresponding tables/figures even though the results are statistically significant. Analyses by HR professionals’ organizations’ industry, staff size, sector, region and operations location are presented and discussed where applicable.
Industry categories: only industries that had 20 or x
more respondents were included in industry anal-yses. Although respondents from other industries participated in the study, analysis from industries with fewer than 20 respondents sometimes yields inconclusive or questionable results.
Organization staff size categories: small (1 to 99 x
employees), medium (100 to 499 employees) and large (500 or more employees). The analysis by
staff size refers to the number of part-time and full-time employees at the HR professional’s work location only.
Organization sector: publicly owned for-profit x
organization, privately owned for-profit organiza-tion, nonprofit organization, government sector and “other” categories. Results are not presented for other employment sectors due to the small number of organizations in this category.
Organization region: the U.S. Census Bureau x
recognizes four census regions within the United States, and these regions are groupings of the 50 states.
Organization operation location: U.S.-based x
operations only and multinational.
Differences: Conventional statistical methods were used to determine if observed differences were statistically significant (i.e., there is a small likelihood that the differences occurred by chance). Therefore, in most cases, only results that were significant are included, unless otherwise noted. It is also important to note that in some cases, data may be discussed in the text of this report but not presented in an accompanying figure or table.
Tables: Unless otherwise noted in a specific table, please note that the following are applicable to data depicted in tables throughout this report.
Data are sorted in descending order by “overall” x
column in a table.
Percentages for a question or a response option x
may not total 100% due to rounding.
Tables include only response options for which x
there were significant differences.
For tables by organization staff size, the sample x
size is based on the actual number of respondents by organization staff size who answered the ques-tion using the response options provided.
Methodology

Workplace Flexibility in the 21st Century: Meeting the Needs of the Changing Workforce 29
For tables by organization sector, the sample size x
is based on the actual number of respondents by organization sector who answered the question using the response options provided.
Figures: Unless otherwise noted in a specific figure, please note that the following is applicable to data depicted in figures throughout the report.
Percentages for a question may not total 100% x
due to rounding.
Generalization of results: As with any research, readers should exercise caution when generalizing results and take individual circumstances and experiences into consideration when making decisions based on these data. While SHRM is confident in its research, it is prudent to understand that the results presented in this survey report are only truly representative of the sample of HR professionals responding to the survey.
Number of respondents: The number of respondents (indicated by “n” in figures and tables) varies from table to table and figure to figure because some respondents did not answer all of the
questions. Individuals may not have responded to a question on the survey because the question or some of its parts were not applicable or because the requested data were unavailable. This also accounts for the varying number of responses within each table or figure.
Confidence level and margin of error: A confidence level and margin of error give readers some measure of how much they can rely on survey responses to represent all SHRM members. Given the level of response to the survey, SHRM Research is 96% confident that responses given by responding HR professionals can be applied to all SHRM members, in general, with a margin of error of approximately 4%. For example, 47% of the responding HR professionals reported that their organizations formally offer part-time/reduced-hours schedules. With a 4% margin of error, the reader can be 96% certain that between 43% and 51% of SHRM members work for organizations that formally offer part-time/reduced-hours schedules. It is important to know that as the sample size decreases, the margin of error increases.
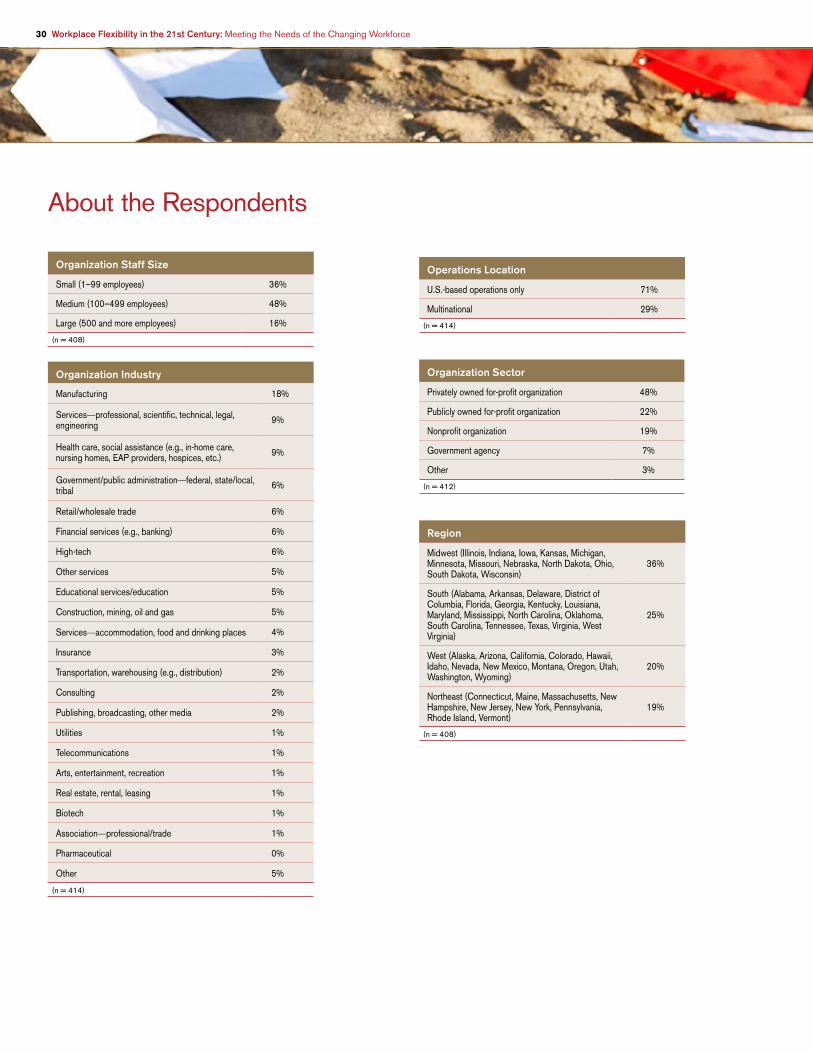
30 Workplace Flexibility in the 21st Century: Meeting the Needs of the Changing Workforce
Organization Staff Size
Small (1–99 employees) 36%
Medium (100–499 employees) 48%
Large (500 and more employees) 16%
(n = 408)
Organization Industry
Manufacturing 18%
Services—professional, scientific, technical, legal, engineering 9%
Health care, social assistance (e.g., in-home care, nursing homes, EAP providers, hospices, etc.) 9%
Government/public administration—federal, state/local, tribal 6%
Retail/wholesale trade 6%
Financial services (e.g., banking) 6%
High-tech 6%
Other services 5%
Educational services/education 5%
Construction, mining, oil and gas 5%
Services—accommodation, food and drinking places 4%
Insurance 3%
Transportation, warehousing (e.g., distribution) 2%
Consulting 2%
Publishing, broadcasting, other media 2%
Utilities 1%
Telecommunications 1%
Arts, entertainment, recreation 1%
Real estate, rental, leasing 1%
Biotech 1%
Association—professional/trade 1%
Pharmaceutical 0%
Other 5%
(n = 414)
Operations Location
U.S.-based operations only 71%
Multinational 29%
(n = 414)
Organization Sector
Privately owned for-profit organization 48%
Publicly owned for-profit organization 22%
Nonprofit organization 19%
Government agency 7%
Other 3%
(n = 412)
Region
Midwest (Illinois, Indiana, Iowa, Kansas, Michigan, Minnesota, Missouri, Nebraska, North Dakota, Ohio, South Dakota, Wisconsin)
36%
South (Alabama, Arkansas, Delaware, District of Columbia, Florida, Georgia, Kentucky, Louisiana, Maryland, Mississippi, North Carolina, Oklahoma, South Carolina, Tennessee, Texas, Virginia, West Virginia)
25%
West (Alaska, Arizona, California, Colorado, Hawaii, Idaho, Nevada, New Mexico, Montana, Oregon, Utah, Washington, Wyoming)
20%
Northeast (Connecticut, Maine, Massachusetts, New Hampshire, New Jersey, New York, Pennsylvania, Rhode Island, Vermont)
19%
(n = 408)
About the Respondents
Workplace Flexibility in the 21st Century: Meeting the Needs of the Changing Workforce 31
Endnotes Recently Published SHRM Survey Products
1 Society for Human Resource Management. (2008, September). SHRM poll: Assistance organizations offered to help employees deal with high gas prices. Retrieved from www.shrm.org.
2 Society for Human Resource Management. (2008, June). Workplace forecast. Alexandria, VA: Author.
3 Society for Human Resource Management. (2006, December). U.S. job retention poll findings. Retrieved from www.shrm.org.
4 Bureau of Labor Statistics. (2007). Visual essay: Labor force status of families. Retrieved May 13, 2009, from www.bls.gov/opub/mlr/2007/07 /ressum.pdf.
5 Society for Human Resource Management. (2009, June). 2009 employee benefits: A survey report by SHRM. Alexandria, VA: Author.
6 Society for Human Resource Management. (2009, June). 2009 employee job satisfaction: A survey report by SHRM. Alexandria, VA: Author.
7 Ibid.
8 Society for Human Resource Management. (2009, January). SHRM poll: Pressure to work—employees’ perspective. Retrieved from www.shrm.org.
9 Data are not depicted in a table/figure.
10 Data are not depicted in a table/figure.
11 This survey instrument is available upon request by contacting the SHRM Survey Program at [email protected] or by phone at 703-535-6301.
12 Compared with the general SHRM membership, more HR professionals in the sample were from medium-staff-sized organizations and fewer from large-staff-sized organization. HR professionals in this sample were more likely to be from the manufacturing and services (profit) industries.
Benefits
2009 Employee Benefits (June 2009)
Examining Paid Leave in the Workplace: Helping Your Organization Attract and Retain Talented Employees (April 2009)
2008 Cost of Health Care Benchmarking Study: Executive Summary (September 2008)
2008 Employee Benefits (June 2008)
FMLA and Its Impact on Organizations (July 2007)
SHRM Survey Brief: Backup Care (May 2007)
SHRM Survey Brief: FMLA (May 2007)
Business Leadership
Survey Brief: The Impact of the U.S. and Global Economic Decline on Businesses (April 2009)
Leading Now, Leading the Future: What Senior HR Leaders Need to Know—Executive Summary (February 2009)
SHRM Survey Brief: Key Priorities for the HR Profession Through 2015 (December 2008)
SHRM Survey Brief: Human Resource Outsourcing: Is It Here to Stay? (December 2008)
Creating People Advantage—How to Address HR Challenges Worldwide Through 2015 (May 2008)
HR’s Evolving Role in Organizations and Its Impact on Business Strategy (May 2008)
2008 Managing Your HR Career Survey Report (February 2008)
SHRM Human Capital Benchmarking Study: 2008 Executive Summary (June 2008)
32 Workplace Flexibility in the 21st Century: Meeting the Needs of the Changing Workforce
Compensation
2006 HR Practices in Executive-Level Compensation Survey Report (May 2006)
Diversity
2008 Religion and Corporate Culture (October 2008)
The 2007 State of the Workplace Diversity Management (February 2008)
2006 Workplace Diversity and Changes to the EEO-1 Process Survey Report (October 2006)
Employee Relations
2009 Job Satisfaction (June 2009)
Point of View: The Economic Downturn from the Employee Perspective (April 2009)
2008 Job Satisfaction (June 2008)
2007 Job Satisfaction (June 2007)
Ethics and Sustainability
2007 Corporate Social Responsibility Pilot Study (April 2007)
The Ethics Landscape in American Business Survey Report (June 2008)
SHRM Survey Brief: Green Workplace (January 2008)
Global HR
Global Talent Sourcing in the United States and Canada (March 2008)
2006-2007 Employee Retention in China Survey Report (October 2007)
Organizational and Employee Development
What Senior HR Leaders Need to Know (February 2009)
Critical Skills Needs and Resources for the Changing Workforce Survey Report (2008)
2007 Change Management Survey Report (April 2007)
Safety and Security
2006 Weapons in the Workplace Survey Report (November 2006)
Staffing Management
SHRM and CCHRA 2008 Global Talent Sourcing in the United States and Canada (March 2008)
2007 Advances in E-Recruiting Leveraging the .Jobs Domain (June 2007)
Are They Really Ready to Work? (October 2006)
Recently Published SHRM Survey Products (continued)
To access these reports and view a complete listing of SHRM survey products, please visit www.shrm.org/surveys.
Project Team
Project leader: Justina Victor, survey research analyst
Project contributors: Evren Esen, manager, SHRM Survey Research Center
Steve Williams, Ph.D., SPHR, director, SHRM Research
Nancy R. Lockwood, M.A., SPHR, GPHR, manager, HR Content Program
External contributors: SHRM Total Rewards/Compensation and Benefits Special Expertise Panel:
Therese Allender CCP, GPHR
Rajiv Burman, GPHR, SPHR, CCP, CEB
Jennifer C. Loftus CCP, CBP, GRP, SPHR
Timothy McKeown MBA, SPHR
Michael A. Murphy SPHR
Robin Spivak SPHR
SHRM Organizational Development Special Expertise Panel:
Carol Cooley
SHRM Staffing Management Special Expertise Panel:
Jill Evans-Silman, SPHR
Anne Nimke
SHRM Employee Relations Special Expertise Panel:
Chana Anderson, CCP, SPHR
Editing: Katya Scanlan, copy editor
Design: Blair Wright, senior graphic designer
Production: Bonnie Claggett, production traffic coordinator
This report is published by the Society for Human Resource Management (SHRM). All content is for informational purposes only and is not to be construed as a guaranteed outcome. The Society for Human Resource Management cannot accept responsibility for any errors or omissions or any liability resulting from the use or misuse of any such information.
© August 2009 Society for Human Resource Management. All rights reserved.
This publication may not be reproduced, stored in a retrieval system or transmitted in whole or in part, in any form or by any means, electronic, mechanical, photocopying, recording or otherwise, without the prior written permission of the Society for Human Resource Management.
SHRM members can download this research report and many others free of charge at www.shrm.org/surveys. If you are not a SHRM member and would like to become one, please visit www.shrm.org /application.
09-0464


