Page 1
International Journal of Asian Social Science, 2013, 3(5):1208-1226
1208
A SUSTAINABILITY ASSESMENT OF NIGERIAN TRANSPORT POLICY
Paul C. Ugboaja
Department of Transport Management Technology, Federal University of Technology, Nigeria
ABSTRACT
This paper aims at accessing the effectiveness of the Nigeria’s National Transport Policy (NTP) in
enhancing Social Sustainability in Nigeria and offer guidance to Policy makers on the effective
ways to make progress towards a sustainable Transportation in Nigeria. This paper offers an
analytical evaluation of the Policy, using both Primary and Secondary data. To do this, the Survey
research method was adopted for the Study and questionnaires were used as data collection
Instrument. A random of 127 or 68.28% Transport companies were selected for the study out of the
population of 186 registered Luxury Buses and shipping companies in Nigeria in 2009. For
completeness, a sample of 400 non Transport workers was included in the study. Therefore , a total
of 1670 questionnaires were administered to the respondents , out of which 1452 questionnaire s
were completed given a response rate of 86.95%. The data analyses revealed that overall mean
score was 2.22 which was lower than the expected value of 3.00 on a five point likert scale. The
Test of the hypothesis also indicated that the Z – calculated and the Z – tabulated were 10.6094
and 1.9600 respectively. Thus the null hypothesis was rejected at 5% level of Significance since the
Z- calculated is greater than Z- tabulated. Therefore, it was concluded that the extent to which the
Transport Policy enhances Social Sustainability in Nigeria was below the average. This implies
that the policy had little or no influence in reducing the negative social impact emanating from
Nigeria’s Transport system. In this light, it is recommended so that the policy should be modified
so as to make it capable of increasing the salience of the Policy for implementing Organizations.
Keywords: Nigeria, Policy, Social, Sustainability, Transport
INTRODUCTION
Transportation is about mobility of people, goods and services. World demand for transport
services is growing at alarming rate. For example, global demand for passenger transport service is
predicted to grow from 26 trillion passenger kilometers in 1990 to 103 trillion passenger kilometers
in 2050 on average (Schafer and Victor, 1997; USA DOT, 1999) Unfortunately, the rapid growth in
transport demand strains the transport capacity unit as a result of inadequate expansion in transport
International Journal of Asian Social Science
journal homepage: http://www.aessweb.com/journal-detail.php?id=5007
Page 2
International Journal of Asian Social Science, 2013, 3(5):1208-1226
1209
physical infrastructure. Consequently, this situation poses capacity crisis, which generates increase
in congestion, pollution and safety problems in the system. Expansion of the infrastructure such as
building new roads has only a limited role to play in solving the problems (O’Flaherty, 1997).
However, what is required to meet the anticipated demand is innovative solution (FTAG, 2001).
This means solution that will promote sustainable development; which is defined as development
that meets the needs of the present without compromising the ability of feature generations to meet
their own needs (Brundtland, 1987). It is in transport terms, as May (1997) puts it; “a strategy
which achieves improvements in inefficiency and accessibility without degrading the environment
or increasing the accident toll is clearly more sustainable.” Going by this definition sustainable
transport strategies include:
Economic efficiency in the use of transport resources Accessibility within and outside the city,
which is defined as case of reaching transport facilities and an enhanced environment including
land use and safety.
The Definition of the Problem
Transport Systems provide mobility, access and other benefits such as facilitating the productivity
of the other sectors of the economy. At the same time transport contributes to several major
environmental pressure including atmospheric pollution, traffic accidents and congestion,
resources depletion, waste accumulation and disruption of nature and cities. In a similar vein,
population growth, increased economic activity and growing incomes combine to generate higher
demand for transport service which has some negative implication for development. These impacts
are economic, social and environmental issues which pose constrains to sustainable transport
system. Following the growth in transport demand and consequent negative effects; sustainable
transport policy has been adopted in many parts of the world, in order to deal effectively with the
threats and simultaneously provide optimal mobility and access. Along the same lines, the Federal
Government of Nigeria (FGN) in 1993 introduced National Transport Policy (NTP), aimed at
achieving sustainability in the transport system. Although the NTP ought to guide decision-making
in transport industry, it is observed that the policy has little influence. Despite the policy, for
instance, Nigeria’s transport infrastructural facilities are deteriorating at a rate N800 billion naira
or 5.41 percent per annum and quality of service is falling.
Going by the analysis, it is apparent that, inspite of the Federal Government of Nigeria (FGN),
huge expenditure in the transport sub-sector of the economy and the introduction of elaborate
National Transport Policy coupled with the formulation of strategies for implementing the policy
in 1993 and 2002 respectively aimed at promoting viable sustainable transportation, the system
appears sluggish and unsustainable.
Obviously, in the light of the foregoing, there is need to evaluate the National Transport policy
(NTP) to determine the extent to which the policy has achieved its stipulated objectives.
Page 3
International Journal of Asian Social Science, 2013, 3(5):1208-1226
1210
The NTP stipulated objectives are to achieve sustainability in the three pillars of sustainable
transport. According to World Bank (World Resources Institute, 2004) the three pillars of
sustainable transport are:
_ Economic and financial sustainability
_ Social sustainability and
_ Environmental sustainability.
Economic and Financial Sustainability
This is concerned with economically and financially sustainable transport cost- effective and
continuously responsive to change demands
Environmental Sustainability
This assumes that transport has significant effects on the environment and these effects should be
addressed explicitly in the design of programmes and the systems in general. This entails making
better use of reliability and cost, cost effective technology but not in itself sufficient. Thus, more
strategic action is also required in form of better-directed planning of land use and stricter
management of demand, the use of pollution and congestion changes to correct the relative prices
of private and public transport.
Social Sustainability
This is concerned with equity. It seeks transport strategies that provide the poor with better
physical services. In addition, consumer satisfaction is ingredient in creating a social sustainable
transport system.
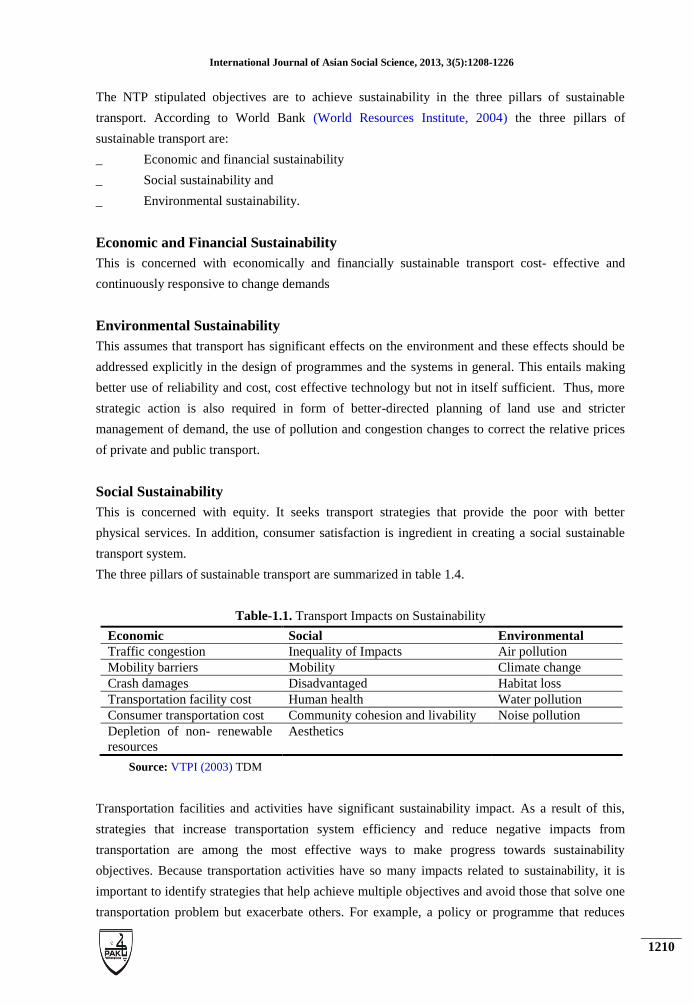
The three pillars of sustainable transport are summarized in table 1.4.
Table-1.1. Transport Impacts on Sustainability
Economic Social Environmental
Traffic congestion Inequality of Impacts Air pollution
Mobility barriers Mobility Climate change
Crash damages Disadvantaged Habitat loss
Transportation facility cost Human health Water pollution
Consumer transportation cost Community cohesion and livability Noise pollution
Depletion of non- renewable
resources
Aesthetics
Source: VTPI (2003) TDM
Transportation facilities and activities have significant sustainability impact. As a result of this,
strategies that increase transportation system efficiency and reduce negative impacts from
transportation are among the most effective ways to make progress towards sustainability
objectives. Because transportation activities have so many impacts related to sustainability, it is
important to identify strategies that help achieve multiple objectives and avoid those that solve one
transportation problem but exacerbate others. For example, a policy or programme that reduces
Page 4
International Journal of Asian Social Science, 2013, 3(5):1208-1226
1211
traffic congestions but increases crashes and consumer costs is not necessarily a sustainable
strategy. The most sustainable strategies are those that simultaneously help reduce traffic
congestion, pollution, crashes and consumer costs, increase mobility options for non-drivers, and
encourages more efficient land use patterns, or at least avoid contradicting these objectives.
The Purpose of the Study
The objective of the study is to determine the effectiveness of the National Transport policy (NTP),
in achieving sustainable transport system in Nigeria. Owing to time and space constraints only one
aspect of sustainability is accessed; that is social sustainability. Moreover, study has indicated that
social sustainability is the most unsustainable aspect of Nigeria’s transport system Ugboaja (2007),
hence the choice of social sustainability of the National Transport Policy (NTP) for the study.
Thus, the objective of this paper is to assess the extent to which National Transport Policy (NTP)
enhances social sustainability in Nigeria.
Research Question
In other to be guided in our investigation of the problem we sought answers to the general question
stated below. To what extent does the National Transport Policy (NTP) enhance social
sustainability in Nigeria?
Hypothesis for the Study
In order to concentrate attention on the objective of the paper both null and alternative hypothesis is
formulated:
Ho: There is no significant difference in the perception of transport workers and non -
transport workers on the extent to which the National Transport Policy (NTP) enhances social
sustainability in Nigeria.
H1: There is significant difference in the perception of transport workers and non-transport
workers on the extent to which the National Transport Policy (NTP) enhances social sustainability
in Nigeria.
Significance of the Study
It is important that this work be done because the findings and results of the study will be useful to
the transport industry and the general public in addition to serving as a useful contribution to
knowledge.
LITERATURE REVIEW
The industry is generally regarded as an engine of development as a result of its crucial role in
linking all the segments of the economy into one main stream. For example, it is useful in the
movement of people, goods and services within the economy. The transport industry makes
significant contribution towards the growth of Nigeria’s economy. For instance, in 1996, there were
Page 5
International Journal of Asian Social Science, 2013, 3(5):1208-1226
1212
a total of 1153 registered transport firms in Nigeria or 2 percent, of 58, 665 registered
establishments. The Nigeria’s transport industry employed 26,514 workers or 3 percent of 997, 381
workers engaged in all establishments. This analysis is presented in table 2.1
Table-2.1. Distribution of Establishments by the activity Group and Number of workers Engaged
in 1996
Active group Total No of
Establishments
by Activity
Group
% of Total
Establishments
by Activity
Group
Total No of
workers
engaged
% of total
workers
Engaged
Transport 1153 2.00 26514 3.00
Other
Establishments
57512 98.00 970867 96.00
Total 58665 100 997381 100
Source: FOS (1999).
In the transportation industry, ownership is mostly dominated by sole proprietors. For instance, in
1996, there were 596 sole proprietors or 52.00 percent of 1153 establishments in the industry. The
cooperative establishments were the smallest group of ownership, with only 11 establishments or
1.00 percent of 1153. The distribution of ownership in the transport industry is shown in table 2.2
Table-2.2. Distribution of Establishments by Type of Ownership in 1996
Activity Group Total No of
Establishments
Transport
Establishments
Transport % of
Activity Group
Total No of
Workers
Engaged in
each Group
Sole Proprietor
Partnership
Pubic Limited Private Limited
Cooperative
Statutory
Total
40178
4428
3578
8341
697
935
58665
596
95
77
282
11
78
1153
1.48
2.15
2.15
3.38
1.58
8.34
371708
67986
205607
244806
19438
68158
997381
Source: FOS (1999).
Further analysis of the economy also indicates that the 1994 aggregate output measured by the
Gross Domestic Product (GDP) at 1984 constant factor cost stood at N100.98 billion naira and
showed an increase of 1.32 percent, with average growth rate of 2.82 percent between 1990 and
1994. The transport sub-sector contributed to the increase by accounting for N3.24 billion naira or
3.21 percent of the GDP in 1994, with average growth rate of 3.27 percent between 1990 and 1994
(FOS, 1999; Ugboaja, 2002). Apparently, most nations of the World have adopted sustainable
transport mobility as the principal objective of transportation policy Gudmundsson and Hojer
(1996) including Nigeria (Maduekwe, 2002). This is because it has been observed that transport
sector makes significant contributions towards the Gross Domestic Product (GDP) of the countries
and it serves increasingly as a prerequisite to maintaining and developing the productivity of other
Page 6
International Journal of Asian Social Science, 2013, 3(5):1208-1226
1213
sectors of the economy. For example, in European Community (EC) countries, transport sector
contributes 7-8 percent of the GDP Gudmundsson and Hojer (1996) and in Nigeria it was about 3
percent between 1994 and 1998 (FOS, 1999), while in United States of America (USA) transport
accounts for more than 11 percent of GDP (FTAG, 2001). Transport sub-sector contribution
towards the Gross Domestic Product at current factors cost in Nigeria between 1994 and 1998 is
also shown in table 1.3. Analysis of the table shows that Road, Rail, Ocean and Air modes
contributed 2.5, 0.00001, 0.02, and 0.04 percent to GDP between 1994 and 1998 respectively.
Table-2.3. Transport share of Gross Domestic Product (GDP) at current factor cost between 1994
and 1998 in N million.
Modes
GDP
1994 1995 1996 1997 1998 Total
GDP
Average
total
GDP
% of
total
GDP
GDP (all
sectors)
911068 1960686 2740458 2834999 2721511 11168722 2233744 100
GDP
(transport
sector)
30948 48025 62138
138
71466 79731 292308 58462 2.62
a. Road 29827 46687 60622 69676 77831 284643 56929 2.5
b. Rail 3 2 3 4 4 16 3 0.00001
c. Ocean 435 502 569 642 671 2819 564 0.02
d. Air 684 833 944 1144 1225 4830 966 0.04
% of
transport
to GDP
3.4 2.45 2.27 2.52 2.93 13.57 2.71
Source: Federal Office of Statistics (FOS) (1999)
The Nigerian Federal Government, in recognition of these roles, which the transport sub-sector
plays in national development, devoted a substantial amount of money to the sub-sector. Between
1990 and 1994 the transport and allied sub-sector accounted for 3.00 percent of the total approved
budget or 1112 million naira on average (World Bank, 1996). In spite of the Federal Government’s
huge expenditure on transport sub-sector, the transport infrastructural facilities are deteriorating
and quality of services is falling. For example, the road condition and fleets, rail services, air
services and water transport are all declining (World Bank, 1996).
In 1995, for example, the nation’s road network has an asset with nominal value of N1, 850 billion
naira. As a result of systematic deterioration of the network, the asset is depreciating at the rate of
N800 billion naira or 5.41 percent per annum. The rehabilitation of the asset was estimated to cost
N20 billion naira as at 1995 (Adeniji, 2000). The deterioration of the facilities has contributed to
lack of efficiency of the transport system, which has been swift and devastating on the economy.
The inefficiency of the transport system has inhibited the flow of local products to domestic and
international markets, increased final costs and consequently reduced the competitiveness of
Nigerian non-oil exports. In the same vein, high transport costs also increased the cost of input such
as fertilizer and pesticides. Lastly, public safety has also been put at risk particularly in the case of
Page 7
International Journal of Asian Social Science, 2013, 3(5):1208-1226
1214
road transport (World Bank, 1996). Besides the development of the highway system, the Nigeria
Federal Government in 1993 introduced elaborate transport policy objectives that emphasize
integrated multi-model transportation development system. The transport policy contains
essentially two major thrusts.
Accordingly, the Federal Ministry of Transport maintains that the major policy thrusts are:
Assuring that transport service is adequate to meet the social and economic needs of the
country and to provide an instrument for national development polices and
Assuring that the most efficient use of resources within the transport sector and sustained
improvements of the sector’s productivity (FMT, 1993).
In effect, the two major thrusts of the National Transport Policy (NTP) gave rise to two main
transport policy objectives in Nigeria. The objectives are:
_ Adequate transport service and
_ Efficient use of transport resources.
The national transport policy (NTP) objective of providing adequate transport service is the same
with promoting accessibility in transport system. In the other hand, the NTP objective of efficient
utilization of transport resource refers to economic efficiency in the use of transport resources;
hence the aim of NTP is to achieve sustainable transport system in Nigeria. These transport terms:-
accessibility; economic efficiency and safety are appropriate elements of sustainable Transport
(May, 1997). The National transport policy objectives ought to guide decisions in transport
industry but surprisingly it is observed that the policy has little influence in the system.
In this regard, World Bank laments:
“The National transport policy (NTP) proposed by the Federal Ministry of
Transport formerly the FMTA was ratified by the national council on
transport in July 1991 and became the official transport policy of Nigeria.
The general objectives of the transport policy are; adequacy; economic and
financial efficiency; safety; reliable and national self-reliance. There are
very few measurable police goals and deadlines despite the detailed analysis
and recommendations contained in the document. Accordingly, the NTP has
had little influence on the government’s actions (World Bank, 1996)”.
Following the inability of the National Transport Policy objectives to achieve sustainable
Transport system in Nigeria the then Federal Minister of Transport Chief Ojo Maduekwe at both
the 5th
meeting of the National Council on Transport and ministerial Press briefing in 2000 and
2002 respectively advocated policy initiatives to evolve a more workable National Transport
policy and functional strategies for the Policy implementation (Adesanwo, 2000; Maduekwe,
2002). The Ministry’s strategies include among others (1) stimulating the private sector
participation in transport industry and (2) Policy initiatives.
Page 8
International Journal of Asian Social Science, 2013, 3(5):1208-1226
1215
Furthermore, in order to deal with the deteriorating infrastructural facilities which resulted in
falling quality and safety of transport service that engendered unsustainability in the transport
system; a number of strategic policy options were proposed.
Firstly, the World Bank (1996), argues that the root cause of this situation are lack of proper
maintenance of the facilities and over-reliance on the Government for the provision of services and
further maintains that:
(a) To provide a viable sustainable transport services in the long run government will need to
promote increased private sector participation in service provision and in the maintenance
of infrastructure and
(b) In the short-run the government should increase her efforts towards infrastructure
maintenance, improved cost recovery, reducing outstanding liabilities, operational cost
and size of public investment.
Secondly, Adeniji (2000) believes that there is need to:
(a) Appraise the existing state of various modes of transport in Nigeria.
(b) Prepare a blue print containing immediate, short and long term strategic proposals bearing
in mind the challenges facing the transports system and
(c) Develop information infrastructure.
Thirdly, Chikolo (2001) advocates integrated inter-modal transport system. This is the case where
transport becomes organic and functioning in synergy rather than discretely in uncoordinated
manner. This entails provision of infrastructure that will enable the introduction of any appropriate
mode including cycle with linking mechanism within the system.
Fourthly, the Federal Ministry of Transport has in 2002 designed strategies to deal with the
implementation of the NTP. These proposed strategies already advanced for the solution to the
unsustainable transport system may all be necessary and relevant. However, we noted that the
studies cited in the literature did not address the issue of sustainability. For instance, the World
Bank did not substantiate enough reason why poor maintenance culture, and reliance on
governments for the provision of service exist. In the other hand, Chikolo and Adeniji fail to
outline the extent to which their proposals would enhance sustainability in the transport system.
Similarly, the Federal Government proposed strategies for implementation of the National
Transport policy is very necessary but not sufficient enough because the strategies do not explicitly
include structural arrangements for effective implementation of the NTP.
As Ansoff (1965); Chandler (1962); Onwuchekwa (2000) and McCarthy et al. (1979), point out
that structure must always follow strategy to ensure successful implementation of strategy.
To this end therefore, our interest in this study arose from our concern to fill this void by
evaluating sustainable transport objectives.
Page 9
International Journal of Asian Social Science, 2013, 3(5):1208-1226
1216
Sustainable Transport Performance Indicators
According to Gilbert and Tanguay (2000); Gudmundsson (2001) and Litman (2003), sustainability
and sustainable transportation are difficult to measure directly, so various performance indicators
are used to evaluate them. Some are relatively narrow, focusing on just a few impacts, such as air
pollution emission, social and environmental objectives. The indicators are listed below:
Quality overall accessibility i.e. ability to reach desired goods, services and activities more is
better.
Land use accessibility: average number of basic services (schools, shops and government
offices) within walking distance of residences.
Children’s accessibility: portion of children who can walk or bicycle to schools, shops and
parks from their homes higher is better.
Electronic accessibility: portion of population with Internet services; higher is better.
Commute speed: Average commutes travel time. Lower is better, particularly for
disadvantaged populations.
Transport diversity: variety and quality of transport option available in a community; higher is
better.
Transit service: Public transit service quality, including coverage (portion of households and
jobs within 5 minutes walking distance of 15 minutes transit service), service frequency,
comfort (portion of trips in which passengers can sit and portion of transit stops with shelters)
information availability, and safety (injuries per billion passenger-mile).
Motor transport options: quality of airline, rail, public transit, and ferry ride share taxi services.
Congestion delay: per capita traffic congestion delay; lower is better.
Consumer transport cost: portion of household expenditures devoted to transport; lower is
better.
Affordability: portion of household expenditures devoted to transport, including vehicles
expenses, fares, residential parking costs, and taxes devoted to transport; particularly to people
who are economically, socially and physically disadvantaged; lower is preferred particularly
for disadvantaged populations.
Facility cost: per capita expenditures on roads, traffic services and parking facilities lower is
preferred.
Freight and commercial transport efficiency: speed, quality, and affordability of freight and
commercial transport; higher is better.
Delivery services: quality and quantity of delivery services (international/ intercity courier, and
stores that offer delivery); higher is better.
Market principles: degree to which transport system reflects market principles, including price
that reflect full costs and neutral tax policies; higher is better.
Planning practices: degree to which transport institutions reflect least – cost planning and
investment practices.
User rating: overall satisfaction rating of transport system and services by users.
Citizen involvement: public involvement in transport planning process.
Page 10
International Journal of Asian Social Science, 2013, 3(5):1208-1226
1217
Health and fitness: portion of population that regularly uses active transport modes (walking
and cycling); higher is better.
Community livability: degree to which transport activities increase community livability (local
environment quality).
Cultural preservation: degree to which cultural and historic values are reflected and preserved
in transport planning decision.
Basic access: quality of transport to access socially valuable activities such as medical service,
education, employment and essential shopping, particularly for disadvantaged populations.
Horizontal equity (fairness): degree to which prices reflect full costs unless a subsidy is
specifically justified.
Progressivity: degree to which transport polices make lower income people relatively better
off.
Mobility for non-drivers: quality of accessibility and transport services for non-drivers.
Mobility for people with disability: quality of transport facilities and services for people with
disabilities, such as wheel chair users and people with visual impairments; higher is better.
Non-motorized transport: quality of walking and cycling conditions higher is better.
Climate change emissions of CO2 and other climate change emissions; lower is desirable.
Other air pollution: per capital emissions of convention air pollutants (CO2, VOC, NOX) lower
is desirable.
Noise pollution: portion of population exposed to high levels of traffic noise.
Water pollution: per capita vehicle fluid losses; lower is better
Land use impacts: per capita land devoted to transportation facilities; lower is better.
Habitat protection: preservation of high quality wildlife habitat (wet land, old-growth forest,
etc.) from loss due to transport facilities and development.
Roadway aesthetic conditions (people tend to be more inclined to care for environments that
they consider beautifully and meaningfully).
The Nigeria National Transport Policy Of 1993
Nigeria is a country with a total land area of 91.2 million hectares, 68.4 million hectares are
cultivable. However only 34 million hectares are cultivated at present. There are limitations due to
lack of all-season roads particularly feeder roads, which will provide market access for linking
urban population centres with remote farming district. (Nnama, 1986). Besides the development of
the highways system, Nigeria transportation policy involves integrated multi-modal transportation
development. The broad transport policy objectives of adequacy and efficiency are broken down
into the following specific objectives called principles (FMT, 1993). The principles are:
Adequate to support the existing and future needs for efficient movement of people and
goods.
Adequate to meet the requirement for social and economic development and be able to
perform its proper role as an instrument of social and economic policies of the nation.
Page 11
International Journal of Asian Social Science, 2013, 3(5):1208-1226
1218
Assure adequate and economic mobility of people and goods and efficient provision of
public services thereby act as instrument of national integration and unity.
Improve competitiveness of Nigeria export through its efficient operations.
Assure that essential transport services are affordable to the majority of Nigerians.
Transport cost should not be a barrier to having access to employment opportunities or to
the delivery of essential social and public services.
Transport facilities and service should use economic resources in the most efficient
manner.
Ensure that transport mode is able to achieve its full economic potential and develop
according to its comparative advantages.
Free market force should as far as possible play the dominant role in assuring efficient and
allocation and use of resources. Government intervention in transport sector should
promote efficiency, avoid creating economic distortions and assure protection of transport
users.
Government enterprises or parastatals should operate under conditions of commercial
discipline, be assured managerial freedom and fully accountable for their results.
Public service obligation imposed on transport enterprises should be fully compensated
and the methods of compensation be such as to provide incentives for efficient use of
resources.
Effective measure should be taken to assure safely of transport operations and to reduce as
far as possible accidents with resulting loss of life, injuries and damages and
Transport operations and development should avoid causing environmental damages and
effective measure should be taken to reduce pollution.
The first five principles above represent aspects or elements of adequacy in transport service whilst
the last seven reflect the efficiency objectives in transport policy. In a nutshell both adequacy and
efficiency are broad objectives of the National Transport policy in which all transport decisions
ought to be based.
METHODOLOGY
The study was carried out in selected transport firms in Nigeria to evaluate the effectiveness of
NTP and the survey research method was adopted for study. In sample size determination and
selection, simple random sampling and stratified random sampling techniques were employed.
Data were collected from both primary and secondary sources and descriptive and inferential
statistic were employed in the analysis. The instruments for gathering data were structured
questionnaire augmented with additional information from oral interviews. With the aid of Yamene
(1964) statistical formula, a random sample of 127 (or 68.28%) transport firms were selected for
the study out of a population of 186 registered luxury bus and shipping firms in Nigeria as of 2005
(ALBON, 2005; NMA, 2005). Proportion of each strata was determined by Bowley’s proportion
allocation formula. (Kumar, 1976). From the sample, all available managers in the firms were
Page 12
International Journal of Asian Social Science, 2013, 3(5):1208-1226
1219
included in the study. On the whole there were 1270 managers in the 127 firms, which were used
for the study. For completeness a sample of 400 transport facilitators referred to as non-transport
workers were included in the study using Walpole (1974) formula. Therefore a total number of
1670 questionnaires were administered to the respondents out of which 1452 questionnaires were
completed, given a response of 86.95%. To draw valid conclusions for the study, the hypothesis
formulated was tested with an aid of Z-test statistic at 0.05 level of significance.
DATA PRESENTATION AND ANALYSIS
Introduction
The data generated from the study were presented and analyzed according to the research question
and hypothesis that guided the study.
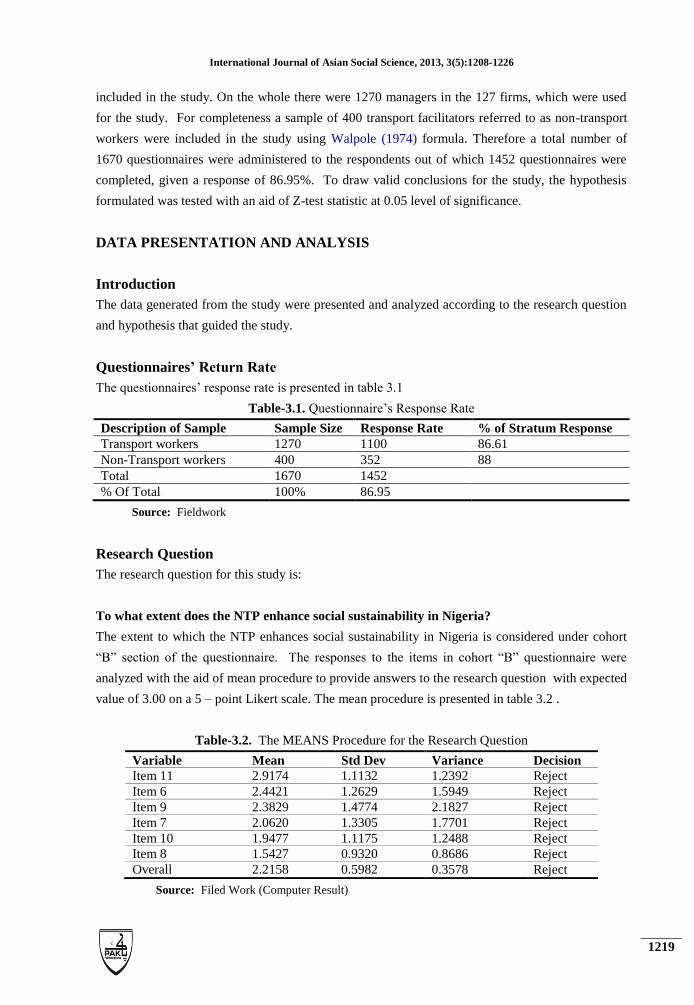
Questionnaires’ Return Rate
The questionnaires’ response rate is presented in table 3.1
Table-3.1. Questionnaire’s Response Rate
Description of Sample Sample Size Response Rate % of Stratum Response
Transport workers 1270 1100 86.61
Non-Transport workers 400 352 88
Total 1670 1452
% Of Total 100% 86.95
Source: Fieldwork
Research Question
The research question for this study is:
To what extent does the NTP enhance social sustainability in Nigeria?
The extent to which the NTP enhances social sustainability in Nigeria is considered under cohort
“B” section of the questionnaire. The responses to the items in cohort “B” questionnaire were
analyzed with the aid of mean procedure to provide answers to the research question with expected
value of 3.00 on a 5 – point Likert scale. The mean procedure is presented in table 3.2 .
Table-3.2. The MEANS Procedure for the Research Question
Variable Mean Std Dev Variance Decision
Item 11 2.9174 1.1132 1.2392 Reject
Item 6 2.4421 1.2629 1.5949 Reject
Item 9 2.3829 1.4774 2.1827 Reject
Item 7 2.0620 1.3305 1.7701 Reject
Item 10 1.9477 1.1175 1.2488 Reject
Item 8 1.5427 0.9320 0.8686 Reject
Overall 2.2158 0.5982 0.3578 Reject
Source: Filed Work (Computer Result)
Page 13
International Journal of Asian Social Science, 2013, 3(5):1208-1226
1220
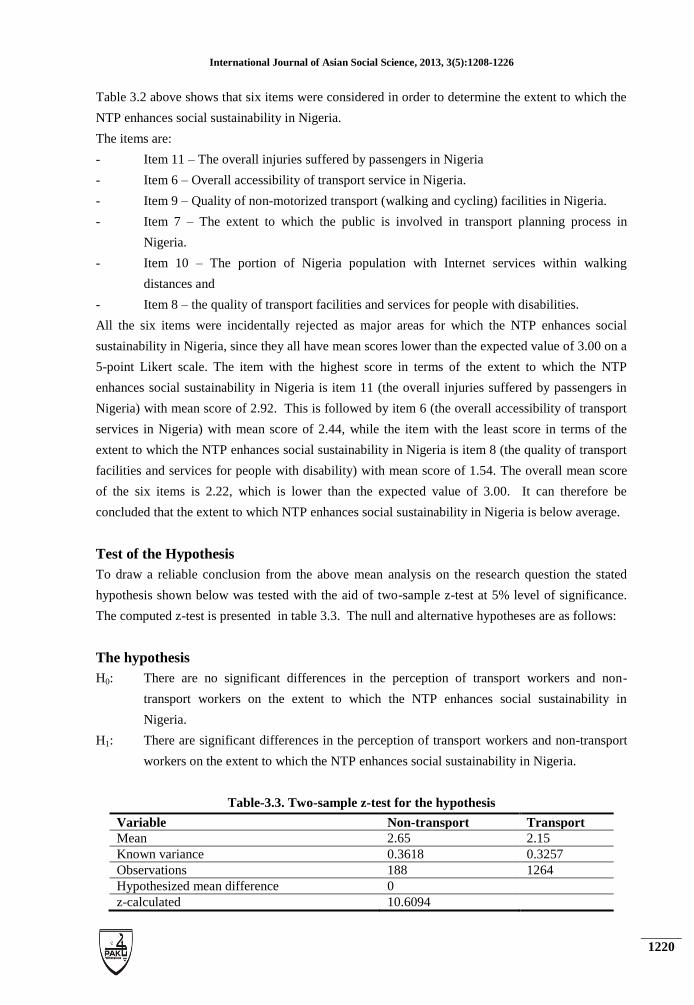
Table 3.2 above shows that six items were considered in order to determine the extent to which the
NTP enhances social sustainability in Nigeria.
The items are:
- Item 11 – The overall injuries suffered by passengers in Nigeria
- Item 6 – Overall accessibility of transport service in Nigeria.
- Item 9 – Quality of non-motorized transport (walking and cycling) facilities in Nigeria.
- Item 7 – The extent to which the public is involved in transport planning process in
Nigeria.
- Item 10 – The portion of Nigeria population with Internet services within walking
distances and
- Item 8 – the quality of transport facilities and services for people with disabilities.
All the six items were incidentally rejected as major areas for which the NTP enhances social
sustainability in Nigeria, since they all have mean scores lower than the expected value of 3.00 on a
5-point Likert scale. The item with the highest score in terms of the extent to which the NTP
enhances social sustainability in Nigeria is item 11 (the overall injuries suffered by passengers in
Nigeria) with mean score of 2.92. This is followed by item 6 (the overall accessibility of transport
services in Nigeria) with mean score of 2.44, while the item with the least score in terms of the
extent to which the NTP enhances social sustainability in Nigeria is item 8 (the quality of transport
facilities and services for people with disability) with mean score of 1.54. The overall mean score
of the six items is 2.22, which is lower than the expected value of 3.00. It can therefore be
concluded that the extent to which NTP enhances social sustainability in Nigeria is below average.
Test of the Hypothesis
To draw a reliable conclusion from the above mean analysis on the research question the stated
hypothesis shown below was tested with the aid of two-sample z-test at 5% level of significance.
The computed z-test is presented in table 3.3. The null and alternative hypotheses are as follows:
The hypothesis
H0: There are no significant differences in the perception of transport workers and non-
transport workers on the extent to which the NTP enhances social sustainability in
Nigeria.
H1: There are significant differences in the perception of transport workers and non-transport
workers on the extent to which the NTP enhances social sustainability in Nigeria.
Table-3.3. Two-sample z-test for the hypothesis
Variable Non-transport Transport
Mean 2.65 2.15
Known variance 0.3618 0.3257
Observations 188 1264
Hypothesized mean difference 0
z-calculated 10.6094
Page 14
International Journal of Asian Social Science, 2013, 3(5):1208-1226
1221
P(Z<=z) one tail 0.0000
z-tabulated (one tail) 1.6449
P(Z<=z) two tail 0.0000
z-tabulated (two tail) 1.9600
Source: Field Work (Computer results)
Table 3.3 shows that the mean scores for non-transport and transport workers are 2.65 and 2.15
respectively. This indicates that both the non-transport and transport workers rated the extent to
which the NTP enhances social sustainability in Nigeria as below average, since both the mean
values are less than the expected value of 3.00 on a 5-point Likert scale. Both mean values also
reveal that the rating of the transport workers is lower than the rating of the non-transport workers
in terms of the extent to which the NTP enhances social sustainability in Nigeria.
The table 3.3 also indicates that the z-calculated and z-tabulated (two tail) values for the hypothesis
are 10.6094 and 1.9600 respectively. Thus, we reject the null hypothesis at 5% level of
significance, since the z-calculated is greater than the z-tabulated. It can therefore be concluded
that there is significant difference in the perception of transport workers and non-transport workers
on the extent to which the NTP enhances social sustainability in Nigeria.
DISCUSSION OF THE FINDINGS, CONCLUSION AND RECOMMENDATIONS
Introduction
The findings of this study are discussed in this section along the line of the study’s objective. In
order to remain focus on the discussion of the research findings the research objective is re-stated;
To assess the extent to which the NTP enhances social sustainability in Nigeria
Research Question
To what extend does the NTP enhance social sustainability in Nigeria? To provide answers to the
above-mentioned research questions six (6) questionnaire items were considered, using means
procedure to analyze the responses with expected value of 3.00 on a 5 point Likert scale. The
analysis revealed that all the six items were incidentally rejected as major areas for which the NTP
enhanced social sustainability in Nigeria (see table 3.2) since they all have mean scores lower than
the expected value of 3.00 on 5-point Likert scale. The analysis also showed that the overall means
score of the six items was 2.22 that are lower than the expected value of 3.00 and it was therefore
concluded that the extent to which the NTP enhanced social sustainability in Nigeria was below
average. To draw a valid conclusion from the above means analysis on the research question, the
study hypothesis (see 1.5 for the research hypothesis) was tested with the aid of two-sample z-test
at 5% level of significance.
The result of the two-sample z-test (see table 3.3) indicated that the means scores for the non-
transport and transport workers were 2.65 and 2.15 respectively. This showed that both the non
Page 15
International Journal of Asian Social Science, 2013, 3(5):1208-1226
1222
transport and transport workers rated the extent to which the NTP enhanced social sustainability in
Nigeria is below average, since both the mean values were less than the expected value of 3.00 on a
5-point Likert scale. The two-sample z-test also indicated that the z-calculated and z-tabulated
(two tail) values for the hypothesis are 10.6094 and 1.9600 respectively. Thus, the null hypothesis
was rejected at 5% level of significance since the z-calculated was greater than the z-tabulated. It
was therefore concluded that there was significant difference in the perception of transport workers
and non-transport workers on the extent to which the NTP enhanced social sustainability in
Nigeria.
Implications of the Findings
The findings of this study based on the research question and hypothesis have several implications
to the society in general and transport system in particular. For instance, one of the implications is
that the objective of this study has been realized to the extent that the study has revealed that social
sustainability in Nigeria is not enhanced to some extent by the NTP since the NTP has not
significantly reduced the negative impact on social sustainability issues of the Nigeria’s transport
system. This is evidenced by the fact that all the six items considered under social sustainability
were rated below the expected value of 3.00 on a 5-point likert scale. (see tables 3.2 and 3.3).
According to some writers such as World Resources Institute (2004); VTPI (2003) and
Gudmundsson and Hojer (1996) social sustainability issues include;
Accessibility of transport service
Quality of non motorized transport
Public participation in transport planning process
Overall injuries suffered by passengers
Quality of transport facilities and services and
Electronic accessibility.
Even though the result showed that there was significant difference in the perception of non-
transport and transport workers on the extent to which the NTP enhanced social sustainability in
Nigeria, this trend does substantially strengthened the findings of this study; because means scores
for non-transport and transport workers were 2.65 and 2.15 respectively (see table 3.3) which were
lower than the expected value of 3.00 on a 5-point Likert scale. This provides an indication of the
extent to which both the categories (non-transport and transport workers) rated NTP effectiveness
in enhancing social sustainability in Nigeria below average. Moreover, it is evident that the rating
of the transport workers is lower than that of the non-transport workers in terms of the extent to
which the NTP enhanced social sustainability in Nigeria. To a considerable extent the reason for
this may lie in the fact that the transport workers have better understanding of the sustainability
factors than the non-transport workers. To this effect, this scenario or situation generally seems
strong enough to account for all the differences in the perception of both the non-transport and
transport workers on the extent to which the NTP enhanced social sustainability in Nigeria.
Page 16
International Journal of Asian Social Science, 2013, 3(5):1208-1226
1223
Consequently it can be concluded that to the extent that one of the objectives of the NTP is to
enhance social sustainability; it served this end only in a very limited fashion with regard to:
Overall accessibility of transport service in Nigeria.
Quality of non mortised transport (walking and cycling) facilities in Nigeria
The extent to which the public is involved in transport planning process in
Nigeria
The overall injuries suffered by passengers in Nigeria.
The portion of Nigeria population with internet service within walking
distances and
The quality of transport facilities and services for people with disabilities in
Nigeria.
CONCLUSION
In the light of the analysis and findings above the following conclusions about the study were
deduced. The study showed that the extent to which the NTP enhances social sustainability in
Nigeria was below average. In view of this fact we conclude that although the NTP has fostered
appreciable change to some extent, the policy has not had substantial and intended impact, on
social sustainability in Nigeria.
RECOMMENDATIONS
In light of the findings and their consequent conclusion and implications we make the following
recommendations as a way towards realizing sustainable transport system in Nigeria. Although the
NTP did not enhance social sustainability to some extent its potential to contribute to sustainable
transport is great, so the policy should be radically modified with a view to formulating sound
implementation strategy capable of increasing the salience of the policy for the implementing
organizations, if further strides toward sustainable transport are to be made. In effect, the policy
should incorporate a structural framework aimed at motivating the implementing organizations to
fit the policy into their standard operating routines. Obviously this is because a policy that is
congruent with organizational self-interests is more likely to be adopted and implemented with less
change.
Along the same lines, we advocate the introduction of comparative analysis in the transport system
with the aid of benchmarking technique to identify the best practices in sustainable transport and
them attempt to copy the exemplary practices. For example in Nigeria’s road transport mode, ABC
Transport Plc is known to emphasize passengers’ safety. This practice if benchmarked by other
transport operators will of course contribute to sustainable transport in Nigeria. In a similar vein we
recommend that the NTP be specifically modified along these lines to improve its viability.
Page 17
International Journal of Asian Social Science, 2013, 3(5):1208-1226
1224
Clarity of Purpose
The NTP should adequately clarify its goals. In other words, the specificity of policy goals is
required to minimize the vagueness of the general aspects of the policy.
Scope of the Policy
The extent or scale of change required should be specified in the policy. In effect, the NTP should
be broad enough to quantify the policy objectives so that it should be measurable overtime.
The Complexity of the Policy
The NTP should specify the roles of stakeholders in order to minimize the complexity of the
policy.
Mechanisms for Compliance
The NTP should stipulate appropriate implementation mechanisms to ensure that rewards and
penalties relate to performance thereby causing the mechanisms to be at a motivating level where
necessary optional and mandatory aspects be introduced.
Perception of Benefits
To help sustain interest in the NTP the policy should be modified to appeal to the self-interest of
the implementing organizations. It is believed that perception of higher benefits accruing from
policy will generate higher level of commitment among the implementing organizations and
consequently enhance the policy implementation. The benefits may include: provision tax
incentives; assistance in manpower development; facilitating the supply of petroleum products and
transport equipment etc.
Appropriate Organizational Structure
Appropriate organizational structure should be in place, which is essential to effective
implementation of the policy and minimize role conflict among the stakeholders.
Government Attitudes
The disposition of indifferent to NTP among the transport firms was partly attributed to lack of
government incentives to facilitate efficient transport operation. To this effect, increase in positive
attitudes by the government agencies towards the NTP will enhance the chances of the policy
realizing its objectives.
REFERENCES
Adeniji, K., 2000. Transport challenges in Nigeria in the next two decades, Ibadan:
Transport studies unit. Nigeria Institute of Social and Economic Research, 1(3):
40-67.
Page 18
International Journal of Asian Social Science, 2013, 3(5):1208-1226
1225
Adesanwo, S., 2000. Towards a vibrant transport policy. Nigerian Ports Authority (NPA)
News Quarterly Journal of the NPA.
ALBON, A.o.L.B.o.o.N., 2005. Transport news. Journal of ALBON, Rota Business
Communications.
Ansoff, H.I., 1965. Corporate strategy. New York, McGraw-Hill.
Brundtland, C., 1987. Our common future: Report of the 1987 world commission on
environment and development. Oxford; Oxford University Press.
Chandler, A.D.J., 1962. Strategy and structure. Cambridge; Mass The MIT Press.
Chikolo, V.I., 2001. Advantages of principled planning in transport sector. Daily
Champion Newspaper Limited.
FMT, F.M.o.T., 1993. National transport policy. Abuja; FMT.
FOS, F.O.o.S., 1999. Annual abstracts of statistics. Abuja; FOS.
FTAG, S., R.E. , 2001. Vision 2050 integrated national transportation system. USA
Federal Transportation Advisory Group (FTAG).
Gilbert, R. and H. Tanguay, 2000. Sustainable transportation performance indicators
project. The Centre for Sustainable Transportation, Toronto.
Gudmundsson, H., 2001. Indicators and performance measures for transportation,
environment and sustainability in North America. Department of Policy Analysis,
National Environmental Research Institute, Ministry of Environment and Energy,
Research Notes from NERI, No. 148, Denmark.
Gudmundsson, H. and M. Hojer, 1996. Sustainable development principle and their
implications for transport. Ecological Economics: Elsevier Science BV.
Kumar, S.R., 1976. A manual of sampling technique. London: Heinemann Limited.
Litman, O., 2003. Sustainable transport systems. Jornal of Transport Research. South
Africa. new Publishers, 2(3): 45-47.
Maduekwe, O., 2002. Ministerial press briefing.
May, A.D., 1997. Transport police Transport Planning and Traffic Engineering, Oxford;
Butterworth-Heinemann.
McCarthy, D.J., R.J. Minichiello and J.R. Curran, 1979. Business policy and strategy.
NMA, N.M.A., 2005. List of registered shipping companies in Nigeria. Apapa; NMA.
Nnama, S.K., 1986. 100 years of automobile. Enugu; Anambra Motor Manufacturing
Company Limited.
O’Flaherty, C.A.E., 1997. Transport planning and traffic engineering. Oxford;
Butterworth - Heinemann.
Onwuchekwa, C.I., 2000. Business policy and strategic management. Onitsha; University
Publishing Company.
Schafer, J. and C. Victor, 1997. The past and future of global mobility. Scientific
America.
Ugboaja, P.C., 2002. Scanning Nigeria’s transport environment: Strategic management
approach. Interworld Journal of Management and Development Studies, 1(1).
Page 19
International Journal of Asian Social Science, 2013, 3(5):1208-1226
1226
Ugboaja, P.C., 2007. An evaluation of strategy implementation mechanisms of the
national transport policy in Nigeria; unpublished ph.D thesis submitted to the
department of management. University of Nigeria, Nsukka, Nigeria.
USA DOT, D.o.T., 1999. Bureau of transportation statistics, national transportation
statistics washington dc; dot.
VTPI, V.T.P.I., 2003. Transportation demand management (tdm) encyclopedia sustainable
transport and tdm vtpi
Walpole, u.P., 1974. Research methods. Second Edn.
World Bank, 1996. Nigeria federal public expenditure review report no. 1447 uni, west
central Africa department country. Washington DC. World Bank.
World Resources Institute, W., 2004. Sustainable cities, sustainable transportation” earth
trends, wri Available from http//earthtrends, wri.org/features.
Yamene, T., 1964. Statistics: An introductory analysis. 3rd Edn., New York: Harper and
Row Publishers.