Page 1 A Synthesis of Current Roadmap to a U.S. Hydrogen (H 2 , NH 3 ) Economy with Implications for Alaska’s Energy Outlook Developed by Mark A. Foster & Associates (MAFA) Developed for Commonwealth North Energy Action Committee December 4, 2020
Transcript
Page 1
A Synthesis of Current Roadmap to a U.S. Hydrogen (H2, NH3) Economy
with Implications for Alaska’s Energy Outlook
Developed by Mark A. Foster & Associates (MAFA)Developed for Commonwealth North Energy Action Committee
December 4, 2020
Page 2
Overview
• Quick high level review of the McKinsey Hydrogen Road Map (September 2020) with an eye toward:• Upstream: Utilization of natural gas adjacent to major oil & gas infrastructure
with CCS potential for production• Downstream: End-Use market validations
• More recent observations on emerging upstream and downstream market assessments and market validations• Discussion
Page 3
Executive Summary
Strengthen the U.S. Economy, supporting up to:
Creating a highly competitive source of domestically produced low-emission energy
Provide significant environmental benefits and improve air quality
Enhance the U.S. energy system
In 2030:
$140 billion in revenue 100% domestically produced energy source
Significant reductions in CO2, NOx, SOx and particulates in cities and corridors
700,000 new jobs
In 2050:
$750 billion in revenue 100% domestically produced energy source
-16% U.S. CO2-36% U.S. NOx
14% of total final U.S. energy demand
3,400,000 new jobs
Potential Benefits of hydrogen in the U.S. in the ambitious scenario:
Adapted from McKinsey, Exhibit 1, US Hydrogen Roadmap, October 2020
Page 4
Hydrogen demand potential across sectors – 2030 & 2050
Adapted from McKinsey, Exhibit 2, US Hydrogen Roadmap, October 2020
Including ammonia as bunker fuel for shipping, synthetic jet fuel
fuel cell electric vehicles (FCEV), including: vans/light commercial vehicles, medium and heavy duty
trucks, trucks in freight terminals, ports and mines, light duty passenger vehicles (taxis, pickup trucks, SUVs, crossovers)
Page 5
Hydrogen EnablersPolicy Support
Adapted from McKinsey, Exhibit 4, US Hydrogen Roadmap, October 2020
2020-2022Immediate next steps
2023-2025Early Scale Up
2026-2030Diversification
2031 +Broad Rollout
Dependable, technology-neutral decarbonization goals in more states and at the federal level
Policy incentives (state and federal) in early markets to transition from direct support to scalable market-based mechanisms
Transition of policy incentives in fast following markets from direct support to scalable market-based mechanisms
Reduced / phase out of direct policy support in certain applications when reaching cost parity
Public incentives to bridge barriers to initial market launches, bring a wider range of mature hydrogen solutions to market, increase public awareness and acceptance, and continue to pilot hydrogen use across applications
Spread public incentives bridging barriers to initial market launches beyond pioneer states
Applications to broaden beyond transport with specific enabling policies in other sectors, e.g. industry, power
Robust hydrogen code at federal level
Hydrogen codes and safety standards, including blending standards, in market leader U.S. States
Regulatory framework for wider implementation of H2 energy storage
Policy/regulatory framework to include grid stability mechanisms for long-term energy storage, including hydrogen
Implementation of cross-sectoral decarbonization policy initiatives to support distributed energy resources
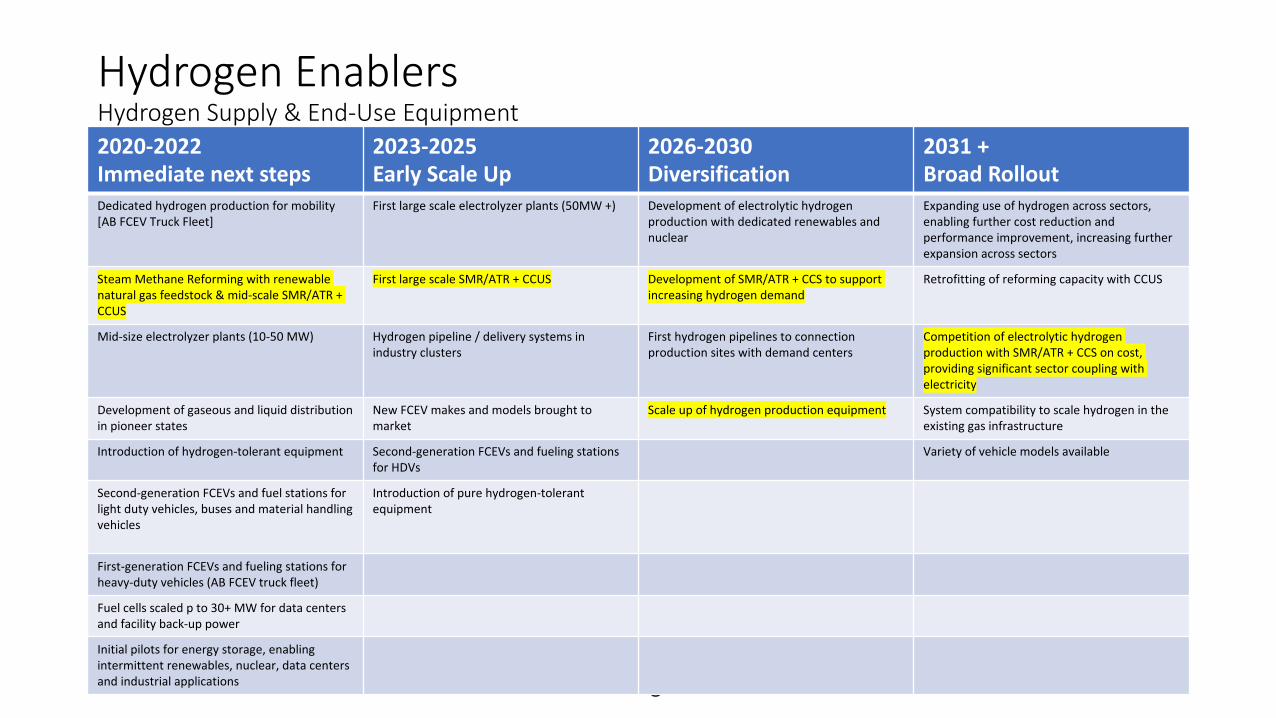
Adapted from McKinsey, Exhibit 4, US Hydrogen Roadmap, October 2020
2020-2022Immediate next steps
2023-2025Early Scale Up
2026-2030Diversification
2031 +Broad Rollout
Dedicated hydrogen production for mobility [AB FCEV Truck Fleet]
First large scale electrolyzer plants (50MW +) Development of electrolytic hydrogen production with dedicated renewables and nuclear
Expanding use of hydrogen across sectors, enabling further cost reduction and performance improvement, increasing further expansion across sectors
Steam Methane Reforming with renewable natural gas feedstock & mid-scale SMR/ATR + CCUS
First large scale SMR/ATR + CCUS Development of SMR/ATR + CCS to support increasing hydrogen demand
Retrofitting of reforming capacity with CCUS
Mid-size electrolyzer plants (10-50 MW) Hydrogen pipeline / delivery systems in industry clusters
First hydrogen pipelines to connection production sites with demand centers
Competition of electrolytic hydrogen production with SMR/ATR + CCS on cost, providing significant sector coupling with electricity
Development of gaseous and liquid distribution in pioneer states
New FCEV makes and models brought to market
Scale up of hydrogen production equipment System compatibility to scale hydrogen in the existing gas infrastructure
Introduction of hydrogen-tolerant equipment Second-generation FCEVs and fueling stations for HDVs
Variety of vehicle models available
Second-generation FCEVs and fuel stations for light duty vehicles, buses and material handling vehicles
Introduction of pure hydrogen-tolerant equipment
First-generation FCEVs and fueling stations for heavy-duty vehicles (AB FCEV truck fleet)
Fuel cells scaled p to 30+ MW for data centers and facility back-up power
Initial pilots for energy storage, enabling intermittent renewables, nuclear, data centers and industrial applications
Page 7
Hydrogen Applications Road Map
Adapted from McKinsey, Exhibit 5, US Hydrogen Roadmap, October 2020
2020-2022Immediate next steps
2023-2025Early Scale Up
2026-2030Diversification
2031 +Broad Rollout
Transportation FuelMaterial handling / forklifts
Light duty passenger vehiclesLight commercial vehicles / busesMedium and heavy duty trucks
Rail sector (direct Fuel Cells, Rail Electrification with H2 grid electricity production support)
Power Generation & Grid BalancingDistributed power, e.g., data centers
Distributed power, other segments Transmission system interconnections Centralized electrical grid generation stations and transmission system expansions
Fuel for Residential & Commercial BuildingsEngineering analysis and pilot testing
Blended H2 + CH4 pilot projects Blended H2 + CH4 heating Pure H2 heating
Feedstock for industry and long-distance transport
R&D investmentPilot testing
Low carbon fuel for transport sectors commercialization (biofuel, synfuel, ammonia)
High grade industrial heating Low and medium grade industrial heat
Page 8
Hydrogen Scale-Up – ambitious road map milestones
Adapted from McKinsey, Exhibit 6, US Hydrogen Roadmap, October 2020
TodayImmediate next steps
2022Early scale-up
2025Diversification
2030Broad roll out
H2 demand, metric tonnes 11 m 12 m 13 m 17 m
FCEV sales 2,500 30,000 150,000 1,200,000
Fueling Stations 63 165 1,000 4,300
Material handling FCEVs
25,000 50,000 125,000 300,000
Material handling fueling stations
120 300 600 1,500
Annual Investments $1 bn $2 bn $8 bn
New Jobs +50,000 +100,000 +500,000
Page 9
US hydrogen market todaycurrent consumption in the US H2 market, pct
Adapted from McKinsey, Exhibit 7, US Hydrogen Roadmap, October 2020
Page 10
Estimated Revenue Generated along the value chainRevenue breakdown by value chain steps, $ billions
Adapted from McKinsey, Exhibit 8, US Hydrogen Roadmap, October 2020
0.7 3.4 Millions of Jobs
Page 11
Hydrogen Applications Which Drive Demand -2030
Adapted from McKinsey, Exhibit 10, US Hydrogen Roadmap, October 2020
Page 12
Hydrogen Applications Which Drive Demand -2050
Adapted from McKinsey, Exhibit 11, US Hydrogen Roadmap, October 2020
Page 13
Use of hydrogen in the U.S. today
Adapted from McKinsey, Exhibit 15, US Hydrogen Roadmap, October 2020
Page 14
Low-carbon fuel pathways for aviation and shipping in the U.S.
Adapted from McKinsey, Exhibit 22 US Hydrogen Roadmap, October 2020
Page 15
Industrialization / Large-Scale production, analogous to the wind and solar tech development cycle, seen as having potential to enable significant cost reductions
Adapted from McKinsey, Exhibit 26, US Hydrogen Roadmap, October 2020
Page 16
Hydrogen Production Cost Scenarios in 2030
Adapted from McKinsey, Exhibit 28, US Hydrogen Roadmap, October 2020
Page 17
Path to Competitive Hydrogen at the Fuel Supply Station
Adapted from McKinsey, Exhibit 28, US Hydrogen Roadmap, October 2020
Page 18
Global installed/expected capacity of electrolyzers
Adapted from McKinsey, Exhibit 29, US Hydrogen Roadmap, October 2020
Page 19
Hydrogen Fueling Stations in the U.S. Potential Growth Scenarios
Adapted from McKinsey, Exhibit 33, US Hydrogen Roadmap, October 2020
Page 20
Appendices…
• References• Business press• McKinsey• MIT Energy Initiative
3.6 ConclusionTo qualitatively assess the costs derived from each hydrogen production (renewable and fossil fuel based) method, variables such as energy source, feed stock and capital investment cost, and hydrogen production cost (per kg of hydrogen) have been shown in Table 3.8. There are some uncertainties regarding the cost of hydrogen production. This cost is strongly affected by the production technology's advancement level, availability of existing infrastructure, and the feedstock price. According to the table, the most financially advantageous methods for hydrogen production are steam methane reforming, coal, and biomass gasification. Nuclear thermochemical cycles (CueCl and SeI) also seem to be competitive to fossil fuel and biomass prices. Wind and solar electrolysis give the highest production cost per kg of hydrogen. Since one of the major advantages of electrolysis is its local applications, distributed, small-scale production assumption is made when calculating the cost of electrolysis [47, 48].
Kayfeci, et al, Solar Hydrogen Production, 2019
Page 22
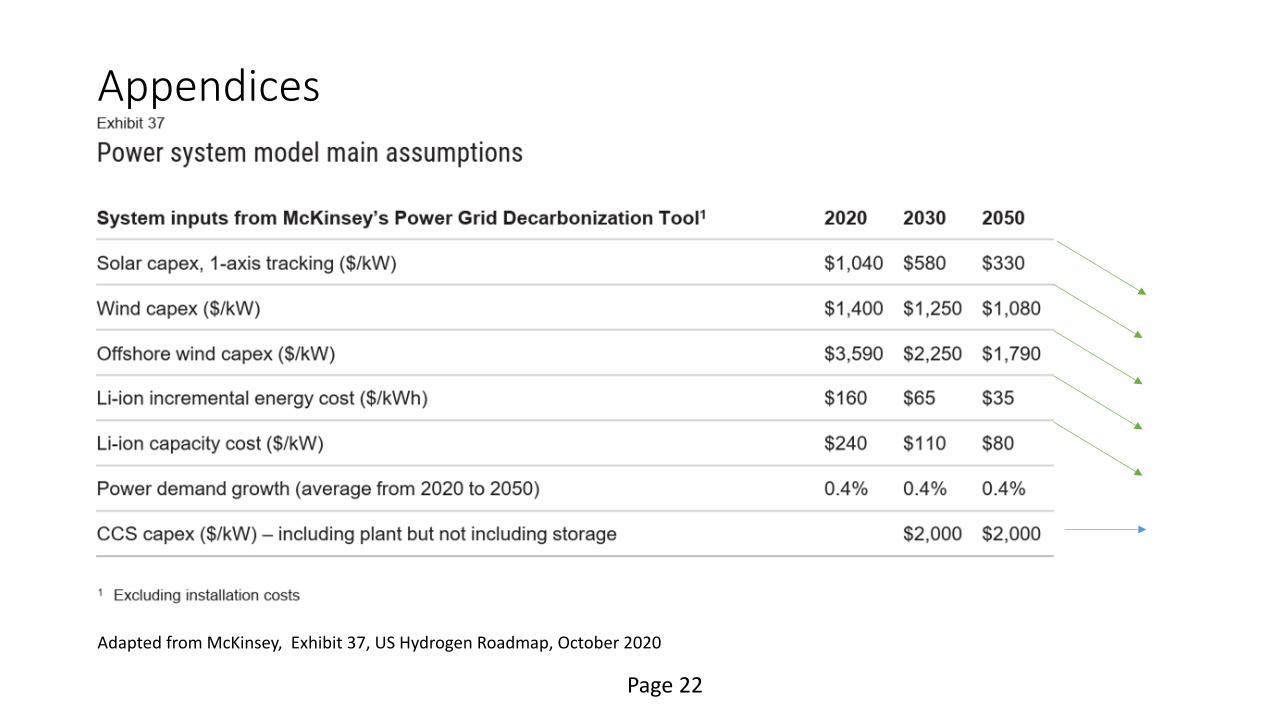
Appendices
Adapted from McKinsey, Exhibit 37, US Hydrogen Roadmap, October 2020