APPLIED OPTIC S A System for Microspectrophotometry Employing a Commercial Recording Spectrophotometer PAUL K. BROWN* Biological Laboratories, Harvard University, Cambridge, Massachusetts (Received April 12, 1961) The present paper describes the design and performance of an attachment for the Cary model 14 recording spectrophotometer, which permits the accurate recording of absorption spectra in small areas. A special compartment built into the light path of the spectrophotometer holds a low-magnification microscope ("macroscope") consisting of two opposed quartz condensers, with which measurements can be made between 300 and 700 mu in fields 0.1 to 1 mm in diameter. This can be replaced by a conventional microscope with which spectra can be measured from about 350-650 mu in fields as small as 4,u in diameter. These arrangements have been used to measure the absorption spectra of visual pigments i situ. With the macro- scope, such measurements have been made in small areas of surviving retinas; and with the microscope, they have been made in single isolated outer segments of rods. The present paper contains examples of each type of measurement. INTRODUCTION THE localization of chemical substances and proc- esses within living cells has long presented biolo- gists with a particularly challenging and fundamental problem. Traditionally, this has been met with staining procedures carried out with fixed preparations, but always under the disability that the fixation may have produced artifacts and that the stains may have moved from the positions originally occupied. The development of systems of microabsorption spectrophotometry in living cells by Caspersson con- stituted an enormous improvement since it opened the possibility of applying the powerful and, under favorable circumstances, highly specific methods of absorption spectrophotometry to restricted regions and components of living cells.' This type of procedure has since de- veloped greatly. 2 Its primary problems are: (1) to in- crease to its theoretical limits the degree of optical resolution achieved-i.e., to work with the narrowest possible fields localized as accurately as possible within the structure of the cell; (2) to extend the range of wavelengths over which such measurements can be * This investigation was supported in part with funds granted to Professor George Wald by the Rockefeller Foundation, the Office of Naval Research, and the U. S. Public Health Service. I should like to thank Professor Wald for help with the preparation of this paper. 1 T. Caspersson, Skand. Arch. Physiol. 73, Suppl. 8, 1 (1936); Chromosoma 1, 147 (1939); J. Roy. Microscop. Soc. 60, 8 (1940). 2 Recent general discussions of microspectrophotometry will be found in "Optical Methods of Investigating Cell Structure," Discussions Faraday Soc. No. 9, (1950); E. R. Blout, Advances in Biol. and Med. Phys. 3, 285 (1953); H. Swift and E. Rasch, in Physical Techniques in Biological Research, edited by G. Oster and A. W. Pollister (Academic Press, Inc., New York, 1956), Vol. 3, p. 353; and P. M. B. Walker ibid., Vol. 3, p. 401. For recent con- tributions to the art, see B. Chance, R. Perry, L. Akerman, and B. Thorell, Rev. Sci. Instr. 30, 735 (1959); and G. K. Strother and J. J. Wolken, Science 130, 1084 (1959). made; (3) to increase as greatly as possible the speed with which absorption spectra can be recorded, since the living cell is a dynamic system constantly under- going reactions and frequently wholly or partly in motion; and (4) finally, to increase the accuracy of such measurements, ideally to meet standards of absorption spectrophotometry as practised in solution. The particular point of the present instrument is to enlist the accuracy, convenience, and speed of a com- mercial recording spectrophotometer for absorption measurements in very small fields. Two interchangeable types of optical system have been built into the light path of a Cary model 14 recording spectrophotometer. One is a low-magnification device constructed of two quartz condensers facing each other, one of them focus- ing the sample beam upon an object on a slide between the condensers, the second condenser so close as to pick up virtually all the light that is transmitted or scattered, for eventual delivery to the phototube. This arrange- ment, hereafter called the "macroscope," is used for fields in the range 0.1-1.0 mm in diameter. When higher optical resolution is wanted, the upper condenser is re- moved and standard microscope objectives and ocular inserted so as to complete a conventional microscope. This can be removed entirely and replaced by any standard form of microscope. With this second arrange- ment measurements can be restricted to fields as small as 4 -is diam. RECORDING SPECTROPHOTOMETER The Cary model 14 recording spectrophotometer is a rapid, accurate, dual-beam instrument which can be readily adapted to accept various optical systems. This instrument employs a single photocell which is struck alternately by the sample and reference beams so that 1000
Transcript
APPLIED OPTIC SA System for Microspectrophotometry Employing a Commercial
Recording SpectrophotometerPAUL K. BROWN*
Biological Laboratories, Harvard University, Cambridge, Massachusetts(Received April 12, 1961)
The present paper describes the design and performance of an attachment for the Cary model 14 recordingspectrophotometer, which permits the accurate recording of absorption spectra in small areas. A specialcompartment built into the light path of the spectrophotometer holds a low-magnification microscope("macroscope") consisting of two opposed quartz condensers, with which measurements can be madebetween 300 and 700 mu in fields 0.1 to 1 mm in diameter. This can be replaced by a conventional microscopewith which spectra can be measured from about 350-650 mu in fields as small as 4,u in diameter. Thesearrangements have been used to measure the absorption spectra of visual pigments i situ. With the macro-scope, such measurements have been made in small areas of surviving retinas; and with the microscope,they have been made in single isolated outer segments of rods. The present paper contains examples ofeach type of measurement.
INTRODUCTION
THE localization of chemical substances and proc-esses within living cells has long presented biolo-
gists with a particularly challenging and fundamentalproblem. Traditionally, this has been met with stainingprocedures carried out with fixed preparations, butalways under the disability that the fixation may haveproduced artifacts and that the stains may have movedfrom the positions originally occupied.
The development of systems of microabsorptionspectrophotometry in living cells by Caspersson con-stituted an enormous improvement since it opened thepossibility of applying the powerful and, under favorablecircumstances, highly specific methods of absorptionspectrophotometry to restricted regions and componentsof living cells.' This type of procedure has since de-veloped greatly.2 Its primary problems are: (1) to in-crease to its theoretical limits the degree of opticalresolution achieved-i.e., to work with the narrowestpossible fields localized as accurately as possible withinthe structure of the cell; (2) to extend the range ofwavelengths over which such measurements can be
* This investigation was supported in part with funds grantedto Professor George Wald by the Rockefeller Foundation, theOffice of Naval Research, and the U. S. Public Health Service.I should like to thank Professor Wald for help with the preparationof this paper.
2 Recent general discussions of microspectrophotometry will befound in "Optical Methods of Investigating Cell Structure,"Discussions Faraday Soc. No. 9, (1950); E. R. Blout, Advancesin Biol. and Med. Phys. 3, 285 (1953); H. Swift and E. Rasch, inPhysical Techniques in Biological Research, edited by G. Oster andA. W. Pollister (Academic Press, Inc., New York, 1956), Vol. 3,p. 353; and P. M. B. Walker ibid., Vol. 3, p. 401. For recent con-tributions to the art, see B. Chance, R. Perry, L. Akerman, andB. Thorell, Rev. Sci. Instr. 30, 735 (1959); and G. K. Strotherand J. J. Wolken, Science 130, 1084 (1959).
made; (3) to increase as greatly as possible the speedwith which absorption spectra can be recorded, sincethe living cell is a dynamic system constantly under-going reactions and frequently wholly or partly inmotion; and (4) finally, to increase the accuracy of suchmeasurements, ideally to meet standards of absorptionspectrophotometry as practised in solution.
The particular point of the present instrument is toenlist the accuracy, convenience, and speed of a com-mercial recording spectrophotometer for absorptionmeasurements in very small fields. Two interchangeabletypes of optical system have been built into the lightpath of a Cary model 14 recording spectrophotometer.One is a low-magnification device constructed of twoquartz condensers facing each other, one of them focus-ing the sample beam upon an object on a slide betweenthe condensers, the second condenser so close as to pickup virtually all the light that is transmitted or scattered,for eventual delivery to the phototube. This arrange-ment, hereafter called the "macroscope," is used forfields in the range 0.1-1.0 mm in diameter. When higheroptical resolution is wanted, the upper condenser is re-moved and standard microscope objectives and ocularinserted so as to complete a conventional microscope.This can be removed entirely and replaced by anystandard form of microscope. With this second arrange-ment measurements can be restricted to fields as smallas 4 -is diam.
RECORDING SPECTROPHOTOMETER
The Cary model 14 recording spectrophotometer is arapid, accurate, dual-beam instrument which can bereadily adapted to accept various optical systems. Thisinstrument employs a single photocell which is struckalternately by the sample and reference beams so that
1000
September 1961 SYSTEM FOR MICROSPECTROPHOTOMETRY
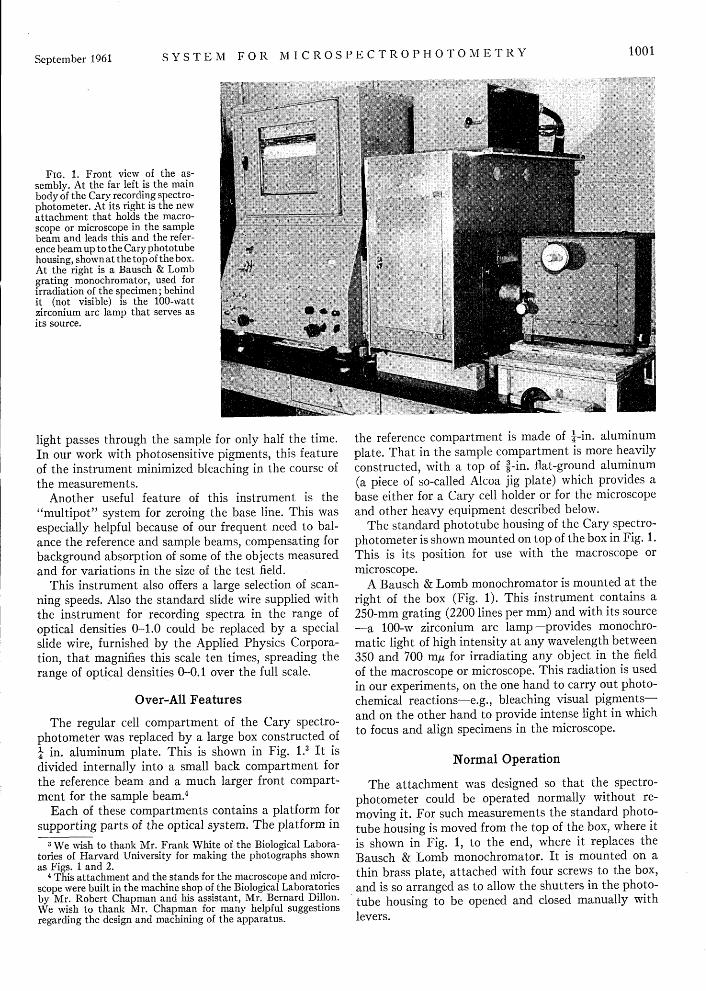
FIG. 1. Front view of the as-sembly. At the far left is the mainbody of the Cary recording spectro-photometer. At its right is the newattachment that holds the macro-scope or microscope in the samplebeam and leads this and the refer-ence beam up to the Cary phototubehousing, shown at the top of the box.At the right is a Bausch & Lombgrating monochromator, used forirradiation of the specimen; behindit (not visible) is the 100-wattzirconium arc lamp that serves asits source.
light passes through the sample for only half the time.In our work with photosensitive pigments, this featureof the instrument minimized bleaching in the course ofthe measurements.
Another useful feature of this instrument is the"multipot" system for zeroing the base line. This wasespecially helpful because of our frequent need to bal-ance the reference and sample beams, compensating forbackground absorption of some of the objects measuredand for variations in the size of the test field.
This instrument also offers a large selection of scan-ning speeds. Also the standard slide wire supplied withthe instrument for recording spectra in the range ofoptical densities 0-1.0 could be replaced by a specialslide wire, furnished by the Applied Physics Corpora-tion, that magnifies this scale ten times, spreading therange of optical densities 0-0.1 over the full scale.
Over-All Features
The regular cell compartment of the Cary spectro-photometer was replaced by a large box constructed of4in. aluminum plate. This is shown in Fig. 1.3 It isdivided internally into a small back compartment forthe reference beam and a much larger front compart-ment for the sample beam.4
Each of these compartments contains a platform forsupporting parts of the optical system. The platform in
I We wish to thank Mr. Frank White of the Biological Labora-tories of Harvard University for making the photographs shownas Figs. 1 and 2.
4 This attachment and the stands for the macroscope and micro-scope were built in the machine shop of the Biological Laboratoriesby Mr. Robert Chapman and his assistant, Mr. Bernard Dillon.We wish to thank Mr. Chapman for many helpful suggestionsregarding the design and machining of the apparatus.
the reference compartment is made of 4-in. aluminumplate. That in the sample compartment is more heavilyconstructed, with a top of 8-in. flat-ground aluminum(a piece of so-called Alcoa jig plate) which provides abase either for a Cary cell holder or for the microscopeand other heavy equipment described below.
The standard phototube housing of the Cary spectro-photometer is shown mounted on top of the box in Fig. 1.This is its position for use with the macroscope ormicroscope.
A Bausch & Lomb monochromator is mounted at theright of the box (Fig. 1). This instrument contains a250-mm grating (2200 lines per mm) and with its source-a 100-w zirconium arc lamp-provides monochro-matic light of high intensity at any wavelength between350 and 700 myL for irradiating any object in the fieldof the macroscope or microscope. This radiation is usedin our experiments, on the one hand to carry out photo-chemical reactions-e.g., bleaching visual pigments-and on the other hand to provide intense light in whichto focus and align specimens in the microscope.
Normal Operation
The attachment was designed so that the spectro-photometer could be operated normally without re-moving it. For such measurements the standard photo-tube housing is moved from the top of the box, where itis shown in Fig. 1, to the end, where it replaces theBausch & Lomb monochromator. It is mounted on athin brass plate, attached with four screws to the box,and is so arranged as to allow the shutters in the photo-tube housing to be opened and closed manually withlevers.
1001
P A 0 T 1. K. B R Vol 51
FIG. 2. The macroscope, at the left, isconstructed of two quartz condensers op-posed to each other. Between the con-densers, the platform holds two mechani-cal stages, one for positioning the specimenand one for positioning a circular dia-phragm below the specimen, to delimitthe field. A sliding pair of front-surfacemirrors in the base of the macroscopemakes it possible to send either the samplebeam of the spectrophotometer or radia-tion from a grating monochromator upthrough the instrument. The upper quartzcondenser can be replaced by the standardmicroscope shown at the right, in order toview and align the specimen under highpower and for measurements in smallfields.
For such measurements the standard Cary absorptioncell holders, mounted on special aluminum bases whichhold them in the correct positions and at the correctheight, replace the macroscope and microscope on theplatforms in the sample and reference compartments.Lenses focus the sample and reference beams so thatthey pass through the absorption cells with the sameorientation and dimensions as in the standard Cary cellcompartment. A quartz meniscus lens, mounted at theback of each cell holder, refocuses the beams on theentrance lenses of the phototube housing. The addedlenses are needed because the attachment involves alonger light path than the unmodified instrument. Thesample cell holder is mounted to slide between two fixedpositions, bringing either of two absorption cells intothe light path. With these provisions, all normal opera-tions of the spectrophotometer can be performed.
phooube |housin9 -
mnasAing d-a - - is
quartz condenser
specimen moulerr \ . f-,-quartz ens
quartz conenser\ K/l
reference beam , I _~e fit-c +T_ ----mirror
sample beam '."' monochromator
FIG. 3. Schematic diagram of the optical arrangements whichlead the sample and reference beams to the single photomultipliertube in the compartmeL at the top. he arrangement shown isfor macrospectrophotometry. It is converted for microspectro-photometry by replacing the upper quartz condenser in the samplebeam by the compound microscope shown at the right in Fig. 2.
The platform in the sample compartment is also easilyremoved to make room for larger equipment, as forexample, a Dewar absorption vessel for measurementsat low temperatures.
Macrospectrophotometry
To measure absorption spectra accurately in areas oftissue 0.1-1 mm in diameter requires that as much aspossible of the light passing through the tissue, whethertransmitted directly or scattered, be gathered up anddelivered to the phototube. The following optical systemseems to accomplish this result.
Mounting of Pilotolube IHousing
The phototube housing is mounted on a sliding brassplate on top of the box (Fig. 1) so that it can be pushedaside, permitting examination and comparison of thesample and reference beams. Small levers are mountedso that the shutters in the phototube housing can beopened manually when measurements are being made.At the suggestion of the Applied Physics Corporation,sponge rubber was packed around the infrared source inthe phototube housing to steady the chassis which holdsthe phototube.
Sample Beam
The macroscope is shown at the left in Fig. 2, and theoptical arrangements are diagrammed in Fig. 3. A block,mounted on its base so as to slide back and forth be-tween two fixed positions, holds two front-surfacemirrors facing in opposite directions, each at an angleof 450, so as to turn a horizontal beam of light upwardinto the macroscope. When the macroscope is in placeon the platform of the sample compartment, one ofthese mirrors can pick up either the light beam enteringfrom the Cary monochromator at the left (Fig. 1), orfrom the Bausch & Lomb monochromator at the right,directing either beam at will into the macroscope.
There it enters a quartz condenser which focuses it on
1002 Vol. 51
a circular diaphragm which delimits the field of measure-ment. The beam is then picked up by another quartzcondenser5 which leads it into the entrance lens of thephototube housing (Fig. 3). The top condenser mountcan easily be removed and replaced by a standardmicroscope tube (Fig. 2, right) with objectives andocular, used for more detailed observation of thespecimen.
Circular diaphragms on the macroscope stage formasking off areas of the specimen were of two kinds:
diaphragms (40-100 bt) made of aluminum foil 15 .u
thick, cemented onto a quartz slide with Duco cement;and larger diaphragms (0.2-1.0 mm), made by drillingholes in brass slides (25X50 mm).
These masking diaphragms are centered in the lightbeam by means of the mechanical stage shown in Fig. 2.Provision is made to lock the stage once the diaphragmhas been aligned. Each new diaphragm must be centeredand aligned but rarely needs readjustment.
Mounting the Specimen
The tissue to be measured is mounted on a circularquartz coverslip, 22 mm in diameter and 0.2 mm thick,within a Lucite ring about 6 mm across, and cementedto the center of the coverslip to form a well for the tissue.This permits the tissue to be bathed in an appropriatefluid. The thickness of this ringvariesfromO.2 to 0.5 mm,depending on the thickness of the tissue to be examined.Finally a 0.2X6-mm quartz coverslip is placed over theLucite ring, closing what is, in effect, a microcell holding
the tissue in its fluid medium. This microcell then fitsover the diaphragm holder on the stage of themacroscope.
A brass ring with a rubber gasket is mounted on anarm which can be raised and lowered so as to come down
on the lower coverslip which holds the specimen, clamp-
ing it firmly. This ring is attached to a second mechani-cal stage, seen at the left edge of the microscope stage
in Fig. 2, with which the slide holding the specimen can
be moved about and positioned accurately over themasking diaphragm. It has a standard vernier withwhich the position of the specimen can be determinedto 0.1 mm.
In setting up a preparation, the macroscope is takenout of the box and the top condenser is replaced by thestandard microscope tube (Fig. 2, right). The specimenis mounted and an area chosen for measurement isaligned with the masking diaphragm. Then the topcondenser is put back in place and the macroscope re-mounted on the sample-beam platform, ready for themeasurement.
In macrospectrophotometry, the sample beam is notmasked after passing through the tissue because thiswould result in a poor baseline. The whole area of the
5 The quartz condenser lenses, which are identical, were madeby the Jones Optical Company of Cambridge, Massachusettsand were mounted by Mr. Kenneth A. Dawson of Belmont,Massachusetts.
sample beam lens in the phototube housing is left openso as to bring as much scattered light as possible to thephototube.
Reference Beam
The optical arrangement of the reference beam isshown schematically in Fig. 3. A mirror block carrying
a front-surface mirror turns the Cary reference beamthrough 900, sending it upward through an adjustablediaphragm and a quartz meniscus lens, mounted in whathad been the holder for a Bausch & Lomb focusing con-denser resting on the platform in the reference compart-ment. The beam then passes through a second adjustablediaphragm at the top of the compartment and is focusedon the reference beam lens of the phototube housing.
The top diaphragm is used to adjust the size of thereference beam while the lower one controls the intensityof light which enters the phototube housing. Thus whendiaphragms 40-100 g in diameter are used in the samplebeam, the instrument is brought into approximatebalance (approximately zero baseline) by adjusting bothreference beam diaphragms. The top diaphragm is ad-justed so that the size of beam entering the phototubehousing matches approximately that of the sample beamwhen no tissue is in the microcell. The lower diaphragmis adjusted so that the intensity of the reference beammatches that of the sample beam.
When the largest diaphragm (1.0 mm) is used in thesample pathway, the top diaphragm in the referencepathway is left wide open and the lower diaphragm isadjusted to zero the baseline.
Setting the Baseline
The quartz condensers and masking diaphragm on themacroscope are carefully centered. The spectrophotome-ter is set at 400 mys and the upper and lower quartzcondensers are focused to give maximal light trans-mittance, as determined by the position of the recorderpen. The difference between the reference and samplebeams is grossly compensated by adjusting the referencebeam diaphragms to approximate a zero baseline. Finaladjustments are made with the multipots on the Caryspectrophotometer. Usually a zero baseline can be ob-
tained between about 360 and 700 m,4.Whether or not at zero, the baseline is recorded from
300 to 700 mg with the standard Cary tungsten sourceand may be recorded from 250-400 mAt with the hydro-gen source. Any departure from zero in the baseline is
used to correct subsequent spectra. The baseline can bechecked or re-recorded at any time by moving themicrocell so that the light beam passes through an areafree from tissue. The identical area of tissue can thenbe brought back into the light path by resetting thescales on the mechanical stage.
Microspectrophotometry
The main change here is the substitution of a micro-scope for the macroscope. This is accomplished most
September 1961 SYSTEM FOR MICROSPECTROPHOTOMETRY 1003
Wave enr9th-mpFIG. 4. Absorption spectra of a frog retina immersed in Ringer solution. Curve 1 is the base line, drawn beforehand with only Ringersolution in the microcell. Curve 2 is the recorded spectrum of a circular patch of dark-adapted retina, 0.2 mm in diameter. The absorptionspectrum of the retina is obtained by subtracting curve 1 from 2; but curve 2 even uncorrected displays the main a band of rhodopsin(X,\,, 503 m) and the minor 3 band at about 355 m. Curve 3 shows the result of irradiating the retina for 5 min with intense lightfrom the grating monochromator (500 m, 1-mm slits). The rhodopsin has been partly bleached, causing a fall of extinction in thevisible region and a corresponding rise in the near ultraviolet, owing to the formation of the yellow product retinene (Max about 385 m).
readily by replacing the top quartz condenser of themacroscope by the monocular microscope shown at theright in Fig. 2, thus completing what is essentially astandard microscope assembly while retaining thespecial features built into the macroscope (the mirrorsin its base, the special stage). The following descriptionis based upon this arrangement though alternativelyany other type of monocular microscope can be posi-tioned on the sample beam platform.
In microspectrophotometry, the mount for circulardiaphragms used in the macroscope is replaced by aquartz slide. The specimen is mounted between coverslips and positioned in the same way as alreadydescribed.
Since the objective and ocular are not quartz in thisarrangement, a Corning 738 filter (H. R. Nultra), whichabsorbs light almost completely below 345 m and trans-mits almost completely above 400 m, is inserted in thereference beam to help flatten the baseline. The two irisdiaphragms in the reference path are closed down tobring the baseline near zero and with the Cary multipotit is balanced further between about 350 and 650 mji.Sometimes the reference beam needs to be maskedfurther, when very small areas or particularly denseobjects are being measured.
In microspectrophotometry, the area of the specimen
to be measured can no longer be delimited with dia-phragms applied close to the specimen, and is maskedinstead on the the projected image of the specimen. Amask holder is mounted close to the sample beam en-trance of the phototube housing (Fig. 3). This holds aniris diaphragm which provides circular openings ad-justable in size; or the iris diaphragm can be replaced bycardboard masks with openings of various shapes andsizes. The phototube housing is pulled aside (cf. Fig. 1)and replaced with a ground glass screen. The images ofboth the specimen and the mask are projected onto thisscreen and by adjustment of the mechanical stage thespecimen is moved so that the mask delimits the portionof specimen to be measured.
MEASUREMENTS
The use and performance of this instrument are bestillustrated with specific examples. These involve macro-scopic measurements of portions of frog retina andmicroscopic measurements of single outer segments ofthe retinal rods.
Absorption Spectrum of a Frog Retina
As an example of the use of this instrument in macro-spectrophotometry, the procedure is described for meas-
0.8
0.6
1o0
-IJ
CD
_I-0.4
0.2
0
300
1004
September1961 SYSTEM FOR MICROS
uring the absorption spectrum of a patch of retina(cf. Fig. 4).6
The baseline is brought as close to zero as possiblewith the microcell containing only suspension mediumin place on the macroscope, and is recorded from 300to 700 mp. The macroscope is then removed from thespectrophotometer and the top condenser taken off.
A dark-adapted retina, containing the photosensitivevisual pigment rhodopsin, is dissected out in red lightand the whole retina or a portion of it is placed in themicrocell with the visual cells facing upward. The cell isfilled either with Ringer solution or with a denser mix-ture approximating the refractive index of the tissue, tominimize light scattering. The microcell is then placedover the masking diaphragm on the microscope stage.The monocular microscope is mounted in place of thetop condenser and, looking through this, an area ofretina is found in which the rods, seen end-on, form aregular mosaic. By focusing up and down one can makesure that the outer segments of the rods are vertical andhence parallel with the light beam. The monocularmicroscope is now removed, the quartz condenser re-placed, and the macroscope is set into the spectro-photometer. All these observations are made in red lightof wavelengths longer than 600 m/u.
With the spectrophotometer at 700 mt, the extinctionat that wavelength is recorded and the pen is adjustedto zero, if possible, with the Cary balance control. Thisadjustment compensates for light lost by scattering andreflection in the retina.
The sensitivity of the Cary spectrophotometer (volt-age applied to the photomultiplier tube) is adjusted sothat the slit width at 500 m/t is 0.1-0.2 mm. Under theseconditions spectra can be recorded with no measurablebleaching of visual pigment.
The spectrum is then recorded from 700-300 mu. Aresolution of 10 m/u per chart division requires about5 min to draw. Faster scanning speeds are used whenwanted.
Measuring spectra in a portion of retina involves somescattering and reflection of light. The quartz condenserswhich form the macroscope, however, are large com-pared with standard microscope objectives. The topcondenser gathers in almost all the light emerging fromthe retina. Whatever light escapes being brought to thephototube when the retina is in place seems to displacethe baseline about the same amount throughout thespectrum, so that it can be brought back into positionbodily by adjustment of the Cary balance control. Amore elaborate system might make this correction moreaccurately but this seems to do very well.
6 It should be said at once that we were encouraged to prepareto make measurements of this type by the pioneer work of E. J.Denton at the Marine Biological Station in Plymouth, England.Denton showed that spectrophotometric measurements on intactretinas can yield spectra of visual pigments that rival in accuracythe best work done in solution [cf. E. J. Denton, in Visual Prob-lems of Colour, National Physical Laboratory, Teddington, Eng-land, Symposium No. 8 (Her Majesty's Stationary Office, London,1958), p. 177; also Proc. Roy. Soc. (London) B150, 78 (1959)].
ECTRO PHOTO I ET RY 1005
A specific example of such a measurement is shown inFig. 4. It involves a frog retina immersed in frog-Ringersolution, the measurement being confined to a circulararea 0.2 mm in diameter. Curve 1 shows the baselinerecorded through the microcell containing Ringer solu-tion alone. Curve 2 is the absorption spectrum of thedark-adapted retina. It exhibits the a band of rhodopsin(Xmax about 503 mp), undistorted in shape or positionas compared with reasonably pure preparations of frogrhodopsin measured in solution.7 The general rise ofabsorption in the near ultraviolet is caused in large partby the rise of baseline in this region; but even here thesmall absorption band of rhodospin ( band; Xmax ca.355 mgu) is evident. After recording this spectrum, theretina was exposed for 5 min to radiation from theBausch & Lomb monochromator set at 500 my withslits 1 mm wide. Curve 3 shows that this partly bleachedthe rhodopsin to the usual mixture of retinene (Xmax ca.385 myi) and opsin, the extinction falling at wavelengthsbelow 428 m/i, simultaneously rising at shorter wave-lengths owing to the formation of retinene.
Absorption Spectra of Single Visual Cells
Examples of the microspectrophotometry of singleouter segments of frog rods-the retinal structures thatcontain rhodopsin-are shown in later figures (Figs.6-8). The outer segments are readily stroked off fromthe surface of a dark-adapted retina into the suspendingmedium. In the present instance isolated rods or wholeretinas were suspended in a solution of frog-Ringer saltsdissolved in a mixture of 55% glycerol in water. This
has about the same refractive index as the outer seg-ments and so minimizes the scattering of light.
transverse measuremen.
mecsuron
top viewend view
top view
FIG. 5. Masking of the images of single outer segments of frogrods for microspectrophotometry. The outer segment is roughlycylindrical, about 6 wide and 50 ,u long. The masking is done onthe projected image at the level of the photocell compartment.For transverse measurement an oblong mask is used that delimitsan area equivalent to 4X40 /i at the level of the outer segment.For axial measurements, in which the outer segments are viewedend-on, a circular mask is used that delimits an area 4,u in diameterat the level of the specimen.
7 G. Wald, J. Opt. Soc. Am. 41, 949 (1951).
I I
Vol. 51
400
I I I I I l l l l l l
_ Single frog rod+NH20H (transverse)-| - - I Ii If I I II .
500 600Wave length-rrmu
FIG. 6. Recorded spectra of a single outer segment of a frog rod, measured through the side. The outer segment is suspended in aglycerol-Ringer mixture that approximates the refractive index of the rod to minimize scattering of light, and also contains 0.1 molarhydroxylamine. Curve 1 is the recording, uncorrected for irregularities of base-line, of the spectrum of the dark-adapted rod; it showsthe rhodopsin maximum near 500 m. Curve 2 shows the result of exposing the rod for 10 min to intense light from the grating mono-chromator (500 mu, 2-mm slits). The rhodopsin has bleached completely, the extinction rising in the near ultraviolet owing to theformation of retinene oxime (,,ax 367 mu). By subtracting curve 2 from curve 1 one obtains the difference spectrum of rhodoDsin,which in the presence of hydroxylamine is identical with its absorption spectrum at wavelengths above about 440 mu.
The rod outer segments have the approximate form oflittle cylinders, about 6g wide and 50yu long. Two typesof measurement were performed: transverse measure-ments on isolated outer segments suspended as describedand lying on their sides so that the light passed throughthem laterally; and axial measurements in which wholeretinas were mounted so that the rods could be viewedend-on and the field masked down so as to lie entirelywithin the cross section of a single rod. In both casesthe masking was done on the images of the rods, pro-jected on a ground-glass screen at the level of the photo-
tube housing, as already described. The dimensions ofthe masks and their positions on the images of the outersegments are shown in Fig. 5.
Figure 6 shows recordings of transverse measurementsof a single rod outer segment, dark-adapted (curve 1),and after bleaching for 10 min with radiation from theBausch & Lomb monochromator set at 500 mu and withslits 2 mm wide (curve 2). In this instance hydroxyla-mine (NH20H) had been added to the glycerol-Ringersolution in which the rods were suspended in a finalconcentration of 0.1 M so that on bleaching the rho-
I \.i.. I 10.:
450 500 550
0.4
0.3
00-
).-
6b0
FIG. 7. Recorded spectraof a single frog rod, meas-ured axially in the wholeretina. Curve 1 is a tracing ofthe baseline, recorded withthe microcell filled with thesuspending medium alone(glycerol-Ringer). Curve 2is a tracing of the spectrumrecorded with the dark-adapted rod. Curve 3 is animmediate repetition of thelatter measurement, directlyrecorded by the instrument.It shows that some bleach-ing of rhodopsin accom-panies the recording of itsspectrum under these con-ditions. Curve 4 shows theresult of completely bleach-ing the rhodopsin by expos-ing the retina for 5 min tothe intense light of the Carysample beam, set at 500 muwith slits opened to 3 mm.
650Wave length- ru
1006
.0
I
0.2
0
0.6
0.6
0.4,.2
3JIA
X0.2
0.1
0400
- h l l l l -- l
I I .4
J 1 1 1 -4---io- |
A U L K . B R 0 W N
I- = ET :=1031 I
I lo.11
T -1---1 l 'v.-
- 11 I 1 1 40.:
SYSTEM FOR MICROSPECTROPHOTOMETRY 1007
0.8
FIG. 8. Spectra of a single frog rod,measured axially in the whole retina, re-corded from the red to the violet, andimmediately back again from the violetto the red, i.e., in the direction shown bythe arrow. The rod is suspended in glyc-erol-Ringer solution, containing 0.1 molarhydroxylamine. Curve 1 shows the pair ofspectra of the dark-adapted rod, display-ing the rhodopsin maximum near 500 mu,lower on the left than at the right owingto slight bleaching of rhodopsin in thecourse of the measurement. Curve 2 showsthe result of completely bleaching therhodopsin to retinene oxime by exposingthe retina for 5 min to the intense light ofCary sample beam, set at 500 mpt with3-mm slits. Subtraction of curve 2 fromcurve 1 yields a pair of difference spectra,each of which is slightly distorted owingto the bleaching that accompanies thismeasurement, but distorted in oppositedirections, so that the average of thesecurves yields a difference spectrum ofrhodopsin that approximates its truespectrum very closely.
0.6
Z:.040
$3
'04
0.2
0
600 S00
_ Single
- axial
400
frog rod-t +NHA
500 600
Wave length-mvu
dopsin, the retinene, as rapidly as liberated, combinedwith hydroxylamine to form retinene oxime (Xmax ca.367 mp).8 In such lateral measurements, the maximalextinction of rhodopsin is only about 0.04 on the aver-age; yet the rhodopsin band at about 500 mgz is recordedaccurately. On bleaching to retinene oxime, the extinc-tion falls in the neighborhood of 500 mgt and rises simul-taneously in the near ultraviolet. With the sample beammasked down to 4X40 for such measurements, asshown in Fig. 5, no appreciable bleaching of rhodopsinis caused by the recording of its spectrum.
Figure 7 shows absorption spectra of a single frogrod measured axially. Curves 3 and 4 are direct record-ings and curves 1 and 2 are tracings of such recordings.The need to close the sample beam at the level of thespecimen down to a circular cross section only 4 indiameter (cf. Fig. 5) strains the procedure further thanany other measurements we have yet undertaken. Thebaseline (curve 1) is no longer as flat as heretofore andsometimes cannot be brought to zero; nor, with theglass microscope we have been using can it be extendedbelow about 380 mg. Curve 2 shows the spectrum of the(lark-adapted rod and curve 3 is an immediate repetition
8 G. Wald and P. K. Brown, J. Gen. Physiol. 37, 189 (1953-54).
of the same measurement. Clearly in this instance therecording of the spectrum partly bleaches the rhodopsin,owing to the automatic opening wide of the Cary slits inresponse to the drastic closing down of the size of thesample beam, with a consequent great increase in itsintensity. Finally, this retina was bleached by irradiat-ing for 5 min at 500 mgu with the light of the Cary samplebeam itself, with the slits opened to 3 mm (curve 4).
Though such a measurement as this still displays thecharacteristic features of the rhodopsin spectrum, somedistortion is inevitably caused by the bleaching thatoccurs during the course of the measurement. To meetthis situation, we changed the procedure of axial meas-urement as follows.
In Fig. 8 the conditions are exactly as in the experi-ment of Fig. 7, except that 0.1 M hydroxylamine hadbeen added to the suspension medium. Curve 1 showsthe spectrum of the dark-adapted rod, measured firstfrom the red to the violet (as were all recordings pre-viously discussed) and then immediately back againfrom the violet to the red. It is clear from the fall ofextinction at 500 myt of the second spectrum that themeasurement has caused some bleaching; yet the com-parison of these two curves, in which distortions owingto bleaching are opposite in direction, specifies the limits
I
1007September 1961
I~~ II I °9
PAUL K. BROWN
within which the true absorption spectrum of the un-bleached pigment must lie. Fortunately the bleaching,and hence the distortion, are very moderate.
The spectra of Fig. 8 were also recorded 2.5 times asrapidly as heretofore-hence the compressed wave-length scale-in order to minimize exposure to themeasuring light; but this precaution proved to helprelatively little and more satisfactory records have sincebeen obtained at the slower recording speed.
After recording the two-way spectra of the unbleachedrod (Fig. 8, curve 1), the retina was exposed for 5 minto the light of the Cary sample beam set at 500 mmt withslits wide open (3 mm). This caused total bleaching toretinene oxime. The spectra of the bleached product(curve 2) were recorded in similar mirror-image fashion;
in this case, of course, the measurement involves nofurther bleaching and the spectra measured in the twodirections are identical. The difference spectra of frogrhodopsin obtained by subtracting curve 2 from curve 1and averaging the result can hardly be told apart froma difference spectrum measured in a large patch of retinain which no bleaching had occurred during the measure-ment. This procedure therefore yields reasonably ac-curate results.
Such measurements of retinas and single outer seg-ments and their significance will be discussed furtherelsewhere. Our major concern here has been to showwhat can be done with the present apparatus, using asan example a particularly demanding-since light-sensitive-type of object.
JOURNAL OF THE OPTICAL SOCIETY OF AMERICA VOLUME 51, NUMBER 9 SEPTEMBER, 1961
Large-Aperture Polarizers and Retardation Plates for Use in the Far Ultraviolet*M. N. MCDERMOTT AND R. Novicyt
Columbia Radiation Laboratory, Columbia University, New York, New York(Received October 17, 1960)
The ultraviolet properties of films that have useful polarizing properties at wavelengths as short as215 mu are reported. Large-diameter films may be obtained, and the material is not bleached by intenseultraviolet radiation. The use of stretched polyvinyl alcohol and cleaved mica sheets as retardation platesis reviewed.
WE have recently discovered that the polarizingfilms prepared by the Polacoat Company' have
useful polarization properties in the far-ultravioletregion of the spectrum. 2 These films are normally appliedto glass or plastic and coated with a protective layer oflacquer. The same material when coated on fuzed quartzwithout lacquer can be used to produce polarized lightat wavelengths at least as short as 215 m. For manyapplications these films are superior to calcite crystalpolarizers. They can be applied to large-diameter quartzdisks and they can be used in highly convergent light.These polarizers exhibit a higher transmittance andbetter extinction than the dyed and stretched polyvinylalcohol films described by Barer.3' 4
* Work supported in part by the U. S. Air Force monitored bythe Air Force Office of Scientific Research of the Air Researchand Development Command.
t Alfred P. Sloan Foundation Fellow.l Polacoat Incorporated, 9750 Conklin Road, Blue Ash 42, Ohio.2 For a general review of ultraviolet polarizers, see Y. Bouriau
and J. Lenoble, Rev. opt. 36, 531 (1957).R. Barer, J. Sci. Instr. 26, 325 (1949).We have recently learned that Dr. A. Makas of the Polaroid
Corporation has developed impsrovel experimental polarizers of1ihis Ilp)e ((lesignal ed as mn(lified tl)e FN"). The polarizinglroperties of this material are superior to those of the Polacoatmaterial at wavelengths greater than about 260 m. However,the Polaroid material rapidly bleaches under intense uv irradia-tion (see below).
In this note we report on the properties of threedifferent films prepared by the Polacoat Company andalso on the properties of two materials that may be usedfor the construction of retardation plates. The PolacoatCorporation has supplied only limited information onthe preparation of its polarizing films; however, thegeneral class of materials used and the methods ofpreparation can be inferred from a few of the patents'covering the Polacoat process. Three main steps areapparent. A supporting material, such as quartz, is firstrubbed along parallel lines. This produces minutescratches parallel to the rubbing direction. A solutionof one or more azo dyes (some 30 or more possible dyesand dye combinations are mentioned) is applied to therubbed material, then dried in a controlled fashion.Presumably, the conjugated double-bond structures ofthe azo dye molecule line up preferentially along therubbing direction, resulting in a greater absorption forlight polarized in that direction. As a final step, thesurface is treated with an acidic solution, often that of ametallic salt such as stannous chloride, a treatmentwhich has the effect in many cases of increasing thedichroism and producing a more neutral color. Furtherreferencesx to the preparation of polarizers by the appli-
J. F. Dreyer, U. S. Patents 2,400,877; 2,481,830; 2,544,659.H. Zocher and K. Coper, Z. physik. Chem. 132, 295 (1928),