A SYSTEMATIC STUDY OF DEPARTURES FROM CHEMICAL EQUILIBRIUM IN THE ATMOSPHERES OF SUBSTELLAR MASS OBJECTS Ivan Hubeny 1 and Adam Burrows 1 Received 2007 May 26; accepted 2007 August 3 ABSTRACT We present a systematic study of the spectral consequences of departures from chemical equilibrium in the atmo- spheres of L and T dwarfs, and for even cooler dwarfs. The temperature/pressure profiles of the nonequilibrium models are fully consistent with the nonequilibrium chemistry. Our grid of nonequilibrium models includes spectra for effec- tive temperatures from 200 to 1800 K, three surface gravities, four possible values of the coefficient of eddy diffusion in the radiative zone, and three different CO/CH 4 chemical reaction prescriptions. We also provide clear and cloudy model variants. We find, in keeping with previous studies, that there are essentially only two spectral regions where the effects of departures from chemical equilibrium can influence the predicted spectrum. These are in the M (4 Y 5 "m) and N (8 Y 14 "m) bands due to CO and NH 3 , respectively. The overabundance of CO translates into flux suppressions of at most 40% between effective temperatures of 600 and 1800 K. The effect is largest around T eA 1100 K. The underabundance of ammonia translates into flux enhancements of no more than 20% for the T eA range from 300 to1800 K, with the largest effects at the lowest values of T eA . The magnitude of the departure from chemical equilib- rium increases with decreasing gravity, with increasing eddy diffusion coefficient, and with decreasing speed of the CO/CH 4 reaction. Although these effects are modest, they lead to better fits with the measured T dwarf spectra. Fur- thermore, the suppression in the M band due to nonequilibrium enhancements in the CO abundance disappears below 500 K, and is only partial above 500 K, preserving the M-band flux as a useful diagnostic of cool atmospheres and maintaining its importance for searches for the cooler brown dwarfs beyond the T dwarfs. Subject headin gg s: stars: abundances — stars: atmospheres — stars: individual (Gliese 570D) — stars: low-mass, brown dwarfs 1. INTRODUCTION It has been long realized that departures from the local chem- ical equilibrium (LCE) may play a significant role in the atmo- spheres of the substellar-mass objects (SMOs), that is of giant planets and brown dwarfs. Essentially, some chemical reactions occurring in these atmospheres may be very slow, so that vertical transport via convective motions or eddy diffusion can lead to departures from LCE. The mechanism was first suggested to operate in the Jovian planets of the solar system (Prinn & Barshay 1977; Barshay & Lewis 1978; Fegley & Prinn 1985; Yung et al. 1988; Fegley & Lodders 1994). Fegley & Lodders (1996) suggested that the same mechanism can also operate in the atmospheres of brown dwarfs. Noll et al. (1997) studied in more detail the nonequilibrium enhancement of CO in the atmosphere of Gl 229B. Subsequently, Griffith & Yelle (1999) and Saumon et al. (2000) provided a more detailed analysis. The latter paper also suggested that a nonequilibrium depletion of NH 3 may be important. Saumon et al. (2003) dem- onstrated the effects of nonequilibrium chemistry for a range of effective temperatures (T eA between 800 and 1600 K). Recently, Saumon et al. (2006, 2007) showed that the nonequilibrium ef- fects in the carbon and nitrogen chemistry have significant ef- fects on the predicted spectrum of brown dwarfs, and in turn fit the observed spectrum of the T7.5 dwarfs Gliese 570D (Saumon et al. 2006) and 2MASS 0415 (Saumon et al. 2007) much better than models based on LCE. Finally, Leggett et al. (2007) extended the Saumon et al. (2006) models to a larger range of parameters, and presented a comparison of model predictions with observed infrared colors. In this paper, we extend and generalize the Saumon et al. and Leggett et al. treatments by computing a large grid of solar- metallicity models for effective temperatures T eA covering the whole domain of T and L dwarfs (700 Y 1800 K), as well as for cooler dwarfs (200 Y 700 K), for three values of surface gravity (log g ¼ 4:5; 5:0; 5:5 cm s 2 ), for several values of the coeffi- cient of eddy diffusion (see x 3.1), and for three different re- action rate timescales for the carbon reactions (see x 3.1). We compute self-consistent models in the sense that the atmospheric structure (T /P profile) is computed taking into account depar- tures from chemical equilibrium. We have computed two grids of models, one cloudless and one including clouds composed of sil- icate condensates. In x 2, we outline our procedures for computing model atmo- spheres, while allowing for departures from chemical equilibrium. In x 3, we present and analyze the predicted spectra computed with and without chemical equilibrium for L and T dwarfs. We explore the dependence on T eA , gravity, and eddy mixing coeffi- cient in the radiative zone and compare clear and representative cloudy models. We also discuss the effect of nonequilibrium chem- istry for objects cooler than the coolest T dwarfs down to effective temperatures of 200 K. Then, in x 4, we briefly present a compar- ison between theory and observation in the mid-IR for Gliese 570D. Finally, in x 5, we summarize our conclusions. 2. MODELING PROCEDURES 2.1. Nonequilibrium Carbon and Nitro gen Chemistry The chemistry of carbon and nitrogen in the atmospheres of SMOs is essentially described by the net reactions CO þ 3H 2 ! CH 4 þ H 2 O ð1Þ 1 Department of Astronomy and Steward Observatory, University of Arizona, Tucson, AZ 85721. 1248 The Astrophysical Journal, 669:1248 Y 1261, 2007 November 10 # 2007. The American Astronomical Society. All rights reserved. Printed in U.S.A.
Transcript
A SYSTEMATIC STUDY OF DEPARTURES FROM CHEMICAL EQUILIBRIUMIN THE ATMOSPHERES OF SUBSTELLAR MASS OBJECTS
Ivan Hubeny1and Adam Burrows
1
Received 2007 May 26; accepted 2007 August 3
ABSTRACT
We present a systematic study of the spectral consequences of departures from chemical equilibrium in the atmo-spheres of L and T dwarfs, and for even cooler dwarfs. The temperature/pressure profiles of the nonequilibriummodelsare fully consistent with the nonequilibrium chemistry. Our grid of nonequilibrium models includes spectra for effec-tive temperatures from 200 to 1800 K, three surface gravities, four possible values of the coefficient of eddy diffusionin the radiative zone, and three different CO/CH 4 chemical reaction prescriptions. We also provide clear and cloudymodel variants. We find, in keeping with previous studies, that there are essentially only two spectral regions wherethe effects of departures from chemical equilibrium can influence the predicted spectrum. These are in the M (�4Y5 �m)and N (8Y14 �m) bands due to CO and NH3, respectively. The overabundance of CO translates into flux suppressionsof at most�40% between effective temperatures of 600 and 1800 K. The effect is largest around TeA � 1100 K. Theunderabundance of ammonia translates into flux enhancements of no more than �20% for the TeA range from 300to1800 K, with the largest effects at the lowest values of TeA. The magnitude of the departure from chemical equilib-rium increases with decreasing gravity, with increasing eddy diffusion coefficient, and with decreasing speed of theCO/CH4 reaction. Although these effects are modest, they lead to better fits with the measured T dwarf spectra. Fur-thermore, the suppression in theM band due to nonequilibrium enhancements in the CO abundance disappears below�500K, and is only partial above�500 K, preserving theM-band flux as a useful diagnostic of cool atmospheres andmaintaining its importance for searches for the cooler brown dwarfs beyond the T dwarfs.
It has been long realized that departures from the local chem-ical equilibrium (LCE) may play a significant role in the atmo-spheres of the substellar-mass objects (SMOs), that is of giantplanets and brown dwarfs. Essentially, some chemical reactionsoccurring in these atmospheres may be very slow, so that verticaltransport via convective motions or eddy diffusion can lead todepartures from LCE. The mechanism was first suggested tooperate in the Jovian planets of the solar system (Prinn&Barshay1977; Barshay & Lewis 1978; Fegley & Prinn 1985; Yung et al.1988; Fegley & Lodders 1994).
Fegley & Lodders (1996) suggested that the same mechanismcan also operate in the atmospheres of brown dwarfs. Noll et al.(1997) studied in more detail the nonequilibrium enhancementof CO in the atmosphere of Gl 229B. Subsequently, Griffith &Yelle (1999) and Saumon et al. (2000) provided a more detailedanalysis. The latter paper also suggested that a nonequilibriumdepletion of NH3 may be important. Saumon et al. (2003) dem-onstrated the effects of nonequilibrium chemistry for a range ofeffective temperatures (TeA between 800 and 1600 K). Recently,Saumon et al. (2006, 2007) showed that the nonequilibrium ef-fects in the carbon and nitrogen chemistry have significant ef-fects on the predicted spectrum of brown dwarfs, and in turn fitthe observed spectrum of the T7.5 dwarfs Gliese 570D (Saumonet al. 2006) and 2MASS 0415 (Saumon et al. 2007) much betterthanmodels based onLCE. Finally, Leggett et al. (2007) extendedthe Saumon et al. (2006) models to a larger range of parameters,and presented a comparison of model predictions with observedinfrared colors.
In this paper, we extend and generalize the Saumon et al. andLeggett et al. treatments by computing a large grid of solar-metallicity models for effective temperatures TeA covering thewhole domain of T and L dwarfs (700Y1800 K), as well as forcooler dwarfs (200Y700 K), for three values of surface gravity( log g ¼ 4:5; 5:0; 5:5 cm s�2), for several values of the coeffi-cient of eddy diffusion (see x 3.1), and for three different re-action rate timescales for the carbon reactions (see x 3.1). Wecompute self-consistent models in the sense that the atmosphericstructure (T /P profile) is computed taking into account depar-tures from chemical equilibrium.We have computed two grids ofmodels, one cloudless and one including clouds composed of sil-icate condensates.In x 2, we outline our procedures for computing model atmo-
spheres,while allowing for departures from chemical equilibrium.In x 3, we present and analyze the predicted spectra computedwith and without chemical equilibrium for L and T dwarfs. Weexplore the dependence on TeA, gravity, and eddy mixing coeffi-cient in the radiative zone and compare clear and representativecloudymodels. We also discuss the effect of nonequilibrium chem-istry for objects cooler than the coolest T dwarfs down to effectivetemperatures of 200K. Then, in x 4, we briefly present a compar-ison between theory and observation in themid-IR forGliese 570D.Finally, in x 5, we summarize our conclusions.
2. MODELING PROCEDURES
2.1. Nonequilibrium Carbon and Nitrogen Chemistry
The chemistry of carbon and nitrogen in the atmospheres ofSMOs is essentially described by the net reactions
COþ 3H2 ! CH4 þ H2O ð1Þ1 Department of Astronomy and StewardObservatory, University of Arizona,
Tucson, AZ 85721.
1248
The Astrophysical Journal, 669:1248Y1261, 2007 November 10
# 2007. The American Astronomical Society. All rights reserved. Printed in U.S.A.
for carbon, and
N2 þ 3H2 ! 2NH3 ð2Þ
for nitrogen. Because of the strong C ¼ O and N � N bonds, thereactions (1) and (2) proceed much faster from right to left thanfrom left to right. For instance, for carbon the reaction in whichCO is converted to CH4 is very slow, and therefore CO can bevertically transported in the atmosphere to the upper and coolerregions by convectivemotions or eddy diffusion. The net result isan overabundance of CO and N2 and an underabundance of NH3
and CH4 in the upper atmosphere. Since more oxygen atoms arenow tied in CO, the mixing ratio of water is also reduced becauseof conservation of the total number of oxygen atoms.
The mixing (vertical transport) timescale, tmix, was suggestedby Griffith & Yelle (1999) to be parameterized by
tmix ¼ H 2=Kzz; ð3Þ
where H is the pressure scale height, and Kzz is the coefficientof eddy diffusion. Equation (3) applies in the radiative (convec-tively stable) zone. In the convection zone, the mixing time isgiven by (Saumon et al. 2006)
tmix ¼ 3Hc=vc; ð4Þ
whereHc is the convective mixing length (adopted here to be equalto H ), and vc is the convective velocity. We stress that while themixing time is well defined in the convection zone, it can only beroughly parameterized in the radiative zone. As discussed, e.g.,by Saumon et al. (2006, 2007), the reasonable values of Kzz arein the range 102Y106 cm2 s�1.
The chemical reaction timescale, tchem, generally decreases rap-idly with increasing pressure and temperature. In the atmosphericregions where tmix � tchem, the species acquire their equilibriummixing ratios. This occurs at temperatures and pressures largerthan that at the depth where tmix ¼ tchem. At smaller pressures, thespecies acquire mixing ratios equal to those at the tmix ¼ tchemlayer, as first suggested for the case of the CO/CH4 reaction byPrinn & Barshay (1977).
The nonequilibrium mixing ratios thus depend sensitively onthe chemical reaction timescales, which unfortunately are poorlyknown. For the N2 ! NH3 conversion, we adopt the timescalegiven by Lodders & Fegley (2002):
tchem � tN2¼ 1
�N2N H2ð Þ ;
�N2¼ 8:54 ; 10�8 exp � 81515
T
� �; ð5Þ
where �N2is the rate constant for the N2 ! NH3 reaction, and
N (H2) is the number density of H2.The reaction timescales for the CO! CH4 conversion are
uncertain because the correct chemical pathway is still unknown.Wewill therefore use three different timescales, suggested earlierin the literature:
(1) The ‘‘slow’’ chemical timescale after Prinn & Barshay(1977):
tchem � tCO ¼N COð Þ
�CON H2ð ÞN H2COð Þ ;
�CO ¼ 2:3 ; 10�10 exp � 36200
T
� �; ð6Þ
where N (M) is the number density of species M.
(2) and (3) The ‘‘fast’’ chemical timescale after Yung et al.(1988) or Dunning et al. (1984). In both cases the timescale isgiven by
tCO ¼N COð Þ
�7N Hð ÞN H2COð Þ ; ð7Þ
where the rate coefficient differs in each reference. We use tabu-lated values presented in Yung et al. (1988, their Table 3), and in-terpolate to current temperatures. In this paper, we call the Dunninget al. timescale ‘‘fast1,’’ and theYung et al. timescale ‘‘fast2.’’ Aswe shall show in x 3, these two fast timescales produce very sim-ilar results.
2.2. Atmosphere and Spectrum Modeling
Weuse the updated codeCOOLTLUSTY, described in Sudarskyet al. (2003), Hubeny et al. (2003), and Burrows et al. (2006, here-after BSH), which is a variant of the universal atmospheric codeTLUSTY (Hubeny 1988; Hubeny & Lanz 1995). COOLTLUSTYself-consistently solves a set of radiative transfer equations forselected frequency points (typically 5000 points logarithmicallyspaced between 7 ; 1014 Hz and 1012 Hz), and the equation ofradiative+convective equilibrium. The atmosphere is assumed tobe in hydrostatic equilibrium. The opacities are not computed onthe fly; instead, they are interpolated from precalculated opacitytables for the current values of temperature and density. Our opac-ity database is described in detail by Sharp & Burrows (2007).The atmospheric structure is computed iteratively, applying theNewton-Raphson method (first applied in the case of stellar at-mospheres by Auer & Mihalas 1969 with the name ‘‘completelinearization’’). The discretized and linearized equations are re-organized in the so-called Rybicki scheme (Mihalas 1978), whichrenders the computer time linearly proportional to the number offrequencies (and not proportional to the cube of the number offrequencies as in the case of the original complete linearization).This allows us to avoid using the accelerated lambda iteration(ALI) scheme to treat the radiative transfer equation, which leadsto faster andmore stable convergence, without compromising oncomputer time.
We have found that the most stable procedure to compute non-LCE models is to perform several iterations (typically six) of thelinearization method assuming chemical equilibrium (using thealgorithm of Burrows & Sharp [1999] to determine the equilib-rium abundances of all species), and then to switch the non-LCEalgorithm. In each subsequent iteration, one calculates the inter-section point where the mixing time for the current T /P profileequals the reaction time (computed again for the current T /P pro-file); the number densities of CO, CH4, H2O, and NH3 are set toconstant values equal to those found at the intersection points forpressures lower than the pressure at the intersection. The opac-ities in these regions are modified accordingly. The next iterationof the linearization scheme is then performed with the new opac-ities. The overall process usually converges in a few additionaliterations.
When clouds are taken into account, we employ the schemedescribed in BSH. In the case of L and T dwarfs, we represent in-dividual cloud decks of many condensate species by a single ex-tended cloud deck of one representative condensate. As in BSH,we take forsterite as a representative condensate, and assume thecloud deck to extend between the intersection of the condensationcurve of forsterite with the current T /P profile, and the pressurewhere the local temperature equals 2300 K (which schemati-cally represents the condensation curve of the most refractory
DEPARTURES FROM CHEMICAL EQUILIBRIUM 1249
condensate), and with exponential decreases of particle densityon both sides of the cloud. In the terminology of BSH, this is anE-type cloud. In all the present models, we assume the modalparticle size 100 �m.
3. RESULTS
3.1. L and T Dwarfs
Our effort has generated an extensive grid of nonequilibriummodel spectra for effective temperatures from 700 to 1800 K (insteps of 100K), for three values of surface gravity, g ¼ 104:5; 105:0,and 105.5 cm s�2, for four values of the coefficient of eddy diffu-sion in the radiative zoneKzz ¼ 102; 104; 106, and 108 cm2 s�1,and for three different CO/CH4 reaction time prescriptions.2 Wehave also provided clear and cloudy model variants. The latterassumes an E-type forsterite cloud with a modal particle size of100 �m. In the present paper, we consider only solar-compositionmodels, where the solar elemental abundances are from Asplundet al. (2006).
We will first discuss composition profiles and their trends witheffective temperature, surface gravity, diffusion coefficient, andthe CO/CH4 reaction speed. Figure 1 displays the compositionprofiles of the nonequilibrium species, CO, CH4, NH3, and H2O,as a function of the local temperature in the atmosphere, for arepresentative model with TeA ¼ 900 K, g ¼ 105:5 cm s�2, andKzz ¼ 104 cm2 s�1. The solid lines show the nonequilibriummole fractions or, equivalently, the number fractions (expressedas a fraction of the total number of particles), while the dashedlines show the equilibrium number fractions. For this model, the
nonequilibrium effects in water and methane are negligible. Thenonequilibrium number fraction of ammonia is smaller than theequilibrium one for T < 1200 K, as first shown by Saumon et al.(2006). The nonequilibrium mixing ratio of CO is significantlylarger than the equilibrium one, which in turn leads to a signifi-cant strengthening of the 4.7 �m feature (and, to a lesser extent,to other CO features at 3.4 and 2.8 �m) in nonequilibrium mod-els. Moreover, the nonequilibrium mixing ratio of CO is largerfor the slower CO/CH4 reaction, because the intersection of thetmix(T ) curve with the tCO(T ) curve occurs deeper in the atmo-sphere for higher temperature, where the equilibrium COmixingratio is higher (see also Fig. 5). Figure 1 is analogous to Figure 3of Saumon et al. (2006).To depict the trend of composition profiles with effective tem-
perature, we display in Figure 2 composition profiles as in Figure 1,but for TeA /100 K ¼ 8; 10; 12; 14; 16, and 18. To avoid clut-tering the figure, the models are not labeled by the values of TeA.Instead, the models are distinguished by the fact that the higherthe effective temperature is, the longer the curves continue to-ward high temperatures (i.e., to the right side of the plot). First,we stress that the equilibrium abundance patterns follow fromthe basic chemistry (Burrows & Sharp 1999; Lodders & Fegley2002), and are well understood. Briefly, the same local tempera-ture is reached at lower pressure for models with higher effectivetemperatures (see Fig. 7 for an explicit demonstration). Due toLe Chatelier’s principle, at a given local temperature the abun-dance of CH4 decreases and the abundance of CO increases withincreasing TeA. Analogously, the abundance of NH3 decreases,and the abundance of N2 (not shown here) increases with increas-ing TeA. These effects are clearly shown in Figure 2.For all models displayed here, the nonequilibrium effects in
water and methane are negligible. The nonequilibrium abundance
2 Electronic versions of these spectral models can be found online at http://zenith.as.arizona.edu/~burrows.
Fig. 1.—Comparison of the equilibrium (dashed lines) and nonequilibrium (solid lines) abundances of water (black line), methane ( yellow line), ammonia (redline), and CO (blue line), for a representative model with TeA ¼ 900 K, g ¼ 105:5 cm s�2, and Kzz ¼ 104 cm2 s�1. In this case, water and methane remain essentially attheir equilibrium abundances, while ammonia becomes underabundant at the upper layers ( leading to a lower opacity and, thus, higher predicted flux in the 8Y14 �mregion for nonequilibrium models). The plots also show that CO exhibits larger departures from equilibrium with the slow reaction. See Fig. 5 and the text for adiscussion.
HUBENY & BURROWS1250 Vol. 669
of CO is always larger than the equilibrium abundance for T P1000 K. For very low TeA, although the nonequilibrium abundanceof CO is significantly larger than the equilibrium abundance, itis still small in absolute value, and therefore does not have muchof an effect on the model structure and predicted spectra. For thehighest TeA, the equilibrium abundance profile of CO becomesflatter, and consequently the differences between the nonequilib-rium and equilibrium abundance profiles of CO decrease, and sodo the differences in the predicted spectra. This is demonstratedin Figure 8. For ammonia, departures from equilibrium becomesmaller for higher effective temperatures, because the equilibri-um ammonia composition profile becomes flat. Therefore, fixingthe ammonia number fraction at the intersection of the tmix andthe tNH3
curves does not lead to a significant difference in thecomposition. Therefore, the nonequilibrium effects in ammonia,and consequently in the predicted flux in the 8Y14 �m region,decrease with increasing TeA. This also is demonstrated in Figure 8.Moreover, because of its diminished number fraction, ammoniabecomes a less important source of opacity as the temperatureincreases.
In Figure 3, we show the trend of the composition profiles withthe surface gravity, for TeA ¼ 900 K,Kzz ¼ 104 cm2 s�1, and thefast CO/CH4 reaction. The intersection of the tmix and the tCOcurves occurs at essentially the same temperature for all threesurface gravities (see Fig. 4). However, at a given temperature,the model with the lowest gravity exhibits the lowest pressure,and therefore the CO mixing ratio at the intersection is higherfor the lower gravity models. Consequently, the effects of depar-tures from chemical equilibrium are greater for the low-gravitymodels.
Figure 4 displays the mixing time and the reaction times forthe models displayed in Figure 3. Notice the abrupt change of
the mixing time at T � 1800 K; this corresponds to the onset ofconvection, where the mixing times are about 5 orders of magni-tude faster. To explain the behavior of models with different coef-ficients of eddy diffusion, and with different reaction timescalesfor the CO/CH4 reaction, we display in Figure 5 the mixing timesfor four different diffusion coefficients,Kzz ¼ 102; 104; 106, and108 cm2 s�1. By increasing the coefficient of eddy diffusion, Kzz ,the mixing time decreases and, consequently, the intersection ofthe chemical reaction timescale curves and themixing time curveoccurs at higher temperatures. Therefore, the nonequilibriummixing ratio of CO is higher. For the N2/NH3 reaction, and forKzz > 104 cm2 s�1, the chemical time curve intersects the mix-ing time curve in the convection zone at very high temperature(T � 2100 K).
In Figure 6, we display trends of the chemical reaction timewith the effective temperature. The N2/NH3 reaction timescale isrelatively insensitive to the model effective temperature, whilefor the CO/CH4 reaction the intersection of the curves moves tohigher temperatures and pressures for higher effective tempera-tures. It would seem at first sight that the departures from chem-ical equilibrium would increase with increasing TeA. However,as we have shown in Figure 2, the abundance profile of CO be-comes flatter, and thus the departures from chemical equilibriumdecrease instead.
In Figure 7 we display the temperature/pressure profiles forselected models of our grid. The differences in the local tempera-ture between the equilibrium and nonequilibrium models are notlarge, but nevertheless appreciable.
We now turn to emergent spectra. In Figure 8 we display theemergent spectra for all effective temperatures, and for one repre-sentative value of g ¼ 105:5 cm s�2, for Kzz ¼ 104 cm2 s�1, andfor the slow reaction rate of the CO/CH4 reaction of Prinn &
Fig. 2.—Similar to Fig. 1, but with a range of effective temperatures to display the trends with TeA. The color scheme is the same as in Fig. 1. The association of theindividual lines with effective temperatures is made by noting that in the plot the lines corresponding to progressively lower effective temperatures end at progressivelylower local temperatures. ( In other words, the longer the lines go to the right, the higher the effective temperature is.) In all cases displayed here, water andmethane remainat their equilibrium abundances. The degree of departure from equilibrium for ammonia decreases with increasing effective temperature.
DEPARTURES FROM CHEMICAL EQUILIBRIUM 1251No. 2, 2007
Fig. 3.—Similar to Fig. 2, but showing the trend with changing surface gravity. This figure demonstrates that the nonequilibrium abundance of CO increases withdecreasing gravity. See explanation in the text.
Fig. 4.—Plot of the mixing time (solid lines), the reaction time for the CO/CH4 (dashed lines), and the reaction time for the NH3/N2 reaction (dash-dotted lines), formodels with TeA ¼ 900 K, Kzz ¼ 104 cm2 s�1, and log g (cm s�2) ¼ 5:5 (black lines), 5.0 (blue lines), and 4.5 (red lines). The abrupt change of the mixing-time curvesrepresents the boundary of the convection zone.
Barshay (1977). There are essentially only two wavelength re-gions where the departures from chemical equilibrium influencethe predicted spectrum, the region around 4.7 �m (due to non-equilibrium abundances of CO), and a wide region between 8 and14 �m, due to nonequilibrium abundances of NH3. The CO fea-ture has its peak for effective temperatures between 800 and1200 K; the effect generally decreases for hotter models andessentially disappears at 1800 K. The nonequilibrium effect ofammonia already disappears for TeAk 1200 K. The behaviorof the associated spectra is readily understood on examinationof the composition profiles displayed in Figures 1Y3 (see alsothe related discussion). Figure 8 is a synoptic display of the over-all model trends, but is not meant to communicate details of thepredicted spectra. Therefore we later present in Figures 11, 12,and 13 enlarged plots of the two nonequilibrium regions, the COregion between 3 and 5 �m, and the ammonia region between8 and 14�m. In these and subsequent figures that display the pre-
dicted spectra, we smooth the computed spectrum by a 10 pointboxcar average, which corresponds to a resolution of about 1/100.The corresponding models with clouds are displayed in Figure 9and behave analogously, thus demonstrating that the presence ofclouds does not lead to any qualitative differences in the magni-tude of departures from chemical equilibrium.
Figure 10 shows the sensitivity of the predicted spectrum tothe surface gravity. The nonequilibrium effects generally increasewith decreasing gravity, as was explained in the discussion of Fig-ure 3. Figure 11 presents a more detailed view of the CO non-equilibrium region between 3 and 5 �m, for one particular modelwith TeA ¼ 900 K and g ¼ 105:5 g cm�2. We display both theLCE model and four nonequilibrium models with Kzz ¼ 102;104; 106, and 108 cm2 s�1. All models are for the slow reactionrate of Prinn & Barshay (1977) for the CO/CH4 reaction. Ananalogous plot for the models with the fast2 reaction of Yunget al. (1988) is displayed in Figure 12. The magnitude of depar-tures from LCE increases significantly with increasing Kzz. Thisis because the mixing time decreases with increasing Kzz and,thus, the intersection of the tmix and the tCO curves occurs deeperin the atmosphere, where the mixing ratio of CO is larger. Thiswas already demonstrated in Figure 5. As Figure 12 shows, thedepartures from LCE are smaller for the faster CO/CH4 reactionrate, as demonstrated previously in Figure 1.
In Figure 13, we display a more detailed view of the ammoniaregion between 8 and 14 �m, for the samemodels as displayed inFigure 12. The departures from chemical equilibrium are essen-tially the same as predicted by Saumon et al. (2006, 2007). Un-like the case of CO, the abundance of ammonia, and thereforethe flux in the region between 8 and 14 �m, is relatively insen-sitive to the value ofKzz. This is because the abundance profile ofammonia is rather flat (see Figs. 1Y3), and therefore the depthof intersection of the tN2
and the tmix curves does not matter verymuch. The departures of ammonia from LCE are largely insensi-tive to the speed of the CO/CH4 reaction, as expected. We do notshow this in the figure because the corresponding plots are essen-tially identical. The predicted departures of NH3 from LCE seemto be quite robust.
To better display departures from chemical equilibrium, weplot in Figure 14 the ratio of the integrated flux between 4.4 and5 �m of the nonequilibrium and equilibrium models, as a func-tion of effective temperature. The top panel displays the depen-dence of the nonequilibrium ratio for g ¼ 105 cm s�2, for the
Fig. 5.—Similar to Fig. 4, but depicting the mixing times (solid lines) cor-responding to ( from top to bottom) the four values of the diffusion coefficient,Kzz ¼ 102; 104; 106, and 108 cm2 s�1, for models with TeA ¼ 900 K, and g ¼105:5 cm s�2. Also shown are the reaction times for CO/CH4 (dashed lines) chem-istry, for the three different treatments of the reaction speed, ‘‘slow,’’ ‘‘fast1,’’ and‘‘fast2’’ (the curves are labeled accordingly), and the reaction times for the NH3/N2
reaction (dash-dotted line).
Fig. 6.—Similar to Fig. 4, but depicting the mixing times (solid lines), andthe reaction times for CO/CH4 (dashed lines) for the fast2 reaction rate, and thereaction time for the NH3/N2 reaction (dash-dotted lines), for a set of modelswith g ¼ 105:5 cm s�2, Kzz ¼ 104 cm2 s�1, and TeA /100 K ¼ 9, 12, 15, and 18.The reaction times for CO/CH4 are labeled accordingly.
Fig. 7.—Comparison of temperature-pressure profiles for equilibrium (dashedlines) and nonequilibrium (solid lines) models of TeA ¼ 800; 1000; 1200; 1400;1600, and 1800 K ( from bottom to top). The value of g is equal to 105.5 cm s�2.
DEPARTURES FROM CHEMICAL EQUILIBRIUM 1253
Fig. 8.—Synoptic comparison of model atmosphere spectra computed with chemical equilibrium (black lines), and with departures from equilibrium (red lines), fora representative value of g ¼ 105:5 cm s�2, and Kzz ¼ 104 cm2 s�1, for a slow CO/CH4 reaction, and for effective temperatures between 700 and 1800 K, covering mostof the Tand L spectral types. There are essentially two wavelength regions where the departure from chemical equilibrium influences the predicted spectrum: the regionaround 4.7 �m (due to nonequilibrium abundances of CO), and a wide region between 8 and 14 �m, due to nonequilibrium abundances of NH3. The CO feature has itspeak for effective temperatures between 800 and 1200 K; the effect generally decreases for hotter models and essentially disappears at 1800 K. The figure is similar tothat presented by Saumon et al. (2003).
Fig. 9.—Same as Fig. 8; the only difference is that the models are computed with clouds. We assume a cloud composed of a collection of magnesium silicate com-pounds represented by a single species, in this case forsterite, with an extension of the cloud layer toward higher pressures, as suggested by BSH (E-type cloud model intheir notation). We assume a modal particle size of 100 �m. The presence of clouds leads to differences in the predicted spectrum, in particular for wavelengths below2.5 �m, but otherwise the effect of departures from chemical equilibrium is essentially the same as for the cloudless models.
1254
Fig. 10.—Comparison of predicted spectra for a model with TeA ¼ 900 K, Kzz ¼ 104 cm2 s�1, and three different surface gravities. We display the equilibriummodels (black lines), and nonequilibrium models (red lines) assuming the slow CO/CH4 reaction rate of Prinn & Barshay (1977). The plot also clearly shows that theeffects of departures from chemical equilibrium are more pronounced for lower gravities. See Fig. 1 and the text for explanations.
Fig. 11.—More detailed view of the CO nonequilibrium region between 3 and 5 �m, for models with TeA ¼ 900 K and g ¼ 105:5 cm s�2. Displayed are theequilibriummodel (black line) and four nonequilibriummodels withKzz ¼ 102 (blue line), 104 (red line), 106 ( yellow line), and 108 (green line) cm2 s�1. All models arefor the slow reaction rate for the CO/CH4 reaction of Prinn & Barshay (1977).
1255
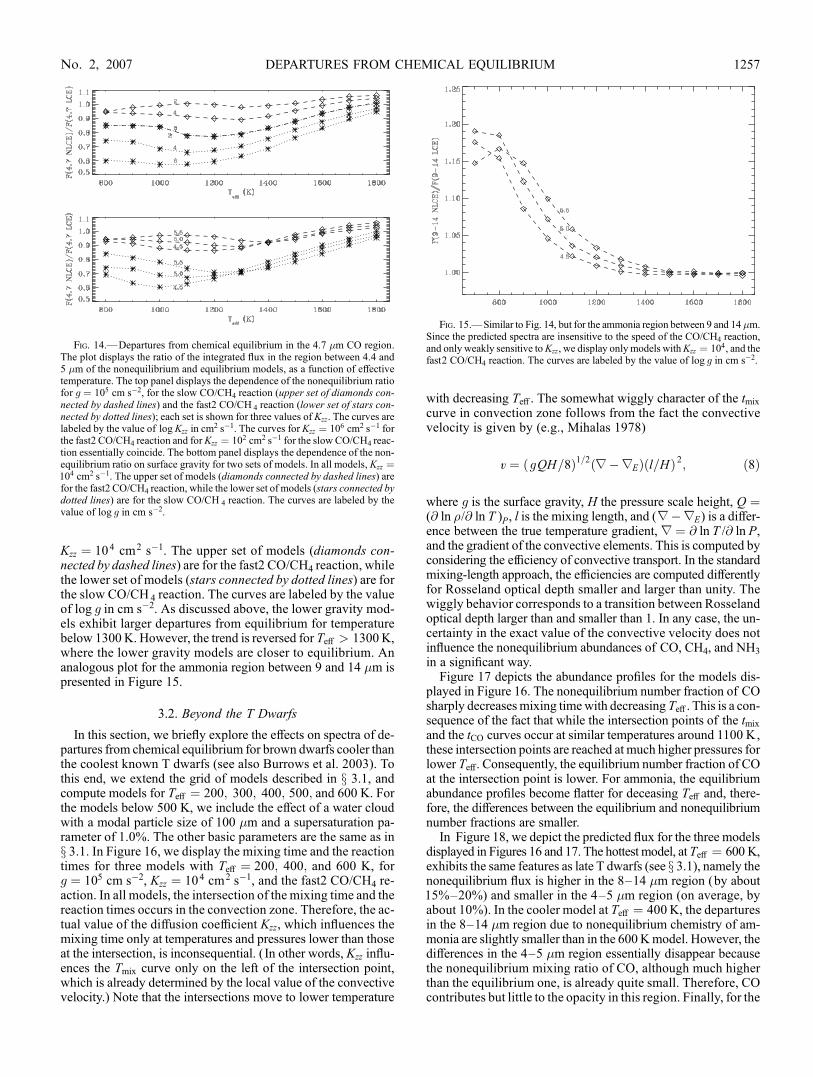
slow CO/CH4 reaction and the fast2 CO/CH4 reaction. Each setof models is computed for three values of Kzz. The curves arelabeled by the value of logKzz in cm
2 s�1. As discussed above,assuming the slow CO/CH 4 reaction increases the departuresfrom LCE significantly, reaching about 30% at TeA ¼ 1100 K
(at Kzz ¼ 104 cm2 s�1), and decreasing toward higher tempera-tures. For the slow2 reaction, the maximum effect is around TeA ¼1300 K, where it reaches about 10% (again, atKzz ¼ 104 cm2 s�1).The bottom panel displays the dependence of the nonequilibriumratio on surface gravity for two sets of models. In all models,
Fig. 12.—Similar to Fig. 11, but for the fast2 CO/CH4 reaction rate of Yung et al. (1988). Departures from equilibrium are now smaller, as explained in the text.
Fig. 13.—More detailed view of the ammonia region between 8 and 14 �m, for the same models as displayed in Fig. 12. The curves for all nonequilibrium modelsessentially coincide, except for the highest value of Kzz ¼ 108 cm2 s�1. The flux in the region between 8 and 14 �m is relatively insensitive to the value of Kzz .
HUBENY & BURROWS1256 Vol. 669
Kzz ¼ 104 cm2 s�1. The upper set of models (diamonds con-nected by dashed lines) are for the fast2 CO/CH4 reaction, whilethe lower set of models (stars connected by dotted lines) are forthe slow CO/CH4 reaction. The curves are labeled by the valueof log g in cm s�2. As discussed above, the lower gravity mod-els exhibit larger departures from equilibrium for temperaturebelow 1300 K. However, the trend is reversed for TeA > 1300 K,where the lower gravity models are closer to equilibrium. Ananalogous plot for the ammonia region between 9 and 14 �m ispresented in Figure 15.
3.2. Beyond the T Dwarfs
In this section, we briefly explore the effects on spectra of de-partures from chemical equilibrium for brown dwarfs cooler thanthe coolest known T dwarfs (see also Burrows et al. 2003). Tothis end, we extend the grid of models described in x 3.1, andcompute models for TeA ¼ 200; 300; 400; 500; and 600 K. Forthe models below 500 K, we include the effect of a water cloudwith a modal particle size of 100 �m and a supersaturation pa-rameter of 1.0%. The other basic parameters are the same as inx 3.1. In Figure 16, we display the mixing time and the reactiontimes for three models with TeA ¼ 200; 400; and 600 K, forg ¼ 105 cm s�2, Kzz ¼ 104 cm2 s�1, and the fast2 CO/CH4 re-action. In all models, the intersection of the mixing time and thereaction times occurs in the convection zone. Therefore, the ac-tual value of the diffusion coefficient Kzz, which influences themixing time only at temperatures and pressures lower than thoseat the intersection, is inconsequential. ( In other words, Kzz influ-ences the Tmix curve only on the left of the intersection point,which is already determined by the local value of the convectivevelocity.) Note that the intersections move to lower temperature
with decreasing TeA. The somewhat wiggly character of the tmix
curve in convection zone follows from the fact the convectivevelocity is given by (e.g., Mihalas 1978)
v ¼ gQH=8ð Þ1=2 9�9Eð Þ l=Hð Þ2; ð8Þ
where g is the surface gravity, H the pressure scale height, Q ¼(@ ln �/@ ln T )P, l is the mixing length, and (9�9E) is a differ-ence between the true temperature gradient, 9 ¼ @ ln T /@ ln P,and the gradient of the convective elements. This is computed byconsidering the efficiency of convective transport. In the standardmixing-length approach, the efficiencies are computed differentlyfor Rosseland optical depth smaller and larger than unity. Thewiggly behavior corresponds to a transition between Rosselandoptical depth larger than and smaller than 1. In any case, the un-certainty in the exact value of the convective velocity does notinfluence the nonequilibrium abundances of CO, CH4, and NH3
in a significant way.Figure 17 depicts the abundance profiles for the models dis-
played in Figure 16. The nonequilibrium number fraction of COsharply decreasesmixing timewith decreasing TeA. This is a con-sequence of the fact that while the intersection points of the tmix
and the tCO curves occur at similar temperatures around 1100 K,these intersection points are reached at much higher pressures forlower TeA. Consequently, the equilibrium number fraction of COat the intersection point is lower. For ammonia, the equilibriumabundance profiles become flatter for deceasing TeA and, there-fore, the differences between the equilibrium and nonequilibriumnumber fractions are smaller.
In Figure 18, we depict the predicted flux for the three modelsdisplayed in Figures 16 and 17. The hottest model, at TeA ¼ 600 K,exhibits the same features as late T dwarfs (see x 3.1), namely thenonequilibrium flux is higher in the 8Y14 �m region (by about15%Y20%) and smaller in the 4Y5 �m region (on average, byabout 10%). In the cooler model at TeA ¼ 400 K, the departuresin the 8Y14 �m region due to nonequilibrium chemistry of am-monia are slightly smaller than in the 600Kmodel. However, thedifferences in the 4Y5 �m region essentially disappear becausethe nonequilibrium mixing ratio of CO, although much higherthan the equilibrium one, is already quite small. Therefore, COcontributes but little to the opacity in this region. Finally, for the
Fig. 14.—Departures from chemical equilibrium in the 4.7 �m CO region.The plot displays the ratio of the integrated flux in the region between 4.4 and5 �m of the nonequilibrium and equilibrium models, as a function of effectivetemperature. The top panel displays the dependence of the nonequilibrium ratiofor g ¼ 105 cm s�2, for the slow CO/CH4 reaction (upper set of diamonds con-nected by dashed lines) and the fast2 CO/CH 4 reaction (lower set of stars con-nected by dotted lines); each set is shown for three values of Kzz. The curves arelabeled by the value of logKzz in cm
2 s�1. The curves for Kzz ¼ 106 cm2 s�1 forthe fast2 CO/CH4 reaction and forKzz ¼ 102 cm2 s�1 for the slow CO/CH4 reac-tion essentially coincide. The bottom panel displays the dependence of the non-equilibrium ratio on surface gravity for two sets of models. In all models, Kzz ¼104 cm2 s�1. The upper set of models (diamonds connected by dashed lines) arefor the fast2 CO/CH4 reaction, while the lower set of models (stars connected bydotted lines) are for the slow CO/CH 4 reaction. The curves are labeled by thevalue of log g in cm s�2.
Fig. 15.—Similar to Fig. 14, but for the ammonia region between 9 and 14 �m.Since the predicted spectra are insensitive to the speed of the CO/CH4 reaction,and only weakly sensitive toKzz, we display only models withKzz ¼ 104, and thefast2 CO/CH4 reaction. The curves are labeled by the value of log g in cm s�2.
DEPARTURES FROM CHEMICAL EQUILIBRIUM 1257No. 2, 2007
Fig. 16.—Plot of the mixing time (solid lines), the reaction time for the CO/CH4 (dashed lines), and the reaction time for the NH3/N2 reaction (dash-dotted lines), formodels with g ¼ 105 cm s�2, Kzz ¼ 104 cm2 s�1, and TeA ¼ 600 (black lines), 400 (blue lines), and 200 K (red lines).
Fig. 17.—Comparison of the equilibrium (dashed lines) and nonequilibrium (solid lines) abundances of water (black lines), methane ( yellow lines), ammonia (redlines), and CO (blue lines), for the same models as displayed in Fig. 16. Thin lines depict models for TeA ¼ 600 K, thicker lines for TeA ¼ 400 K, and the thickest linesfor TeA ¼ 200 K. The curves for CO are labeled by the value of TeA in K.
coolest model at TeA ¼ 200 K, the nonequilibrium effects almostdisappear in both the 4Y5 and 8Y14 �m regions.
To diagnose the trends described above, we display in Fig-ure 19 the temperature/pressure profiles for the samemodels (bothnonequilibrium and equilibrium) depicted in Figures 16Y18. In
Figure 20, we display the radiation formation temperature as afunction of wavelength for the two extreme models with TeA ¼200 and 600K. The radiation formation temperature is defined asa local temperature in the atmosphere where the monochromaticoptical depth is 2/3. This quantity indicates the position /layer from
Fig. 18.—Predicted flux for models with equilibrium (black lines) and nonequilibrium (red lines) models with g ¼ 105 cm s�2, Kzz ¼ 104 cm2 s�1, and TeA ¼ 600(top), 400 (middle), and 200 K (bottom).
Fig. 19.—Comparison of temperature-pressure profiles for equilibrium(dashed lines) and nonequilibrium (solid lines) models of TeA ¼ 600; 400, and200 K ( from top to bottom). The value of g is equal to 105 cm s�2.
Fig. 20.—Radiation formation temperature as a function of wavelength formodels with TeA ¼ 600 (upper curve) and 200 K (lower curve). The value of g isequal to 105 cm s�2.
DEPARTURES FROM CHEMICAL EQUILIBRIUM 1259
which a photon of a given wavelength effectively decouples fromthe atmosphere.
4. MODEL COMPARISONWITH GLIESE 570D OBSERVATIONS
In Figure 21, we display the observed spectrumof Gliese 570D,kindly supplied to us in digital form byM.Cushing (Cushing et al.2006). This is one of the latest known T dwarfs, and is the objectstudied by Saumon et al. (2006). We also display two theoreticalmodels computed for TeA ¼ 800 K and g ¼ 105 cm s�2, namelyanLCE and a non-LCEmodel. The nonequilibriummodel is com-puted with Kzz ¼ 104 cm2 s�1, and for the fast2 CO/CH4 reactionrate, but as demonstrated in Figure 13, this predicted flux es-sentially coincides with the flux computed for all other values ofKzz and CO/CH4 reaction time prescriptions. The agreement be-tween the observed and predicted spectrum for non-LCE modelis excellent in the region between 8 and 14 �m, while the fit ismuch worse for the LCE model. We thus confirm the results ofSaumon et al.3 In a future work, we will show comparisons be-tween our nonequilibrium spectral models and observations inthe near- and mid-IR of other late T dwarfs.
5. DISCUSSION AND CONCLUSIONS
In this paper, we have performed a systematic study of thespectral consequences of departures from chemical equilibriumin carbon and nitrogen chemistry in the atmospheres of L dwarfs,T dwarfs, and substellar-mass objects down to 200 K. Unlike
previous investigations, the temperature/pressure profiles of thenonequilibrium models are fully consistent with the nonequilib-rium chemistry. Such models reveal that failure to calculate thenonequilibrium atmospheric profiles in a self-consistent fashioncan result in errors of as much as�50Y100 K in the atmospherictemperatures at a given pressure. Our effort has generated an ex-tensive grid of nonequilibrium model spectra for effective tem-peratures from 700 to 1800K (in steps of 100K), for three valuesof surface gravity, g ¼ 104:5; 105:0, and 105.5 cm s�2, for fourvalues of the coefficient of eddy diffusion in the radiative zoneKzz ¼ 102; 104; 106, and 108 cm2 s�1, and for three differentCO/CH4 reaction time prescriptions. We have also provided clearand cloudy model variants. We find, in keeping with previousstudies, that there are essentially only two regions where the ef-fects of departures from chemical equilibrium significantly influ-ence the predicted spectrum. These are in the M (�4Y5 �m) andN (8Y14 �m) bands, due to CO and NH3, respectively. The over-abundance of CO can be very large, but translates into flux sup-pressions in the M band of at most �40% between effectivetemperatures of 800 and 1800 K. The effect is largest aroundTeA � 1100 K. The underabundance of ammonia can be signifi-cant, but translates into flux enhancements in the N band of nomore than�20% for the TeA range from 700 to 1800 K, with thelargest effects at the lowest values of TeA. The magnitude of thedeparture from chemical equilibrium increases with decreasinggravity, with increasing eddy diffusion coefficient, and with de-creasing speed of the CO/CH4 reaction. Although these effectsare modest, they lead to better fits with the measured T dwarfspectra (see also Saumon et al. 2006, 2007).In addition, we have calculated an exploratory sequence of
nonequilibrium models down to 200 K, including the possibleeffects of water cloud formation. These models show that in the
Fig. 21.—Comparison of observed and predicted spectra of Gl 570D. The thick black histogram displays the observed flux, the red and blue lines are the predictedspectra for nonequilibrium (red lines) and equilibrium (blue lines) models, computed for TeA ¼ 800 K and g ¼ 105 cm s�2. The nonequilibrium model displayed iscomputed with Kzz ¼ 104 cm2 s�1, and for fast CO/CH4 reaction rate but, as demonstrated in Fig. 13, this predicted flux essentially coincides with the flux computed forall other values of Kzz and CO/CH4 reaction time prescriptions.
3 Note that the predicted fluxes for both ourmodels and those of Saumon et al.(2006) are too low between 7 and 8 �m, for both LCE and non-LCEmodels. Thereason for this is unclear, but may be related to deficiencies in the extant wateropacity databases.
HUBENY & BURROWS1260 Vol. 669
region beyond the T dwarfs (Burrows et al. 2003) the suppres-sion effect of nonequilibrium CO in the M band diminishes, thendisappears, with decreasing TeA.
Hence, despite the modest suppression in the M band due tononequilibriumCO chemistry for TeA values above�500 K, non-equilibrium effects do not compromise the use of the M-band fluxas a useful diagnostic of cool atmospheres and as one of their mostprominent features. At the higher TeA values above�500 K, thisis due in part to the saturation of the augmented CO absorption,but importantly it is due to the fact that only about half of theM band overlaps with the 4.7 �mCO absorption feature. At lowerTeA values below �400 K, nonequilibrium effects in the M andN bands all but disappear. Overall, the prominence and impor-
tance of the M band flux for searches for the coolest dwarfs andfor brown dwarfs (‘‘Y’’ dwarfs?) beyond the T dwarf range is notsubstantially affected by nonequilibrium chemistry.
We thank M. Cushing, J. Budaj, and W. Hubbard for fruitfuldiscussions and help during the course of this work. We alsothank the referee, K. Lodders, for her detailed comments. Thisstudy was supported in part by NASA grants NAG5-10760,NNG05GG05G,NNG04GL22G, andNNX07AG80G, and throughthe NASA Astrobiology Institute under Cooperative AgreementCAN-02-OSS-02, issued through the Office of Space Science.
REFERENCES
Asplund, M., Grevesse, N., & Sauval, A. J. 2006, Commun. Asteroseis., 147, 76Auer, L. H., & Mihalas, D. 1969, ApJ, 158, 641Barshay, S. S., & Lewis, J. S. 1978, Icarus, 33, 593Burrows, A., & Sharp, C. M. 1999, ApJ, 512, 843Burrows, A., Sudarsky, D., & Hubeny, I. 2006, ApJ, 640, 1063Burrows, A., Sudarsky, D., & Lunine, J. I. 2003, ApJ, 596, 587Cushing, M. C., et al. 2006, ApJ, 648, 614Dunning, T. H., Harding, L. B., & Wagner, A. F. 1984, in Texas A&M Symp.,Theory and Modeling for Materials Design (College Station: Texas A&MUniv.)
Fegley, B., Jr., & Lodders, K. 1994, Icarus, 110, 117———. 1996, ApJ, 472, L37Fegley, B., Jr., & Prinn, R. G. 1985, ApJ, 299, 1067Griffith, C. A., & Yelle, R. V. 1999, ApJ, 519, L85Hubeny, I. 1988, Comput. Phys. Commun., 52, 103Hubeny, I., Burrows, A., & Sudarsky, D. 2003, ApJ, 594, 1011Hubeny, I., & Lanz, T. 1995, ApJ, 439, 875
Leggett, S. K., Saumon, D., Marley, M. S., Geballe, T. R., Golimowski, D. A.,Stephens, D., & Fan, X. 2007, ApJ, 655, 1079
Lodders, K., & Fegley, B., Jr. 2002, Icarus, 155, 393Mihalas, D. 1978, Stellar Atmospheres (2nd ed.; San Francisco: Freeman)Noll, K. S., Geballe, T. R., & Marley, M. S. 1997, ApJ, 489, L87Prinn, G. G., & Barshay, S. S. 1977, Science, 198, 1031Saumon, D., Geballe, T. R., Leggett, S. K., Marley, M. S., Freedman, R. S.,Lodders, K., Fegley, B., Jr., & Sengupta, S. K. 2000, ApJ, 541, 374
Saumon, D., Marley, M. S., Cushing, M. C., Leggett, S. K., Roellig, T. L.,Lodders, K., & Freedman, R. S. 2006, ApJ, 647, 552
Saumon, D., Marley, M. S., Lodders, K., & Freedman, R. S. 2003, in IAUSymp. 211, Brown Dwarfs, ed. E. Martı́n (San Francisco: ASP), 345
Saumon, D., et al. 2007, ApJ, 656, 1136Sharp, C. M., & Burrows, A. 2007, ApJS, 168, 140Sudarsky, D., Burrows, A., & Hubeny, I. 2003, ApJ, 588, 1121Yung, Y. L., Drew, W. A., Pinto, J. P., & Friedl, R. R. 1988, Icarus, 73, 516
DEPARTURES FROM CHEMICAL EQUILIBRIUM 1261No. 2, 2007