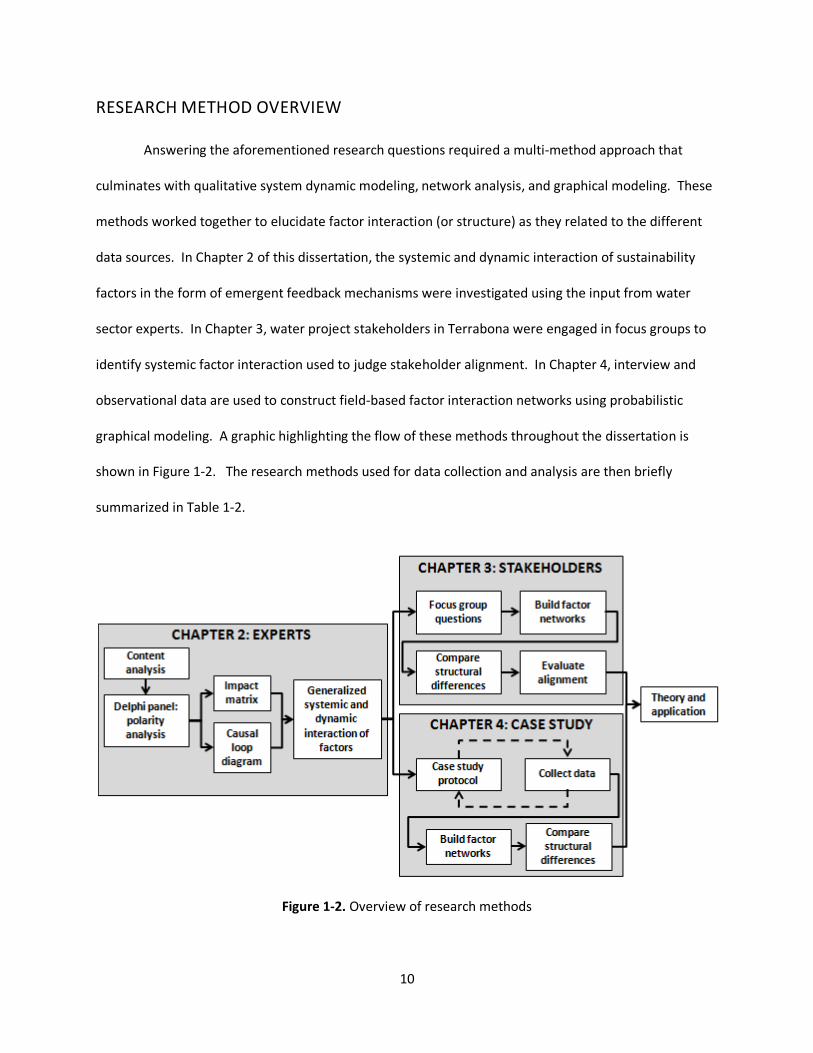
A SYSTEMS APPROACH TO SUSTAINABLE RURAL WATER INFRASTRUCTURE IN DEVELOPING COUNTRIES By Jeffrey Paul Walters B.S. University of Washington, Civil Engineering, 2005 M.S. University of Washington, Structural Engineering, 2007 M.S. University of Colorado Boulder, Environmental Engineering, 2012 A thesis submitted to the Faculty of the Graduate School of the University of Colorado in partial fulfillment Of the requirements of the degree of Doctor of Philosophy Department of Civil, Environmental and Architectural Engineering 2015
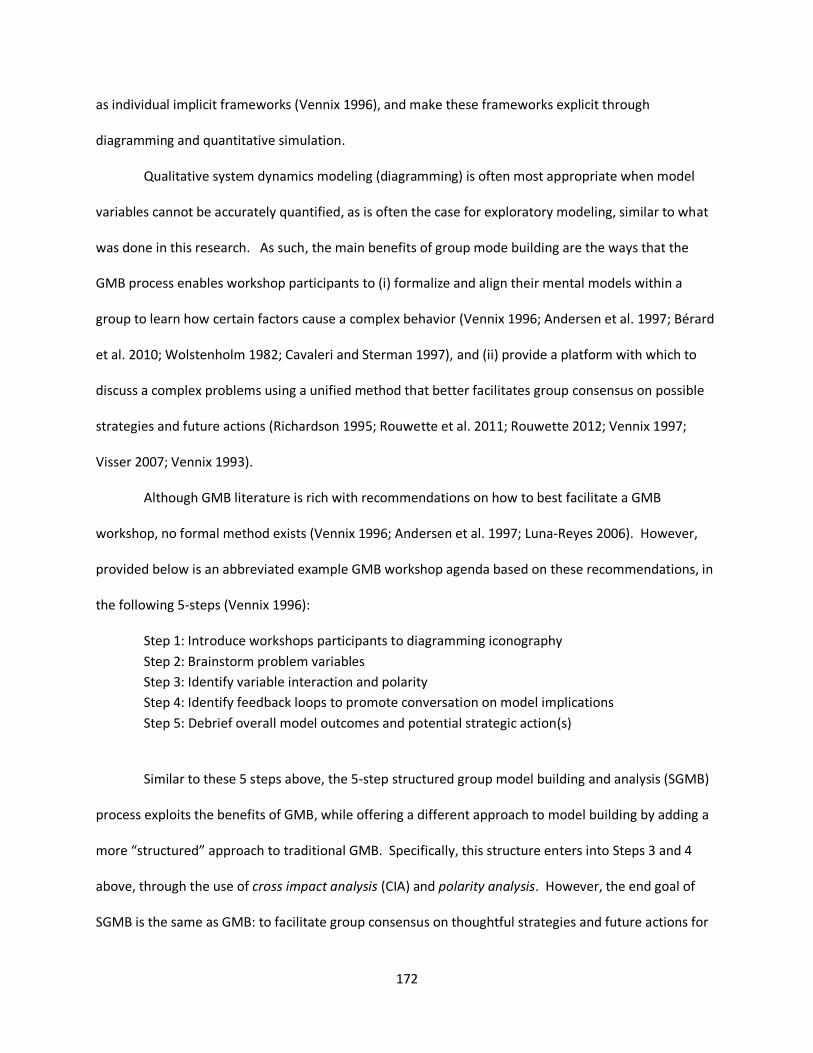
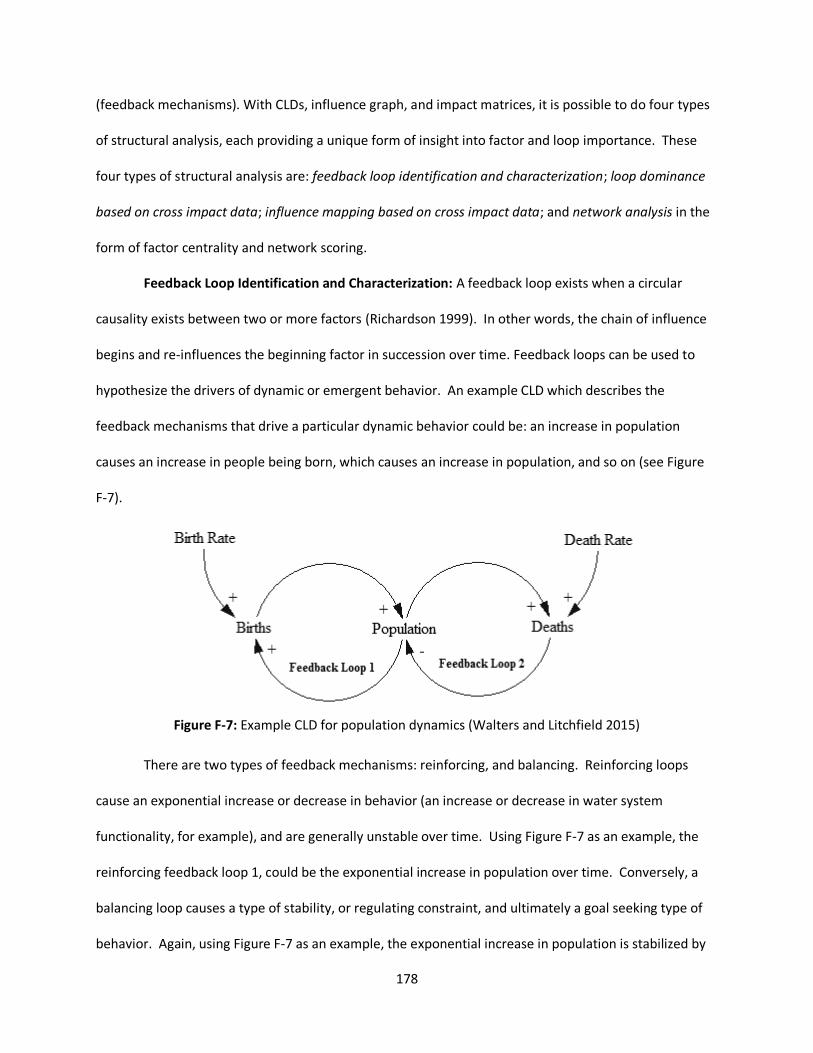
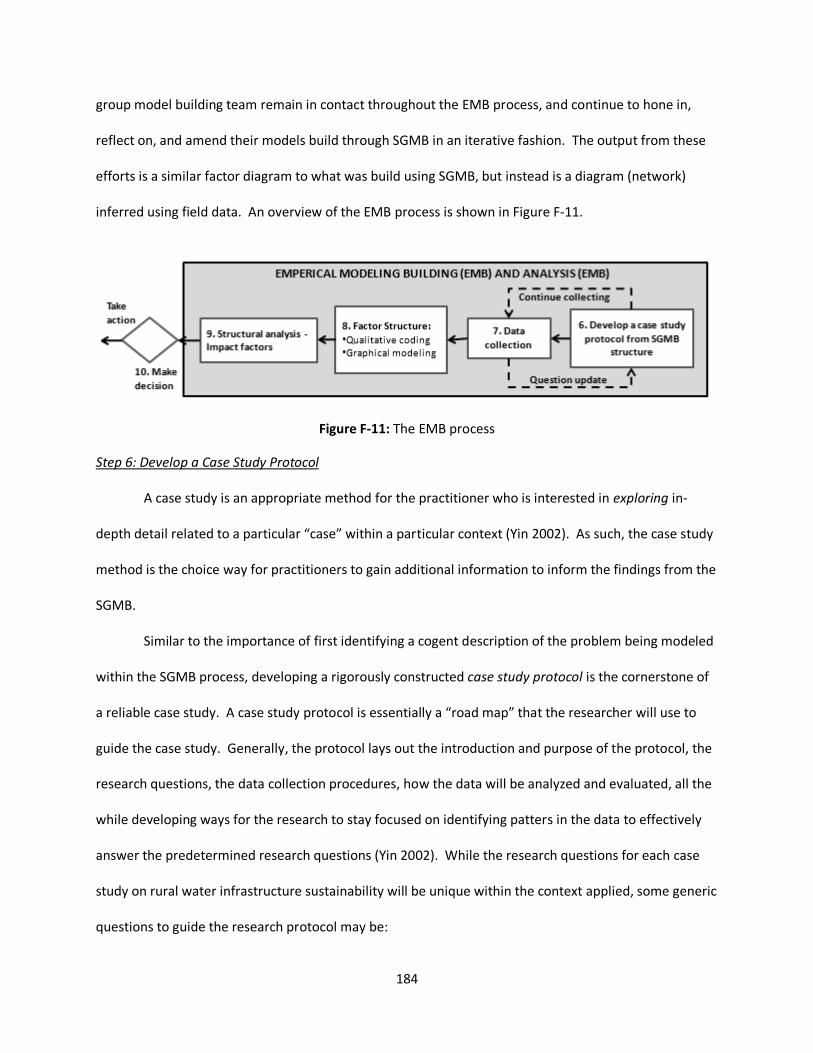
Transcript
A SYSTEMS APPROACH TO SUSTAINABLE RURAL WATER INFRASTRUCTURE IN
DEVELOPING COUNTRIES
By
Jeffrey Paul Walters
B.S. University of Washington, Civil Engineering, 2005
M.S. University of Washington, Structural Engineering, 2007
M.S. University of Colorado Boulder, Environmental Engineering, 2012
A thesis submitted to the
Faculty of the Graduate School of the
University of Colorado in partial fulfillment
Of the requirements of the degree of
Doctor of Philosophy
Department of Civil, Environmental and Architectural Engineering
2015
This thesis entitled: A Systems Approach to Sustainable Rural Water Infrastructure in Developing
Countries
written by Jeffrey Paul Walters
has been approved for the Department of Civil, Environmental and Architectural Engineering
________________________________
Dr. Bernard Amadei
(committee chair)
________________________________
Dr. Paul Chinowsky
(committee co-chair)
_______________________________
Dr. Amy Javernick-Will
(committee co-chair)
________________________________
Dr. Rita Klees
________________________________
Dr. Susan Bolton
________________________________
Dr. Joseph Kasprzyk
Date_______________
The final copy of this thesis has been examined by the signatories, and we find that
both the content and the form meet acceptable presentation standards of scholarly
work in the above mentioned discipline.
IRB protocol #13-0705
iii
ABSTRACT
Walters, Jeffrey Paul (Ph.D., Civil, Environmental & Architectural Engineering)
A Systems Approach to Sustainable Rural Water Infrastructure in Developing Countries
Dissertation directed by Dr. Bernard Amadei
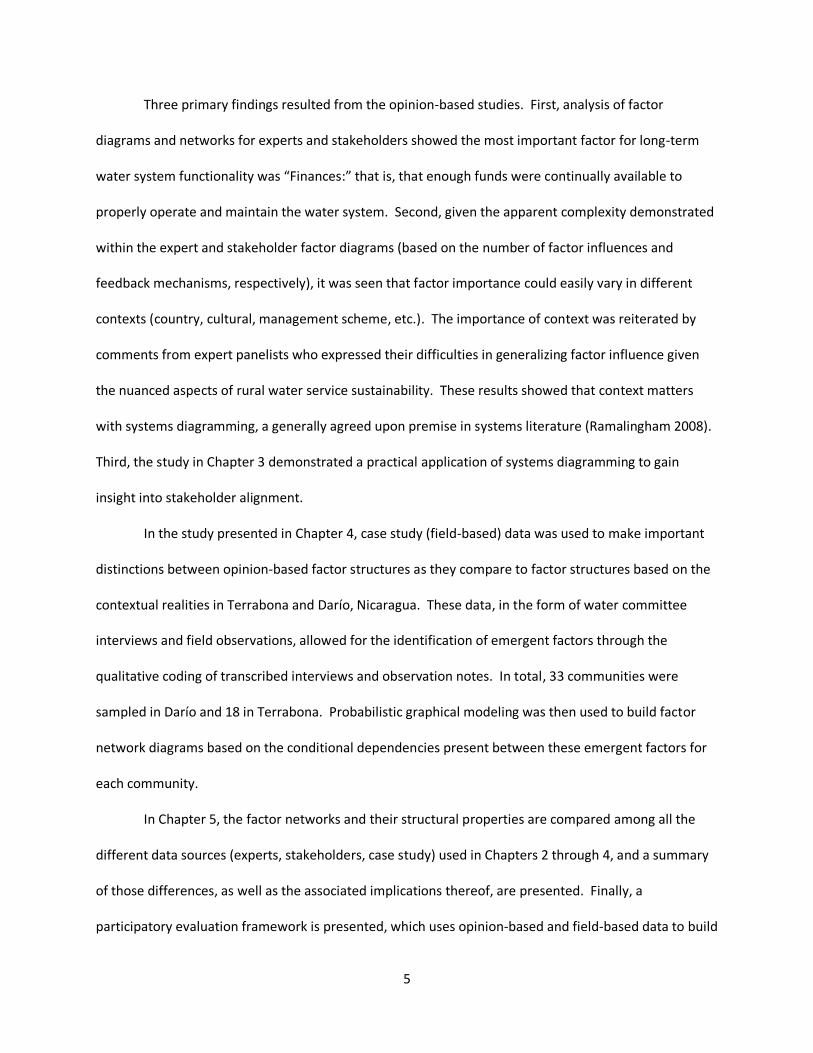
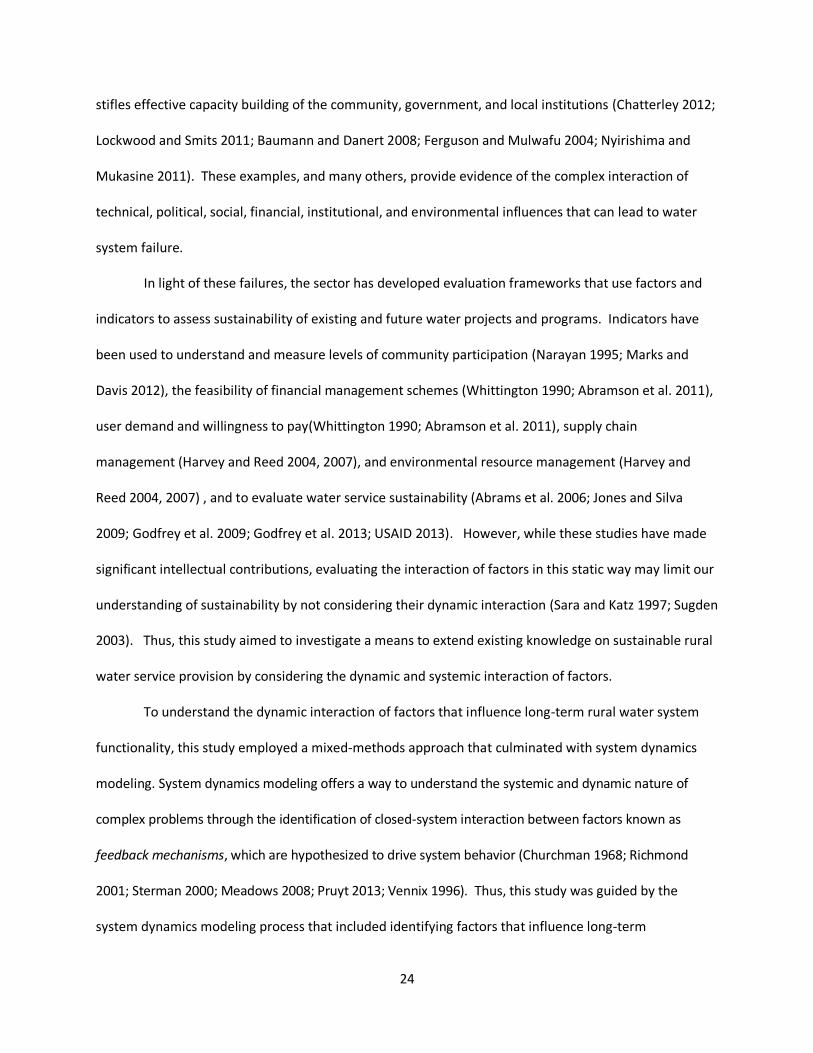
Failure of rural water infrastructure in developing countries is often caused by the systemic
interaction of technical, social, financial, institutional, and environmental factors. Unfortunately, current
approaches for the planning and evaluation of sustainable rural water services in developing countries
are unable to adequately interpret and adapt to the complex interactions of these factors. Thus, the
aim of this research was to investigate a systems approach to better consider these inherent
complexities through modeling the systemic interaction of influential factors. The overarching research
question asks how do factors interact as a system to influence rural water system sustainability in
developing countries? To answer this question, this research began with a systematic review of water
sector literature to identify factors that influence the long-term functionality of rural water
infrastructure in developing countries. Through this systematic literature review, it was possible to
identify a list of important factors the author called “sustainability factors”. Using a panel of water
sector experts involved in Delphi survey and cross impact questionnaire study, it was then possible to
model the interaction of these sustainability factors as a system. The culmination of this work (Chapter
2) presented a causal loop diagram that described the critical areas of factor interaction by identifying
dominant feedback mechanisms. The dominant feedback mechanism was found to influence water
system functionality through the community involvement with system maintenance, proper finances for
operation and maintenance, and effective water system management. However, the study also found a
multitude of feedback mechanisms that could be equally influential within a particular regional context.
iv
Thus, the next step of this research entailed the use of focus groups to gather opinion-based data on
factor interaction from water project stakeholders in Terrabona, Nicaragua. This work (Chapter 3)
allowed for context-based evaluation of factor influences in the form of stakeholder value networks.
Specifically, this study presented a compelling use of systems diagramming to gain insight into
stakeholder alignment. This study ended with a petition for future research that would verify whether
these stakeholder value networks truly provide accurate representations of stakeholder alignment
compared with the true interaction of factors that influence rural water system functionality in the field.
As such, the last step of this research was to identify field-based factor interaction using field-based
evidence from water systems in Darío and Terrabona, Nicaracua (Chapter 4). Using graphical modeling,
this last study used interview data gathered from water committee members to build factor networks
based on conditional dependence between factors. The study showed a dramatic difference in factor
interaction between Darío and Terrabona, and demonstrated the impact of regional context on factor
influence. In summary, this doctoral research presents both practical and theoretical contributions to
the field of rural water development by demonstrating the usefulness of systems-based methods to
understand project complexity. Future research, which further tests the ability of these tools to predict
project success and foster holistic learning, will certainly prove a worthy endeavor for future researchers
and practitioners.
v
ACKNOWLEDGMENTS
The dissertation you are about to read is not solely my own work, but the cumulative product of
hours upon hours of guidance, editing, and “wordsmithing” from my advisors and colleagues. Truly, it is
quite possible that every word you read in this dissertation has been somehow touched and inspired by
more than 6 other people. And, let us not even begin to acknowledge the many scholars I have been
inspired by, whose words I have quoted, and whose shoulders I have stood on to see farther – or merely
look down from to see – to my dismay – how far I have climbed without a rope. It is my honest opinion
that each and every individual within Amy and Paul’s research groups (including Maryanne Fantalis!)
should place their name on this document right next to mine, and be given an honorary doctorate.
The words in this dissertation pay insufficient homage to the hidden stories it could tell if given
the chance. It would tell of my personal doubt and crippling despair that at times left me paralyzed and
unable to do this research. It would tell of innumerable red-eyed mornings at Bittersweet in Louisville
drinking coffee that was, ironically, quite bitter, but not all that sweet. It would tell of the frequent days
my wife Jessie and daughter Rayna had to “understand” I was working. It would tell of the laughter in
the grad office about some stupid (and yet glorious) YouTube video of screaming goats and Taylor Swift;
how so often my wrinkled and tired brow would be given much needed respite by a light-hearted belly-
laugh with my colleagues. It would tell of the successes and failures of each of the papers within the
main dissertation body; of the down-right mean comments of blind reviewers; and the encouraging
accolades from people that kept me going.
Indeed, the typed words in this dissertation are a façade, a shell, covering richer things with
academic lingo and form:
The richness of meeting with my advisor, Dr. Bernard Amadei, and co-advisors, Dr.Paul Chinowsky,
and Dr. Amy Javernick-Will; meeting with Bernard to passionately discuss the implications of
systems-thinking for sustainable development, a topic he inspired me to investigate some 3 years
vi
ago; meeting with Paul to gain invaluable wisdom about what it takes to be a good academic and
father; meeting with Amy to be inspired to write better, to work harder, and to stay on track. Truly,
I owe more to Amy than there are words to do justice, and hope she knows by now how impactful
she is in the lives of her students.
The richness of connecting and learning important lessons from my colleagues in the grad lounge,
the C4C, the CEM office, and ECCE161 grad citadel; learning from Kaitlin, John, and Jessica about
what it takes to write a rigorous research paper, while keeping an eternal perspective; learning from
Xavi, Cristina, and Wesam that academia is a world-wide pursuit towards excellence; learning from
Amy, Sarah and (Real) Laura how life-giving baked goods and Keurig coffee can be; and, learning
from Kyle how meaningful and impactful it can be to have a hetero-life-partner in the office during
times of tribulation.
The richness of depending on my friends and family, and leaning on them for support over these
past years; leaning on my father for his unwavering support during my tumultuous time in college,
appreciating that he frequently (but not always) abstained from singing George Thorogood’s “Get a
Haircut” –“get a haircut, and get a real job”; leaning on Jessie, a person I love and respect more than
I could have ever imagined, the cornerstone of our family; leaning on Pat, Justin and the rest of my
Rootz BOCs, who bi-weekly (to Pat’s chagrin) give me encouragement and flatulence-induced
laughter.
Lastly, I am so thankful for having been given the financial means at CU-Boulder to do this PhD.
I am thankful for the folks in the NSF GK-12 Graduate Teaching Fellowship program who let me work
along-side them for a year teaching 6th, 7th, and 8th grade STEM. Additionally, I am deeply thankful to
Paul, Bernard, and the Mortenson Family for two years of funding to do my research as a Mortenson
Fellow in Engineering for Developing Communities. It is my most sincere hope that they are all satisfied
with their decision to invest in my education and career.
vii
TABLE OF CONTENTS
ABSTRACT .................................................................................................................................. iii
ACKNOWLEDGMENTS ................................................................................................................. v
TABLE OF CONTENTS ................................................................................................................ vii
LIST OF TABLES ........................................................................................................................... x
LIST OF FIGURES ........................................................................................................................ xi
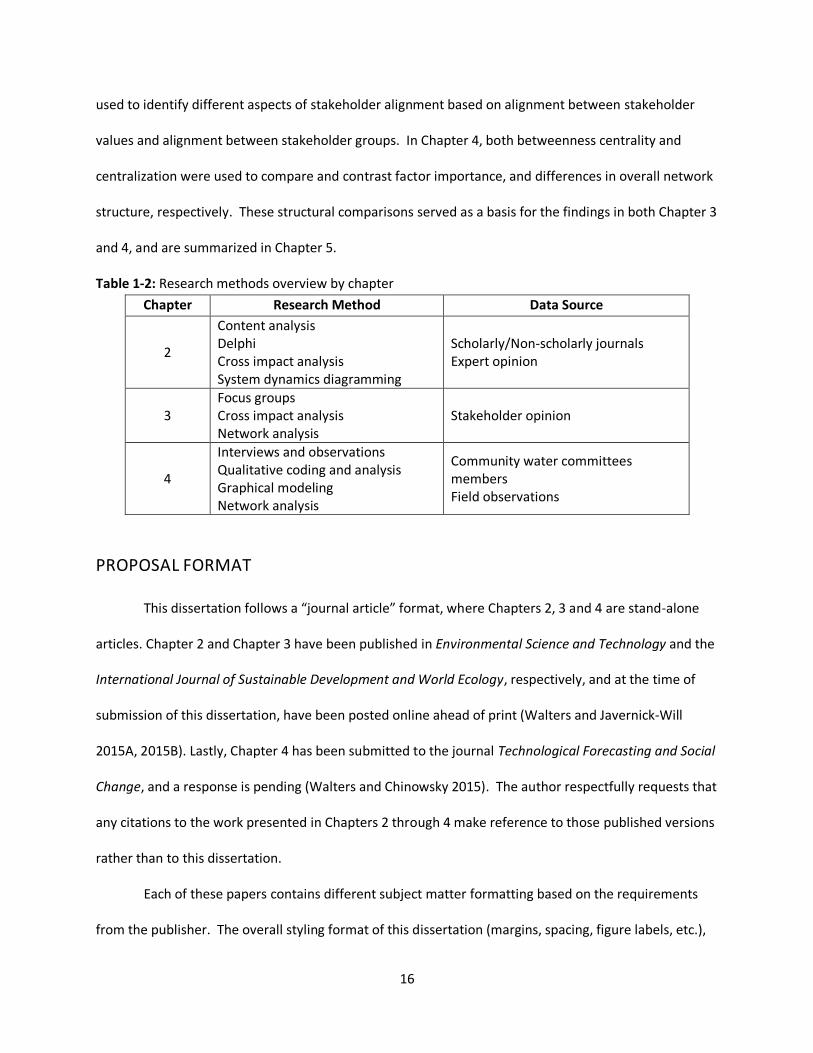
Scott, J. (2000). “Social Network Analysis: A Handbook.” SAGE Publications Ltd, 2nd Edition, March 2000.
Srikanth, R. (2009). “Challenges of sustainable water quality management in rural India.” Current
Science, 97(3) August.
Sterman, J. (2000). “Business Dynamics: Systems Thinking and Modeling for a Complex World.”
McGraw-Hill/Irwin.
Stewart, D. W. (2014). “Focus Groups: Theory and Practice.” SAGE publications, Inc., 3rd Edition, March
20, 2014.
Sugden, S. (2001). “Assessing sustainability – the sustainability snap shot.” 27th WEDC Conference:
People and Systems for Water, Sanitation and Health. Lusaka, Zambia 2001.
Sugden, S. (2003). “Indicators for the water sector: example from Malawi.” WaterAid Reporting.
20
Torres, N., and Olaya, C. (2010). “Tackling the Mess: System Conceptualization through Cross-Impact
Analysis.” System Dynamics Society Conference Proceedings.
United Nations (UN) Secretary-General’s High-level Panel on Global Sustainability (2012). “Resilient
People, Resilient Planet: A future worth choosing.” New York: United Nations.
USAID (2013). “WASH Sustainability Index Too.”
USAID (2014). “Local Systems: A Framework for Supporting Sustained Development.” April 2014.
Veeman, T.S., and Politylo, J. (2003). “The role of institutions and policy in enhancing sustainable
development and conserving natural capital.” Environment, Development and Sustainability, 5
(3) 317-332.
Vennix, J.A.(1996). “Group Model Building: Facilitating Team Learning Using System Dynamics.” Wiley,
1st edition. August 1996.
Walters, J.P., and Chinowsky, P. (2015). “Strategic Panning of Rural Water Development in Nicaragua: A
Systems-based Understanding of Local Impact Factors.” Technological Forecasting and Social
Change. Manuscript submitted and pending response.
Walters, J.P., and Javernick-Will, A.N. (2015A). “Long-term Functionality of Rural Water Services in Developing Countries: A System Dynamics Approach to Understanding the Dynamic Interaction of Factors.” Environmental Science and Technology, DOI: 10.1021/es505975h.
Walters, J.P., and Javernick-Will, A.N. (2015B). “Management of Rural Water Services in Nicaragua: A
Systemic Network Approach to Evaluating Stakeholder Alignment.” International Journal of
Sustainable Development &World Ecology, DOI: 10.1080/13504509.2015.1053999
WASH Sustainability Charter (2013). Sustainablewash.org
Wasserman, S., and Fraust, K. (1994). “Social Network Analysis: Methods and Application – Structural
Analysis in the Social Sciences (Book 8).” Cambridge University Press. 1st Edition, November 25,
1994.
WaterAid 2011. “Sustainability Framework.”
Whittaker, J. (1990). “Graphical Models in Applied Multivariate Statistics.” Wiley Series in Probability &
Statistics. 1st Edition.
Whittington, D., Davis, J. , Prokopy, L., Komives, K., Thorston, R., Lukacs, H., Bakalian, A., and Wakeman,
W. (2009). “How well is the demand-driven, community management model for rural water
systems doing? Evidence from Bolivia, Peru and Ghana.” Water Policy, 11, 696-718.
Williamson, T., Agha, Z. K., Bjornstad, L., Twijukye, G., Mahwago, Y., and Kabelwa, G. (2008). “Building
Blocks or Stumbling Blocks? The Effectiveness of New Approaches to Aid Delivery at the Sector
Level.” Overseas Development Institute. Working Paper 6.
21
Wolstenholme, E. (1990). “System Enquiry: A System Dynamic Approach.” John Wiley & Sons Inc.
Yin, R. (2002). “Case Study Research: Design and Methods (Applied Social Research Methods) .” SAGE
Publications, Inc . 3rd Edition.
22
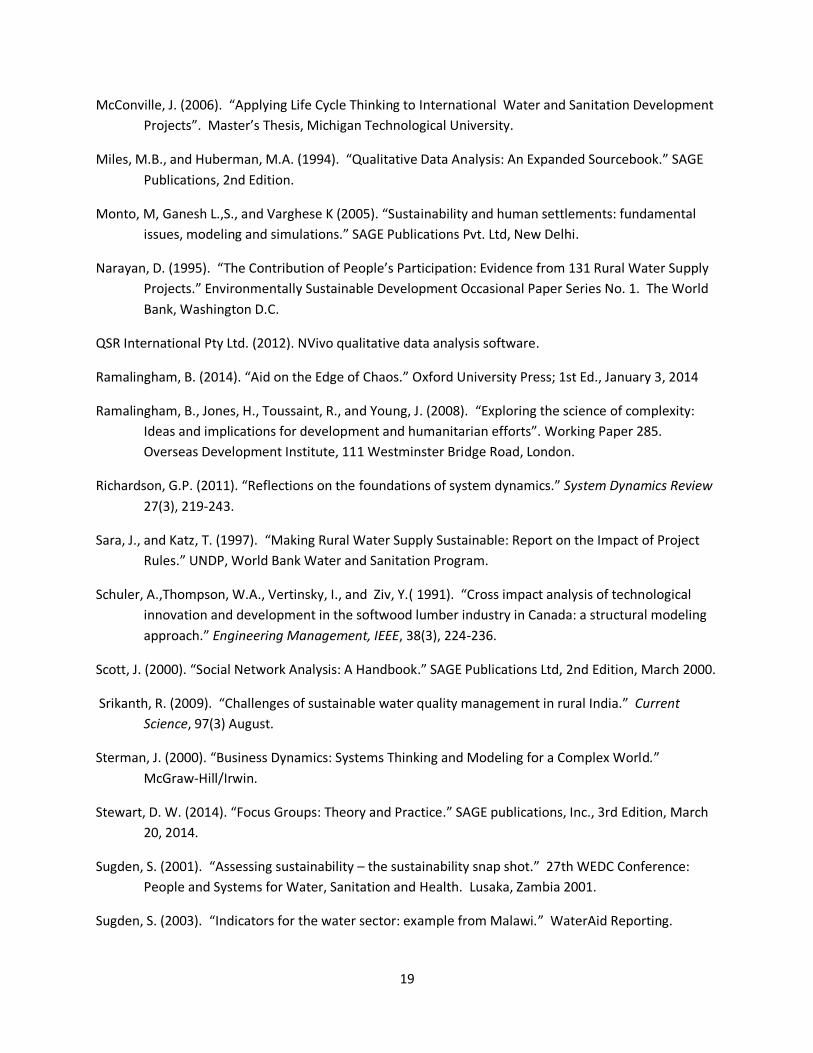
CHAPTER 2 – LONG-TERM FUNCTIONALITY OF RURAL WATER
SERVICES IN DEVELOPING COUNTRIES: A SYSTEM DYNAMICS
APPROACH TO UNDERSTANDING THE DYNAMIC INTERACTION OF
FACTORS
Keywords: sustainability factors; developing countries; rural water projects; modeling; systems
ABSTRACT
Research has shown that sustainability of rural water infrastructure in developing countries is
largely affected by the dynamic and systemic interactions of technical, social, financial, institutional, and
environmental factors that can lead to premature water system failure. This research employs system
dynamics modeling, which uses feedback mechanisms to understand how these factors interact
dynamically to influence long-term rural water system functionality. To do this, the research first
identified and aggregated key factors from literature, then asked water sector experts to indicate the
polarity and strength between factors through Delphi and cross impact survey questionnaires, and
finally used system dynamics modeling to identify and prioritize feedback mechanisms. The resulting
model identified 101 feedback mechanisms that were dominated primarily by three and four-factor
mechanisms that contained some combination of the factors: Water System Functionality, Community,
Financial, Government, Management, and Technology, implying these factors were the most influential
on long-term functionality. These feedback mechanisms were then scored and prioritized, with the
most dominant feedback mechanism identified as: Water System Functionality – Community – Finance –
Management. This study showcases a way for practitioners to better understand the complexities
inherent in rural water development using expert opinion, and indicates the need for future research in
rural water service sustainability that investigates the dynamic interaction of factors in different
contexts.
23
INTRODUCTION
In the developing world, over 768 million people are without access to safe drinking water, 83%
of which live in rural communities (JMP 2013). However, despite well-intended efforts, a large number
of intervention attempts to sustainably lower these statistics have been unsuccessful. Studies have
found that 30% to 50% of rural water projects, whether water systems or wells, fail between 3 and 5
years following construction (WASH Sustainability Charter 2013).
Water sector literature has shown that sustainability is often hindered as a result of the dynamic
and systemic interactions of technical, social, financial, institutional, and environmental factors that
influence project success or failure over time (Sara and Katz 1997; Sugden 2001, 2003; WaterAid 2011).
More than just a static outcome, rural water project sustainability appears to be a process that emerges
as a result of the systems-based integration of these factors (Lockwood et al. 2003; Forrester 1962;
Bossel 2007; Bagheri and Hjorth 2007; Veeman and Politylo 2003; Berke and Conroy; UN 2012). As such,
planning for sustainable rural water services largely becomes a process of interpreting and adapting to
the dynamic interaction of factors that influence long-term functionality (Lockwood et al. 2003). Thus,
in order to create long-lasting solutions to water poverty, the systemic and dynamic interaction between
these factors must be considered.
Literature within the international water development sector are rich with studies investigating
the causes of water system failure. For instance, literature has shown communities often lack the
necessary capacity to maintain their water system (IRC 2009), with wells breaking down frequently due
to poor maintenance or insufficient water supplies caused by seasonal fluctuations in water levels
(UNICEF Sierra Leone 2012). In addition, water systems often fail to respond to local needs, desires, and
demands, leading to eventual abandonment of the water system (Chatterley 2012; Lockwood and Smits
2011). And, finally, a lack of harmonious coordination and alignment between donors, non-
governmental organizations, and key stakeholders, coupled with an inefficient use of resources, often
24
stifles effective capacity building of the community, government, and local institutions (Chatterley 2012;
Lockwood and Smits 2011; Baumann and Danert 2008; Ferguson and Mulwafu 2004; Nyirishima and
Mukasine 2011). These examples, and many others, provide evidence of the complex interaction of
technical, political, social, financial, institutional, and environmental influences that can lead to water
system failure.
In light of these failures, the sector has developed evaluation frameworks that use factors and
indicators to assess sustainability of existing and future water projects and programs. Indicators have
been used to understand and measure levels of community participation (Narayan 1995; Marks and
Davis 2012), the feasibility of financial management schemes (Whittington 1990; Abramson et al. 2011),
user demand and willingness to pay(Whittington 1990; Abramson et al. 2011), supply chain
management (Harvey and Reed 2004, 2007), and environmental resource management (Harvey and
Reed 2004, 2007) , and to evaluate water service sustainability (Abrams et al. 2006; Jones and Silva
2009; Godfrey et al. 2009; Godfrey et al. 2013; USAID 2013). However, while these studies have made
significant intellectual contributions, evaluating the interaction of factors in this static way may limit our
understanding of sustainability by not considering their dynamic interaction (Sara and Katz 1997; Sugden
2003). Thus, this study aimed to investigate a means to extend existing knowledge on sustainable rural
water service provision by considering the dynamic and systemic interaction of factors.
To understand the dynamic interaction of factors that influence long-term rural water system
functionality, this study employed a mixed-methods approach that culminated with system dynamics
modeling. System dynamics modeling offers a way to understand the systemic and dynamic nature of
complex problems through the identification of closed-system interaction between factors known as
feedback mechanisms, which are hypothesized to drive system behavior (Churchman 1968; Richmond
2001; Sterman 2000; Meadows 2008; Pruyt 2013; Vennix 1996). Thus, this study was guided by the
system dynamics modeling process that included identifying factors that influence long-term
25
functionality of rural water infrastructure in developing countries and determining the dynamic
interaction of these factors by identifying feedback mechanisms. Using these methods, the study set
out to specifically answer the questions: What are the most important factors that influence the long-
term functionality of rural water infrastructure in developing countries? How do these factors interact as
a system? Which feedback mechanisms dominate the outcome of long-term water system functionality?
By answering these questions, this study aims to improve sector knowledge on sustainability by gaining
much needed insight regarding the dynamic and systemic complexities inherent in rural water project
sustainability. Additionally, it aims to motivate future research focused on finding solutions and
remedies to rural water issues in developing countries that are dynamic and systemic in nature.
METHOD & RESULTS
As indicated previously, system dynamics modeling allows us to analyze feedback mechanisms
that form through the dynamic interaction of factors. These feedback mechanisms help determine what
drives an outcome; in this case the success or failure of a rural water project (Sterman 2000; Meadows
2008; Pruyt 2013; Vennix 1996). Therefore, system dynamics modeling not only allows a better
understanding of the complex structure of factors and influences that lead to a particular problem, but
also provides a way to learn from, adapt to, and plan for unintended consequences that could result
from a particular solution (Meadows 2008; Vennix 1996; Sterman 2000). Following its inception in 1961
by Michigan Institute of Technology (MIT) professor, Jay Forrester, system dynamics modeling has been
used for a wide range of applications. For example, there is a long tradition of using system dynamics to
study public management issues (Homer 1985), including public health (Homer 1985; Newman and
Martin 2003), energy and the environment (Bossel 2007; Ford 1999), social welfare (i.e., modeling the war
on drugs)(Sterman 2000; Homer 1993), security (Weaver 2006), economics and enterprises(Churchman
1968; Sterman 2000), and sustainable development (Bossel 2007; Meadows 2008; Vennix 1996; Saeed
2001).
26
System dynamics modeling can entail qualitative or quantitative modeling. Typically, qualitative
system dynamics modeling precedes quantitative modeling (Vennix 1996; Wolstenholme 1990). The
primary objective of qualitative system dynamics modeling is to develop dynamic theory, traditionally in
the form of a causal loop diagram (CLD), which visually depicts the causal structure hypothesized to
drive the dynamic behavior of the system. In this case, dynamic behavior manifests in the emergence of
feedback mechanisms, where a feedback mechanism is a loop of two or more factors that influences
each factor in succession over time (Pruyt 2013). Since the aim of this study was to identify the
feedback mechanisms that affect long-term functionality of rural water services, this research dealt
solely with the qualitative system dynamics modeling process.
The creation of dynamic theory in the form of a CLD followed a three-phase process. In Phase 1,
we identified the factors that can affect long-term water system functionality by conducting a
systematic literature review. In Phase 2, distinctions were made regarding the polarity of influence
(either a positive or negative influence) and strength between each factor identified in the literature
with the help of a panel of water sector experts using both a polarity analysis and cross impact analysis
(CIA), respectively. Lastly, Phase 3 identified and ranked dominant feedback mechanisms using the
Phase 2 results from the CIA. Due to the multi-method approach employed for this research, we
present the method, followed immediately by the results, for each phase below.
PHASE 1: FACTOR IDENTIFICATION
To identify the factors used in the CLD we performed a content analysis of journals published
within the water sector using different combinations of the keywords “rural water”, “developing
countries”, “sustainability”, “factors” and “indicators”. Scholarly articles were searched within the Web
of Knowledge and Engineering Village, and non-scholarly articles were searched by direct referral from
bibliographies. The process began by reading the abstract of each article found in the keyword search to
ensure the research was related to rural water project sustainability in developing countries. Articles
27
that did not meet this requirement were excluded. We coded and aggregated recurring references
within the literature to factors that affected the sustained functionality of a rural water system in a
developing country context. The coding process was performed within the qualitative data analysis
software, QSR NVivo, chosen for its ability to easily allow researchers to code and manage qualitative
data (Bazeley 2007). Finally, these coded factors were grouped within affiliated categories called
“sustainability factors” to ensure the number of factors included in the CLD were of a manageable size,
while covering the spectrum of key themes related to rural water service sustainability (Godet 1986;
Scholz and Tietje 2002) .
The initial keyword search yielded 472 articles within scholarly journals and 176 non-scholarly
articles found within the water sector. From these, 97 were chosen for their explicit identification of
factors that influence long-term functionality of rural water services in developing countries. These 97
articles yielded 157 unique references to factors that potentially affect sustainability and functionality of
a rural water system. These factors were then aggregated into “sustainability factor” affiliation
categories, which included: Government (Gov), Community (Com), External Support Management (Ext),
Financial (Fin), Environment & Energy (E&E), Technology Construction & Materials (TCM), and Water
System Functionality (WSF). The factor “Water System Functionality” relates to how the water system is
functioning at any particular time. For example, a water system that is not functioning properly might
influence users’ willingness to pay monthly tariffs, or could deplete funds available for system operation
if excessive funds are continually used for system repair. Therefore, while the emergent outcome of
interest in this study is the long-term functionality of rural water infrastructure, we deemed it necessary
to create a factor based on water system functionality that could, in turn, influence other factors and
thereby the overall long-term functionality of a water system.
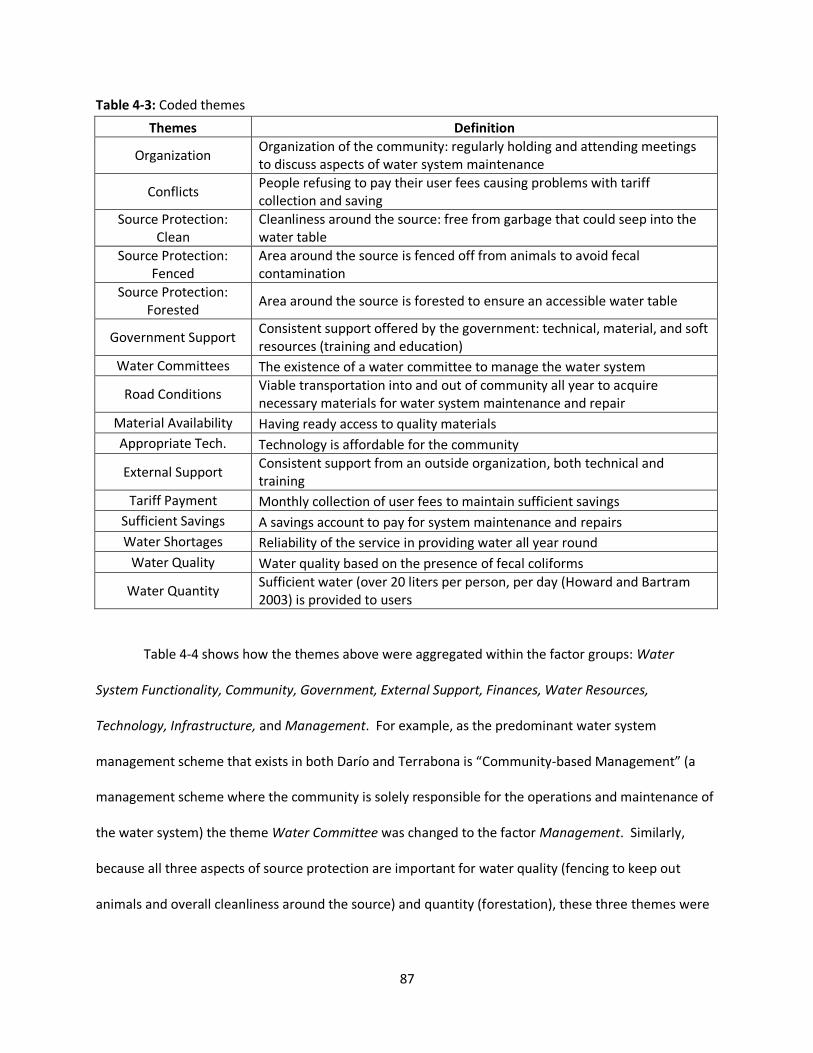
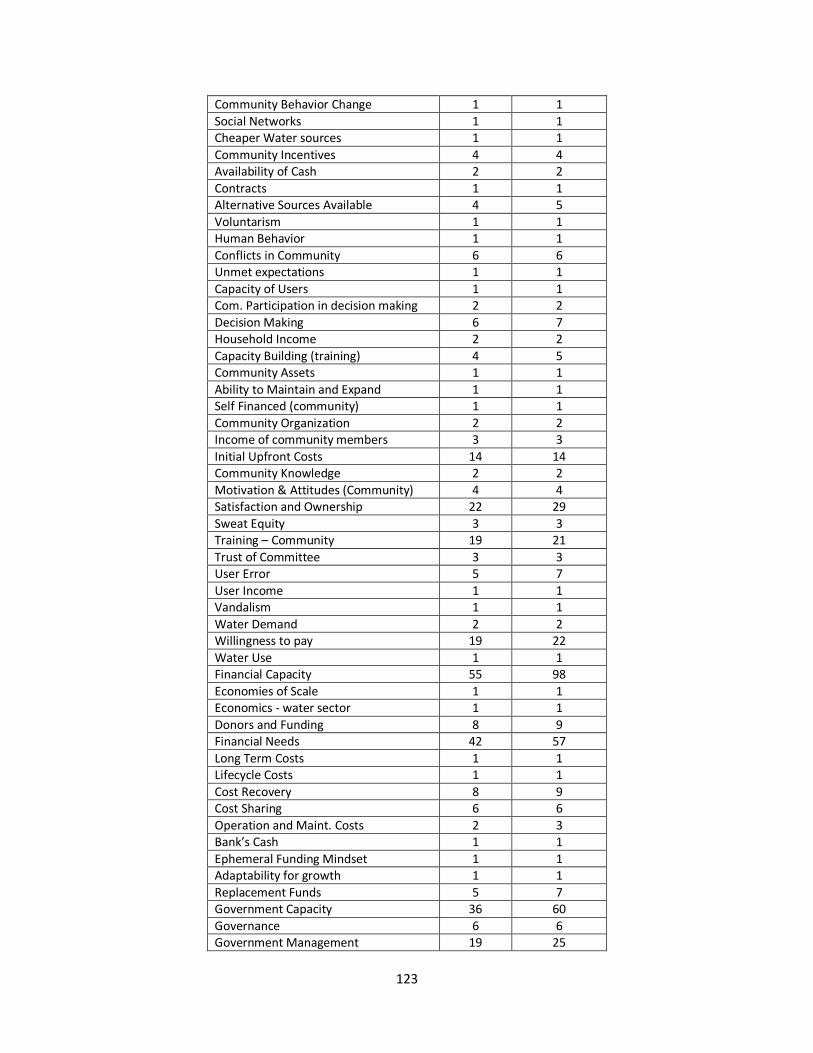
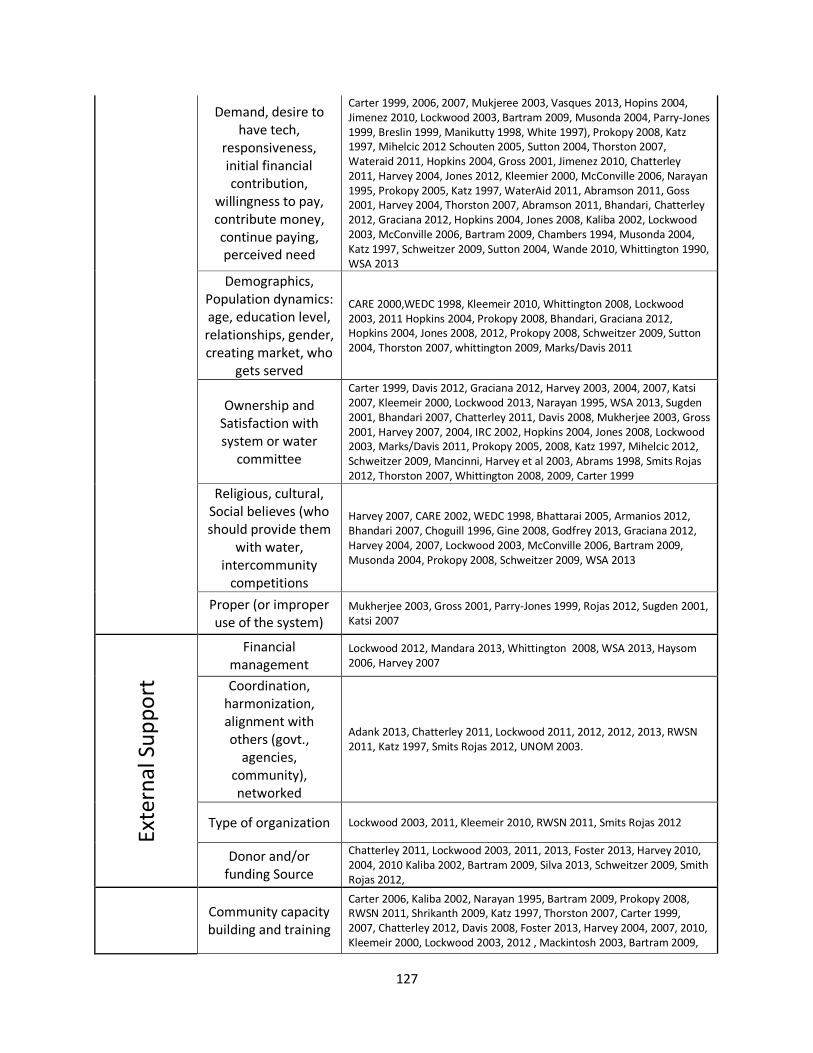
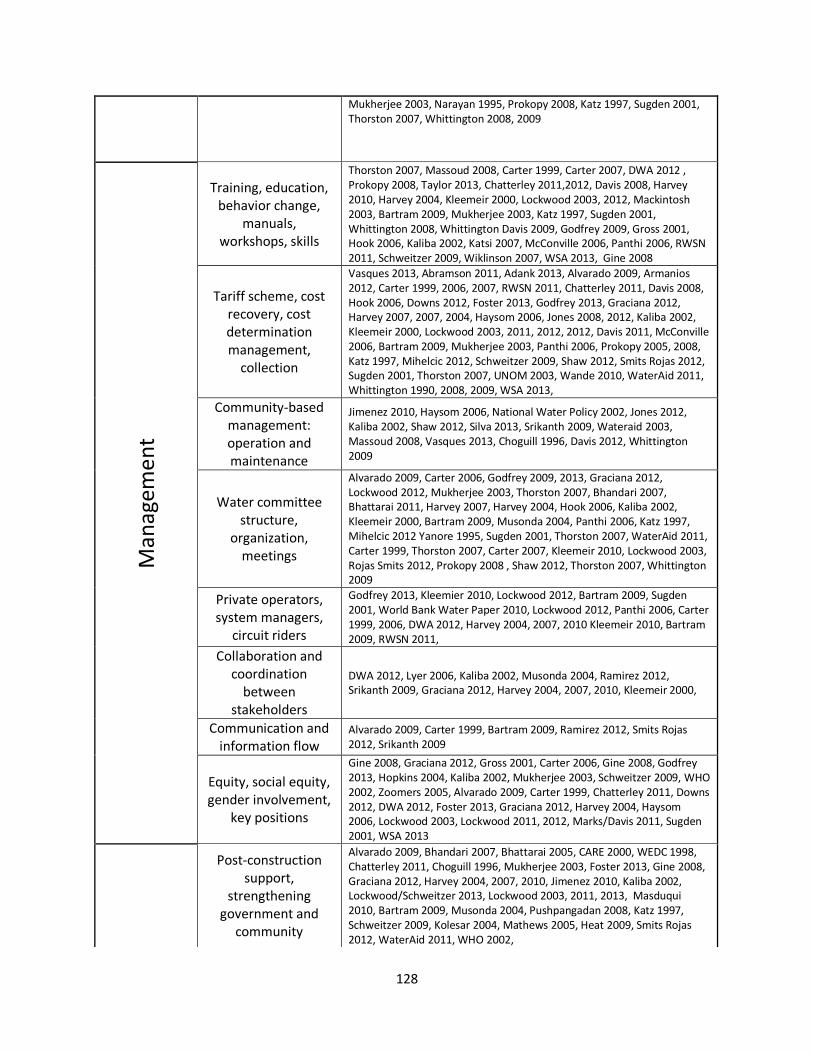
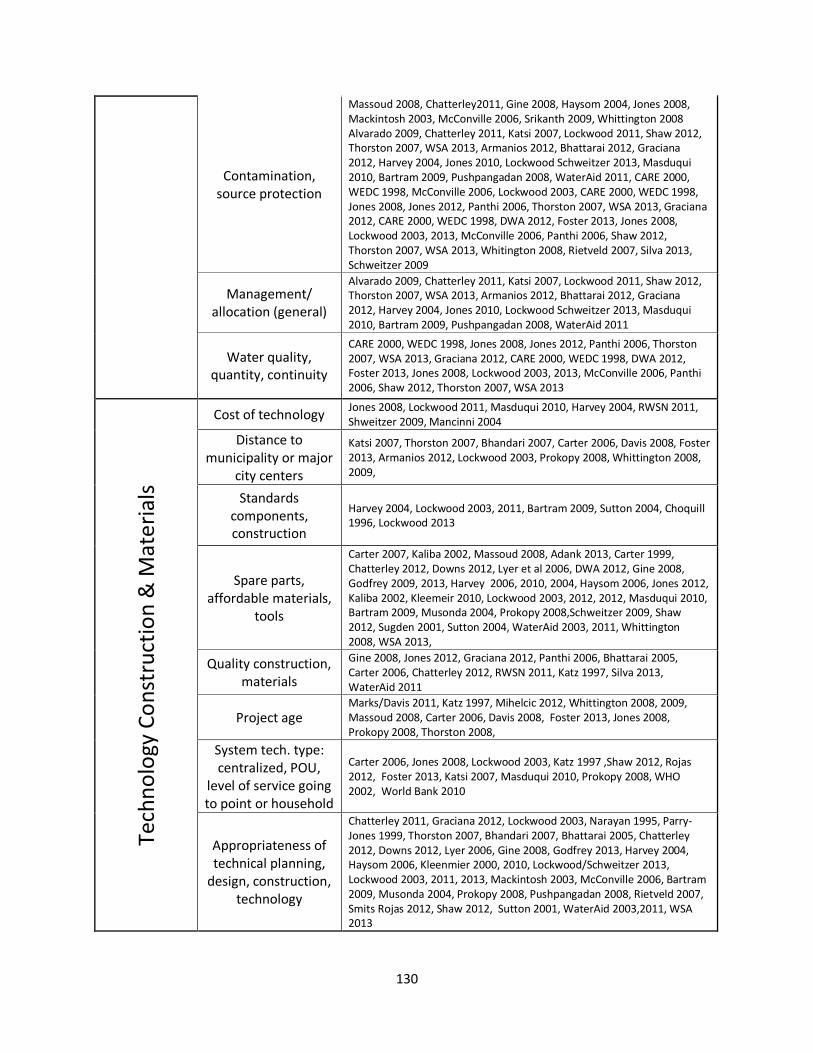
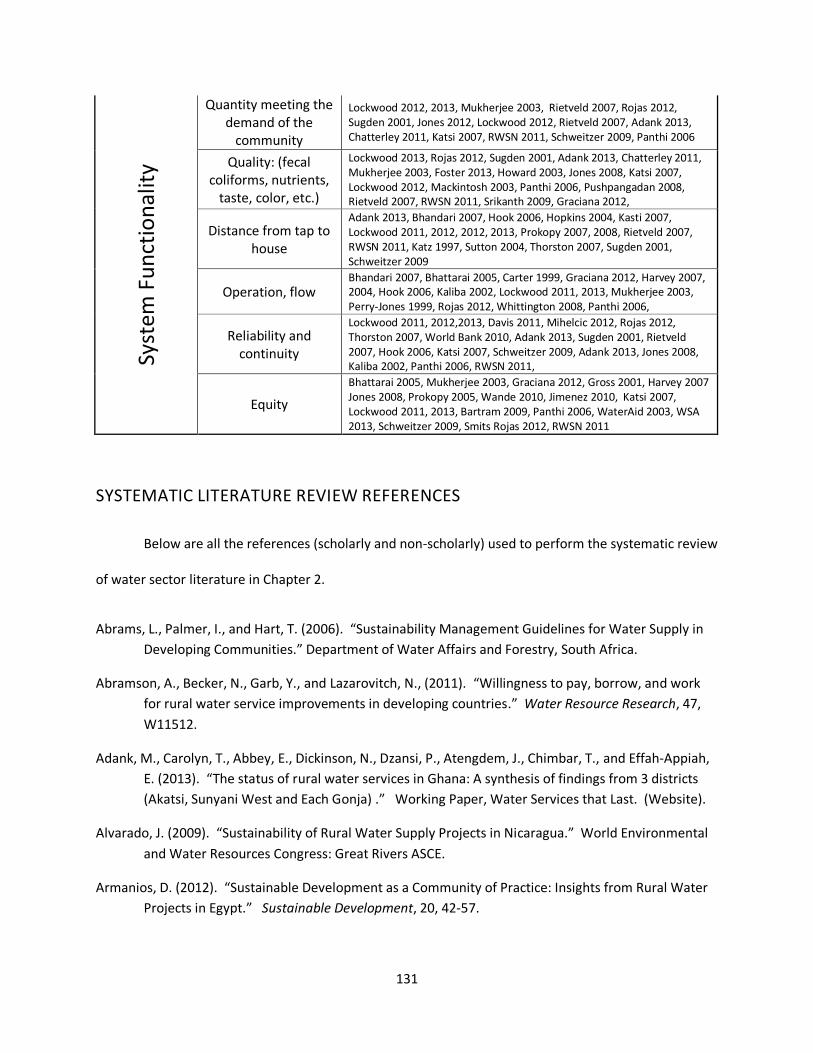
Table 2-1 summarizes these sustainability factors, including a definition, the key sub-factors
mentioned in the literature for each sustainability factor, and the number of articles that mentioned
28
each sub-factor. The language used to define each factor was intentionally kept positive per best
practices for causal loop diagramming (Sterman 2000). To this end, a common thread of these
definitions was chosen as “the ability”, where this “ability” relates to how the factor either enables or
inhibits the objective of long-term water service functionality. Thus, as we progress into the
identification of feedback mechanisms, it will be important for the reader to understand that these
sustainability factors are thought to have a type of “capacity” or “ability” to, over time, increase or
decrease in a way that influences overall project success (long-term functionality) or failure.
29
Table 2-1: Sustainability factors found in the content analysis
Sustainability Factor
Category
Most Cited Sub- Factors
# of journal articles that cited factor
Definition
Government
Laws & Policy 21 The ability of the government to provide the necessary expertise and resources to help operate, maintain, monitor, and eventually replace the rural water system.
Management 19
Governance 6
Community
Participation 44 The ability and necessary demand present in a community to properly use, operate, monitor, maintain, and eventually replace the rural water system.
Demand 30
Satisfaction 22
External Support
Type of Support 15 The ability of an external organization or agency to provide the necessary expertise and resources to help operate, maintain, monitor, and eventually replace the rural water system.
Cooperation 14
Post Const. Supp. 12
Management
Maintenance 38 The ability of a water services management scheme to support the permanent and continually high functioning operation of a rural water system through proper operation, maintenance, and monitoring.
Skilled Operator 29
Women Involvement 29
Financial
Cost Recovery 48 The ability of water system management entity (community, external organization/ agency, and/or governing body) to financially support the costs associated with the operation, maintenance and eventual replacement of the rural water system.
Financial Management 42
Cost of system or part 16
Technology Construction &
Materials
Spare Part Availability 31 The ability to obtain the appropriate technology, skilled labor, and spare parts to satisfactorily construct, operate and maintain a rural water system.
Tech. Appropriateness 29
Construction Quality 9
Environment & Energy
Resource
Management
20 The ability of the available water resources to provide a continuously sufficient amount of clean water and the ability of the energy infrastructure, typically in the form of electricity, to support continual water system functionality.
Source Protection 17
Energy Avail/Reliable 8
Water System Functionality*
Quality 18 The quality of the water as it compares to the country standards for drinking water quality Quantity 30 The quantity of water provided by the system as it compares to country standards for the requisite amount of water provided per person per day
Reliability 20 The duration of continuous operation of the water system without water shortages or system break-downs Coverage 26 The availability of water services to users
* The water system functionality at a particular point in time, which may influence the other factors
PHASE 2: FACTOR INTERACTION
The purpose of Phase 2 was to identify the influence between factors. To accomplish this
objective, we employed two complimentary methodologies, described below, to ascertain two distinct
influence characteristics between sustainability factors. First, a polarity analysis was conducted using
the input from water sector experts to characterize the dynamic influence (either direct or indirect)
between factors. Second, a cross impact analysis (CIA) was employed using input from the same group
of experts to characterize the strength between factors.
30
Polarity Analysis.
Using the factors identified in Phase 1, a Delphi panel of water sector experts was assembled in
an attempt to reach consensus regarding the polarity of influence and associated model structure
between the identified sustainability factors using expert assessments. The Delphi Method is a research
technique to facilitate consensus within a group of experts regarding underlying relationships among
causal factors (Vennix 1996; Linstone and Turoff 1975, Gratch 2012; Hsu and Sanford 2007). This is
typically done through a multi-round survey whereby panelists are presented the aggregate group
responses from the previous round in an attempt to facilitate consensus on a series of themes. Polarity
of influence relates to the dynamic nature of pairwise influence between factors, where this influence
can either be positive (an increase in one factor leads to an increase in the other) or negative (an
increase in one factor leads to a decrease in the other). Identifying the pairwise polarity of influence
between each of the factors provided the necessary building blocks for causal loop diagramming and the
identification of feedback mechanisms (Phase 3).
A thoughtful selection of experts for the Delphi panel was considered critical to the quality of
the study, as many researchers reference non-uniformity between panelist expertise as a major
weakness of the methodology (Hsu and Sanford 2007). Thus, a 6-point criterion was used to select
panelists, shown in Table 2-2, per recommendation of Hallowell et al. (2010). These criteria were
created based upon the desire for panelist expertise and experience in rural water service sustainability
in developing countries. To ensure a sufficient amount of panelists remained through the 2 rounds of
this Delphi, we over-sampled and chose 23 panelists (Hsu and Sanford 2007; Ludwig 1997; Delbecq et al.
1975). Of these 23 panelists, 9 were consultants or advisors, 12 were directors, and 2 were academics,
all focusing on sustainability of water systems in either Africa, Latin America or Asia. Panelists were
given two weeks to respond to each round, an amount of time that is typically considered sufficient to
31
allow panelists flexibility within the context of their schedules, yet short enough to have the study
conducted in a reasonable timeframe (Delbecq et al. 1975).
Table 2-2: The criterion used to select the expert panel
Points1 Criteria
1 per article up to 3
Primary or secondary writer of scholarly journal articles on sustainable rural water services in developing countries
1 per article up to 2
Primary or secondary writer of non-scholarly journal articles on sustainable rural water services in developing countries
1 Member or chair of a nationally recognized committee focused on sustainable rural water services in developing countries
3 At least 5 years of professional experience doing international water aid as a director, practitioner, and/or policy maker
3 Conducts sustainable rural water service research for their job
2 Advanced degree in the field of engineering and/or international development
1 At least 5 years of experience living in a developing country
1 Has presented at conferences where the focus is on sustainable rural water service provision
16 Points required for inclusion
The Panelists were sent Qualtrics online survey questionnaires that asked them to indicate the
influence of each sustainability factor on the other factors. Consensus between panelists for each
influence was determined using a method known as the “Average Percentage Majority Opinion”
(APMO). This was chosen as the preferred determinant for consensus as it was predicted that high
levels of variability would exist in the overall agreement regarding influences between factors. APMO is
an appropriate metric for general consensus in cases such as this, where panelist agreement is used as a
viable indicator of consensus (Hwang 2004; Saldanha and Gray 2002; Cottam et al. 2004; Islam et al.
2006). Using APMO, each consensus limit between factors (i.e., Factor A on B, C, D…etc), was
considered on a factor-by-factor basis. APMO had to be 51 percent, or greater, to be used as a limit for
consensus, per the definition of majority (Gratch 2012). The equation for APMO is shown below.
32
In Round 1, the experts were acquainted with the objective of the study and given definitions
for each of the factors, as shown in Table 2-1. Each expert was then asked to indicate the polarity of
influence between the sustainability factors. For example, to obtain responses on the polarity between
a particular factor—such as Factor A on Factor B—each expert was asked to select an option regarding
how Factor A would influence Factor B, either: (+)—an increase in Factor A will cause an increase in
Factor B; (0)—there is little or no influence between Factor A and Factor B or; (-)—an increase in Factor
A will cause a decrease in Factor B.
The data from Round 1 were analyzed in Microsoft Excel using an individualized APMO
consensus limit for each factor. Pairwise connections that met or exceeded this consensus limit of
agreement were said to reach consensus, while connections that did not were passed on to Round 2.
Consensus was reached on 27 of the 56 potential polarities of influence between the sustainability
factors.
In Round 2, each panelist was asked to again make pairwise comparisons regarding the
influence between the factors that did not reach consensus in Round 1 (29 influences). In this round,
however, panelists were presented with the aggregated responses of the other panelists. Per Delphi
protocol (Hallowell and Gambatese 2010), this was to see if a panelist reinterpreted the questions based
upon the responses from the other panelists. Round 2 reached consensus on an additional 15 polarities,
resulting in a total of 42 influences that reached consensus and 14 that did not. Influences that did not
reach consensus were not included in the final CLD. For the 42 influences that reached consensus, 33
had positive polarity (+: direct relationships), 9 had no influence (0), and 0 had negative polarity (-:
indirect relationship). This CLD, created using the consensus results on factor influence from Round 1
and 2 of the Delphi, is shown in Figure 2-1.
33
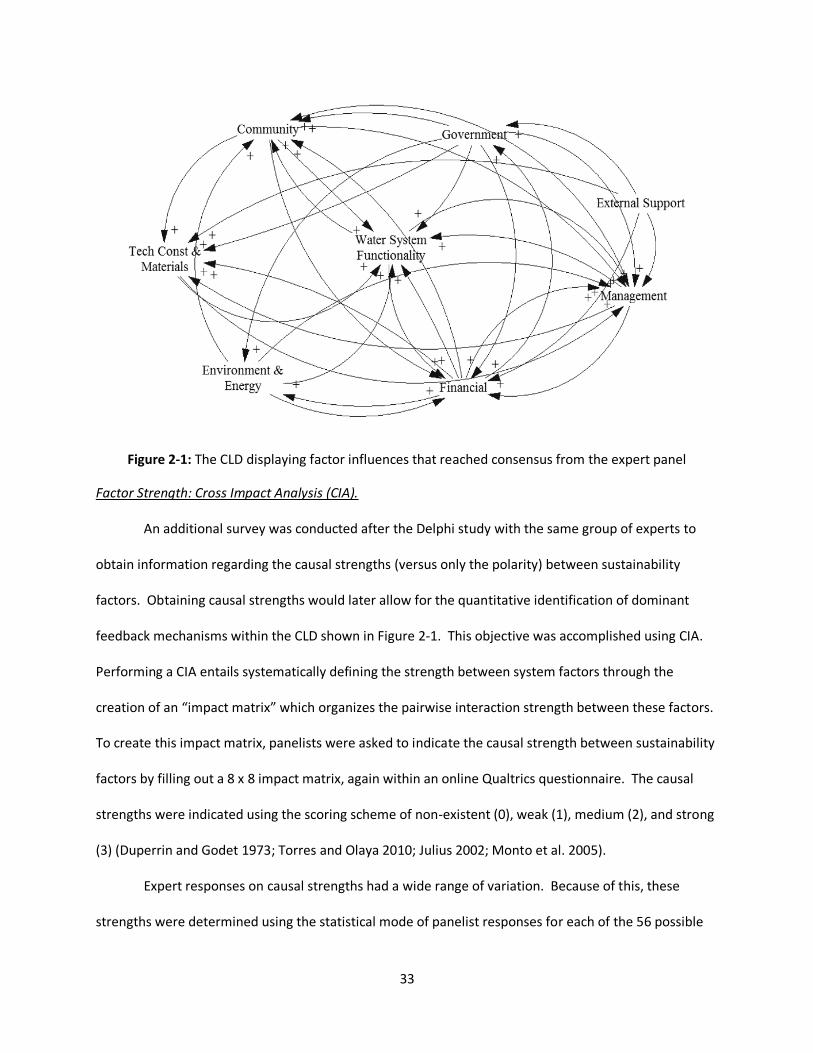
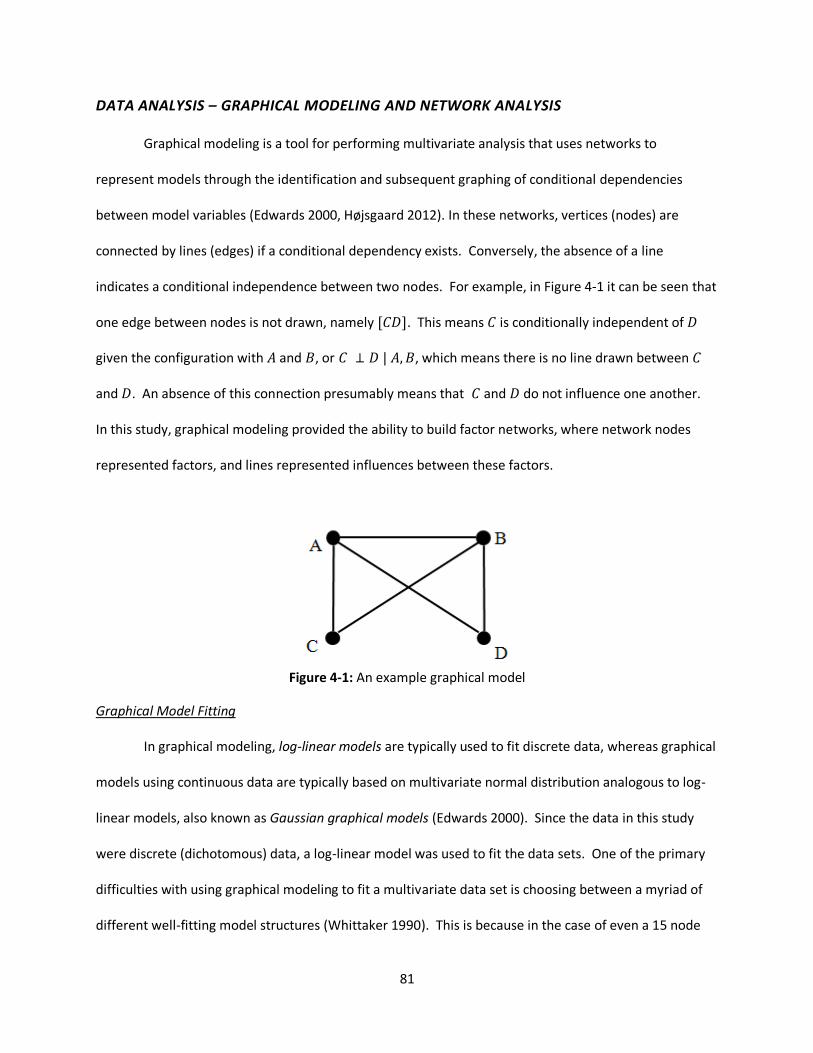
Figure 2-1: The CLD displaying factor influences that reached consensus from the expert panel
Factor Strength: Cross Impact Analysis (CIA).
An additional survey was conducted after the Delphi study with the same group of experts to
obtain information regarding the causal strengths (versus only the polarity) between sustainability
factors. Obtaining causal strengths would later allow for the quantitative identification of dominant
feedback mechanisms within the CLD shown in Figure 2-1. This objective was accomplished using CIA.
Performing a CIA entails systematically defining the strength between system factors through the
creation of an “impact matrix” which organizes the pairwise interaction strength between these factors.
To create this impact matrix, panelists were asked to indicate the causal strength between sustainability
factors by filling out a 8 x 8 impact matrix, again within an online Qualtrics questionnaire. The causal
strengths were indicated using the scoring scheme of non-existent (0), weak (1), medium (2), and strong
(3) (Duperrin and Godet 1973; Torres and Olaya 2010; Julius 2002; Monto et al. 2005).
Expert responses on causal strengths had a wide range of variation. Because of this, these
strengths were determined using the statistical mode of panelist responses for each of the 56 possible
34
influences. The statistical mode was chosen as the appropriate measure of centrality due to the
categorical nature of the data. Table 3 shows the impact matrix for each causal influence.
Table 2-3: Impact matrix from the expert survey showing the strength of influence between factors (row
fators influence column factors)
Gov Com Ext Man Fin E&E TCM WSF
Gov 0 3 2 2 1 2 2 2
Com 2 0 1 2 2 1 1 2
Ext 2 2 0 2 2 1 2 2
Man 0 2 1 0 2 2 2 3
Fin 3 3 2 3 0 1 2 3
E&E 0 2 1 1 1 0 1 2
TCM 1 2 1 2 2 1 0 3
WSF 1 3 2 2 2 2 2 0
PHASE 3: FEEDBACK MECHANISMS
After polarity and strength between factors were identified from Phase 2, the CLD (Figure 2-1)
was imported into the Ventana Systems Inc.’s VENSIM system dynamics modeling software
(www.Vensim.com) to identify feedback mechanisms that influenced water system functionality using
the program’s “loop” tool. Specifically, the feedback mechanisms of interest were those that
influenced the factor Water System Functionality. By considering feedback mechanisms that influenced
this factor, we were able to directly infer how factors would influence water system functionality over
time (i.e. long-term functionality). By combining interactions identified in the polarity analysis and CIA,
it was then possible to identify 101 unique feedback mechanisms that influence the factor Water System
Functionality.
The question then became: which of the 101 feedback mechanisms most influenced long-term
water system functionality? To address this question, we identified dominant feedback mechanisms
through factor influence ranking with the CIA data (Torres and Olaya 2010). Using the CIA impact matrix
created in Phase 2, feedback mechanism strength was calculated by summing pairwise influence scores
for each factor within each feedback mechanism. These feedback mechanism scores were normalized
35
based on the number of factors within the loop to enable comparison. For example, the feedback
mechanism WSF-Com-Fin-Man implies that water system functionality influences community
involvement in the project, which then influences the funds available to operate and maintain the
system, which then influences the capacity for the responsible managing entity to perform these duties
of operation and maintenance, which thereby influences the water system functionality. This was
scored as (3 + 2 + 3 + 3)/4 = 2.75 using influence strengths from the impact matrix (Table 2-3). The top-
five scored feedback mechanisms with normalized scores of 2.4 and above, are shown in Table 2-4.
WSF = Water System Functionality; Com = Community; Fin = Finances; Gov = Government; Man = Management; TCM = Technology, Construction & Materials; E&E = Environment & Energy
36
DISCUSSION
Several findings may be inferred from the results of this study. From the polarity analysis, water
experts in Rounds 1 and 2 of the Delphi indicated that all existing influences between factors were
positive (+). This means the resulting feedback mechanisms are all reinforcing and would likely lead to a
system behavior that is either one of growth (increasing), or decay (decreasing), depending on
the dominance of the feedback mechanisms over time. In the context of a rural water system, a
reinforcing feedback mechanism could imply water services that are increasing in functionality, or
decreasing in functionality over time. An interesting example in the case of the former, a study by
WaterAid Tanzania in (2009), observed a dramatic decrease in water system functionality over 2 to 7
years that seems to match this trend in functionality (WaterAid Tanzania 2009). The decreased water
system functionality observed in the WaterAid study demonstrates the existence of one or more
reinforcing feedback mechanisms similar to the inferred dynamic trend in water system functionality
found in this study using the CLD (Figure 1). The complicated interactions between factors shown in the
CLD also provide evidence of the complexity inherent in rural water project sustainability.
The 32 dominant feedback mechanisms from the CIA were found to contain six sustainability
factors—Water System Functionality (WSF); Community (Com); Financial (Fin); Government (Gov);
Technology, Construction, and Materials (TCM); and Management (Man)—as summarized in Table 4.
Based on the methods used in this study, the most dominant feedback mechanism was Water System
Functionality–Community–Financial–Management. With a methodological understanding that these
four factors have an intrinsic “ability” or “capacity” to positively or negatively influence water system
functionality—these findings imply that contexts where a water project has high levels of Community,
Management, Financial “capacity”, are more likely to have long-term water system functionality.
Conversely, any decrease in the capacity of any or all of these factors would seemingly lead to a
37
cascading decrease in water system functionality over time, similar to what was seen in the
aforementioned WaterAid Tanzania example.
The factors (WSF, Com, Fin, Man) that emerged in our results are well aligned with water sector
literature, which suggest community involvement and effective financial and management schemes
greatly influence the long-term functionality of rural water infrastructure in developing countries.
Specifically, the literature mentions that a community’s capacity to effectively engage with a rural water
system is affected largely by the community’s perceived need for a potable water system (thus creating
a demand) and the community’s involvement in the decision and selection process of the technological
solution (Lockwood et al. 2003; Carter and Howsam 1999; Montgomery et al. 2009; Hopkins et al. 2004;
Weaver, E. A., and G. Richardson (2006). “Threshold setting and the cycling of a decision threshold.”
System Dynamics Review, 22 (1), 1–26.
Whittington, D. (1990). “Estimating the Willingness to Pay for Water Services in Developing Countries: A
Case Study of the Use of Contingent Valuation Surveys in Southern Haiti”. Economic
Development and Cultural Change, University of Chicago Press, 38(2), 293-311
Wolstenholme, E. (1990). “System Enquiry: A System Dynamic Approach”. John Wiley & Sons Inc.
47
CHAPTER 3 – MANAGEMENT OF RURAL WATER SERVICES: A
SYSTEMIC NETWORK APPROACH TO EVALUATING STAKEHOLDER
ALIGNMENT
Keywords: alignment; values; network; stakeholder; developing countries; rural water projects
ABSTRACT
Water sector literature attributes a substantial cause of rural water system failure in developing
countries to poor alignment between project stakeholders. This study aimed to investigate a means for
assessing stakeholder alignment by comparing the systemic interaction of stakeholder values, where the
term “stakeholder values” refers to aspects stakeholders believe are necessary to ensure rural water
services are sustainable. The research held focus groups with key stakeholder groups involved in the
management of rural water infrastructure in Terrabona, Nicaragua to identify stakeholder values, and
then used cross impact analysis to evaluate how these values interacted to form stakeholder value
networks (SVN). Using ranked and normalized betweenness centrality measures, the structures of SVNs
were compared to determine alignment. Results from this study showed high levels of stakeholder
alignment on the topic of finances for the sustainability of water systems, while there was marked non-
alignment regarding the involvement of local government and organizations in the management of
water infrastructure. This study offers compelling evidence for future studies to assess stakeholder
alignment by identifying and structurally analyzing stakeholder value networks.
INTRODUCTION
Significant progress has been made in improving access to potable water in developing countries
over the past decade (JMP 2014); however, studies have shown that substantial issues with project
sustainability exist in spite of these accomplishments (JMP 2014; Sustainability Charter 2014; Davis
2014). One important component for project sustainability is the unified coordination or alignment
48
between key stakeholder groups (Lockwood et al. 2003; Lockwood and Smits 2011; RWSN 2010).
Unfortunately, water sector literature often blames incongruous alignment between donors, country-
level organizations and governments for confounding sustainability (IRC 2012; WaterAid 2011;
Williamson et al. 2008; Ferguson 2001). For example, the IRC 2012 tells of their experience with a
“vicious cycle” that results when the lack of stakeholder coordination causes nonalignment within sector
policy, which, in turn, causes weakened stakeholder collaboration and unsustainable water services. In
addition, Jansz (2011) mentions that, in spite of the many factors that can influence long-term
sustainability of water infrastructure, it is paramount that stakeholders work together effectively with
transparent coordination. Similarly, Pearce-oroz et al. (2011) argues that “inter-sector coordination
contributes to sustainable water services, and closer alignment between local and national
stakeholders”(p.6) are critical for this end goal of sustainability.
Effective coordination and alignment between stakeholders, as a key element for water project
sustainability, comes as no surprise. Project management literature clearly indicates that stakeholder
alignment is imperative for long-term project success (Freeman 1984, 2001; Loucopoulos and Kavakli
1995; Vaidya and Mayer 2014). This literature mentions that alignment is fostered and realized through
the agreement between stakeholder values and goals, which drive and unify stakeholder actions that
are beneficial to project success (Winn 2001; Luftman 2003). Thus, in accordance with the
aforementioned literature, this research posits that the emergent outcomes from stakeholders’ values –
as they relate to the ideal management of rural water infrastructure –are their associated actions.
Therefore, specifically evaluating certain aspects of stakeholder values would intuitively enable an
improved ability to judge how stakeholders will align their actions towards the end goal of long-lasting
water services (Rokeach 1973; Keely 1983; Zang et al. 2008). As such, the aim of this research was to gain
understanding of stakeholder alignment through the emergence and analysis of their respective values,
and how these values interact.
49
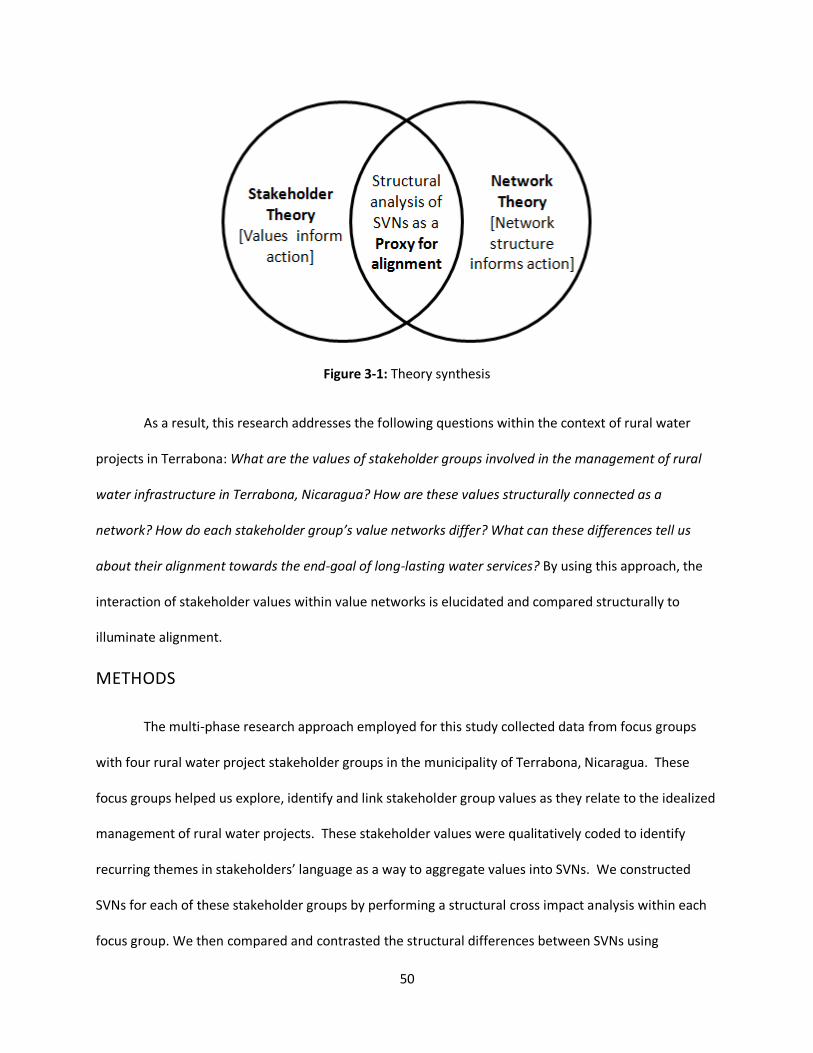
This study proposes a method for comparing stakeholder values through the creation and analysis
of stakeholder value networks (SVN). We elected to use stakeholder theory and network theory to
provide a theoretical basis for these proposed methods of data collection and analysis. Stakeholder
theory suggests that mapping stakeholder values as they relate to a particular end goal (in this case, the
long-term functionality of rural water infrastructure) can enable an improved understanding of their
future actions (Winn 2001; Weiner 1988; Freeman 2001; Mills et al. 2009; Rosenblueth et al. 1943).
Similarly, network theory suggests that the structural interaction of these stakeholder values – shown by
drawing a network comprised of nodes (in our case stakeholder values) and lines/edges that connect
these nodes (to show the interaction between these values) – can provide insight into the type of
stakeholders’ actions that potentially manifest (Wasserman and Fraust 1994; Freeman 1979; Scott 2000;
Borgatti and Everett 2006; Wossen et al. 2013).
As a proxy for stakeholder alignment, this research proposes to assess stakeholder action by
comparing the structural interaction of their values networks. First, we propose using stakeholder
theory for the illumination of stakeholder values based on their goals for water project success.
Second, we propose using network theory as a basis for the use of SVNs to display a meaningful
interaction between stakeholder values. Lastly, we combine these two theories to develop a proxy for
alignment based on stakeholder action inferred through the structural analysis of their value networks.
Figure 3-1 summarizes the synthesis of these two theories that guided our research methods.
50
Figure 3-1: Theory synthesis
As a result, this research addresses the following questions within the context of rural water
projects in Terrabona: What are the values of stakeholder groups involved in the management of rural
water infrastructure in Terrabona, Nicaragua? How are these values structurally connected as a
network? How do each stakeholder group’s value networks differ? What can these differences tell us
about their alignment towards the end-goal of long-lasting water services? By using this approach, the
interaction of stakeholder values within value networks is elucidated and compared structurally to
illuminate alignment.
METHODS
The multi-phase research approach employed for this study collected data from focus groups
with four rural water project stakeholder groups in the municipality of Terrabona, Nicaragua. These
focus groups helped us explore, identify and link stakeholder group values as they relate to the idealized
management of rural water projects. These stakeholder values were qualitatively coded to identify
recurring themes in stakeholders’ language as a way to aggregate values into SVNs. We constructed
SVNs for each of these stakeholder groups by performing a structural cross impact analysis within each
focus group. We then compared and contrasted the structural differences between SVNs using
51
betweenness centrality scores to highlight stakeholder alignment (or non-alignment). The
methodological phases, as they relate to data collection and data analysis, are explained below.
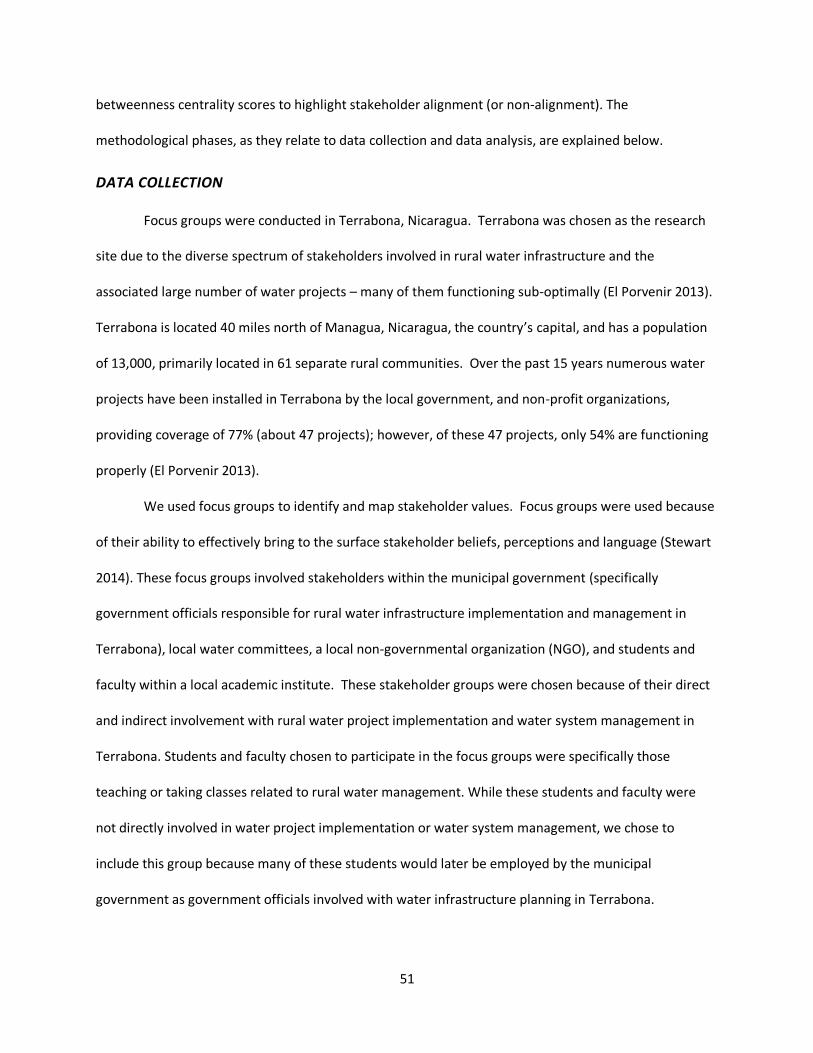
DATA COLLECTION
Focus groups were conducted in Terrabona, Nicaragua. Terrabona was chosen as the research
site due to the diverse spectrum of stakeholders involved in rural water infrastructure and the
associated large number of water projects – many of them functioning sub-optimally (El Porvenir 2013).
Terrabona is located 40 miles north of Managua, Nicaragua, the country’s capital, and has a population
of 13,000, primarily located in 61 separate rural communities. Over the past 15 years numerous water
projects have been installed in Terrabona by the local government, and non-profit organizations,
providing coverage of 77% (about 47 projects); however, of these 47 projects, only 54% are functioning
properly (El Porvenir 2013).
We used focus groups to identify and map stakeholder values. Focus groups were used because
of their ability to effectively bring to the surface stakeholder beliefs, perceptions and language (Stewart
2014). These focus groups involved stakeholders within the municipal government (specifically
government officials responsible for rural water infrastructure implementation and management in
Terrabona), local water committees, a local non-governmental organization (NGO), and students and
faculty within a local academic institute. These stakeholder groups were chosen because of their direct
and indirect involvement with rural water project implementation and water system management in
Terrabona. Students and faculty chosen to participate in the focus groups were specifically those
teaching or taking classes related to rural water management. While these students and faculty were
not directly involved in water project implementation or water system management, we chose to
include this group because many of these students would later be employed by the municipal
government as government officials involved with water infrastructure planning in Terrabona.
52
Focus groups were conducted individually for each group of stakeholders to avoid conflicts or
biases between different stakeholder groups. Audio was recorded for each focus group session to aid in
the subsequent step of value aggregation and comparison. Table 3-1 displays some basic information
regarding each focus group session and displays each stakeholder group’s respective involvement with
rural water infrastructure.
It may be seen in Table 3-1 that the Water Committees and Academics stakeholder groups were
considerably larger than the other two groups. For these larger focus groups, a significant effort by the
focus group facilitator went into ensuring each stakeholder was involved in the discussion. The process
of facilitating a discussion with a larger number of focus groups participants resulted in sessions that
were approximately one hour longer for both the Water Committees and Academics stakeholder
groups.
Table 3-1: Focus group information
Stakeholder Involvement with Water Service # of Participants
Length (hr)
Government Implementation, management, training 5 2
Organization Implementation, management, training 6 2.5
Water Committees Management 14 3
Academics (students and faculty)
Best practices, education of future government-based practitioners
16 3
Focus group sessions began by asking stakeholders the open-ended question: “what do you feel
are the most important things that lead to the long-term functioning of a rural water system?” The
wording of this question effectively asked stakeholders to provide “things” (values) they thought might
lead to the end goal of long-term water system functionality. Each stakeholder group was then given
time to brainstorm, discuss, and reach consensus on the most important values.
Once these stakeholder values were identified and aggregated into subgroups, the next step
was to ascertain the influence between values that would later be used to build each SVN. To do this,
53
stakeholders were prompted to systematically identify “the interaction between each value”, through
pairwise connections (i.e., the influence of good accounting on community participation, good
accounting on proper system maintenance, community participation on good accounting, etc.). This
method of pairwise interaction was considered a systematic, simple, and objective way to find the
influence from one stakeholder value on the other (Turnstone 1927; Bradley 1954; Linstone and Turoff
1975; Saaty 2008; Cheung et al. 2010; Gregory and Wellman 2001). Practically, this process entailed
eliciting and writing down all possible pairwise interactions. The focus group session ended after each
pairwise influence was discussed, resulting in a synthesized list of pairwise comparisons between
stakeholder values for each stakeholder group.
DATA ANALYSIS
Each focus group session was recorded, transcribed in Spanish, and then imported and
qualitatively analyzed in QSR NVivo 10 software to code similarities and differences between the
stakeholders’ language (QSR International Pty Ltd. 2012). Transcriptions were intentionally kept in
Spanish to preserve many of the contextual subtleties available only in the native tongue of focus group
participants. Similar stakeholder value names that were described with similar language (wording) by
stakeholders were then put into generalized categories, which enabled the comparison of these values
between each of the stakeholder groups. Specifically, the recurring language used by stakeholders to
describe the important values for long-term functionality of water infrastructure was used to create
these means for stakeholder value generalization.
With the list of generalized stakeholder values, it was then possible to create a SVN for reach
stakeholder group. SVNs were built using the value interactions (the second part of each focus group
session) indicated by the stakeholders. Interactions between the stakeholder values allowed us to build
SVNs using R-Project for Statistical Computing (R-Project 2015), where each SVN displayed the mapped
interaction between stakeholder values. To structurally compare SVNs, this research used betweenness
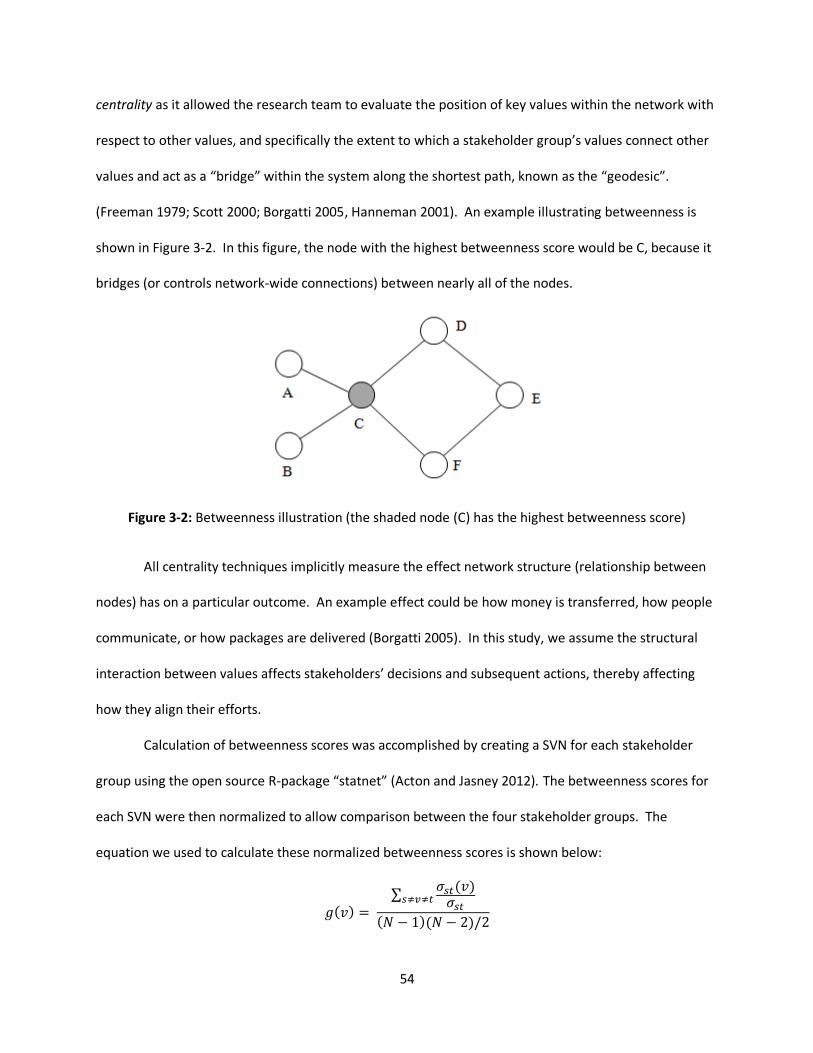
54
centrality as it allowed the research team to evaluate the position of key values within the network with
respect to other values, and specifically the extent to which a stakeholder group’s values connect other
values and act as a “bridge” within the system along the shortest path, known as the “geodesic”.
(Freeman 1979; Scott 2000; Borgatti 2005, Hanneman 2001). An example illustrating betweenness is
shown in Figure 3-2. In this figure, the node with the highest betweenness score would be C, because it
bridges (or controls network-wide connections) between nearly all of the nodes.
Figure 3-2: Betweenness illustration (the shaded node (C) has the highest betweenness score)
All centrality techniques implicitly measure the effect network structure (relationship between
nodes) has on a particular outcome. An example effect could be how money is transferred, how people
communicate, or how packages are delivered (Borgatti 2005). In this study, we assume the structural
interaction between values affects stakeholders’ decisions and subsequent actions, thereby affecting
how they align their efforts.
Calculation of betweenness scores was accomplished by creating a SVN for each stakeholder
group using the open source R-package “statnet” (Acton and Jasney 2012). The betweenness scores for
each SVN were then normalized to allow comparison between the four stakeholder groups. The
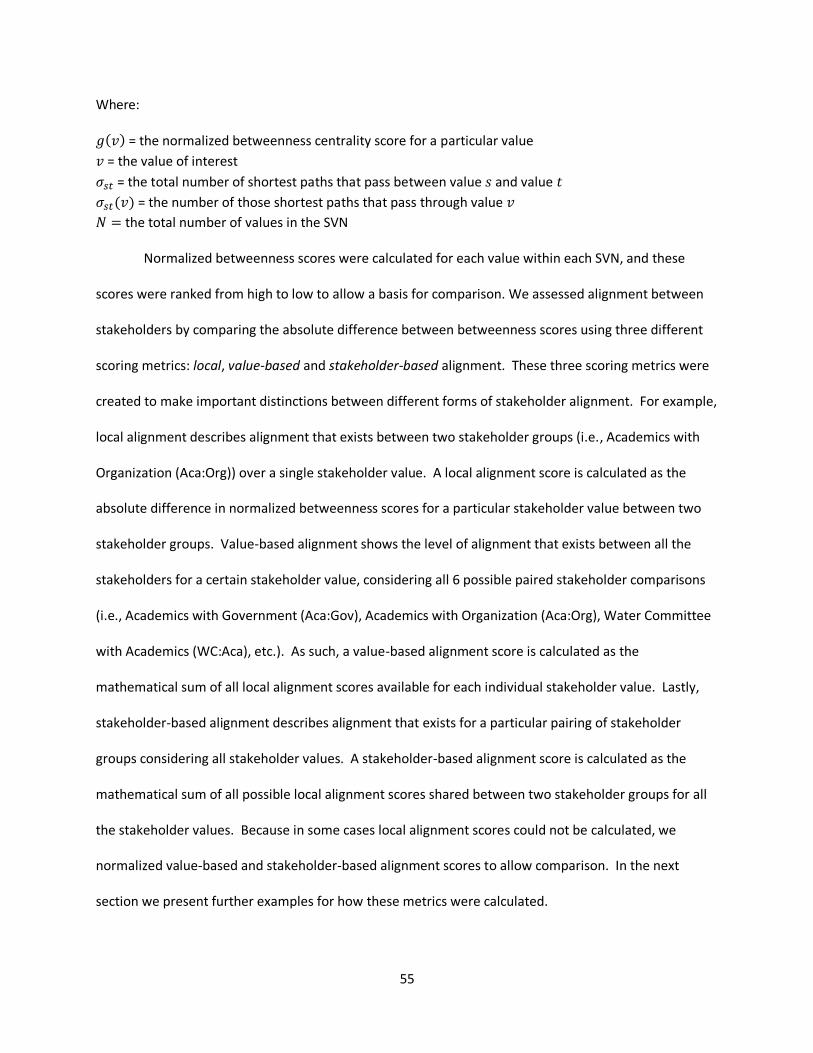
equation we used to calculate these normalized betweenness scores is shown below:
55
Where:
= the normalized betweenness centrality score for a particular value
= the value of interest
= the total number of shortest paths that pass between value and value
= the number of those shortest paths that pass through value
the total number of values in the SVN
Normalized betweenness scores were calculated for each value within each SVN, and these
scores were ranked from high to low to allow a basis for comparison. We assessed alignment between
stakeholders by comparing the absolute difference between betweenness scores using three different
scoring metrics: local, value-based and stakeholder-based alignment. These three scoring metrics were
created to make important distinctions between different forms of stakeholder alignment. For example,
local alignment describes alignment that exists between two stakeholder groups (i.e., Academics with
Organization (Aca:Org)) over a single stakeholder value. A local alignment score is calculated as the
absolute difference in normalized betweenness scores for a particular stakeholder value between two
stakeholder groups. Value-based alignment shows the level of alignment that exists between all the
stakeholders for a certain stakeholder value, considering all 6 possible paired stakeholder comparisons
(i.e., Academics with Government (Aca:Gov), Academics with Organization (Aca:Org), Water Committee
with Academics (WC:Aca), etc.). As such, a value-based alignment score is calculated as the
mathematical sum of all local alignment scores available for each individual stakeholder value. Lastly,
stakeholder-based alignment describes alignment that exists for a particular pairing of stakeholder
groups considering all stakeholder values. A stakeholder-based alignment score is calculated as the
mathematical sum of all possible local alignment scores shared between two stakeholder groups for all
the stakeholder values. Because in some cases local alignment scores could not be calculated, we
normalized value-based and stakeholder-based alignment scores to allow comparison. In the next
section we present further examples for how these metrics were calculated.
56
RESULTS AND DISCUSSION
This section first presents the results from the focus groups and then the network analyses.
Normalized betweenness scores for each stakeholder group and structural differences between each
SVN are compared and discussed using the aforementioned alignment metrics in conjunction with
quotes (translated from Spanish to English) from focus group participants and observations from the
field. In this section, we highlight either alignment or non-alignment based on these findings and
analysis methods.
VALUE GENERALIZATION
The focus group activities yielded a spectrum of stakeholder values for each group. These
values were aggregated into 11 values that, at minimum, 2 out of 4 stakeholder groups shared. Using
these criteria, it was possible to cover the majority of values mentioned by the stakeholders, while
permitting comparison between at least two stakeholders. However, Table 3-2 shows that the majority
of stakeholder values were shared between 2 and 3 stakeholder groups – a result that required us to
normalize our scoring metrics. The stakeholder values that emerged through this selection process
were: Technology (Tech), Management (Man), Communication (Com1), Community (Com2),
Infrastructure (Infra.), Government & Politics (G&P), Water Resources (WR), Water System Functionality
(WSF), External Support (Ext.), Finances (Fin), and Training & Education (T&E). Table 3-2 displays a
description of each generalized stakeholder value, along with the language and context used by the
stakeholder groups.
57
Table 3-2: Value context by stakeholder
Value Stakeholder Context Referenced
Technology Organization Quality of construction and materials so the system works
properly Academics Water Committees The type of system being implemented as it influences
availability of electricity, materials; technologies that are too expensive may not be supported by the community
Management
Organization Management would be organized, and all stakeholders would collaborate with effective leadership over the life of the project
Water Committees Ownership is taken by the water committees who would organize effectively and frequently to assess and maintain the water system
Government Management of the water system should be provided by the water committees with support from the local government
Community Organization
Necessity, demand, motivation, priority, drive community member interaction with the water system
Academics Organization
A willingness to pay, and a need for a culture of payment within the community; level of community education
Infrastructure Government
Transportation infrastructure and reliable affordable energy (if applicable)
Academics Organization
Government & Politics
Government Government continuity, communication, law establishment and reinforcement for water committees
Water Committees Academics
Organization Tariff regulation Regulation of the water system technology
Water Resources
Water Committees Climate change, natural disasters, deforestation, land use, and source protection
Government
Academics
Water levels, conservation, availability of water resources Organization
Water System Functionality
Water Committees A functioning system (water quality, quantity and continuity) is critical for the satisfaction of the community who ultimately pay for the service.
Government Academics
Water Committee
External Support Government Visits from an organization Academics Organizational involvement, visitations, trainings
Organization The organization picks technology, and continually manages the system and educates the community on proper use of system, and on conflict resolution
Finances
Government Available funds saved to perform operation and maintenance of system available through the collection of monthly user tariffs
Academics
Water Committees Economic level of people
Government Financial reporting to community
Communication Water Committees Communication related to information on water system
functionality, issues, etc. Water Committees
Training & Education Academics Trainings of users on proper and responsible use of the
technology Government Training regarding water committee laws and the operation and maintenance of the system Organization
58
NETWORK ANALYSIS
The resulting SVNs for each stakeholder group are shown below in Figure 3-3 as a way to
visualize the structural interaction of stakeholder values. In these network diagrams each node is a
stakeholder value, and each line is an interaction between these values. Arrows indicate the direction of
influence of one value on the other. For example, T&E WR means Training & Education affects, and
thus informs decisions, related to Water Resources. The associated normalized betweenness scores are
shown below for each SVN in Table 3. Because our criteria for stakeholder value generalization allowed
a minimum of two stakeholder group pairings, many of the stakeholder values were not comparable
over all the stakeholder groups. In this case, stakeholder values that were not unanimously mentioned
in a focus group session for a particular stakeholder group are designated with “no data”. Normalized
betweenness scores of zero denote stakeholder values that are structurally unimportant; that is, they
were not structurally necessary to bridge between other stakeholder values.
59
Figure 3-3: Stakeholder value networks, Community (top left), Organization (top right), Academics
(bottom left), Government (bottom right), G&P = Government & Politics, Man = Management, T&E =
Training & Education, Com1 = Communication, WSF = Water System Functionality, WR = Water
Resources, Fin = Finances, Ext = External Support, Tech = Technology, Infra = Infrastructure, Com2 =
Community.
60
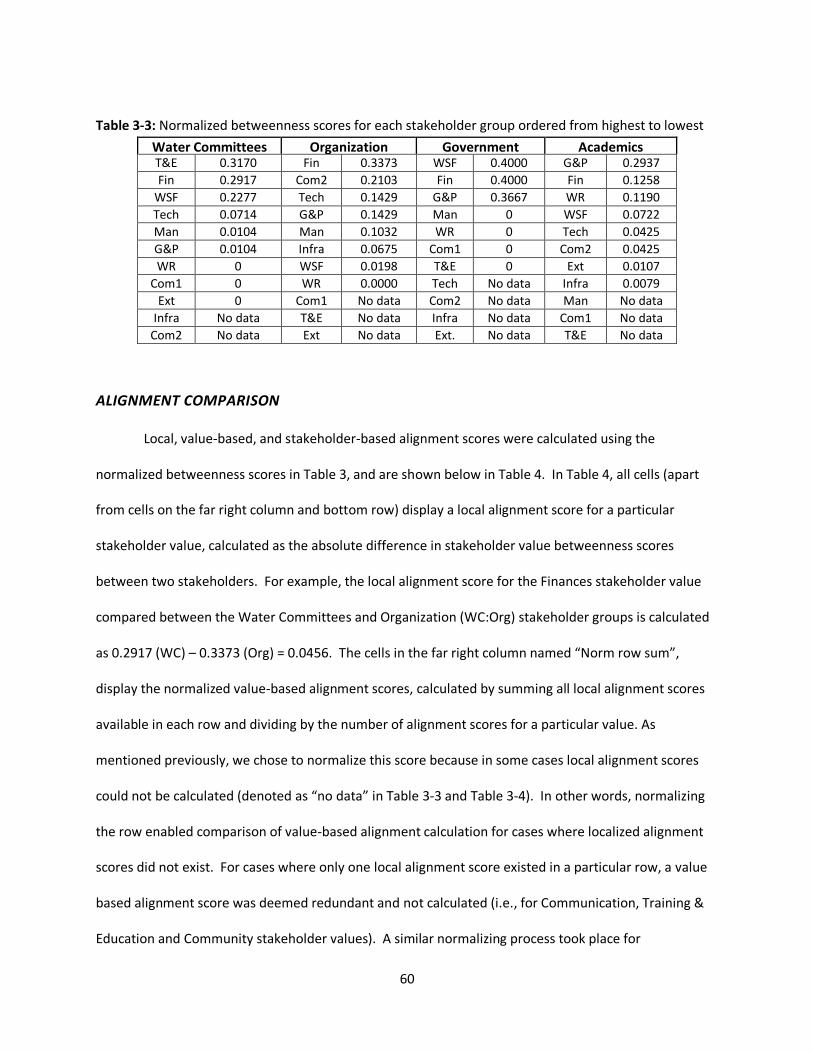
Table 3-3: Normalized betweenness scores for each stakeholder group ordered from highest to lowest
Water Committees Organization Government Academics T&E 0.3170 Fin 0.3373 WSF 0.4000 G&P 0.2937
Fin 0.2917 Com2 0.2103 Fin 0.4000 Fin 0.1258
WSF 0.2277 Tech 0.1429 G&P 0.3667 WR 0.1190
Tech 0.0714 G&P 0.1429 Man 0 WSF 0.0722
Man 0.0104 Man 0.1032 WR 0 Tech 0.0425
G&P 0.0104 Infra 0.0675 Com1 0 Com2 0.0425
WR 0 WSF 0.0198 T&E 0 Ext 0.0107
Com1 0 WR 0.0000 Tech No data Infra 0.0079
Ext 0 Com1 No data Com2 No data Man No data
Infra No data T&E No data Infra No data Com1 No data
Com2 No data Ext No data Ext. No data T&E No data
ALIGNMENT COMPARISON
Local, value-based, and stakeholder-based alignment scores were calculated using the
normalized betweenness scores in Table 3, and are shown below in Table 4. In Table 4, all cells (apart
from cells on the far right column and bottom row) display a local alignment score for a particular
stakeholder value, calculated as the absolute difference in stakeholder value betweenness scores
between two stakeholders. For example, the local alignment score for the Finances stakeholder value
compared between the Water Committees and Organization (WC:Org) stakeholder groups is calculated
as 0.2917 (WC) – 0.3373 (Org) = 0.0456. The cells in the far right column named “Norm row sum”,
display the normalized value-based alignment scores, calculated by summing all local alignment scores
available in each row and dividing by the number of alignment scores for a particular value. As
mentioned previously, we chose to normalize this score because in some cases local alignment scores
could not be calculated (denoted as “no data” in Table 3-3 and Table 3-4). In other words, normalizing
the row enabled comparison of value-based alignment calculation for cases where localized alignment
scores did not exist. For cases where only one local alignment score existed in a particular row, a value
based alignment score was deemed redundant and not calculated (i.e., for Communication, Training &
Education and Community stakeholder values). A similar normalizing process took place for
61
stakeholder-based alignment, where in this case, summing was of cells in a particular column (Norm.
Column Sum).
Table 3-4: Alignment scores for the three alignment metrics (lower numbers denote alignment)
Management 0.0928 0.0104 no data 0.1032 no data no data 0.0688
Water Resources 0 0 0.1190 0 0.1190 0.119 0.0595
Wat Sys. Funct. 0.2079 0.1723 0.1555 0.3802 0.0524 0.3278 0.2160
Technology 0.0715 no data 0.0289 no data 0.1004 no data 0.0669
Communication no data 0 no data no data no data no data --
Training and Edu. no data 0.317 no data no data no data no data --
Community no data no data no data no data 0.1678 no data --
Infrastructure no data no data no data no data 0.0596 no data --
Ext. Support no data no data 0.0107 no data no data no data --
Norm. Column Sum
0.0917 0.1378 0.15052 0.1540 0.1231 0.1985
Stakeholder-based Alignment
Comparing local, value-based, and stakeholder-based alignment scores highlights interesting
findings on stakeholder alignment in Terrabona. Low scores for each of these metrics imply alignment,
and conversely, high scores imply nonalignment. We now present the results from these quantitative
analyses for alignment and nonalignment in conjunction with quotes from participants and contextual
support from our observations in the field.
Alignment
The Water Resources stakeholder value appeared to have the lowest value-based alignment
score (0.0595), meaning consistently low local alignment scores for each stakeholder pairing, and good
alignment for the value overall. Interestingly, the only SVN that yielded a normalized betweenness
score over null for Water Resources was for the Academics stakeholder group. The Academics local
alignment score of 0.119 for Water Resources (as opposed to 0 for the other stakeholders) is supported
by a quote from an Academics stakeholder who stated: “If water resources are not managed well, the
62
water system will not be sustainable”. While the other stakeholders mentioned the importance of water
resources for water system sustainability, this importance did not emerge based on their SVNs.
Additionally, both Management and Technology stakeholder values received low value-based
alignment scores (0.0688 and 0.0669, respectively). Within each focus group session, the majority of
stakeholders agreed on the value of Management as the responsibility of the Water Committees (a
management scheme known as “Community Based Management”). However, the details on how
management was to be executed within water committees varied substantially between stakeholder
groups. As is shown in Table 3-1, the Water Committees stakeholders believed they were in charge of
the water system; however, Organization stakeholders believed the water committee was the primary
maintainer of the system, but that all stakeholders should be involved; and Government stakeholders
believed the community should be in charge of managing the system, with the help of the government.
These apparent disparities in perception of the ideal management schemes are reinforced further in the
network diagram (Figure 3-3 top left), which shows a high level of influence from Management on other
stakeholder values, yet a low level of influence from the other stakeholder values towards Management.
This shows that Management has a greater affect on other stakeholder values than vice versa; and thus
the low betweenness scores for Management overall.
The Technology stakeholder value had a moderately high normalized betweenness score
between the stakeholder groups and was referenced primarily in terms of issues related to electricity
costs, shown by a quote from one Organization stakeholder:“The type of system is important, because
there are systems that pump by gravity and some systems that pump by electricity. The water
committee needs to be careful with water systems that pump by electricity, because they need to
understand the costs associated with this type of technology, and know that if they don’t pay their
electricity bills, the electricity will be cut-off, and water will stop flowing.” The network diagrams in
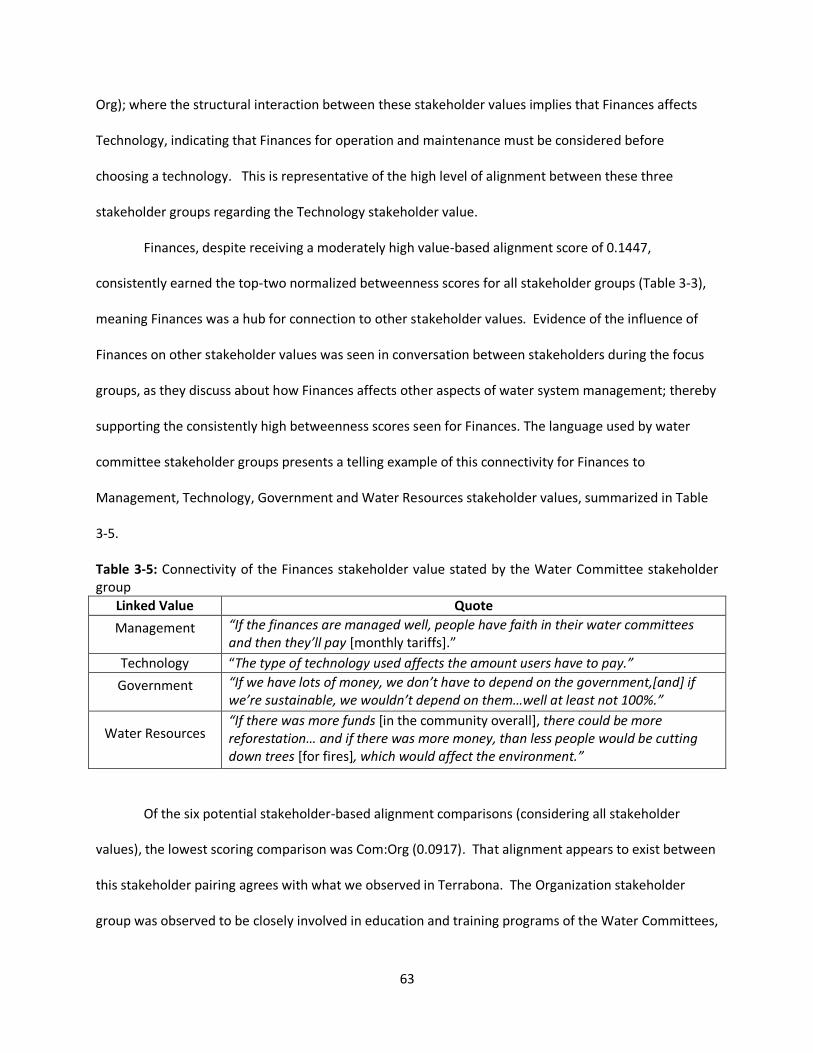
Figure 3-3 support this quote for all three stakeholder groups who mention technology (WC, Aca and
63
Org); where the structural interaction between these stakeholder values implies that Finances affects
Technology, indicating that Finances for operation and maintenance must be considered before
choosing a technology. This is representative of the high level of alignment between these three
stakeholder groups regarding the Technology stakeholder value.
Finances, despite receiving a moderately high value-based alignment score of 0.1447,
consistently earned the top-two normalized betweenness scores for all stakeholder groups (Table 3-3),
meaning Finances was a hub for connection to other stakeholder values. Evidence of the influence of
Finances on other stakeholder values was seen in conversation between stakeholders during the focus
groups, as they discuss about how Finances affects other aspects of water system management; thereby
supporting the consistently high betweenness scores seen for Finances. The language used by water
committee stakeholder groups presents a telling example of this connectivity for Finances to
Management, Technology, Government and Water Resources stakeholder values, summarized in Table
3-5.
Table 3-5: Connectivity of the Finances stakeholder value stated by the Water Committee stakeholder group
Linked Value Quote
Management “If the finances are managed well, people have faith in their water committees and then they’ll pay [monthly tariffs].”
Technology “The type of technology used affects the amount users have to pay.”
Government “If we have lots of money, we don’t have to depend on the government,[and] if we’re sustainable, we wouldn’t depend on them…well at least not 100%.”
Water Resources “If there was more funds [in the community overall], there could be more reforestation… and if there was more money, than less people would be cutting down trees [for fires], which would affect the environment.”
Of the six potential stakeholder-based alignment comparisons (considering all stakeholder
values), the lowest scoring comparison was Com:Org (0.0917). That alignment appears to exist between
this stakeholder pairing agrees with what we observed in Terrabona. The Organization stakeholder
group was observed to be closely involved in education and training programs of the Water Committees,
64
and stated that an important aspect for a successful water project was the motivation and
empowerment of water committee members to properly manage their water system. This alignment is
demonstrated quantitatively by their local alignment score (WC:Org) of 0.0928 for Management, and a
relatively high normalized betweenness score of 0.2103 for the Community stakeholder value. This high
betweenness score is further supported by various Organization stakeholder quotes that mention the
importance of the Community for the sustainability of the water project, outlined in Table 3-6:
Table 3-6: Connectivity of the Community stakeholder value stated by the Organization stakeholder group
Linked Value Quote
Maintenance “[water committees] will do the maintenance, if they are motivated.”
Finances “If a culture is made around gathering funds and saving, this will affect the ability to have funds for maintenance. If there isn’t a culture of paying, the people won’t pay.
External Support “If the community is motivated, they will search out donors.”
Community “Without empowerment and motivation, you can’t have a sustainable project.”
Non-Alignment
Government & Politics and Water System Functionality stakeholder values appeared to have the
highest local (0.3563 and 0.3802, respectively) and value-based alignment scores (0.2033 and 0.2160,
respectively), thus signifying an apparent lack of alignment with these two stakeholder values.
Government & Politics is an easy target, since the majority of stakeholders had strong opinions
regarding how the government should be involved with rural water supply. This is illustrated well by
the quote from a Water Committees stakeholder about not wanting to depend on the government,
shown in Table 3-5: “If we have lots of money, we don’t have to depend on the government, [and] if
we’re sustainable, we wouldn’t depend on them…well at least not 100%.” This stands in obvious
contrast with how the Government stakeholder group desires to interact with community water
committees by offering them incentives if they agreed to be officially legalized by the government, a
process that takes some water committee years to complete: “So the community will have a water
65
system that works well, the community needs to organize a water committee. We organize the
meetings, and we explain the water rights, and we help them do the paper work to become officially
recognized so they may have energy subsidies and bank accounts. The government helps improve the
capacity of the water committees to support the water system”.
The Academics stakeholder group SVN indicated the high importance of government
involvement for sustainable rural water services, receiving a normalized betweenness score of 0.2937
for Government & Politics (G&P). This high normalized betweenness score for G&P indicates a high
connectivity between G&P and the other stakeholder values, as supported by the one Academics
stakeholder’s quote: “Whether the water system is functioning isn’t based on the government, the
government isn’t involved much in the maintenance. They influence everything else.” Strangely, the
Government and Academics stakeholder groups (Gov:Aca) appeared to be the most poorly aligned, with
the highest stakeholder-based alignment score of 0.1985, largely driven by their high local alignment
scores for Finances (0.2742) and Water System Functionality (0.3278). Similarly, the Organization and
Government stakeholder groups (Org:Gov) also appear out of alignment, receiving the second highest
stakeholder-based alignment score of 0.1540.
STUDY IMPLICATIONS AND LIMITATIONS
The findings from the structural analyses of SVNs showed alignment existed between the Water
Committee and Organization stakeholder groups – likely due to how these two stakeholder groups work
together and communicate. Alignment between stakeholder groups regarding each individual
stakeholder value existed for the values: Management, Technology and Finances. For the stakeholder
value, Management, this related to the importance of a viable community based management scheme;
for the Technology stakeholder value, this related to the importance of selecting an appropriate
technology that could be feasibly maintained by the water committee; and for Finances, this related to
the importance of available funds for the operation and maintenance of the water system. That
66
alignment exists based on the structural interaction of these stakeholder values implies similar decisions
would be made by stakeholders related to a project’s finances, management, and technology. This
connection between stakeholder value interaction and alignment is supported by the observed
management decisions made in Terrabona regarding appropriate technology based on regional finances
and the costs of operation and maintenance.
The largest discrepancy of stakeholder-based alignment was found between the Academics,
Organization and Government stakeholder groups. Alignment could be bolstered through improved
communication between these stakeholder groups to enable an alignment of their respective water
management plans. Improved alignment between these stakeholder groups might then lead to
improvements in how community based water system management schemes are successfully planned,
implemented and managed in Terrabona with the help of external support from the government and
local organizations – a strategy that is in-line with current best-practices in the water sector (Lockwood
et al. 2003; Smits et al., 2012; Pushpangadan and Gangadhara 2008; Montgomery et al. 2009; Prokopy
et al. 2008; Davis et al. 2008; IRC 2013).
The presentation of qualitative examples gathered from the focus groups allowed us to support
the quantitative findings on stakeholder alignment based on the structural analysis of SVNs. As such,
this study demonstrates a novel and useful way to quantitatively evaluate stakeholder alignment.
However, it remains to be seen whether comparing stakeholder value interaction accurately predicts
future stakeholder alignment, as well as the resulting impact varying levels of alignment may have on
water service sustainability. Thus, further research will be needed to validate these and any subsequent
findings by investigating if stakeholder alignment or nonalignment truly manifests in the way inferred by
their value networks; and if this improved alignment truly leads to sustainable water services.
67
Finally, it is important to note that a stakeholder group representing water users was not included in this
study because of our limited research resources. As a result of these constraints, we deemed it
infeasible to obtain a representative sample of water user opinions within a single focus group while
maintaining the focus group size used for the other four focus groups (i.e., less than 16 participants).
Although most of the Water Committees stakeholders in this study were water users themselves, future
studies would certainly benefit from the emergence and analysis of stakeholder values from water
users, potentially through a series of focus groups conducted within multiple communities.
CONCLUSIONS
This study demonstrates a way to evaluate stakeholder alignment through the analysis of
stakeholder value networks (SVN). SVNs were created using data gathered in focus groups with four
different stakeholder groups (Government, Water Committees, Academics and Organization) involved in
rural water infrastructure implementation and management in Terrabona, Nicaragua. Using data
gathered in these focus groups in conjunction with qualitative coding, we identified 11 stakeholder
values that could be compared between at least two of the four stakeholder groups. By comparing
pairwise interaction between stakeholder values within focus groups, we then created and structurally
analyzed SVNs using betweenness centrality as a means to judge stakeholder alignment.
The methods employed in this study allowed for insightful stakeholder alignment comparisons
to emerge. From these insights, it was possible to highlight alignment (and nonalignment) of
stakeholders based on the structural interaction of their values, which thereby aided in developing
recommendations for ways to improve stakeholder alignment in Terrabona. For example, the apparent
lack of alignment between Government and Organization stakeholder groups informed our
recommendation for the improved communication between the Government and Organization
stakeholders to better support existing community based management schemes in Terrabona. This
same level of insight on stakeholder alignment in Terrabona could likely be gained by applying this
68
method in other areas and contexts by water practitioners (local organizations, NGOs, etc.) and
academic researchers interested in making recommendations for improved stakeholder alignment.
Thus, this study provides ample motivation for future research that continues to grow understanding on
stakeholder alignment by comparing true stakeholder alignment outcomes with the alignment
assessments found by the structural analysis of stakeholder value networks.
ACKNOWLEDGMENTS
This work was supported by a Graduate Research Fellowship from the Mortenson Center in
Engineering for Developing Communities at the University of Colorado Boulder.
CHAPTER 3 REFERENCES
Acton, R. M., and Jasney L. (2012). “An Introduction to Network Analysis with R and statnet.” Sunbelt
XXXII Workshop Series, March 13, 2012.
Borgatti, S. P., and Everett, M.G. (2006). “A graph-theoretic framework for classifying centrality
measures.” Social Networks, 28 (4), 466-484.
Borgatti, S.P. (2005). “Centrality and network flow.” Social Networks, 27, 55-71.
Bradley, R. A. (1954). “Rank Analysis of Incomplete Block Designs: II.” Additional Tables for the Method
of Paired Comparisons. Biometrika, 41 (3), 502–537.
Cheung, S., Lam, T., Leung, M., and Wan, Y. (2010). “An analytical hierarchy process based procurement
selection method.”Construction Management and Economics, 19, 427-437.
Davis, J., Lukacs, H., Jeuland, M., Alvestegui, A., Soto, B., Lizarraga, G., Bakalian, A., and Wakeman, W.
(2008). “Sustaining the benefits of rural water supply investments: Experience from
Cochabamba and Chuquisaca, Bolivia.” Water Resources Research, 44, W12427.
Davis, S. (2014). “Six Factors for Improving Rural Water Services in Central America.”Global Water
Initiative.
El Porvenir (2013). “Cobertura de Agua y Saneamiento Rural Municipio – Terrabona 2013.” Excel
document from Rob Bell, Executive Director of El Porvenir. Denver, CO.
Ferguson, A., and Mulwafu, W.O. (2001). “Decentralization, participation and access to water reform in
Malawi.” Report prepared for the Basis CRSP Policy Synthesis Workshop, July 2001,
Johannesburg, South Africa.
69
Freeman, L.C. (1977). “A Set of Measures of Centrality Based on Betweenness.” Sociometry, 40 (1), 35-
41.
Freeman, R.E. (1984). “Strategic management: A stakeholder approach.”Boston: Pitman
Freeman, R.E. (2001). “A Stakeholder Approach to Strategic Management.” Working Paper No. 01-02.
Darden Graduate School of Business Administration. University of Virginia.
Gregory, R., and Wellman, K. (2001). “Bringing stakeholder values into environmental policy choices: a
community-based estuary case study.” Ecological Economics, 39, 37-52.
Hanneman, RA. (2001). “Introduction to Social Network Methods. Department of Sociology”, University of California, Riverside.
IRC (2012). “Making Aid Effective at the Local Level.” Briefing Note No. 5. Water Services That Last. July
2012.
IRC (2013). “Direct Support Post-Construction to Rural Water Service Providers.” Briefing Note No. 6.
Water Services That Last.
Jansz S. (2011). “A study into rural water sustainability in the Niassa province, Mozambique.” WaterAid
JMP (2014). “Progress on Drinking Water and Sanitation: 2014 Update.” World Health Organization
(WHO) and UNICEF 2014. Geneva, Switzerland.
Keely, M. (1983). “Values in Organizational Theory and Management Education.” The Academy of
Management Review, 8 (3), 376-386.
Linstone, H. A. ,and Turoff, M. (1975). “The Delphi method: Techniques and applications.” Addison-
Wesley, Reading.
Lockwood, H., and Smits, S. (2011). “Supporting Rural Water Supply: Moving Towards a Service Delivery
Approach.” Practical Action Publishing Ltd.
Lockwood, H., Bakalian, A., and Wakeman, W. (2003). “Assessing Sustainability in Rural Water Supply:
The Role of Follow-up Support to Communities.” Literature Review and Desk Review of Rural
Water Supply and Sanitation Project Documents, Britain.
Loucopoulos, P., and Kavakli, E. (1995). “Enterprise Modeling and the Teleological Approach to
Requirements Engineering.” International Journal of Cooperative Information Systems, 4 (1), 45-
79
Luftman, J.N. (2003). “Assessing IT-Business alignment.” Information Systems Management, 20 (4), 9-
15.
Mills, G. R., Austin, S. A., Thomson, D. S., and Devine-Write, H. (2009). “Applying a Universal Content
and Structure of Values in Construction Management.” Journal of Business Ethics, 90, 473-501.
70
Montgomery, M. A., Bartram, J., and Elimelech, M. (2009). “Increasing Functional Sustainability of
Water and Sanitation Supplies in Rural Sub-Saharan Africa.” Environmental Engineering Science,
26(5), 1017-1023
Pearce-Oroz, G. (2011). “Rural Water Supply and Sanitation Challenges in Latin America for the Next
Decade.” Water and Sanitation Program, World Bank.
Prokopy, L., Thorston, R., Bakalian, A., and Wakeman, W. (2008). “Evaluating the Role of
Postconstruction Support in Sustaining Drinking Water Projects.” Journal of Planning Education
and Research, 27, 294-305.
Pushpangadan, K., and Gangadhara M. (2008). “On the measurement of sustainability of rural water
supply in India: A Supervaluationist-Degree Theory approach.” Centre for Development
Studies, Prasanth Nagar. February 2008.
QSR International Pty Ltd. (2012). NVivo qualitative data analysis software.
Rokeach, M. (1973). “The Nature of Human Values.” The Free Press, New York.
Rosenblueth, A, Wiener, N., and Bigelow, J. (1943). “Behavior, Purpose and Teleology.” Philosophy of
Science, 10, 18-24.
R-Project (2015). R-Project for Statistical Computing. www.r-project.org
RWSN (2010). “A vision for achieving sustainable rural water services for all.” Field Note No 2011-9.
RWSN Executive Steering Committee.
Saaty, T. L. (2008). “Relative Measurement and Its Generalizations in Decision Making: Why Pairwise
Comparisons are Central in Mathematics for the Measurement of Intangible Factors – The
Analytical Hierarchy/Network Process.” Rev. R. Acad. Cien. Serie A. Mat. (RACSAM), 102(2), 251-
318.
Scott, J. (2000). “Social Network Analysis: A Handbook.” SAGE Publications Ltd, 2nd Edition, March 2000.
Smits, S., Tamayo, S., Ibarra, V., Rojas, J., Benavidez, A., and Bey, V. (2012). “Gobernanza y
Sostenibilidad de los sistemas de agua potable y saneamiento rurales en Columbia.” Banco
Interamericano de Desarrollo. www.iadb.org.
Stewart, D. W. (2014). “Focus Groups: Theory and Practice.” SAGE publications, Inc., 3rd Edition, March
20, 2014.
Turnstone, L.L. (1927). “A Law of Comparative Judgment.” Psychology Review, 34, 273-286.
Vaidya, A., Mayer, AL. (2014). “Use of the participatory approach to develop sustainability assessments for natural resource management.” International Journal of Sustainable Development and World Ecology. 21(4), 369–379.
71
WASH Sustainability Charter (2013). Sustainablewash.org
Wasserman, S., and Fraust, K. (1994). “Social Network Analysis: Methods and Application – Structural
Analysis in the Social Sciences (Book 8) .” Cambridge University Press. 1st Edition, November 25,
1994.
WaterAid (2011). “Sustainability Framework.”
Whittington, D., Davis, J., Prokopy, L., Komives, K., Thorston, R., Lukacs, H., Bakalian, A., and Wakeman,
W. (2009). “How well is the demand-driven, community management model for rural water
systems doing? Evidence from Bolivia, Peru and Ghana.” Water Policy, 11, 696-718.
Wiener, Y. (1988). “Forms of Value Systems: A Focus on Organizational Effectiveness and Culture Change
and Maintenance.” The Academy of Management Review, 13(4), 534-545.
Williamson, T., Agha, Z. K., Bjornstad, L., Twijukye, G., Mahwago, Y., and Kabelwa, G. (2008). “Building
Blocks or Stumbling Blocks?” The Effectiveness of New Approaches to Aid Delivery at the Sector
Level. Overseas Development Institute. Working Paper 6.
Winn, M.I. (2001). “Building Stakeholder Theory with a Decision Modeling Methodology.”Business
Society ,40(2), 133-166.
Wossen, T., Berger, T., Mequaninte, T., and Alamirew, B. (2013). « Social network affects on the adoption of sustainable natural resource management practices in Ethiopia. International Journal of Sustainable Development & World Ecology. 20(6), 477–483.
Zhang, X., Austin, S., Glass, J., and Mills, G. (2008). “Toward collective organizational values: a case study
in UK construction.” Construction Management and Economics, 26(10), 1009-1028.
72
CHAPTER 4 – STRATEGIC PLANNING OF RURAL WATER
DEVELOPMENT: A SYSTEMS-BASED UNDERSTANDING OF LOCAL
IMPACT FACTORS
Keywords: sustainability; rural water development; Nicaragua; graphical modeling; networks
ABSTRACT
The success or failure of rural water systems is a result of numerous factors that interact in a
complex set of connections that are difficult to separate and identify. This research effort presented a
means to empirically reveal the interactions of factors that influence rural water project success or
failure in Darío and Terrabona, Nicaragua. To accomplish this, the study employed graphical modeling
to build and analyze factor networks. Influential factors were first identified by qualitatively and
quantitatively analyzing transcribed interviews from community water committee members. Factor
influences were then inferred by graphical modeling to create factor network diagrams that reveal the
direct and indirect interaction of factors. Finally, network analysis measures were used to identify
“impact factors” based on their influence within each factor network. Findings from this study showed
the systematic nature of such factor interactions in both Darío and Terrabona, and highlighted key areas
for programmatic impact on project success for both municipalities. Specifically, in Darío, the impact
areas related to the importance of community water committees, while in Terrabona, the impact areas
related to the importance of appropriate project implementation and capacity building by external
organizations. Overall, this study presents a rigorous and useful means to identify impact factors as a
way to facilitate the thoughtful planning and evaluation of rural water services in developing countries.
73
INTRODUCTION
The challenges of providing sustainable access to rural water services in developing countries
often go far beyond that of the technology itself (Chatterley 2012; Kaminsky 2014). Indeed, many water
projects tend to fail or operate suboptimally due to a myriad of social, environmental and political
factors that confound long-term system functionality (RWSN 2010; Lockwood et al. 2003; Wateraid
2011; Davis 2014). In most cases these factors are interconnected. As a result, they interact as a
system, producing outcomes that are often difficult to plan for or adapt to (WaterAid 2003; Sara and
Katz 1997; Wateraid 2011; Ramalingham et al. 2008; Ramalingham 2014). While water sector literature
has identified a number of important factors that affect the sustainability of rural water infrastructure,
there is limited research that specifically addresses the systemic nature of factor interactions.
Improving understanding on how factors interact as a system would aid in more thoughtful rural water
project design by allowing practitioners to plan initiatives that target specific programmatic areas that
yield the greatest overall impact, which this study calls impact factors. Thus, the aim of this study was to
investigate how factors that influence rural water project sustainability actually interact as a system.
To accomplish this aim, the study used qualitative and quantitative data analysis methods that
culminate with graphical modeling to display this systemic interaction of factors that in the form of
factor networks. The techniques presented in this paper are demonstrated using a case study of rural
water system functionality in Darío and Terrabona, Nicaragua. Specifically, this study aimed to answer
the following research questions:
RQ1: What are the factors that influence functionality of rural water services in Terrabona and
Darío Nicaragua?
RQ2: How do these factors form interconnected networks?
RQ3: Based on an understanding of factor interaction as a network, what are the most
important factors for long-term functionality of rural water services in Darío and Terrabona?
RQ4: How do systemic factor interactions differ between Darío and Terrabona?
74
To answer these questions, data was obtained using semi-structured interviews with community
water committee members in charge of water system maintenance in Darío and Terrabona Nicaragua.
Interviews were then analyzed to identify recurring factors that appeared influential to water project
sustainability. Once these factors were identified, graphical models were used to map conditionally-
dependent connections that existed between these factors as a way to build factor networks. Factor
networks were then structurally analyzed using point and graph betweenness centrality measures to
identify impact factors. The findings from this research are presented as programmatic
recommendations for Darío and Terrabona based on the identified impact factors
BACKGROUND
The identification of influential factors for project sustainability – along with development of
assessment and evaluation methods to analyze the impact of these factors on rural water system
sustainability – has been the focus of many research efforts within the water sector over the past two
decades. As a testament to this level of sector attention on the subject of sustainability, a recent study
of water sector literature by Walters and Javernick-Will (2015) identified 93 articles that focused
specifically on rural water project sustainability. They identified 157 unique factors that influence long-
term water system functionality, which they aggregate down to 25 sub-factors and 8 “sustainability
factors” (Table 4-1).
75
Table 4-1: Sustainability factors found in water sector literature (Walters and Javernick-Will 2015)
Sustainability Factor
Sub- Factors Definition
Government
Laws & Policy The ability and willingness of local government to provide the necessary expertise and resources to help operate, maintain, monitor, and eventually replace the rural water system.
Management
Governance
Community
Participation The necessary demand present in a community to properly use, operate, monitor, maintain, and eventually replace the rural water system.
Demand
Satisfaction
External Support Type of Support An external organization or agency to provide the necessary expertise
and resources to help operate, maintain, monitor, and eventually replace the rural water system.
Cooperation
Post Const. Supp.
Management
Maintenance A water services management scheme to support the permanent and continually high functioning operation of a rural water system through proper operation, maintenance, and monitoring.
Skilled Operator
Women Involvement
Financial
Cost Recovery A water system management entity (community, external organization/ agency, and/or governing body) to financially support the costs associated with the operation, maintenance and eventual replacement of the rural water system.
Financial Management
Cost of system or part
Technology Construction &
Materials
Spare Part Availability Appropriate technology, skilled labor, and spare parts to satisfactorily construct, operate and maintain a rural water system.
Tech. Appropriateness
Construction Quality
Environment & Energy
Resource Management The ability of the available water resources to provide a continuously sufficient amount of clean water to meet the long term needs of the community and the ability of the energy infrastructure, typically in the form of electricity, to support the continual water system functionality.
Source Protection
Energy Avail/Reliable
Water System Functionality
Quality The quality of the water as it compares to the country standards for drinking water quality
Quantity The quantity of water provided by the system as it compares to country standards for the requisite amount of water provided per person per day
Reliability The duration of continuous operation of the water system without water shortages or system break-downs
Coverage The availability of water services to users
Many of these same sustainability factors shown in Table 4-1 have been used as metrics and
indicators within quantitative evaluation tools that assess the potential for water project sustainability,
both for existing and future projects. In a study by Lockwood et al. (2003), a typology of these
evaluation tools was presented as those which either assess sustainability using “tabular analysis” or
“regression-based analysis”. Both types of tools have advantages and limitations in their application and
analytical ability.
Tabular analysis tools evaluate survey data by scoring and aggregating factors to derive a
composite score usually presented as frequencies, averages or percentages that relate to some level or
The case study method using qualitative data collection and analysis was chosen to provide rich,
process-based insight into research questions that are exploratory in nature, and was deemed well-
suited for the purpose of collecting data that provided insight into factor interaction (Yin 2002; Maxwell
2004). A multiple-site case study was chosen for its ability to obtain data that can be spatially and
contextually interesting. Conjointly, this provides a more compelling and robust foundation for the
propositions made within the data analysis and interpretation process (Yin 2002; Herriot and Firestone
1983). The cases were embedded multiple case designs, where the embedded unit of analysis was set at
79
the community level (Yin 2002). In other words, the unit of analysis within Terrabona and Darío was set
at the community itself where a particular water system exits. In each of the municipalities, data were
collected by semi-structured interviews with community water committee members and through
observations taken while in each community. Community water committees are elected members from
the community who are in charge of the basic operation and maintenance of the community water
system. For this interview process, each community was randomly sampled. Throughout the three-
month case study time period, it was possible to visit 32 randomly sampled communities in Darío and 22
in Terrabona.
Interview questions were intentionally kept open-ended and directed towards various aspects
that could influence functionality of rural water infrastructure within each community. An influence on
water system functionality was considered to exist if said factor were to influence water quality,
quantity, or continuity (reliability) of the water provided by the system. For example, questions were
asked such as, “How well is your water system functioning”, and, “Have there been situations where the
water system is not functioning properly? If so, why?”. These types of questions allowed water
committee members to tell meaningful stories about how or why their water system was functioning
and later provided the needed data for qualitative analysis used to identify factors.
Observational data focused primarily on factors related to the functionality of the water systems
themselves, specifically, water reliability (how often the water system was out of service), and water
quality. System reliability was assessed by asking interviewees to indicate how often the water system is
out of service. Water quality was evaluated by: (i) water quality tests and (ii) the identification of
potential pollution risks (presence of nearby animals, pit latrines, etc.). Water quality at the time of
sampling was based on the presence or absence of fecal coliforms using PathoScreen Field Test kits
which take 24 to 48 hours to display presence (sample turns black), or absence (no perceivable color
change in sample) (Hach 2015).
80
DATA ANALYSIS – QUANTIFICATION
Interviews were transcribed and then analyzed for emerging themes through the process of
qualitative coding following the best practices of Miles and Huberman (1994), using QSR NVivo 10
software (QSR International Pty Ltd. 2012). Qualitative codes were used to identify portions of
transcribed text that fit within recurring themes and patterns that existed between interviews. Specific
attention was paid to factors that appeared to relate to the long-term functionality of infrastructure
(e.g., finances, existence of a water committee, etc.). All codes were then aggregated into themes, and
then into factor groups to allow conversion of the data into a quantitative format to later be analyzed
with graphical modeling. Although the process of minimizing the number of variables in the model
through theme and factor aggregation presumably simplified the complexities present in both Darío and
Terrabona contexts – the authors felt any gains in providing a richer description in the form of more
factors would later present difficulties in interpreting model structure for reasons mentioned later in the
methods section regarding model fitting.
The quantitative format for data was kept discrete, either “yes” or “no” for each factor to aid in
graphical modeling. This process eliminated subjective scoring and subsequent bias on the part of the
researcher. As an example of binary factor quantification, if one particular reason given by an
interviewee for why their water system was not functioning properly was the “insufficient maintenance
and financial support due to frequent conflicts between community members” – the factor “conflicts”
would be marked as “yes” for that particular community sampled. If the same community experienced
substantial seasonal fluctuations in groundwater level which often caused water shortages, the factor
“water resources” would be marked as “yes” as well for that community. In summary, what resulted
from the qualitative analysis was a list of recurring factors that emerged between each community,
where the presence or absence was then quantified for each factor as either “yes” or “no” for each
community.
81
DATA ANALYSIS – GRAPHICAL MODELING AND NETWORK ANALYSIS
Graphical modeling is a tool for performing multivariate analysis that uses networks to
represent models through the identification and subsequent graphing of conditional dependencies
between model variables (Edwards 2000, Højsgaard 2012). In these networks, vertices (nodes) are
connected by lines (edges) if a conditional dependency exists. Conversely, the absence of a line
indicates a conditional independence between two nodes. For example, in Figure 4-1 it can be seen that
one edge between nodes is not drawn, namely . This means is conditionally independent of
given the configuration with and , or , which means there is no line drawn between
and . An absence of this connection presumably means that and do not influence one another.
In this study, graphical modeling provided the ability to build factor networks, where network nodes
represented factors, and lines represented influences between these factors.
Figure 4-1: An example graphical model
Graphical Model Fitting
In graphical modeling, log-linear models are typically used to fit discrete data, whereas graphical
models using continuous data are typically based on multivariate normal distribution analogous to log-
linear models, also known as Gaussian graphical models (Edwards 2000). Since the data in this study
were discrete (dichotomous) data, a log-linear model was used to fit the data sets. One of the primary
difficulties with using graphical modeling to fit a multivariate data set is choosing between a myriad of
different well-fitting model structures (Whittaker 1990). This is because in the case of even a 15 node
82
undirected graph (a model where edges are not explicitly directional), the number of possible
undirected graphs is 4.05 x 1031 (Højsgaard 2012). Thus, the likelihood of having the true optimally best-
fit model is small, especially when the number of variables is high. However, in the case of this research,
an optimal fit was deemed less important than a “good-fit” model that helps gain insight into the
implication of systemic factor interaction (Amadei 2015).
Because this research focuses on the exploratory development of factor structures, this study
used a stepwise method of model selection (Edwards 2000; Højsgaard 2012). The stepwise model
selection method is an iterative process where a graphical model (in this case, a factor network) is
chosen that optimally fits a particular statistical criteria for model significance. Højsgaard (2012)
suggests a criteria based on maximum likelihood, which considers a set of models Ԑ(j) for
where the best model is selected based on the Ԑ(j) that minimizes -2log , where
is the maximum likelihood under the model and is the number of free parameters in the model
Ԑ(j), and is a penalty parameter. Two popular values for k are 2 (Akaine Information Criterion (AIC)
(Akaine 1974)) and the Bayesian Information Criterion (BIC) (Schwarz 1978) which sets k = log( , where
is the number of observations.
With the designation of emergent factors into a binary data format (performed in the previous
section), it was possible to run a stepwise analysis to iteratively fit probabilistic dependencies between
factors. R-Project statistical software was used to perform these analyses using the packages gRim to
perform the graphical modeling analyses, and igraph to plot the graphical model (Højsgaard 2013).
Once a graphical model was built for both Terrabona and Darío, these models were structurally analyzed
with betweenness centrality. Betweenness centrality was the choice method for structural analysis as it
allowed the evaluation for how factors “bridged” to one another as a system, thereby identifying the
structural importance of each factor as a function of the other factors (Freeman 1977; Scott 2000;
Borgatti 2005). For this study, betweenness centrality was used to see how factors structurally combine
83
together to directly and indirectly influence sustainability of rural water infrastructure in Terrabona and
Darío.
Betweenness centrality scores were calculated both for the factors themselves (known as point
centrality) as well as for the entire graph (known as graph centrality). Point centrality (from this point
forward referred as factor centrality) scores were calculated for each factor to allow for factor
comparison to identify impact factors. Calculation of factor centrality scores was accomplished by
analyzing the resulting adjacency matrix for each graphical model using the R-package statnet (Acton
and Jasney 2012). The adjacency matrix houses information regarding where edges exist between nodes
in a network. The equation used to calculate a betweenness score for an undirected graphical model (a
model where edges are not directional) is shown below. Betweenness scores for Terrabona and Darío
graphical models were then ranked from high to low to allow a basis for score comparison using the
equation below:
Where:
= the betweeness centrality score for a particular factor
= the factor of interest
= the total number of shortest paths that pass between factor and factor
= the number of those shortest paths that pass through factor
Graph centrality (from this point forward referred as network centrality) allowed for additional
structural comparison between the whole factor networks built for Darío and Terrabona by direct
comparison between graph structures using the normalized distribution of point centrality scores
(Freeman 1979). Calculation of network centrality required the use of factor betweenness centralities
, for each graphical model. These factor betweenness centralities were used to find network
84
centralities for Darío and Terrabona using the equation below, which compares the largest factor
betweenness score within a factor network with all other scores in the network (Freeman 1979).
Where:
= the normalized network centrality score
= the most central factor for based on betweenness centrality
= betweenness centrality for each factor in the network
= the maximum graph centrality based on betweenness, for a wheel or
star = , used to normalize the network centrality score
the total number of factors in the graph
Factor Network Building:
To build factor networks, the binary factor data were first imported into R-Project. Then, these
data were fit with a log-linear model using the dmod function of gRim, designated as an undirected
graph, since the direction of influence was assumed unknown. A best-fit model was then selected using
the stepwise function of gRim considering the statistical criterion as AIC and the type of analysis based
on decomposable graphs to enable calculation of MLE with the penalty parameter, , set to 2 for a true
AIC model fit, per best modeling practices (Højsgaard 2012). The stepwise function performs a stepwise
analysis of either backward selection (removing lines from an initial graphical model, where lines initially
exist between all factors at the first iteration) or forward selection (adding lines between factors, where
no lines initially exist at the first iteration). However, for the model fitting in this study, backward
selection was chosen per best practices indicated by Højsgaard (2012). Then, igraph was used to plot
the emerging factor dependency graph (factor network), and each factor network was analyzed as an
adjacency matrix using the betweenness function of statnet with the analysis mode set for an undirected
graph to calculate factor centrality. These factor centrality scores were then ranked for later
comparison. Lastly, network centrality was calculated for both Terrabona and Darío graphs using the
85
factor centrality scores from the previous step. The overall process for building graphical models used to
create factor networks and perform structural analyses, is shown in Figure 4-2.
Figure 4-2: The factor network building and analysis process
RESULTS & DISCUSSION
This section presents the results of the analyses from the data collected in Darío and Terrabona.
First, it presents and describes the factors that emerged through qualitative analysis of the interview
and survey data, and then describes the method and rationale for factor quantification. Second, it
displays the results from the graphical modeling and discusses similarities and differences between
factor interaction in the context of Terrabona and Darío using betweenness centrality measures. It then
proceeds with a discussion of the findings from these analyses.
FACTOR IDENTIFICATION AND QUANTIFICATION
The transcribed interviews coupled with field observation allowed for the coding of recurrent
themes between the communities in Darío and Terrabona. Recurrent themes were coded for two
reasons: (i)because they signified factors that were consistently important for long-term water system
functionality; and (ii) because graphical model building required the use of consistent factor
comparisons for each sampled community to evaluate conditional independence between factors.
Themes of interest related specifically to aspects that appeared to enable or hinder the long-term
functionality of the water system. For example, one important recurring theme – community
86
“organization” – appeared to influence the community’s ability to make timely water system repairs, as
mentioned by one water committee member:
“If there is a problem with the water system it always gets resolved quickly because of
the level of organization we have in the community. When we say we need to organize,
we always do it, including when we need to clean up garbage in our community”.
Below is a similar example for the recurring theme of water user fees (tariffs):
“Members of this community need to pay 20 pesos per month for their water services. If
they don’t pay we cut their water services.”
In this same way, each recurring theme that related to an effect on long-term functionality was noted
and classified (Table 4-3). Each of these themes was then aggregated into factors to create a model that
was easier to interpret, while preserving contextual richness (Højsgaard 2012).
87
Table 4-3: Coded themes
Themes Definition
Organization Organization of the community: regularly holding and attending meetings to discuss aspects of water system maintenance
Conflicts People refusing to pay their user fees causing problems with tariff collection and saving
Source Protection: Clean
Cleanliness around the source: free from garbage that could seep into the water table
Source Protection: Fenced
Area around the source is fenced off from animals to avoid fecal contamination
Source Protection: Forested
Area around the source is forested to ensure an accessible water table
Government Support Consistent support offered by the government: technical, material, and soft resources (training and education)
Water Committees The existence of a water committee to manage the water system
Road Conditions Viable transportation into and out of community all year to acquire necessary materials for water system maintenance and repair
Material Availability Having ready access to quality materials
Appropriate Tech. Technology is affordable for the community
External Support Consistent support from an outside organization, both technical and training
Tariff Payment Monthly collection of user fees to maintain sufficient savings
Sufficient Savings A savings account to pay for system maintenance and repairs
Water Shortages Reliability of the service in providing water all year round
Water Quality Water quality based on the presence of fecal coliforms
Water Quantity Sufficient water (over 20 liters per person, per day (Howard and Bartram 2003) is provided to users
Table 4-4 shows how the themes above were aggregated within the factor groups: Water
System Functionality, Community, Government, External Support, Finances, Water Resources,
Technology, Infrastructure, and Management. For example, as the predominant water system
management scheme that exists in both Darío and Terrabona is “Community-based Management” (a
management scheme where the community is solely responsible for the operations and maintenance of
the water system) the theme Water Committee was changed to the factor Management. Similarly,
because all three aspects of source protection are important for water quality (fencing to keep out
animals and overall cleanliness around the source) and quantity (forestation), these three themes were
88
combined into the factor Water Resources. In this way, each theme was placed within a factor group,
where in many cases the factor group housed only one theme.
Once factors were created, data quantification entailed reviewing each interview and
designating either “yes” or “no” for the presence or absence of each factor for each community. For
example, in the case of Water System Functionality, if water quality tests in a community revealed the
source was clean (no presence of fecal coliforms) AND if members of the households both indicated
enough water was available in ample amounts all year round –“yes” would be designated in the place of
Water System Functionality. Thus, quantification of each factor followed a similar rationale, as displayed
in Table 4-4. While this form of factor quantification introduces potential subjectivity, strict attention to
consistency was maintained, and the process was undertaken in order to facilitate the next step of
graphical modeling using binary factor values.
Table 4-4: Factors
Criteria
Factor Associated Theme yes no
Water System Functionality
Water quality, quantity, and shortages all 3 <all 3
Community Organization of the community: regularly holding and attending meetings
yes no
Government Community frequently receiving help from government yes no
External Support
Community frequently receiving help from organizations yes no
Finances Regular collection of monthly user fees, and sufficient savings both <both
Water Resources
Protection of the source: clean surrounding, fenced and well-forested
all 3 <all 3
Technology Appropriate technology: viable supply chain and cheap materials both <both
Infrastructure Viable transportation into and out of community all year yes no
Management Existence of a well-organized community water committee yes no
STRUCTURAL ANALYSIS OF FACTOR NETWORKS
By identifying and quantifying factors in binary terms (yes or no), it was possible to build
graphical models to represent factor interaction for Darío and Terrabona. The factor networks that
89
emerged from these analyses for Terrabona and Darío are shown below in Figure 4-3. In these
networks, the circles represent factors and the lines represent a conditional dependence between two
factors.
Figure 4-3: The graphical models for factors in Darío (top) and Terrabona (bottom), WSF = Water System
Functionality.
90
GRAPHICAL MODEL INTERPRETATION
The completion of the factor and theme identification in addition to the network graph
construction provided the starting point for graphical model interpretation. This step in the process
would effectively allow the researcher as well as policy maker to identify the connections – as well as
absence of connection – between the factors that influence sustainable rural water systems. Specifically
the graphs allow analysis of direct and indirect influences between the factors and the final water
system performance.
By direct observation of the graphical models presented above (Figure 4-3), it can be inferred
how each of the factors are directly and indirectly connected with the factor Water System Functionality
(WSF in Figure 4-3). In the case of Darío, the factor Water System Functionality is directly connected only
to Management and Community, meaning there are more indirect influences on water system
functionality that direct. For Terrabona, Water System Functionality is connected to all factors other
than Government, meaning there are more direct influences on water system functionality than indirect.
It may also be seen that this lack of connection between government and water system functionality is
one main similarity which exists for both Darío and Terrabona factor networks. On the whole, Water
System Functionality in Terrabona appeared to be influenced by more factors than it is in Darío. These
graphical images give a concrete tool to assist in approaching projects in these two locations in a very
different manner.
A second level of graphical analysis may now be performed using the centrality measures
introduced in Table 4-5 below. Table 4-5 demonstrates that structural differences exist between the
factors for the two municipalities. High factor centrality scores imply importance or impact for these
factors, due to their ability to bridge between other factors that potentially influence Water System
Functionality. In the case of Darío, the ranked betweenness scores indicate the most impactful factors
are water system Management (ranked 1) and Community (ranked 2). In the case of Terrabona, Water
91
Resources, External Support and Finances were found to be most important (ranked 1), whereas
compared to Darío, Community was found to be less impactful (a lower factor centrality). These
implications in betweenness scores are reinforced with an overall graph centrality sore of 0.1317 for
Darío and 0.0234 for Terrabona, meaning factor centrality scores are greater in Darío (indicating higher
potential impact) than in Terrabona. Therefore, because Darío has higher factor centrality scores
overall, it is easier to identify areas where strategic programmatic changes may have the greatest
impact, since Management and Community are clearly the top-ranked factors. It is more difficult,
however, to locate impact areas for Terrabona, which has three factors that are in the top rank, and
lower scores than Darío’s for these top ranked factors.
Table 4-5: Ranked factor betweenness centrality scores for Darío and Terrabona based on the graphical models (normalized network centrality scores on bottom row)
Jordan, E., Gross, M.E., Javernick-Will, A.N., and Garvin, M.J. (2011). “Use and misuse of Qualitative
Comparative Analysis: A Promising Approach for Construction Research.” Construction
Management and Economics, 29(11), 1159-1173.
Lockwood, H., Bakalian, A., and Wakeman, W. (2003). “Assessing Sustainability in Rural Water Supply:
The Role of Follow-up Support to Communities.” Literature Review and Desk Review of Rural
Water Supply and Sanitation Project Documents, Britain.
Maxwell, J.A. (2004). “Qualitative Research Design: An Interactive Approach.” SAGE Publications, Inc;
2nd Ed
Miles, M.B., and Huberman, M.A. (1994). “Qualitative Data Analysis: An Expanded Sourcebook.” SAGE
Publications, 2nd Edition.
Mukherjee, N., and Wijk, C. (2003). “Sustainability Planning and Monitoring in Community Water Supply
and Sanitation: A Guide on the Methodology for Participatory Assessment (MPA) for
Community-Driven Development Programs.” World Bank Water and Sanitation Program (WSP).
97
Narayan, D. (1995). “The Contribution of People’s Participation: Evidence from 131 Rural Water Supply
Projects.” Environmentally Sustainable Development Occasional Paper Series No. 1. The World
Bank, Washington D.C.
QSR International Pty Ltd. (2012). “NVivo qualitative data analysis software.”
Ramalingham, B. (2014). “Aid on the Edge of Chaos.” Oxford University Press; 1st Ed., January 3, 2014
Ramalingham, B., Jones, H., Toussaint, R., and Young, J. (2008). “Exploring the science of complexity:
Ideas and implications for development and humanitarian efforts.” Working Paper 285.
Overseas Development Institute, 111 Westminster Bridge Road, London.
RWSN (2010). “A vision for achieving sustainable rural water services for all.” Field Note No 2011-9.
Rural Water Supply Network (RWSN) Executive Steering Committee.
Sara, J., and Katz, T. (1997). “Making Rural Water Supply Sustainable: Report on the Impact of Project
Rules.” UNDP, World Bank Water and Sanitation Program.
Schwarz, Gideon E. (1978), "Estimating the dimension of a model.” Annals of Statistics, 6(2), 461–464
Schweitzer, R. and Mihelcic, J. (2012). “Assessing sustainability of community management of rural
water systems in the developing world.” Journal of Water, Sanitation and Hygiene for
Development, 2 (1), 20-30.
Scott, J. (2000). “Social Network Analysis: A Handbook.” SAGE Publications Ltd, 2nd Edition, March
2000.
Sugden, S. (2001). “Assessing sustainability – the sustainability snap shot.” 27th WEDC Conference:
People and Systems for Water, Sanitation and Health. Lusaka, Zambia 2001.
USAID (2013). “WASH Sustainability Index Tool.”
Walters, J.P., and Javernick-Will, A.N. (2015). “Long-term Functionality of Rural Water Services in
Developing Countries: A System Dynamics Approach to Understanding the Dynamic Interaction
of Factors.” Environmental Science and Technology. DOI: 10.1021/es505975h.
WaterAid (2011). “Sustainability Framework.”
WaterAid Malawi (2003). “Indicators for the water sector: examples from Malawi.”
Whittaker, J. (1990). “Graphical Models in Applied Multivariate Statistics.” Wiley Series in Probability &
Statistics. 1st Edition.
WSP (1996) “Sustainability Monitoring: The VIP Way”. Water and Sanitation Program - South Asia.
Yin, R. (2002). “Case Study Research: Design and Methods (Applied Social Research Methods).” SAGE
Publications, Inc . 3rd Edition.
98
CHAPTER 5 – SUMMARY OF MAJOR FINDINGS AND CONCLUSIONS
“Being less surprised by complex systems is mainly a matter of learning to expect,
appreciate, and use the world's complexity."
- Meadows 2008
“Remember that all models are wrong; the practical question is how wrong do they have
to be to not be useful”.
- Box and Draper 1987
“A reinforcing feedback loop [was] drawn by three first‐grade boys that helped them
take an endogenous view and see their own roles in their repeated playground
arguments and they owned it. Realizing that mean words hurt feelings and set up the
likelihood of more mean words enabled the boys to think about ways they could break
the spiral. The boys have internalized at least some of the lessons here. At one point two
of them got into an argument cleaning up the classroom, tussling over putting away the
same chair. The third interrupted them: ‘Guys! Remember the loop!’ And the two
fighting over the chair backed off, each offering it to the other to take care of: ‘You take
it.’ ‘No, you….’ They [were] beginning to see themselves in the dynamics they
experience.”
- Richardson 2011
INTRODUCTION
The body of this dissertation (Chapters 2 through 4), presented three unique studies that share
the unified objective of gaining insight into rural water service sustainability in developing countries by
mapping and analyzing the interaction of influential factors. The purpose of this final chapter is to
summarize the combined findings of these three studies, and to discuss their theoretical and practical
implications as a whole. Additionally, this chapter aims to highlight potential limitations that exist as a
result of the research methods employed, and proposes future research that might address these
limitations while fortifying and expanding upon the exciting prospects of system-based analysis
techniques for sustainable development.
99
MAJOR FINDINGS – CONTRIBUTION TO WATER SECTOR THEORY
This research provides two overarching theoretical findings that contribute to the water sector
body of knowledge regarding the complex aspects of rural water service provision in developing
countries, and the merit for systems approaches that consider the complexities inherent in rural water
service development. First, it showed that although many of the same factors were found across the
studies to influence long-term rural water functionality based on literature, expert and stakeholder
opinion, and field data; the way in which factors interact is largely dependent on context. Second, it
presented clear evidence that the factors that influence long-term functionality are interconnected as a
complex system and change over time. These major findings are presented in more detail below.
THE INFLUENCE OF CONTEXT ON FACTOR INTERACTION
Factor interaction (or “structure”) was found to be largely controlled by the region of study (i.e.,
Terrabona and Darío, Chapters 3 and 4), and the opinions of the experts and stakeholders (Chapters 2
and 3). Interesting similarities and differences between factor structures emerged as a result of these
two contexts, and provided compelling evidence for the need of sustainability assessment and planning
tools that can adapt to unearth, analyze, and consider these complexities for a wide array of contexts.
It makes logical sense that the geographical region of study affects the level of influence from
factors on water system functionality, such as the type of technologies and construction materials that
are available, the type of management schemes that are used, or the environmental constraints that
affect water resources. In the same way, one might expect marked structural differences between
factors based on the opinions of water experts and project stakeholders within a particular region.
However, while the influence of these contexts is indeed obvious, the research presented here
demonstrates a novel means to visually and quantitatively assess these seemingly invisible differences.
A useful example of the power of the systems-based methods employed in this research can be made
100
through comparison of factor diagrams and networks that emerged in Chapters 2 through 4, again using
normalized betweenness centrality scoring. Table 5-1 summarizes this comparison using the normalized
factor betweenness scores (factor impact based on point centrality – described in Chapter3 p. 55 and
Chapter 4 p. 85), and overall normalized graph centrality scores (entire network – described in Chapter
4, pp. 85), for both opinion and field-based factor networks, respectively. As was done in Chapters 3
and 4 these betweenness scores are normalized from high to low for the purpose of cross-comparison.
Table 5-1: Normalized betweenness score comparison summary from all three studies, where G&P = Government & Politics, Man = Management, T&E = Training & Education, Com1 = Communication, WSF = Water System Functionality, WR = Water Resources, Fin = Finances, Ext = External Support, Tech = Technology, Infra = Infrastructure, Com2 = Community, ND = No Data, Exp = Experts, Dar = Darío, Terra = Terrabona
WC1 Org2 Gov3 Aca4 Exp5 Dar6 Terra7 T&E 0.317
0 Fin 0.337
3 WSF 0.400
0 G&P 0.293
7 Fin 0.311
0 Man 0.285
7 Fin 0.065
Fin 0.2917
Com2 0.2103
Fin 0.4000
Fin 0.1258
Man 0.1277
Com2 0.1250
WR 0.065
WSF 0.2277
Tech 0.1429
G&P 0.3667
WR 0.1190
WSF 0.1000
WR 0.0179
Ext 0.065
Tech 0.0714
G&P 0.1429
Man 0 WSF 0.0722
Com2.
0.0611
G&P 0.0179
Com2 0.006
Man 0.0104
Man 0.1032
WR 0 Tech 0.0425
WR 0 Ext 0.0179
WSF 0.006
G&P 0.0104
Infra 0.0675
Com1 0 Com2 0.0425
Tech 0 WSF 0 Tech 0.006
WR 0 WSF 0.0198
T&E 0 Ext 0.0107
G&P 0 Fin 0 Infra 0
Com1 0 WR 0.0000
Tech ND Infra 0.0079
Ext ND Infra 0 G&P 0
Ext 0 Com1 ND Com2 ND Man ND Infra ND Tech 0 Man 0
Base on these cross-comparisons between factor betweenness scoring for both opinion and
field-based data one may deduce that regardless of the differences in context, “Finances” is the most
impactful factor for the sustainability of long-term water system functionality; namely that sufficient
funds are available to operate and maintain the water system. In contrast, the least impactful factor
based on opinion and field-based data appears to be “Technology”; namely, the selection of an
appropriate technology based on cost, and available materials. These results present additional insight
into rural water service sustainability theory by aligning with the shifting focus of the water sector away
101
from technological approaches towards market-based approaches that foster viable income streams for
sustaining rural water infrastructure.
In contrast, as a testament of the influence of context on factor interaction, Table 5-1 shows
marked structural differences exist between factor networks based on both factor (point) and network
(graph) betweenness centrality scores for the opinion and field-based data sources. Differences in these
factor structures imply a potential disconnect between what practitioners and stakeholders viewed as
impactful on sustainable rural water services versus what field-based evidence shows is impactful. The
first representation of this difference is the relative impact of the factor “Water Resources”. For water
resources, stakeholders and experts indicated a very low impact (other than the Academics stakeholder
group), when it fact it was found to be significantly impactful in Darío, and especially in Terrabona based
on field data. A second difference exists between the normalized graph centrality for opinion and field
data. For opinion-based data, the range in graph betweenness centrality is relatively high (0.234 to
0.272), whereas for field-based data, the range is relatively low (0.023 to 0.132). A lower graph
centrality score (such as for the field-based factor graphs) means each factor has relatively the same
impact, or in other words, they are all equally influential or “connected”. In contrast, a higher graph
centrality scores (such as for the opinion-based factor graphs) means one particular factor is
comparatively more important than the other factors. This means the factor structures formed by
experts and stakeholder opinion revealed factors that were comparatively more important or impactful
than what was found in the field, implying that while these practitioners may indicate certain factors are
more important than others, it is possible that, in reality, a multitude of factors are equally important
and interconnected. These findings place further precedence on fully considering the unique interaction
of factors based on the study context, and the importance of considering factor interaction as a system.
102
THE SYSTEMIC INTERACTION OF FACTORS
This research showed the factors that influence rural water system functionality in developing
countries interact as a complex system. While this finding is relatively intuitive (i.e., most would agree
that in reality factors are interconnected in a complex way), it nonetheless emphasizes the need for
systems methods that can aptly consider these complexities in order to plan and maintain water
services that are sustainable. In light of historical research and practices in water service sustainability,
this finding implores a paradigm shift in methods that lie outside the traditional forms of assessment
and planning (i.e., tabular analysis and regression-based methods), and which instead exploit the
advantages of methods specifically created to deal with complex systems.
Thus, this research presents a case for methods that enable systems-based understanding on
problems rooted within complex social structures; methods that evolve from a reductionist-based
understanding (closed-form, static and linear systems) to a systems-based understanding of a problem
(open, dynamic and non-linear systems). In fact, this research provides clear evidence of the systemic
and dynamic factor interaction (see Chapters 2 and 4), which, in turn, implies linear thinking will
improperly address the core issues that inhibit rural water service sustainability. In the same way, this
research successfully demonstrated the use of qualitative and quantitative methods to interpret the
complex social aspects of stakeholder alignment (see Chapter 3). As such, this research makes a
compelling case for the use of systems methods to understand the complex factor influence on rural
water service sustainability in developing countries by effectively demonstrating a compelling use of
systems-based tools.
MAJOR FINDINGS – CONTRIBUTION TO WATER SECTOR PRACTICE
Many of the previously mentioned theoretical contributions from this research directly correlate
to practical ways to improve rural water service sustainability. Specifically, the resounding importance
103
for sound finances, found to be the most impactful factor, provides impetus for the allocation of
resources for existing and future rural water projects. As a practical matter, this requires that viable
financial management plans be thoughtfully investigated by researchers and skillfully implemented by
practitioners to operate and maintain infrastructure appropriately in different contexts. Also, there is
clear disparity in expert and stakeholder opinion (Chapters 2 and 3) regarding how post-construction
support should be executed by local government and external organizations, and this creates an
additional incentive for investigating effective collaborative water system management plans. The way
in which stakeholder alignment facilitates effective infrastructure design and management provides
additional incentive for practitioner collaboration that is aligned with the constraints in the field,
constraints that this dissertation has shown significantly affect sustainability based on the systemic
interaction of factors.
In the process of investigating systemic factor interaction, this research employed a suite of
methods which practitioners could conceivably use to improve understanding on rural water service
sustainability. In a pilot attempt to demonstrate a potential framework, this dissertation integrates
many of the methods employed herein within a framework the author is calling the “Systems-based
Sustainability Assessment (SSA) Framework.” The proposed SSA framework follows either a 5-step or
10-step model building process that ends with a decision made by the practitioner for strategic action
(i.e., implementation, management, and policy) based on the insight gained through system-based
factor analysis. The beginning (and requisite) 5-step process is called Structured Group Model Building
and Analysis (SGMB), a participatory method which takes place in model building workshops where
participants build informative models during multiple workshop sessions. If workshop participants
require further information to make their decision, the second 5-step process called Empirical Model
Building and Analysis (EMB), offers additional insight into complexity based on the realities in the field
through computational modeling using field data in combination with insight from the previous SGMB
104
sessions. An overview of the entire modeling framework is shown in Figure 5-1. A complete overview of
the model-building processes may be found in Appendix F.
Figure 5-1: The Systems-Based Sustainability Analysis Framework
STUDY LIMITATIONS AND PROPOSED FUTURE RESEARCH
The research presented in this dissertation took one humble step towards improving
understanding on the complexity of rural water infrastructure sustainability through systems-based
analyses of factor interaction. However, many important limitations exist in this research that must be
mentioned in order for future research of this type to be improved upon and profitable.
As a whole, the underlying premises behind the methods of this research were founded on the
notion that analyzing the structural interaction between factors offers key insight into the systemic
causes of a particular outcome. An unfortunate reality, however, is that structural modeling techniques
(i.e., system dynamics, network analysis, and graphical modeling) have an inherent issue with validity;
that is, the extent to which the research findings accurately represent the real world (Mohapatra et al.
105
1994; Sterman 2000; Bossel 2007; Vennix 1996; Mirchi 2012). Specifically, there are two validity
concerns associated with structural modeling: construct validity (a gap between the problem that is
modeled and the model itself), and internal validity (the influence between these variables is not true-
to-life) (Olivia 1996, Barlas 1996). These inherent validity issues were potentially exacerbated by
attempting to model the influence of soft variables, such as “Management,” “Community,” and
“External Support,” on long-term rural water system functionality. Specifically, the use of soft model
variables in this research potentially caused issues with both construct validity (i.e., the model’s ability
to truly measure sustainability), as well as internal validity (i.e., the factors chosen for the model truly
interact as they do to influence sustainability) (Reyes 2003), because modeling soft variables
necessitated the use of expert and stakeholder opinion, and required the author to make broad
generalizations and simplifications throughout the modeling process. Consequently, the major cause for
aforementioned validity concerns is likely subjectivity and bias on the part of the author and the human
subjects used to gather and analyze these data used to build factor diagrams and networks.
For the author, many forms of subjectivity and bias invariably entered the research design and
execution. The author’s previous experience with rural water service sustainability could have
conceivably influenced the research methods for both data collection and analysis. For example, in
Chapter 2, the author took the opinions from experts within water literature to create a list of
“sustainability factors” based on recurrent themes. It is possible that the selection of these recurrent
themes was influenced by the author’s own perceptions regarding the important factors for rural water
sustainability, perceptions developed from years of taking classes and reading journal articles on the
subject of sustainable community development. In this same way, in Chapter 3, biases likely entered
into the way the author engaged with the stakeholder focus groups in the subconscious guiding of
participants towards important factors and factor influences. Issues with author subjectivity may also
be present in Chapter 4 with the coding of important recurrent factors based on the transcribed
106
interviews with water committee members. Examples of author bias and subjectivity such as these give
substantial evidence for possible validity issues within the emerging factor structures found in this
research.
Similar issues with biases likely entered into the collected data and analyses from the Delphi
panelists (Chapter 2) and interview participants (Chapter 4). For example, in Chapter 2, expert panelists
had noticeable biases towards a particular type rural water system management scheme (i.e., market
based approaches, community based management, post-construction support, etc.), and as a result, had
significant variance in their cross impact scoring of factors. Similarly, in the Nicaragua case study
(Chapter 4), interview participants had obvious biases towards the interviewers regarding how they
perceived the economic status of the interviewer. These biases were often confirmed when an
interviewee would ask at the end of the interview: “So, when are you going to bring help?” These
examples of participant biases provide substantial evidence for the existent of additional sources for
validity issues within the emerging factor structures found in this research.
Lastly, while a powerful attribute of the methods employed in this research was the ability to
emerge systemic factor influences, replicating meaningful results within certain regional contexts could
potentially be difficult. Indeed, the utility of these methods (as with most research methods) hinges on
the type and availability of data sources used. In the case of this research, the data were gathered
predominantly from community water committees, which may be considered an organization that has
an intimate understanding of their specific water system. In contrast, applying the methods used in this
research in other areas where community based management schemes are not used and where water
system installation is driven by disparate organizations and corrupt government, could yield results that
are both uninformative and inaccurate.
Having highlighted the possible sources of validity issues, the question becomes: How likely is it
that the factors found in this research actually describe the real problem of rural water service
107
sustainability in developing countries (e.g., construct validity)? Furthermore, how likely is it that the
factor interactions found in this research truly represent how these factors interact (e.g., internal
validity)? A reasonable answer to these questions is: there is no real way to tell. Indeed, the act of
arguing over the validity of a model structure has nearly the same rational basis as trying to assess
validity altogether. To attest to this truth, many systems modeling experts indicate that assessing the
true validity of model structures is actually impossible (Forrester 1962; Forrester and Senge 1980; Barlas
1996; Sterman 2000), largely a result of not having access to proper data (Mirchi 2012). In spite of these
challenges, the prevailing view of systems modeling experts is that model validity should be based on its
“usefulness with respect to some purpose” (Barlas 1996, p.186). In other words, the real benefits from
systems modeling manifest in the form of useful information that may be gained by engaging in the
modeling process overall, where knowledge gained by the modeler(s) for how system structure
influences behavior is far more important than obtaining a “correct answer” (Bossel 2007, Vennix 1996,
Box and Draper 1987). The difficulty then becomes less a matter for how well the model is built, and
rather how well the modeler(s) exercise discernment and critical reflection when interpreting the
results.
Despite the previously mentioned limitations, the author recommends conducting future
research that continues to look at the complexities inherent in rural water infrastructure using systems-
based tools. In particular, the author recommends focusing on future research that supports or denies
the claims presented here by i.) testing and rigorously assessing the ability of the tools used in this
dissertation to replicate equally informative insight in different regional contexts, as well as assessing
the extent to which certain tools should be omitted or employed; ii.) investigating the use of different
systems tools (e.g., quantitative system dynamics modeling, operational research, complexity science
methods, soft systems methods, Bayesian networks, etc.) that can better evaluate factor interaction and
the resultant outcome on water service sustainability; and lastly iii.) continuing to investigate the proper
108
use of systems modeling frameworks (i.e., the SSA framework presented earlier) to obtain useful
information on factor interaction while minimizing the influence of modeler biases. A summary of
these recommendations in light of the major findings, implications, and limitations of this research, are
shown in Table 5-3.
Table 5-2: Summary of major findings, contributions to water sector body of knowledge (BOK), and
recommended future research
Major Finding Contribution to BOK Limitation Future Research
Context largely influences factor
interaction
Emphasis on the importance of sound project finances regardless of the regional context Evidence that future sustainability assessment and planning tools must have the ability to unearth influences in varying contexts
Ability of the research methods to reliably replicate meaningful and useful results in different contexts
Rigorous testing of the ability for the research methods to replicate useful results within different country and cultural contexts. Continuing to investigate the use of systems modeling frameworks that minimize modeler biases
Factors interact as an
interconnected system
Evidence that sustainability assessment and planning tools must have the ability to consider the systemic and dynamic influences between factors in order to plan for and maintain sustainable water services
Possible concerns with the validity of factor structures as a result of modeler and data biases, as well as the inherent validity concerns with systems modeling
Investigating the application of different systems tools to better identify and evaluate systemic and dynamic factor interaction and the resultant impact on water service sustainability
In summary, the more a person looks into the complexities of sustainable development, the
more they realize just how far down the proverbial rabbit hole they must go to gain the breadth and
depth of knowledge necessary to truly understand it. However, this is a worthy venture if we must
indeed fundamentally reorient and improve the way rural water projects and services are planned,
implemented, and managed. Therefore, it is the author’s sincere hope that future research efforts
continue to investigate the use of systems-based approaches to rural water service sustainability in
developing countries.
109
CHAPTER 5 REFERENCES
Barlas Y. (1996). Formal aspects of model validity and validation in system dynamics models.” System
Dynamics Review, 12(3), 183-210.
Bossel, H. (2007). “Systems and Models: Complexity, Dynamics, Evolution, Sustainability.” Books on
Demand. Norderstedt, Germany.
Box, G. E. P., and Draper, N. R., (1987), “Empirical Model Building and Response Surfaces.” John Wiley &
Sons, New York, NY.
Forrester, J. W. (1962). “Industrial Dynamics”. Productivity Pr.
Forrester, J.W., and Senge, P.M. (1980). “Validation of System Dynamics Models With Sequential
Luna-Reyes, L.F., and Andersen, D.L. (2003). “Collecting and analyzing qualitative data for system
dynamics: methods and models.” System Dynamics Review, 19 (4) 271-296.
Meadows, D. (2008). “Thinking in Systems: A Primer.” Chelsea Green Publishing.
Mirchi, A., Madani, K., Watkins Jr., D., and Ahmad, S. (2012). “Synthesis of System Dynamics Tools for
Holistic Conceptualization of Water Resources Problems.” Water Resource Management,26,
2421-2442.
Mohapatra, P.K., Mandal, P., and Bora, M.C. (1994). “Introduction to System Dynamics Modelling.”
Universities Press of India, Hyderabad.
Olivia, R. (1996). “Empirical Validation of a Dynamic Hypothesis.” Paper. Sloan School of Management,
MIT, 30 Memorial Dr.
Richardson, G.P. (2011). “Reflections on the foundations of system dynamics.” System Dynamics Review
27(3), 219-243.
Sterman, J. (2000). “Business Dynamics: Systems Thinking and Modeling for a Complex World.”
McGraw-Hill/Irwin.
Vennix, J.A. (1996). “Group Model Building: Facilitating Team Learning Using System Dynamics. Wiley,
1st edition.” August 1996.
110
DISSERTATION REFERENCES
Abrams, L., Palmer, I., and Hart, T. (2006). “Sustainability Management Guidelines for Water Supply in
Developing Communities.” Department of Water Affairs and Forestry, South Africa.
Abramson, A., Becker, N., Garb, Y., and Lazarovitch, N. (2011). “Willingness to pay, borrow, and work for
rural water improvements in developing countries.” Water Resources Research, (47) W11512.
Acton, R. M., and Jasney L. (2012). “An Introduction to Network Analysis with R and statnet.” Sunbelt
XXXII Workshop Series, March 13, 2012.
Akaike, H. (1974) "A new look at the statistical model identification.” IEEE Transactions on Automatic
Control , 19(6), 716–723.
Alarcon, L.F., and Ashley, D.B. (1998). “Project Management Decision Making Using Cross-Impact
Analysis.” International Journal of Project Management, 16(3), 145-152.
Amadei, B. (2014). “Engineering for Sustainable Human Development: A Guide to Successful Small-Scale
Community Projects.” ASCE Press. August 15, 2014.
Amadei, B. (2015). “Systems Approaches to Sustainable Community Development.” In Press.
Andersen, D., F., Richardson, J., P., and Vennix, J. (1997). “Group model building: adding more science to the craft.” System Dynamics Review, 13(2), 187-201.
Arcade, J., Godet, M., Meunier, F., Roubelat, F. (2001). “Structural analysis with the MICMAC method &
Actors’ strategy with MACTOR method. Futures Research Methodology, AC/UNU Millennium
Project.
Bagheri, A. and Hjorth, P 2007. “Planning for sustainable development: a paradigm shift towards a
Meadows, D. (2008). “Thinking in Systems: A Primer.” Chelsea Green Publishing.
Miles, M.B., and Huberman, M.A. (1994). “Qualitative Data Analysis: An Expanded Sourcebook.” SAGE
Publications, 2nd Edition.
Mills, G. R., Austin, S. A., Thomson, D. S., and Devine-Write, H. (2009). “Applying a Universal Content
and Structure of Values in Construction Management.” Journal of Business Ethics, 90, 473-501.
Mirchi, A., Madani, K., Watkins Jr., D., and Ahmad, S. (2012). “Synthesis of System Dynamics Tools for
Holistic Conceptualization of Water Resources Problems.” Water Resource Management,26,
2421-2442.
Mohapatra, P.K.J., Mandal, P. and Bora, M.C. (1994). “Introduction to System Dynamics Modelling.”
Universities Press of India, Hyderabad.
Montgomery, M. A., Bartram, J., and Elimelech, M. (2009). “Increasing Functional Sustainability of
Water and Sanitation Supplies in Rural Sub-Saharan Africa.” Environmental Engineering Science,
(26), 5, 1017-1023.
Monto, M, Ganesh L.,S, and Varghese K (2005). “Sustainability and human settlements: fundamental
issues, modeling and simulations.” SAGE Publications Pvt. Ltd, New Delhi.
Mukherjee, N., and Wijk, C. (2003). “Sustainability Planning and Monitoring in Community Water Supply
and Sanitation: A Guide on the Methodology for Participatory Assessment (MPA) for
Community-Driven Development Programs.” World Bank Water and Sanitation Program (WSP).
117
Narayan, D. (1995). “The Contribution of People’s Participation: Evidence from 131 Rural Water Supply
Projects.” Environmentally Sustainable Development Occasional Paper Series No. 1. The World
Bank, Washington D.C.
Newman, J., and Martin, L. (2003). “A System Dynamics Approach to Monitoring and Evaluation at the
Country Level: An Application to the Evaluation of Malaria-Control Programs in Bolivia.”
Operations Evaluation Department, OED Conference.
Nyirishima, R., and Mukasine, B. (2011). “Multi-stakeholder platform for sustainable WASH Services:
Lessons from Rwanda.” SNV Netherlands Development Organisation.
Olivia, R. (1996). “Empirical Validation of a Dynamic Hypothesis.” Paper. Sloan School of Management,
MIT, 30 Memorial Dr.
Pearce-Oroz, G. (2011). “Rural Water Supply and Sanitation Challenges in Latin America for the Next
Decade.” Water and Sanitation Program, World Bank.
Prokopy, L. (2005). “The Relationship between Participation and Project Outcomes: Evidence from Rural
Water Supply Projects in India.” World Development, 33(11), 1801-1819.
Prokopy, L., Thorston, R., Bakalian, A., and Wakeman, W. (2008). “Evaluating the Role of
Postconstruction Support in Sustaining Drinking Water Projects.” Journal of Planning Education
and Research, 27, 294-305.
Pruyt, E. (2013). “Small System Dynamics Models for Big Issues: Triple Jump Towards Real-World
Dynamic Complexity.” TU Delft Library, Delft, The Netherlands Version 1.0.
Pushpangadan, K., and Gangadhara M. (2008). “On the measurement of sustainability of rural water
supply in India: A Supervaluationist-Degree Theory approach.” Centre for Development
Studies, Prasanth Nagar. February 2008.
QSR International Pty Ltd. (2012). “NVivo qualitative data analysis software.”
Ramalingham, B. (2014). “Aid on the Edge of Chaos.” Oxford University Press; 1st Ed., January 3, 2014
Ramalingham, B., Jones, H., Toussaint, R., and Young, J. (2008). “Exploring the science of complexity:
Ideas and implications for development and humanitarian efforts.” Working Paper 285.
Overseas Development Institute, 111 Westminster Bridge Road, London.
Richardson, G.P. (1984). “Loop polarity, loop dominance, and the concept of dominant polarity.” System
Dynamics Review, 11 (1), 67-88.
Richardson, G.P. (1995). “Teamwork in Group Model Building.” University at Albany.
Richardson, G.P. (1999). “Feedback thought in Social Science and Systems Theory.” Pegasus
Communications 1999.
118
Richardson, G.P. (2011). “Reflections on the foundations of system dynamics.” System Dynamics Review
27(3), 219-243.
Richmond, B. (2001). “An Introduction to Systems Thinking.” High Performance Systems, Inc. STELLA.
Rokeach, M. (1973). “The Nature of Human Values.” The Free Press, New York.
Rosenblueth, A, Wiener, N., and Bigelow, J. (1943). “Behavior, Purpose and Teleology.” Philosophy of
Science, 10, 18-24.
Rouwette E, Korzilius, H., and Vennix, J. (2011). “Modeling as persuasion: the impact of group model building on attitudes and behavior.” System Dynamics Review, 27(1), 1-21
Rouwette E.(2012). “Does Group Model Building Work? Evidence from and Comments on the Paper by
Videira et al.” Syst. Res.,29, 620-623
R-Project (2015). R-Project for Statistical Computing. www.r-project.org
RWSN (2010). “A vision for achieving sustainable rural water services for all.” Field Note No 2011-9.
Rural Water Supply Network (RWSN) Executive Steering Committee.
Saaty, T. L. (2008). “Relative Measurement and Its Generalizations in Decision Making: Why Pairwise
Comparisons are Central in Mathematics for the Measurement of Intangible Factors – The
Analytical Hierarchy/Network Process.” Rev. R. Acad. Cien. Serie A. Mat. (RACSAM),102(2), 251-
318.
Saeed, K. (20001). “System Dynamics for Discerning Development Problems.” Social Science and Policy
Studies Department. Worchester Polytechnic Institute.
Saldanha, J., and Gray, R. (2002). “The Potential for British Costal Shipping in Multimodal Chain.”
Maritime Management and Policy, 29 (1), 77-92.
Sara, J., and Katz, T. (1997). “Making Rural Water Supply Sustainable: Report on the Impact of Project
Rules.” UNDP, World Bank Water and Sanitation Program.
Scholz R.W., and Tietje T. (2002). “Embedded Case Study Methods: Integrating Quantitative and
Qualitative Knowledge.” Sage Publications, Inc.
Schuler, A.,Thompson, W.A., Vertinsky, I. and Ziv, Y. ( 1991). “Cross impact analysis of technological
innovation and development in the softwood lumber industry in Canada: a structural modeling
Schwarz, G., and Gideon E. (1978), "Estimating the dimension of a model.” Annals of Statistics, 6(2),
461–464
Schweitzer, R., and Mihelcic, J (2012). “Assessing sustainability of community management of rural
water systems in the developing world.” Journal of Water, Sanitation and Hygiene, 2 (1) 20-30.
119
Scott, J. (2000). “Social Network Analysis: A Handbook.” SAGE Publications Ltd, 2nd Edition, March 2000.
Shaw, D. (2012). “An Assessment of Rural Water Supply Sustainability in Monze District, Zambia.”
Doctoral Dissertation to University of Bristol. Graduate School of Engineering.
Smits, S., Tamayo, S., Ibarra, V., Rojas, J., Benavidez, A., and Bey, V. (2012). “Gobernanza y
Sostenibilidad de los sistemas de agua potable y saneamiento rurales en Columbia.” Banco
Interamericano de Desarrollo. www.iadb.org.
Srikanth, R. (2009). “Challenges of sustainable water quality management in rural India.” Current
Science, 97(3), 317-325.
Sterman, J. (2000). “Business Dynamics: Systems Thinking and Modeling for a Complex World.”
McGraw-Hill/Irwin.
Stewart, D. W. (2014). “Focus Groups: Theory and Practice.” SAGE publications, Inc., 3rd Edition, March
20, 2014.
Sugden, S. (2001). “The Community Based Rural Water Supply, Sanitation and Hygiene Education
Implementation Manual – Is it working?” WaterAid Malawi , Private bag 364, Lilongwe 3,
Malawi.
Sugden, S. (2003). “Indicators for the water sector: example from Malawi. WaterAid Reporting.
sustainability-framework.pdf
Torres, N., and Olaya, C. (2010). “Tackling the Mess: System Conceptualization through Cross-Impact
Analysis.” System Dynamics Society Conference Proceedings.
Turnstone, L. L. (1927). A Law of Comparative Judgment. Psychology Review, 34, 273-286.
UNICEF Sierra Leone (2012). “Sierra Leone Waterpoint Report.” Review Version – June 26, 2012. Sierra
Leone Ministry of Energy and Water Resources.
United Nations (UN) Secretary-General’s High-level Panel on Global Sustainability (2012). “Resilient
People, Resilient Planet: A future worth choosing.” New York: United Nations.
USAID (2013). “WASH Sustainability Index Tool.”
USAID (2014). “Local Systems: A Framework for Supporting Sustained Development.” April 2014.
Vaidya, A., and Mayer, AL. (2014). “Use of the participatory approach to develop sustainability assessments for natural resource management.” International Journal of Sustainable Development and World Ecology. 21(4), 369–379.
Veeman, T.S., and Politylo, J. (2003). “The role of institutions and policy in enhancing sustainable
development and conserving natural capital.” Environment, Development and Sustainability, 5
(3) 317-332.
120
Vennix J. A. (1997). “Forward: Group Model Building, art, and science.” System Dynamics Review, 13(2), 103-106
Vennix, J.A. (1993). “Group model-building: what does the client think of it? In The Role of Strategic Modeling in International Competitiveness.” International System Dynamics Conferences.
Vennix, J.A. (1996). “Group Model Building: Facilitating Team Learning Using System Dynamics. Wiley,
1st edition.” August 1996.
Visser, M. (2007). “System dynamics and group facilitation: contributions from communication theory.” System Dynamics Review, 23(4), 453-463.
Walters, J.P, Litchfield, K.E. (2015). “The Educational Benefits of Group Model Building Using System
Dynamics for Engineers Without Borders Students.” American Society for Engineering Education
2015, Seattle WA.
Walters, J.P., and Chinowsky, P. (2015). “Strategic Panning of Rural Water Development in Nicaragua: A
Systems-based Understanding of Local Impact Factors.” Technological Forecasting and Social
Change. Manuscript submitted and pending response.
Walters, J.P., and Javernick-Will, A.N. (2015A). “Long-term Functionality of Rural Water Services in
Developing Countries: A System Dynamics Approach to Understanding the Dynamic Interaction
of Factors.” Environmental Science and Technology. DOI: 10.1021/es505975h.
Walters, J.P., and Javernick-Will, A.N. (2015B). “Management of Rural Water Services in Nicaragua: A
Systemic Network Approach to Evaluating Stakeholder Alignment.” International Journal of
Sustainable Development and World Ecology. Manuscript submitted and pending response.
Wasserman, S., Fraust, K. (1994). “Social Network Analysis: Methods and Application – Structural
Analysis in the Social Sciences (Book 8).” Cambridge University Press. 1st Edition, November 25,
1994.
WaterAid (2011). “Sustainability Framework.”
WaterAid Malawi (2003). “Indicators for the water sector: examples from Malawi.”
WaterAid Tanzania (2009). “Management for Sustainability: Practical Lessons Learned from Three
Studies on the Management of Rural Water Supply Schemes.”
Weaver, E. A. and G. Richardson (2006). Threshold setting and the cycling of a decision threshold.
System Dynamics Review, 22 (1), 1–26.
Whittaker, J. (1990). “Graphical Models in Applied Multivariate Statistics.” Wiley Series in Probability &
Statistics. 1st Edition.
121
Whittington, D. (1990). “Estimating the Willingness to Pay for Water Services in Developing Countries: A
Case Study of the Use of Contingent Valuation Surveys in Southern Haiti.” Economic
Development and Cultural Change, University of Chicago Press, 38(2), 293-311
Whittington, D., Davis, J. , Prokopy, L., Komives, K., Thorston, R., Lukacs, H., Bakalian, A., and Wakeman,
W. (2009). “How well is the demand-driven, community management model for rural water
systems doing? Evidence from Bolivia, Peru and Ghana.” Water Policy, 11, 696-718.
Wiener, Y. (1988). “Forms of Value Systems: A Focus on Organizational Effectiveness and Culture Change
and Maintenance.” The Academy of Management Review, 13(4), 534-545.
Williamson, T., Agha, Z. K., Bjornstad, L., Twijukye, G., Mahwago, Y., and Kabelwa, G. (2008). “Building
Blocks or Stumbling Blocks? The Effectiveness of New Approaches to Aid Delivery at the Sector
Level.” Overseas Development Institute. Working Paper 6.
Winn, M.I. (2001). “Building Stakeholder Theory with a Decision Modeling Methodology.” Business
Society 40(2), 133-166.
Wolstenholm, E.F. (1982). “System Dynamics in Perspective.” J. Opl. Res. Soc., 33, 547-556.
Wolstenholme, E. (1990). “System Enquiry: A System Dynamic Approach.” John Wiley & Sons Inc.
Wossen, T., Berger, T., Mequaninte, T.and Alamirew, B. (2013). “Social network affects on the adoption of sustainable natural resource management practices in Ethiopia.” International Journal of Sustainable Development & World Ecology. 20(6), 477–483.
WSP (1996) “Sustainability Monitoring: The VIP Way.” Water and Sanitation Program - South Asia.
Yin, R. (2002). “Case Study Research: Design and Methods (Applied Social Research Methods).” SAGE
Publications, Inc . 3rd Edition.
Zhang, X., Austin, S., Glass, J. and Mills, G. (2008). “Toward collective organizational values: a case study
in UK construction.” Construction Management and Economics, 26(10), 1009-1028.
122
APPENDIX A: CONTENT ANALYSIS
This Appendix presents the comprehensive findings from the systematic literature review
(content analysis), the first step of this research and first part of Chapter 2. These findings are
presented as a raw list of the factors considered by literature to influence rural water service
sustainability in developing countries (Table A-1); an ordering of these factors into “sustainability
factors” and their associated sub-groups presented in part in Chapter 2, Table 2-1 (Table A-2); and a list
of the references included in the literature review.
FACTOR SUMMARY FROM LITERATURE REVIEW
The 157 factors identified in the content analysis are presented below. While many of these
factors are self-explanatory, those that are more ambiguous have text in parentheses for additional
Project age Marks/Davis 2011, Katz 1997, Mihelcic 2012, Whittington 2008, 2009, Massoud 2008, Carter 2006, Davis 2008, Foster 2013, Jones 2008, Prokopy 2008, Thorston 2008,
System tech. type: centralized, POU,
level of service going to point or household
Carter 2006, Jones 2008, Lockwood 2003, Katz 1997 ,Shaw 2012, Rojas 2012, Foster 2013, Katsi 2007, Masduqui 2010, Prokopy 2008, WHO 2002, World Bank 2010
Rietveld, L., Haarhoff, J., and Jagals, P. (2007). “A tool for technical assessment of rural water supply
systems in South Africa.” Physics and Chemistry of the Earth, 34, 43-49.
RWSN (2010). “A Vision for achieving sustainable rural water services for all”. Field Note No 2011-9.
RWSN Executive Steering Committee.
Sanders, H., and Fitts, J. (2011). “Assessing the Sustainability of Rural Water Supply Programs: A Case
Study of Pawaga, Tanzania.” Duke University.
Sara, J., and Katz, T. (1997). “Making Rural Water Supply Sustainable: Report on the Impact of Project
Rules.” UNDP, World Bank Water and Sanitation Program.
Schouten, T., Fonseca, C., Lockwood, H., and Moriarty, P. “Taking a service delivery approach to
monitoring water supply in low income areas and implications for the Joint Monitoring
Programme.” Water Services That Last.
137
Schweitzer, R. (2009). “Community Managed Rural Water Supply Systems in the Dominican Republic:
Assessment of Sustainability of Systems Built by the National Institute of Potable Water and
Peace Corps, Dominican Republic.” Thesis, Master of Science Michigan Tech.
Schweitzer, R., and Mihelcic, J (2012). “Assessing sustainability of community management of rural
water systems in the developing world.” Journal of Water, Sanitation and Hygiene, 2 (1), 20-30.
Shaw, D. (2012). “An Assessment of Rural Water Supply Sustainability in Monze District, Zambia”.
Doctoral Dissertation to University of Bristol.”Graduate School of Engineering, January 2012.
Silva, F., Heikkila, T., Filho, F., and Silva, D. (2013). “Developing sustainable and replicable water supply
systems in rural communities in Brazil.” International Journal of Water Resources Development,
29(4), 622-635.
Smits, S., Tamayo, S., Ibarra, V., Rojas, J., Benavidez, A., and Bey, V. (2012). “Gobernanza y
Sostenibilidad de los sistemas de agua potable y saneamiento rurales en Columbia.” Banco
Interamericano de Desarrollo. www.iadb.org.
Srikanth, R. (2009). “Challenges of sustainable water quality management in rural India.” Current
Science, 97(3),
Sugden, S. (2001). “Assessing sustainability – the sustainability snap shot.” 27th WEDC Conference:
People and Systems for Water, Sanitation and Health. Lusaka, Zambia 2001.
Sutton, S. (2004). “Preliminary Desk Study of Potential for Self Supply in Sub-Saharan Africa.” Wateraid
RWSN.
Taylor, B. (2013). “Effectiveness, Scale and Sustainability in WASH Programs –A Review. Springfield
Working Paper Series (2) .” The Springfield Centre, Durham.
Thorston R. (2007). “Predicting Sustainable Performance of Household Satisfaction of Community-
Oriented Rural Water Supply Projects: Quantitative Evaluation of Evidence from Ghana and
Peru”. Doctoral Dissertation, University of North Carolina.
UNOM (2003). “La Descentralización de la Unidad Nacional de Operación y Mantenimiento: Hacia un
modelo de apoyo post-construcción de sistemas de agua en el sector rural de Nicaragua.”
ENECAL, 2003.
USAID (2013). “WASH Sustainability Index Tool.”
Vasquez, W. (2013). “Rural Water Services in Guatemala: a survey of institutions and community
preferences.” Water Policy, 12 (2) 258-268.
Walters, J. (2012). “Striving Towards Transformative WASH Programs – Lessons Learned and Potential
Steps Forward.” Masters Reports, University of Colorado Boulder.
138
Wande S., Reweta, J., and Sampath, R. (1998). “Sustainability of a Water Supply System: The Case of Hai
Water Project in Tanzania.” Water Resources Development, 14(2), 249-270.
WASH Sustainability Forum Proceedings (2013). World Bank Building, Washington DC, March 11-12,
2013.
WaterAid (2011). “Sustainability Framework”.
WaterAid Malawi (2003). “Indicators for the water sector: examples from Malawi”. Sugden
Well (1998). “DFID Handbook.”
Whittington, D. (1990). “Strategy for Cost Recovery in the Rural Water Sector: A Case Study of Nsukka
District, Anambra State, Nigeria.” Water Resources Research, 26(9), 1899-1913.
Whittington, D., Davis, J. , Prokopy, L., Komives, K., Thorston, R., Lukacs, H., Bakalian, A., and Wakeman,
W. (2009). “How well is the demand-driven, community management model for rural water
systems doing? Evidence from Bolivia, Peru and Ghana.” Water Policy, 11, 696-718.
WSA (2013). “Sustaining Rural and Small Town Water Supply Systems in Africa: A predictive Model.”
www.wsafrica.org.
Zoomers, A. (2005). “Three decades of rural development projects in Asia, Latin America, and Africa:
Learning from successes and failures.” IDPR 27(3) 2005.
139
APPENDIX B: DELPHI AND CROSS IMPACT STUDY
This appendix presents the data collection tools and findings from the two-round expert Delphi
polarity analysis and cross impact study, showcased in Chapter 2. Data collection tools are presented as
two example screenshots of the online Qualtrics forms that were used to engage experts in the Delphi
and cross impact survey (Figure B-1 and B-2, respectively); as the consensus results for each Delphi
Round (Table B-1); and as the raw cross impact scores for each factor (Table B-2).
EXAMPLE QUALTRICS FORMS
Expert panelists participated in the Delphi and cross impact survey using the online Qualtrics
forms presented below. These are not the complete forms, but are examples of how panelists
interfaced with the study materials.
Figure B-1: Delphi polarity analysis
140
Figure B-2: Cross impact survey
DELPHI RESULTS
For each of the two Delphi rounds, consensus on a particular influence polarity was ascertained
using the Average Percentage Majority Opinion (APMO). Table B-1 presents the consensus results for
each round based on these consensus criteria.
141
Table B-1: Delphi Round 1 and 2 results
+ 0 - Maj. % APMO + 0 - Maj. % APMO
1 Gov - Func 21 2 0 91 yes
2 Com - Func 22 1 0 96 yes
3 Ext - Func 16 5 1 73 17 4 1 77 no
4 Man - Func 21 1 0 95 yes
5 Fin - Func 21 1 0 95 yes
6 E&E - Func 18 3 0 86 19 3 0 86 yes
7 TCM - Func 20 1 1 91 yes
8 Func - Gov 7 11 1 58 7 15 0 68 no
9 Func - Com 18 3 0 86 yes
10 Func - Ext 3 13 4 65 2 18 2 82 yes
11 Func - Man 13 7 0 65 16 6 0 73 yes
12 Func - Fin 18 3 0 86 yes
13 Func - E&E 6 10 2 56 7 15 0 68 no
14 Func - TCM 10 9 0 53 7 15 0 68 no
15 Gov - Com 15 4 2 71 18 2 2 82 yes
16 Gov - Ext 9 7 5 43 9 9 4 41 no
17 Gov - Man 20 0 1 95 yes
18 Gov - Fin 18 4 0 82 yes
19 Gov - E&E 15 6 0 71 13 8 1 59 yes
20 Gov - TCM 15 6 0 71 17 5 0 77 yes
21 Com - Gov 5 13 3 62 4 18 0 82 yes
22 Com - Ext 6 10 6 45 7 13 2 59 yes
23 Com - Man 19 1 0 95 yes
24 Com - Fin 18 4 0 82 yes
25 Com - E&E 9 11 0 55 11 11 0 50 no
26 Com - TCM 10 11 0 52 13 9 0 59 yes
27 Ext - Gov 12 3 6 57 yes
28 Ext - Com 11 4 6 52 13 6 3 59 no
29 Ext - Man 10 6 4 50 18 3 1 82 yes
30 Ext - Fin 13 5 3 62 yes
31 Ext - E&E 9 10 1 50 9 12 1 55 no
32 Ext - TCM 12 7 2 57 yes
33 Man - Gov 7 12 0 63 6 16 0 73 no
34 Man - Com 14 5 0 74 yes
35 Man - Ext 7 11 2 55 4 17 1 77 no
36 Man - Fin 21 0 0 100 yes
37 Man - E&E 12 6 1 63 17 5 0 77 no
38 Man - TCM 12 6 1 63 18 3 1 82 yes
39 Fin - Gov 9 9 1 47 15 7 0 68 yes
40 Fin - Com 20 1 0 95 yes
41 Fin - Ext 8 8 4 40 10 9 3 45 no
42 Fin - Man 20 0 0 100 yes
43 Fin - E&E 9 8 1 50 13 9 0 59 yes
44 Fin - TCM 16 3 0 84 yes
45 E&E - Gov 7 10 1 80 yes
46 E&I - Com 13 5 2 55 yes
47 E&E - Ext 3 12 3 70 yes
48 E&E - Man 13 5 1 68 yes
49 E&E - Fin 11 5 1 52 10 12 0 55 yes
50 E&E - TCM 9 8 1 47 11 11 0 50 no
51 TCM - Gov 4 16 0 56 5 17 0 77 yes
52 TCM - Com 9 11 0 65 yes
53 TCM - Ext 5 14 1 67 yes
54 TCM - Fin 13 6 0 68 yes
55 TCM - Man 11 10 0 65 yes
56 TCM - E&E 9 9 1 50 9 13 0 59 no
-------CONSENSUS-------
-------CONSENSUS-------
-------CONSENSUS-------
-------CONSENSUS-------
-------CONSENSUS-------
-------CONSENSUS-------
-------CONSENSUS-------
-------CONSENSUS-------
Final
Consensus?
-------CONSENSUS-------
-------CONSENSUS-------
-------CONSENSUS-------
-------CONSENSUS-------
50
65
78
58
-------CONSENSUS-------
-------CONSENSUS-------
-------CONSENSUS-------
-------CONSENSUS-------
Influence
Description
Influence
Number
Round 1 Round 2Factor
Water
System
Functionality
Water
System
Functionality
Government
Community
External
Support
Management
Financial
52
68
72
59
55
56
70
53
65
-------CONSENSUS-------
--------CONSENSUS------
Environment
& Energy
Technology,
Construction
& Materials
-------CONSENSUS-------
67
90 82
72
55
-------CONSENSUS-------
-------CONSENSUS-------
-------CONSENSUS-------
-------CONSENSUS-------
-------CONSENSUS-------
-------CONSENSUS-------
-------CONSENSUS-------
-------CONSENSUS-------
142
CROSS IMPACT RESULTS
Within the cross impact survey, each expert panelist indicated the strength of influence
between each of the eight sustainability factors described above in Appendix A. Below are the raw
influence scores that were used for loop dominance ranking described in Chapter 2.
Table B-2: Cross impact analysis raw data (Gov = Government, Com = Community, Ext = External Support, Man = Management, Fin = Finances, E&E = Environment & Energy, TCM = Technology, Construction & Materials, WSF = Water System Functionality)
GOVERNMENT
GOV COM EXT MAN FIN E&E TCM WSF
0 2 3 3 3 1 3 2
0 2 0 2 1 2 1 2
0 1 3 2 2 1 1 2
0 3 3 2 3 3 3 3
0 2 2 3 3 1 3 3
0 1 3 2 1 1 1 1
0 1 1 1 1 2 1 1
0 3 1 1 1 3 2 1
0 3 2 2 3 2 2 2
0 3 0 3 3 2 2 2
0 3 2 2 1 0 1 2
0 2 1 2 2 3 2 2
0 1 2 1 1 2 2 2
0 3 1 2 3 3 3 3
0 3 0 2 1 3 3 3
0 2 1 2 1 2 1 2
0 3 2 3 3 2 2 3
0 2 0 2 2 3 2 2
0 3 3 3 3 2 2 2
COMMUNITY
GOV COM EXT MAN FIN E&E TCM WSF
2 0 1 1 1 1 1 2
0 0 0 2 2 0 1 2
0 0 0 3 2 3 2 3
0 0 1 3 2 1 2 2
2 0 2 1 2 2 1 2
2 0 2 2 2 1 1 2
1 0 1 3 2 1 2 3
1 0 2 2 3 1 2 3
1 0 0 2 2 1 2 2
2 0 2 2 3 2 1 2
2 0 2 3 2 2 2 3
143
1 0 0 3 1 2 0 2
3 0 3 3 3 1 1 3
1 0 2 2 2 1 1 3
0 0 1 2 2 1 2 2
3 0 1 3 2 2 2 2
1 0 1 2 3 2 1 3
0 0 1 2 1 2 1 3
2 0 1 2 1 1 1 1
EXTERNAL SUPPORT
GOV COM EXT MAN FIN E&E TCM WSF
3 3 0 3 2 1 2 2
1 0 0 2 3 0 2 0
2 2 0 2 2 2 2 2
2 1 0 3 2 1 3 2
3 2 0 2 3 3 3 3
2 2 0 1 3 1 2 2
0 3 0 3 3 2 2 3
1 2 0 2 2 1 3 2
2 3 0 2 1 3 3 1
2 3 0 2 1 1 1 1
1 1 0 0 2 1 3 2
1 3 0 3 2 2 2 3
2 2 0 3 2 2 2 3
1 2 0 2 2 1 2 2
2 3 0 2 2 1 2 2
1 2 0 1 1 1 1 1
2 1 0 1 1 1 1 1
1 2 0 2 1 2 2 2
2 2 0 2 2 2 2 2
MANAGEMENT
GOV COM EXT MAN FIN E&E TCM WSF
2 2 1 0 2 2 2 3
0 1 0 0 1 0 2 3
0 2 0 0 2 1 2 3
0 2 1 0 3 2 3 3
1 1 1 0 2 3 3 3
1 1 2 0 2 2 2 3
0 3 2 0 3 2 2 3
1 2 2 0 2 1 2 2
0 0 0 0 2 1 1 3
2 3 1 0 3 3 3 3
1 3 1 0 3 2 3 3
1 2 0 0 2 2 2 2
2 3 2 0 3 1 1 3
0 2 2 0 2 1 3 3
1 2 2 0 2 2 1 3
144
3 2 1 0 2 2 2 2
1 1 2 0 1 1 1 3
0 0 0 0 0 2 1 2
2 2 1 0 3 3 3 3
FINANCIAL
GOV COM EXT MAN FIN E&E TCM WSF
3 2 3 3 0 2 2 31
2 2 0 2 0 2 2 2
1 2 1 1 0 2 2 3
0 1 1 3 0 1 3 3
3 2 2 3 0 3 3 3
2 2 2 3 0 1 1 3
0 1 2 2 0 2 2 2
1 3 2 2 0 1 2 3
0 0 0 2 0 0 2 3
1 2 1 3 0 1 2 3
2 3 2 3 0 1 2 3
3 3 0 3 0 1 2 3
1 3 3 3 0 1 1 3
1 3 2 2 0 1 2 3
2 3 2 1 0 1 2 2
3 2 1 3 0 3 3 3
2 3 1 3 0 1 1 3
0 1 0 2 0 1 1 2
3 3 2 2 0 2 3 3
ENVIRONMENT & ENERGY
GOV COM EXT MAN FIN E&E TCM WSF
1 2 1 1 3 0 3 3
0 2 0 3 2 0 0 3
0 1 0 1 1 0 0 2
0 2 0 1 1 0 1 2
1 2 2 0 2 0 0 2
1 1 1 1 1 0 2 3
0 2 1 1 2 0 1 3
0 2 1 2 1 0 1 2
1 2 2 3 0 0 2 3
1 2 1 1 1 0 1 3
1 2 2 2 2 0 3 3
0 0 0 3 1 0 0 3
0 2 2 2 1 0 1 2
1 2 2 1 1 0 2 2
1 2 1 1 1 0 2 2
3 3 1 2 2 0 2 2
0 2 0 2 1 0 1 2
0 0 0 1 0 0 1 3
2 2 2 2 1 0 1 2
145
TECHNOLOGY, CONSTRUCTION & MATERIALS
GOV COM EXT MAN FIN E&E TCM WSF
1 2 1 1 2 2 0 2
0 0 0 3 0 0 0 3
0 1 0 1 1 0 0 2
0 1 1 1 1 1 0 2
0 0 1 0 2 2 0 3
1 1 1 2 1 3 0 3
0 1 1 2 2 1 0 3
1 2 2 2 1 1 0 2
0 2 0 2 3 0 0 3
1 3 2 3 3 1 0 3
1 2 3 2 2 2 0 3
0 0 0 3 2 1 0 3
1 1 1 2 2 1 0 2
1 2 2 3 2 1 0 2
1 2 2 1 1 2 0 2
3 1 1 3 3 1 0 3
2 2 0 1 2 1 0 2
0 0 0 2 0 1 0 3
2 2 1 2 3 2 0 2
WATER SYSTEM FUNCTIONALITY
GOV COM EXT MAN FIN E&E TCM WSF
1 3 2 2 2 0 1 0
0 2 0 1 2 0 0 0
0 3 0 2 2 0 0 0
1 3 1 3 3 1 2 0
0 3 2 0 3 1 0 0
1 1 1 2 1 3 3 0
1 3 3 3 3 1 1 0
1 3 3 2 2 1 2 0
1 3 2 2 2 2 2 0
2 3 1 2 2 2 1 0
2 3 2 2 3 2 2 0
2 2 0 2 2 2 0 0
2 3 3 3 3 2 2 0
1 2 2 3 3 1 3 0
1 3 3 2 2 2 2 0
3 2 1 2 3 3 3 0
2 3 0 3 3 1 1 0
0 1 0 1 0 2 1 0
2 3 1 3 2 2 2 0
146
APPENDIX C: CASE STUDY MATERIALS AND ANALYSIS
This appendix presents the materials used to perform interviews with community water
committee members for the Terrabona and Darío, Nicaragua, case study presented in Chapter 4. It
subsequently presents the interview and observation guide used by Jeff Walters and Tim Roberts (Table
C-1 English, and C-2 Spanish); the raw coding used in the qualitative analysis of the transcribed
interviews (Table C-3); and lastly, the results from binary factor quantification for both coded themes
(Tables C-4 and C-6 for Darío and Terrabona, respectively) and aggregated factors (Table C-5 and Table
C-7 for Darío and Terrabona, respectively).
INTERVIEW GUIDE
The interview guide below was created based on the factors identified in the literature review,
conversations with organizational leaders involved in rural water infrastructure in Nicaragua, and the
author’s own experience working as a water practitioner.
Table C-1: Interview guide (English)
Factor Topic Question
Code Question
Water System
Origin of water system
WS1 Do you have a water system? If so who installed your water system?
Well
WS2 What kind of water system do you have? Well with India II
Electric pump
Gravity
System age WS3 How old is your water system
System story WS4 Have there been other water systems installed in this community? If so, can you tell me the history?
Community Water
Committee
# Meetings (activity) CAPS1 Does this community have a water committee? If so, how often do you meet?
System maintenance
CAPS2 How often do you do maintenance on the water system?
Chlorination CAPS3 Is the water system chlorinated? If not, do you add chlorine to you water? If so, how often?
Legalized in CAPS4 Is the water committee registered with the
147
municipality government?
Gender CAPS5 How many women are on the water committee?
Government
Visits/ Communication
GOV1 How often does the government visit your community? How often do you communicate with the government?
Trainings GOV2 Does the government continue to offer trainings with your water system?
Technical support GOV3 Does the government help with maintenance of the water system?
Financial support GOV4 Does the government help fund maintenance of the water system?
External Support
Organization EXT1 Are you currently being helped by an organization? If so, who?
Visits EXT2 How often does the organization visit your community? How often do you communicate with the organization?
Trainings EXT3 How often does the organization have trainings for proper use, and maintenance of the water system?
Technical support EXT4 Does the organization help with maintenance of the water system?
Financial support EXT5 Does the organization help fund maintenance of the water system?
Community Behavior
Meeting CB1 How often are there community meetings?
Attendance CB2 When there is a community meeting, what percentage of the community usually attends?
Tariff Payment CB3 Does the community pay a tariff for their water system? If so, how much? Does everyone pay
Unity/Collaboration CB4 Have there been any conflicts in the community regarding the water system?
Priorities (demand) CB5 What are the greatest needs of your community? (if water) are there alternative water sources available?
Community Demographics & Population
Education CD1 What is the average level of education in the community
Political party CD2 What political party is this community associated with?
Population CD3 How many houses are in this community?
Income of Community
Job continuity IC1 What is the main income for the community?
Monthly income IC2 More or less, what is the average household income?
Financial
Tariff FIN1 Does the community pay a tariff for their water system? If so, how much?
Account FIN2 Does the community have a savings account dedicated towards the water system?
Tariff $$ to pay for proper operation
FIN3 Is there enough money to pay for all operation of the system?
Tariff $$ to pay for FIN4 Is there enough money to pay for all maintenance of
148
maint the system?
Tariff $$ for repairs FIN5 Is there enough money to pay for all repairs of the system?
Land Owner
Source LO1 Does the community own the water source?
Conflicts LO2 If land now owned: Are there any issues with the land owner?
Area near source LO3 Are their farms in the watershed?
Electricity
Availability E1 Is electricity available in your community?
Continuity E2 Are there ever times when the electricity is not working?
Cost E3 Is the cost of the electricity affordable?
Road Condition
Pass-ability RC1 Are there times in the year when the road to (Terrabona or Darío) was not passable?
Functionality
Taste F1 Do you have any problems with the taste of the water?
Quantity F2 Is the amount of water enough for the needs of the community?
Continuity F3 Are there ever times when the water system was not working?
Distance F4 How far do you have to walk to get water?
Water System (OBS)
Water cloudy? (yes or no)
OBWS1
Wear of the system (corrosion, concrete
decay…etc)? OBWS2
Cleanliness around system
OBWS3
Water Resources
(OBS)
Fenced OBWR1
Animals OBWR2
Plantation OBWR3
Rainy season OBWR4
149
Table C-2: Interview guide (Spanish)
Question Code Question (Spanish)
WS1 ¿Tiene un sistema de agua? Si es así quien instaló su sistema de agua?
WS2 ¿Qué tipo de sistema de agua Tiene en su comunidad?
WS3 ¿Cuántos años tiene su Sistema de agua?
WS4 ¿Ha habido otros sistemas de agua instalados en esta comunidad? Si es así, ¿me puede decir la historia?
CAPS1 ¿Tiene la comunidad un comité de agua? Si es así, ¿con qué frecuencia se reúnen?
CAPS2 ¿Con qué frecuencia lo hace el mantenimiento del sistema de agua?
CAPS3 ¿Se clora el sistema de agua? Si no, ¿están la gente echando cloro para que el agua sea limpia? Si es así, ¿con qué frecuencia?
CAPS4 ¿El comité de agua registrado con el gobierno?
CAPS5 ¿Cuántas mujeres están en el comité de agua?
GOV1 ¿Con qué frecuencia el gobierno visita su comunidad? ¿Con qué frecuencia se comunica con el gobierno?
GOV2 ¿El gobierno continuará ofreciendo entrenamientos con su sistema de agua?
GOV3 ¿Está el gobierno ayudándoles con el mantenimiento del sistema de agua?
GOV4 ¿Está el gobierno ayudándoles financiar el mantenimiento del sistema de agua?
EXT1 ¿Está la comunidad recibiendo apoyo por una organización con su systema de agua? Si es así, ¿quién?
EXT2 ¿Con qué frecuencia esta el organización visitando su comunidad? ¿Con qué frecuencia se comunica con la organización?
EXT3 ¿Con qué frecuencia tiene la organización capacitaciones para el uso correcto y el mantenimiento del sistema de agua?
EXT4 ¿La organización ayuda con el mantenimiento del sistema de agua?
EXT5 ¿La organización de mantenimiento de la ayuda del fondo del sistema de agua?
CB1 ¿Con qué frecuencia hay reuniones de la comunidad?
CB2 ¿Cuándo hay una reunión de la comunidad, ¿qué porcentaje de la comunidad por lo general asiste?
CB3 ¿La comunidad paga una tarifa por su sistema de agua? Si es así, ¿cuánto? ¿Paga todos?
CB4 ¿Ha habido conflictos en la comunidad en relación con el pago? ¿Hay personas que no pagan? ¿Si es asi, cuantos casas?
CB5 ¿Cuáles son las mayores necesidades de su comunidad? (Si el agua) ¿existen fuentes de agua alternativas disponibles?
CD1 ¿Cuál es el nivel promedio de educación en la comunidad?
150
CD2 ¿Qué partido político está asociado con esta comunidad?
CD3 ¿Cuántas casas se encuentran en esta comunidad?
IC1 ¿Cuál es la principal fuente de ingresos para la comunidad?
IC2 Más o menos, ¿cuál es el ingreso promedio de los hogares?
FIN1 ¿La comunidad paga una tarifa por su sistema de agua? Si es así, ¿cuánto?
FIN2 ¿Tiene la comunidad una cuenta de ahorros dedicada hacia el sistema de agua?
FIN3 ¿Hay suficiente dinero para pagar por todo el funcionamiento del sistema?
FIN4 ¿Hay suficiente dinero para pagar por todo mainenance del sistema?
FIN5 ¿Hay suficiente dinero para pagar todas las reparaciones del sistema?
LO1 ¿La comunidad es el dueno la fuente de agua?
LO2 Si la tierra ahora propiedad: ¿Hay algún problema con el dueño del terreno?
LO3 ¿Hay fincas alrededor de la fuente?
E1 ¿Hay electricidad (luz) en su comunidad?
E2 ¿Hay algunas veces cuando la electricidad no está funcionando?
E3 Es el costo de la electricidad asequible?
RC1 ¿Hay momentos en el año en que el camino de la (Terrabona o Darío) no está en servicio?
F1 ¿Tiene algún problema con el sabor del agua?
F2 ¿Es la cantidad de agua suficiente para las necesidades de la comunidad?
F3 ¿Hay alguna vez momentos en que el sistema de agua no funcionaba?
F4 ¿Que tan lejos tiene que caminar para conseguir agua?
CODING DICTIONALRY FOR QUALITATIVE ANALYSIS
Water committee member interviews were transcribed and coded to identify and classify
themes, or reasons for why a community water system was or was not functioning. Below are the raw
codes that were used to develop the factors used in Chapter 4.
Table C-3: Coding dictionary
Code Sources References Definition
Climate 23 34 Informant reference to climate change influencing area
Com - Alternative sources 23 31 Use of more than one water source for drinking
Com - CAPS 45 90 Existence of a water committee
Com - Chlorination 23 29 Use of chlorine to disinfect
151
Com - Conflicts 18 31 Issues within the community regarding tariff collection
Com - Demand (priority, necessity...etc)
16 20 Community demand present to have clean water
Com - Economy 26 41 Community economic status
Com - Improvements 1 1 Community mentioned initiative to make system. Improvements
Com - Initial payment 10 11 Community members pay initial funds for water system
Com - Institutional involvement 55 215 Existence of institutional involvement (i.e., NGO)
Com - Maintenance 24 35 Community took initiative to repair system
Com - Meetings 7 8 Community mentioned community meetings as important
Com - Monitoring and evaluation, reporting
1 1 Community involved in monitoring and evaluation
Com - organization 17 20 Community appeared organized (holding meetings 1x/mo)
Com - Reforestation 12 15 Community indicated involvement with reforestation near the source
Com - Religion 1 1 Religion of community
Com - Repairs 22 33 Community initiative to make repairs
Com - Savings 28 44 Existence of savings for O&M
Com - Sweat equity 9 9 Community put their own labor into implementing water system
Com - Tariff 46 88 Monthly user fee
Com - Topography 1 1 Topography of the community influencing water availability
Com - Training 2 3 Community in charge of holding trainings
Com - Use 8 13 Community members using water source responsibly
Com - Women in leadership 1 1 Women in leadership (water committees)
Energy 18 20 Availability of electrical energy
Energy costs 9 17 Cost of Electrical Energy
Energy shortages 12 15 Reliability of electrical energy
Environmental resources 16 24 Water resources in general
Failure mode 5 6 Direct reference to the failure mode of the system
Functionality - Distance 9 11 Distance Users have to walk
Functionality - Equity 10 12 Availability of services to all people in community
Functionality - Quality 18 25 Quality of the water based on past MINSA tests
Functionality - Quantity 12 15 Interviewee opinion on quantity of water
Functionality - Reliability 18 26 Reliability of the water system
Functionality - Rhortage 29 43
Functionality - Taste 1 1 Reference to taste of water.
Government 45 107 Involvement of government with water project
Gringo bias 2 3 Any obvious solicitation of interviewer for money
Historical trend 32 45 References to historical trends in functionality
Land ownership 32 53 Whether the community owns the land or not
Law and rights 18 33 Whether the community or water committee has rights to water
152
Meter 9 14 Water meters used in communities to regulate use
Political party 3 7 References to the political party of the community affecting government involvement
Resilience 2 4 Instances where the community was resilient to issues that affected water system
Road conditions 31 50 Whether committee members could leave the community for spare parts
Sectors 11 27 Reference to sectorization in communities
Sickness 2 2 Reference to sickness (related to water quality above)
System - Age 41 58 Age of the system
System - Current state 9 14 Current state of functionality of the water system
System - Source Protection 26 38 Whether or not the source is protected
System - Type 48 81 The type of system that is implemented (well, gravity-fed..etc)
TCM 48 99 Availability of materials (supply chain)
Technician 15 15 The designation of a skilled technician to take care of system O&M
Transportation 13 13 Availability of transportation to leave the community
Willingness to pay 1 1 Willingness for community to put forward upfront system costs
153
FACTOR QUANTIFICATION
Table C-4: Darío Themes
Community Qual Quant Cont Conf Org Clean Fenc Forr Gov Com. Roads Tar Sav Mat ApTec Ex Sup Candelaria no no no no no no no no no no yes no no yes yes yes Casas Viejas yes yes yes no yes yes yes yes yes yes no yes yes yes yes yes El Achote no no yes no no yes no yes no no no no no yes yes no El Bacacan no no no yes no yes no no no no no no no no no no El Carbonal yes no yes yes yes no yes no no no yes yes yes yes yes yes El Carmen no no yes yes no yes no no no no no no no no yes yes El Chaguite no yes yes no no yes no yes yes no no no no no yes yes El Cristal no no no no yes yes yes yes yes yes yes yes yes no yes yes El Guineo yes no no yes no no no no yes no yes yes no no yes no El Hato no no no no yes no no yes no yes no yes yes yes yes yes El Jícaro no no no no yes no no yes no yes no yes yes no yes yes El Jobo no yes yes yes yes no yes no yes yes no yes yes yes no yes El Pavón yes yes yes yes no no no no yes yes yes no no no no yes El Prado yes no yes yes yes no yes yes yes yes no yes no no yes no El Sisteo no yes yes yes no no yes no yes no no no no yes yes no Guapinol no no no no yes no no yes yes yes no yes yes yes yes yes El Zarzal no no yes no no yes yes no no no no yes yes no yes no La Ceibita no no yes no yes no no no yes yes no yes yes yes yes yes La Cruz yes no yes yes no no no no no no no no no yes yes yes La Flor yes yes no no yes no no yes no yes no yes yes no yes yes Las Mesas no no no no yes no yes yes yes yes yes yes yes no no yes Las Palmas no no no yes no yes no no no no no no no no yes no Las Pozas no yes yes no no no no yes no no yes no no no yes no Los Capules yes yes no no yes no no yes no no yes yes yes no yes no Los Cerritos yes yes yes yes yes no no yes no yes no yes yes yes yes yes Sabana Verde no no yes yes yes no yes no yes yes no yes yes yes no yes San Esteban no yes yes yes no yes yes no yes no yes no no no no no Valle San Juan yes yes yes no no no yes yes no yes no yes yes yes no yes San Lucia yes yes no no yes no no yes no yes yes yes yes yes yes yes El Llano no yes no no yes yes yes yes yes yes yes yes yes yes yes no Tamalapa no yes no no yes yes yes yes yes yes yes yes yes yes yes no El Tempisque no no no no yes no no yes yes yes no yes yes yes yes yes Veracruz yes yes yes yes yes no yes no yes yes no yes yes yes no yes
153
154
Table C-5: Darío Factors Community Government Ext. Supp. Finances Manage Infra Wat. Res. Wat. Sys. Funct Tech.
no no yes no no yes no no yes yes yes yes yes yes no yes yes yes no no no no no no yes no yes no no no no no no no no no no no yes yes no yes no yes yes no no yes no no no no no no no yes yes no no no yes no no yes yes yes yes yes yes yes no no no yes no yes no yes no no no yes no yes yes yes no yes no yes yes no yes yes yes no yes no no no yes yes yes yes no no no yes no yes yes no yes yes no yes no no yes no yes yes no yes yes no no yes no no no no no no yes yes yes yes yes yes no yes no yes no no no yes no no no no no yes yes yes yes yes no no no yes no no yes no no no no yes yes yes no yes yes yes no yes no no yes yes yes yes yes yes yes no no no no no no no no no no no no no no no no yes yes no no yes no no yes no yes yes no no no no yes yes yes no yes yes yes no yes yes yes yes no no no yes no yes no no no yes no no no no no yes yes yes no yes yes yes yes no yes yes yes yes yes no yes yes yes no yes yes yes yes no yes yes yes no yes yes yes yes no yes yes yes yes yes yes no yes no yes no yes yes yes yes no no yes yes
155
Table C-6: Terrabona Themes
Community Qual Quant Cont Clim Conf Org Fenc Clean Forr Gov Com. Roads Tar Sav Mat ApTec ExSup
Apatu no yes yes yes yes no yes yes yes no no no no no no no yes
Chaguitillo yes yes no yes no no no no no yes no no no no no no yes
El Arado no yes no yes no no yes no no no no no no no no yes no
El Hatillo no yes no yes yes no no no yes no no no no no no yes no
El Balsamo yes no no no yes no yes yes yes yes no no no no no yes yes
El Caracol no yes yes yes no yes yes yes yes yes yes no yes yes yes yes yes
El Rincon no yes yes no no yes yes yes yes no no no yes no yes yes yes
El Rodeo yes yes yes no no no no yes yes yes yes no no no yes yes no
La Ceiba no yes yes no no no no yes yes yes yes no no no yes yes yes
Monte Grande yes yes yes yes no yes yes yes yes no yes yes yes yes no yes yes
Monte Verde yes no no no no no no yes no no no no no no no no yes
Ocotillo no yes yes yes no no yes no yes yes yes no yes no no no no Payacuca yes yes yes yes no yes yes yes yes no yes yes yes yes yes no yes
Puntisuela no yes yes no yes no no no no no no no no no yes yes no
San Juan las Conoas yes yes yes yes no yes no yes no no no yes no no yes yes yes
San Pedro yes yes yes yes no yes yes yes yes no yes no yes no yes no yes
Santa Rosa no yes no no yes no yes yes yes yes yes yes no no no no no
155
156
Table C-7: Terrabona Factors
Community Government Ext. Supp. Finances Manage Infra Wat. Res. Wat. Sys.
Funct Tech.
no no yes no no no yes no no
no yes yes no no no no no no
no no no no no no no no no
no no no no no no no no no
no yes yes no no no yes no no
yes yes yes yes yes no yes no yes
yes no yes yes no no yes no yes
no yes no no yes no yes yes yes
no yes yes no yes no yes no yes
yes no yes yes yes yes yes yes no
no no yes no no no yes no no
no yes no yes yes no no no no
yes no yes yes yes yes yes no yes
no no no no no no no no yes
yes no yes no no yes yes yes yes
yes no yes yes yes no yes no yes
no yes no no yes yes yes no no
157
APPENDIX D: GRAPHICAL MODELING AND NETWORK ANALYSIS
This appendix presents supplemental material for the graphical modeling techniques used in
Chapter 4. It also presents the R code used to build networks and perform betweenness centrality on
stakeholder factor networks (Chapter 3), and to iteratively build graphical models with the Nicaragua
case study data (Chapter 4). Sources referenced in this appendix may be found in the Dissertation
References section at the end of this thesis.
GRAPHICAL MODELING – SUPPLEMENTAL INFORMATION
Graphical models display interdependencies based on patterns of conditional dependencies.
These patterns ultimately emerge through the identification of conditional independencies (or
connections between factors that DO NOT exist).
In probability, two variables and are said to be independent if:
Or if
Similarly, two random variables and are said to be independent for each value of and if:
Or if
For the concept of conditional independence, if we have three random variables, say , and
– and if for each value of , and are independent in the conditional distribution given = , then we
say and are conditionally independent of Z, and write (Edwards 2000)
, or
158
An exemplar extension of this concept of conditional independent may best be made by directly
moving forward with an example graphical model. In graph theoretic terms, one could say graphical
models are which is a structure where V is a set of verticies (nodes), and a finite set E of
edges, also known as arcs, between these vertices, within the graphical model G. Edges for a graphical
model can either be directed, undirected, or bidirected. An example graphic displaying three similarly
structured graphs with each edge type is show in Figure D-1. Undirected edges indicate a dependency
between two variables with no explicit statement on the direction of influence (i.e., A on B or B on A).
Conversely, directed edges imply a direction of influence from one variable on another, typically
presented as an arrow, where bidirected edges imply either variable can influence the other. In the case
where graphs are composed of only undirected edges, the graph is called an undirected graph. In the
case where a graph has directed edges, it is known as a directed graph.
Figure D-1: Example of three edge and graph types: Undirected (left), directed (middle), bidirected (right)
For this study, the extrapolation of data to form directed or bidirected graphs would appear to
offer the most advantages in explicitly ascertaining characteristics for both factor influence and
structure. However, there are statistical limitations when working with directed graphs that make them
less appealing for this study. The majority of work dealing with directed graphs deals with graphs that
are acyclic, meaning there can be no formation of loops, a form of graph known as direct acyclic graph
(DAG). As such, DAGs are typically implied for most directed graphs, since directed cycles (feedback)
may not be modeled as there is no joint probability density function to model this situation (Whittaker
159
1990). Because we are concerned with exploring the structural interaction between factors, and not
necessarily direction of influence, and we do not want to be confined by the statistical limitations of
DAGs, we elected to use undirected graphs. For this same reason, undirected graphs are often best
used for exploring structure before moving forward with the creation of directed graphs, if this level of
detail is needed (Whittaker 1990).
Additionally, an important piece of terminology which will be useful to explain the research
methodology is graph completeness. A complete graph is one which has an edge between every pair of
vertices (Edwards 2000). It can be shown below that each of the graphs shown in Figure D-1, despite
the type of edge, would be considered a compete graph. Even if a graph is not complete itself, it may
still be broken down into one or more complete sets known as cliques. For example, while the figures
below are complete graphs , these graphs may also be broken down into four separate three
node cliques, , , and . This could also be done in a similar way for
two node cliques.
As mentioned earlier, for a graphical model, dependence between two variables, say A and B, is
denoted graphically by creating a line (undirected) or arrow (directed or bidirected) between A and B
nodes. Graphical models are built through the identification of conditional independencies between
variables that hold for probability densities in the model (Edwards 2000). For example, in figure D-2
below, it can be seen that one edge between nodes is not drawn, namely . Mathematically, this
can be written as , which states that is conditionally independent of given the
configuration with and , which means there is no line drawn between these two nodes.
160
Figure D-2: Example undirected graph
Lines that are drawn denote conditional dependency. Graphs such as this may be interpreted
using the global Markov property for undirected graphs, which states (Edwards 2000):
If two sets of variables and are separated by the third set of variables , then .
Graphical models can be used to display conditional dependency between discrete or
continuous data. Log-linear models are typically used with discrete data, where as continuous data uses
models based on multivariate normal distribution analogous to log-linear models, or Gaussian graphical
models (Edwards 2000). Since the data in this study are discrete (dichotomous) data, we will focus our
efforts in explaining the method for using log-linear models.
We will begin the mathematical explanation of log-linear modeling using the undirected graph in
Figure D-3 in a way similar to Edwards (2000). In this graph these random variables and can take
on values or “levels”, which we can replace with and as level values for and . The values
for four variables, each having observations could be appropriately described within a 3 x 3 matrix or
table, or a “three-way” table. In this case, the probability that any of observations might fall within a
given cell of that table, is . Therefore, the simplest model for and , considering all variables
are independent would be:
ln
Where the ’s are unknown parameters called interaction terms.
161
Figure D-3: A simple undirected graph
To model these interaction terms, an ANOVA-like factor expansion is typically conducted with
the ’s, typically using the unrestricted or “saturated” model (explained later). The saturated model
implies that all variables are conditionally dependent (i.e., the whole graph is complete), demonstrated
for the model in Figure D-2.
ln
Where in the case for Figure D-3, , where the appropriate model would emerge from
setting for all and and similarly for all , and . This demonstrates what is
called a hierarchical log-linear model which means if a term is set to zero, all higher order terms are set
to zero as well, where in most cases, hierarchical log-linear models are of interest (Højsgaard 2012).
Generally fitting a graphical model to data uses this understanding of hierarchy to simplify model fitting
by breaking the model into hierarchical chunks.
For multinomial sampling of observations, the likelihood function (in the case of a three-way
table used for the case of example graph and ) for the table { }
Therefore, the maximum likelihood estimates that maximizes this expression are:
162
A similar formulation of this maximum likelihood equation, albeit more complicated, could be done for
larger data sets, and is facilitated in this research using R-Project. The MLE is the statistical basis for
model selection, described in the next section.
MODEL SELECTION
One of the main difficulties with using graphical modeling to fit a particular multivariate data
set, is that there are generally a myriad of different well-fitting model structures (Whittaker 1990). This
is because, in the case of even a 15 node undirected graph, the number of undirected possible graphs is
215x14/2 = 4.05 x 1031. Because of this, the likelihood of having the true optimally best-fit model is not
good. However, in the case of this research, an optimal fit is less desirable than a good fitting model
that helps us gain insight into the implication of model structure. There are generally three types of
model fitting algorithms, (Højsgaard 2012):
1. Use of low-order conditional independence tests to infer structure of the joint model;
2. Heuristic search to optimize some criterion;
3. Bayesian methods, often involving Markov chain Monte Carlo Methods.
In the case of this research which is focused on a high-level, exploratory development of model
structure, we opted to use the first method, where further exploration and refinement of the model
could take place in future studies if so desired (Højsgaard 2012). The first method, also known as a step-
wise method, selects the model that best fits a particular criterion, also known as a penalized likelihood.
This is accomplished by iterating through model structures (including or excluding edges between
nodes), where inclusion or exclusion of edges is decided using significance tests. Edwards (2000)
suggests at each step using a chi-squared tests based on the difference between subsequent models in
which the edge whose chi-squared test has the largest (non-significant) -value is removed. If all -
values are significant (i.e., all then the process stops (Whittaker 1990, Edwards 2000). This can
either be done by backward or forward selection. Backward selection starts with the saturated
163
(complete) model, and begins deleting edges to fit the model, while forward selection starts from the
independent model and adds edges. Typically, backward selection is the preferred selection method
since the complete model is generally consistent with the data (Edwards 2000). Another slightly more
sophisticated selection criterion may be based on maximum likelihood. As described by Højsgaard
(2012), methods of this type consider a set of models Ԑ(j) for where the best model is
selected back on the Ԑ(j) that minimizes -2log , where is the maximum likelihood under
the model and is the number of free parameters in the model Ԑ(j) and is a penalty parameter.
Two popular values for k are 2 (Alkines Information Criterion (AIC) (Akaine 1974) and the Bayesian
Information Criterion (BIC) (Schwarz 1978) which sets k = log( . The BIC penalizes models that are
more complex, therefore generally giving simpler models. With the stepwise method, the eligible edges
are tested for removal (backward selection) or addition (forward selection using the AIC or BIC criteria),
deleting or adding the edge that would give the largest decrease in AIC.
Finally, it is worth noting that since model estimation assumes independent realizations of
Poisson distribution, it is also possible to use generalized linear models (GLM) in place of log-linear
model estimation. However, GLM is typically not recommended for the creation of graphical models if
the data sample size is small compared to the relative complexity of the model (Højsgaard 2012).
Therefore, given the complexity of the problem we are modeling, and the small level of samples, we
opted to use log-linear modeling to fit the data.
NETWORK ANALYSIS – R CODE
Presented below is the network analysis code used to perform betweenness centrality (point
and graph) on the stakeholder value networks (Chapter 3) using community Water Committee
stakeholder opinion. Similar code was used to perform these same analyses for the other three