A T-Entropy Analysis of the Slammer Worm Outbreak Raimund Eimann, Ulrich Speidel, Nevil Brownlee The University of Auckland Department of Computer Science Tamaki Campus 731.334 New Zealand Ph: +64 9 373 7599 x85288 [email protected]Abstract Network events such as Internet worms, port scans, and DDoS attacks pose an ongoing threat to Internet businesses and organizations. The detection of such events is often difficult, especially on nodes that are not immediately involved. In 2002, Kulkarni, Bush, and Evans proposed the use of complexity metrics in the detection of DDoS attacks [7]. Our paper applies this idea to an analysis of tracefiles taken during the emergence of the Slammer worm. We use a computable entropy measure with almost linear time complexity. The experimental results indicate that the entropy is a sensitive tool for the detection of such attacks. Keywords: Network Event Detection, Network Measurement, Entropy, Slammer, DDoS 434
Transcript
A T-Entropy Analysis of the Slammer Worm OutbreakRaimund Eimann, Ulrich Speidel, Nevil Brownlee
The University of AucklandDepartment of Computer Science
Network events such as Internet worms, port scans, and DDoS attacks pose an ongoing threat to Internet businesses and organizations. The detection of such events is often difficult, especially on nodes that are not immediately involved. In 2002, Kulkarni, Bush, and Evans proposed the use of complexity metrics in the detection of DDoS attacks [7]. Our paper applies this idea to an analysis of tracefiles taken during the emergence of the Slammer worm. We use a computable entropy measure with almost linear time complexity. The experimental results indicate that the entropy is a sensitive tool for the detection of such attacks.
• 1994: Leland et al. investigate self-similar nature of Ethernet traffic.
• Kulkarni, Bush & Evans proposed DDoS detection using Kolmogorov complexity metrics in 2002.
• But: Kolmogorov complexity is not computable .• Approximations by Lempel-Ziv or Shannon entropy? Too slow
and/or too inaccurate • T-entropy approximation: fast (Speidel & Yang 2004) &
accurate (Ebeling, Steuer & Titchener 2001, Titchener, Speidel & Yang 2005)
Background
IntroductionFrom an observer’s point of view, network traffic consists of a sequential stream of datagrams. Each datagram has certain properties, such as protocol, length, source/destination IP, arrival time, etc. The ensemble statistics that these properties follow in busy high volume networks have been of interest for quite some time, most notably in the discussion about the self-similar/fractal nature of the traffic [8]. These ensemble properties are affected by network events such as DDoS attacks or worms, which make them a promising information source for event detection. However, knowing what to look out for and which statistical aspect to monitor is difficult. Moreover, monitoring a particular aspect of network traffic only increases the risk of false alarms and of actual events going undetected. E.g., if we monitor for TCP-to-UDP ratio, an attacker may simply generate a mix of both to fool our detector. The more features we monitor, the more difficult evasion becomes, but the cost of monitoring also increases. The proposal by Kulkarni, Bush, and Evans to use complexity metrics in event detection [7] takes a bird’s eye approach. It works on the assumption that the information rate of “normal” network traffic is approximately constant. This information rate encompasses most if not all information conveyed by the datagrams. In the case of an event, one expects this information rate to change drastically. Kulkarni, Bush, and Evans proposed the use of Kolmogorov-Chaitin complexity as an information measure. Since Kolmogorov-Chaitin complexity is not computable, an approximation has to be used. The authors themselves state that the success of their approach requires a fast and practical information measure that provides a good approximation. In another paper [3], Bush and Hughes propose the use of compression tools from the Lempel-Ziv family as well as an estimate of the Shannon entropy for this purpose. Our experiments use T-entropy, a measure that provides a close approximation to the Kolmogorov-Sinai (KS) entropy of the logistic map [4] and compares favorably with the Lempel-Ziv family of measures both from an accuracy and speed point of view. T-entropy is derived from another measure, the T-complexity.
435
T-entropy• Based on T-complexity. T-complexity measures string
complexity as a weighted number of copy-and-append string construction steps discovered in a recursive parsing of strings (similar to LZ77 but not quite the same)
• T-complexity is non-linear in string length but may be approximately linearized by the inverse logarithmic integral. This is called T-information
• T-entropy (rate) = T-information gradient• A high T-entropy indicates minimal repetition of patterns (i.e.,
new patterns appearing)• A low T-entropy indicates pattern repetition in the string
T-complexity, T-entropy, and T-decompositionT-complexity is a complexity measure proposed by Titchener [9, 11, 10] and has also been discussed in papers by one of the authors [6, 12]. It serves as the basis for two further measures, T-information and its gradient, the T-entropy. T-entropy is attractive to us because of its computability, speed of computation, and relative accuracy. Ebeling, Steuer and Titchener [4] showed that T-entropy is closely related to known entropies such as the Kolmogorov-Sinai entropy of the logistic map. We may thus conjecture that T-complexity approximates Kolmogorov complexity well.The T-complexity of a string may be computed via an algorithm called T-decomposition, a detailed description of which may be found in [5]. We proceed with the relationship between T-complexity, T-information, and T-entropy. The T-complexity is defined as: where x represents a string of characters over a finite alphabet A with cardinality #A. The values m and k1…km are obtained by the T-decomposition of x. A closed form for an upper bound for the maximum T-complexity of strings x of length |x| has not been formulated yet, but it has been conjectured that the logarithmic integral represents a good approximation of the asymptotic upper bound [9, 11, 10]. CT(x) is not a linear function. Therefore, one may define the T-information of x, denoted by IT(x), as a more linear measure for the amount of information carried in a string x. This linearization is achieved by using the inverse logarithmic integral li-1: Usually T-information is measured in nats, i.e., natural information units (base e). For the experiments in this paper we used a base of 2 instead to simplify the estimation of the information content carried in x. The gradient of IT(x) is called T-entropy HT(x) = IT(x)/|x|and may be measured in nats per symbol or bits per byte, depending on the base used. In other words: T-entropy is a measure of the change in information as |x| increases. Unlike other entropy measures, T-entropy is not normalized. We used T-entropy as our measure in a number of tests that are described in the following sections.
∑=+=
m
i iT kxC1
)1log()(
))(ln/)((li)( 1 #AxCxI TT−=
436
Methodology• Network datagrams are mapped into symbols
according to selected properties (e.g., dest port, src/dest IP, protocol, payload, etc.)
• String of symbols is broken up into fragments of 500 symbols each
• Measure average T-entropy (T-information / 500) for each fragment
• Result: sequence of T-entropy values that permit observation of changes
• Fragmentation / averaging acts as a low-pass filter window
Experimental SetupFor our experiments, we used the Slammer TSH (Time Sequenced Header) tracefiles[2] from the NLANR Special Traces site [1]. TSH tracefiles are chronological concatenations of 44 byte records where each record holds information about a single IP datagram. These 44 bytes are sufficient to store: 1. a 56 bit timestamp,2. an 8 bit interface identifier,3. the entire IP header (20 bytes if no options are present),4. the entire headers of most transport protocols such as UDP and TCP,5. part of the payload of those datagrams that are sent using transport protocols that
Datagrams were mapped into a single ASCII character before proceeding with T-entropy measurements. This intermediate step is required for three reasons:1. Some fields of the IP/TCP/UDP headers or TSH records in general, exhibit an
increase of the observed average T-entropy while other fields at the same time exhibit a decrease. As our results are scalar, these two phenomena may compensate each other and thus weaken or even hide event footprints.
2. Redundant and/or virtually random information, such as the IP checksum, may be filtered out.
3. The overall volume of data to be processed is reduced, which immediately leads to a decrease in processing time.
Mapping details are included for each of our measurements presented in the following section. The ASCII character string resulting from the mapping step was then broken up into 500 byte fragments. Following this, the T-entropy of the fragments was computed, which lead to a sequence of samples which permitted observation of changes. We therefore present our results as plots of average T-entropy over sample number, where the average T-Entropy is the total T-information of a fragment divided by the fragment’s length (500 bytes in our case).The mapping part of our approach is an algorithm with linear time complexity. The subsequent T-decomposition step is performed by an algorithm which runs in O(n log n) time. The log n component of this upper bound arises from the addressing scheme used by the algorithm. In real implementations with limited n, this component can be neglected as it is absorbed by the hardware. Thus the overall computational complexity of this approach is linear and therefore suitable for online scenarios. On a 1.8 GHz Celeron machine running Linux 2.6 the algorithm processes 4.5 million symbols in approximately 2.26 seconds.
438
Why look at Slammer?
• Slammer is a good example for a worm operating at the transport level.
• Should be detectable from header traces. Expect lowering of entropy as a result of many similar datagrams (patterns)
• Tracefiles from various sites available from NLANR.• We selected two sites, COS (Colorado State
University) and AIX (Ames Internet Exchange) as sources.
• Ran two test series with various mappings.
Why look at Slammer?Slammer is an Internet worm that operates at the transport layer. It is possible to observe the outbreak of Slammer in the IP header details available from NLANR’sSlammer tracefiles. More specifically, Slammer spreads by opening a UDP connectionto port 1434 of machines running a vulnerable version of Microsoft SQL Server. We therefore hoped to find changes in the T-entropy of IP header properties during the outbreak of the worm.Additionally, the structure of the TSH tracefiles generally would permit observation of up to 8 bytes of UDP payload. Generally, an attacker has two options about how to generate the payload carried in attack datagrams, namely 1. fill the datagrams with random data, or 2. fill all datagrams with (at least largely) identical data. The first type of datagram content should mainly appear in large scale DDoS attacks, where the datagram content has no other use but to consume bandwidth. For Internet worms one can expect the payload to be of the second type, because the datagramsusually need to carry both, the compromising code and self-replication code. While an attacker may write an Internet worm that appears in a number of slightly different versions, the main structure of the worm will generally not vary. This makes the UDP payload fraction in TSH tracefiles another interesting feature to be observed in T-entropy measurements. Unfortunately, in the tracefiles provided by NLANR, the payload of the UDP datagrams was erased, making it impossible to run experiments with the UDP payload.
439
Results
Slammer between samples 11351 and 35942Internet news traffic between samples 46732 and 49981HTTPS traffic between samples 64984 and 71514
COS SiteFigure 1 is based on a combined mapping of the IP header fields for datagram length, source IP address, destination port (only for TCP and UDP datagrams) and TTL. This choice for the mapping arose from previous observations of correlations between header fields. 32 symbols were used for this mapping. The start of the Slammer circulation at sample 11351 had a relatively strong impact on the symbol distribution of the fragments. This led to an immediate drop of the T-entropy. At COS, the circulation of Slammer ceased at sample 35942, restoring the initial symbol distribution. This is reflected by the T-entropy as it returns to the level it had before the event. Two other events are visible in the plot. From an analysis of the tracefile, the minor event between samples 46732 and 49981 appears to be regular Internet news traffic (TCP port 119). The second minor event between samples 64984 and 71514 appears to be regular HTTPS traffic (TCP port 443). The events’ impact on the T-entropy confirms that regular heavy traffic events distort the statistics less than attack traffic such as Slammer. The relatively small effect of the regular events in Figure 1 may arise from Slammer’s comparably high packet rate, combined with its low variance in the observed header fields.For all observable events in Figure 1, the T-entropy dropped. This is an indication of a loss in complexity in the chronological datagram sequence and hence in the symbol sequence. Figure 2 examines the opposite situation. The mapping here was chosen to focus on header fields that normally do not show a high degree of variation:
• The last five bits of the destination IP address. This holds for multi-datagram communications between two hosts. • The protocol field. TCP tends to be the most common transport protocol on most links at present. This often leads to long sequences of TCP datagrams.
Each of these mapping components operated on 32 symbols (5 bits). The binary values of the symbols were then added together to yield a 6 bit value between 0 and 63, i.e. a symbol from a 64 character alphabet.
440
Results
Slammer between samples 11351 and 35942
Figure 2 shows the same major event as Figure 1. With this mapping, the T-entropy values increased during the circulation of the Slammer datagrams. The reason for this behavior lies in the propagation method of Slammer:The communication just involves transmission of a single datagram. Additionally, destination IP addresses are randomly generated by Slammer. I.e., each new connection attempt by Slammer involves a destination IP address that is different from the previous address. For most datagrams, this resulted in a change in the last five bits of the destination address. Slammer used UDP as its transport protocol. The distribution of the values in the protocol field thus changed significantly during the presence of Slammer datagrams.
Slammer observed none of the steadiness characteristics on which the mapping focuses. As a result, the mapping used for Figure 2 leads to more complex symbol arrangements in the fragments during Slammer’s propagation. Under such circumstan-ces one would expect the T-entropy to rise.
441
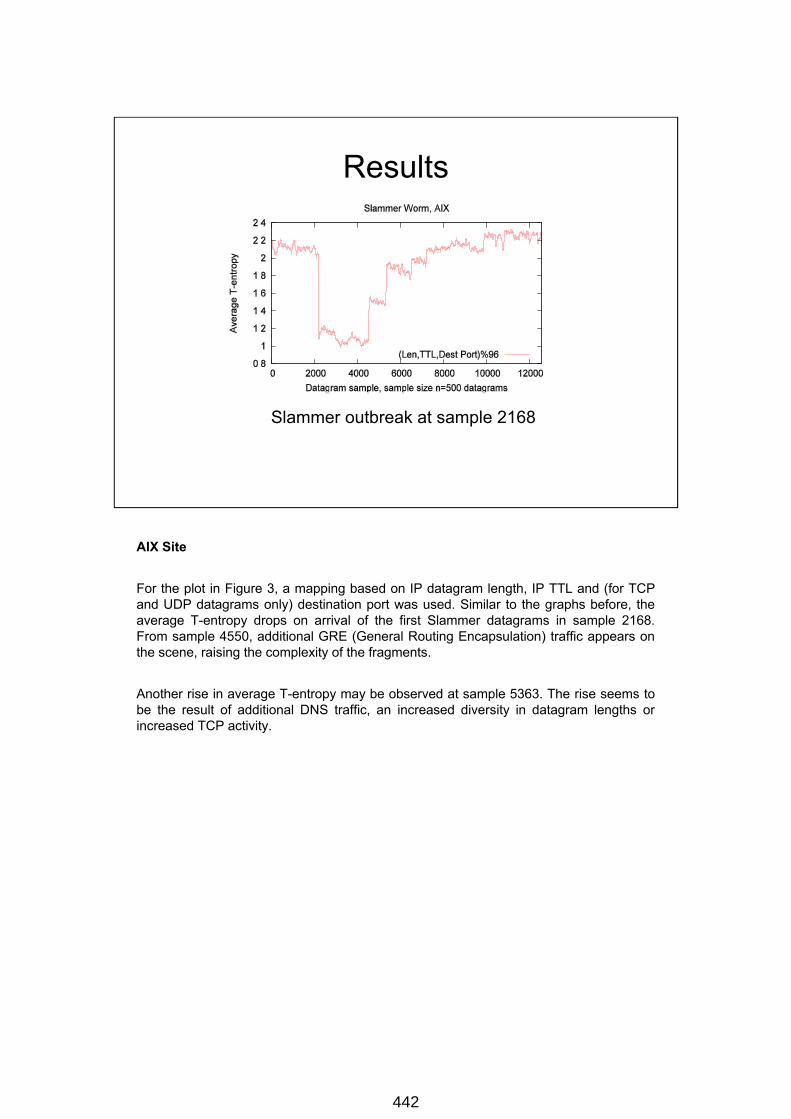
Results
Slammer outbreak at sample 2168
AIX Site
For the plot in Figure 3, a mapping based on IP datagram length, IP TTL and (for TCP and UDP datagrams only) destination port was used. Similar to the graphs before, the average T-entropy drops on arrival of the first Slammer datagrams in sample 2168. From sample 4550, additional GRE (General Routing Encapsulation) traffic appears on the scene, raising the complexity of the fragments.
Another rise in average T-entropy may be observed at sample 5363. The rise seems to be the result of additional DNS traffic, an increased diversity in datagram lengths or increased TCP activity.
442
Results
Slammer outbreak at sample 2168Other “steps” caused by increased GRE/DNS activity.
Figure 4 shows a plot that was generated using the mapping based on the last five bits of the destination IP address and the protocol field. A analysis of the tracefile showed that before the appearance of Slammer, the link was in a state of relatively low entropy. This was a consequence of long TCP flows. In this scenario the appearance of Slammer datagrams led to a steep rise in the entropy at sample 2168. Another sudden increase may be observed once the GRE traffic blends in at sample 4550. A third rise may be observed at sample 5363 which appears to be the result of a larger fraction of DNS traffic. Unlike the COS case, no steep drop in the average T-entropy follows. A possible explanation for this could be different anti-Slammer strategies at the two sites: At the COS site, few Slammer datagrams appear after sample 35844. This indicates that most datagrams with UDP destination port 1434 were dropped before they reached the monitoring point. At the AIX site, Slammer datagrams are present in larger quantities right until end of the observation window covered by the tracefile. It appears that on the AIX link no effective countermeasures against the Slammer datagrams were put in place while the tracefiles were recorded.
443
Conclusions
• T-entropy is a sensitive measure for the detection of network events even if event characteristics are not fully known in advance.
• T-entropy can operate on arbitrary information provided from the datagram stream.
• Mapping rules should be chosen to avoid compensation effects in event footprints.
ConclusionUsing the example of the Slammer Internet worm, we showed that the average T-entropy of network traffic is a sensitive measure for the detection of network events. T-entropy measurements can be performed with arbitrary pieces of available information: fields from IP/UDP/TCP headers as well as payload analysis. In order to broaden the spectrum of detectable events, different properties may be combined into complex symbol mappings. It appears beneficial to combine properties that have a similar effect on the T-entropy in an attack scenario. If properties with antagonistic effects are used, this may lead to compensation and therefore to a less obvious attack footprint.
444
Literature
References:[1] http://pma.nlanr.net/Special (last visited on May 17th , 2005).[2] http://pma.nlanr.net/Traces/tsh.format.html (last visited on May 17th , 2005).[3] S. F. Bush and T. Hughes. On The Effectiveness of Kolmogorov Complexity Estimation to Discriminate Semantic Types. In SFI Workshop: Resilient and Adaptive Defense of Computing Networks, no 1. Santa Fe Institute, Nov. 2003.[4] W. Ebeling, R. Steuer, and M. R. Titchener. Partition-based Entropies of Deterministic and Stochastic Maps. Stochastics and Dynamics, 1:45 - 61, Mar. 2001.[5] R. Eimann, U. Speidel, N. Brownlee, and J. Yang. Network Event Detection with T-entropy. CDMTCS report 266, The University of Auckland, 2005.[6] U. Günther. T-Complexity and T-Information Theory - an Executive Summary. CDMTCS report 149, The University of Auckland, Feb. 2001.[7] A. B. Kulkarni, S. F. Bush, and S. C. Evans. Detecting Distributed Denial-of Service Attacks Using Kolmogorov Complexity Metrics, Technical Information Series. GE Development & Research Center, Feb. 2002.[8] W. E. Leland, M. S. Taqqu, W. Willinger, and D. V. Wilson. On the Self-Similar Nature of Ethernet Traffic (Ext. version), IEEE Transactions on Networking, vol. 2, pp. 1-15., Feb. 1994.[9] M. R. Titchener. A Deterministic Theory of Complexity, Information and Entropy, Proceedings of IEEE-ITW, Killarney, Ireland, p. 80, 1998.[10] M. R. Titchener. A Novel Deterministic Approach to Evaluating the Entropy of Language Texts, Proceedings of 3rd Conference in Information-Theoretic Approaches to Logic, Languages, and Computation (ITALLC'98), Hsi-tou, Taiwan , June 1998.[11] M. R. Titchener. Deterministic Computation of Complexity, Information and Entropy,Proceedings of IEEE-ISIT, Cambridge, MA, USA, page 326, 1998.[12] M. R. Titchener, A. Gulliver, R. Nicolescu, U. Speidel, and L. Staiger. Deterministic Complexity and Entropy, Fundamenta Informaticae, vol. 64, pp. 443-461. IOS Press, Jan. 2005.