IEEE TRANSACTIONS ON ELECTRON DEVICES, VOL. ED-19, NO. 1, JANUARY 1972 111 A Ten-Stage Electrostatic Depressed Collector for Improving Klystron Efficiency Abstract-A ten-stage electrostatic depressed collector, designed with i;he aid of an analogcomputer,wastested on a 1-kW CW 750-MHz klystron. Excelle.nt correlation was achieved between com- puted and measured performance under varying conditions of RF drive. At full RF power output approximately 60 percent of the spent beam energy was recovered by use of the depressed collector. The net power conversion efficiency of the tube was raised from its unde- pressed value of 54.3 percent to approximately 70.9 percent. At one- half full power output, a collector efficiency of 70 percent was mea- sured,,At zero RF power output collector efficiency was 80 percent. To achieve these results it was necessary to install a small focusing coil between the final drift tube and the collector. No spurious oscillations or instabilities were detected when col- lector depression was employed, nor was electron backstreaming increased significantly. 1nt:entional short circuiting of adjacent col- lector electrode pairs was shown to cause only minor degradation in collector performance. %' 1. INTRODUCTION HE improvement of microwave tube efficiency is important from at least two points of view. First, for a given RF power output, a more efficient tube means that a smaller prime power source is needed. A second important advantage is that a more efficient tube allows use of a smaller heat rejection system. Both of thesefeaturestake on additional significance when a highpower tube is to be used in a space application. High efficiency is also important in some ground-based appl:ications, such as mobile installations, or in RF power sources used for CW linear accelerators. High efficiency in a. microwave tube can be achieved in taro ways. First, the electronic efficiency of the basic microwave interaction can be optimized. For example, recent work by Mihran et al. [l] has shown that by care- ful optimization of design parameters the efficiency of klystrons intended for narrowband FM applications can be increased to the 60- to 70-percent range. There are applications, however, for which the use of a narrow- band klystron of optimum design is not feasible. Two examples are 1) klystrons intended for AM service and 2) broadband klystrons. In both of these cases the wide range of operating conditions makes it necessary to use compromise design parameters, and efficiencyfallsbe- low 40 percent, sometimes to as low as 20 percent. work supported by NASA Lewis Research Center, Cleveland, Ohio, Manuscript received June 24, 1971; revised August 5, 1971. This under Contract NASS-11532. W. Neugebauer is with the Microwave Tube Operation, General Electric Company, Schenectady, N. Y. T. G. Mihran is with the Research and Development Center, General Electric Company, Schenectady, N. Y. It is intheseinherently low efficiency applications that the development of the second means of increasing tube efficiencybecomesdesirable,namely the idea of recovering some of the power from the spent beam of the klystron before it is wasted as heat in the collector re- gion of the tube. The work described in this paper shows that it has been possible to increase the net power conversion effi- ciency of a klystron from a base value of 50 to nearly 70 percent by use of a carefully designed ten-stage elec- trostatic depressedcollector. Furthermore, similar im- provement in net tube efficiency was achieved over a two-to-one range of base tube efficiencies, indicating that the depressed collector is directly applicable to Ahl klystron service where linearity is a prime concern. 11. HISTORICAL BACKGROUND The most practical measure of the quality of a de- pressed collector is its ability to increase the efficiency of a tube from T~, its base efficiency without depression, to a higher efficiency 7, the net tube efficiency with de- pression. Collector performance reported in the litera- ture from 19.53 to 1968 is summarized in Fig. l. In this figure, net tube efficiency 7 is plotted as a function of base tube efficiency 70. Data points indicated by solid circles and triangles represent cases in which the collec- tor under test was attached to a klystron [2]-[6]. The hollow points represent data taken using traveling wave tubes [7]-[14]. The measurement by Preist and Leidigh [15] was made on an extended-interaction klystron. The data of Fig. 1 indicates that for tubes with low to moderate base efficiencies, collector depression has re- portedly more than doubled tube efficiency in some cases. However,for high-efficiency tubes (40 percent <vo <60 percent) collector depression has generally added ten points or less to the base tube efficiency. Most of the data shown in Fig. 1 were taken with only oneortwostages of collector depression. Several in- vestigators reported that the addition of further stages of collector depression did not materially improve per- formance. This fact suggests that a more detailed study and optimization of the electron sorting operation may be the key to improved collector performance. A potentially promising solution to this problem was suggested by a preliminary study of depressed collectors carried out in connection with the design of five high- efficiency klystrons for space broadcasting [16]. In this work Neugebauer and Mihran studied electron trajec- tories in a cylindrical-can collector with a retarding
Transcript
IEEE TRANSACTIONS ON ELECTRON DEVICES, VOL. ED-19, NO. 1, JANUARY 1972 111
A Ten-Stage Electrostatic Depressed Collector for Improving Klystron Efficiency
Abstract-A ten-stage electrostatic depressed collector, designed with i;he aid of an analog computer, was tested on a 1-kW CW 750-MHz klystron. Excelle.nt correlation was achieved between com- puted and measured performance under varying conditions of RF drive.
At full RF power output approximately 60 percent of the spent beam energy was recovered by use of the depressed collector. The net power conversion efficiency of the tube was raised from its unde- pressed value of 54.3 percent to approximately 70.9 percent. At one- half full power output, a collector efficiency of 70 percent was mea- sured,, At zero RF power output collector efficiency was 80 percent. To achieve these results it was necessary to install a small focusing coil between the final drift tube and the collector.
No spurious oscillations or instabilities were detected when col- lector depression was employed, nor was electron backstreaming increased significantly. 1nt:entional short circuiting of adjacent col- lector electrode pairs was shown to cause only minor degradation in collector performance.
%' 1. INTRODUCTION
H E improvement of microwave tube efficiency is important from at least two points of view. First, for a given RF power output, a more efficient tube
means that a smaller prime power source is needed. A second important advantage is that a more efficient tube allows use of a smaller heat rejection system. Both of these features take on additional significance when a high power tube is to be used in a space application. High efficiency is also important in some ground-based appl:ications, such as mobile installations, or in R F power sources used for CW linear accelerators.
High efficiency in a. microwave tube can be achieved in taro ways. First, the electronic efficiency of the basic microwave interaction can be optimized. For example, recent work by Mihran et al. [l] has shown that by care- ful optimization of design parameters the efficiency of klystrons intended for narrowband FM applications can be increased to the 60- to 70-percent range. There are applications, however, for which the use of a narrow- band klystron of optimum design is not feasible. Two examples are 1) klystrons intended for AM service and 2) broadband klystrons. In both of these cases the wide range of operating conditions makes it necessary to use compromise design parameters, and efficiency falls be- low 40 percent, sometimes to as low as 20 percent.
work supported by NASA Lewis Research Center, Cleveland, Ohio, Manuscript received June 24, 1971; revised August 5 , 1971. This
under Contract NASS-11532. W. Neugebauer is with the Microwave Tube Operation, General
Electric Company, Schenectady, N. Y . T. G. Mihran is with the Research and Development Center,
General Electric Company, Schenectady, N. Y .
I t is in these inherently low efficiency applications that the development of the second means of increasing tube efficiency becomes desirable, namely the idea of recovering some of the power from the spent beam of the klystron before it is wasted as heat in the collector re- gion of the tube.
The work described in this paper shows that i t has been possible to increase the net power conversion effi- ciency of a klystron from a base value of 50 to nearly 70 percent by use of a carefully designed ten-stage elec- trostatic depressed collector. Furthermore, similar im- provement in net tube efficiency was achieved over a two-to-one range of base tube efficiencies, indicating that the depressed collector is directly applicable to A h l klystron service where linearity is a prime concern.
11. HISTORICAL BACKGROUND The most practical measure of the quality of a de-
pressed collector is its ability to increase the efficiency of a tube from T ~ , its base efficiency without depression, to a higher efficiency 7, the net tube efficiency with de- pression. Collector performance reported in the litera- ture from 19.53 to 1968 is summarized in Fig. l. In this figure, net tube efficiency 7 is plotted as a function of base tube efficiency 70. Data points indicated by solid circles and triangles represent cases in which the collec- tor under test was attached to a klystron [2]-[6]. The hollow points represent data taken using traveling wave tubes [7]-[14]. The measurement by Preist and Leidigh [15] was made on an extended-interaction klystron.
The data of Fig. 1 indicates that for tubes with low to moderate base efficiencies, collector depression has re- portedly more than doubled tube efficiency in some cases. However, for high-efficiency tubes (40 percent <vo <60 percent) collector depression has generally added ten points or less to the base tube efficiency.
Most of the data shown in Fig. 1 were taken with only one or two stages of collector depression. Several in- vestigators reported that the addition of further stages of collector depression did not materially improve per- formance. This fact suggests that a more detailed study and optimization of the electron sorting operation may be the key to improved collector performance.
A potentially promising solution to this problem was suggested by a preliminary study of depressed collectors carried out in connection with the design of five high- efficiency klystrons for space broadcasting [16]. In this work Neugebauer and Mihran studied electron trajec- tories in a cylindrical-can collector with a retarding
IEEE TRANSACTIONS ON ELECTRON DEVICES, JANUARY 1972
0 10 20 30 4 0 50 60 C8 B A S E T U 0 E E F F I C I E N C Y WITHOUT D E P R E S S I O N I q o l P E R C E N T
Fig. 1. Survey of measured improvement in klystron and TM'r
tors. power conversion efficiency by use of depressed collcc-
spike protruding from the back wall. The spike deflect(. (1 electrons radially, and eventually they were reflected 1 #:J the back and side walls toward the input plane of t'ltl-
collector. The lens formed by the action of the spike a1 (1 the collector can was found to possess the useful focusi~ .):
action that electrons of equal energy originating a t se J -
era1 radial positions arrived a t a common focus ne lr their reflection point. This focusing action affords t i r s e promise that additional stages of depression could 1)'e used more effectively with this geometry than in tilse past. The choice of a purely electrostatic collector is a1 $13 appealing because i t eliminates magnetic field pro:.- lems, such as shielding, weight, etc.
111. COMPUTATION AND TEST FACILITIES In this section, the analog computer used for calcul3-
tions, the test klystron, and the test setup are describ1:d briefly.
A. Analog Computer System An analog computer is particularly well suited for tile
calculation and plotting of a large number 'of electr1.m trajectories. While digital programs are available to ~ : h both calculation and plotting, the analog computer is
TABLE I 2-5061 KLYSTRON PARAMETERS
Beam perveance 0.1 to 0 .7 microperveance, controlled
Beam voltage Frequency Bandwidth Variable up to approximately 4 MHz Output power (saturated) 1- to 2-kW CW Efficiency Gain Focusing Brillouin flow Circuit efficiency 90 percent a t full power output
via nonintercepting electrode 9-kV maximum Tunable 650 to 800 MHz
45 to 50 percent, undepressed 18 to 24 dB (depending on perveance)
superior to the digital machine in cost of operation and turn-around time. A pair of PACE analog computers were available on virtually a full-time basis for this work.
The analog computer facility used in this work has been integrated with a precision resistor network and an array of current sources for the simulation of space charge [17]. The computation of electron trajectories is done essentially as described by Martin et al. [ l8] and Hechtel and Seeger [19]. In the calculations presented here full space charge was introduced into the beam dur- ing its initial deceleration. Space charge was removed abruptly at a point roughly two thirds of the distance from the input plane to the spike, a t which point the electron energy is approximately one-half the beam voltage. Trajectory calculations were run both with and without space charge. The main effect of space charge was to cause a slightly greater radial displacement at a given axial penetration than in the space-charge-free case.
B. Test Klystron To make the most meaningful and accurate measure-
ments on a depressed collector, i t is desirable that the tests be conducted on a sealed-off high-efficiency CW klystron. The klystron chosen for this depressed collec- tor investigation has three interaction gaps tuned by cavities external to the vacuum envelope, and has an insulated collector. The electrical characteristics of this tube are listed in Table I.
Standard 2-5061 tubes were severed following the col- lector insulators, and the multielectrode collectors were attached. The cathodes were recoated and the modified tubes were reprocessed following essentially the same schedule as in their original manufacture.
C. Test Set A schematic drawing of the test circuit for the collec-
tors is given in Fig. 2 . The current and voltage at each collector electrode were individually monitored. The spike and cup were generally operated at the same volt- age. Current which enters the collector but is unable to reach any active electrode is measured with the collec- tor housing ammeter labeled ICH. Since the tube body is grounded for safety, the intercepted current must be measured between the power supply positive terminal
NEUGEBAUER AND MIHRAN : TEN-STAGE ELECTROSTATIC DEPRESSED COLLECTOR 113
W A T E R FLOW
Fig. 2. Schematic of test circuit for klystron with five-stage collector.
and ground with the meter IB. The bias voltage is gen- erally several hundred volts negative with respect to the cathode, and the bias current is zero under all condi- tions.
Th'e R F power flow during test is measured through directional couplers and a thermistor type power bridge, as shown in Fig. 2 , with an absolute calibration of the output power being established by calorimetric means. The power meter was calibrated near saturated tube output, and this calibration was assumed to hold linearly for lower values of output power. All the voltmeters and ammeters used in the test set were calibrated and the overall accuracy of the measurements is approximately two percent.
All. tests were made under dc conditions. Possible col- lector oscillations werme suppressed by placing a bypass capacitor in series with a 1 2 4 resistor from each elec- trode to ground with rninimum lead length. In addition, a 2 0 4 resistor was placed close to the collector feed- through in each line coming from the 3.50042 divider. Besides damping any possible oscillations, these resis- tors also acted as crude fuses, protecting the electrodes from potential arc damage.
117. BASIC CONCEPTS AND DEFINITIONS In order to develop the relationships existing between
the base tube efficiency 70 and the net tube efficiency 7 in terms of measured data, a few parameters must be defined. In the following discussion, all voltages are mea- sured with respect to the tube body, which is generally at ground potential.
If the cathode voltage is Vo and the cathode current is Io then the power P o flowing into the tube is given by
Po = IOVO.
In regular tube operation, without collector depression, this would be the net input power. With collector de- pression, however, the net input power will be less than Po. Suppose a depressed collector has N electrodes with the it11 electrode a t a potential Vi with respect to the tube body and that this electrode collects a current Ii. If Vi were a battery, the flow of the current l i under normal conditions will be such that the battery will be charged. The power P,,, recovered through the de- pressed collector is clearly given by
In applying this relationship to measured data, care must be taken to observe the direction of the current flow, which may reverse under certain conditions in- volving large secondary emission coefficients. The net powes into the tube with collector depression is the dif- ference between PO and the recovered plower:
Generally not all of the current. 10 reaches the collec- tor because some fraction is intercepted on the body of the tube. If under dc conditions the intercepted body current is I b d o and under R F conditions at the same cathode voltage this current is I b r f , then the continuity equation requires that
IV
lo - Ti = 1
I b d c (dc conditions)
I b r f (RF conditions) . (4)
114 IEEE TRANSACTIONS ON ELECTRON DEVICES, JANUARY 1972
Without RF drive the intercepted dc current impiriges on the drift tube wall with an energy corresponding, to the full beam voltage V O . The additional current inwr- cepted when R F power is generated impinges M ith energies below V , because some energy has been c m - verted to useful R F power. Generally most of this ac di- tional current is collected on the second half of the out- put cavity, or ju s t after the main R F interaction. I ; is useful to denote by ajV0 the average energy with wh Ich this additional current impinges on the tube structure.
T h e R F power generated by the tube is denoted by P,f and the power delivered to an external load will lle slightly less due to circuit losses in the output cavity and the coupling mechanism. The output power Pout is there- fore given by
P o u t = V c k t P r f :.j)
where v&t is the circuit efficiency which can be est: 1)- lished by measuring the loaded and unloaded Q of the output cavity. Thus,
Vckt = 1 - Q L / Q u . ! ti)
Having developed the basic concepts regarding pov. (x-
flow in the tube and collector, i t is now possible to coin- pute the efficiencies associated with R F performan1::e. The base tube conversion efficiency is clearly defined ;,y
rlo = P r f / P 0 ( : i )
while the net tube conversion efficiency is given by
= P r f / ( P o P r e c ) = P r f / P n e t ( 9 where Pnet is the total dc input power. The collector efi- ciency vo-,.f is more difficult to compute because of t’ille
added complication of intercepted current. While it is easy enough to define the collector efficiency as the ra.t o of the recovered power to the total power entering tl I?
collector, i t is relatively difficult to determine the lattlx quantity. In the absence of intercepted current, tl I: collector efficiency is easily computed to be the ratio o f the recovered power to the difference between Po and the generated RF power:
vcdrf = Preo/(Po - P,.f) (no interception). (‘l;~
The effect of body interception can be taken into a’::,” count approximately, however, by writing
qc-rf = P r e c / [ P O - P r f - VOlbdc - a iVO(1brf - Ibdo)] (I( 1 where the additional terms in the denominator represeI 1 the power intercepted on the drift tube. The fraction (!?
may be anywhere between zero and one. In this work (:,, was assumed to be 0.5 for the five-stage collector. BI.. cause there is no universal agreement as to the propt r choice of this parameter, the results obtained with t t e ten-stage collector are presented with a; equal to zer:: as well as 0.5. Since the tube transmission was reasor;- ably good, the difference in the two values of vc--rf is rela- tively minor.
The basic relationships developed here are used in t h 2
remainder of this paper for analyzing the measured data. The concept of recovered power may appear superfluous as i t pertains to power supply design, but it has been found to be very helpful in visualizing the behavior of depressed collectors. A similar analysis based on net power flow with all voltages referred to cathode poten- tial has been performed and yields the same equations for the various efficiencies. I t should be pointed out that dc power supplies with multiple taps are entirely feasible with today’s silicon rectifiers and the voltage multiplier which automatically provides many taps is also very often the cheapest solution.
v. FIVE-STAGE COLLECTOR The first collector that was constructed used five
stages of potential depression arranged in a geometry similar to that shown in Fig. 2. Four cone-shaped copper electrodes were used in conjunction with a molybdenum retarding spike and a copper collector cup to sort elec- trons. All electrodes were water cooled, and no special surface treatment was employed. Specific calculated electron trajectories for this collector are shown in Fig. 3. The collector electrodes (heavy lines) were located approximately along the equipotentials (dashed lines) which result when the spike and cup are placed a t cathode potential, with the collector housing at beam potential. The collector electrodes are terminated before they reach the axis in order to allow the electron beam to pass them in the forward direction. In the five-stage collector the holes in the electrodes were quite large so that virtually all of the interception occurred after the electrons were reflected, as is evident from Fig. 3 . This has the advantage that the secondary electrons which are produced by these “topside” hits are automatically suppressed because they see a decelerating electric field.
Trajectories for electrons originating a t four initial radii are shown in Fig. 3. At each of these radii the be- havior of five electron energy classes is shown, namely, 0.2 Vo, 0.4V0, 0.6V0, 0.8 VO,and 0.95 VO. These trajectories are calculated on the basis of parallel injection of spent beam electrons at the drift tube exit plane. Other tra- jectories were calculated assuming finite initial radial velocities a t this plane. The final choice of the electrode edge locus shown in Fig. 3 was made by qualitatively weighting various trajectories that had been calculated at an early stage in this work.
After extensive tests had established the characteris- tics and performance of the five-stage collector, a very detailed computer study was made in which over three hundred electron trajectories were calculated. Ten input radial locations were allowed, and electron energy was varied in steps of 200 V from 0 to 7000 V. Parallel injec- tion was used, starting a t a plane midway down the taper between drift tube and collector.
Comparison of measured and computed characteris- tics of the five-stage collector suggested that improve- ments in secondary electron suppression, electrode edge locus, and electrode number could be made. These im- provements were the key to the success of the ten-stage
NEUGEBAUER AND MIHRAN: TEN-STAGE ELECTROSTATIC DEPRESSED COLLECTOR
Cl
collector. For this reason the characteristics of the five- stage collector are discussed in detail below.
A . Current Division Ideally the current should switch from one electrode
to the next higher electrode in stepwise fashion as the bean1 voltage is increased. This behavior is illustrated in Fig. 4(a) by the das:hed rectangular current distribu- tions. The measured current distributions, also shown in Fig. 4(a), exhibit limited qualitative agreement with this ideal behavior, Experimentally, the measured cur- rent distributions are found to be more rounded than ideally is the case, and their center of gravity is dis- placed upward in energy. Furthermore, regions of nega- tive current are observed, and corresponding peaks of current are seen to occur a t t he next lower electrode. All of these departures from the ideal rectangular shape re- duce collector efficiency.
T o eliminate these discrepancies i t is essential to understand their sources. To achieve this understanding the calculated current division curves, shown in Fig. 4(b) are extremely useful. Comparing corresponding curves in Fig. 4 i t is evident that the rounded shape and upward displacement of the curves is very accurately predicted by computer analysis. Since these discrepan- cies :represent significant loss of collector efficiency, the method of calculation can be considered to be firmly based on observed facts and therefore may be used with confidence for the evaluation of future improved de- signs.
The secondary electron effects evident in Fig. 4(a)
are not present in Fig. 4(b) because a secondary yield of unity was assumed in the computations. At beam voltages just above the electrode voltages, electrons skim the bottom side of the electrodes. Under these con- ditions the secondary electron yield undoubtedly ex- ceeds unity, the value assumed in the calculation. This correction could easily be introduced into the calcula- tion, but i t is not done here. An important feature of the measured curves is that region lying above the normal beam voltage of 7 kV. Ideally all of the current above 7 kV should go to the cup electrode, but i t is evident from Fig. 4(a) that secondaries are leaving the cup and arriving a t electrodes 3 and 4. This suggests that a sup- pressor grind in front of the cup electrode would be a useful addition to improve efficiency.
B. D C Collector Ef ic iency At a given beam voltage in Fig. 4 the currents arriv-
ing a t each electrode can be multiplied by their respec- tive electrode voltages and the recovered power may be calculated from (2). The dc collector efficiency is then calculated from (10) with P,f and I b r f set equal to zero. The resulting computed and measured curves of dc col- lector efficiency as a function of beam voltage are shown in Fig. 5 . The correlation between computed and mea- sured dc collector efficiency is excellent. In an operating klystron with a beam voltage of 7 kV, antibunch elec- trons will be accelerated to roughly 14 kV due to the full RE' voltage swing in the output gap. Therefore, in Fig. 5 the computed curve has been extended up to 14 kV. If there were no secondary electron production in
116 IEEE TRANSACTIONS ON ELECTRON DEVICES, JANUARY 1972
100 r I- - 1
-25
50 2 5
- - c 0 ' I I
CUPlSPlKE LIMIT OF I I 1
7 , 2 5 KV OMP PUT AT ION
ZERO SECONDARY
5 0 SECONDARY a :I
I 4.4 KV I
c I
-25 L c- 1 HOUSING-0 KV
100 75 50
TUBE TUNNEL 0 KV
25
0 1 2 3 4 5 6 7 8 3 1 0 I
\ 1 - , : - : - 1
BEAM VOLTAGE - KILOVOLTS
(a)
COLLECTOR HOUSING-0 KV
25
TUBE T U N N E L - 0 KV
2 5 LIMIT OF COMPUTATION
0 1 2 3 4 5 6 7 8 9 1 0 BEAM VOLTAGE - KILOVOLTS
(b) Fig. 4. Electrode current division in five-stage collect' 'I as a function of beam voltage. (a) Measured. (b) Computed.
Fig. 5 . voltage.
NEUGEBAUER AND MIHRAN: TEN-STAGE ELECTROSTATIC DEPRESSED COLLECTOR 117
I 1 I I I , I I
0 100 200 300 400 500 600 700 BOO 900 1000 I N T E R N A L P O W E R O U T P U T - W A T T S
Fig. 6. Computed and measured RF collector efficiency of five-stage collector as a function of internal power output.
the region between 7 and 14 kV, the computed curve wouild fall along the hyperbola vc-dc = 7/l/0. However, from the evidence presented in Fig. 4, secondary emis- sion is present in this region, therefore the computed curve in Fig. 5 shows two downward steps between 7 and 14 kV as secondaries return first to electrode 3 and then to electrode 2. ‘This portion of the curve was not measured because the power rating of the tube would have been exceeded.
C. RF Collector E f i c i e n c y To a first approximation, R F collector efficiency is
equal to the area under the dc collector efficiency curve. This calculation assumes that the energy distribution of the spent beam of the klystron is flat from 0 to 14 kV. This is shown to be a reasonably good assumption in the Appendix. Integrating the curve of Fig. 5, collector efficiency can be calculated as a function of R F power output, as shown in Fig. 6. Also shown in Fig. 6 is mea- sured R F collector efficiency. Not only is the measured efficiency a t full power output found to be very nearly equal to the integrated area under the computed curve of Fig. 5, bu t also the variation of measured R F collector efficiency with power output is predicted surprisingly well by the computed curve. To obtain the computed curve at nonsaturation power outputs, the voltage swing in the output gap was assumed to be equal to the square root of the normalized power output. Thus at a power level of 190 W, which is one quarter of full power output, the spent .beam energy distribution was assumed to be flat from 3.5 to 10.5 kV, corresponding to an output voltage swing of 1 /0 /2 .
The most disturbing feature of Fig. 6 is the rapid fall- off of collector efficiency from its high value of 80 per-
cent without R F drive to a disappointingly low value of 34 percent at full RF power output. However, the close correlation achieved on the three levels of performance shown in Figs. 4-6 indicates that the tools and methods in hand are sufficient to attack the design of an improved collector with confidence.
VI. TEN-STAGE COLLECTOR After the tests were completed on the five-stage col-
lector, a number of possibilities were considered for the design of a collector with improved efficiency. The sim- ple solution of merely increasing the number of elec- trodes in the existing collector was studied first but i t was discarded when computer studies showed that the R F collector efficiency a t full power output would rise to a maximum of 50 percent even if an infinite number of electrodes were used. Clearly, a, more basic redesign approach was needed.
A. Des ign I t became clear from studying the five-stage collector
data that significant improvement could be obtained by reducing the size of the apertures in the collector elec- trodes, i.e., moving the electrode edge locus closer to the axis of the collector. The optimum location of the elec- trode edge locus is highly dependent upon the trans- verse energy associated with the spent beam electrons at the entrance to the collector. This transverse energy distribution remains the greatest single unknown in col- lector design. Transverse energy distribution arises from the RF transverse forces which .affect the beam in the output gap and the transverse space charge forces tha t are exerted on the beam as the magnetic field is removed between the output gap and the collector.
An at tempt was made to establish an analytic model of transverse energy distribution which would represent these two sources of transverse energy. A “spreading point-source” model of the spent beam was devised in which all velocity classes were given the same absolute transverse energy a t t he edge of the beam. This trans- verse energy was assumed to decrease linearly with radius. T~ILIS higher energy electrons entered with small angles and lower energy particles entered with larger entry angles. In the most detailed study made, the angle of entry of 7-kV beam-edge electrons was 6.8’, whereas the angle of entry for 0.7-kV electrons was 22.1’. These angles were imposed on the beam starting a t a point midway down the tapered tunnel section between the tube and the collector.
An example of trajectories calculated with the spread- ing point-source model are shown in Fig. 7. This choice of input conditions indicated that the electrode edge should be moved closer to the beam axis than it was in the five-stage collector. Note that in Fig. 7 the electrode edge locus is closer to the axis than in Fig. 3. Further study of the measured and computed behavior of the five-stage collector showed, however, that the dc collec- tor efficiency, shown in Fig. 5 , was not predicted as well
118 IEEE TRANSACTIONS ON ELECTRON DEVICES, JANUARY 1972
40
I O
0.7 \ hY I
AX I'LL DISTANCE - MESH LINES
Fig. 7 . Computed trajectories in ten-stag 3 collector using the spreading point-source model.
B E A M VC'.'"AGE-KILOVOLTS
Fig. 8. Computed dc collector efficiency of five- t rtd ten-stage collector as a function of beam voltage.
by the seemingly more realistic spreading-point model of the spent beam than by the older parallel-flow model. In view of this conflicting evidence for model choice, the electrode edge locus in the new collector was chosen as a compromise between the different optimum loci pre- dicted by the two spent beam models.
Collector efficiency was found to be nlucll more re- sponsive to electrode number with the new collector edge locus. Therefore, the second improvement in the new collectar was to increase the number of electrodes
from five to ten. The third improvement made in the new collector was the placement of a coarse grid im- mediately in front of the back cup of the collector to suppress secondaries.
The computed dc collector efficiency for the ten-stage collector is shown in Fig. 8. Both spent bean1 models give practically the same curve as a result of the com- promise choice for electrode edge locus. I t is evident that the area under this curve is almost twice as large as the area under the preliminary five-stage collector curve.
This suggests that the final ten-stage collector should perform with nearly twice the efficiency of t h e original five-stage design.
I t is very important to emphasize that the improved effici'ency of the ten-stage collector did not simply result from doubling the number of electrodes, although super- ficially this may appear to be the case. The suppressor grid accounts for all of the improvement shown in the right-hand half of Fig. 8. In the left-hand half, the new electrode edge locus and the increase in electrode num- ber contribute nearly equally to the remaining efficiency improvement.
B. Construction The mechanical co~nstruction of the ten-stage collec-
tor was simpler than that of the five-stage collector, as is evident from the final layout sketch shown in Fig. 9. Flat radiation-cooled molybdenum electrodes, rather than conical water-cooled copper electrodes, were used in the collector. Provision was made for water-cooling the spike, the back cup, and the collector housing. The suppressor grid consisted of a coarse mesh of platinum- clad molybdenum wire spaced approximately one-half inch in front of the back cup. Each electrode was sup- ported by two rods leading to standoff insulators pro- truding frorn the end of the collector.
C. Performance Jnitially the performance of the final collector was not
as good as that predicted in Fig. 8. T o achieve the pre- dicted performance it was found necessary to install a small coil on the insulator between the tube and collec- tor. This neck coil increased the power recovered by the collector by 150 'Ilr under varying conditions of drive. Subsequent analog computer analysis has shown that the .magnetic field produced by this coil serves to refocus the low energy electrons in the spent beam such that they are able to enter the collector structure. Without this refocusing field many of the slow electrons would impinge on the section of the drift tube leading to the collector. Experimental observations tend to verify this analysis. When the refocusing coil current was varied, a large change was noticed in the current collected by the low voltage electrodes, while very little change was ob- served in the current landing on the more negative elec- trodes.
The measured R F collector efficiency of the ten-stage collector is shown in Fig. 10, where i t is compared with the computed curve (upper dashed line). TWO sets of measured data are also shown in Fig. 10. The data in- dicated by the crosses are uncorrected for RF current interception, i.e., a i = O in (10) ; hence these data points are somewhat pessirnistic. A more realistic measure of collector efficiency is obtained by allowing ai to be 0.5, in which case the mseasured collector efficiency is given by the circles in Fig. 10. The computed curve of collector efficiency lies between these two sets of measured data, and correlates very closely with these measurements.
The improvement in the performance of the ten-stage col'lector compared with the five-stage collector is evi-
i 6 I1 A X I S
0 - I P - \
COLLECTOR HOUSING
Fig. 9. Final layout sketch of ten-stage collector.
1 ~
I 0 IO 20 30 40 50 60 70
BASE TUBE EFFIC IENCY (qo)- PERCENT
Fig. 10. Measured and computed RE' collector efficiency of ten- stage collector as a function of base internal power conversion efficiency.
120 IEEE TRANSACTIONS ON ELECTRON DEVICES, JANUARY 1972
B A S E TUBE EFFICIENCY (To) -PERCENT
Fig. .11. Lleasured and computed net tube efficiency with depre5.- slon as a functiop of base tube internal power conversion efficienc:r without depression.
dent from Fig. 10. At nearly full R F power output thl.: ten-stage collector extracts 60 percent of the energy 0 '
the spent beam at the point where the R F collectol, efficiency of the five-stage model was 35 percent.
Finally, in Fig. 11 a plot is given of the increase in ne1 tube efficiency as a result of collector depression. Basc. tube efficiency was changed by varying R F drive, witl. all other parameters held constant. From Fig. 11 it it evident that over the two-to-one range of base tube effi. ciencies extending from 25 to 50 percent, the ten-stagt collector has added roughly twenty points of efficienc) to the base tube performance.' Comparing Fig. 11 witl.1 Fig. 1, i t is clear that in the range of base tube efficien. cies extending from 40 to 60 percent, the ten-stage C O L
lector has doubled the efficiency improvement reportecl in the past. At base efficiencies of 25 and 36 percent, the performance reported by Sterzer [ lo ] and by Preist anci Leidigh [IS] exceed the tube efficiency improvemeni measured here. However, neither of these measurements were made on a conventional high-efficiency ldystron oi the type used in this work. Nor were data reported over a wide range of operating conditions, as is shown in Fig, 11 for the present collector.
A number of other tests were made on the ten-stage.
collector electrodes in the 10-stage model were not water cooled. 1 Data at lower base efficiencies were not taken because the
The more negative electrodes collect most of the beam at low base efficiency. They tend to overheat and liberate gas. This effect did not occur in the water cooled five-stage collector (Fig. 6).
collector to check its stability under unusual operating conditions. Adjacent pairs of electrodes were shorted to determine whether collector efficiency would be seri- ously impaired. In all cases R F collector efficiency dropped less than six percentage points, and in no case was any instability noted. A comparison was made of the output RF energy spectrum under fully depressed condi- tions with the R F spectrum of the driver. No significant extraneous spectral components were observed over the 60-dB dynamic range of the analyzer, nor did the spec- trum change appreciably as the klystron R F drive was varied from zero to saturation. It would appear there- fore that the present collector does not introduce spuri- ous oscillations in the klystron.
1711. CONCLUSIONS AND RECOMMENDATIONS FOR FUTURE WORK
Two electrostatic depressed collectors have been built, and successful operation has been demonstrated on a klystron over a two-to-one range of output power. These collectors were designed on the basis of detailed analog computer calculation of electron trajectories. Measured R F collector efficiencies as a function of drive level range from 70 to 50 percent, in excellent agreement with com- puted behavior. KO spurious effects due to reflected electrons were detected.
The work presented here was done a t a frequency of 750 MHz. If the ratio of collector length L to beam radius b is held constant, it is believed that the present design can be scaled upward in frequency in a straight- forward manner. However, a power dissipation limit will eventually be reached which may require that a higher ratio of L to b be used. Under these circumstances space charge will play a more prominent role, and the design will have to be modified. I t seems likely that col- lector efficiency would be reduced under these circum- stances.
The use of the neck coil allowed the unknown spent beam input conditions to be accommodated without actually being known. With some tube geometries, par- ticularly a t higher frequencies, mechanical considera- tions may prohibit the use of a neck coil. Under these conditions i t will be necessary to establish the input conditions of the spent beam more accurately than was done here. T o find a general solution for the input condi- tions appears to be a very formidable project. The best approach at present would be to make a large-signal computer analysis of klystron bunching for the specific tube under consideration, using a model which allows radial motion of electron rings, and taking into account magnetic field entrance and exit conditions.
There is no reason to believe that a purely electrosta- tic collector represents the optimum way to recover spent beam energy. A parallel study [20] was made of a large number of collector schemes which utilized mag- netic as well as electrostatic sorting. In this study the TEF collector of Okoshi et al. [13], utilizing a tilted electric field and an axial magnetic field, was found to promise slightly higher efficiency than could be achieved
NEUGEEIAUER AND MXHRAN: TEN-STAGE ELECTROSTATIC DEPRESSED COLLECTOR 121
by purely electrostatic means alone. This conclusion was reached after extensive analog computer trajectory analyses using an electron beam model which in each case had no initial radial velocities due to the RF inter- action forces. Radial velocities due to the spreading magnetic fields were included. Subsequent large signal digital analysis has shown that the radial velocities due to the RF forces are not always negligible; consequently some of the conclusions reached above may have to be altered. Also, i t is not possible to include the effect of space charge as accurately in the analysis of an asym- metrical TEF collector as in a symmetrical electrostatic collector.
APPENDIX
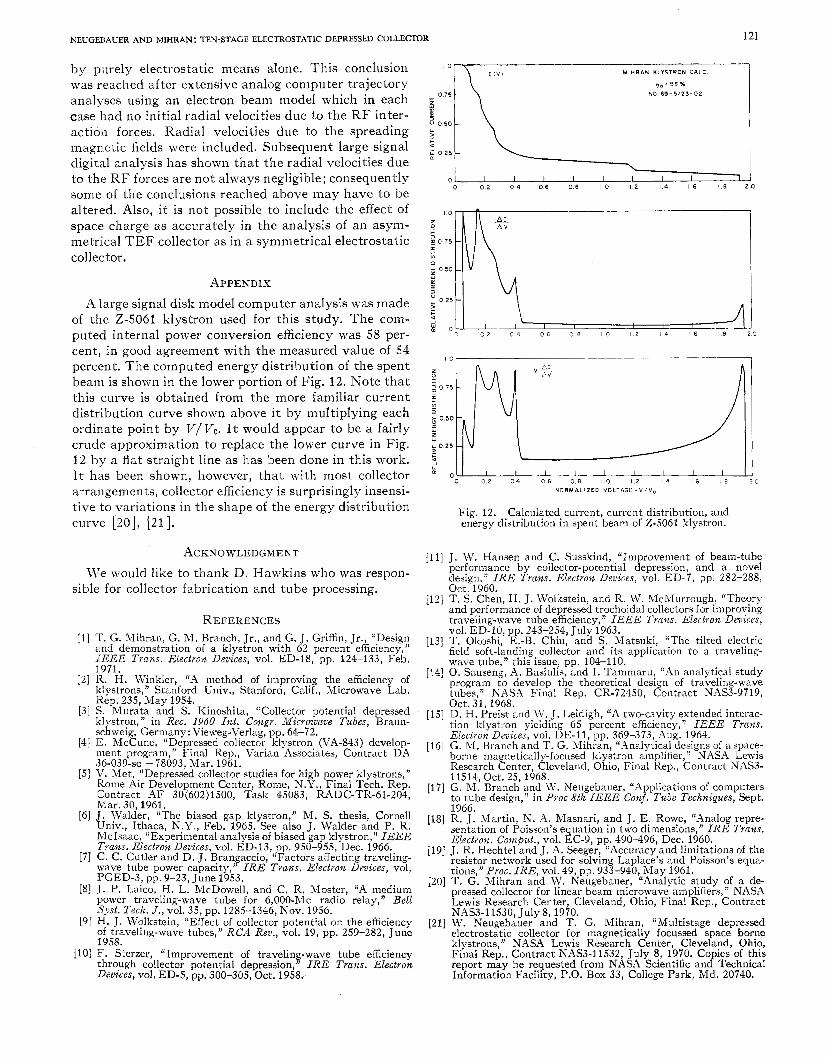
A large signal disk model computer analysis was made of the 2-5061 klystron used for this study. The com- puted internal power conversion efficiency was 58 per- cent, in good agreement with the measured value of 54 percent. The computed energy distribution of the spent beam is shown in the lower portion of Fig. 12. Kote that this curve is obtained from the more familiar current distribution curve shown above i t by multiplying each ordinate point by V/I/o. I t would appear to be a fairly crude approximation to replace the lower curve in Fig. 12 b.y a flat straight line as has been done in this work. I t has been shown, however, that with most collector arrangements, collector efficiency is surprisingly insensi- tive to variations in the shape of the energy distribution curve [20], [21] .
ACKNOWLEDGMENT We would like to thank D. Hawkins who was respon-
sible for collector fabrication and tube processing.
REFERENCES T . G. Mihran, G. ”I Branch, Jr., and G. J. Griffin, Jr., “Desig; and demonstration of a klystron with 62 percent efficiency, i%EE Trans. Electron Devices, vol. ED-18, pp. 124-133, Feb. 1.971.
klystrons,’’ Stanford Univ., Stanford, Calif., Microwave Lab. R. H. Winkler, “A method of improving the efficiency of
Rep. 235, May 1954. S. Murata and S. Kinoshita, “Collector potential depressed klystron,” in Rec. lY60 Int. Congr. Microwave Tubes, Braun- schweig, Germany: Vieweg-Verlag, pp. 64-72. ]E. McCune, “Depressed collector klystron (VA-843) develop- ment program,” Final Rep., Varian Associates, Contract DA 36-039-sc -78093, Mar. 1961. ’V. Met, “Depressed collector studies for high power klystrons,” Rome Air Development Center, Rome, N.Y., Final Tech. Rep. Contract AF 30(602)1500, Task 45083, RADC-TR-61-204, Mar. 30. 1961.
’ J . !&‘alder, “The biased gap klystron,” M. S. thesis, Cornel1 Unw., Ithaca, N.Y., Feb. 1965. See also J . Walder a n i P. R. McIsaac, “Experimental analysis of biased gap klystron, IEEE Trans. Electron Devices, vol. ED-13, pp. 950-955, Dec. 1966.
[7] C. C. Cutler and D. jr, Brangaccio, “Factors affecting traveling- wave tube power capacity,” IRE Trans. Electron Devices, vol, PGED-3, pp. 9-23, June 1953,
[8] J. P. Laico, H. L. McDowell, and C. R. Moster, “A medium power traveling-wave tube for 6,000-Mc radio relay,” Bell Syst. Tech. J . , vol. 35, pp. 1285-1346, Nov. 1956.
[91 H. J. Wolkstein, “ERect,,of collector potential on the efficiency of traveling-wave tubes, RCA Rev., vol. 19, pp. 259-282, June 1958.
[lo] F. Sterzer, “Improvement of traveling-wave tube efficiency through collector potential depression,” IRE Trans. Electron Devices, vol. ED-5, pp. 300-305, Oct. 1958.
I O I [ V I M I I I R A N KLVSTRON C A L C
,o: 5 0 Y.
NO 69-5/23-02
’I d 0 2 5 \ .
0 I I I I I I I I I I 0 0.2 0 4 0.6 0 .0 I O 1.2 1.4 1.6 I 0 2 0
0 I I I I I I 0 0 2 0 4 0 6 0 8 I O 1 2 1 4 I 6 I 0 2 0
N O R M A L I Z E D V O L T A G E - V / V ,
Fig. 12. Calculated current, current distribution, and energy distribution in spent beam of 2-5061 klystron.
J. W. Hansen and C. Susskind, “Improvement of beam-tube performance by collector-potential depression, and a novel design,” IRE Trans. Electron Devices, vol. ED-7, pp. 282-288, Oct. 1960. T. S. Chen, H. J. Wolkstein, and R. W. McNIurrough, “Theory and performance of depressed trochoidal collectors for improving traveling-wave tube efficiency,” IEEE Trans. Electron Devices,
T. Okoshi, E.-B. Chlu, and S. Matsulri, “The tilted electric field soft-landing collector and its application to a traveling- wave tube,” this issue, pp. 104-110. 0. Sauseng, A. Basiulis, and I. Tammaru, “An analytical study program to develop the theoretical design of traveling-wave
Oct.31, 1968. tubes,’’ NASA Final Rep. CR-72450, Contract NAS3-9719,
tion klystron yielding 65 percent efficiency,” IEEE Trans. D. H. Preist and W. J. Leidigh, “A two-cavity extended interac-
Electron Devices, vol. DE-11, pp. 369-373, Hug. 1964. G. NI. Branch and T. G. Mihran, “Analytical designs of a space- borne magnetically-focused klystron amplifier,” NASA Lewis Research Center, Cleveland, Ohio, Final Rep., Contract NAS3- 11514, Oct. 25, 1968. G. M. Branch tnd W. Neugebauer, “Applications of computers to tube design, in Proc 8th IEEE CorLf. Tube Techniques, Sept. 1966.
V O ~ . ED-10, pp. 243-2$4, July 1963.
R. J. Martin, N. A. Masnari, and J . E. Rowe, “Analog repre-
Electron. Comput., vol. EC-9, pp. 490-496, Dec. 1960. sentation of Poisson’s equation in two dimensions,” IRE Trans.
J. R. Hechtel and J. A. Seeger, “Accuracy and limitations of the resistor network used for solving Laplace’s and Poisson’s equa- tions,” Proc. IRE, vol. 49, pp. 933-940, Nay 1961. T. G. Mihran and W. Neugebauer, “Analytic study of a de- pressed collector for linear beam microwave amplifiers,” NASA Lewis Research Center, Cleveland, Ohio, F k a l Rep., Contract
[21] W. Xeugebauer and T. G. Mihran, “Multistage depressed electrostat,ic collector for magnetically focussed space borne klystrons, NASA Lewis Research Center, Cleveland, Ohio, Final Rep., Contract NAS3-11532, July 8, 1970. Copies of this report may be requested from NASA Scientific and Technical Information Facility, P.O. Box 33, College Park, Md. 20740.