A TG-FTIR INVESTIGATION AND KINETIC ANALYSIS OF OIL SHALE KEROGEN PYROLYSIS USING THE DISTRIBUTED ACTIVATION ENERGY MODEL
MINGSHU CHI(a,b), XIANGCHENG XU(c), DA CUI(b), HONGXI ZHANG(b), QING WANG(b)* (a) The College of Energy and Mechanical Engineering in North China Electric
Power University, Beijing, 102206, P. R. China (b) Engineering Research Centre of Oil Shale Comprehensive Utilization, Ministry
of Education, Northeast Dianli University, Jilin 132012, Jilin Province, P. R. China
(c) Inner Mongolia Daihai Electric Power Generation Co., Ltd., Ulanqab 013700, P. R. China
Abstract. In this paper, the Thermogravimetric Analysis-Fourier Transform Infrared Spectroscopy (TG-FTIR) technique is used to analyze the pyrolysis behavior of kerogen of two different oil shales at different heating rates. The pyrolysis reaction mechanism of kerogen and the regularity of change in the composition of its pyrolysis products are discussed. Furthermore, the apparent activation energy (E) and the frequency factor (k0) are determined through the distributed activation energy model (DAEM), and the relation-ships between E and the kerogen chemical structure, conversion rate, frequency factor, and the amount of kerogen pyrolysis products generated are established. The results show that the kerogen structure is similar to that of aliphatic chains, its pyrolysis takes place mostly in the range of 350–520 °C, and the post-pyrolysis semicoke residue accounts for less than 32.5%. In the kerogen pyrolysis process, first the precipitation of free water takes place, followed by depolymerization and decarboxylation, so that the main alkyl side chains are constantly parting and cycling, and the oxygen-containing group gradually breaks up and produces substances such as alkanes, carboxylic acids, alcohols, and aldehydes until a more stable graphite-like structure of kerogen is formed. In the products of kerogen pyrolysis, the concentrations of released lightweight noncondensable volatiles (CH4, CO, CO2) are lower than those of liberated condensable volatiles containing macromolecules (e.g., CHx, C=O groups) that show the Gaussian-like distribution. The apparent activation energy in the two kinds of kerogen varies in the range of 100–495 kJ·mol–1. At the same time, during the entire pyrolysis system, the apparent activation energy and logarithm values of the frequency factor (lnk0) exhibit a good linear relationship. The study reveals the pyrolysis reaction mechanism of oil shale in terms of the
A TG-FTIR Investigation and Kinetic Analysis of Oil Shale Kerogen Pyrolysis ...
229
relationship between the chemical structure of kerogen macromolecules and the degree of oil shale pyrolysis. Keywords: kerogen chemical structure, TG-FTIR, pyrolysis mechanism, released components analysis, distributed activation energy model.
1. Introduction
Oil shale, an unconventional oil and gas resource, is a fine foliated sedi-mentary rock containing heterogeneous solid combustible organic matter in its mineral skeleton. Thanks to its rich reserves and the feasibility of exploitation, oil shale is recognized throughout the world as an important future supplement to oil for energy purposes [1–3]. The industrial value and hydrocarbon generation potential of oil shale significantly depend on its chemical composition and the structure of the dispersed organic micro-component contained within. With kerogen as its main organic component, oil shale is a three-dimensional (3D) organic polymer of complex chemical structure composed of C, H and O, and minor elements like N and S [2]. The nonhomogeneous kerogen macromolecules are the major mother substances of oil and gas, the pyrolysis process of which involves many complex physical and chemical reactions.
The Thermogravimetric Analysis (TGA) is commonly used to study the pyrolysis characteristics and kinetics of complex materials such as coal, kerogen and biomass. In pyrolysis kinetics analysis, the apparent activation energy (E) and the frequency factor (k0) are important parameters describing the pyrolysis process of a sample. The existing literature reports many pyro-lysis kinetic models, including universal first-order [4], section first-order [5], Starink [6], Friedman [7] and distributed activation energy [8] models. The distributed activation energy model (DAEM) was established by Vand [9] and then simplified by Miura and Maki [10] to make it easier to obtain E and k0 at different heating rates (≥ 3) upon the pyrolysis process. In recent years, DAEM has been widely applied to studying the pyrolysis kinetics of organic materials like coal, oil shale and biomass under linear heating con-ditions [11–14]. Based on the first-order reaction, Liu et al. [15] offered theoretical explanations for and made improvements in DAEM, applying then the model to a complex system of non-first-order chemical reactions. Having comprehensively considered all experimental and theoretical results, it may be said that DAEM has many advantages over the other pertinent methods. Fourier Transform Infrared Spectroscopy (FTIR) is an effective technique for the qualitative identification and structural analysis of organic compounds, allowing tests to be carried out also with samples other than crystalline and amorphous. In the microcomponent study of organic com-pounds, the chemical structure and variation characteristics of the corres-ponding macromolecules (except for paramagnetic diatomic molecules) may be determined according to the distribution of the characteristic spectrum
Mingshu Chi et al.
230
and fingerprint region absorption peak in the spectrum. Solomon and Carangelo [16] studied three kinds of coal samples by using FTIR, and, accounting for the correlation between the characteristic peak area and sample concentration, quantitatively determined the percentage contents of aliphatic hydrogen (Hal) and aromatic hydrogen (Har) in the sample. Wang et al. [17] characterized the kerogen of oil shales from five different regions of China by employing X-Ray Diffraction (XRD), Nuclear Magnetic Resonance Spectroscopy (13C NMR) and FTIR. The results showed kerogen to consist of different functional groups, i.e. aliphatic and aromatic hydrocarbons and oxygen-containing compounds, while the content of aliphatic carbon was in the range of 60–90%, being mainly of long chain-containing methylene structure. Thermogravimetric Analysis-Fourier Transform Infrared Spectro-scopy (TG-FTIR), which offers the advantages of high sensitivity, real-time analysis and reproducibility, currently suits better the online identification of gaseous products and study of the pyrolysis mechanism of kerogen. Tong et al. [18] investigated the kerogen of Chinese Huadian oil shale by using 13C NMR, X-ray Photoelectron Spectroscopy (XPS) and TG-FTIR. The researchers established that the kerogen carbon skeleton consisted mainly of aliphatic carbon (86.1%), while the aromatic carbon content was rather low (9.7%). It was also found that a functional group existed in the organic oxygen of kerogen and nearly half of the amount of organic nitrogen was present in aromatic heterocyclic rings. However, the in-depth study of kerogen composi-tion and pyrolysis mechanism is extremely significant for further improving the development of oil shale and increasing its usage value, as well as bettering the quality characteristics of oil and gas produced.
In recent years, investigators in different countries have carried out a lot of research on the molecular composition and pyrolysis process of oil shale, though rarely revealing the pyrolysis reaction mechanism in terms of the relationship between kerogen macromolecular chemical structure and oil shale pyrolysis mechanism. The present paper characterizes the micro-structure and composition of two types of kerogen samples by using the FTIR analysis, and performs their online analysis upon pyrolysis at different heating rates (10, 20, 50 °C/min), by employing TG-FTIR, to find out the characteristic parameters of the process. In addition, the pyrolysis reaction mechanism of kerogen and the change of the yield of pyrolysis products are studied in detail. Also, the apparent activation energy and the frequency factor are determined through DAEM. Furthermore, the paper determines the apparent activation energy and uncovers the kerogen chemical structure, along with the change of the relationship between the conversion rate and the frequency factor.
A TG-FTIR Investigation and Kinetic Analysis of Oil Shale Kerogen Pyrolysis ...
231
2. Experimental
2.1. Selection and preparation of samples
The oil shale samples for the study were collected from the Huadian mine in Jilin Province and the Maoming mine in Guangdong Province, both China, in accordance with the requirements of standards ASTM D2013-07 (USA) and GB474-2008 (China). The collected samples were crushed, ground and screened to a particle size up to 88 μm and labeled HD and MM, respectively. The samples were obtained as hard, dark gray blocks with no particular smell. The proximate and ultimate analyses of oil shale samples met Chinese national standards GB/T212-2011 and GB/T476-2001, and the Fisher assay satisfied the national standard SH/T0508-92 of China. The physical properties of oil shale samples are presented in Tables 1 and 2. The kerogen samples were prepared in accordance with the method described in the national standard GB/T19144-2010 (China) and labeled respectively HDK and MMK. Kerogen purity was determined using the Chinese national standard SY5123/T-1996, with loss on ignition (LOI) greater than 97%, which falls in line with the preparation standard grade with LOI of kerogen ≥ 75%. The kerogen ultimate analysis, the results of which are presented in Table 3, was carried out in compliance with the Chinese national standard GB/T476-2001. Table 3 also gives the H/C and O/C atomic ratios and loss on ignition in the samples. Combined with the Van Krevelan diagram [19],
HDK was determined to be type I kerogen, while MMK was established to belong to kerogen of types I to II. However, it was more similar to type I kerogen, which suggests that kerogens of these two types have rather good oil-generating potential [18]. After the experiment, the remainders of the samples were placed in a vacuum oven and dried to constant mass, weighed, and finally stored in the dryer, for further use.
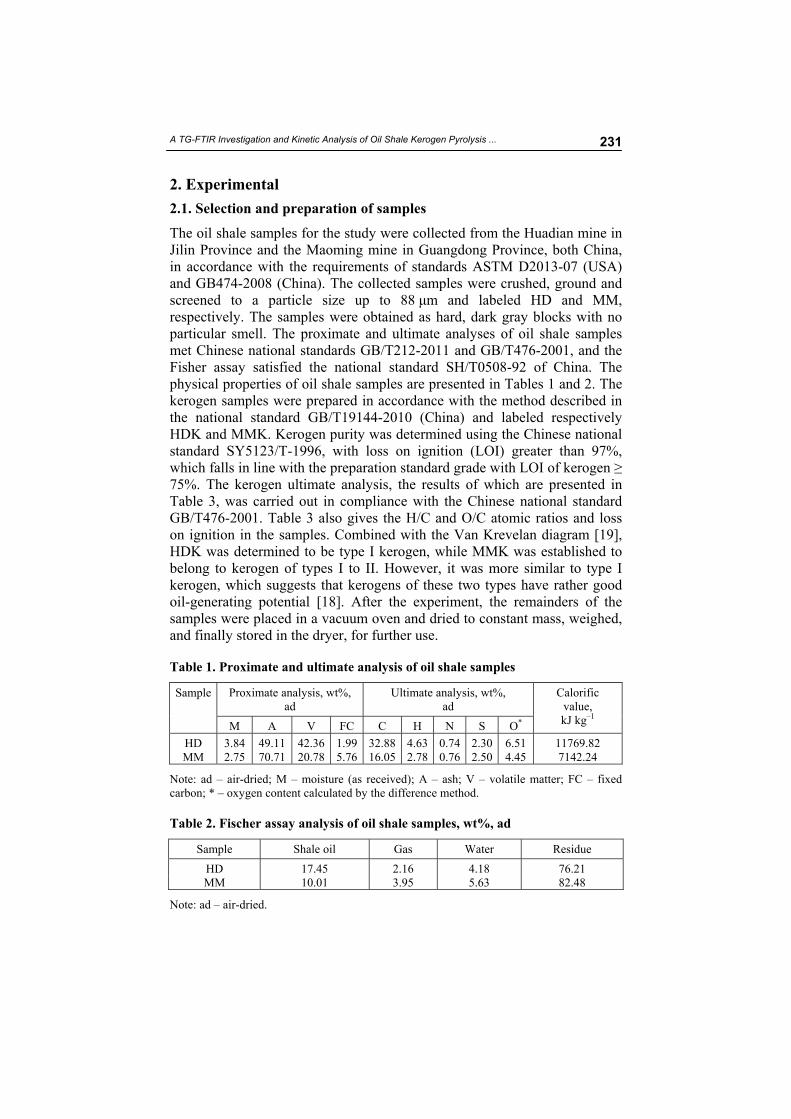
Table 1. Proximate and ultimate analysis of oil shale samples
Note: ad – air-dried; M – moisture (as received); A – ash; V – volatile matter; FC – fixed carbon; * – oxygen content calculated by the difference method.
Table 2. Fischer assay analysis of oil shale samples, wt%, ad
Sample Shale oil Gas Water Residue
HD 17.45 2.16 4.18 76.21 MM 10.01 3.95 5.63 82.48
Note: ad – air-dried.
Mingshu Chi et al.
232
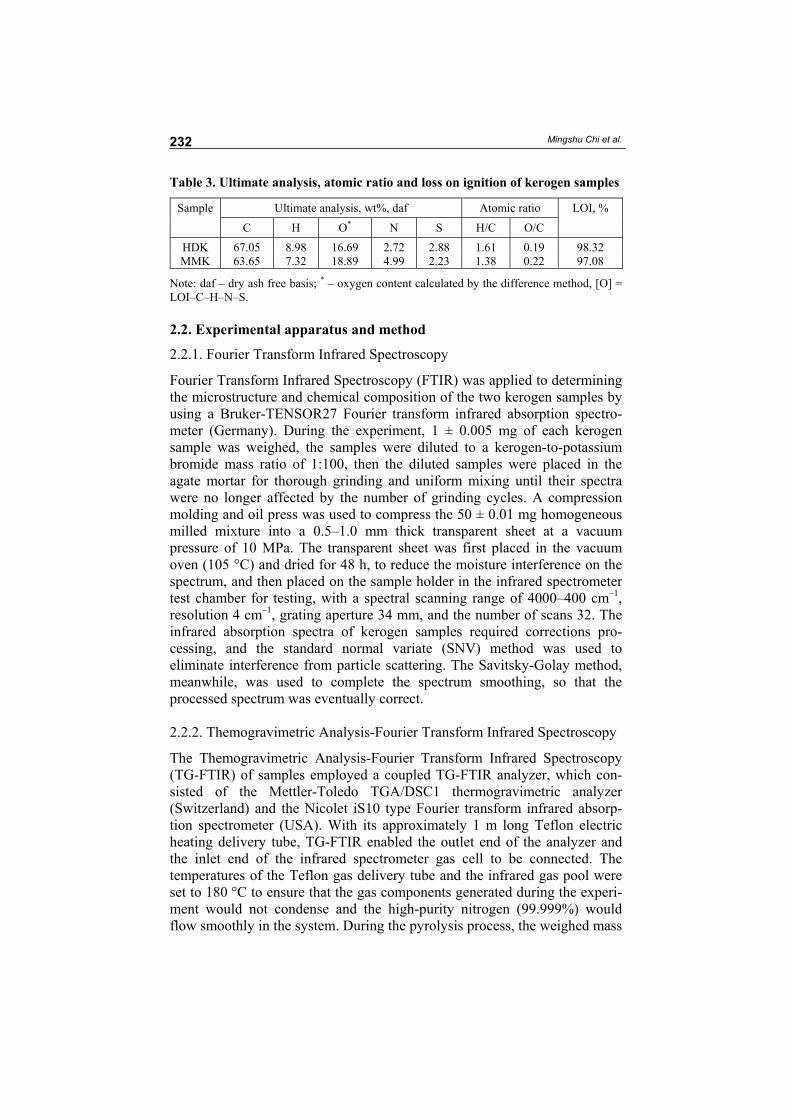
Table 3. Ultimate analysis, atomic ratio and loss on ignition of kerogen samples
Ultimate analysis, wt%, daf Atomic ratio LOI, % Sample
Note: daf – dry ash free basis; * – oxygen content calculated by the difference method, [O] = LOI–C–H–N–S.
2.2. Experimental apparatus and method
2.2.1. Fourier Transform Infrared Spectroscopy
Fourier Transform Infrared Spectroscopy (FTIR) was applied to determining the microstructure and chemical composition of the two kerogen samples by using a Bruker-TENSOR27 Fourier transform infrared absorption spectro-meter (Germany). During the experiment, 1 ± 0.005 mg of each kerogen sample was weighed, the samples were diluted to a kerogen-to-potassium bromide mass ratio of 1:100, then the diluted samples were placed in the agate mortar for thorough grinding and uniform mixing until their spectra were no longer affected by the number of grinding cycles. A compression molding and oil press was used to compress the 50 ± 0.01 mg homogeneous milled mixture into a 0.5–1.0 mm thick transparent sheet at a vacuum pressure of 10 MPa. The transparent sheet was first placed in the vacuum oven (105 °C) and dried for 48 h, to reduce the moisture interference on the spectrum, and then placed on the sample holder in the infrared spectrometer test chamber for testing, with a spectral scanning range of 4000–400 cm–1, resolution 4 cm–1, grating aperture 34 mm, and the number of scans 32. The infrared absorption spectra of kerogen samples required corrections pro-cessing, and the standard normal variate (SNV) method was used to eliminate interference from particle scattering. The Savitsky-Golay method, meanwhile, was used to complete the spectrum smoothing, so that the processed spectrum was eventually correct. 2.2.2. Themogravimetric Analysis-Fourier Transform Infrared Spectroscopy
The Themogravimetric Analysis-Fourier Transform Infrared Spectroscopy (TG-FTIR) of samples employed a coupled TG-FTIR analyzer, which con-sisted of the Mettler-Toledo TGA/DSC1 thermogravimetric analyzer (Switzerland) and the Nicolet iS10 type Fourier transform infrared absorp-tion spectrometer (USA). With its approximately 1 m long Teflon electric heating delivery tube, TG-FTIR enabled the outlet end of the analyzer and the inlet end of the infrared spectrometer gas cell to be connected. The temperatures of the Teflon gas delivery tube and the infrared gas pool were set to 180 °C to ensure that the gas components generated during the experi-ment would not condense and the high-purity nitrogen (99.999%) would flow smoothly in the system. During the pyrolysis process, the weighed mass
A TG-FTIR Investigation and Kinetic Analysis of Oil Shale Kerogen Pyrolysis ...
233
of each kerogen sample was 10 ± 0.1 mg, the heating rates were set respectively at 10, 20 and 50 °C/min, the test temperature was in the range of 50–850 °C, the flow rate of the high-purity N2 was 50 ml/min, and positive pressure conditions were established. The other experimental conditions were as follows: spectral detection range 4000–400 cm–1, resolution 4 cm–1, number of scanning cycles 200, and scanning rate 20 kHz. 2.3. Distributed activation energy model
The distributed activation energy model (DAEM) is a kinetic method that processes the reaction behavior of complex systems involving an infinite series of parallel first-order reactions. The related theoretical methods established earlier include the approximation [20], inflection tangent [21], Miura differential [22] and Miura integral [10] methods. In this paper, the Miura integral method was used to calculate the pyrolysis kinetic parameters of kerogen. In calculations, two assumptions were made: 1) assumption of occurrence of an unlimited number of parallel reactions, i.e. the entire pyro-lysis reaction system consists of an infinite number of independent primary irreversible reactions taking place in parallel; 2) assumption of the activated energy distribution. In case of the latter assumption, each reaction has a uniquely determined activation energy value, and thus the activation energy value of the entire reaction system is presented in the form of a certain continuous distribution function. At point t, the kerogen pyrolysis process satisfies the following integral equation:
*
0( , )1 ( )/ Φ E T f E dV V E
, (1)
where 0
0exp( / )( , ) exp
TE R
kT dTΦ E T
; V is the emitted quantity of
a volatile component at point t; V* is the total quantity of volatiles calculated from the activation energy at any small change in the interval (E, E + △E) during the pyrolysis reaction of kerogen samples; V/V* is the conversion rate of pyrolysis products at point t; k0 is the frequency factor; E is the apparent activation energy; R is the ideal gas constant, R = 8.314 J·mol–1·K–1.
When
T = T0 + βt, (2)
where β is the heating rate, and
β = dT/dt, (3)
the activation energy distribution function f (E) can satisfy the following equation:
0( ) =1f E dE
. (4)
Mingshu Chi et al.
234
Meanwhile, the function ( , )Φ E T is calculated and summarized as follows:
20( , ) exp .exp( / )RT
Φ E T E RTE
k
. (5)
According to the Miura integration method, Equation (1) is simplified upon deformation as follows:
*02
1ln ln ln[ ln(1 / )]
k R EV V
E R TT
. (6)
From Equation (5), ( , )Φ E T = 0.58, allowing for a further simplification of Equation (6) into the following Arrhenius equation [10]:
02
1ln ln 0.6075
k R E
E R TT
. (7)
3. Results and discussion
3.1. Kerogen microstructure characteristics
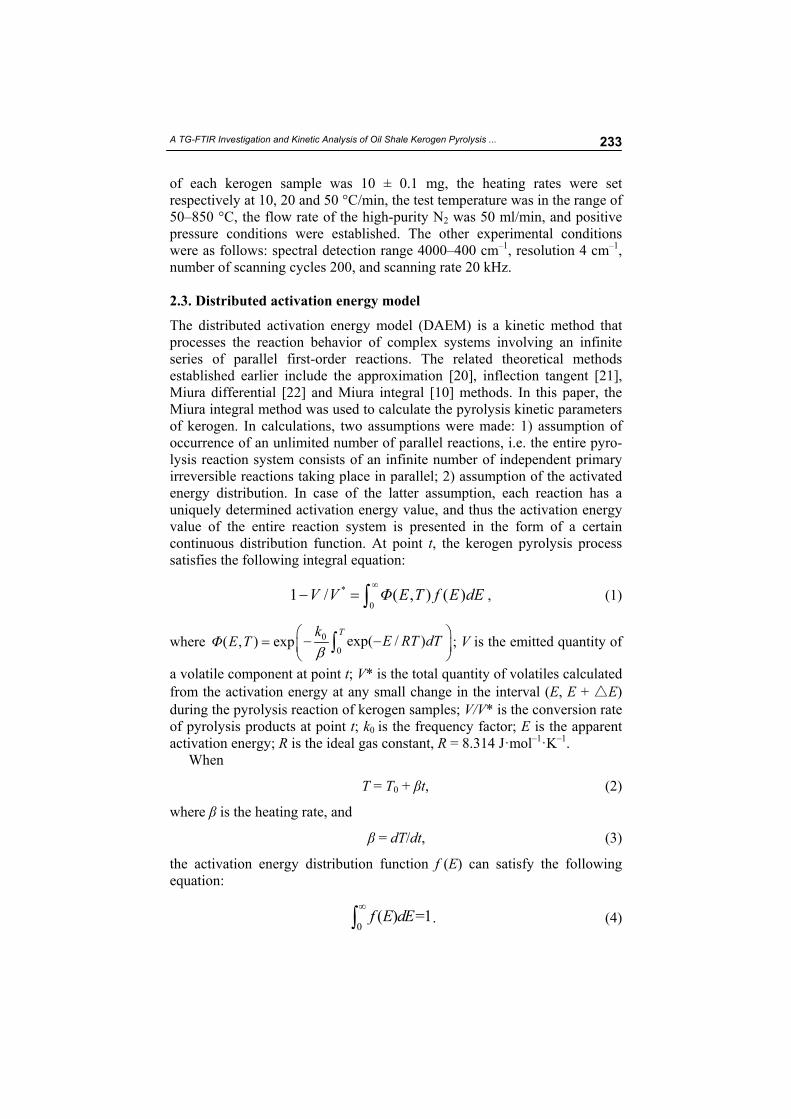
The absorbance strength at any wavenumber in the FTIR spectrum region of the tested kerogen samples can be obtained according to the Beer-Lambert law, which reflects the concentration of substances (functional groups) in kerogen [23]. Figure 1 shows the infrared absorption spectra of the micro-structure of kerogen samples. Based on FTIR and quantum theory [24, 25], the infrared spectra of the samples were divided into the following three regions: aliphatic hydrocarbons CHx stretching vibration, aromatic (–Ar) outer surface deformation and vibration, and other oxygen-containing hetero-atom stretching vibrations, as presented in Table 4.
Fig. 1. FTIR spectra of kerogen samples.
A TG-FTIR Investigation and Kinetic Analysis of Oil Shale Kerogen Pyrolysis ...
235
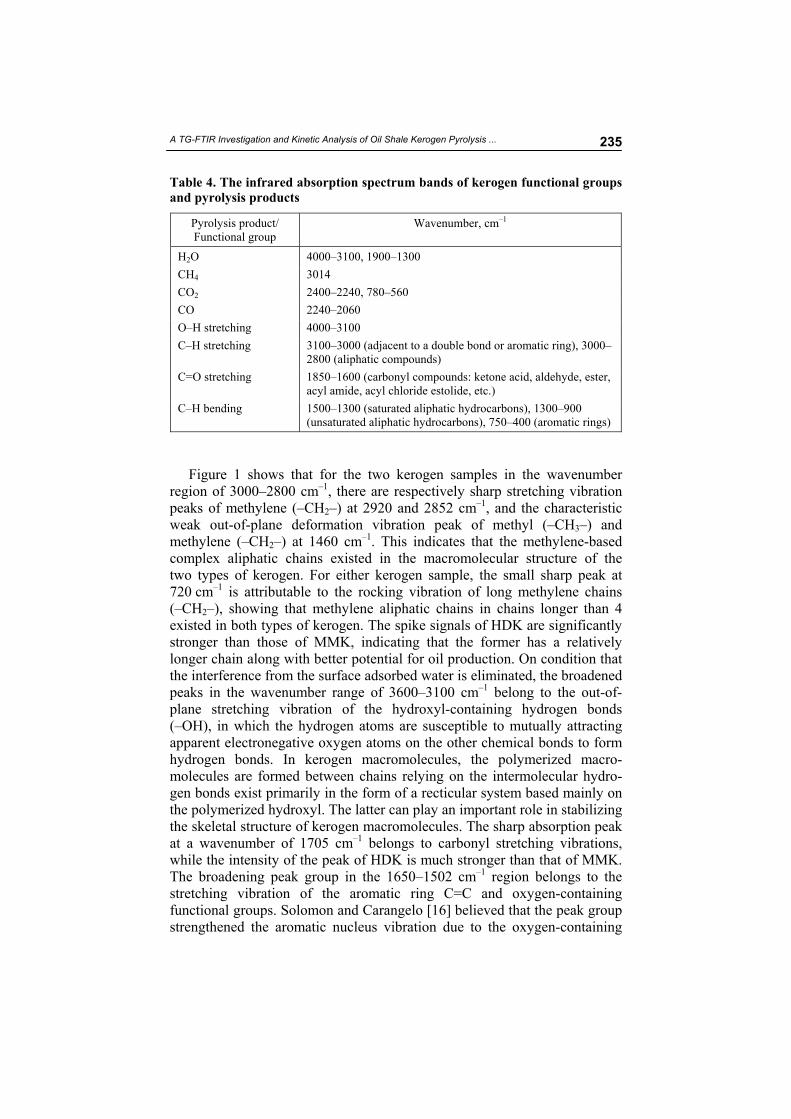
Table 4. The infrared absorption spectrum bands of kerogen functional groups and pyrolysis products
Pyrolysis product/ Functional group
Wavenumber, cm–1
H2O 4000–3100, 1900–1300
CH4 3014
CO2 2400–2240, 780–560
CO 2240–2060
O–H stretching 4000–3100
C–H stretching 3100–3000 (adjacent to a double bond or aromatic ring), 3000–2800 (aliphatic compounds)
Figure 1 shows that for the two kerogen samples in the wavenumber
region of 3000–2800 cm–1, there are respectively sharp stretching vibration peaks of methylene (–CH2–) at 2920 and 2852 cm–1, and the characteristic weak out-of-plane deformation vibration peak of methyl (–CH3–) and methylene (–CH2–) at 1460 cm–1. This indicates that the methylene-based complex aliphatic chains existed in the macromolecular structure of the two types of kerogen. For either kerogen sample, the small sharp peak at 720 cm–1 is attributable to the rocking vibration of long methylene chains (–CH2–), showing that methylene aliphatic chains in chains longer than 4 existed in both types of kerogen. The spike signals of HDK are significantly stronger than those of MMK, indicating that the former has a relatively longer chain along with better potential for oil production. On condition that the interference from the surface adsorbed water is eliminated, the broadened peaks in the wavenumber range of 3600–3100 cm–1 belong to the out-of-plane stretching vibration of the hydroxyl-containing hydrogen bonds (–OH), in which the hydrogen atoms are susceptible to mutually attracting apparent electronegative oxygen atoms on the other chemical bonds to form hydrogen bonds. In kerogen macromolecules, the polymerized macro-molecules are formed between chains relying on the intermolecular hydro-gen bonds exist primarily in the form of a recticular system based mainly on the polymerized hydroxyl. The latter can play an important role in stabilizing the skeletal structure of kerogen macromolecules. The sharp absorption peak at a wavenumber of 1705 cm–1 belongs to carbonyl stretching vibrations, while the intensity of the peak of HDK is much stronger than that of MMK. The broadening peak group in the 1650–1502 cm–1 region belongs to the stretching vibration of the aromatic ring C=C and oxygen-containing functional groups. Solomon and Carangelo [16] believed that the peak group strengthened the aromatic nucleus vibration due to the oxygen-containing
Mingshu Chi et al.
236
functional groups connected by the aromatic ring Based on the above analysis, kerogen is polymerized from chemical bonds (i.e. hydrogen, ester, ether and π bonds) and contains functional groups such as alkyl, hydroxyl, carbonyl, carboxyl and aldehyde, At the same time, methylene is the basic cell of an aliphatic chain in the kerogen structure, and the interaction among the groups leads to the complex polymer compound having a sheet structure of condensed aromatic nuclei [26].
3.2. Analysis of pyrolysis characteristics of kerogen samples
The kerogen samples HDK and MMK were analyzed for pyrolysis cha-racteristics. Figures 2a–b show the thermogravimetric (TG) and differential thermogravimetric (DTG) curves of HDK and MMK, respectively, obtained
(a)
(b)
Fig. 2. TG and DTG curves of kerogen samples at different heating rates: (a) HDK; (b) MMK.
A TG-FTIR Investigation and Kinetic Analysis of Oil Shale Kerogen Pyrolysis ...
237
at different heating rates (10, 20, 50 °C/min). According to the figure, the total thermal loss of HDK reaches 80% by weight, while that of MMK is near 70% by weight. Thus, HDK underwent a greater heat loss by weight. The characteristic pyrolysis parameters of kerogen samples were established according to TG/DTG curves (Table 5). The initial and final pyrolysis tem-peratures (respectively t0 and tf) given in Table 5 were determined in accordance with the calculation method described in [14]. At different heat-ing rates, the thermal loss by weight (w) for HDK in the main pyrolysis stage was respectively 46.94, 46.53 and 42.38%, and 40.90, 38.87 and 37.45% for MMK So, HDK experienced a greater weight loss. As the heating rate increased, the TG/DTG curves of both samples shifted to a higher tem-perature zone, and the thermal weight loss of HDK changed little while that of MMK was reduced. At different heating rates, the initial pyrolysis tem-perature of HDK was higher than that of MMK, the final pyrolysis tempera-tures of both were rather close. However, the maximum weight loss rate ((vDTG)max), the temperature of maximum weight loss rate ((tDTG)max) and the thermal weight loss rate (w) of HDK were greater than the corresponding figures for MMK. This indicates that the macromolecular structure and composition of HDK are relatively simple, its molecular structures are internally closely linked, the pyrolysis process represents a centralized reaction, and the yields of volatile substances are high, and reach quickly the peak. On the other hand, the internal molecular structure of MMK is rather complex. Both the samples underwent a bond-breaking reaction during the pyrolysis, involving interactions between the functional groups within the macromolecular structure of kerogen so that the pyrolysis required high energy and, finally, resulted in a higher final pyrolysis temperature [27, 28].
Note: β – heating rate; t0 – initial pyrolysis temperature; tf – final pyrolysis temperature; (vDTG)max – maximum weight loss rate; (tDTG)max – temperature of maximum weight loss rate; w – thermal weight loss. 3.3. Analysis of the pyrolysis mechanism of kerogen samples
Figure 3 shows the Gramm-Schmidt curves for pyrolysis of kerogen samples HDK and MMK at a heating rate of 20 °C/min obtained using TG-FTIR. It can be seen from the figure that the kerogen samples show volatile compo-nent escape peaks of two different intensities, the intensity of each peak
Mingshu Chi et al.
238
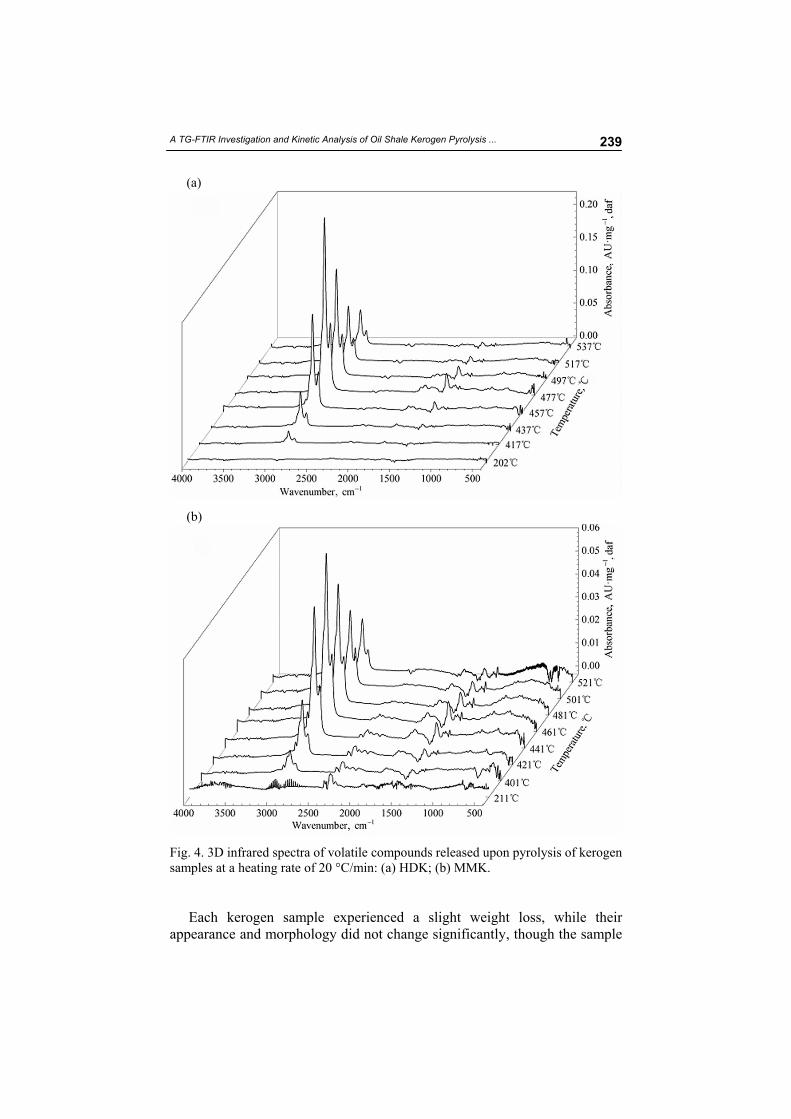
Fig. 3. Gramm-Schmidt curves for pyrolysis of kerogen samples at a heating rate of 20 °C/min obtained using FTIR. matching well with that of the corresponding DTG peak. According to the DTG and Gram-Schmidt curves and the 3D FTIR spectra, the FTIR spectral curves at several representative temperatures during the pyrolysis were selected for study. The conversion mechanism of volatiles during the pyrolysis of kerogen samples is depicted in Figure 4. In Figures 4a–b, absorbance, wavenumber and representative time are coordinates. From Figure 4a it can be seen that the first volatile escape peak for HDK is at 202 °C, while the corresponding infrared spectral curve exhibits mainly a weak peak group in the stretching vibration region at 2325–2217 and 1920–1892 cm–1. This indicates that a very small amount of micromolecular gases (CO2, CO, H2O) was produced along with the breakage of intramolecular hydroxyl and carbonyl functional groups in the transitional stage of pyrolysis of HDK. Figure 4b shows that the first volatile escape peak for MMK is at 211 °C, while the corresponding infrared spectral curve exhibits weak absorption peaks like the weak hydroxy stretching vibration (characteristic wave bands at 3750 cm–1), the C–H stretching vibration (two characteristic wave bands at 2962/2800 cm–1) and the C=O stretching vibration (two characteristic wave bands at 2377/2306 cm–1). This implies that small amounts of micromolecular gases (H2O, CO2, CH4, CO) were generated along with the breakage of intramolecular (–OH), C=O and CHx functional groups in the transitional stage of pyrolysis of MMK. In the transitional phase of pyrolysis, the breakage of intra- or intermolecular hydrogen bonds led to the release of a very small amount of water from kerogen samples. As a result, the kerogen macromolecules were structurally changed and the amorphous region was destructed. Finally, the kerogen molecules underwent homogenization of polymerization degree, so that a large quantity of active free radicals was produced from dehydrogenization and decarbonization, and frangible bond functional groups (carboxyl, alcohol, hydroxyl, carbonyl) were gradually produced [29].
A TG-FTIR Investigation and Kinetic Analysis of Oil Shale Kerogen Pyrolysis ...
239
(a)
(b)
Fig. 4. 3D infrared spectra of volatile compounds released upon pyrolysis of kerogen samples at a heating rate of 20 °C/min: (a) HDK; (b) MMK.
Each kerogen sample experienced a slight weight loss, while their
appearance and morphology did not change significantly, though the sample
Mingshu Chi et al.
240
internal structure underwent a series of physical as well as irreversible chemical changes typical of hot asphalt. As a result, the samples composi-tion, structure and number of chemical groups were changed and an active intermediate was formed which influenced the distribution of final volatile products.
In Figures 4a–b, the temperatures corresponding to the second-order intensity peaks of HDK and MMK are 477 °C and 461 °C, respectively, both representing the highest volatile escape peak throughout pyrolysis. For both HDK and MMK, the front and back of the highest volatile escape peak together form the main region of pyrolysis, namely the oil production stage. With the constant escape of large quantities of volatile products, the intensity of characteristic peaks, including the –CH2– stretching vibration at 2920 and 2852 cm–1, the C=O stretching vibration at 1705 cm–1 and the –CH3– and –CH2– deformation vibrations at 1460 cm–1, increased with time (temperature) elapsed, while the intensity of each peak weakened rapidly upon attaining the maximum. However, the corresponding CO2 and CO absorption peaks of stretching vibrations at 2278 and 2240 cm–1 always appeared feebly during pyrolysis, while the weak absorption peak of gaseous H2O corresponding to the stretching vibration in the 3852–3150 cm–1 region was always present. Based on the above analysis, with increasing temperature, the kerogen samples underwent an intense decomposition, which afforded a high amount of macromolecular condensable volatile components along with a small portion of micromolecular noncondensable volatiles, which eventually resulted in a significant weight loss. During pyrolysis, the kerogen macromolecules under-went a series of complex thermal decomposition reactions, featuring chemical bonds (crosslinks) breakage, along with the constant breaking, parting and cyclization of alkyl side chains, the carboxyl group and ether bond functional groups in the aliphatic hydrocarbons. As a result, the macromolecular tar sub-stances like alkanes, carboxylic acids, aldehydes, alcohols and ketones, and micromolecular light gases gradually formed. In subsequent experiments, a small portion of macromolecular condensable volatile components were broken down into micromolecular gases CH4, CO2 and CO. The aromatic structures were continuously polycondensated, and the aromatic structure levels in the kerogen pyrolysis residues increased. Finally, the solid phase crosslinking and a more stable graphite-like structure of kerogen took shape.
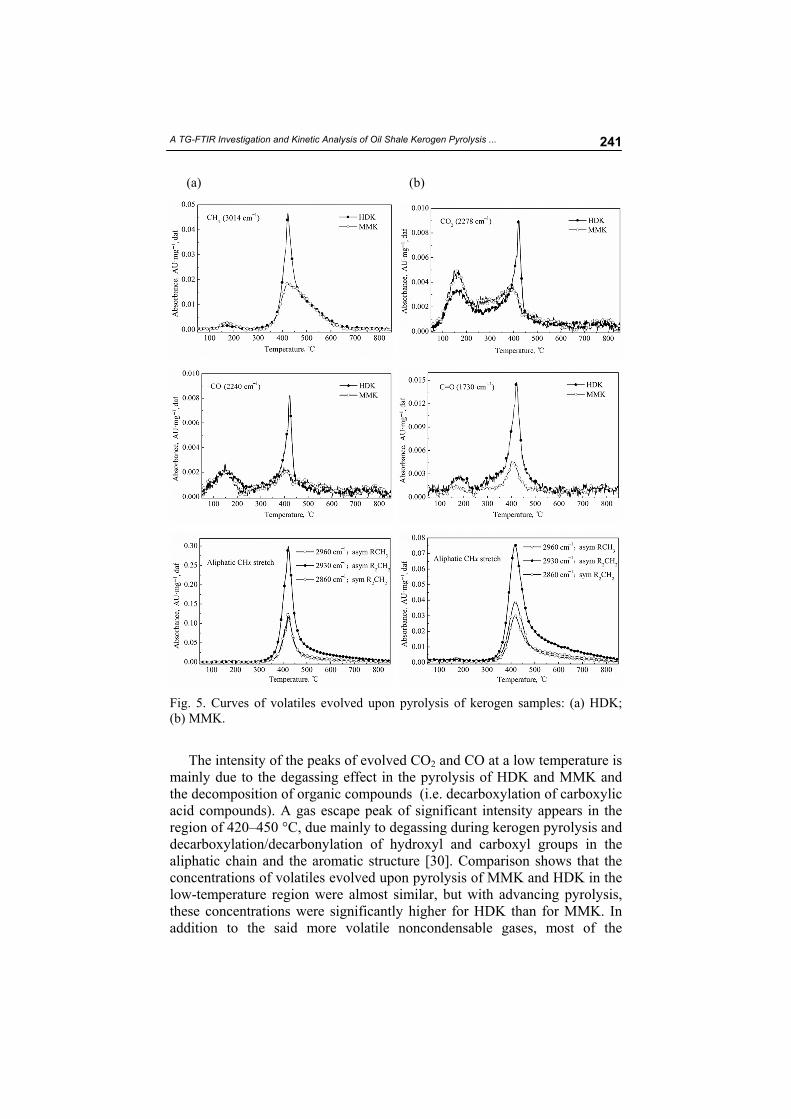
In addition, the curves for evolved micromolecular light noncondensable volatile compounds (CH4, CO2, CO) and macromolecular condensable volatiles containing CHx and C=O functional groups produced during kerogen pyrolysis could be obtained employing FTIR (Fig. 5). Figure 5 shows that in the whole range of the online red-light spectrum, the escape curve of CH4 upon pyrolysis of HDK and MMK remained rather weak, due primarily to the degassing/decarboxylation in the transitional phase of kerogen pyrolysis and
reorganization of the volatiles debris in its main stage. The escape curves of CO2 and CO demonstrate that the emission and mass loss of the gases during pyrolysis of kerogen samples were basically similar (Fig. 5).
A TG-FTIR Investigation and Kinetic Analysis of Oil Shale Kerogen Pyrolysis ...
241
(a) (b)
Fig. 5. Curves of volatiles evolved upon pyrolysis of kerogen samples: (a) HDK; (b) MMK.
The intensity of the peaks of evolved CO2 and CO at a low temperature is mainly due to the degassing effect in the pyrolysis of HDK and MMK and the decomposition of organic compounds (i.e. decarboxylation of carboxylic acid compounds). A gas escape peak of significant intensity appears in the region of 420–450 °C, due mainly to degassing during kerogen pyrolysis and decarboxylation/decarbonylation of hydroxyl and carboxyl groups in the aliphatic chain and the aromatic structure [30]. Comparison shows that the concentrations of volatiles evolved upon pyrolysis of MMK and HDK in the low-temperature region were almost similar, but with advancing pyrolysis, these concentrations were significantly higher for HDK than for MMK. In addition to the said more volatile noncondensable gases, most of the
Mingshu Chi et al.
242
pyrolysis products were large-molecular condensable volatiles consisting of complex functional groups. In the 3000–2800 cm–1 region of the infrared absorption spectrum the characteristic peaks of symmetric and asymmetric CHx stretching vibrations and a Gaussian-type curve of evolved high-concentration volatiles can be found at 2960, 2920 and 2852 cm–1, respectively. This region’s peak groups belong to the methylene and methyl functional groups in the aromatic ring and aliphatic chains [31]. In the wavenumber region of 1900–1300 cm–1 the C=O stretching vibration peaks at 1730 cm–1 can be found. These peaks belong to the carbonyl, ether and carboxyl groups contained in the aromatic ring and aliphatic chains. The analysis reveals that the pyrolysis of aliphatic hydrocarbons and oxygen-containing compounds in kerogen occurs mainly in the temperature region of 350–520 °C and the kerogen pyrolysis products are alkanes, carboxylic acids, aldehydes, alcohols, ketones and other macromolecular tar substances.
3.4. Analysis of pyrolysis kinetics of kerogen samples
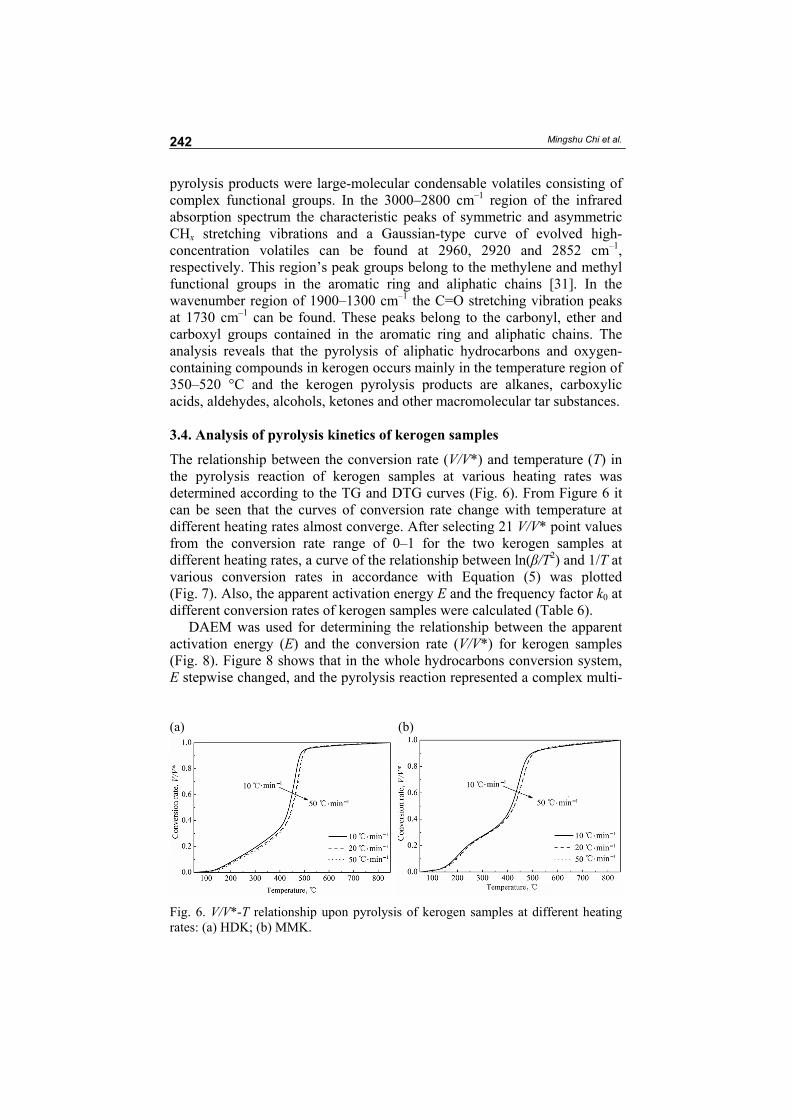
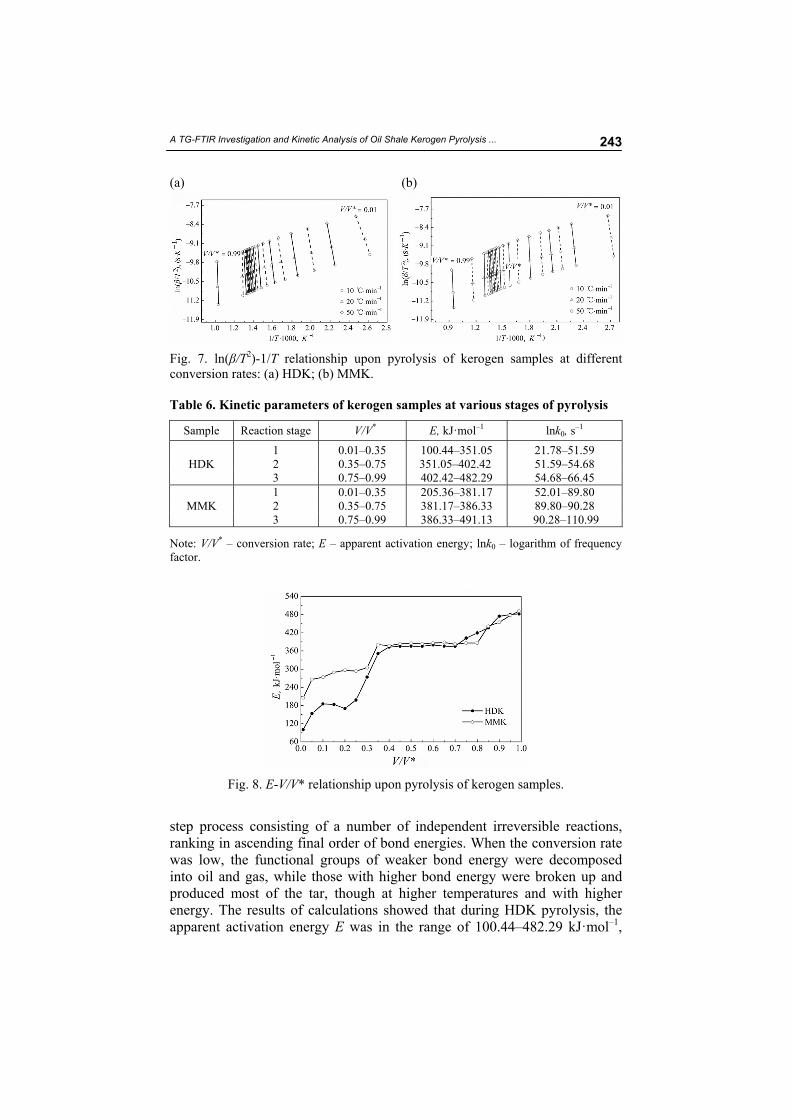
The relationship between the conversion rate (V/V*) and temperature (T) in the pyrolysis reaction of kerogen samples at various heating rates was determined according to the TG and DTG curves (Fig. 6). From Figure 6 it can be seen that the curves of conversion rate change with temperature at different heating rates almost converge. After selecting 21 V/V* point values from the conversion rate range of 0–1 for the two kerogen samples at different heating rates, a curve of the relationship between ln(β/T2) and 1/T at various conversion rates in accordance with Equation (5) was plotted (Fig. 7). Also, the apparent activation energy E and the frequency factor k0 at different conversion rates of kerogen samples were calculated (Table 6).
DAEM was used for determining the relationship between the apparent activation energy (E) and the conversion rate (V/V*) for kerogen samples (Fig. 8). Figure 8 shows that in the whole hydrocarbons conversion system, E stepwise changed, and the pyrolysis reaction represented a complex multi- (a) (b)
Fig. 6. V/V*-T relationship upon pyrolysis of kerogen samples at different heating rates: (a) HDK; (b) MMK.
A TG-FTIR Investigation and Kinetic Analysis of Oil Shale Kerogen Pyrolysis ...
243
(a) (b)
Fig. 7. ln(β/T2)-1/T relationship upon pyrolysis of kerogen samples at different conversion rates: (a) HDK; (b) MMK.
Table 6. Kinetic parameters of kerogen samples at various stages of pyrolysis
Note: V/V* – conversion rate; E – apparent activation energy; lnk0 – logarithm of frequency factor.
Fig. 8. E-V/V* relationship upon pyrolysis of kerogen samples.
step process consisting of a number of independent irreversible reactions, ranking in ascending final order of bond energies. When the conversion rate was low, the functional groups of weaker bond energy were decomposed into oil and gas, while those with higher bond energy were broken up and produced most of the tar, though at higher temperatures and with higher energy. The results of calculations showed that during HDK pyrolysis, the apparent activation energy E was in the range of 100.44–482.29 kJ·mol–1,
Mingshu Chi et al.
244
the average apparent activation energy E0 was 330.61 kJ·mol–1, and the logarithm of the frequency factor, lnk0, varied from 21.78 to 66.45 s–1. During MMK pyrolysis, E ranged from 205.36 to 491.13 kJ·mol–1, E0 was 363.61 kJ·mol–1, and lnk0 varied between 52.0 and 111.0 s–1. So, compared to MMK, E0 of HDK pyrolysis was lower, while the pyrolysis activation energies of both kerogen samples were sufficiently high. These results verify again that the kerogen pyrolysis process on the whole is a complex multistep chemical reaction.
When V/V* fell in the range < 0.35 to > 0.75, the change range of E was relatively wide, but with no obvious trend. When V/V* < 0.35, the E value was relatively low, mainly because the side chains with poor stability and the active functional groups in the kerogen macromolecules were broken in the low-temperature region of pyrolysis. When V/V* > 0.75, a higher activation energy was required for pyrolysis due to the dehydrogenation and condensa-tion of the aromatic residue of kerogen and aromatization of the aromatic ring. When V/V* fell in the range of (0.35–0.75), the E value levelled with the changing amplitude of V/V*, due chiefly to the constant breaking, parting and cycling of functional groups (i.e. long-chain alkanes, the carboxyl group, and the ether bond in kerogen macromolecules), thereby generating large quantities of macromolecular condensable volatile compounds and a small fraction of micromolecular light gases at this stage of pyrolysis. With progressing kerogen pyrolysis, the apparent activation energy increased. Taken together, a further discussion on the kerogen pyrolysis mechanism by using TG-FTIR will be required.
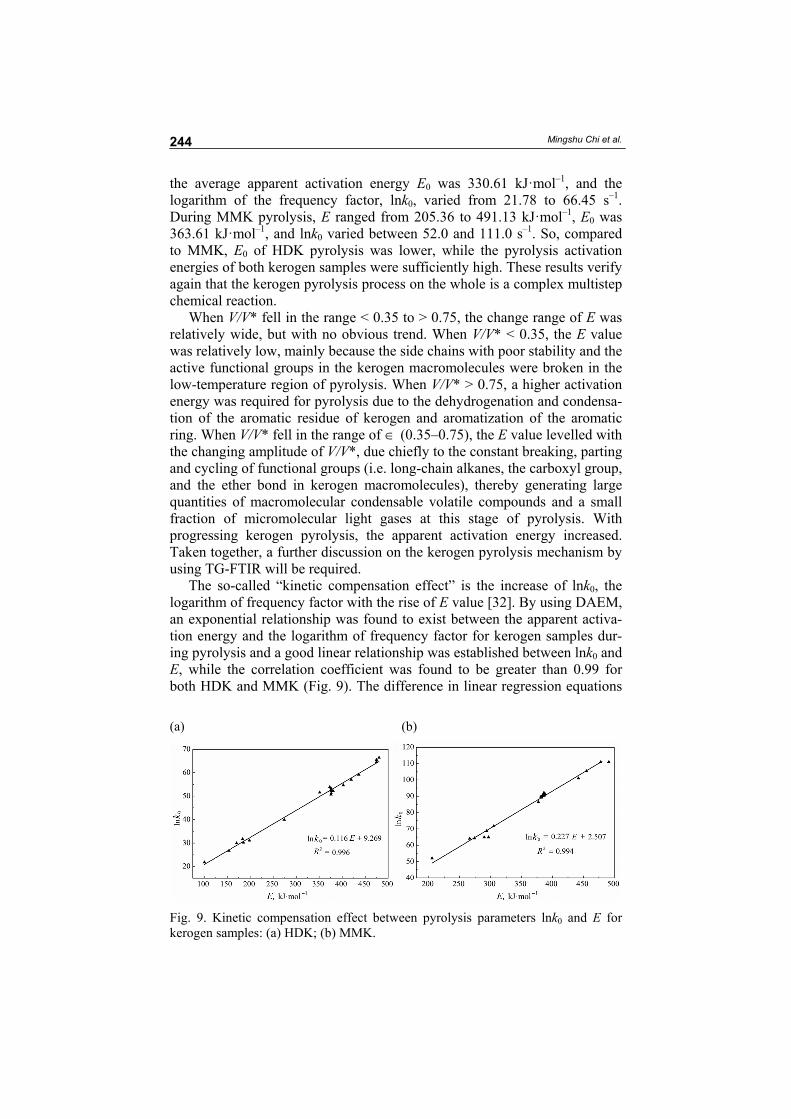
The so-called “kinetic compensation effect” is the increase of lnk0, the logarithm of frequency factor with the rise of E value [32]. By using DAEM, an exponential relationship was found to exist between the apparent activa-tion energy and the logarithm of frequency factor for kerogen samples dur-ing pyrolysis and a good linear relationship was established between lnk0 and E, while the correlation coefficient was found to be greater than 0.99 for both HDK and MMK (Fig. 9). The difference in linear regression equations
(a) (b)
Fig. 9. Kinetic compensation effect between pyrolysis parameters lnk0 and E for kerogen samples: (a) HDK; (b) MMK.
A TG-FTIR Investigation and Kinetic Analysis of Oil Shale Kerogen Pyrolysis ...
245
between kerogen samples also explained the difference in homogeneity and stability between their macromolecular structures. In the pyrolysis process of kerogen, the exponential relationship between the frequency factor k0 and the apparent activation energy E objectively reflects the kerogen chemical structure, and has a certain reference value from the viewpoint of application of the dynamics model to a further study of the chemical structure of oil shale.
3. Conclusions
1. The Fourier Transform Infrared Spectroscopy (FTIR) technique was employed to analyze the microstructure of kerogen of Chinese Huadian and Maoming oil shales. The results show that in the wavenumber region of 3000–2800 cm–1, there are sharp stretching vibration peaks of methylene (–CH2–) at 2920 and 2852 cm–1 for the two kerogen samples, respectively. The kerogen of oil shales consists of three parts – aliphatic chains, aromatic hydrocarbons and the oxygen-containing heteroatomic functional group, and it has a structure typical of aliphatic chain.
2. The pyrolysis of kerogen samples occurs mainly in the temperature region of 350–520 °C in which the conversion rate is the most intense, and the post-pyrolysis semicoke residue accounts for less than 32.5%. With the increase of the heating rate, the heat transfer lag effect and the chemical reaction time are shortened so that the initial pyrolysis tem-perature of the samples, the mass loss peak temperature and the final pyrolysis temperature are increased and, finally, the TG/DTG curves shift to the high-temperature region.
3. The kerogen pyrolysis products contain most of the macromolecular tar substances like alkanes, ketones and carboxylic acids, as well as a small portion of lightweight volatile gases. The aliphatic hydrocarbons are the main compounds released from kerogen pyrolysis. Throughout pyro-lysis, the lightweight noncondensable volatile compounds (CH4, CO, CO2) are present in relatively low concentrations, while the condensable volatile compounds containing macromolecules (CHx, C=O group) are released in higher concentrations and show the Gaussian distribution.
4. The pyrolysis kinetics analysis of the two kerogen samples reveals that the average apparent activation energy is respectively 330.61 kJ·mol–1
and 363.61 kJ·mol–1, and the pyrolysis reactions mainly occur in the con-version rate range of [0.35– 0.75]. In the whole pyrolysis system, the apparent activation energy and the logarithm value of frequency factor show a good linear relationship. This relationship objectively reflects the kerogen chemical structure and is of reference significance from the viewpoint of application of the dynamics model to a further study of oil shale chemical structure.
Mingshu Chi et al.
246
Acknowledgements
This work was supported by the National Natural Science Foundation of China (51276034) and the Program for Changjiang Scholars and Innovative Research Team in University, China (IRT13052). REFERENCES
1. Qian, J. L., Yin, L., Wang, J. Q. Oil Shale – Petroleum Alternative. China Petrochemical Press, Beijing, 2008 (in Chinese).
2. Ru, X., Cheng, Z. Q., Song, L. H., Wang, H. Y., Li, J. F. Experimental and computational studies on the average molecular structure of Chinese Huadian oil shale kerogen. J. Mol. Struct., 2012, 1030(51), 10–18.
3. Marshall, C. P., Love, G. D., Snape, C. E., Hill, A. C., Allwood, A. C., Walter, M. R., Van Kranendonk, M. J., Bowden, S. A., Sylva, S. P., Summons, R. E. Structural characterization of kerogen in 3.4 Ga Archaean cherts from the Pilbara Craton, Western Australia. Precambrian Res., 2007, 155(1–2), 1–23.
4. Coats, A. W., Redfern, J. P. Kinetic parameters from thermogravimetric data. Nature, 1964, 201, 68–69.
5. Lin, T., Goos, E., Riedel, U. A sectional approach for biomass: Modelling the pyrolysis of cellulose. Fuel Process. Technol., 2013, 115, 246–253.
6. Starink, M. J. The determination of activation energy from linear heating rate experiments: a comparison of the accuracy of isoconversion methods. Thermo-chim. Acta, 2003, 404(1–2), 163–176.
7. Friedman, H. L. Kinetics of thermal degradation of char-forming plastics from thermogravimetry. Application to a phenolic plastic. J. Polym. Sci. Part C, 1964, 6(1), 183–195.
8. Wang, Q., Wang, H., Sun, B., Bai, J., Guan, X. Interactions between oil shale and its semi-coke during co-combustion. Fuel, 2009, 88(8), 1520–1529.
9. Vand, V. A theory of the irreversible electrical resistance changes of metallic films evaporated in vacuum. P. Phys. Soc., 1943, 55(3), 222–246.
10. Miura, K., Maki, T. A simple method for estimating f(E) and k0(E) in the distributed activation energy model. Energ. Fuel., 1998, 12(5), 864–869.
11. Güneş, M., Güneş, S. K. Distributed activation energy model parameters of some Turkish coals. Energ. Source. Part A, 2008, 30(16), 1460–1472.
12. Hillier, J. L., Fletcher, T. H. Pyrolysis kinetics of a Green River oil shale using a pressurized TGA. Energ. Fuel., 2011, 25(1), 232–239.
13. Meng, A., Zhou, H., Qin, L., Zhang, Y., Li, Q. Quantitative and kinetic TG-FTIR investigation on three kinds of biomass pyrolysis. J. Anal. Appl. Pyrol., 2013, 104, 28–37.
14. Bai, F., Sun, Y., Liu, Y., Li, Q., Guo, M. Thermal and kinetic characteristics of pyrolysis and combustion of three oil shales. Energ. Convers. Manage., 2015, 97, 374–381.
15. Liu, X. Q., Li, W., Li, B. Q. A new theoretical approach to the distributed activation energy model under isothermal conditions and its application. Journal of Fuel Chemistry & Technology, 2002, 30(3), 214–217(in Chinese).
A TG-FTIR Investigation and Kinetic Analysis of Oil Shale Kerogen Pyrolysis ...
247
16. Solomon, P. R., Carangelo, R. M. FT-i.r. analysis of coal: 2. Aliphatic and aromatic hydrogen concentration. Fuel, 1988, 67(7), 949–959.
17. Wang, Q., Xu, X. C., Chi, M. S., Zhang, H. X., Cui, D., Bai, J. R. FT-IR study on composition of oil shale kerogen and its pyrolysis oil generation cha-racteristics. Journal of Fuel Chemistry and Technology, 2015, 43(10), 1158–1166 (in Chinese).
18. Tong, J., Han, X., Wang, S., Jiang, X. Evaluation of structural characteristics of Huadian oil shale kerogen using direct techniques (solid-state 13C NMR, XPS, FT-IR, and XRD). Energ. Fuel., 2011, 25(9), 4006–4013.
19. Miknis, F. P., Lindner, A. W., Gannon, A. J., Davis, M. F., Maciel, G. E. Solid state 13C NMR studies of selected oil shales from Queensland, Australia. Org. Geochem., 1984, 7(3–4), 239–248.
20. Hashimoto, K., Miura, K., Watanabe, T. Kinetics of thermal regeneration reaction of activated carbons used in waste water treatment. AICHE J., 1982, 28(5), 737–746.
21. Williams, P. T., Ahmad, N. Investigation of oil-shale pyrolysis processing con-ditions using thermogravimetric analysis. Appl. Energ., 2000, 66(2), 113–133.
22. Miura, K. A new and simple method to estimate f(E) and k0(E) in the distributed activation energy model from three sets of experimental data.Energ. Fuel., 1995, 9(2), 302–307.
23. Chen, L. G., Tun, H. C., Cen, G. F. Quantitative research of evolved gas rate by TGA-FTIR. Journal of Zhejiang University (Engineering Science), 2009, 43(7), 1332–1336 (in Chinese).
24. Wang, Y., Alimjan, A. Comprehensive Analysis of Spectrum Guide. Chemical Industry Press, Beijing, 2008 (in Chinese).
25. Fu, J. M., Qin, K. Z. Kerogen Geochemistry. Guangdong Science and Techno-logy Press, Guangzhou, 1995 (in Chinese).
26. Guan, X. H., Liu, Y., Wang, D., Wang, Q., Chi, M. S., Liu, S., Liu, C. G. Three-dimensional structure of a Huadian oil shale kerogen model: An experimental and theoretical study. Energ. Fuel., 2015, 29(7), 4122–4136.
27. Yan, J. W, Jiang, X. M., Han, X. X., Liu, J. G. A TG-FTIR investigation to the catalytic effect of mineral matrix in oil shale on the pyrolysis and combustion of kerogen. Fuel, 2013, 104, 307–317.
28. Wang, H., Jiang, X. M., Yuan, D. Q., Wan, P. Pyrolysis of coal water slurry volatile matter by using FG-DVC model. Journal of Chemical Industry & Engineering, 2006, 57(10), 2428–2432 (in Chinese).
29. Wang, Q., Yan, Y. H., Jia, C. X., Zhu, Y. C. FTIR analysis and pyrolysis cha-racteristics of oil shale from Gansu province. Chemical Industry & Engineering Progress, 2014, 33(7), 1730–1734 (in Chinese).
30. Scaccia, S. TG–FTIR and kinetics of devolatilization of Sulcis coal. J. Anal. Appl. Pyrol., 2013, 104, 95–102.
31. Wang, S. H., Griffiths, P. R. Resolution enhancement of diffuse reflectance i.r. spectra of coals by Fourier self-deconvolution: 1. C-H stretching and bending modes. Fuel, 1985, 64(2), 229–236.
32. Starink, M. J. Activation energy determination for linear heating experiments: deviations due to neglecting the low temperature end of the temperature integral. J. Mater. Sci., 2007, 42(2), 483–489.


![arXiv:1608.00292v4 [math.GN] 12 Oct 2016 · 2016-10-13 · We show that the answer is no, ... i2!Ki.! K1 K2 K3 K0 K1 K2 K3 K0! K1 K2 K3 K0 K1 K2 K3 K0 Figure 2. K! K1 K2 K3 K0 K1](https://static.documents.pub/doc/80x56/5e779fd8cdc8f45d52235a34/arxiv160800292v4-mathgn-12-oct-2016-2016-10-13-we-show-that-the-answer-is.jpg)


