Sedimentology (1987) 34,943-956 A theoretical model for aeolian impact ripples ROBERT S. ANDERSON* Quaternary Research Center and Department of Geological Sciences University of Washington, Seattle, Washington 98195 U.S.A. ABSTRACT New insights into the grain-bed impact process arising from both numerical and physical experiments involving single grain impacts lead to a more complete conceptual model of the aeolian saltation process that in turn allows a simple model of aeolian impact ripples to be developed. The saltating population may be idealized as consisting of (1) long trajectory, high impact-energy, constant impact-angle ‘successive saltations’, and (2) short trajectory, low impact-energy ‘reptations’. It is argued that the spatial variations in mass flux due to the reptating population lead to the growth and translation of impact ripples. Using the sediment continuity equation, an expression for the spatial variation in the ejection rate of reptating grains from a sinusoidally perturbed bed, and a probabiiity distribution for the reptation lengths, a simple stability analysis demonstrates that the flat bed is unstable to small amplitude perturbations. A fastest-growing wavelength emerges that is roughly six times the mean reptation length, and is only weakly dependent upon the detailed shape of the probability distribution of reptation lengths, The results match well with the observed initial wavelengths in wind tunnel experiments. INTRODUCTION Aeolian ripples form some of the most regular and aesthetically pleasing patterns in nature, and figure importantly in the interpretation of aeolian sandstones (e.g. Hunter, 1977; Kocurek, 1981). Despite their ubiquity in present-day deserts and coastaI regions, as well as in the geological record, no general theory exists for the complex interactions of wind and sand responsible for the formation of this smallest class of aeolian bedforms. The study of aeolian ripples has been largely guided by Bagnold’s seminal work of the 1930’s (Bagnold, 1941), wherein he stressed the causal connection between ripple spacing and a ‘characteristic path length’ in saltation. Bagnold envisioned a rhythmic barrage of grains saltating from one ripple to another, creating alternating zones of high and low impact- intensity and, hence, of imposed motion of surface * Present address : Physics 301-38, California Institute of Technology, Pasadena, California 91 125, U.S.A. grains. He pointed to a close correspondence between his calculated saltation path lengths and observed ripple wavelengths. This correspondence, based upon very rough calculations of trajectories whose heights were forced to match the height of the observed ‘kink’ in the wind-velocity profile, has dominated the literature for four decades. The coupling between saltation impacts and surface grain-motion, and the relative importance of these two types of particle motion in ripple translation were discussed only qualitatively. Wilson (1972) and Ellwood, Evans & Wilson (1975) extended Bagnold’s model to treat poorly sorted or bimodal sands. Using an experimentally determined ‘rebound probability matrix’, they proposed that the entire range of observed ripple wavelengths corre- sponds to the range of mean saltation lengths of one size fraction off another. Again, no explicit model of saltation-induced motion of grains in the bed was proposed. Only the trajectories of the rebounding 943
Transcript
Sedimentology (1987) 34,943-956
A theoretical model for aeolian impact ripples
R O B E R T S . A N D E R S O N *
Quaternary Research Center and Department of Geological Sciences University of Washington, Seattle, Washington 98195 U .S .A .
ABSTRACT
New insights into the grain-bed impact process arising from both numerical and physical experiments involving single grain impacts lead to a more complete conceptual model of the aeolian saltation process that in turn allows a simple model of aeolian impact ripples to be developed. The saltating population may be idealized as consisting of (1) long trajectory, high impact-energy, constant impact-angle ‘successive saltations’, and (2) short trajectory, low impact-energy ‘reptations’. It is argued that the spatial variations in mass flux due to the reptating population lead to the growth and translation of impact ripples.
Using the sediment continuity equation, an expression for the spatial variation in the ejection rate of reptating grains from a sinusoidally perturbed bed, and a probabiiity distribution for the reptation lengths, a simple stability analysis demonstrates that the flat bed is unstable to small amplitude perturbations. A fastest-growing wavelength emerges that is roughly six times the mean reptation length, and is only weakly dependent upon the detailed shape of the probability distribution of reptation lengths, The results match well with the observed initial wavelengths in wind tunnel experiments.
INTRODUCTION
Aeolian ripples form some of the most regular and aesthetically pleasing patterns in nature, and figure importantly in the interpretation of aeolian sandstones (e.g. Hunter, 1977; Kocurek, 1981). Despite their ubiquity in present-day deserts and coastaI regions, as well as in the geological record, no general theory exists for the complex interactions of wind and sand responsible for the formation of this smallest class of aeolian bedforms.
The study of aeolian ripples has been largely guided by Bagnold’s seminal work of the 1930’s (Bagnold, 1941), wherein he stressed the causal connection between ripple spacing and a ‘characteristic path length’ in saltation. Bagnold envisioned a rhythmic barrage of grains saltating from one ripple to another, creating alternating zones of high and low impact- intensity and, hence, of imposed motion of surface
* Present address : Physics 301-38, California Institute of Technology, Pasadena, California 91 125, U.S.A.
grains. He pointed to a close correspondence between his calculated saltation path lengths and observed ripple wavelengths. This correspondence, based upon very rough calculations of trajectories whose heights were forced to match the height of the observed ‘kink’ in the wind-velocity profile, has dominated the literature for four decades. The coupling between saltation impacts and surface grain-motion, and the relative importance of these two types of particle motion in ripple translation were discussed only qualitatively.
Wilson (1972) and Ellwood, Evans & Wilson (1975) extended Bagnold’s model to treat poorly sorted or bimodal sands. Using an experimentally determined ‘rebound probability matrix’, they proposed that the entire range of observed ripple wavelengths corre- sponds to the range of mean saltation lengths of one size fraction off another. Again, no explicit model of saltation-induced motion of grains in the bed was proposed. Only the trajectories of the rebounding
943
944 R. S . Anderson
grains were calculated. No attention was given to the resulting motion of the surface grains.
Bagnold’s concept of the origin of aeolian ripple spacing has been challenged, most notably by Sharp (1963), and more recently by Walker (1981). Sharp argued that because ripples begin as small amplitude, short-wavelength forms, and grow to their ultimate steady-state dimensions, Bagnold’s concept is at least suspect. Sharp argued qualitatively, on geometrical grounds, that ripple wavelength should depend on ripple amplitude and on the angle at which saltating grains approach the bed, both of which are controlled by air velocity and particle size. Later experimental work of Seppala & LindC (1978) empirically quantifies Sharp’s initial observations of the evolution of ripple dimensions.
Walker’s (1981) careful experiments, and his exten- sive review of the aeolian ripple literature, pointed to serious difficulties in simply relating ripple wavelength to a ‘characteristic path length’, or saltation distance. A well-defined ‘kink’ in the wind-velocity profile during saltation, upon which Bagnold based his trajectory calculations, was not observed. A clear empirical relation was demonstrated between flow velocity at a given height above the bed, grain size, and ripple wavelength, height and index; however, in agreement with Sharp, Walker argued that no recourse need be made to a characteristic path length, a development that Warren (1983) believed to be one of the more important recent findings in arid geomor- phology.
Nonetheless, no general and analytically rigorous model has appeared that explicitly addresses the motion of the ‘surface grains’ that comprise aeolian ripples. Recent theoretical and experimental work on aeolian saltation (e.g. Rumpel, 1985; Mitha et al., 1986; Anderson & Hallett, 1986; Ungar & Haff, 1987; Willetts & Rice, 1986) provides the necessary frame- work for such a model. When combined with a well- established formalism for analysing the stability of fluvial granular beds (e.g. Kennedy, 1964; Engelund, 1970; Smith, 1970; Jain & Kennedy, 1974; Smith & McLean, 1977; Engelund & Fredsoe, 1982; Richards, 1984; McLean & Smith, 1986), the resulting simplified model of aeolian saltation yields a reasonable quanti- tative description of the initial growth of aeolian impact ripples. I present first a qualitative description of the aeolian saltation process, emphasizing recent experimental work on grain-bed impacts. The result- ing picture of the saltation process is then simplified by making several important assumptions, in order to make the stability analysis tractable.
A CONCEPTUAL MODEL OF AEOLIAN SALTATION
The view adopted here conforms in general with that of most previous studies in that the motion of grains comprising aeolian ripples is believed to result not directly from fluid forces imposed by the air, but rather from the impacts of saltating particles that are themselves accelerated by the wind. As air is a low- viscosity, low-density fluid, its ability to lift grains off the bed is quite poor. For the same reason it does little to reduce the velocities of high-density grains about to impact the bed. Although aeolian saltation must be initiated by aerodynamic forces, it is the subsequent impacts of saltating grains that appear to be respons- ible for most of the ejection of grains into the airstream during fully developed saltation (e.g. Rumpel, 1985 ; Willetts & Rice, 1986; Ungar & Haff, 1987).
As the result of any individual impact cannot be known exactly, owing to the local topography of the bed surface, and packing of grains, the description of the grain-bed interaction can be formulated only statistically. This is the essence of Ungar & Haffs (1987) ‘splash function’, that returns the number of ejected particles and the probability distribution of their ejection velocities for a given distribution of impact velocities. The identification of the character of this ‘splash function’ has been the focus of much recent experimental work (e.g. Mitha et al., 1986; Werner & Haff, 1986, 1987), the results of which provide the primary guidance for the assumptions and simplifications made in the theoretical work presented here.
In order to quantify the effectiveness of a single impact with a granular surface, and to scale properly their laboratory experiments on impact dynamics, Mitha and co-workers (1986) defined an ‘impact number’, Nke, to be the ratio of the kinetic energy of an impacting grain with the energy necessary to raise a similar grain out of its pocket in the bed against the force of gravity. Extending their treatment to allow for differences in diameter between the impacting and bed grains, D,,, and D, respectively, the impact number becomes
where V,, is the speed of the impacting grain and g is the acceleration due to gravity. Note the extreme sensitivity of the impact number to the ratio of the particle diameters. For typical sediment transport
Theoretical model for aeolian impact ripples 945
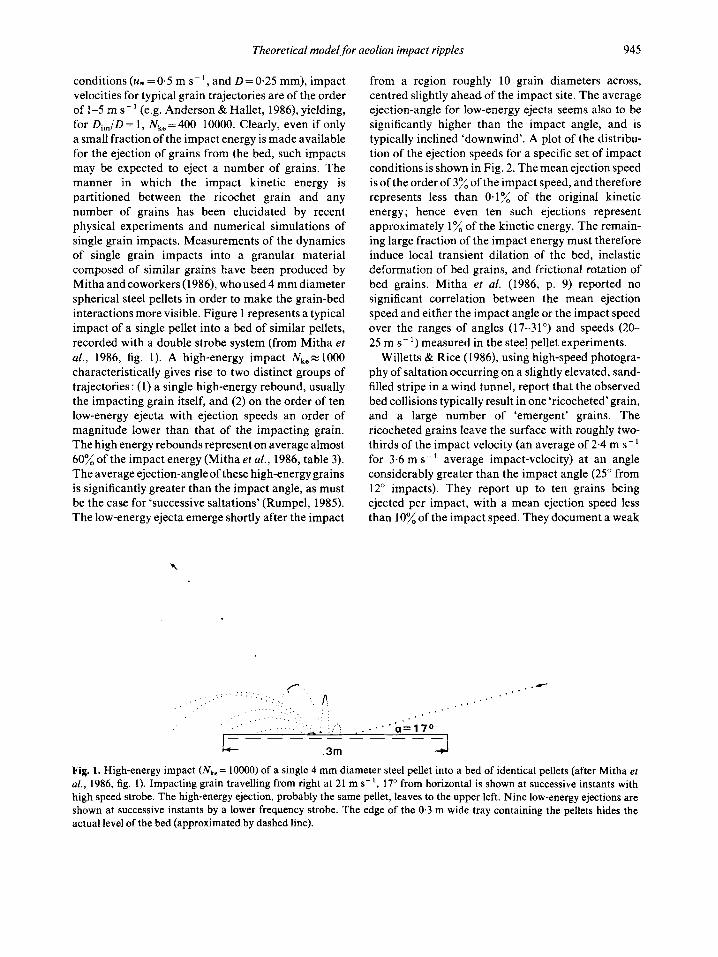
conditions (u, = 0.5 m s- ', and D = 0.25 mm), impact velocities for typical grain trajectories are of the order of 1-5 m s- ' (e.g. Anderson & Hallet, 1986), yielding, for Di,/D = 1, Nke = 400-10000. Clearly, even if only a small fraction of the impact energy is made available for the ejection of grains from the bed, such impacts may be expected to eject a number of grains. The manner in which the impact kinetic energy is partitioned between the ricochet grain and any number of grains has been elucidated by recent physical experiments and numerical simulations of single grain impacts. Measurements of the dynamics of single grain impacts into a granular material composed of similar grains have been produced by Mithaandcoworkers(l986), whoused4 mmdiameter spherical steel pellets in order to make the grain-bed interactions more visible. Figure 1 represents a typical impact of a single pellet into a bed of similar pellets, recorded with a double strobe system (from Mitha et al., 1986, fig. 1). A high-energy impact NkezlOOO characteristically gives rise to two distinct groups of trajectories : (1) a single high-energy rebound, usually the impacting grain itself, and (2) on the order of ten low-energy ejecta with ejection speeds an order of magnitude lower than that of the impacting grain. The high energy rebounds represent on average almost 60% of the impact energy (Mitha et al., 1986, table 3). The average ejection-angle of these high-energy grains is significantly greater than the impact angle, as must be the case for 'successive saltations' (Rumpel, 1985). The low-energy ejecta emerge shortly after the impact
from a region roughly 10 grain diameters across, centred slightly ahead of the impact site. The average ejection-angle for low-energy ejecta seems also to be significantly higher than the impact angle, and is typically inclined 'downwind'. A plot of the distribu- tion of the ejection speeds for a specific set of impact conditions is shown in Fig. 2. The mean ejection speed is of the order of 3% of the impact speed, and therefore represents less than 0.1% of the original kinetic energy; hence even ten such ejections represent approximately 1% of the kinetic energy. The remain- ing large fraction of the impact energy must therefore induce local transient dilation of the bed, inelastic deformation of bed grains, and frictional rotation of bed grains. Mitha et al. (1986, p. 9) reported no significant correlation between the mean ejection speed and either the impact angle or the impact speed over the ranges of angles (17-31") and speeds (20- 25 m s- ') measured in the steel pellet experiments.
Willetts & Rice (1986), using high-speed photogra- phy of saltation occurring on a slightly elevated, sand- filled stripe in a wind tunnel, report that the observed bed collisions typically result in one 'ricocheted' grain, and a large number of 'emergent' grains. The ricocheted grains leave the surface with roughly two- thirds of the impact velocity (an average of 2.4 m s- ' for 3.6 m s- ' average impact-velocity) at an angle considerably greater than the impact angle (25" from 12" impacts). They report up to ten grains being ejected per impact, with a mean ejection speed less than 10% of the impact speed. They document a weak
. . . . . . . . . . , . . . . .
.3m J Fig. 1. High-energy impact (A',,= 10000) of a single 4 mm diameter steel pellet into a bed of identical pellets (after Mitha er al., 1986, fig. 1). Impacting grain travelling from right at 21 m s-', 17" from horizontal is shown at successive instants with high speed strobe. The high-energy ejection, probably the same pellet, leaves to the upper left. Nine low-energy ejections are shown at successive instants by a lower frequency strobe. The edge of the 0.3 m wide tray containing the pellets hides the actual level of the bed (approximated by dashed line).
946 R. S. Anderson
1
0 .03 .06 .09 .12 .15
vei “im
Fig. 2. Distribution of low-energy ejection speeds ( V , ) resulting from approximately 100 identical impacts, normal- ized with the impact speed (V!,,,), for 17”, 25 m s - ’ impacts of 4 mm steel pellets with a bed of similar pellets (after Mitha et al., 1986, table 2). Note that the mean ejection speed is of the order of 3% of the impact speed.
dependence of the number of grains ejected on the angle of impact, the largest number of grains being ejected at impact angles near 12”.
Numerical simulation of single impacts (Werner & Haff, 1986, 1987) shed further light on the grain impact process. That a grain impact results in a single ricocheted grain and numerous emergent grains is again demonstrated in the calculations. Werner & Haff (1987, tables 3, 4) demonstrate that the kinetic energy represented by the low-energy ejecta increases monotonically with both increasing angle of incidence, and increasing impact energy, although the precise form of this dependence has by no means been fully established (B. T. Werner, private communication).
These impact experiments and earlier numerical work on aeolian saltation (esp. Anderson & Hallett, 1986; Ungar & Haff, 1987), lead to the following conceptual model of aeolian saltation, which forms the basis for the ripple analysis to follow. Saltation transport is initiated by fluid lift and drag forces, resulting in relatively short trajectories that impact the bed after having been accelerated by the wind to several times their initial velocities. The kinetic energy of each impact can be distributed among (1) rebound of the original grain from the bed, or ‘successive saltation’ (after the usage of Tsuchiya, 1969; Reizes,
1978; and Rumpel, 1985), (2) ejection of a number of other grains from the bed, which then comprise the small trajectory, or ‘reptating’ population (after Ungar & Haff, 1987; Mitha et al., 1986), and (3) dissipation by inelastic deformation and frictional rearrangement of bed grains.
Greeley & Iversen (1985, p. 293) define creep to be ‘slow, forward motion of grains that are too large to be lifted by the wind, whose motion is produced by impact from saltating grains.’ The term reptation as used in this paper includes creep in the above sense, but is used to emphasize that such a mode of transport is not restricted to large grains in the mixed grain-size case, but exists during transport of even well-sorted aeolian sands. The word, which derives from the latin for ‘to crawl’, was originally suggested for use in the description of aeolian sediment transport by P. K. Haff (private communication) in order to bring this mode of transport onto etymologically equal footing with the others: saltation, and suspension.
Because in all cases the wind causes grains to land with more energy than they left the bed with, and because higher energy impacting grains both retain a larger fraction of their energy upon impact, and are more efficient at imparting energy to low-energy ejecta, the initial aerodynamically generated set of trajectories leads easily to a chain reaction. Increasing numbers of grains are mobilized in saltation. The largest fraction of this saltating population will be the low-velocity or reptating grains.
The saltation process reaches a steady state only when there is no longer change in the number and velocity distribution of the ejected grains. It is presently thought that this is made possible primarily by the reduction of near-bed wind velocities due to the accelerationof saltating grains (negative feedback) (Ungar & Haff, 1987; Anderson, 1986b), reflecting the self-regulatory nature of the saltation process first envisioned by Bagnold (1941) and later discussed by Owen (1964).
The following biological analogy is fruitful in that it provides an appropriate and familiar terminology. First-generation trajectories usually originate by aero- dynamic forces. Upon impact many of these first- generation trajectories ‘die’: due to the inelasticity of the bed, their relatively low impact-velocity, and/or to an unfavourable local microtopography of the bed, they neither reproduce themselves, nor give ‘birth’ to other trajectories. Those few grains that do rebound tend to have higher ejection-velocities at each succes- sive saltation, i.e. they ‘age’. After many generations, a stable population is achieved that may best be
Theoretical model for aeolian impact ripples 947
characterized by the probability distribution of its hop lengths, hop heights, lift-off or impact velocities, any of these being analogous to the age distribution in a biological population. Anderson & Hallett (1986) show that plausible probability distributions of lift-off velocities are exponential, the lowest ejection-veloci- ties being the most probable. This sort of distribution, heavily skewed toward young trajectories, is compa- rable to the age structures in biological populations characterized by high birth-rates and low survival- rates (e.g. Krebs, 1978). By analogy, then, the following generalizations appear justified : (1) high impact-velocity trajectories have a low but finite probability of death, and a high ‘fertility’ at each impact, whereas low impact-velocity trajectories have a high probability of death, and essentially no fertility; and (2) it is required that a small number of low- energy grains make several subsequently more ener- getic rebounds in order to replace the small fraction of high-velocity grains that do die in any generation, thereby maintaining a stable probability distribution of trajectories. In this context, it is clear that Ungar & Haff’s splash function is closely analogous to the transition matrix, or life table used in the life sciences to calculate the evolution of the age structure within a biological population (e.g. Keyfitz, 1970; Krebs, 1978, ch. 4-5; Vandermeer, 1981, ch. 2). To complete the analogy, the momentum of the wind acts as the ‘limiting resource’ that ultimately controls the size of the steady-state saltating population.
SIMPLIFICATIONS AND ASSUMPTIONS
Clearly, an analysis of the coupling of each saltation trajectory with the motion of other grains in the bed would require a cumbersome and probably numerical treatment of the problem. The philosophy adopted here is rather to simplify the process in order to maintain analytical tractability, and to make the results more transparent to interpretation. In the aeolian ripple analysis to follow, the broad distribution of saltation trajectories is idealized as being comprised of two end-members : high-energy successive salta- tions, and low-energy reptations. In essence this assumes that the successive saltation population has zeroprobabilityofdeath (it reproducesitselfperfectly), whereas the reptations have exactly unit probability of death upon impact.
Other salient featuresof the aeolian saltation process allow further simplification of the analysis. Earlier
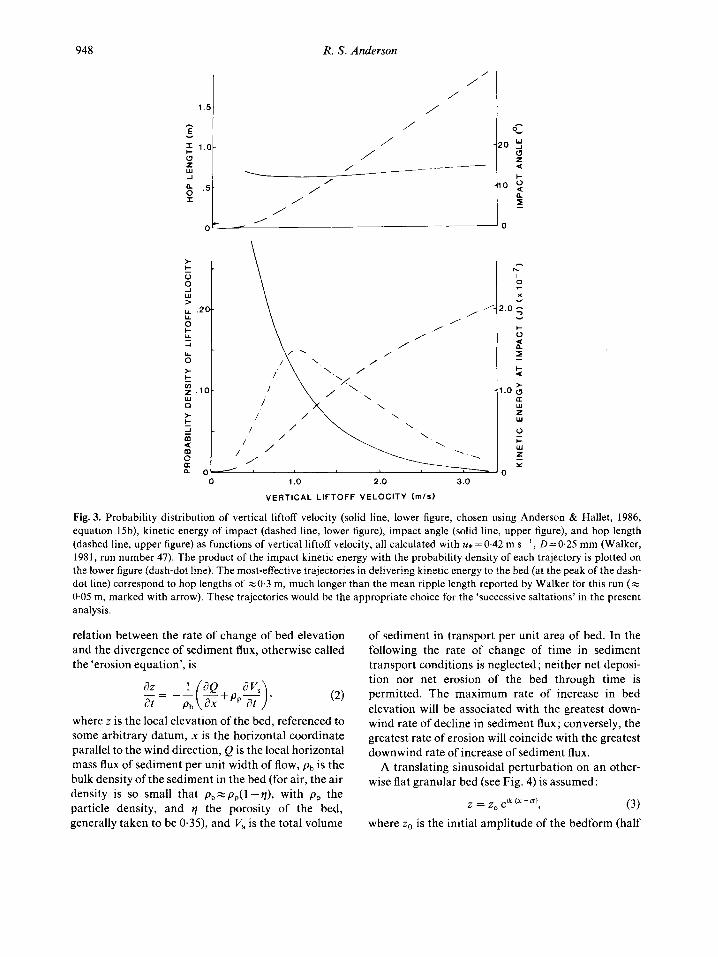
modelling of aeolian saltation (e.g. Anderson & Hallet, 1986) has shown that in any given wind-velocity field the saltation impact-velocity rises monotonically with increasing ejection-velocity. This implies that high impact-velocity trajectories, comprising a relatively small portion of the total population of transported grains, supply most of the energy available for ejecting surface grains. A set of saltation trajectory calculations for a single combination of shear velocity and grain size was performed to demonstrate these relationships. The product of the impact kinetic-energy with the probability density of each trajectory is presented in Fig. 3. There exists a distinct maximum in this product, representing the trajectories most effective in delivering energy to the bed, and hence in driving reptation. It is these trajectories that will be chosen to represent the ‘successive saltating’ population in the present analysis.
Figure 3 also demonstrates that these high-energy trajectories comprise a broad distribution of saltation lengths, which tend to be considerably longer (many decimetres) than the 0.05 m wavelengths characteris- tic of the co-existing, measured ripple field. In other words, the trajectories are long enough relative to the ripple wavelength to have lost the information about the position on the ripple they originated from by the time they land again. Moreover, the associated range of impact angles is very narrow, varying by only 1-2” over a broad range of trajectory lengths. These considerations amply justify the additional simplify- ing assumptions that (1) the spatial distribution of saltation impacts on a horizontal surface should be uniform, and (2) all long trajectories descend at an identical angle.
The low numbers of grains travelling in high-energy trajectories, and the low probability that they be incorporated into the rippled bed, allows us to ignore their direct contribution to ripple transport. Rather, their role in ripple formation and translation is here idealized as merely an energy supply for initiating and maintaining reptation. Because the angle of descent of these high-energy trajectories is so uniform, the spatial variations in energy available for initiating reptation are imposed solely by the local surface- topography; the steeper the upwind inclination of the surface, the greater the number of impacts per unit area of bed.
RIPPLE MODEL
Consider a two-dimensional flow of air over a granular bed. From continuity of material in the bed, the
948
1 . 5 ~
R. S . Anderson
- I E / /
- /
1.0- 0 z W A \
/ / g . 5 - /
/ I /
L / I
0-
c -20 y
-10 2
0 z 4 I-
a z 0
/ /
/ /
> 0
W 5
U U
0 t- Y 2 Y 0 > t cn Z ’ W 0 >
t
2
t i m 4 m 0 a a
/ \ \ \
/ ’ \ . / . -
- Ic I 0
X r
Y
2.0 ;
L 2 2
1.0 &
Y
t- 0
U W z w
0
f I- W
Y 0
1 .o 2.0 3.0
VERTICAL LIFTOFF VELOCITY ( I I I l S )
Fig. 3. Probability distribution of vertical liftoff velocity (solid line, lower figure, chosen using Anderson & Hallet, 1986, equation 15b), kinetic energy of impact (dashed line, lower figure), impact angle (solid line, upper figure), and hop length (dashed line, upper figure) as functions of vertical liftoff velocity, all calculated with u* =0.42 m s-’ , 0=0.25 mm (Walker, 1981, run number 47). The product of the impact kinetic energy with the probability density of each trajectory is plotted on the lower figure (dash-dot line). The most-effective trajectories in delivering kinetic energy to the bed (at the peak of the dash- dot line) correspond to hop lengths of ~ 0 . 3 m, much longer than the mean ripple length reported by Walker for this run (= 0.05 rn, marked with arrow). These trajectories would be the appropriate choice for the ‘successive saltations’ in the present analysis
relation between the rate of change of bed elevation and the divergence of sediment flux, otherwise called the ‘erosion equation’, is
where z is the local elevation of the bed, referenced to some arbitrary datum, x is the horizontal coordinate parallel to the wind direction, Q is the local horizontal mass flux of sediment per unit width of flow, P b is the bulk density of the sediment in the bed (for air, the air density is so small that pb%pp(l-q), with pp the particle density, and q the porosity of the bed, generally taken to be 0.35), and V, is the total volume
of sediment in transport per unit area of bed. In the following the rate of change of time in sediment transport conditions is neglected ; neither net deposi- tion nor net erosion of the bed through time is permitted. The maximum rate of increase in bed elevation will be associated with the greatest down- wind rate of decline in sediment flux; conversely, the greatest rate of erosion will coincide with the greatest downwind rate of increase of sediment flux.
A translating sinusoidal perturbation on an other- wise flat granular bed (see Fig. 4) is assumed:
0 (3) z = z eik(x-n)
where zo is the initial amplitude of the bedform (half
Theoretical model for aeolian impact ripples 949
Fig. 4. Schematic bed topography with initial amplitude, zo, and descending portions of the impacting successive saltation trajectories. The angle a between the descending saltations and the horizontal is taken as positive. The angle 0 between the local bed slope and the horizontal is positive on the stoss sides of bed perturbations, and negative in the lee.
the height from the trough to the crest of the form). Taking the phase speed, c, to be complex, c= c, + ic,, yields the following equation for the bed elevation, with the growth or decay in amplitude now made explicit:
(4) I = ekcr W - c r t ) 0 ' e
Note that c, > 0 now indicates forward translation of the bedform, while the imaginary part of the phase speed determines the growth or decay of the ampli- tude : c, > 0 implies growth; c, < 0 implies decay; only if c, = 0 is the form unchanging under translation. The results of the stability analysis will be in the form of expressions for the rate of growth and translation speed as functions of wavenumber.
IMPACT-DRIVEN SEDIMENT TRANSPORT RELATION
An expression is now sought for the local mass transport of sediment per unit width of flow, and its dependence on position on the waveform. In this first, simplest case, it is assumed that each grain ejected from the bed by energetic impacts reptates a length, a, with unit probability. Although this 'uniform reptation' assumption will be relaxed in a subsequent section, the results of this analysis are more transparent to interpretation, and provide a convenient end- member for the more general class of analyses to be developed later.
Under these conditions, the mass flux per unit width
X x'-a X '
Fig. 5. Two-dimensional schematic diagram of reptation flux. High-energy saltating grains are not shown, but give rise to these low-energy ejections, here assumed to follow identical reptation trajectories. Horizontal flux across a plane perpendicular to the wind direction is seen to be dependent upon the ejection rate per unit area of bed, and the hop length, a. In this simple case, no contribution to the flux occurs from portions of the bed beyond a distance a upwind of the plane perpendicular to the flow at x'. The reptation length in turn reflects the ejection speed and the wind velocity profile.
950 R. S. Anderson
across the plane perpendicular to the flow is (see Fig. 5 ) :
Q(x) = Q, + J:-ampNe,(x)& (5 )
where mp is the particle mass, Ne, is the number of particles ejected per unit area of bed per unit time (the ‘ejection rate’), evaluated at a specific position on the bed, and Qs is the saltation flux due to the long- trajectory grains, taken to be independent of position. The ejection rate is taken to be directly proportional to the impact rate of high-energy grains. Saltations are assumed to produce an average of n, low-energy trajectories. At the low topographic slopes implicit in the infinitesimal ripple initiation case being consid- ered in the present analysis, this assumption poses no problem. The flux relation then becomes
Q W = Qs+mpn, j;-jV,&)d.. (6)
where N,, is the number of successively saltating particles impacting the bed per unit area per unit time, or the ‘impact rate’. As stated previously, the impact rate is a function of position because the bedslope determines the effective cross section of the descending barrage of long-trajectory particles that
will be intercepted. Simple geometric considerations lead to the relation
(7)
where I9 is the angle the bed makes with the horizontal (defined such that 8>0 where the bed dips upwind) and a is the incident angle of the impacting grains (defined such that a> 0 when the descent is inclined downwind, in the + x direction-see Fig. 4) , and (N,m)o is the impact rate on a flat (6=0) surface. For small bed slopes, cos I9 e 1, thus leaving
N,,(x)= ( N ) l+cota- l m 0 [ ::I
The expression in brackets is identical to Bagnold’s (1941, p. 147-148) ‘surface component of impact intensity’. Equatioils (7) and (8) are plotted in Fig. 6 for a typical wind ripple geometry, and for different impact angles. As expected, the impact intensity peaks where the perturbed bed slopes most steeply upwind. For the lower impact-angles illustrated, the impact rate vanishes over a significant portion of the lee slope, representing Sharp’s (1963) notion of total ‘shadowing’ of the bed. Although the present analysis therefore breaks down once the lee ripple-slope
’ O I 0 1 I I I I I 1
X (m) .075 .1 5 , 2 2 5
Fig. 6. Impact intensity, N,,, normalized with the impact intensity over a flat bed, (N,&, shown as a function of position on a typical eolian ripple of 5 mm amplitude, 0.15 m wavelength. Cases for four impact angles, a, (labelled) are shown. Equation (7) is represented by the solid curves, equation (8) by the dashed. Note the slight error introduced by the small angle approximation.
Theoretical model for aeolian impact ripples 95 1
exceeds the saltation impact-angle, this poses no problem for the initial generation of ripples from a flat bed.
Combining this relation for the impact rate (equa- tion 8) with the previous expression for mass flux (equation 6) allows the sediment flux relation to be written as the sum of two mean rates, one associated with saltation, the other with reptation, and a spatially varying quantity:
Q(x) = Q, + Mpnl (N,,)oa
Performing the integration, the final expression for mass flux becomes
Q(x) = Qo+se,cotcc[z(x)--z(x--a)l, (10)
where Qo = Q, + qeJa, and qs = mpnl (N,m)o is the ‘mass ejection rate’ from a flat bed. Qo is the total mass flux expected over a flat bed, and includes that due to saltation, Qs, and that due to repation, Qr=qe,a. The second term in equation (lo), which corresponds to the integral term in equation (9), represents the spatially varying flux involved in the growth and translation of ripples.
It is worth noting that (N,& is, in general, a small fraction of the total number of grains encountering a unit area of bed per unit time (called N in previous work-Anderson & Hallet, 1986). In accord with the simplification of the coupling between saltation and reptation, i.e. that all saltations effectively reproduce themselves, and that all reptations land with insuffi- cient energy either to rebound or to eject other grains, theimpactratemay bewritten: (N,,),=N[l/(l +TI,)]. An expression similar to that for the flat-bed reptation flux may also be developed for the saltation flux :
where a, is the mean saltation trajectory length.
DISPERSION RELATION FOR THE UNIFORM REPTATION
CASE
Given the above physical assumptions and their mathematical description, expressions are now sought for the growth rate and the translation speeds of bed perturbations of various wavelengths. These arise straight-forwardly from inserting the expressions for sediment flux (equation 10) and bed elevation (equa-
tion 3) into the sediment continuity equation (2). The complex phase speed, c, becomes :
c = p[ 1 - exp( - ika)], (12)
where B=q, cota/pb has the dimensions of a velocity. The real and imaginary parts of the phase speed correspond to the translation speed (or ‘celerity’), c,, and the amplification rate, kc,, respectively, and may be written in dimensionless form as
cr - = 1 -cos(ka) B
kc, c, kB B _ - - - = sin(ka).
These are plotted in Fig. 7a and b as dashed and solid lines, respecjively. Two scales are shown to illustrate both the details of the first (longest wavelength) maximum, and the apparent short-wavelength har- monics. A maximum in the growth rate corresponds to the combination of ripple wavelength, 1 (= 2n/k), and reptation length, a, that produces, simultaneously, the strongest rate of decline of mass flux - hence maximum deposition - over the crest of the ripple, and the strongest rate of increase in mass flux - hence maximum erosion4ver the trough. The first peak in the growth rate, at ka=lr/2, corresponds to ripples with wavelengths equivalent to four reptation lengths. That this should be the case is evident from inspection of Fig. 6, depicting the pattern of impact rate (and hence ejection rate) over a sinusoidal bed. The greatest rate of decrease of impact rate [i.e. negative curvature in Nim(x)], corresponds with the middle of the stoss slope; conversely, the greatest rate of increase in impact rate (positive curvature) corresponds with the middle of the lee slope. A uniform reptation length of a =1/4 effectively advances this pattern in the diver- gence of the ejection rate forward as a pattern in the divergence of mass flux that then yields maximum deposition rate at the crest, and maximum erosion in the trough, as required for a peak in the growth rate.
However, similarly rapid growth is found associated with every successive ka multiple of 2n, corresponding to ripples with wavelengths equivalent to 2, 1, 0.5, etc., reptation lengths. As illustrated in Fig. 8, these represent bedforms growing in response to reptations that originated on bedforms one, two and more wavelengths upwind. It will be demonstrated in the next section that this unrealistic behaviour arises from the strict assumption that all reptations are identical in length. Any breadth in the distribution of reptation lengths, which arises naturally from the stochastic
952 R. S . Anderson
I I I -1.01 0 I 2 3 4
ka k a I
A 8 4 2 A 4 2 I 0.5 0.33 1 1 1 I 1 I I
X /a (a) X / a (bf
Fig. 7. (a) Dimensionless translation speed (equation 13a, dashed line), and growth rate (equation 13b, solid line) for the uniform reptation length case, plotted against the product of the wave number k = 2 n / l with the reptation length, a. The peak in growth rate-the fastest growing wave-at ka = 4 2 corresponds to wavelengths four times greater than the reptation length. (b) Same as (a) except for the expanded ka scale, showing many maxima in the growth rate, corresponding to shorter and shorter wavelengths. See text for explanation.
nature of the grain-bed impact process, should be expected to suppress the growth of these shorter wavelength harmonics : reptations originating at the same point will land with more and more equal probability on the lee and stoss slopes of these higher frequency forms, thereby reducing the magnitude of the associated differences in mass flux between crest and trough of the form.
Ripple translation velocities predicted from the uniform reptation analysis show a monotonic, almost
Fig. 8. Schematic diagram illustrating the origin of the higher frequency peaks in the growth rate arising from the uniform reptation length analysis.
linear increase with increase in wavenumber through- out the region of the first maximum (see Fig. 7a). The shorter wavelength forms travel faster than the longer forms, a consequence of there being less total mass in the smaller bedforms.
THE EFFECTS OF A DISTRIBUTION I N REPTATION LENGTH
In order to assess the effects of a realistic distribution in the reptation lengths resulting from grain impacts, the foregoing analysis is extended to include as a variable the probability density of reptation lengths, p(a)da. We see that the uniform reptation case then corresponds to a delta function for this probability density, orp(a)da = 6(a - ii)da, where 6 is the kronecker delta, and ii refers hereafter to the mean reptation length. The simple picture of reptation flux at any position, x, illustrated in Fig. 5 breaks down; trajectories originating at all positions upwind that cross the plane of concern must be counted in the calculation of local sediment flux. The flux at a position x must therefore involve an integral over all possible reptation lengths; equation (10) is altered to become :
Q(x) = Q, + qe, cot a [z(x) - Z(X - a>lp(a)da. (1 4)
Theoretical model for aeolian impact ripples 953
An analysis parallel to that presented above then yields for the phase speed
c = p( 1 -j:p(a)e-""ilo = B(1 -a), (15)
where the overbar denotes the Fourier transform of the expression. Recovery of the uniform reptation result (equation 12) is straightforward when the probability density is taken to be a delta function.
Two, more realistic cases are addressed, correspond- ing to exponential and gamma function probability densities, both of which may be expressed as
(16) p(a) = Aabexp( - da) a > 0 p(a) = 0 a<O,
with b,d real, > O (Papoulis, 1965, p. 103). The most probable reptation lengths correspond to a= b/d, and the mean length fs = (b+ l ) /d . Setting b=O results in an exponential distribution, with A = d = ( l / d ) ; b= 1 yields a gamma function with a broadly peaked maximum in the probability density, and d=(2/6) , A = d 2 . Performing the Fourier transforms for each case (Kaplan, 1981, p. 222), the dimensionless expres- sions for the real and imaginary components of the phase speed become, for the exponential distribution :
1
c, /3 - 1 +(ka)2
B - 1 +(ka)2 ci k a
0.8 -
0 0.5 I .o 1.5 2 .o
and for the gamma distribution : c, (ka)4 + 1 2(ku32 _ - /I - 14 + (kc)']'
The results are plotted in Fig. 9a and b. The most striking alteration of the pattern of ripple
growth resulting from the introduction of more realistic probability distributions of reptation lengths is the damping of the growth of the shorter wavelength harmonics, seen by contrasting Figs 9b and 7b. In the more realistic cases, there exists a single fastest- growing wavenumber corresponding to wavelengths on the order of six times the mean reptation length for both the exponential and gamma distributions. Al- though the position of the peak in growth rate appears to be relatively insensitive to the choice of probability distribution in reptation length, the ripple wavelength selectivity appears to be somewhat stronger with the gamma distribution. As in the uniform reptation case, all waveforms travel downwind.
DISCUSSION
Inspection of Fig. 9b reveals that no special meaning need be attached to the case when the mean reptation length equals :he ripple wavelength (i.e. when l = E ) . Such wavelengths are neither the fastest growing
k a I 1 I I I
A 4 2 I 0.5 0.33 X / i (b)
Fig. 9. (a) Dimensionless translation speed (dashed lines) and growth rate (solid lines) for exponential distribution of reptation lengths (case 11, equations 17), and gamma distribution of reptation lengths (case 111, equations 18), shown together with the results from the constant reptation length analysis (case I, equations 13). Note that the horizontal scale is now scaled by the mean reptation length, (1. (b) Same as (a) except for the expanded kd scale. Case I is not shown. In contrast with the patterns in Fig. 7b, there exists a single peak in the growth rate and translation speed, corresponding roughly to the first maximum in the uniform reptation-length analysis.
954 R. S . Anderson
forms (maximum c,), nor the steady-state forms (c, = 0). It should be noted that a mean trajectory length derived from averaging over all trajectories - both the numerous short reptations, and the rarer long salta- tions - may roughly correspond to the ripple wave- length. As both the mean saltation length and the associated mean reptation length should increase with increasing wind speed, the ripple wavelength should increase as well, as is observed (e.g. Walker, 1981; Seppalla & LindC, 1978). Only in this sense does Bagnold's equation of ripple wavelength to a charac- teristic path length have meaning. A rhythmic barrage of grains travelling trajectories equivalent to the ripple wavelength and imposing a parallel variation in surface creep is not a correct image of the process. Such short saltation trajectories land with insufficient energy to produce significant reptation transport (see Fig. 3). The physics is contained in the variation of reptation flux imposed by high impact-energy salta- tions with trajectory lengths many times a ripple wavelength. The wavelength of the fastest-growing ripple is set entirely by the mean reptation distance.
It remains to be shown that a fastest-growing wavelength of the order of six reptation lengths is physically reasonable. Seppalla & Linde (1978) report the wavelengths of initial ripples for three different wind velocities: 15,45 and 85 mm for shear velocities of 0.35, 0.51 and 0.65 m s-! , respectively. Assuming that the saltation trajectories most effective in driving reptation transport correspond to liftoff velocities of roughly 2-3 times the shear velocity (see Fig. 3); that saltation impact velocities are roughly 3-4 times the liftoff velocities (Anderson & Hallet, 1986, fig. 7); and that the mean liftoff velocity for reptations is of the order of 3-5% of the saltation impact velocity (see Fig. 2), the mean ejection velocity for reptations may be crudely bracketed between 0.2 and 0.6 times the shear velocity. Calculation of reptation lengths may be accomplished most simply by assuming ballistic trajectories, yielding :
where y is the ejection angle. Assuming the most favourable liftoff angle, 45", which is in rough accord with the available single impact data (e.g. Mitha et al., 1986), calculated mean reptation lengths yield predicted initial ripple wavelengths that both bracket the reported wavelengths and display the same increase in wavelength with shear velocity: using 1 = 6d, the calculated fastest growing wavelengths are 2.4-24 mm for u* =0.35 m s- ' , 5.0-56.0 mm for
u* =051 m s- ', and 8.0-91.0 mm for u* =0.65 m s- '. That the measured wavelengths are near the high end of the calculated bracket in each case is not surprising, as the horizontal drag imposed by the wind, although small for these small ejection velocities, will increase all trajectory lengths somewhat. It is encouraging that suchcrude calculations are in accord with the available measurements.
I conclude by reiterating the assumptions made in the present analysis, and by discussing the implied restrictions on the generality of the model. (1) Most importantly, the present analysis is strictly
applicable to infinitesimal perturbations of the bed, and to the initial growth rates and translation speeds of incipient ripples. Once the amplitudes become large enough to introduce other physical effects, a more complicated finite amplitude analysis is required. Coalescence of rippleforms due to the dispersion of ripple translation speeds should be expected. All analyses imply that the shortest wavelength forms should travel faster than longer waveforms. This leads to a coalescence of ripples, as the short forms cannot travel as fast in the low impact-intensity zones in the lee of the larger forms, and should thus be captured by them (P. K. Haff, private communication). The result should be the disappearance of the higher fre- quency forms through times, as is indeed reported from both wind tunnel (Seppala & Lindt, 1978) and natural experiments (Sharp, 1963). The reptation transport is a function of the impact rate only. The probability distribution of ejection velocities (which leads to a distribution in repta- tion lengths), and the average number of grains ejected per impact, n ! , are both assumed to be independent of the angle between the impact trajectory and the local surface [i.e. the sum (a+ O)]. For the small variations in this angle charac- teristic of initial small amplitude perturbations of the bed, this assumption is valid. The more general finite amplitude problem does, however, provide a strong motivation for determining more precisely the dependence of the granular splash on the impact angle. The granular bed is composed of identical grains. As many aeolian sands are well sorted, this should not impose undue constraint on the applicability of the model. Truly bimodal or poorly sorted sands, however, require a more complete analysis of the divergent rates of transport of the various grain sizes. As reported in numerous previous works (e.g. see review in Allen, 1982, p. 310-314),
Theoretical model for
sorting plays an important role in establishing the ultimate (finite amplitude) ripple spacing in these cases. ‘Grain jams’ of larger particles near the crests of ripples are both expected and observed; not only does the efficiency of impacts of the finer, successively saltating grain population drop as the cube of the bed particle diameter, but the effective size of the pocket from which the bed particle must exit increases with the size of the neighbour- ing grains, giving rise to the D - 4 dependence of the impact number in equation (1). There is no spread in the impact angle of high- energy trajectories. Although the impact angle is remarkably uniform over a wide range of liftoff velocities for a single grain size (see Fig. 3), amply justifying the assumptions made in the present paper, the angle does vary with grain size, further complicating the multiple grain-size problem. The role of fluid shear stresses in ejecting grains from the bed has been neglected entirely in the present analysis. First-order ‘inviscid’ solutions for flow over a sinusoidally perturbed bed display shear stress maxima over the crests and minima over the troughs (e.g. Kennedy, 1964). A more detailed fluid mechanical model of the flow field over a perturbed subaqueous bed (Smith, 1970) demonstrates that the shear stress maximum is shifted a small fraction of a wavelength upstream of the topographic crest when ‘real fluid’ effects such as viscosity and inertia are introduced. Relevant detailed flow experiments in air are rare. The results of wind tunnel experiments over a wooden sinusoidal bed (Motzfeld, 1937) display patterns very similar to the inviscid solution, with a basal shear stress maximum very close to the crest of the form, implying that the pattern of ejection rate due to fluid shear stresses should be roughly in phase with the topography. As these fluid stress variations should scale with the aspect ratio (height over wavelength) of the form, the importance of transport variations due to aerodyn- amic entrainment is minimized in the infinitesimal perturbation case addressed herein. It is expected that the role of impacts in causing variations in mass flux continues to dominate over aerodynamic entrainment even for typical finite amplitude ripples, whose aspect ratios are typically 1/20.
aeolian impact ripples 955
ripple field is characterized by a wide distribution of trajectories with lengths that span the co-existing ripple wavelength. Stability analysis using a simplified model of aeolian saltation that emphasizes the role of the grain-bed impact process shows that a flat bed is unstable to infinitesimal perturbations of the bed ; the analysis also yields the wavelength of the fastest- growing form. This wavelength is indeed scaled by a grain transport distance, as initially proposed by Bagnold (1941). The relevant length is not, however, the mean saltation distance (one interpretation of his ‘characteristic path length’), but is rather the mean reptation length. Nor is the relation a simple equiva- lence between transport distance and ripple length. The relevant physics is not a rhythmic barrage of trajectories of length equal to the ripple spacing; it is a pattern of divergence and convergence of mass flux dominated by reptating grains with a probability distribution of reptation lengths. The pattern of ejection intensity for the reptating population is set by a pattern in impact intensity that in turn reflects both the local bed slope, and the angle of impact of the high energy saltations effectively driving the reptation. The resulting fastest-growing ripple wavelength should be roughly six times the mean reptation distance; this corresponds well with the observed wavelengths of initial disturbances in wind tunnel experiments.
ACKNOWLEDGMENTS
Grateful acknowledgment is made to the donors to the Petroleum Research Fund, administered by the American Chemical Society, for the support of this research. Significant revision of the manuscript at Caltech was accomplished through the support of the Army Research Office, contract number DAAL03- 86-K-0132. Much of the generation, and subsequent interpretation of the mathematical results was aided by frequent discussions with E. Waddington. Very helpful suggestions were provided by J . Bridge and an anonymous reviewer. I also wish to express my appreciation for the consistent support and friendship of my adviser, B. Hallet, throughout my PhD research on aeolian sediment transport processes, of which this paper is a part.
REFERENCES CONCLUSIONS
ALLEN, J.R.L. (1982) Sedimentary Srructures: Their Character The complex process of aeolian saltation that ulti- andphvsicn[&sis. vol, 1, ~ l ~ ~ ~ i ~ ~ . Amsterdam. mately gives rise to the observed regularly spaced ANDERSON, R.S. (1986) Eolian sediment transport as a
956 R . S . Anderson
(Manuscript received 16 July 1986; revision received I1 February 1987)
stochastic process: Effects of a fluctuating wind on particle trajectories. J . Geol., 95.
ANDERSON, R.S. (1986b) Sediment transport by wind: Salta- tion, suspension, erosion and ripples [Chapter 3 . Modification of wind velocity profiles by sulfating grains.] PhD disserta- tion, University of Washington, Seattle, Washington, 174 PP.
ANDERSON, R.S. & HALLET, B. (1986) Sediment transport by wind: Toward a general model. Bull. geol. SOC. Am., 97,
BAGNOLD, R.A. (1941) The Physics of Blown Sand and Desert Dunes. Methuen &Company, London, 265 pp.
ENGELUND, F. (1970) Instability of erodible beds. J . Fluid Mech., 42,225-244.
ENGELUND, F. & FREDSOE, J . (1982) Sediment ripples and dunes. Ann. Rev. Fluid Mech., 14, 13-37.
FREDSOE, J . (1982) Shape and dimensions of stationary dunes in rivers. J . Hydraul. Div., Am. SOC. civ. Engrs, 108, 932- 947.
GREELEY, R. & IVERSEN, J.D. (1985) Wind as a Geological Process. Cambridge University Press, Cambridge.
HUNTER, R.E. (1977) Basic types of stratification in small eolian dunes. Sedimentology, 24, 361-387.
JAIN, S.C. &KENNEDY, J.F. (1974) The spectral evolution of sedimentary bed forms. J . Fluid Mech., 63, 301-314.
JENSEN, J.L. & SORENSON, M. (1986) Estimation of some eolian saltation transport parameters: A re-analysis of Williams’ data. Sedimentology, 33,547-555.
KAPLAN, W. (1981) Advanced Mathematics for Engineers. Addison- Wesley, Reading.
KENNEDY, J.F. (1964) The formation of sediment ripples in closed rectangular conduits and in the desert. J . geophys. Res.,69, 1517-1524.
KEYFITZ, N. (1970) Finding probabilities from random rates, or how to make a life table. Amer. Stat., 24, 28-33.
KOCUREK, G . (1981) Significance of interdune deposits and bounding surfaces in aeolian dune sands. Sedimentology,
KREBS, C.J. (1978) Ecology: The Experimental Analysis of Distributions and Abundances, 2nd edn. Harper & Row, New York.
MCLEAN, S.R. & SMITH, J.D. (1986) A model for flow over two-dimensional bed forms. J . Hydraul. Eng., 112, 300- 317.
MITHA, S. , TRAN, M.Q., WERNER, B.T. & HAFF, P.K. (1986) The grain-bed impact process in aeolian saltation. Acta Mechanica, 63,267-278.
MOTZFELD, H. (1937) Die turbulente Stromung an welligen Wanden. Z . ang. math. mech., 17, 193-212.
NALPANIS, P. (1985) Saltating and suspended particles over
523-535.
28,753-780.
flat and sloping surfaces. 11. Experiments and numerical simulations. Proc. Int. workshop on the physics of blown sand, 1, 37-67. Department of theoretical statistics, University of Aarhus.
OWEN, P.R. (1964) Saltation of uniform grains in air. J . Fluid Mech., 20,225-242.
PAPOULIS, A. (1965) Probability, Random Variables, and Stochastic Processes. McGraw-Hill, New York.
REIZES, J.A. (1978) Numerical study of continuous saltation. J . Hydraul. Div., Am. SOC. civ Engrs, 104, (HY9), 1305- 1321.
RICHARDS, K.J. (1980) The formation of ripples and dunes
RUMPEL, D.A. (1985) Successive aeolian saltation: studies of
SEPPXLA, M. & LINDE, K. (1978) Wind tunnel studies of
SHARP, R.P. (1963) Wind ripples. J . Geol., 71,617-636. SMITH, J.D. (1970) Stability of a sand wave subjected to a
SMITH, J.D. & MCLEAN, S.D. (1977) Spatially averaged flow over a wavy surface. J . geophys. Res., 82,1735-1746.
TSUCHIYA, Y. (1969) Mechanics of the successive saltations of a sand particle on a granular bed in a turbulent stream. Bull. disast. Prev. Res. Inst.., Kyoto Univ., 19, 3144.
UNGAR, J. & HAFF, P.K. (1987) Steady state saltation in air. Sedimentology, 34,289-299.
VANDERMEER, J.H. (1981) Elementary MathematicalEcology. Wiley, New York, 294 pp.
WALKER, D.J. (1981) An experimental study of wind ripples. MSc thesis, Massachusetts Institute of Technology, Cam- bridge.
WARREN, A. (1983) Progress report on arid geomorphology. Progr. Phys. Geogr., 7, 397-403.
WERNER, B.T. & HAFF, P.K. (1986) A simulation study of the low energy ejecta resulting from single impacts in eolian saltation. In : Advances in Aerodynamics, Fluid Mechanics, and Hydraulics (Ed. by R. E. A. Arndt et al.). American Society of Civil Engineers, New York.
WERNER, B.T. & HAFF, P.K. (1987) Dynamical simulations of granular materials using concurrent processing com- puters. Submitted to Geotechnique.
WERNER, B.T., HAFF, P.K., LIVI, R.P. & ANDERSON, R.S. (1985) The measurement of eolian ripple cross-sectional shapes. Geology, 14,743-745.
WILLETTS, B.B. & RICE, M.A. (1986) Inter-saltation colli- sions. Proc. Int. workshop on the physics of blown sand, 1, 83-100. Department of theoretical statistics, University of Aarhus.
WILSON, I.G. (1972) Aeolian bedforms-their development and origins. Sedimentology, 19, 173-210.