Page 1
A THEORY OF DROPWISE CONDENSATION
A THESIS SUBMITTED TO
THE GRADUATE SCHOOL OF NATURAL AND APPLIED SCIENCES
OF
MIDDLE EAST TECHNICAL UNIVERSITY
BY
HASAN FEHMİ TEKİN
IN PARTIAL FULFILLMENT OF THE REQUIREMENTS
FOR
THE DEGREE OF MASTER OF SCIENCE
IN
MECHANICAL ENGINEERING
DECEMBER 2005
Page 2
Approval of the Graduate School of Natural and Applied Sciences
Prof. Dr. Canan ÖZGEN
Director
I certify that this thesis satisfies all the requirements as a thesis for the degree of Master of Science.
Prof. Dr. Kemal İDER Head of the Department
This is to certify that we have read this thesis and that in our opinion it is fully adequate, in scope and quality, as a thesis for the degree of Master of Science.
Assoc. Prof. Dr. Cemil YAMALI Supervisor
Examining Committee Members Prof. Dr. Kahraman ALBAYRAK (METU,ME) Assoc. Prof. Dr. Cemil YAMALI (METU,ME) Asst. Prof. Dr. İlker TARI (METU,ME) Asst. Prof. Dr. Tahsin ÇETİNKAYA(METU,ME) Prof. Dr. Ercan ATAER (GAZİ UNV.,ME)
Page 3
iii
I hereby declare that all information in this document has been obtained and
presented in accordance with academic rules and ethical conduct. I also declare that,
as required by these rules and conduct, I have fully cited and referenced all material
and results that are not original to this work.
Hasan Fehmi TEKİN
Signature:
Page 4
iv
ABSTRACT
A THEORY OF DROPWISE CONDENSATION
Tekin, Hasan Fehmi
M.S., Department of Mechanical Engineering
Supervisor: Assoc. Prof. Dr. Cemil Yamalı
December 2005, 167 pages
In this study, the effect of the substrate material on dropwise condensation
was studied theoretically. Temperature distribution in the material was obtained by
using the finite difference method for different substrate materials and drop radii and
FORTRAN computer program was used for this purpose.
A computer program in Mathcad was also written to calculate heat transfer
and heat flux for a single drop at various substrate materials and drop radii. After
finding heat transfer and heat flux through droplets of various sizes, total dropwise
condensation heat transfer and heat flux were calculated by integrating the heat
transfer through droplets with respect to the size distribution of the droplet
population. Substrate material effect in temperature distribution and heat transfer
were presented as tables, graphs and were discussed. Average temperature at the base
Page 5
v
of single droplet was obtained, then using the dropsize distribution the overall
average temperature of the condenser surface in dropwise condensation was obtained
for various substrate material. Finally overall average surface temperature and total
dropwise condensation heat flux was used to calculate heat transfer coefficient in
dropwise condensation as a function of thermal properties of the substrate material.
Major finding of this study is that the thermal conductivity of the substrate
material effects to the dropwise condensation heat transfer coefficient and at low
substrate thermal conductivity dropwise condensation heat transfer coefficient is
lower.
Numerical results were compared with results in literature.
Keywords: Dropwise condensation, dropsize distribution, theoretical study, substrate
material effect.
Page 6
vi
ÖZ
DAMLACIK YOĞUŞMASI TEORİSİ
Tekin, Hasan Fehmi
Yüksek Lisans, Makine Mühendisligi Bölümü
Tez Yöneticisi: Doç. Dr. Cemil Yamalı
Aralık 2005, 167 sayfa
Bu çalışmada yoğuşma yüzeyinin damlacık yoğuşması üzerindeki etkisi
teorik olarak incelenmiştir. Malzemedeki sıcaklık dağılımı sonlu farklar metodu
kullanılarak değişik yoğuşma yüzeyi malzemeleri ve damla yarıçapları için elde
edilmiştir ve bu amaç için bilgisayar programı FORTRAN kullanılmıştır.
Tek bir damlacıktan geçen ısı transferi ve ısı akısını farklı yoğuşma yüzeyleri
ve damla yarıçapları için hesaplamak amacıyla Mathcad’de de bir program
yazılmıştır. Tek bir damla tabanındaki ortalama sıcaklık bulunmuş, daha sonra
damlacık dağılımı kullanılarak farklı yoğuşma yüzeyi malzemeleri için damlacık
yoğuşmasındaki yoğuşma yüzeyinin ortalama sıcaklığı elde edilmiştir. Isı transferi ve
ısı akısını çeşitli boyutlardaki damlalar için bulduktan sonra, toplam damlacık
yoğuşması ısı transferi ve ısı akısı damla dağılımına göre entegre edilerek
hesaplanmıştır. Son olarak toplam yüzey sıcaklığı ve damlacık yoğuşması toplam ısı
akısı; damlacık yoğuşmasındaki ısı transferi katsayısını yoğuşma yüzeyi
Page 7
vii
malzemesinin termal özellikleri fonksiyonu olarak hesaplamak amacıyla
kullanılmıştır. Yoğuşma malzemesi yüzeyinin sıcaklık dağılımına ve ısı transferine
olan etkisi tablolar, grafiklerle gösterilmiş ve yorumlanmıştır.
Bu çalışmanın en büyük sonucu yoğuşma yüzeyi malzemesinin damlacık
yoğuşması ısı transferi katsayısına olan etkisi ve düşük termal iletkenli yoğuşma
yüzeylerde damlacık yoğuşması ısı transferi katsayısının daha düşük olmasıdır.
Nümerik sonuçlar literatürdeki sonuçlarla karşılaştırılmıştır.
Anahtar Kelimeler: Damlacık yoğuşması, damlacık dağılımı, teorik çalışma,
yoğuşma yüzeyi malzemesinin etkisi.
Page 8
viii
To my parents ,
who always support me in all aspects of my life
Page 9
ix
ACKNOWLEDGMENTS
I express my sincere appreciation to Assoc. Prof. Dr. Cemil Yamalı for his
guidance, support, understanding and valuable contributions throughout the study. I
am grateful to the jury members for their valuable contributions.
I express my deepest gratitude to my mother Hasine Tekin, my father M.
Şükrü Tekin, my brothers and my sister, for their endurance and for their
encouragements throughout my education life.
Page 10
x
TABLE OF CONTENTS
PLAGIARISM ............................................................................................................. iii
ABSTRACT................................................................................................................. iv
ÖZ ................................................................................................................................ vi
ACKNOWLEDGMENT.............................................................................................. ix
TABLE OF CONTENTS.............................................................................................. x
LIST OF FIGURES ...................................................................................................xiii
LIST OF TABLES .................................................................................................... xvii
LIST OF SYMBOLS ...............................................................................................xviii
CHAPTER
1. INTRODUCTION.............................................................................................. 1
1.1 Condensation.............................................................................................. 1
2. LITERATURE SURVEY .................................................................................. 4
2.1 Dropsize Distribution ................................................................................. 5
2.2 Heat Transfer Through the Droplet............................................................ 9
2.3 The Effect of Surface Thermal Properties and Finish on Dropwise
Condensation................................................................................................ 10
2.4 Substrate Effect ........................................................................................ 11
2.5 Effect of Noncondendsable Gases ........................................................... 22
2.6 Promoting Dropwise Condensation ......................................................... 24
3. MATHEMATICAL ANALYSIS ..................................................................... 31
3.1 Mathematical Modeling of Dropwise Condensation with Substrate
Material Effect ............................................................................................. 33
3.1.1 Temperature Distribution.................................................................. 33
Page 11
xi
3.1.2 Conduction Equations and Boundary Conditions Through a Single
Droplet ......................................................................................................... 36
3.1.3 Average Temperature Under the Droplet............................................ 51
3.1.4 Heat Transfer and Heat Flux............................................................... 52
3.2 Finite Difference Solution of Dropwise Condensation with Substrate
Material Effect ............................................................................................. 54
3.2.1 Temperature Distribution in the Substrate and Under the Droplet ..... 54
3.2.2 Average Temperature Under the Droplet............................................ 62
3.2.3 Total Heat Transfer and Heat Flux in Dropwise Condensation.......... 63
3.2.4 Dropwise Condensation Heat Transfer Coefficient ............................ 66
4. RESULTS AND DISCUSSIONS..................................................................... 67
4.1 Computation Results for the Temperature Distribution Under the Droplet
and in the Substrate ...................................................................................... 67
4.1.1 Temperature Distribution Under a Single Droplet and
Substrate Material ..................................................................................... 68
4.1.2 Average Temperature......................................................................... 74
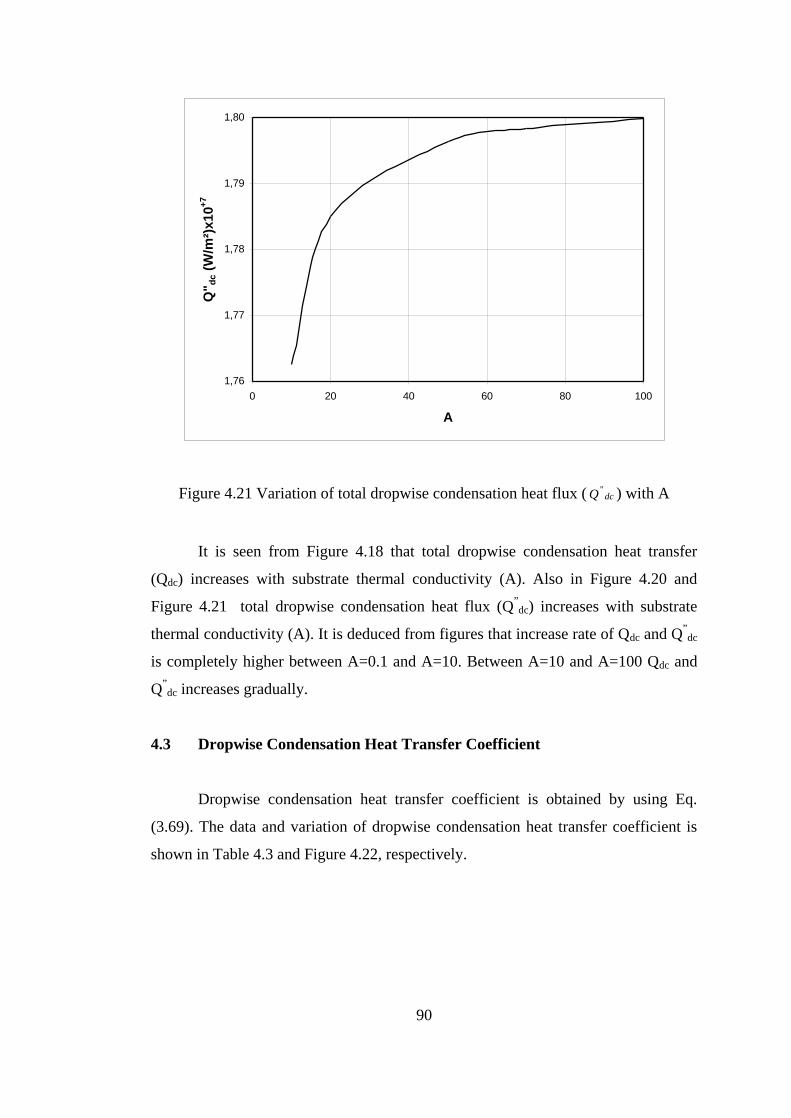
4.2 Computation Results for the Heat Transfer in Dropwise Condensation
Including the Substrate Effect..................................................................... 78
4.2.1 Effect of Droplet Radius on Heat Transfer and Heat Flux for a Single
Droplet ......................................................................................................... 79
4.2.2 Effect of Substrate Material on Heat Transfer and Heat Flux ........... 80
4.3 Dropwise Condensation Heat Transfer Coefficient .................................. 90
4.4 Comparison of Numerical Results with the Results in the Literature....... 92
4.4.1 Comparison of Heat Transfer Coefficient.......................................... 92
5. CONCLUSIONS .............................................................................................. 97
REFERENCES..................................................................................................... 98
APPENDICES
A. FORTRAN SOURCE PROGRAM................................................................ 106
B. NONDIMENSIONAL RADIAL AND AXIAL DIRECTION...................... 116
C. FORMULATION........................................................................................... 118
Page 12
xii
D. MATHCAD SOURCE PROGRAM .............................................................. 120
E. RESULTS FOR TEMPERATURE DISTRIBUTIONS................................. 126
F. RESULTS FOR HEAT TRANSFER AND HEAT FLUX ............................ 145
Page 13
xiii
LIST OF FIGURES
FIGURE
1.1 Condensation on a vertical surface. (a) Dropwise. (b) Filmwise. ...................... 3
2.1 Comparison of drop distribution between random fractal model and
photography ......................................................................................................... 7
2.2 Effect of substrate material and pressure on heat transfer coefficient ............. 13
2.3 Initial dropwise condensation on copper-nickel coated with No-Stick (left) and
Nedox ................................................................................................................. 26
2.4 Dependence of heat flux on coolant velocity. Different symbols denote different
test runs. + x * z, unplated tubes; o ∆ □ ◊, copper plated tubes ....................... 27
3.1 Droplet resting on a semi infinite substrate material ....................................... 33
3.2 Thermal resistances associated with the drop .................................................. 37
3.3 Physical model of thermal resistance Rc ......................................................... 42
3.4 Overall heat transfer coefficient under the droplet and bare area .................... 46
3.5 Temperature nodes under the drop and in the substrate................................... 56
4.1 Variation of nondimensional temperature as a function of nondimensional radial
distance at nondimensional axial distance 0~ =z for B=0.001.......................... 69
4.2 Variation of nondimensional temperature as a function of nondimensional radial
distance at nondimensional axial distance 0~ =z for B=0.001.......................... 70
4.3 Variation of nondimensional temperature as a function of nondimensional radial
distance at nondimensional axial distance 51099.9~ −= xz for B=0.001 ............ 71
4.4 Variation of nondimensional temperature as a function of nondimensional radial
distance at nondimensional axial distance 51099.9~ −= xz for B=0.001 ............ 72
4.5 Variation of average nondimensional condenser surface temperature at the drop
base area as a function of drop radius for A=100 .............................................. 74
Page 14
xiv
4.6 Variation of average nondimensional condenser surface temperature with B. 75
4.7 Variation of average nondimensional condenser surface temperature with A 76
4.8 Variation of dropwise condensation average nondimensional temperature with
A ........................................................................................................................ 77
4.9 Variation of heat transfer with drop radius for A=1 ........................................ 79
4.10 Variation of heat flux with drop radius for A=1 ............................................. 80
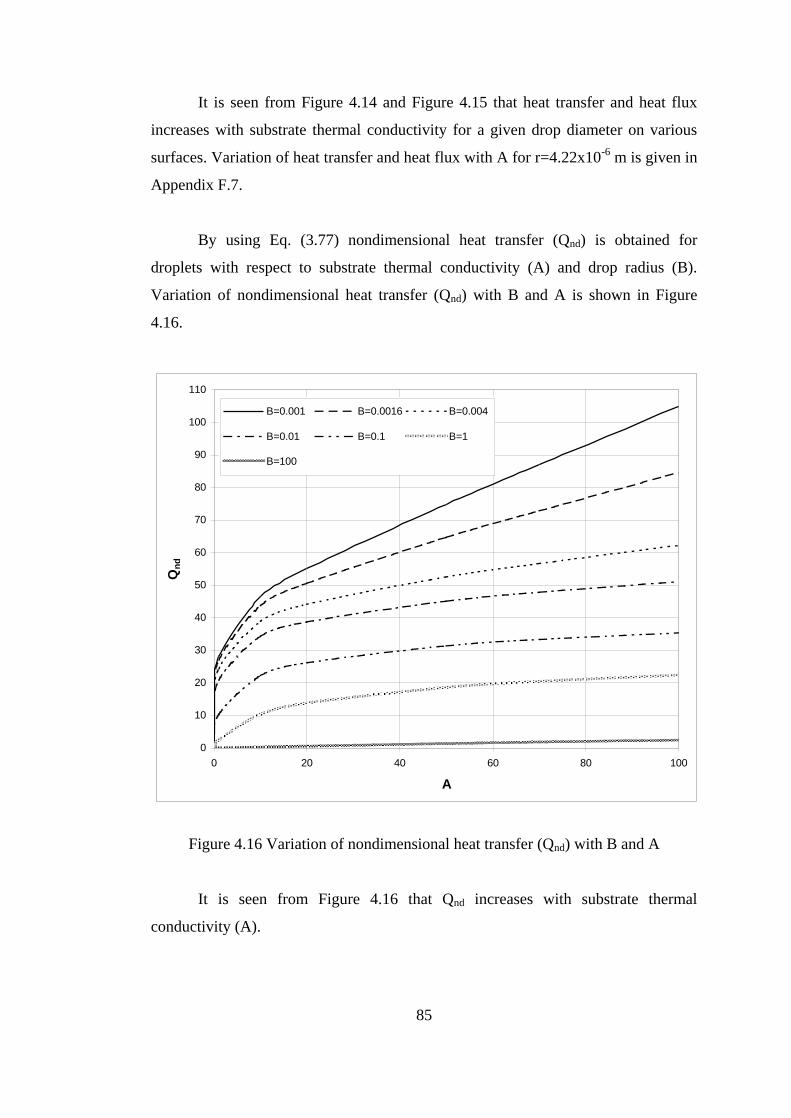
4.11 Variation of Qnd with A for B=0.001 .............................................................. 81
4.12 Variation of Q with A for B=0.001................................................................. 82
4.13 Variation of nondimensional resistance parameter with nondimensional drop
radius for B=0.001 and A=1 .............................................................................. 83
4.14 Variation of heat transfer with A for r=2.11x10⁻⁴ m....................................... 84
4.15 Variation of heat flux with A for r=2.11x10⁻⁴ m............................................. 84
4.16 Variation of nondimensional heat transfer (Qnd) with B and A ...................... 85
4.17 Variation of dimensional heat transfer (Q) with B and A............................... 86
4.18 Variation of heat flux (Q”) with B and A ........................................................ 87
4.19 Variation of total dropwise condensation heat transfer (Qdc) with A ............. 88
4.20 Variation of total dropwise condensation heat flux ( dcQ '' ) with A ................. 89
4.21 Variation of total dropwise condensation heat flux ( dcQ '' ) with A ................. 90
4.22 Variation of dropwise condensation heat transfer coefficient with A............. 91
4.23 Comparison of heat transfer coefficients between the present study and Tanaka
et. al [33] ............................................................................................................ 93
4.24 Comparison of heat transfer coefficients between the present study and Tsuruta
and Tanaka study [61] ....................................................................................... 94
4.25 Comparison of heat transfer coefficients between the present study and
literature ............................................................................................................. 95
4.26 Comparison of heat transfer coefficients between the present study and Yu Ting
Wu et. al. study [17] .......................................................................................... 96
E.1 Variation of nondimensional temperature as a function of nondimensional radial
distance at nondimensional axial distance 0~ =z for B=0.01.......................... 130
E.2 Variation of nondimensional temperature as a function of nondimensional radial
distance at nondimensional axial distance 0~ =z for B=0.01.......................... 131
Page 15
xv
E.3 Variation of nondimensional temperature as a function of nondimensional radial
distance at nondimensional axial distance 0~ =z for B=0.1............................ 132
E.4 Variation of nondimensional temperature as a function of nondimensional radial
distance at nondimensional axial distance 0~ =z for B=0.1............................ 133
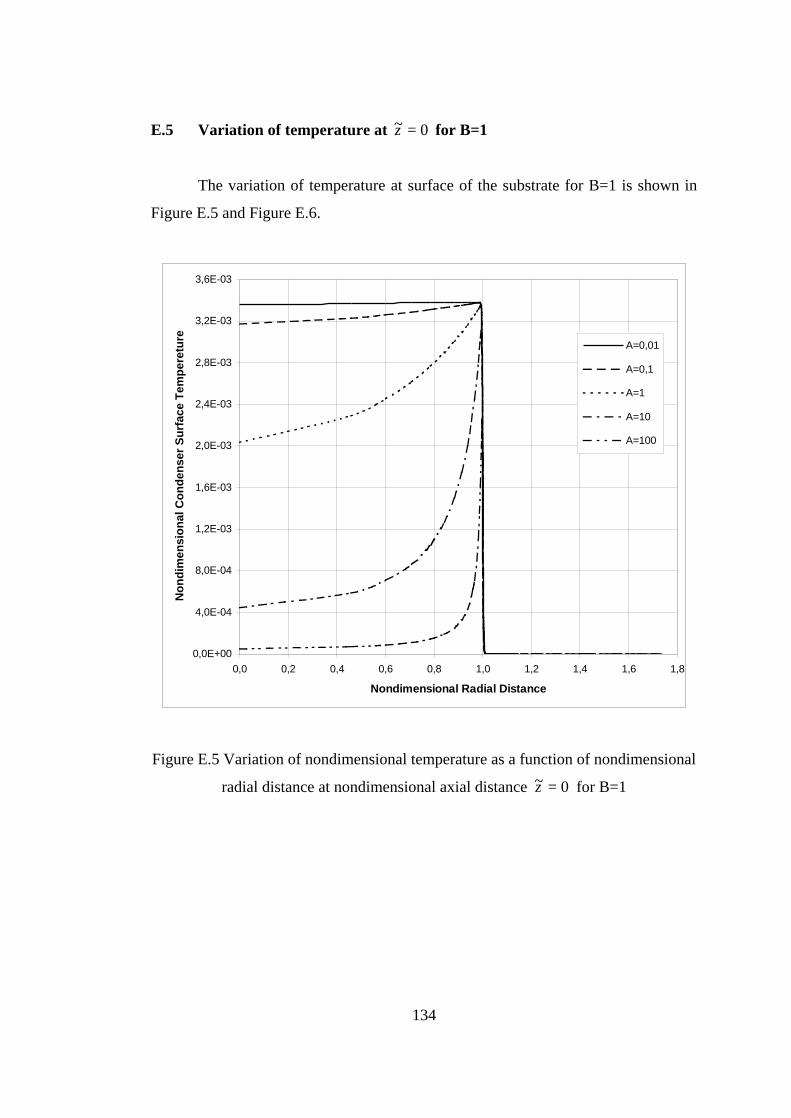
E.5 Variation of nondimensional temperature as a function of nondimensional radial
distance at nondimensional axial distance 0~ =z for B=1............................... 134
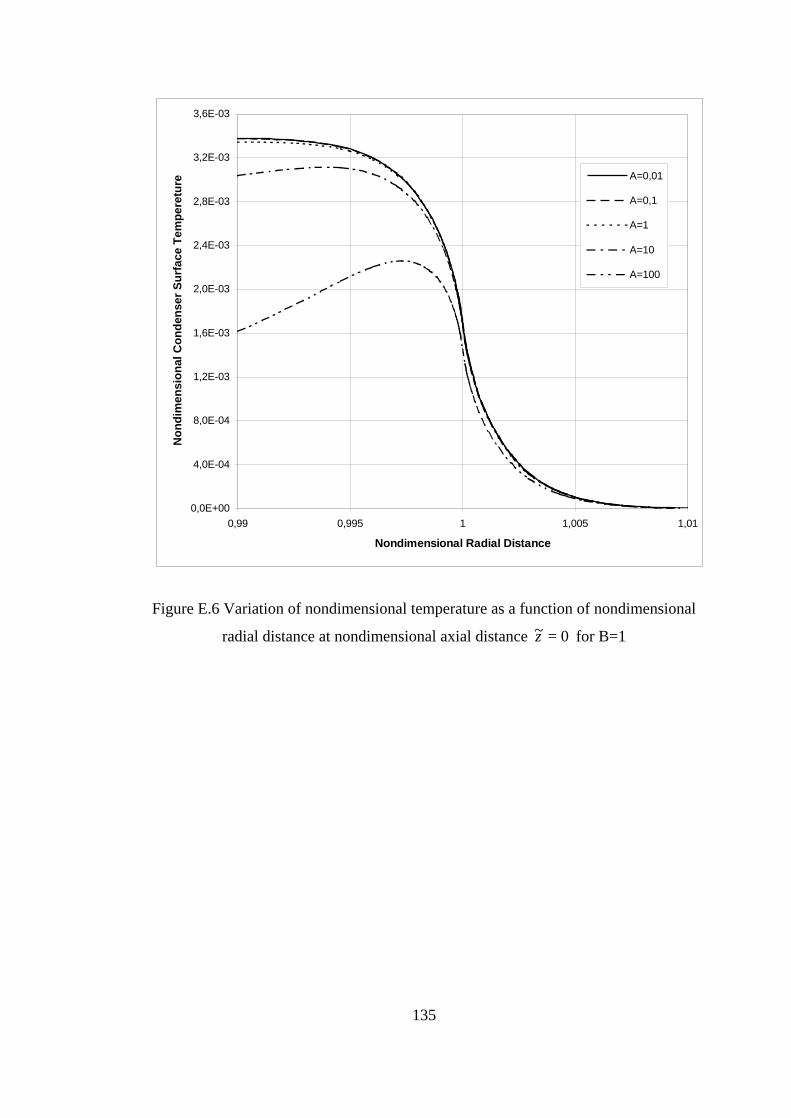
E.6 Variation of nondimensional temperature as a function of nondimensional radial
distance at nondimensional axial distance 0~ =z for B=1............................... 135
E.7 Variation of nondimensional temperature as a function of nondimensional radial
distance at nondimensional axial distance 0~ =z for B=10............................. 136
E.8 Variation of nondimensional temperature as a function of nondimensional radial
distance at nondimensional axial distance 0~ =z for B=10............................. 137
E.9 Variation of nondimensional temperature as a function of nondimensional radial
distance at nondimensional axial distance 0~ =z for B=100........................... 138
E.10 Variation of nondimensional temperature as a function of nondimensional radial
distance at nondimensional axial distance 0~ =z for B=100........................... 139
E.11 Variation of average nondimensional condenser surface temperature at the drop
base area as a function of drop radius for A=1 ................................................ 143
E.12 Variation of average nondimensional condenser surface temperature at the drop
base area as a function of drop radius for A=0.01 ........................................... 144
F.1 Variation of heat transfer with drop radius for A=0.01 ................................. 148
F.2 Variation of heat flux with drop radius for A=0.01....................................... 149
F.3 Variation of heat transfer with drop radius for A=100 .................................. 150
F.4 Variation of heat flux with drop radius for A=100........................................ 151
F.5 Variation of Qnd with A for B=0.01............................................................... 155
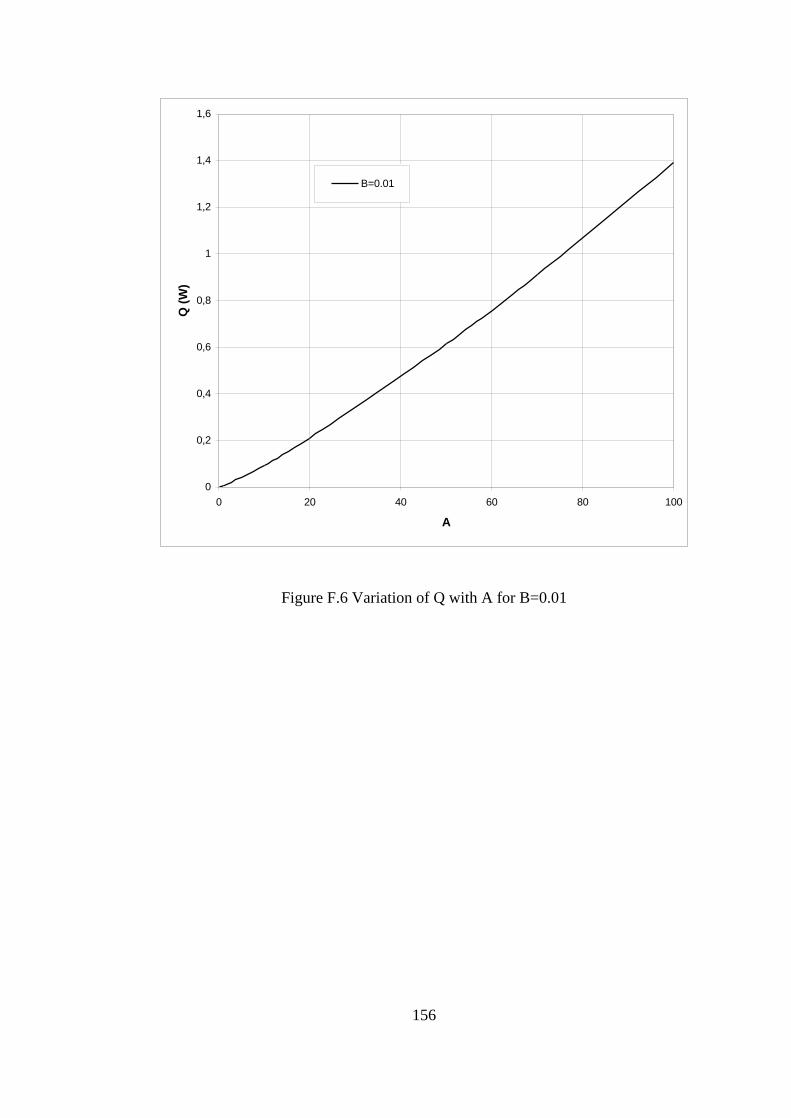
F.6 Variation of Q with A for B=0.01.................................................................. 156
F.7 Variation of Qnd with A for B=0.1 ................................................................. 157
F.8 Variation of Q with A for B=0.1.................................................................... 158
F.9 Variation of Qnd with A for B=1.................................................................... 159
F.10 Variation of Q with A for B=1....................................................................... 160
F.11 Variation of Qnd with A for B=10.................................................................. 161
Page 16
xvi
F.12 Variation of Q with A for B=10..................................................................... 162
F.13 Variation of Qnd with A for B=100................................................................ 163
F.14 Variation of Q with A for B=100................................................................... 164
F.15 Variation of heat transfer with A for r=4.22x10⁻⁶ m ..................................... 166
F.16 Variation of heat flux with A for r=4.22 x10⁻⁶ m .......................................... 167
Page 17
xvii
LIST OF TABLES
TABLE
2.1 Investigations into the surface thermal conductivity effect in dropwise
condensation ...................................................................................................... 16
2.2 Steam side heat transfer coefficients ................................................................ 26
2.3 Condensation mode criteria .. ............................................................................ 30
4.1 Dropwise condensation average nondimensional temperature data .................. 77
4.2 Variation of total dropwise condensation heat transfer (Qdc) and
total dropwise condensation heat flux (Q”dc) data............................................. 88
4.3 Dropwise condensation heat transfer coefficient data ...................................... 91
B.1 Variation of nondimensional radial distance rri ............................................. 116
B.2 Variation of nondimensional axial disance zj.................................................. 117
E.1 Variation of temperature at 0~ =z for B=0.001 .............................................. 126
E.2 Variation of temperature at 51099.9~ −= xz for B=0.001................................. 128
E.3 The data of average temperature...................................................................... 140
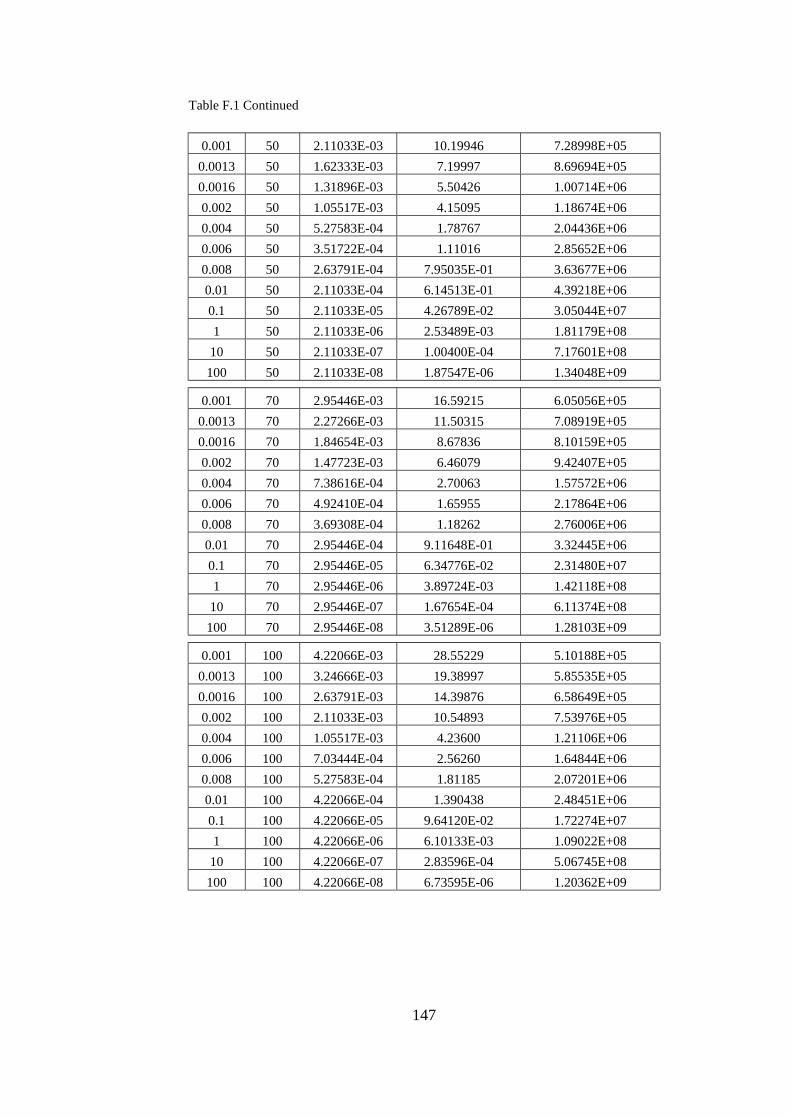
F.1 The data and results of heat transfer and heat flux .......................................... 145
F.2 The data and results of nondimensional heat transfer (Qnd) ............................ 152
F.3 Variation of nondimensional drop resistance for B=0.001 and A=1............... 165
Page 18
xviii
LIST OF SYMBOLS
Cp Specific heat at constant pressure [J/(kgK)]
Ts Surface temperature
Td Temperature distribution in the droplet
Tin Initial temperature in the substrate material
Tdsur Surface temperature of droplet
sT~ Nondimensional surface temperature
z Axial direction
r Radial direction
hi Interfacial heat transfer coefficient [W/(m2K)]
hfg Latent heat of evaporation [J/kg]
A Nondimesional parameter
B Nondimesional parameter
ks Subtrate thermal conductivity [W/(mK)]
kd Water thermal conductivity [W/(mK)]
r Drop radius [m]
r~ Nondimensional drop radius
z~ Nondimensional axial distance
T Temperature [K]
Page 19
xix
T~ Nondimensional temperature
fco Fraction of area
Pv Vapor pressure [N/m²]
σ Surface tension
h Heat transfer coefficient [W/m2K]
dt Time [sec]
γ Condensation Coefficient
Fr Nondimensionless drop resistsance
ρs Density of substrate [kg/m3]
ρl Density of liquid [kg/m3]
Θ Contact angle [rad]
U Overall heat transfer coefficient [W/(m2K)]
∆T Tempereature difference [K]
Tv Vapor temperature [K]
Ti Temperature of liquid-vapor interface [K]
Qnum Numerical heat transfer
Qnd Nondimensional heat transfer
Q Heat transfer rate [W]
Q’’ Heat flux [W/m2K]
Ri Interfacial heat transfer resistance [(m2K)/W]
Rc Condensate thermal resistance [(m2K)/W]
Rt Total thermal resistance [(m2K)/W]
Rc* Constriction resistance [(m2K)/W]
Page 20
xx
A Area [m2]
G Gas Constant [J/kg.K]
Subscripts
dc Dropwise condensation
ad Average dropwise condensation
av Average
max Maximum
min Minimum
Page 21
1
CHAPTER 1
INTRODUCTION
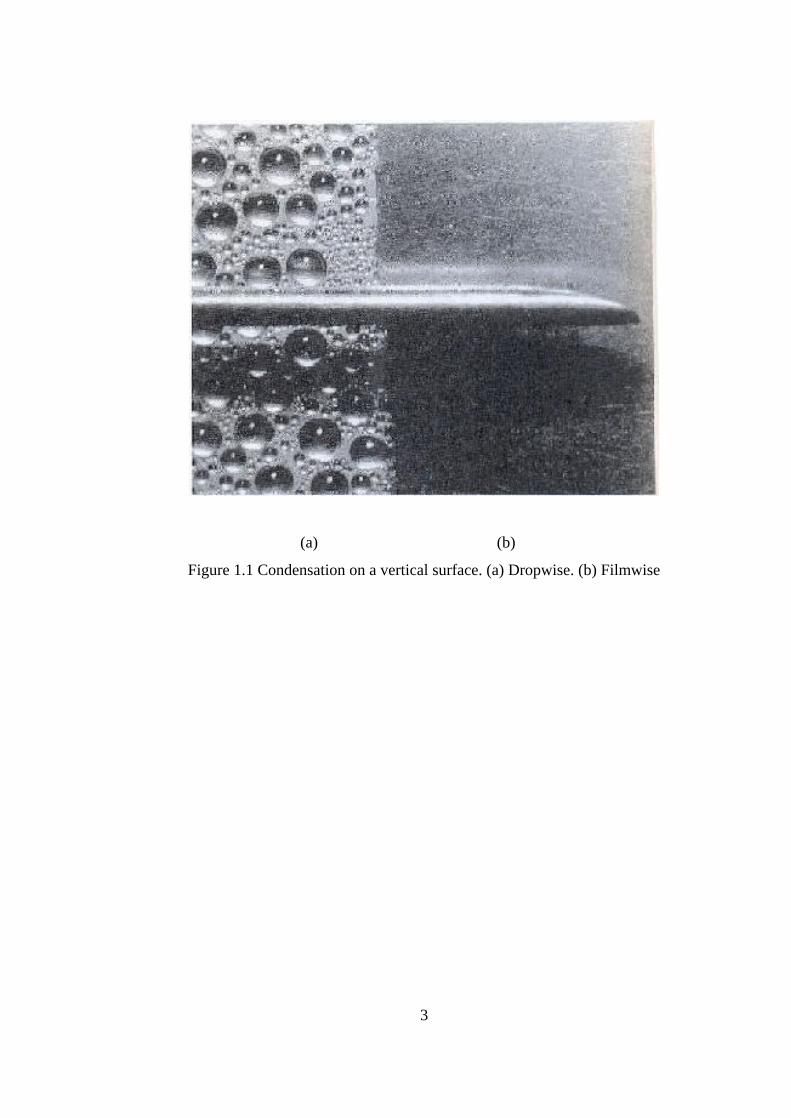
1.1 Condensation
Condensation is defined as the phase change from the vapor state to the liquid
or the solid state and occurs when the temperature of the vapor is reduced below its
saturation temperature. Condensation is usually done by bringing the vapor into
contact with a solid surface whose temperature is below the saturation temperature of
the vapor. But condensation can also occur on the free surface of a liquid or even in a
gas when the temperature of the liquid or the gas to which the vapor is exposed is
below the saturation temperature.
Condensation is classified into two groups; one is bulk condensation and the
other is surface condensation. In bulk condensation vapor condenses in a gas phase.
Formation of fog is an example of this type of condensation. Surface condensation
occurs when the vapor contacts with a surface whose temperature is below the
saturation temperature of the vapor. There are a lot of application with this type of
condensation. Surface condensation is classified as filmwise condensation and
dropwise condensation.
Filmwise condensation occurs when the liquid wets the surface and the
condenser surface is blanket by a condensate film. Liquid film on the surface that
slides down under the influence of gravity. The thickness of the liquid film increases
in the flow direction as more vapor condenses on the film. This liquid film represents
Page 22
2
a thermal resistance to heat transfer and a temperature gradient exists in the film. The
analytical investigation of film condensation was first performed by Nusselt.
In dropwise condensation the condensed vapor forms droplets on the surface
instead of continuous film and the surface is covered by several droplets of varying
diameters. In dropwise condensation, the small droplets that form at the nucleation
sites on the surface grow as a result of continued condensation, coelescence into
large droplets and slide down when they reach a certain size, clearing the surface and
exposing it to vapor. There is no liquid film in this case to resist heat transfer. As a
result, with dropwise condensation heat transfer coefficients can be achieved that are
more than 10 times larger than those associated with filmwise condensation. Large
heat transfer coefficients enable designers to achieve a specified heat transfer rate
with a smaller surface area and thus a smaller and less expensive condenser.
Therefore, dropwise condensation is the preferred mode of condensation in heat
transfer applications. However, it is very difficult to obtain dropwise condensation
since it does not continue long time and converts to filmwise condensation after a
while.
Dropwise condensation is achieved by adding a promoting chemical into the
vapor, treating the surface with a promoter chemical or coating the surface with a
polymer such as teflon or a noble metal such as gold, silver and platinum. The
promoters used include various waxes and fatty acids such as oleic or lionic acids.
They lose their effectiveness after a while, however because of fouling, oxidation
and removal of the promoter from the surface. It is possible to sustain dropwise
condensation for a long time by the combined effects of surface coating and periodic
injection of the promoter into the vapor. However, any gain in heat transfer must be
weighed against the cost associated with sustaining dropwise condensation. Another
reason of losing the effectiveness of dropwise condensation is the accumulation of
droplets on the condenser surface. Heat transfer rate sharply decreases because of the
accumulated droplets. Therefore, most condensers are designed on the assumption
that film condensation will take place on the surface.
Page 23
3
(a) (b)
Figure 1.1 Condensation on a vertical surface. (a) Dropwise. (b) Filmwise
Page 24
4
CHAPTER 2
LITERATURE SURVEY
Considerable interest in dropwise condensation has been aroused since the
discovery by Schmidt et al. [2] of this second “ideal” mode of condensation. The
report by the above authors in 1930, that the heat transfer coefficient associated with
the dropwise mode was substantially higher than that found in the presence of
filmwise condensation and the potential industrial significance of this, have
stimulated this interest.
A basic understanding of the mechanism of dropwise condensation requires a
knowledge of how the drops form and grow. Jakob [3] proposed that very thin layer
of steam or water rapidly develops on the surface, breaking into droplets after a
certain thickness is reached; a new film immediately appears over the exposed area.
This would explain the high heat transfer coefficients observed, since condensation
would be taking place on a thin film having a low resistance to heat transfer. Jakob’s
view was later supported by Baer and McKelvey [4] and by Welch and Westwater
[5].
An opposing view was proposed by Tammann and Boehme [6] who observed
that, upon repetitive condensation, drops appear to have the same arrangement on the
surface, suggesting the existence of particular nucleation sites. This observation was
substantiated by McCormick and Baer [7,8] whose experimental study of drop
Page 25
5
formation and growth indicates that drops nucleate from randomly distributed sites
and that these sites are probably pits and grooves in the surface.
Umur and Griffith [9] indicated that a film does not develop on the surface as
the surface is cooled to below the vapor temperature. And also the film behind the
drops rolling over the surface does not happen. Rolling drops leave behind them at
most a monolayer. They concluded that no film greater than a monolayer in thickness
exists on the area between the drops and that no net condensation takes place on this
area.
In dropwise condensation, primary drops are first formed at nucleation sites.
These grow by condensation until coalescence occurs between neighbours. The
coalesced drops continue to grow and new ones to form and grow at sites exposed
through coalescence. As the process continues, coalescences occur between drops of
various sizes while the size of the largest drops present continues to increase. A
situation is soon reached where the largest drops present appear more or less uniform
in size and spacing. This situation persists as these largest drops grow and their
number per area decreases until they reach a size at which the region is again swept.
In brief, most of the studies clearly show that formation of droplets occurs as
a result of nucleation and no film formation between droplets takes place.
2.1 Dropsize Distribution
The rational solution of any heat transfer problem begins with the definition
of the geometry. For dropwise condensation this means that the dropsize distribution
must be specified.
In dropwise condensation high magnification visual observations of the
condensation process show that there are drops of different size on the condenser
surface with various diameters. Viewing any single spot on the surface, the drop size
will vary in a steady and unsteady way, caused by condensation on the drops and by
Page 26
6
coalescence. The surface temperature of the condenser change with the size of drops
on it, causing fluctuations of the surface temperature.
P. Griffith and C. Graham [10] used a Polaroid microscope camera at a
variety of magnifications to measure the drop distributions. They found 200x106
sites/cm2 nucleation densities.
J. W. Rose and L. R. Glicksman [11] thought that while considerable
progress has been made on the problem of calculating the heat transfer through a
single drop of given size, the problem of the distribution of drop sizes is less well
understood. In attempting to calculate the average heat transfer rate, different
workers have dealt with the problem of the dropsize distribution in a variety of ways,
Fatica and Katz [12] and Sugawara and Michiyoshi [13] assumed that on a given
area all drops have the same size, are uniformly spaced and grow by condensation at
their surfaces. Wenzel [14] assumed that drops grow in uniform square array and that
coalescences occur between four neighbouring drops to form a larger drop in a new
uniform square. Gose, Mucciardi and Baer [15] and more recently, Tanasawa and
Tachibana [16] have attempted partially to model the drop growth and coalescence
process by computer. The major problem here was the large time requirement to
model the process adequately. In the study of J. W. Rose and L. R. Glicksman [11]
the theoretical distribution of drop sizes relates to a particular small region of the
condensing surface. Since falling drops sweep diverging tracks, the lower regions of
the surface are swept more frequently and consequently largest generation of drops
decreases with distance down the surface. In general, to determine the size
distribution over a relatively large area, it would be necessary to determine the
dependence of largest generation of drops on location and to integrate for the whole
region. When considering larger areas it should also be noted that the theory does not
include falling drops.
Yu-Ting Wu et al. [17] made a theoretical study in dropwise condensation.
They insisted that dropwise condensation consists of the transient processes
occurring repeatedly on the condensing surface. In the process, primary drops are
Page 27
7
formed at nucleation sites, then coalescence occurs between neighboring drops with
the drops growth. A new generation of drops is formed at sites exposed by
coalescence. These again grow to be followed by a third generation and so on until a
falling drop sweeps the entire field and the process restarts. They simulated random
fractal model, dropsize and spatial distributions. They find the photographs of
dropwise condensation taken at different instants or in different scales are similar and
a whole photograph can be obtained by enlarging properly a local photograph. This
characteristic indicates that dropwise condensation appears self-similar, which is one
of the most important features of fractals. In addition, drop spatial distribution also
possesses randomicity. The random fractal model and a condensing photograph are
given in Fig. 2.1.
Figure 2.1 Comparison of drop distribution between random fractal model and
photography ( a- Drop distribution constructed by using the random fractal model.
b- Close-up photography of condensing surface).
Le Fevre and Rose [18] proposed the following expression to calculate the
fraction of surface covered by the droplets in the size range r to rmax. They assumed a
form for the time averaged distribution which had the correct behaviour for the
limiting cases of very large and very small drops.
Page 28
8
n
co rr
rrf
−=
maxmax1 (2.1)
This expression can be used for a surface swept by departing droplets as well
as for unswept surfaces. The effect of sweeping can be introduced in to the
expression above by choosing a suitable value for n. It is shown by Tanaka [19] that
for an unswept surface the value of n is close to 1/3.
Rose and Glicksman [11] based on the results of Westwater and co-workers
in which a high magnification cine film was used to observe the sequence of events
resulting from sweeping of the condensing surface by departing drops, introduced a
universal form for large drops that grow primarily by coalescence with small drops.
Maa and Wu [20] used the population balance model to derive the dropsize
distribution of small drops which grow mainly by direct condensation based on the
assumption of steady size distribution.
Later, Maa [21] used the population balance model to derive a dropsize
distribution considering both small and large drops on the condensing surface. He
solved the resulting equation numerically. The number of nucleation sites was varied
so that the result would fit the experimental data.
Tanaka [22-24] based on photographs of a vertical condensing surface,
argued that in the so called steady dropwise condensation, the surface is cleared of
condensate periodically by falling drops. Those drops sweep the plate, exposing bare
strips, on which transient condensation takes place without delay, until the area is
swept clean again. Based on this, he attempted to describe the transient condensation
by a set of simultaneous integrodifferential equation derived from statistical and
geometrical considerations. The solution to these equations was expressed in terms
of four-dimensional parameters, which were adjusted to fit the experimental data.
Page 29
9
2.2 Heat Transfer Through the Droplet
Since condensation occurs on the droplets of varying sizes in the dropwise
condensation, to find the total heat transfer rate, the amount of heat transfer through a
single droplet as a function of its radius and the size distribution over the
condensation surface should be known.
The number of variables which affect dropwise condensation heat transfer is
quite large. Surface micro properties, system pressure, surface orientation, steam
velocity, promoter, condenser thermal conductivity, noncondensable gas
concentration, contact angle and departure radius all play important roles.
There are some important cases to find heat transfer through a single droplet.
These cases are:
a) Heat conduction through a single droplet.
b) Heat conduction in the substrate material.
c) The existence and the variation of the interfacial heat transfer coefficient at
the vapor-liquid interface.
d) Interference of heat conduction through a single droplet with the heat
conduction in the neighboring droplets.
P. Griffith and C. Graham [10] evaluated the heat transfer through a single
droplet and than to sum the heat transfer through all the drops on the surface using
the dropsize distribution in their experimental analysis. The most important
assumption in their study was that the bare spaces between the drops are completely
inactive.
Fatica and Katz [12] proposed a model for heat transfer through an individual
droplet during dropwise condensation. In this model it is assumed that the surface
and base temperatures of the droplet are uniform and constant, equal to the vapor and
Page 30
10
condenser temperatures, respectively. The majority of heat transfer actually takes
place through a region very close to the periphery of the drop, the triple interface
between the solid, liquid and vapor.
Sadhal and Plesset [31] studied effect of solid properties and contact angle in
dropwise condensation and evaporation. They studied the effect of condenser
material by solving the steady heat conduction equation for a geometry consisting of
a droplet in the form of a spherical segment on a semi infinite solid.
Sadhal and Martin [62] used differential inequalities to find heat transfer
through drop condensate. In their analysis the theory of differential inequalities was
applied to obtain approximate solutions which are upper and lower bounds for the
exact solutions of the temperature distributions in droplets of arbitrary contact angle
0≤θ0≤π/2.
Tanner et. al. [25] indicated that; an increase in steam velocity past the
condensing surface increases the heat transfer coefficient both by removing
noncondensable gas and by altering the flow of condensate. And also they stated that
steam side heat transfer coefficient decreases with decreasing pressure [26].
Experimental and theoretical results of the Hurst and Olson’s studies [27]
show that 83 to 98 percent of the calculated total heat transfer to a droplet comes in
through the corner element where the hemispherical surface of the droplet intersected
the condensing surface even for very small droplets. And in their investigation they
showed that condensing surface temperatures in dropwise condensation can be
predicted by assuming that all heat is transferred through a droplet by conduction.
2.3 The Effect of The Surface Thermal Properties and Finish on Dropwise
Condensation
In order to make any rational correlation of the dropwise condensation heat
transfer data it is necessary to have a clear picture of the physical processes involved.
Page 31
11
When one looks a surface on which dropwise condensation is occurs, it is observed
that drops form, grow, agglomerate and finally roll down or fall off.
Peter Griffith and Man Suk Lee [28] choose a horizontal surface facing down
for this investigation because the experiments of Hampson show this geometry
yielded a heat transfer coefficient that was independent of the condensing rate. It
appears that the fraction of the surface which is covered with drops running down is
heat flux dependent and this complication is eliminated with a horizontal surface
facing down.
If the roughness and wetting effects are considered, according to results of
their experiments, it was observed that the rougher the condensing surface, the lower
the heat transfer coefficient. At the same time it was also observed for the rough
lapped copper surface that only an imperfect type of drop condensing was initiated at
the low heat load. As the heat load was increased, the contact angle of the drop was
increased and the condensation was gradually changed to the good dropwise
condensation. For the mirror finished surface it was also noticed that tiny scratches
acted as favorable nucleation sites because they kept on producing the condensing
drops. It appears that the primary effect of roughness is to decrease the apparent
contact angle.
2.4 Substrate Material Effect
As far as the effect of substrate material properties are concerned the opinions
differ. A group of scientist claim that thermal properties of substrate has an important
effect on the rate of heat transfer, in dropwise condensation whereas others claim that
substrate is not a factor in dropwise condensation.
Although many researchers have measured the heat transfer coefficients for
various condensing surface materials with different thermal conductivity, the definite
conclusion has not been obtained up to now. Tanner and colleagues compared the
heat transfer coefficients of the dropwise condensation of steam at atmospheric
Page 32
12
pressure on the copper and stainless steel surfaces [25,38]. Griffith and Lee
experimented with dropwise condensation of the horizontal downward surfaces made
of copper, zinc and stainless steel [28]. In addition, Wilkins and Bromely measured
the heat transfer coefficients of five kinds of vertical pipes [56]. The above
experimental results indicate that the experimental heat transfer coefficients decrease
with the surface thermal conductivity. On the other hand, Aksan and Rose measured
the heat transfer coefficients on copper and mild steel surfaces carefully and they
obtained an opposing result that there was no significant difference between them
[57]. Most of these researchers obtained the condensing surface temperature by
extrapolation method using the temperature profile in the condenser block. Because
the uncertainty in inferring the surface temperature from the extrapolation increases
with decreasing surface thermal conductivity, many arguments have been made
concerning the uncertainty of the experimental heat transfer coefficients together
with some discussions on the effect of surface chemistry. Following them,
Hanneman and Mikic [29] and Tsuruta and Tanaka [33] conducted the precise
measurements of the surface temperature using a thin-film resistance thermometer
deposited on the stainless steel surface and they obtained a lower heat transfer
coefficient than that for the copper condensing surface.
Yu-Ting Wu, Chun-Xin Yang and Xiu-Gan Yuan [17] made theoretical study
for the dropwise condensation heat transfer on the four kinds of surfaces; copper,
zinc, carbon steel and stainless steel. The results indicate that the heat transfer
coefficients are dependent on the surface thermal conductivity. The copper yields the
highest heat transfer coefficient and it decreases markedly with the thermal
conductivity in the order of zinc, steel and stainless steel. Dropwise condensation
heat transfer coefficient increases with an increase in the thermal conductivity of the
substrate material. It also found that the effect of thermal conductivity of the
condenser material on dropwise condensation heat transfer increases with the system
pressure, as shown in Figure 2.2. By this theoretical study it is confirmed that a
decrease of the surface thermal conductivity raises the constriction resistance and
reduces the heat transfer coefficient of dropwise condensation. When using low
conductivity test plates, they find very small temperature differences between the
Page 33
13
vapor and the surface. Under these circumstances, quite small errors in the surface
temperature lead to large error in the vapor-side heat transfer coefficient. On the
other hand, when they used high conductivity test plates, the temperature differences
are high and the effect of the error on the heat transfer coefficient is very small. This
is main reason for diversity of different experimental results.
Figure 2.2 Effect of substrate material and pressure on heat transfer coefficient [17]
In dropwise condensation total resistance is expressed as the sum of two
different thermal resistances in series. First, the surface to vapor resistance. The other
resistance is called constriction resistance which is caused by the bending of the heat
flux lines in the substrate. Constriction resistance was firstly recognized and studied
by B. B. Mikic[30]. Heat flow through a material with a non-uniform heat flux over
its surfaces is always associated with a thermal resistance known as a constriction
resistance. The constriction resistance is caused physically by the heat flow
redistribution in the material so that the flow could conform with the non-uniform
heat flux at the surface. This resistance is significant only if the characteristic length
representing non-uniform conditions over the surface is less than or equal to the
Page 34
14
depth of the material where the constriction takes place. The most common example
of the constriction resistance is the so called thermal contact resistance. Less
common, but also very significant is constriction resistance in dropwise condensation
where this type of the resistance for example could account for about 80 per cent of
the total resistance in case of stainless steel as condensing surface. All studies related
to the substrate effect consider that thermal conductivity of the substrate material is
the only parameter governing the constriction resistance.
Mikic [57] consider the flow of heat through a solid. At the surface z=0,
there is non-uniform heat transfer coefficient h. Far form the surface the temperature
distribution is one dimensional. Tc represent the local surface temperature and T0
constant temperature of the environment. The heat rate at the surface is then;
( )∫ −=A
c AdTThQ 0 (2.2)
The surface temperature Tc would be non-uniform. The average flux over the
heat transfer surface follows from (2-2) as
( ) ( )∫ ∫ −−−=−=A A
scavscav AhdTTA
hTTAhdTA
hTAQ 11
00 (2.3)
Where ( )∫= AhdAhav 1 and Ts is a constant hypothetical surface temperature
obtained at z=0 by the extrapolation of the linear temperature profile existing far
from the surface. Defining the total resistance from the surface to the environment as
AQTT
R s
/0 −
= (2.4)
It can be written from relation (2-3) the following
Page 35
15
cav
Rh
R *1+= where ( )∫ −=
Asc
avc AdTT
hh
QR 1* (2.5)
Equation (2-5) defines the constriction resistance R*C. It can be seen from
relation (2-5) that 1/hav is not the only resistance at the surface. The value of R*C is
always positive since (Tc-Ts) is higher for higher values of h/hav. R*C goes to zero
when Tc→Ts everywhere and that would be the case either for uniform h or an
infinite conductivity of the surface material in the lateral direction.
R. J. Hannemann and B. B. Mikic [29] investigated experimentally surface
thermal conductivity on dropwise condensation. For a gold coated stainless steel
surface, they obtained heat transfer coefficient as 0.62 x 10⁵ W/m2K, whereas for a
gold coated copper surface heat transfer coefficient was found to be 1.5 x 10⁵
W/m2K, almost 2.5 times the value obtained for the stainless steel (low conductivity
surface). In their study, the single most significant experimental difficulty in
condensation heat transfer research is due to the necessity of measuring accurately
the temperature of the solid surface at which the phase change takes place. Since the
surface conductances involved are very large, a slight error in the measurement of
the fluid to surface temperature difference can lead to large errors in the computed
heat transfer coefficients. The problems are most acute when thermal properties of
the condensing surface are to be varied; low conductivity materials inherently lead to
greater inaccuracies in almost any type of surface temperature measurement scheme.
Although most experimental studies on dropwise condensation have been
performed using copper as a condensing surface material (due to its high
conductivity and relative case of promotion), at least four investigators have
produced relevant direct data on the surface thermal conductivity dependence of the
dropwise condensation heat transfer coefficient. The data summarized in Table 2.1.
Page 36
16
Table 2.1 Investigations into the surface thermal conductivity effect in
dropwise condensation
Investigators Material
Thermal
conductivity
(W/mK)
Measured
steamside
coefficient
(W/m2K)
Condenser
orientation
Tanner et al [38] Copper
Stainless steel
381
17.3
2.38 x 10⁵
0.45 x 10⁵
Vertical
Vertical
Griffith & Lee
[28]
Copper
Zinc
Stainless steel
381
109
17.3
0.57 x 10⁵
0.26 x 10⁵
0.11 x 10⁵
Horizontal
Facing
Down
Wilkins &
Bromley [56]
Copper
Gold
Admirally
Cu-Ni 90-10
Monel
393
294
121
50
27
2.27 x 10⁵
1.99 x 10⁵
1.59 x 10⁵
1.25 x 10⁵
0.55 x 10⁵
Condensation
on
vertical
tubes
Aksan & Rose
[57]
Copper
Steel
381
45
2.16 x 10⁵
2.38 x 10⁵
Vertical
Vertical
Hanneman &
Mikic [29]
Copper
Stainless steel
395
17.3
1.50 x 10⁵
0.62 x 10⁵
Vertical
Vertical
In evaluating the results of these investigations, three main factors
influencing the measurements must be considered: (1) the possible presence of
significant noncondensable gas concentrations, (2) the accuracy with which the
surface temperature was measured or inferred during condensation and (3) the effects
of surface chemistry differences due to differences in promoters and surface
microproperties.
Tanner et al. [38] obtained values for the heat transfer coefficient for
atmospheric pressure dropwise condensation for both copper (k=380 W/mK) and
stainless steel (k=17 W/mK) condensing specimens usingthe extrapolation method.
Page 37
17
The conductance for the stainless steel surface was found to be a factor of five lower
than for the copper surface.
Griffith and Lee [28] measured heat transfer coefficient for three different
condensing surface materials with the condensing surface in the horizontal, facedown
position. A modified extrapolation method was used, in which a thin condensing
surface was soldered to a copper rod in which the temperature profile was measured.
Conductances for stainless steel were again found to be a factor of five lower than
those for copper. A uniform surface chemistry was obtained by standard promotion
of the gold plated surfaces. Although noncondensable gases may have been present,
the primary error in these data is thought to be due to extrapolation error.
Wilkins and Bromley [56] investigated a whole series of condenser materials,
measuring the overall coefficient of heat transfer between vapor and cooling water
for thin and thick walled condenser tubes. The steam side coefficient was then
inferred from overall coefficient through knowledge of the coolant flowrate and
material thermal conductivity. The results decrease systematically with conductivity
with the conductance for Monel (k=27 W/mK) reported to be a factor of four lower
than that for copper.
Aksan and Rose [57] measured conductances on copper and copper plated
steel (k=45 W/mK) using the extrapolation method, obtaining results in opposition to
those previously described. In fact, the conductance they report for copper is
somewhat lower than that for the copper plated steel. The data were apparently
flawed by neither noncondensable gas nor surface chemistry effects, but these
authors estimated the possible error in their surface temperature measurements to be
on the order of 0.6 K. A rough calculation shows that if this error were indeed
present, the data point for steel could easily have been a factor of two lower than the
copper data point.
Also, R. J. Hannemann and B. B. Mikic [59] made an analysis of the effect of
surface thermal conductivity on the rate of heat transfer in dropwise condensation.
Page 38
18
Due to the finite lateral thermal conductivity of the condensing surface material, the
distribution of droplets of varying size over the surface during dropwise
condensation and the resulting inhomogeneity of surface heat flux induces a thermal
resistance in addition to the average droplet resistance. This resistance, the thermal
constriction resistance, was studied analytically and the results compared to available
data in the work described in the study. The analytical model, consisting of a
synthesis of single drop constriction resistance results with known droplet
distribution information, resulted in a correlation for the overall dropwise
condensation constriction conductance as a function of the condensing surface
thermal conductivity. In their study, calculating the overall thermal constriction
resistance it is assumed that: (1) The droplet distribution is statistically stationary,
with the macroscopic drop distribution being universal, (2) The droplet distribution is
taken to be spatially random. Each drop is considered to be centered on a disc of
surface area with which the droplet is associated, (3) The time response of the
surface to changing heat transfer coefficients is sufficiently rapid and thermal storage
effects sufficiently small that the steady state conduction equation in the condenser
material is valid. The time for coalescence of macroscopic drops is assumed to be
much smaller than the time between coalescences, so that steady state conduction can
be assumed for calculating the droplet heat transfer resistance, (4) The constriction
resistance due to precoalescence drops can be neglected.
In the study of Mikic [30], he noted that in the case of vertical position of the
condensing surfaces constriction resistance was much lower. That should be
expected, since for a given surface material the constriction resistance depends only
on the distribution of large drops on the condensing surface and the latter strongly
depends on the surface position. The heat transfer coefficient was also much higher
for the vertical surfaces. That came not only due to the decrease in the constriction
resistance but also due to a substantial decrease in thermal resistance excluding
constriction resistance in the experiments done by Tanner et al., which was lower
mainly because of the absence of noncondensibles in the condensing system. The
fact that relative contribution of constriction resistances for the same material
calculated from experimental results of Griffith and Lee, and Tanner et al., is the
Page 39
19
same, is obviously accidental and no generalization should be made based on the fact
that for the stainless steel surfaces constriction resistance was about 84 per cent of
the total resistance and for copper about 20 per cent for both sets of experiments. The
important conclusions that can be drawn from the above evaluations are:
1. The constriction resistance is present in dropwise condensation.
2. Its contribution to the overall resistance could be significant and therefore
cannot be left out from any dropwise condensation model.
Hannemann [60] indicated that the constriction of the heat flow lines near the
surface due to non-uniformity of the surface temperature leads to the conclusion that
the resulting thermal resistance depends also upon the condensing surface thickness.
Sadhal and Plesset [31] analyzed the effect of condenser material is dealt with
by solving the steady heat conduction equation for a geometry consisting of a droplet
in the form of a spherical segment on a semi-infinite solid. In their models they
assumed that the influence on a droplet due to surrounding droplets is negligible.
And they concluded that the importance of the material properties of the solid and of
the droplet contact angle for condensing droplets.
T. Tsuruta and H. Tanaka [61] made a theoretical study on the constriction
resistance in dropwise condensation. The effect of the thermal conductivity of the
condenser material on dropwise condensation heat transfer was studied. By taking
account of the contribution of the droplet resistance in the individual drop size class
to the thermal resistance in transient dropwise condensation, a fundamental
differential equation describing the constriction resistance caused by the
inhomogeneity of surface heat flux is derived. It is found from the non-
dimensionalized fundamental equation that the constriction resistance can be
determined by a Biot number defined by the interfacial heat transfer coefficient, the
departing drop radius and the surface thermal conductivity, in addition to a few
characteristic parameters. And they concluded that heat transfer coefficient of
Page 40
20
dropwise condensation decreases with decreasing surface thermal conductivity due to
increasing constriction resistance.
Peter Griffith and Man Suk Lee [28] emphasized surface thermal conductivity
in their study. They point out that if equations and boundary conditions written, it is
apparent that surface thermal conductivity could enter into the condensing heat
transfer coefficient as well as the thermal conductivity of the condensate itself. If the
surface thermal conductivity is very large, the surface temperature approaches
uniformity at a value close to the saturation temperature of the condensate. This
tends to give a high heat transfer coefficient. For low surface thermal conductivity,
only a very local cooling occurs in the vicinity of the triple interfaces and a large
proportion of the surface is well below saturation temperature. This gives a low heat
transfer coefficient. In their experiment they used horizontal downward-facing
condensing surfaces of copper, zinc and stainless steel. All three surfaces were gold
plated so as to obtain identical surface chemistries as well as readily promotable
surfaces. The promoter used was oleic acid. In the case of the zinc and stainless steel
surfaces thin disks of these materials were respectively soft-soldered and silver-
soldered to thicker copper disks in which the temperature distributions were
measured. The steam side heat transfer coefficients were found to be independent of
heat flux and to have values of about 57 kW/m2K, 26 kW/m2K and 11 kW/m2K for
copper, zinc and stainless steel respectively. These results suggest a systematic
dependence of the steam side heat transfer coefficient on the thermal conductivity of
the plate material, whose approximate values were 381 W/mK, 109 W/mK and 17.3
W/mK for copper, zinc and stainless steel respectively. These authors reported heat
transfer coefficients in the approximate ratios 5:2.2:1 for copper, zinc and stainless
steel, respectively. So, it is by no means obvious that the dropwise condensation heat
transfer coefficient should be a function of the thermal conductivity of the bulk
material underlying the promoter. How this comes about can be seen most easily by
considering the heat transfer through and around a drop. Near the triple interface, the
conduction path is very short and the local heat transfer coefficient is very large. On
bare surface the heat transfer coefficient is virtually zero. On the surface near the
middle of a drop, the conduction path through the liquid is quite long and the heat
Page 41
21
transfer coefficient is very low. One finds then, on the surface, a local heat transfer
coefficient which is s strong function of position. This gives rise to a crowding of
heat flux in certain spots as one gets close to the surface. Locally, this crowding
results in an additional temperature drop, the magnitude of which is a function of the
thermal conductivity of the bulk material. The way the heat transfer coefficient is
defined makes the dropwise condensation heat transfer coefficient then a function of
the thermal conductivity of the base material. An effect such as this can occur any
time the local heat transfer coefficient is not constant over the area.
Tanner et al [38] made measurements on vertical copper and stainless steel
surfaces using montanic acid as promoter. The surface temperature and heat flux
were found from observed temperature distributions in the plates. The maximum heat
flux obtained in the case of the stainless steel was about 30kW/m2. They report that
the steam side coefficient for the stainless steel plate was lower than that for the
copper plate by a factor of about 5 at the highest heat flux and by an even greater
amount lower heat fluxes.
J. W. Rose [32] indicated that for dropwise condensation of steam on tubes of
different materials, the vapour-side heat transfer coefficient depended strongly on the
tube material as well as on the wall thickness. It was suggested that this dependence
was due to the thermal properties of the tube material along the lines of a theoretical
treatment, which considered the heat transfer resistance arising from the non-
uniformity of heat flux near the condensing surface.
T. Tsuruta, H. Tanaka and S. Togashi [33] studied the effect of thermal
properties of the condenser material on dropwise condensation heat transfer. They
indicated in their experimental analysis that the heat transfer coefficient dependent
upon the surface thermal conductivity. They used quart glass, stainless steel and
carbon steel as the condenser material. The heat transfer coefficient for steam is
measured very carefully and precisely using thin film resistance thermometers
deposited on the condensing surface. All tests are conducted in a pressure range from
10 kPa down to 1 kPa to minimize the effect of nucleation site density on the heat
Page 42
22
transfer. In the experimental data it was shown that the heat transfer coefficients
agree satisfactorily with the predictions by the previously developed constriction
resistance theory. The copper surface yields the highest heat transfer coefficient and
it decreases markedly with the thermal conductivity in the order of carbon steel,
stainless steel, quart glass. And they considered that the constriction resistance theory
can describe fairly well the effect of the surface thermal conductivity on the heat
transfer coefficient. It is then confirmed that a decrease of the surface thermal
conductivity raises the constriction resistance and reduces the heat transfer
coefficient of dropwise condensation.
J. W. Rose [34] stated the importance of constriction resistance in dropwise
condensation. He indicated that the effective vapor-to-surface heat transfer
coefficient should depend on the conductivity of the surface material.
2.5 Effect of Noncondensable Gases
Noncondensable gases in the working fluid have some undesirable effects
during condensation. They reduce the heat transfer rate and make temperature
measurements quite difficult, since large fluctuations in the temperature of the
condensation surface takes place. The source of this gas is usually air leake in a
vacuum apparatus or dissolved gases in feed water.
Both filmwise and dropwise condensation are affected by non-condensable
gases present in the vapor, but it is the most significant for the case of dropwise
condensation. Noncondensable gases carried to the condenser surface by the
condensing vapor accumulate and cause a reduction in heat transfer coefficient by
reducing the vapor partial pressure. This reduction might be large enough to offset the
gains of dropwise condensation. Therefore, the removal of non-condensable gases
may become necessary to improve the heat transfer coefficient. On the other hand, in
certain applications such as the production of liquified petroleum gases, liquid
Page 43
23
nitrogen and liquid oxygen, condensation must take place in the presence of non-
condensables, because of the nature of the specific process.
The first study about the effect of non-condensable gases on heat transfer in
dropwise condensation was done by Othmer [35]. He concluded that with an increase
in the amount of non-condensable gases, in filmwise condensation of steam-air
mixtures on a horizontal tube, causes a significant decrease in heat transfer
coefficient. It was concluded that the non-condensable gases which reach the tube
surface remain there and become an obstacle to condensation.
Le Fevre and J. W. Rose [36] used a special venting technique after a series of
experiments to obviate the effects of the non-condensable gases. They removed
temperature fluctuations and also they got new steady temperatures which was higher
than the old peak temperatures. E. Citakoğlu and J. W. Rose [37] also studied effects
of local venting. They indicated that the errors, caused by such gas concentrations
remain in steam after prolonged boiling, may be eliminated by venting. However, care
must be taken regarding the position of the vent and the venting rate, so as to ensure
that the venting is sufficient to reduce the local gas concentration to an insignificant
level without, at the same time, causing errors through disturbance of the condensate.
In their several experiments Tanner et. al. found that the addition of nitrogen
or carbon dioxide to the inlet steam caused a marked reduction in heat transfer by
introducing a diffusional resistance but produced no lasting effect [25]. Oxygen, in
addition to creating a diffusional resistance, produced on copper surfaces a permanent
decrease from the development of areas of filmwise condensation, which was
attributed to the growth of an oxide layer. Removal of this layer by carbon dioxide
attack restored dropwise condensation [38].
Page 44
24
2.6 Promoting Dropwise Condensation
Because of high heat transfer coefficient, dropwise condensation is preferred
to filmwise condensation in industrial applications. However, it is very difficult to
obtain dropwise condensation since it does not continue long time and converts to
filmwise condensation after a while. So this can be achieved by promoting dropwise
condensation.
Dropwise condensation can be promoted by;
a) Applying a suitable chemical such as aloic acid or montan wax to the
condenser surface
b) Injecting nonwetting chemicals called promoters into the vapor which are
deposited on the condenser surface
c) Using a low-surface energy polymer or noble metal coating generally gold
Producing dropwise condensation by chemical promoters have a disadvantage
that it has a limited life. For providing continuous dropwise condensation, promoter
must be injected repeatedly into the condenser at certain intervals of time. Otherwise,
it eventually reverts to the filmwise mode as the promoter is washed away. Another
factor contributing to the failure of the promoter is the accumulation of fouling
matter that may be present in vapor; the promoter becomes submerged beneath the
fouling matter. Considerable excess of fatty acid in the system had to be avoided
because it would be gradually accumulate on the surface, causing poor dropwise
condensation. A large excess of oleic acid usually resulted in a gelatinous emulsion on
the surface which cut down the heat transmission greatly [12].
The use of permanent coatings of the noble metals only gold and silver have
been shown consistently to produce excellent dropwise condensation since the
surface energy of these noble metals is relatively high. Also gold has the ability to
attract and retain organics which render the surface hydrophobic. For this reason gold
is referred to as a self-promoter.
Page 45
25
Coating the condenser surface with a low surface energy polymer or a noble
metal is very important. If the coating is too thin, it wears away in a short period of
time. On the other hand if it is too thick the thermal resistance introduced
circumvents the gains of dropwise condensation. So, selecting the correct thickness is
very important for the effective use of this procedure.
Hurst and Olson [27] coated the copper surface with a promoter to insure
dropwise condensation in their experiments. Benzyl mercaptan was chosen for this
because it had contact angles near 90 deg when water vapor condensing, so that
condensate droplets were very nearly hemispherical.
P. Griffith and M. S. Lee [28] coated copper, zinc and stainless steel surfaces
with 0.005 in thick in order to secure identical chemical and mechanical surface
conditions. The reason for selecting gold as the plating material was first to eliminate
any adverse effects due to surface oxidation and second to have a minimum
temperature drop across its thickness.
J. W. Rose et. al. [39] coated several substrates with different polymer
coatings to increase steam side heat transfer coefficient. The results for these
coatings is shown in Table 2.2. It is clearly seen in Table 2.2 that Nedox produced
the best thermal performance. Nedox is a commercially available coating developed
by the General Magnaplate Corporation for use as a corrosion resistant mold release.
Fig 2.3 is an example of dropwise condensation on copper-nickel coated with No-
stick (left) and Nedox.
Page 46
26
Table 2.2 Steam side heat transfer coefficients [39]
Figure 2.3 Initial dropwise condensation on copper-nickel coated with No-Stick (left)
and Nedox [39]
J. W. Rose [32] made an experimental study to show the important of
promoting surface with a metal. In the experiment; brass, aluminum and stainless
steel tubes had been copper plated to a thickness of 9±1 μm. According to the results
Page 47
27
for the brass and copper plated brass surfaces were essentially the same, but the
observed heat fluxes for the aluminum and stainless steel tubes were substantially
higher when copper plated than when unplated. Figure 2.4 shows the results of this
experiment.
Figure 2.4 Dependence of heat flux on coolant velocity. Different symbols denote
different test runs. + x * z, unplated tubes; o ∆ □ ◊, copper plated tubes [32]
Zhang et al. [40,41] used various surface processing methods including
mechanical polish, ion plating, and ion plating and ion-beam mixing technology, to
modify the micro structure of the metal surface layer in order to form a amorphous-
state surface layer, which has low surface free energy. The Cu–Cr surface prepared by
Page 48
28
ion plating and ion-beam mixing combination technique maintained dropwise
condensation for 8500 h. Zhao et al. [42] studied the effects of different ion-implanted
elements and processing conditions on the dropwise condensation heat transfer
characteristics. It was found that the processing condition for different implanted
elements had considerable impact on the dropwise condensation heat transfer.
Song et al. [43] investigated condensation heat transfer characteristics of steam
on brass tubes having chromium surfaces prepared with three kinds of surface
processing techniques, i.e. ion plating, electroplating, and ion plating with ion-beam
mixing. The ion-plated tubes were sorted into three sets for experimental tests. The
first set of tubes was used to conduct experiments in the laboratory immediately after
the surface was treated. This kind of surface maintained dropwise condensation for 50
h. The tubes of the second set were installed in a large scale steam–water heat
exchanger in a power station which operated for one and half years. Then, one of the
tubes was taken from the heat exchanger and used in condensation experiments in the
laboratory. Film condensation only was obtained. The third set of tubes which had
been exposed to the air for about 2 years also failed to promote dropwise
condensation. The chromium surfaces prepared by ion plating technique were of very
high purity due to the vacuum operation for surface processing. The freshly treated
surface gives rise to dropwise condensation of steam due to the organic substances
adsorbed from the environment. One electroplated chromium surface maintained
dropwise condensation in the laboratory even after the surface was exposed to the air
for 1 year. As noted earlier by Finnicum and Westwater [44] dropwise condensation
on electroplated chromium surfaces is due to impurities from the surface processing
technique rather than the metal itself. The ion plating with ion-beam mixing
technology transforms the chromium surface layer into an amorphous state which
possesses low surface free energy, hence, resulting in dropwise condensation.
For metal organic compound films, the main problems concerned are the cost
for surface film preparation on an industrial scale and the durability of the dropwise
promoting surface. Zhao et al. [45-49] have successfully applied one of this kind of
surface film in a practical condenser in the integral heating system in Dalian Power
Page 49
29
Station in China. The surface film was prepared by the patented Actived Reactive-
Magnetron Sputtering Ion Plating technique [50,51]. The condenser is 800 mm of
diameter and 3500 mm high with 800 brass tubes each having 16 mm i.d. and 3000
mm long. An overall heat transfer coefficient between 6000 and 8000 W/m2K with
2-3 m/s cooling water velocity has been maintained since its installation October
1989, to the present. The dropwise condenser was used to replace the old film one,
which has 1600 brass tubes. The tubes used in the film condenser have the same
dimensions with the treated ones.
For liquids with high surface free energy (or surface tension) such as water
and ethanol, metal organic compound surface layers, which have good adhesion with
the substrate, would be expected to maintain dropwise condensation mode for a long
period of time to meet the requirements of industrial applications. However, for most
organic vapours, which are widely used in petrochemical processes, a polymer film on
the metal substrate may be the only approach for promoting dropwise condensation.
The difficulties for the polymer lie in its much lower thermal conductivity and poor
adhesion with metal substrates. The different thermal expansivities of metal and
polymer film, and the weak binding effect between the two materials lead to the
polymer film peeling after a period of time. In the laboratory test, dropwise
condensation of steam on a copper tube with 10mm o.d. and 100mm long, which was
coated with a PTFE polymer film has been maintained for about 1000 h so far [52].
Contact angle has sometimes been used to predetermine the condensation
mode on a specific solid surface. However, the contact angle measured at room
temperature and in equilibrium with an air environment has been proven not to be
useful for determining the wettability of systems where mass transfer takes place.
Ma [53] put forward a surface free energy criterion, i.e. the surface free
energy difference between the condensate liquid at the condensation temperature and
the solid surface, defined as sl−γ∆ ( l and s denote the surface free energies of liquid
and solid, respectively) to predict whether filmwise or dropwise condensation of a
Page 50
30
vapour will occur on a solid surface. In a conservative manner, the critical surface
free energy difference was considered to be 0.0333 J/m² according to an empirical
correlation between contact angle and surface free energy difference [54]. The
surface free energy of a solid depends only on its composition and chemical structure
and can be calculated from the measured contact angles at room temperature [55] for
low surface-free-energy solid surfaces like polymer films. Consequently, it is more
convenient and accurate to use the surface free energy rather than the contact angle
to predict condensation mode because the surface free energy criterion is not affected
by the measuring temperature of the contact angles. The new surface free energy
difference criteria and comparison with contact angle method are shown in Table 2.3.
Table 2.3 Condensation mode criteria [53]
Page 51
31
CHAPTER 3
MATHEMATICAL ANALYSIS
In this chapter, heat transfer in dropwise condensation is modeled including
the effect of substrate material. Differentials equations are obtained for temperature
distribution in the substrate and the droplet. Since analytical solution of the
differential equation system is quite complicated by the known methods, no attempt
is made to solve these equations analytically. Instead of solving the differential
equations of the drop and the substrate simultaneously, the diffusion equation of the
droplet is replaced by the equivalent thermal resistances and these resistances are
used as boundary condition for the diffusion equation for the substrate material.
Temperature distribution in the substrate material is obtained with finite difference
method and the calculations are performed for different substrate materials and for
various drop radii by using the FORTRAN computer program developed. Heat
transfer and heat flux are calculated through a single droplet with the use of
temperature distribution, then total heat transfer and flux is obtained by integrating
the heat transfer through a single drop for the entire drop population. Finally heat
transfer coefficient for dropwise condensation is determined by using the total heat
flux and average surface temperature of the drop to substrate interface.
Previous analytical and theoretical models of dropwise condensation used
expressions for the heat transfer through single droplets of specific sizes and then
the total heat transfer is determined by integrating over the distribution of sizes. Such
an analysis will also be followed here.
Page 52
32
Following assumptions are made in the analysis of this study :
• The vapor is at uniform temperature.
• Heat transfer from vapor to substrate is carried out only by
condensation.
• Substrate material, although it has a finite thickness in typical applications,
will be assumed to be a semi-infinite body since its thickness is considerably
large for the majority of the droplets on the surface of condensation.
• The area between the droplets can be considered as thermally insulated.
Because the small amount of heat transfer by convection is negligible
compared to the high rate of heat transfer on the surface of the drop.
Previous studies result in two important conclusions;
i. The majority of the heat transfer in a drop takes place within a narrow region
close to the perimeter of the drop, due to the very small thermal resistance existing
there.
ii. The majority of the heat transfer in dropwise condensation takes place through
droplets of very small sizes, because of their small thermal resistances and large
numbers.
Page 53
33
3.1 Mathematical Modeling of Dropwise Condensation with Substrate
Material Effect
3.1.1 Temperature Distribution
The most important phenomena in dropwise condensation is the heat
conduction through the droplet and the substrate which results in the heat transfer
and also the formation of the specially shaped isotherms in both substances.
Overall heat flux in dropwise condensation depends on the growth of a single
droplet and hence, it is necessary to find the droplet temperature distribution and also
the substrate material temperature distribution.
Figure 3.1 Droplet resting on a semi infinite substrate material
The governing differential equation for diffusion of heat in cylindrical
coordinates for substrate material:
Page 54
34
tsTCsq
zsT
skz
sTsk
rrsTrsk
rr ∂∂
=∗
+
∂
∂∂∂
+
∂∂
∂∂
+
∂
∂∂∂
ρφφ2
11 (3.1)
where:
Ts : Temperature distribution in the substrate
z : Axial direction (Figure 3.1)
ks : Thermal conductivity of substrate material, constant
sρ : Density of substrate
C : Specific heat
Since there is no heat generation *q is taken as zero.
ints TT ==0
inT : Initial temperature in the substrate material
With constant thermal conductivity, no heat generation and symmetry, Eq.
(3.1) is reduced to;
tsT
skC
zsT
rsT
rsT
r ∂∂
=∂
∂+
∂
∂+
∂∂ ρ
2
2
2
21 (3.2)
The governing differential equation in cylindrical coordinates for droplet;
tdTCdq
zdT
dkz
dTdk
rrdTrdk
rr ∂∂
=∗
+
∂
∂∂∂
+
∂
∂∂∂
+
∂
∂∂∂
ρφφ2
11 (3.3)
Page 55
35
where:
Td : Temperature distribution in the droplet
r : Radial direction (Figure 3.1)
kd : Thermal conductivity of droplet, constant
Since there is no heat generation *q is taken as zero.
itd TT ==0
With constant thermal conductivity, no heat generation, symmetry, steady
state , Eq. (3.3) is reduced to;
tT
kC
z
T
r
Tr
Tr
s
s
sss∂
∂=
∂
∂+
∂
∂+
∂∂ ρ
2
2
2
21 (3.4)
On the surface of the droplets heat conduction rate can be equated to the heat
convected at the interface.
( )vdsuredropsurfac
d TThn
Tk −=
∂∂
−
where n is the direction perpendicular to the drop surface.
dsurT : Surface temperature of droplet
Simultaneous solution of differential Equations (3.2) and (3.4) with the
boundary conditions gives the temperature distribution in the substrate and the
droplet.
Page 56
36
One of the major objects of this study is to determine the temperature
distribution in the droplet and substrate combination described and formulized
above. It is found in the literature that similar studies are made on this subject
previously. The studies of Sadhal and Plesset [31], Sadhal and Martin [62] on drop
conduction are explained in the previous chapter. However, since the conduction
analysis made by Sadhal and Plesset[31] and Sadhal and Martin[62] to calculate the
heat transfer through droplets is applicable only under limited conditions they are
not sufficient and appropriate to make heat flux calculations for dropwise
condensation in general.
In their studies Hurst and Olson [27] met with similar difficulties in solving
the differential equations that they obtained and they evade the difficulty by using
finite element method and they could obtain solutions only for limited cases.
For that reason, in this study temperature distribution in the substrate will be
obtained for the most general situation by numerical methods also.
3.1.2 Conduction Equations and Boundary Conditions Through a Single
Droplet
In the previous section, it was mentioned that analytical solution of the
differential equation system is complicated and difficult. Therefore, in this study
differential equation system is not solved. Instead of solving the differential equation
system, total resistance from the drop surface to the drop-substrate interface is taken
into consideration. That is, drop on the surface of substrate material removed then
resistance Ri associated with interfacial heat transfer coefficient on the droplet
surface and thermal resistance caused from drop conductance Rc, are placed instead
Fig (3.2). In this approach, it is assumed that heat flow lines in the drop cross section
becomes approximately a piece of circle which has the center on the edge of the
droplet. For that reason, in this approach heat flow lines becomes the torus surfaces
which are centered at the droplet edge and the heat flow takes place from the
interface between the drop and the vapor to the interface between the drop and the
Page 57
37
substrate. Total resistance can be found with the summation of these resistances.
Lastly, heat transfer through a single droplet can be obtained by the use of boundary
conditions obtained from the total resistance and conduction equation.
Figure 3.2 Thermal resistances associated with the drop
The major portion of heat transfer in dropwise condensation takes place near
the edge of the droplet. While Ri remains constant at the surface of the drop, Rc
decreases to the edge of the droplet. That is, there is much lower resistance to the
heat transfer near the edge of the droplet.
In recent, studies of the mathematical modeling of dropwise condensation the
surface temperature of the droplet is assumed to be equal to the temperature of the
surrounding vapor. In this model, since the surface temperature of the drop is taken
constant and interfacial thermal resistance is neglected calculation of the
temperature distribution in the drop becomes much simpler. Nevertheless, in this
approach the isotherm on the drop surface and the isotherm on the drop base which
Page 58
38
have different temperature values meet at the edge of the drop and at the edge of the
drop the anomaly of existence of two different temperatures takes place. To avoid
this anomaly the edge elements of the drop is not taken into consideration in heat
transfer calculations which results in a large error since most of the heat transfer
through the droplet takes place here. In the study, the conduction model for
individual droplet will also consider the thermal resistance due to the interfacial heat
transfer coefficient.
Schrage’s equation for interphase mass transfer under nonequilibrium
conditions is modified by means of the Kelvin-Helmholtz equation and Clasius-
Clapeyron relation.
Mass transfer through the interface is given under noneqilibrium conditions
by,
−
−
=2
1
**
21
21
21
22
i
i
v
v
T
P
T
Pgπγ
γω (3.5)
where
γ : Condensation coefficient
ω : Net rate of condensation per unit interfacial area
Pi** : Equilibrium pressure corresponding to the temperature of liquid-
vapor interface
Pv : Vapor pressure
Tv : Vapor temperature
Ti : Temperature of liquid vapor interface
Page 59
39
Using Kelvin-Helmotzs equation
i
l
i
r
rGTPP σν2ln *
**
= (3.6)
where
Pr** : Equilibrium pressure corresponding to the drop radius r
Pi* : Saturation pressure corresponding to temperature of liquid vapor
interface temperature Ti
σ : Surface tension
νl : Specific volume of liquid
Ti : Temperature of liquid vapor interface
G : Gas constant
By using the property of Pr**=Pi
** at interface, Eq. (3.5) becomes;
−
−
=2
1
212*
21
21
12
122
i
vrGT
v
i
v
v
T
TePP
T
Pg
i
lσν
πγγ
ω (3.7)
From the Clasius-Clapeyron relation;
−−=
v
i
i
fg
v
i
TT
GTh
PP 1ln *
*
(3.8)
Pv* : Saturation pressure corresponding to vapor temperature
If it is assumed that the vapor is saturated, Pv in Eq. (3.7) becomes the
saturation pressure Pv*.
Page 60
40
*vv PP = (3.9)
Substituting Eq. (3.9) and Eq. (3.8) into Eq. (3.7)
−
−
=
−−
21
21
12
21
21
12
122
i
vTT
GTh
rGT
v
v
T
TeeT
Pg
v
i
i
fg
i
lσν
πγγ
ω (3.10)
From Eq. (3.6) and Eq. (3.8)
i
l
v
i
i
fg
v
i
GTrTT
GTh
PP
**
* 21ln σν−=
−−= (3.11)
iv
fgi TT
hh
−=
ω (3.12)
Then, interface heat transfer coefficient becomes;
−
−−−
−−
=RR
TT
GTh
T
T
T
PgTT
hh
v
i
i
fg
i
v
v
v
iv
fgi
*
21
21
21
21
11exp12
122
πγγ
(3.13)
Using the approximation Tv3/2Ti=Tv
5/2, expanding the exponential function in
expression (3.13) and neglecting small terms, an expression for interfacial heat
transfer coefficient becomes;
−
−
=RR
TG
Phh
v
vfgi
*
25
23
221
121
22
πγγ
(3.14)
Page 61
41
ThTR
lfg
sat
∆=
ρσ2*
where
ρl : Liquid density
∆T : Difference between vapor and interface temperature
R* : Critical radius for formation of the droplet
R : The radius of curvature of the interface at the point of interest
Eq.(3.14) has been used in several drop conduction models. In this equation
last term accounts for the effect of the curvature of the interface. In this study it can
be neglected.
The heat transfer is determined by the effects of curvature, interfacial mass
transfer between liquid and vapor phases, conduction through the drop,
noncondensibles in the vapor and non-uniform conduction in the material forming
the condensing surface. The effects of noncondensibles, non-uniform conduction in
the material and effects of curvature have been omitted in this study.
In this way, the flow of heat from vapor to solid is controlled by two
resistances, namely the interfacial resistance and conduction resistance through the
drop. These resistances is shown in Figure 3.2.
Thermal resistance associated with the interfacial heat transfer coefficient for
a hemispherical drop can be expressed as;
ii h
R 1= (3.15)
Page 62
42
This is in series with the thermal resistance of the droplet. Thermal resistance
of the condensate which is directly proportional to the length of heat flow line and
inversely proportional to the thermal conductivity of condensate.
Figure 3.3 Physical model of thermal resistance Rc
kRc
l= (3.16)
( )βxr −=l (3.17)
Page 63
43
αθβ −=
where
θ : contact angle between drop and surface
α=BPA ˆ
Angle of arc AP is α2
So the angle of POA ˆ become equal to the angle of arc by the geometrical
property.
α2ˆ =POA
The length of AP is equal to KP. In the triangle POA ˆ line OM, which is
drawn perpendicular to the line AP, become bisector and intersect AP into the two
equal pieces.
α== POMMOA ˆˆ
−
=2
xrAM
In the triangle PMO ˆ ;
R
xr
RAM
−
== 2sinα
Page 64
44
−
= −
R
xr2sin 1α
90=+θζ ζ=OPD ˆ So; θ=POD ˆ
In the triangle POD ˆ ;
Rr
=θsin ⇒ θsin
rR =
−
=
−
= −−
rxr
r
xrθ
θ
αsin
2sin
sin
2sin 11 (3.18)
( )[ ]αθ −
−=
kxrRc (3.19)
Substituting Eq. (3.18) into the Eq. (3.19)
( )
−
−−
=r
xrak
xrRcθ
θsin
2sin (3.20)
Modifying Rc according to nondimensional length;
rxr =~ (3.21)
rr
=1 (3.22)
r~ : Nondimensional drop radius
Page 65
45
Substituting Eq. (3.21) and Eq. (3.22) into the Eq. (3.17) and Eq. (3.18)
( ) ( )ββ rrrrr ~1~1 −=−=l
−
=
−
=
−
= −−− θθ
θ
α sin2
~1sinsin2
~1sin
sin12
~1
sin 111 rr
rrr
rrr
So Rc becomes;
( ) ( )( )
−−
−=
θθ
sin2
~1sin~1 ra
krrRc (3.23)
Total thermal resistance can be expressed as;
cit RRR +=
( ) ( )( )
−−
−+=
θθ
sin2
~1sin~11 ra
krr
hR
it (3.24)
Overall heat transfer coefficient which is equal to the inverse of the total
thermal resistance becomes;
tRU 1
=
Page 66
46
( ) ( )( )
−−
−+
=
θθ
sin2
~1sin~11
1
rak
rrh
U
di
(3.25)
The transformed form of the differential equation and the boundary condition
system which is obtained after replacing the droplet by the thermal resistances is
shown in Figure 3.4. In the figure r and Ts represent the radius and condenser surface
temperature, respectively.
Figure 3.4 Overall heat transfer coefficient under the droplet and bare area
Page 67
47
Differential equation for the substrate material is;
tT
kC
zT
rT
rT
rs
s
sss
∂∂
=∂∂
+∂∂
+∂∂ ρ
2
2
2
21
At steady state, differential equation reduces to;
012
2
2
2
=∂∂
+∂∂
+∂∂
zT
rT
rT
rsss
(3.26)
On the surface of the substrate material heat conduction rate can be equated to
heat convection represented by the overall heat transfer coefficient U.
( )vzsz
s TTUzTk −=
∂∂
− ==
00
(3.27)
where
( ) ( )( )
−−
−+
=
θθ
sin2
~1sin~11
1
rak
rrh
U
di
for rr ≤ (3.28)
0=U for rr > (3.29)
r is the radius of the drop
At large distance in z direction in the substrate;
0TTzs =
∞→ (3.30)
Page 68
48
After obtaining the differential equation and the boundary conditions, these
equations and boundary conditions are written in nondimensional form as follows
The nondimensionalized differential equation;
012
2
2
22 =
∂∂
+∂∂
+∂∂
zT
rT
rT
rr sss
01
2
2
2
2
2
2
=
∂
∂+
∂
∂+
∂
∂
rzT
rrT
rr
T
rr
sss
0~~~~1
2
2
2
2
=∂∂
+∂∂
+∂∂
zT
rT
rT
rsss
0~~~~11
2
2
2
2
0
0=
∂∂
+∂∂
+∂∂
−− z
TrT
rT
rTTTT
sss
v
0~
~
~
~
~
~
~1
2
2
2
2
=∂∂
+∂∂
+∂∂
zT
rT
rT
rsss (3.31)
where
sT~ : nondimensional surface temperature
Page 69
49
Nondimensionalized boundary condition at condenser surface;
( ) ( )
( )( )vzs
di
zs TT
rak
rrh
zTk −
−−
−+
=∂∂
−=
=0
0
sin2
~1sin~11
1
θθ
(3.32)
( ) ( )
( )( )s
di
s
s Tra
krr
hrk
rz
T ~1
sin2
~1sin~11
11~−
−−
−+
=
∂
∂
θθ
( ) ( )( )
( )0~
0~
~1
sin2
~1sin~1
1~
~
==
−
−−−+
×
=∂∂
zs
d
s
i
sz
s T
kkrar
hrkz
T
θθ
(3.33)
Defining nondimensional parameters ds kkA = and ( )rhkB is= in the
Eq.(3.33);
Page 70
50
( ) ( )( )
( )0~
0~
~1
sin2
~1sin~1
1~
~
==
−
−−−+
=∂∂
zsz
s T
ArarBzT
θθ
(3.34)
Nondimensional overall heat transfer coefficient is obtained as follows;
( ) ( )( )
−−−+
=
θθ
sin2
~1sin~1
1
rarkk
rhkk
rU
d
s
i
ss
(3.35)
Nondimensional overall heat transfer coefficient is called as nondimensional
drop resistance parameter Fr.
( ) ( )( )
−−−+
=
θθ
sin2
~1sin~1
1
rarkk
rhk
F
d
s
i
s
r (3.36)
or
( ) ( )( ) ArarB
Fr
−−−+
=
θθ
sin2
~1sin~1
1 (3.37)
Consequently the problem is reduced to the following form;
0~
~
~
~
~
~
~1
2
2
2
2
=∂∂
+∂∂
+∂∂
zT
rT
rT
rsss
Page 71
51
with the boundary conditions;
0~~ =
∞→zsT
( ) ( )( )
( )0~
0~
~1
sin2
~1sin~1
1~
~
==
−
−−−+
=∂∂
zs
z
s T
ArarBzT
θθ
or
( )0~
0~
~1~
~
==
−=∂∂
zsr
z
s TFzT
(3.38)
with the boundary conditions;
( ) ( )( ) ArarB
Fr
−−−+
=
θθ
sin2
~1sin~1
1 for 1~ ≤r (3.39)
0=rF for 1~ >r (3.40)
3.1.3 Average Temperature Under the Droplet
Temperature distribution in the substrate can be obtained by solving the
differential equation with its boundary conditions given in the previous section.
Then, the average nondimensional temperature under the droplet is obtained as
follows.
Page 72
52
∫=
=
=1~
0~2
~~2~~1~ r
rsav rdrπT
rπT (3.41)
Fraction of area occupied by droplets is given by;
( )n
co rrrf
−=
max
1
( )[ ]
−=
n
co rrdrfd
max1
max
1
max
)(rdr
rrnrdf
n
co
−
= (3.42)
Consequently average nondimensional condenser surface temperature in
dropwise condensation is obtained by integrating average nondimensional
temperature of drop to substrate interface over the size distribution of the drops in
dropwise condensation.
∫=max
min
~~ r
rcoavad dfTT (3.43)
3.1.4 Heat Transfer and Heat Flux
Heat transfer through a single droplet is given by;
∫=
= =∂∂
−=rr
r z
rdrzTkQ
0 0
2π (3.44)
Page 73
53
or
( )∫=
==
−=rr
rzsv rdrTTUQ
00
2π (3.45)
Nondimensional heat transfer is obtained as follows;
( )Tkr
rdrrTTUr
rQ
Tk s
rr
rzsv
s ∆
−=
∆ ∫=
==
121
00 π
( )∫=
=
=
∆
−=
∆
rr
r
zsv
ss rrd
rr
TTT
kUr
TrkQ
0
0 2π
( )∫=
==
−=1~
0~ 0~~~2~1
r
rzsrnd rdrTFQ π (3.46)
and
TrkQQ
snd ∆
=
where 0TTT v −=∆
Total heat transfer is obtained by integrating heat transfer through the droplet
over the size distributions of the drops in dropwise condensation.
∫=max
min
r
rcodc QdfQ (3.47)
or
∫−
=
max
min max
1
max
r
r
n
dc rdr
rrQnQ (3.48)
Page 74
54
Then, total heat flux becomes;
∫−
×=
max
min max
1
max2
"r
r
n
dcrdr
rrn
rQQ
π (3.49)
3.2 Finite Difference Solution of Dropwise Condensation with Substrate
Material Effect
3.2.1 Temperature Distribution in the Substrate and Under the Droplet
In order to obtain the temperature distribution in the substrate under the
droplet a computer code (FORTRAN program), which is given in Appendix A, is
used. In the program thermal conductivity of the substrate material and the radius of
the droplet is chosen and entered as the main data in addition to other thermal and
geometric parameters. Nodal points for temperatures nodes in the substrate and under
the droplet is shown in Figure 3.5. In a drop profile substrate material is divided into
1830 nodes. Nondimensional temperatures are equal to zero in the substrate and
unity in the condensing vapor. Consequently, nondimensional temperature
distribution in the substrate under the newly formed small droplets and the larger
droplets that forms as a result of coalescences should be zero. For that reason, the
nodal points that represents the initial nondimensional temperature distribution in
the substrate are given the value zero and by using the time marching technique
steady state temperature in the droplets are obtained. Nodal equations are obtained by
discretizing the substrate under the droplet and applying the conservation of the
thermal energy for each node. Equations are differed according to special nodes (4,
5, 6, 7, 8, 9, 10, 11, 12 ,13). Substrate material is divided into 61 section on radial (r)
and 30 section on axial (z) direction. For all conditions nondimensional drop radius
is taken as unity which is represented by node 31.
Page 75
55
In the program there are two nondimensional parameter that effect
temperature distribution and heat transfer. These parameters are as shown before A
and B.
d
s
kkA = (3.50)
rhk
Bi
s= (3.51)
Page 76
56
Figure 3.5 Temperature nodes under the drop and in the substrate
Page 77
57
Nodal temperature equations for the interior nodes (i=2,60 and j=2,29):
−
+−
+−= −+−+
2
~~
2210 11
21
212 jjiiii
s
zzrrrrrrrrr
dtkCpA ρ (3.52)
( ) ( )jj
iiii
jiji zz
rrrrrrrr
TTBG ~~22
1
21
21
1,, −
+−
+
−=+
−+
+ (3.53)
( )( )
1
111
,1,
~~2
−
−+−
− −
−
+
−=ii
jjii
jiji rrrr
zzrrrr
TTBB (3.54)
( )( )
ii
jjii
jiji rrrr
zzrrrr
TTBD−
−
+
−=+
−++
+1
111
,1,
~~2
(3.55)
( ) ( )1
21
21
1,, ~~22
−
−+
− −
+−
+
−=jj
iiii
jiji zz
rrrrrrrr
TTBK (3.56)
( )10,, A
BDBBBGBKTTN jiji+++
+= (3.57)
jiTN , is new temperature of node i, j after time interval dt.
irr : Notation used in the computer program for nondimensional radial
direction.
Page 78
58
jz~ : Notation used in the computer program for nondimensional axial
direction.
BG, BB, BD, BK are defined as south, west, east and north directions,
respectively. BB and BK are set to be 0 for the special nodes 5, 9, 10 and 7, 8. These
points are considered as thermally insulated.
Nodal temperature equations for the node 4 (i=2,30 and j=1):
−
+−
+−= +−+
2
~~
2210 1
21
212 jjiiii
s
zzrrrrrrrrr
dtkCpA ρ (3.58)
( ) ( )jj
iiii
jiji zz
rrrrrrrr
TTBG ~~22
1
21
21
1,, −
+−
+
−=+
−+
+ (3.59)
( )( )
1
11
,1,
~~2
−
+−
− −
−
+
−=ii
jjii
jiji rrrr
zzrrrr
TTBB (3.60)
( )( )
ii
jjii
jiji rrrr
zzrrrr
TTBD−
−
+
−=+
++
+1
11
,1,
~~2
(3.61)
( ) riiii
ji Frrrrrrrr
TBK
+−
+−= −+
21
21
, 221 (3.62)
Nodal temperature equations for the node 5 (i=1 and j=1):
Page 79
59
−
+−= ++
2
~~
210 1
212 jjii
s
zzrrrrr
dtkCpA ρ (3.63)
( ) ( )jj
ii
jiji zz
rrrr
TTBG ~~2
1
21
1,, −
+
−=+
+
+ (3.64)
0=BB (3.65)
( )( )
ii
jjii
jiji rrrr
zzrrrr
TTBD−
−
+
−=+
++
+1
11
,1,
~~2
(3.66)
( ) rii
ji Frrrr
TBK2
1, 2
1
+−= + (3.67)
Nodal temperature equations for the node 6 (i=31 and j=1):
A10, BG, BB, BD points are same as Eq. (3.58), (3.59), (3.60), (3.61),
respectively.
( )222
12
12
1,
riiiiji
FrrrrrrrrTBK
+−
+−= −+ (3.67)
The most important phenomena in dropwise condensation is the heat
conduction through the droplet. Temperature distribution in the surface under the
droplet plays important role in the heat transfer through a droplet.
Thermal resistance of condensate is getting smaller as one approaches to the
edge of the droplet. Temperature of the substrate under the droplet changes
drastically as one gets near the edge of the droplet. Consequently, temperature nodes
Page 80
60
close to the droplet edge should be chosen very close to each other in the radial and
axial direction.
In order to avoid sudden temperature changes and to get more accurate
results; an exponential variation of the distance between nodal points such as Eq.
(3.68) is employed. With this equation the intervals of these nodes become smaller
and getting very close from center of droplet to the edge in the radial direction. So,
nondimensional radial distance between i=1 an i=29 is found by;
( )[ ]i
i err −−−= 1303070113.0)0001.0(1 (3.68)
To large distances from the edge of the droplet a gradually increasing
increments in the nondimensional radial direction is targeted. Between i=32 and
i=60;
( ) ( )[ ]1303070113.00001.01 −−+= ii err (3.69)
Just like in the radial direction, in the axial direction the intervals are taken
closer. As one gets close to the edge of the droplet between j=1 and j=30
nondimensional axial jz~ distances is obtained according to the equation below;
( ) ( )[ ]14111759.00001.0~ −= jj ez (3.70)
The values of nondimensional radial distance rri in the radial direction and
nondimensional axial distance jz~ in the axial direction are given in Appendix B.
In the previous section drop resistance parameter is defined in terms of
nondimensional parameters A and B as follows;
Page 81
61
( ) ( )( ) ArarB
Fr
−−−+
=
θθ
sin2
~1sin~1
1 (3.71)
In the model nodes 4, 5, 6 which are the nodes at the interface between the
drop and the substrate play important role in the heat transfer. In order to obtain the
heat transfer through the droplet, conservation of energy principle is used. Equations
are written as:
( )( ) ( )
( )
−
+
−
+
−
−−−+
+
−
+
−
=−+−+
−+
2
~~
22
sin21sin1
122
1
12
12
12
21
21
,
,,jjiiii
s
d
sii
i
s
iiiiji
jijizzrrrrrrrrr
dtkCp
kkrrarr
rhk
rrrrrrrrT
TTNρ
θθ
(3.72)
Outer and inner nondimensional radius:
+
= +
21* ii
orrrr
r (3.73)
+= −
21* ii
irrrr
r (3.74)
Substituting Eq. (3.74) and Eq. (3.73) into the Eq. (3.72):
( )[ ]( ) ( )
( )( )
−−
−−−+
−−
=−+
2
~~sin
21
sin1
11
12*2*2
2*2*,
,,jj
ios
sii
i
s
ioji
jiji zzrrr
dtkCp
kkrr
arrrh
krrT
TTNρ
θθ
(3.75)
Page 82
62
The steps between the equations are presented in Appendix C.
Eq. (3.76), (3.77), (3.78) defines Qnum (heat transfer calculated by numerical
methods which is nondimensional), Qnd (nondimensional heat transfer), Q
(dimensional heat transfer), respectively.
( ) ( )2*2*1,1 ioirnum rrTFQ −−= π (3.76)
kk
QQ snumnd = (3.77)
TrkQQ snum ∆= (3.78)
The heat flux at the base of the droplet is obtained dividing the heat transfer
through the drop by drop base area.
2''
rQQ
π= (3.79)
3.2.2 Average Temperature Under the Droplet
In order to find average nondimensional temperature under the droplet;
nondimensional temperature of each node is multiplied with area of each segment
and divided into the total droplet area. Consequently the average nondimensional
temperature under the droplet can be expressed as:
( )2
3122
222
12
230
231
21,31
212
2232
1,2
2122
1,1
...
...222
rrrrrrrrr
rrrrrTrrrrrrrrrTrrrrrTTav πππ
πππ
+++
−++
+
−
+
+
+
=
(3.80)
Page 83
63
∑
∑
=
== 31
1
31
11,
ii
iii
av
A
ATT (3.81)
Eq. (3.81) gives the average nondimensional temperature of the single
droplet. In order to find the dropwise condensation average nondimensional
temperature (Tad), average nondimensional temperature of drop to substrate interface
integrated over the size distribution of the drops.
+
+
++
+
+
+
+
+
=22
...2222
99991000099991000012120101 rrTrrdfrrTrrdfrrTrrdfT avcoavcoavcoad
(3.82)
3.2.3 Total Heat Transfer and Heat Flux in Dropwise Condensation
Heat transfer through a single droplet is first calculated as explained in the
previous section then total heat transfer is obtained by integrating the heat transfer
through the entire drop population in dropwise condensation.
For the numerical calculation the complete radius interval of the dropsize
distribution from rmin to rmax is divided in m separate intervals to obtain the
incremental heat transfer values in dfco. The fraction of area occupied by droplets in
the size range dr becomes, from Eq. (2.1):
( )[ ]
−=
n
co rrdrfd
max1
Page 84
64
max
1
max
)(rdr
rrnrdf
n
co
−
= (3.83)
m : The number of divisions between rmin to rmax (taken as 10000):
minmax rkr m=
mrrk
min
max= (3.84)
minrkr ii = (3.85)
i : 1, 2, 3…10000
With such a scheme the discrete value of the drop radius would be as follows:
i = 0 min0 rr =
i = 1 min1 krr =
i = 2 min2
2 rkr =
.
.
i = 10000 maxmin10000
10000 rrkr ==
From Eq. (3.83), area increments for droplets, dfco can be expressed as:
Page 85
65
( )
max
1
1
max
1
1 2)2
(r
rrr
rr
nrrdf ii
nii
iico
−
−
−
− −
+
=+
(3.86)
Employing Eq. (3.86), the fraction of area covered by droplets on the
condenser surface area at each increment, dfco(ri):
( )max
01
1
max
01
01 2)2
(r
rrr
rr
nrrdf
n
co−
+
=+
−
( )max
12
1
max
12
12 2)2
(r
rrr
rr
nrrdf
n
co−
+
=+
−
.
.
( )max
999910000
1
max
999910000
999910000 2)2
(r
rrr
rr
nrrdf
n
co−
+
=+
−
Employing Eq. (3.86) and individual heat transfer through the droplets, the
total dropwise condensation heat transfer (Qdc) is written as:
+
+
++
+
+
+
+
+
=22
...2222
99991000099991000012120101 rrq
rrdfrrqrrdf
rrq
rrdfQ cococodc
(3.87)
Page 86
66
The total dropwise condensation heat flux ( dcQ '' ) then becomes:
2999910000
999910000999910000
212
1212
201
0101
''
2
22...
2
22
2
22
+
+
+
++
+
+
+
+
+
+
+
=rr
rrq
rrdf
rr
rrq
rrdf
rr
rrq
rrdf
Qcococo
dc
πππ
(3.88)
3.2.4 Dropwise Condensation Heat Transfer Coefficient
Since total dropwise condensation heat flux and average dropwise
condensation temperature has been calculated, so dropwise condensation heat
transfer coefficient can be calculated by using Eq. (3.89):
( ) 1001
''
×−=
ad
dcdc T
Qh (3.89)
Page 87
67
CHAPTER 4
RESULTS AND DISCUSSIONS
Dropwise condensation on different substrate materials has been investigated
mathematically and numerically in the previous chapter. Temperature distributions,
heat transfer, heat flux and heat transfer coefficient are studied by means of the
computer program with respect to the effect of the substrate material and drop radius.
These results are described and represented graphically.
Results are also compared with results in the literature.
4.1 Computation Results for the Temperature Distribution Under the
Droplet and in the Substrate
In the previous chapter differential equations are obtained for temperature
distribution but, analytical solution of these differential equations are quite
complicated. Thus these equations are not solved. In order to obtain the temperature
distribution under the droplet and substrate material, the FORTRAN program which
is developed is used. Program code follows the following steps.
Although condensing droplet substance can be taken as any liquid in the
computer program developed in this study, taking the majority of the condenser
applications into account, water is taken as the droplet substance and in calculating
Page 88
68
the interfacial heat transfer coefficient hi and in evaluating other thermal properties
water thermal properties at average medium temperature are taken as the basis.
Water thermal conductivity (kd) is taken as 0.645 W/m2K. In the study parameter
‘A’, which determine substrate thermal conductivity (ks), is taken as 0.01, 0.1, 1, 10,
20, 50, 70, 100. By using Eq. (3.28) substrate thermal conductivity is calculated. In
the second step, radius of droplet is determined according to the other dimensionless
parameter ‘B’ with Eq. (3.29). In the study parameter ‘B’ is taken as 0.001, 0.0013,
0.0016, 0.002, 0.004, 0.006, 0.008, 0.01, 0.1, 1, 10, 100. Total temperature difference
is taken as the largest possible for the condensation of water on a surface. Thus,
temperature of the vapor and droplet is taken as 100 0C (373 K) and the temperature
of the substrate is taken as 0 0C (273 K) at infinitely large distances from the surface
of condensation. In the FORTRAN program developed for the temperature of
substrate and for the temperature of vapor, nondimensional values 0 and 1, are used
respectively. So the temperature values are represented as nondimensional in the
tables and graphs in the study.
4.1.1 Temperature Distribution Under a Single Droplet and Substrate
Material
Temperature distribution is dependent to substrate thermal conductivity (A)
and drop radius (B). Variation of temperature distribution at the 0~ =z and 51099.9~ −= xz for the B=0.001 and A=0.01, 0.1, 1, 10, 100; is shown in Figure 4.1,
Figure 4.2 and Figure 4.3, Figure 4.4, respectively.
The data used in Figure 4.1 and Figure 4.3 is given in Appendix E.1 and E.2,
respectively.
Page 89
69
0,0
0,1
0,2
0,3
0,4
0,5
0,6
0,7
0,8
0 0,2 0,4 0,6 0,8 1 1,2 1,4 1,6 1,8
Nondimensional Radial Distance
Non
dim
ensi
onal
Con
dens
er S
urfa
ce T
empe
retu
re A=0,01
A=0,1
A=1
A=10
A=100
Figure 4.1 Variation of nondimensional temperature as a function of
nondimensional radial distance at nondimensional axial distance 0~ =z for B=0.001
Page 90
70
0,00
0,05
0,10
0,15
0,20
0,25
0,30
0,35
0,40
0,45
0,50
0,55
0,60
0,65
0,70
0,75
0,80
0,99 0,995 1 1,005 1,01
Nondimensional Radial Distance
Non
dim
ensi
onal
Con
dens
er S
urfa
ce T
empe
retu
re A=0,01
A=0,1
A=1
A=10
A=100
Figure 4.2 Variation of nondimensional temperature as a function of nondimensional
radial distance at nondimensional axial distance 0~ =z for B=0.001
Page 91
71
0
0,1
0,2
0,3
0,4
0,5
0,6
0,7
0,8
0 0,2 0,4 0,6 0,8 1 1,2 1,4 1,6 1,8
Nondimensional Radial Distance
Non
dim
ensi
onal
Con
dens
er S
urfa
ce T
empe
retu
re A=0,01
A=0,1
A=1
A=10
A=100
Figure 4.3 Variation of nondimensional temperature as a function of nondimensional
radial distance at nondimensional axial distance 51099.9~ −= xz for B=0.001
Page 92
72
0
0,1
0,2
0,3
0,4
0,5
0,6
0,7
0,8
0,99 0,995 1 1,005 1,01
Nondimensional Radial Distance
Non
dim
ensi
onal
Con
dens
er S
urfa
ce T
empe
retu
reA=0,01
A=0,1
A=1
A=10
A=100
Figure 4.4 Variation of nondimensional temperature as a function of nondimensional
radial distance at nondimensional axial distance 51099.9~ −= xz for B=0.001
It is seen in Figure 4.1 and Figure 4.3 that drop to substrate interface as
temperatures increase from center to the edge of the droplet. Hurst and Olson [27]
also obtained similar results in their experimental study. It is seen also that drop to
surface interface temperatures decrease as the substrate thermal conductivity (A)
increase.
As it is seen in Figure 4.1 substrate thermal conductivity increases as A
increases and consequently substrate thermal resistance decreases. As a consequence
of the decrease of the thermal resistance of the substrate, drop to substrate interface
Page 93
73
temperature decreases. For smaller values of A (A=0.01), nondimensional drop to
substrate interface temperature increases up to 0.8 which results in a considerable
decrease in the temperature potential between the vapor and the condenser surface
and as a result heat flux decreases considerably. In other words, as the thermal
conductivity of the substrate material decreases, since the heat transfer through the
droplet decreases heat transfer and the heat transfer coefficient in dropwise
condensation should decrease.
On the other hand (as it is seen in Fig E.1 and Fig. E.3) as the droplet size
decrease with an increase in B, drop to substrate interface temperature decrease
considerably and for B=0.01, the maximum nondimensional drop to substrate
interface temperature becomes 0.26.
In Figure 4.2 and Figure 4.4 the detailed variation of temperature at the edge
of droplet is shown. Another important observation that can be inferred from the
examination of the Figure 4.2 and Figure 4.4 is that the maximum drop to substrate
interface temperature does not occur just at the edge of the droplet but rather inside
the base area of the droplet and that as the substrate thermal conductivity decreases
the maximum substrate surface temperature moves toward the center of the droplet.
An interesting observation that can also be extract from Figure 4.1 is that just
at the edge of the droplet a sharp change in the substrate surface temperature takes
place. In addition to that on the insulated surface of the substrate beyond the edge of
the droplet away from the droplet a considerable increase in the temperature is
observed. As one goes away from the edge of the droplet nondimensional substrate
surface temperature gradually drops to zero.
From the examination of the Figure E.1 and Figure E.3 it can be seen that as
the value of the parameter B changes (as the drop size changes) no significant change
at the nondimensional location of the maximum drop to substrate interface
temperature is discerned.
Page 94
74
Variation of temperature distribution at the drop to surface interface for
B=0.01, 0.1, 1, 10, 100 is given in Appendix E.3, E.4, E.5, E.6, E.7, respectively.
4.1.2 Average Temperature
After surface temperature under a single droplet is obtained, these
temperatures are multiplied with area of each segment and divided by total droplet
base area to obtain the weighted average surface temperature with respect to the area.
This gives the surface average temperature under the droplet as given by Eq. (3.81).
Variation of average temperature with droplet radius for A=100 is shown in Figure
4.5 and Figure 4.6.
0
1
2
3
4
5
6
0 0,5 1 1,5 2 2,5 3 3,5 4 4,5
r (m)x10-3
Aver
age
Non
dim
ensi
onal
Con
dens
er S
urfa
ce T
empe
ratu
re
T avx
10-4
A=100
Figure 4.5 Variation of average nondimensional condenser surface temperature at the
drop base area as a function of drop radius for A=100
Page 95
75
0
1
2
3
4
5
6
0 10 20 30 40 50 60 70 80 90 100
B
Aver
age
Non
dim
ensi
onal
Con
dens
er S
urfa
ce T
empe
ratu
re
T avx
10-4
A=100
Figure 4.6 Variation of average nondimensional condenser surface temperature with
B
It can be seen from Figure 4.5 and Figure 4.6 that average temperature under
large droplets is higher than smaller ones. That is, as the radius of droplet gets
smaller, surface average temperature decreases.
The data of average temperature at A=100 is given in Appendix E.8. Also
variation of average temperature for A=1 and A=0.01 is given in Appendix E.9,
E.10, respectively.
Variation of average nondimensional condenser surface temperature with
respect to A is shown in Figure 4.7. It is deduced from the Figure 4.7 that surface
Page 96
76
average temperature under the droplet decreases as substrate thermal conductivity
(A) increases.
0
0,5
1
1,5
2
2,5
3
0 1 2 3 4 5
A
Aver
age
Non
dim
ensi
onal
Con
dens
er S
urfa
ce T
empe
ratu
re
T ave
x10-1
B=0,001 B=0,1 B=10
Figure 4.7 Variation of average nondimensional condenser surface temperature with
A
Average temperature at the surface at the substrate as a function of substrate
thermal conductance for the entire drop population is obtained by using Eq. (3.82).
Variation of this average temperature is shown in Table 4.1 and Figure 4.8,
respectively.
Page 97
77
Table 4.1 Dropwise condensation average nondimensional temperature data
A Tad 0.01 2.03588E-01
0.1 7.72344E-02
1 1.95700E-02
10 3.27861E-03
20 1.74879E-03
50 7.38096E-04
70 5.32888E-04
100 3.76354E-04
0,00
0,02
0,04
0,06
0,08
0,10
0,12
0,14
0,16
0,18
0,20
0,22
0 0,5 1 1,5 2 2,5 3 3,5 4 4,5 5
A
Dro
pwis
e C
onde
nsat
ion
Aver
age
Non
dim
ensi
onal
Con
ense
r Sur
face
Te
mpe
ratu
re T
ad
Figure 4.8 Variation of dropwise condensation average nondimensional temperature
with A
Page 98
78
It can be seen from Figure 4.8 that substrate surface average temperature for
entire drop population decreases, as A (substrate thermal conductivity) increases.
4.2 Computation Results for the Heat Transfer in Dropwise Condensation
Including the Substrate Effect
In the previous section temperatures under the droplet and in the substrate are
obtained. In this section heat transfer and heat flux results for a single droplet and for
entire drop population on the surface using the dropsize distribution are given. By
using Eq. (3.76), Eq. (3.77), Eq. (3.78); Qnum, Qnd (nondimensional heat transfer), Q
(dimensional heat transfer) is obtained for a single droplet, respectively. The bare
spaces between the drops are considered completely inactive. This model assumes
that the influence on a droplet of a neighboring droplets is negligible.
The maximum drop size that should be taken in the calculations should
obviously be the departure size of the droplets. Nevertheless, the departure size of the
droplets in dropwise condensation depends on various factors like pressure and
temperature of the surrounding as well as body forces and surface roughness.
Measurements show that on metal surfaces, the departure radius of water droplet is
slightly larger than 2 mm. Therefore, in this study the maximum drop radius is taken
as 2 mm and minimum drop radius is taken as 2.6x10⁻⁶ m for the dropsize
distribution. The contact angle is taken as 650.
Page 99
79
4.2.1 Effect of Droplet Radius on Heat Transfer and Heat Flux for a Single
Droplet
Variation of heat transfer and heat flux with radius for A=1 is shown in
Figure 4.9 and Figure 4.10, respectively.
0,00
0,01
0,02
0,03
0,04
0,05
0,06
0,07
0,08
0 0,5 1 1,5 2 2,5 3 3,5 4 4,5
r (m)x10-5
Q (W
)
A=1
Figure 4.9 Variation of heat transfer with drop radius for A=1
Page 100
80
0
20
40
60
80
100
120
140
160
0 0,5 1 1,5 2 2,5 3 3,5 4 4,5
r (m)x10-5
Q''
(W/m
²)x10
+7A=1
Figure 4.10 Variation of heat flux with drop radius for A=1
It is seen from Figure 4.9 that while drop radius becomes smaller, heat
transfer decreases. On the other hand, it is seen from Figure 4.10 that as drop radius
becomes smaller, heat flux increases.
The data and results of heat transfer and heat flux is given in Appendix F.1.
Variation of heat transfer and heat flux with radius for A=0.01 and A=100 is shown
in Appendix F.2 and Appendix F.3, respectively.
4.2.2 Effect of Substrate Material on Heat Transfer and Heat Flux
In dropwise condensation thermal conductivity of the substrate has an
important effect on the rate of heat transfer. Large number of theoretical, analytical
and experimental study were made to clarify this effect by researches. The results of
these studies indicate that both heat transfer and heat transfer coefficient increase
with the surface thermal conductivity. By using Eq. (3.77) and Eq. (3.78)
Page 101
81
nondimensional heat transfer (Qnd) and dimensional heat transfer (Q) is obtained for
single droplets. The data and results of nondimensional heat transfer (Qnd) is given in
Appendix F.4.
Variation of nondimensional heat transfer (Qnd) and dimensional heat transfer
(Q) for B=0.001 is shown in Figure 4.11 and Figure 4.12, respectively.
0
10
20
30
40
50
60
70
80
90
100
110
0 20 40 60 80 100
A
Qnd
B=0,001
Figure 4.11 Variation of Qnd with A for B=0.001
Page 102
82
0
5
10
15
20
25
30
0 20 40 60 80 100
A
Q (W
) B=0,001
Figure 4.12 Variation of Q with A for B=0.001
It is deduced from Figure 4.11 that nondimensional heat transfer (Qnd)
increases with A (substrate thermal conductivity). It is also seen from Figure 4.12
that heat transfer (Q) increases with A (thermal conductivity)of substrate material.
Variation of nondimensional heat transfer (Qnd) and dimensional heat transfer
(Q) for B=0.01, 0.1, 1, 10, 100 is given in Appendix F.5.
One important factor that effects heat transfer through a single droplet is the
drop conductance resistance. The other factor is interfacial resistance Ri. Although Rc
decreases towards the edge of the droplet, Ri remains constant along the surface of
the droplet. Thus, the major portion of heat transfer in dropwise condensation takes
place near the edge of the droplet. Sum of these two resistances, gives total resistance
over the substrate. In this study total resistance is denoted by nondimensional
resistance parameter (Fr).
Page 103
83
Variation of nondimensional drop resistance with nondimensional drop
radius for a single droplet at B=0.001 and A=1 is given in Figure 4.13. The data used
in Figure 4.13 is given in Appendix F.6.
0
120
240
360
480
600
720
840
960
1080
0,8 0,82 0,84 0,86 0,88 0,9 0,92 0,94 0,96 0,98 1
NondimensionalRadial Distance
Non
dim
ensi
onal
Dro
p R
esis
tanc
e F r
B=0.001 A=1
Figure 4.13 Variation of nondimensional resistance parameter with nondimensional
drop radius for B=0.001 and A=1
It is seen from Figure 4.13 that nondimensional resistance parameter
increases from center to edge of the droplet. Increase of nondimensional drop
resistance means that total resistance of drop decreases towards the edge of droplet.
Variation of heat transfer and heat flux with A for a droplet radius which is
r=2.11x10⁻⁴ m is shown in Figure 4.14 and Figure 4.15, respectively.
Page 104
84
0,57
0,58
0,59
0,60
0,61
0,62
10 20 30 40 50
A
Q (W
)
Figure 4.14 Variation of heat transfer with A for r=2.11x10⁻⁴ m
4,1
4,2
4,3
4,4
10 20 30 40 50
A
Q''
(W/m
²)x10
+6
Figure 4.15 Variation of heat flux with A for r=2.11x10⁻⁴ m
Page 105
85
It is seen from Figure 4.14 and Figure 4.15 that heat transfer and heat flux
increases with substrate thermal conductivity for a given drop diameter on various
surfaces. Variation of heat transfer and heat flux with A for r=4.22x10⁻⁶ m is given in
Appendix F.7.
By using Eq. (3.77) nondimensional heat transfer (Qnd) is obtained for
droplets with respect to substrate thermal conductivity (A) and drop radius (B).
Variation of nondimensional heat transfer (Qnd) with B and A is shown in Figure
4.16.
0
10
20
30
40
50
60
70
80
90
100
110
0 20 40 60 80 100
A
Qnd
B=0.001 B=0.0016 B=0.004
B=0.01 B=0.1 B=1
B=100
Figure 4.16 Variation of nondimensional heat transfer (Qnd) with B and A
It is seen from Figure 4.16 that Qnd increases with substrate thermal
conductivity (A).
Page 106
86
By using Eq. (3.78) heat transfer is obtained for single droplet with respect to
substrate thermal conductivity (A) and drop radius (B). Variation of dimensional heat
transfer (Q) with B and A is shown in Figure 4.17.
0
5
10
15
20
25
30
0 20 40 60 80 100
A
Q (W
)
B=0.001 B=0.0013 B=0.0016
B=0.002 B=0.004 B=0.01
Figure 4.17 Variation of dimensional heat transfer (Q) with B and A
It is seen from Figure 4.17 that heat transfer (Q) increases with substrate
thermal conductivity (A).
By employing Eq. (3.79) heat flux of droplets is obtained. Variation of heat
flux (Q”) for B and A is shown in Figure 4.18.
Page 107
87
0
2
4
6
8
10
12
14
16
0 2 4 6 8 10 12 14 16 18 20
A
Q (W
/m²)x
10+8
B=0,001 B=0,01
B=0,1 B=1
B=10 B=100
Figure 4.17 Variation of heat flux (Q”) with B and A
It is deduced from Figure 4.18 that heat flux (Q”) decreases as substrate
thermal conductivity (A) increases.
Total dropwise condensation heat transfer (Qdc) and total dropwise
condensation heat flux (Q”dc) is obtained by integrating the heat transfer through
single droplets according to the size distribution of the drops. By using Eq. (3.87)
and Eq. (3.88) total dropwise condensation heat transfer (Qdc) and total dropwise
condensation heat flux (Q”dc) is obtained, respectively. The data of total dropwise
condensation heat transfer (Qdc) and total dropwise condensation heat flux (Q”dc) is
shown in Table 4.2.
Page 108
88
Table 4.2 Variation of total dropwise condensation heat transfer (Qdc) and
total dropwise condensation heat flux ( dcQ '' ) data
A Qdc ( W ) Q”
dc ( W/m2 )
0.01 0.58959 5.316E+06
0.1 0.80160 1.154E+07
1 1.14167 1.596E+07
10 1.74664 1.763E+07
20 1.91517 1.785E+07
50 2.00914 1.796E+07
70 2.03352 1.798E+07
100 2.07118 1.800E+07
Variation of total dropwise condensation heat transfer (Qdc) with A is shown
in Figure 4.19.
0
0,5
1
1,5
2
2,5
0 20 40 60 80 100
A
Qdc
(W)
Figure 4.19 Variation of total dropwise condensation heat transfer (Qdc) with A
Page 109
89
Variation of total dropwise condensation heat flux ( dcQ '' ) with A is shown in
Figure 4.20 and Figure 4.21.
0,5
0,8
1,1
1,4
1,7
2
0 2 4 6 8 10
A
Q" d
c (W
/m²)x
10+7
Figure 4.20 Variation of total dropwise condensation heat flux ( dcQ '' ) with A
Page 110
90
1,76
1,77
1,78
1,79
1,80
0 20 40 60 80 100
A
Q" d
c (W
/m²)x
10+7
Figure 4.21 Variation of total dropwise condensation heat flux ( dcQ '' ) with A
It is seen from Figure 4.18 that total dropwise condensation heat transfer
(Qdc) increases with substrate thermal conductivity (A). Also in Figure 4.20 and
Figure 4.21 total dropwise condensation heat flux (Q”dc) increases with substrate
thermal conductivity (A). It is deduced from figures that increase rate of Qdc and Q”dc
is completely higher between A=0.1 and A=10. Between A=10 and A=100 Qdc and
Q”dc increases gradually.
4.3 Dropwise Condensation Heat Transfer Coefficient
Dropwise condensation heat transfer coefficient is obtained by using Eq.
(3.69). The data and variation of dropwise condensation heat transfer coefficient is
shown in Table 4.3 and Figure 4.22, respectively.
Page 111
91
Table 4.3 Dropwise condensation heat transfer coefficient data
A hdc (W/m2K) 0.01 66746 0.1 125100 1 162781
10 176834 20 178807 50 179727 70 179899
100 180120
0
30
60
90
120
150
180
0 20 40 60 80 100
A
h dc (
kW/m
²K)
Figure 4.22 Variation of dropwise condensation heat transfer coefficient with A
It can be seen from the Figure 4.22 that the higher the thermal conductivity of
the substrate material, higher the heat transfer coefficient is.
Page 112
92
The results of this study shows that the surface thermal conductivity is an
important parameter in dropwise condensation. And the dropwise condensation heat
transfer coefficient is a function of the thermal conductivity of the substrate material.
4.4 Comparison of Numerical Results with the Results in the Literature
4.4.1 Comparison of Heat Transfer Coefficient
Heat transfer coefficient is one of the most important parameter in dropwise
condensation. There are considerable amount of experimental, numerical and
analytical study for the determination of heat transfer coefficient in the literature.
Tsuruta, Tanaka and Togashi [33] made an experimental verification of
constriction resistance theory in dropwise condensation heat transfer. They studied
the effect of thermal properties of the condenser material on dropwise condensation
heat transfer experimentally.
Quart glass, stainless steel and carbon steel are employed as the condenser
materials in the experiment.
Page 113
93
0
40
80
120
160
200
0 5 10 15 20 25 30
ks (W/mK)
h dc (
kW/m
²K)
Present Study Tsuruta & Tanaka [33]
Figure 4.23 Comparison of heat transfer coefficients between the present study and
Tanaka et. al [33]
In the present study and in the Tanaka’s experimental study the pressure is
taken as 100 kPa. It is seen from Figure 4.23 that heat transfer coefficients obtained
by the present study are higher than those found by Tanaka et. al [33]. The reasons
can be constriction resistance, environmental factors like noncondensibles gases.
Tsuruta and Tanaka [61] made an theoretical study on the constriction
resistance in dropwise condensation. In their research, the effect of the thermal
conductivity of the condenser material on dropwise condensation heat transfer
coefficient decreases with the decrease in substrate thermal conductivity. That is,
heat transfer coefficient increases with substrate thermal conductivity in the present
study as Tsuruta and Tanaka’s study. However values obtained in the present study is
higher than those found by Tsuruta and Tanaka. The results of heat transfer
coefficients are presented in Figure 4.24 from Tsuruta and Tanaka study and present
study.
Page 114
94
Figure 4.24 Comparison of heat transfer coefficients between the present study and
Tsuruta and Tanaka study [61]
Hannemann and Mikic [59] made an analysis of the effect of surface thermal
conductivity on the rate of heat transfer in dropwise condensation. They reported an
analysis and correlation of the thermal constriction resistance in dropwise
condensation. They concluded that heat transfer coefficient increases with substrate
thermal conductivity. Comparison of heat transfer coefficients between the present
study and literature is shown Figure 4.25.
Page 115
95
0
40
80
120
160
200
240
0 10 20 30 40 50 60 70 80
ks (W/mK)
h dc (
kW/m
²K)
Present Study Aksan & Rose [57] Wilkins & Bromley [56]
Tanner et. al. [38] Hanneman & Mikic [59]
Figure 4.25 Comparison of heat transfer coefficients between the present study and
literature
It is seen that the values in Figure 4.25 is not the same as the present study. In
these experiments since noncondensible gases, surface finish, pressure, promoter and
other factors effects dropwise condensation heat transfer, the results obtained in their
experiments are considerably different then the calculated results of this study.
It is seen from Figure 4.26 that heat transfer coefficients found by present
study are higher than those found by Hanneman & Mikic [59] and the other
experimental analysis. On the other hand the experimental results of Aksan and Rose
[57] are higher than the values obtained in the present study.
Yu-Ting Wu, Chun-Xin Yang and Xiu-Gan Yuan [17] made theoretical study
for the dropwise condensation heat transfer on the four kinds of surfaces; copper,
zinc, carbon steel and stainless steel. The results indicate that the heat transfer
coefficients are dependent on the surface thermal conductivity. In the present study
Page 116
96
and in the Yu Ting Wu et. al. [17] experimental study the pressure is taken as 100
kPa.
0
40
80
120
160
200
0 10 20 30 40 50 60 70
ks (W/mK)
h dc (
kW/m
²K)
Present Study
Yu Ting Wu et al.[17]
Figure 4.26 Comparison of heat transfer coefficients between the present study and
Yu Ting Wu et. al. study [17]
It is seen from Figure 4.26 that heat transfer coefficients found by present
study are higher than those found by Yu Ting Wu et. al. [17].
The most important result obtained in this study and in the studies of the
literature is that the substrate thermal conductivity effects the dropwise condensation
phenomena. Both the results of this study and the results of the studies of literature
shows that heat transfer and heat transfer coefficient increases with substrate thermal
conductivity.
Page 117
97
CHAPTER 5
CONCLUSIONS
A numerical method to calculate the substrate effect in dropwise
condensation is proposed in this study. FORTRAN program is used to calculate the
temperature distribution in the substrate where the substrate thermal conductivity and
drop radius are taken as variables. By using these temperatures, heat transfer and heat
flux are obtained for a given droplet.
This theoretical study of dropwise condensation shows that heat transfer and
heat flux are effected by surface thermal conductivity and drop radius.
It is concluded from the results that as the droplet size decrease drop to
substrate interface temperature decrease considerably. Another important observation
that can be inferred from the results that as the substrate material thermal
conductivity decreases the maximum substrate surface temperature moves toward the
center of the droplet. It is also concluded that for low conductivity substrate materials
vapor-to-surface temperature differences are small.
The results indicate that the heat transfer and heat flux are dependent on the
surface thermal conductivity and increase with the increasing substrate material
thermal conductivity. Dropwise condensation heat transfer coefficient increases as
the substrate material thermal conductivity increases.
Comparison of the numerical results with the results in the literature show
that the heat transfer coefficients found by the present study are higher than those
found in the literature.
Page 118
98
REFERENCES
1. Çengel, Y. A., Heat Transfer – A Practical Approach, International Edition,
1998, McGraw-Hill.
2. E. Schmidt, W. Schurig, W. Sellschop, “Versuche uber die kondensation von
wasserdampf in film — und tropenform, Tech. Mech. Thermodyn. (Forsch.
Ing. Wes.), 1, 53–63, 1930.
3. Jakob , M. , “Heat Transfer in Evaporation and Condensation – II”, Mechanical
Engineering , 58 , p. 729 –739, 1936.
4. E. Baer and J. M. McKelvey, “Heat Transfer in Dropwise Condensation”,
Delaware Science Symposium, University of Delaware, 1958.
5. Welch, J.F. and Westwater , J.W. “Microscopic Study of Dropwise
Condensation”, International Heat Transfer Conference, Colorado , USA , p.
302, 1961.
6. G. Tammann and W. Boehme, “Die Zahl der Wassertropfchen bei der
Kondensation auf verschiedenen festen Stoffen”, Annalen der Physik, vol. 5,
1935, pp. 77-80.
7. McCormick, J.L. and Baer, E., “Dropwise Condensation on Horizontal
Surfaces”, Developments in Mechanics, Pergamon Press, N.Y., pp. 749-75,
1965 .
Page 119
99
8. McCormick , J.L. and Baer , E. , “ On the Mechanism of Heat Transfer in
Dropwise Condensation”, Journal of Colloid Science, vol.18, 1963, pp.208-
216.
9. Umur , A. and Griffith , P. , ‘’Mechanism of Dropwise Condensation ,’’ Trans.
ASME ,Journal of Heat Transfer , 87C , pp. 275-282, 1965.
10. Graham, C. and Griffith , P. , ‘’Dropsize Distribution and Heat Transfer in
Dropwise Condensation , ’’ Int. J. Heat Mass Transfer ,16 , p. 337-346, 1973.
11. Rose, J. W. and Glicksman, L. R., “ Dropwise Condensation-The Distribution
of Drop Sizes”, Int. J. Heat and Mass Transfer, vol.11, pp.411-425, 1973.
12. Fatica N. and Katz , D.L , “Dropwise Condensation”, Chem. Eng. Progress, 45,
No.11, pp.661–674, 1949.
13. Sugawara, S. and Michiyoshi, I., “Dropwise Condensation”, Mem. Fac. Engng,
Kyoto Univ., 18, No.2, 1956.
14. Wenzel, H., “Der Warmeübergang bei der Tropfenkondensation”, Linde-Ber.
Tech. Wiss. 18, 44, 1964.
15. Gose, E. E., Mucciardi, A. N. and Baer, E., “Model for Dropwise Condensation
on Randomly Distributed Sites”, Int. J. Heat Mass Transfer, 10, 15, 1967.
16. Tanasawa, I. and Tachibana, F., “A synthesis of the total process of dropwise
condensation using the method of computer simulation”, Proc. Fourth Int. Heat
Transfer Conference 6, 1970.
17. Yu-Ting Wu, Chen-Xin Yang and Xiu-Gan Yuan, “A Theoretical Study of the
Effect of Surface Thermal Conductivity on Heat Transfer coefficient in
Dropwise Condensation”, Numerical Heat Transfer, part A, 40, p. 169-179,
2001.
Page 120
100
18. Le Fevre , E.J. and Rose , J.W. , ‘’A Theory of Heat Transfer by Dropwise
Condensation ,’’ Proc. of 3rd. Inter. Heat Transfer Conf. , 2 , pp.362 – 375,
1966.
19. Tanaka , H. , ‘’Measurements of Dropsize Distributions during Transient
Dropwise Condensation ‘’ , Trans. A.S.M.E. , Journal of Heat Transfer , 97 ,
pp.341-346, 1975.
20. Wu, H. W. and Maa, J. R., “On the heat transfer in dropwise condensation”,
The Chemical Engineering Journal, vol.12, pp.225-231, 1976.
21. Maa J. R., “Drop size distribution and heat flux of dropwise condensation”,
Chemical Engineers J., vol.16, pp.171-176, 1978.
22. Tanaka H., “A theoretical study of dropwise condensation”, Transactions of the
ASME Journal of Heat Transfer, 97, pp.72-78, 1975.
23. Tanaka H., “Measurement of drop size distribution during transient dropwise
condensation”, Transactions of the ASME Journal of Heat Transfer, 97,
pp.341-346, 1975.
24. Tanaka H., “Further developments of dropwise condensation theory”,
Transactions of the ASME Journal of Heat Transfer, 101, pp.603-611, 1979.
25. Tanner , D.W. , Pope , D. , Potter , C.J. and West , D. , “Heat Transfer in
Dropwise Condensation-Part I, The Effects of Heat Flux, Steam Velocity and
Non-Condensable gas Concentration”, Int. J. Heat Mass Transfer , 8 , pp.419 –
426, 1965.
26. Tanner , D.W. , Pope , D. , Potter , C.J. and West , D. , “Heat transfer in
dropwise condensation at low steam pressures in the absence and presence of
noncondensable gas”, Int. J. Heat Mass Transfer, 11, pp.181 – 190, 1968.
Page 121
101
27. Hurst , C.J. and Olson , D.R. ,’’Conduction through Droplets during Dropwise
Condensation , ’’ J. Heat Transfer ,95 ,pp 12-20, 1973.
28. Peter Griffith and Man Suk Lee, “The Effect of Surface Thermal Properties
and Finish on Dropwise Condensation”, Int. J. Heat Mass Transfer, 10, p. 697-
707, 1967.
29. Mikic B. B. and R. J. Hannemann, “An Experimental Investigation Into the
Effect of Surface Thermal Conductivity on the Rate of Heat Transfer in
Dropwise Condensation”, Int. J. Heat and Mass Transfer, 19, p. 1309-1317,
1976.
30. Mikic B. B. “On Mechanism of Dropwise Condensation”, Int. J. Heat and
Mass Transfer, 12, p. 1311-1323, 1969.
31. Sadhal, S. S. and Plesset, M. S., “Effect of solid properties and contact angle in
dropwise condensation theory”, Transactions of the ASME Journal of Heat
Transfer, 101, pp.48-54, 1979.
32. Rose J. W., “Effect of condenser tube material on heat transfer during dropwise
condensation of steam”, Int. J. Heat and Mass Transfer, 21, p.835-840, 1978.
33. Tsuruta T., Tanaka H. and Togashi S., “Experimental verification of
constriction resistance theory in dropwise condensation heat transfer”, Int. J.
Heat and Mass Transfer, vol.34, p.2787-2796, 1991.
34. Rose J. W., “The effect of surface thermal conductivity on dropwise
condensation heat transfer”, Int. J. Heat and Mass Transfer, 21, p.80-81, 1978.
35. Othmer , D.F. , “ The Condensation of Steam ” Industrial and Engineering
Chemistry , 21 , p.576, 1929.
Page 122
102
36. E. J. Le Fevre and J. W. Rose, “An Experimental Study of Heat Transfer by
Dropwise Condensation”, Int. J. Heat and Mass Transfer, 8, p. 1117-1133,
1965.
37. E. Citakoğlu and J. W. Rose, “Dropwise Condensation-Some Factors
Influencing the Validity of Heat Transfer Measurements”, Int. J. Heat and
Mass Transfer, 11, p. 523-537, 1968.
38. Tanner , D.W. , Pope , D. , Potter , C.J. and West , D. , “Heat Transfer in
Dropwise Condensation-Part II, Surface Chemistry”, Int. J. Heat Mass
Transfer, 8 , pp.427 – 436, 1965.
39. Rose, J. W., Boone, D. H., Marto, P. J., Wanniarachchi, A. S. and Holden, K.
M., “The Use of Organic Coatings to Promote Dropwise Condensation of
Steam”, Journal of Heat Transfer, 109, p. 768-774, 1987.
40. D.C. Zhang, Z.Q. Lin, J.F. Lin, New surface materials for dropwise
condensation, in: Proceedings of the 8th International Heat Transfer
Conference ’86, Vol. 4, San Francisco, p. 1677–1682, 1986.
41. D.C. Zhang, Z.Q. Lin, J.F. Lin, New method for achieving dropwise
condensation. III. Determination of dropwise-condensation-heat transfer
coefficient and life-time tests of heat transfer surfaces, J. Chem. Ind. Eng.
(China), 38, 274–280, 1987.
42. Q. Zhao, D.C. Zhang, J.F. Lin, Surface materials with dropwise condensation
made by ion implantation technology, Int. J. Heat Mass Transfer, 34, p. 2833–
2835 , 1991.
43. Y.J. Song, X.H. Ma, D.Q. Xu, J.F. Lin, Condensation of steam on chromium,
in: Proceedings of China–Japan Chemical Engineering Conference, Tianjin
University Press, Tianjin, p. 688–695, 1991.
Page 123
103
44. S.S. Finnicum, J.W. Westwater, Dropwise condensation of steam on
chromium, Int. J. Heat Mass Transfer, 32, p. 1541–1549, 1989.
45. Q. Zhao, D. C. Zhang, X. B. Zhu, D. Q. Xu, Z. Q. Lin, J. F. Lin, Industrial
Application of Dropwise Condensation, Heat Transfer 1990, 4, p. 391-394,
1990.
46. Q. Zhao, B. M. Burnside, Dropwise Condensation of Steam on Iron Implanted
Condenser Surfaces, Heat Recovery Syst. CHP, 14, p. 525-534, 1994.
47. Q. Zhao, J. F. Lin, Research Progress on Industrial Application of Dropwise
Condensation, Chem. Ind. Eng. Progress (China), 53, p. 17-20, 1991.
48. Q. Zhao, D. Q. Xu, Dropwise Condensation Surface With Corrosion Resistant
Properties, Corrosion Rev., 11, p. 97-103, 1993.
49. Q. Zhao, D. C. Zhang, X. B. Zhu, D. Q. Xu, J. F. Lin, The Dropwise
Condensation Condenser Design, Nat. J., 14 (3), p. 232-233, 1991.
50. Q. Zhao, G. Q. Wang, Vertical Dropwise Condensation Shell and Tube Heat
Exchanger for Steam With Water Cooling, Patent No.91100529.3, China
Patent Bureau, Patent Authority, Dalian University of Techonology/Dalian
Power Station.
51. G. Q. Wang, Q. Zhao, G. Li, F. Fu, S. Li, Vertical Dropwise Condensation
Shell and Tube Heat Exchanger for Steam With Water Cooling, Patent
No.91100592.6, China Patent Bureau, Patent Authority, Dalian University of
Techonology/Dalian Power Station.
52. X.H. Ma, B.X. Wang, D.Q. Xu, J.F. Lin, Experimental investigation of
dropwise condensation lifetime for polymer surfaces, J. Eng. Thermophys., 18,
p. 196–200, 1997.
Page 124
104
53. X.H. Ma, Dropwise condensation on PTFE coated surfaces and the catastrophe
transition mechanisms between dropwise and film condensation, Ph.D. Thesis,
Dalian University of Technology, 1994.
54. A.W. Adamson, Physical Chemistry of Surfaces, 5th Edition, Wiley, New
York, 1990.
55. D.K. Owens, R.C. Wendt, Estimation of the surface free energy of polymers, J.
Appl. Polym. Sci., 13, p. 1741–1747, 1967.
56. D. G. Wilkins, L. A. Bromley, “Dropwise condensation phenomena”, A. I. Ch.
E. Journal, vol.19, pp.839-845, 1973.
57. S. N. Aksan and J. W. Rose, “Dropwise condensation-the effect of thermal
properties of the condenser material”, Int. J. Heat and Mass Transfer, vol.16,
pp. 461-467, 1973.
58. Mikic B. B. “Thermal constriction resistance due to non-uniform surface
conditions, contact resistance at non-uniform interface pressure”, Int. J. Heat
and Mass Transfer, vol.15, pp. 1497-1500, 1970.
59. Mikic B. B. and R. J. Hannemann, “An analysis of the effect of surface
thermal conductivity on the rate of heat transfer in dropwise condensation”, Int.
J. Heat and Mass Transfer, vol.19, p. 1299-1307, 1976.
60. R. J. Hannemann, “ Condensing surface thickness effects in dropwise
condensation”, Int. J. Heat and Mass Transfer, vol.21, pp. 65-66, 1978.
61. Tsuruta T., Tanaka H., “A theoretical study on the constriction resistance in
dropwise condensation”, Int. J. Heat and Mass Transfer, vol.34, p.2779-2786,
1991.
Page 125
105
62. C. Graham, “The limiting heat transfer mechanism of dropwise condensation”,
Ph.D. Thesis, Massachusetts Institute of Technology,1969
63. S. Hatamiya and H. Tanaka, “Dropwise condensation of steam at low
pressures”, Int. J. Heat and Mass Transfer, vol.30, p.497-507, 1987.
64. S. A. Stylianou and J. W. Rose, “Dropwise condensation on surfaces having
different thermal conductivities”, Trans. Am. Soc. Mech. Engrs., Series C, J.
Heat Transfer 102, pp. 477-482, 1980
Page 126
106
APPENDIX A
FORTRAN SOURCE PROGRAM
IMPLICIT REAL(A-H,O-Z) DIMENSION T(61,30),TN(61,30),rr(62) ,zz(31) open(9, file='r6k3.dat') open(8, file='r6k3b.dat') ! rrr rdamla olacak ! rksub rk thermal conductivity h_fg=2257000. T_v=(100.+273.) gam=1. P_v=100000. G=461. h_i=(2.*gam/(2.-gam))*(1./(2.*3.1416))**(1./2.)*P_v*h_fg**2./ 1(T_v**(5./2.)*G**(3./2.)) rk=0.6450 rksub=0.645*100 ! A=rksub/rk, A=100 rrr=rksub/h_i/0.0001/10. ! rdamla, B=rksub/(hi*rrr), B=0.001 c rrr = damlan n yar cap ! c rdamla=rrr conang=65./180.*3.1416 ! radyan olmas n ‡ek et c open(50, file='Result50.dat') c write(50,*)h_i ,h_fg ,T_v ,gam ,P_v ,G ,rk ,rksub ,rrr ,rdamla ,conang open(97, file='Result97.dat') write(97,*) rrr cp=444. ro=8900.
Page 127
107
tme=0.0 uc=0.0001 ! kedge=30 ! mr=30 ! drl=(alog(1.)-alog(uc))/kedge alfa=rksub/(ro*cp) delx=uc*exp(drl)*rdamla biot=h_i*delx/rksub dt=0.1/(1.+biot)*(delx)**2/alfa*.1 do 100 i=1,kedge 100 rr(i)=1.-uc*exp(drl*(kedge-i)) do 110 i=kedge+2,mr+kedge+1 110 rr(i)=1.+uc*exp(drl*(i-kedge-2)) c rr(kedge+1)=1+uc c rr(kedge)=1.
rr(30)=0.9999 rr(31)=1.0
ucz=.0001 ! !
nz=30 ! dzl=((alog(10.))-alog(ucz))/(nz-2) do 120 i=1,nz 120 zz(i+1)=ucz*exp(dzl*(i-1)) ! kenar=kedge+1 ! <<------------ nnz=nz nnr=kedge+1+mr do 125 i=1,nnr !BUNLARI initialization !icin muhafaza et do 125 j=1,nnz ! 125 T(i,j)=0. ! c open(56, file='Result56.dat') c write(56,*)i ,j ,T
Page 128
108
c 125 write(*,*)T(i,j),i,j ! c xx=F(.1) ! c write(*,*)xx !--------------------------------- nyaz=0 127 tme=tme+dt
nyaz=nyaz+1
open(57, file='Result57.doc') write(57,*)tme
if(nyaz.eq.0)go to 716
write(9,*)tme 716 continue do 131 i=2,nnr-1 do 130 j=2,nnz-1 A10=-ro*cp/(rksub*dt)*rdamla**2*(((rr (i+1)+rr (i))/2)**2- 1((rr (i)+rr (i-1))/2)**2)*((zz (j+1)-zz (j-1))/2) BG=(T (i,j)-T (i,j+1))*(((rr (i+1)+rr (i))/2)**2-((rr (i)+ 1rr (i-1))/2)**2)/(zz (j+1)-zz (j)) BB=(T (i,j)-T (i-1,j))*(((rr (i)+rr (i-1))/2)*(zz (j+1)- 1zz (j-1)))/(rr (i)-rr (i-1)) BD=(T (i,j)-T (i+1,j))*(((rr (i+1)+rr (i))/2)*(zz (j+1)- 1zz (j-1)))/(rr (i+1)-rr (i)) BK=(T (i,j)-T (i,j-1))*(((rr (i+1)+rr (i))/2)**2-((rr (i)+ 1rr (i-1))/2)**2)/(zz (j)-zz (j-1)) anum=abs(BK+BG+BB+BD) den=abs(a10) TN (i,j)=T (i,j)+(BK+BG+BB+BD)/A10 c GO TO 130 c 132 TN (i,j)=T (i,j) c open(61, file='Result61.dat') c write(61,*)i ,j ,TN(i,j)
Page 129
109
130 continue ! write(*,*)i,j,a10,bg,bb,bd,bk,tn(i,j) 131 continue c damla altı kuzey kenar orta kısım 4 j=1 do 140 i=2,kenar-1 Fr=1/(rksub/(h_i*rrr)+(1-rr(i))*((conang)-asin((1-rr(i))/ 1(2/sin(conang))))*rksub/(rk)) c open(63, file='Result63.dat') c write(63,*) i, Fr A10=-ro*cp/(rksub*dt)*rdamla**2*(((rr (i+1)+rr (i))/2)**2- 1((rr (i)+rr (i-1))/2)**2)*((zz (j+1)-zz (j))/2) BG= (T (i,j)-T (i,j+1))*(((rr (i+1)+rr (i))/2)**2- 1((rr (i)+rr (i-1))/2)**2)/(zz (j+1)-zz (j)) BB= (T (i,j)-T (i-1,j))*(((rr (i)+rr (i-1))/2)* 1(zz (j+1)-zz (1)))/(rr (i)-rr (i-1)) BD= (T (i,j)-T (i+1,j))*(((rr (i+1)+rr (i))/2)* 1(zz (j+1)-zz (1)))/(rr (i+1)-rr (i)) BK= (T (i,j)-1)*(((rr (i+1)+rr (i))/2)**2- 1((rr (i)+rr (i-1))/2)**2)*( Fr ) TN (i,j)=T (i,j)+(BK+BG+BB+BD)/A10 140 continue c damla altı kuzey kenar damla merkezi 5 j=1 i=1 Fr=1/(rksub/(h_i*rrr)+(1-rr(i))*((conang)-asin((1-rr(i))/ 1(2/sin(conang))))*rksub/(rk)) A10= -ro*cp/(rksub*dt)*rdamla**2*((rr (i+1)+rr (i))/2)**2* 1((zz (j+1)-zz (j))/2) BG= (T (i,j)-T (i,j+1))*((rr (i+1)+rr (i))/2)**2/ 1(zz (j+1)-zz (j)) BB= 0.0 BD= (T (i,j)-T (i+1,j))*(((rr (i+1)+rr (i))/2)*
Page 130
110
1(zz (j+1)-zz (1)))/(rr (i+1)-rr (i)) BK= (T (i,j)-1)*((rr (i+1)+rr (i))/2)**2*( Fr ) TN (i,j)=T (i,j)+(BK+BG+BB+BD)/A10 c damla altı damla ucu 6 j=1 i=kenar ! kenar ? Fr=1/(rksub/(h_i*rrr)+(1-rr(i))*((conang)-asin((1-rr(i))/ ! 1(2/sin(conang))))*rksub/(rk)) A10= -ro*cp/(rksub*dt)*rdamla**2*(((rr (i+1)+ 1rr (i))/2)**2-((rr (i)+rr (i-1))/2)**2)*((zz (j+1)-zz (j))/2) BG= (T (i,j)-T (i,j+1))*(((rr (i+1)+rr (i))/2)**2-((rr (i)+ 1rr (i-1))/2)**2)/(zz (j+1)-zz (j)) BB= (T (i,j)-T (i-1,j))*(((rr (i)+rr (i-1))/2)* 1(zz (j+1)-zz (1)))/(rr (i)-rr (i-1)) BD= (T (i,j)-T (i+1,j))*(((rr (i+1)+rr (i))/2)* 1(zz (j+1)-zz (1)))/(rr (i+1)-rr (i)) BK= (T (i,j)-1)*(((rr (i+1)+rr (i))/2)**2- 1((rr (i)+rr (i-1))/2)**2)*( Fr /2.) TN (i,j)=T (i,j)+(BK+BG+BB+BD)/A10 c izole yuzey kuzey kenar orta kısım 7 j=1 do 150 i=kenar+1,nnr-1 A10= -ro*cp/(rksub*dt)*rdamla**2*(((rr (i+1)+rr (i))/2)**2- 1((rr (i)+rr (i-1))/2)**2)*((zz (j+1)-zz (j))/2) BG= (T (i,j)-T (i,j+1))*(((rr (i+1)+rr (i))/2)**2- 1((rr (i)+rr (i-1))/2)**2)/(zz (j+1)-zz (j)) BB= (T (i,j)-T (i-1,j))*(((rr (i)+rr (i-1))/2)*(zz (j+1)- 1zz (1)))/(rr (i)-rr (i-1)) BD= (T (i,j)-T (i+1,j))*(((rr (i+1)+rr (i))/2)*(zz (j+1)- 1zz (1)))/(rr (i+1)-rr (i)) BK= 0.0 TN (i,j)=T (i,j)+(BK+BG+BB+BD)/A10 150 continue c izole yuzey kuzey kenar kose 8 j=1
Page 131
111
i=nnr A10= -ro*cp/(rksub*dt)*rdamla**2*(((rr (i+1)+ 1rr (i))/2)**2-((rr (i)+rr (i-1))/2)**2)*((zz (j+1)-zz (j))/2) BG= (T (i,j)-T (i,j+1))*(((rr (i+1)+rr (i))/2)**2- 1((rr (i)+rr (i-1))/2)**2)/(zz (j+1)-zz (j)) BB= (T (i,j)-T (i-1,j))*(((rr (i)+rr (i-1))/2)* 1(zz (j+1)-zz (1)))/(rr (i)-rr (i-1)) BD= (T (i,j))*(((rr (i+1)+rr (i))/2)*(zz (j+1)-zz (1)))/ 1(rr (i+1)-rr (i)) BK= 0.0 TN (i,j)=T (i,j)+(BK+BG+BB+BD)/A10 c batı orta 9 i=1 do 160 j=2,nnz-1 A10= -ro*cp/(rksub*dt)*rdamla**2*((rr (i+1)+rr (i))/2)**2* 1((zz (j+1)-zz (j-1))/2) BG= (T (i,j)-T (i,j+1))*(((rr (i+1)+rr (i))/2)**2)/ 1(zz (j+1)-zz (j)) BB= 0.0 BD= (T (i,j)-T (i+1,j))*(((rr (i+1)+rr (i))/2)* 1(zz (j+1)-zz (j-1)))/(rr (i+1)-rr (i)) BK= (T (i,j)-T (i,j-1))*(((rr (i+1)+rr (i))/2)**2)/ 1(zz (j)-zz (j-1)) TN (i,j)=T (i,j)+(BK+BG+BB+BD)/A10 160 continue c doğu orta 13 i=nnr do 165 j=2,nnz-1 A10=-ro*cp/(rksub*dt)*rdamla**2*(((rr (i+1)+rr (i))/2)**2- 1((rr (i)+rr (i-1))/2)**2)*((zz (j+1)-zz (j-1))/2) BG= (T (i,j)-T (i,j+1))*(((rr (i+1)+rr (i))/2)**2- 1((rr (i)+rr (i-1))/2)**2)/(zz (j+1)-zz (j)) BB= (T (i,j)-T (i-1,j))*(((rr (i)+rr (i-1))/2)*(zz (j+1)- 1zz (j-1)))/(rr (i)-rr (i-1)) BD= (T (i,j)-0.0)*(((rr (i+1)+rr (i))/2)*(zz (j+1)- 1zz (j-1)))/(rr (i+1)-rr (i)) BK= (T (i,j)-T (i,j-1))*(((rr (i+1)+rr (i))/2)**2-
Page 132
112
1((rr (i)+rr (i-1))/2)**2)/(zz (j)-zz (j-1)) TN (i,j)=T (i,j)+(BK+BG+BB+BD)/A10 165 continue c batı alt uc 10 i=1 j=nnz A10= -ro*cp/(rksub*dt)*rdamla**2*((rr (i+1)+rr (i))/2)**2* 1((zz (j+1)-zz (j-1))/2) BG= (T (i,j)-0)*(((rr (i+1)+rr (i))/2)**2)/(zz (j+1)-zz (j)) BB= 0.0 BD= (T (i,j)-T (i+1,j))*(((rr (i+1)+rr (i))/2)* 1(zz (j+1)-zz (j-1)))/(rr (i+1)-rr (i)) BK= (T (i,j)-T (i,j-1))*(((rr (i+1)+rr (i))/2)**2)/ 1(zz (j)-zz (j-1)) TN (i,j)=T (i,j)+(BK+BG+BB+BD)/A10 c guney orta 11 j=nnz do 170 i=2,nnr-1 A10=-ro*cp/(rksub*dt)*rdamla**2*(((rr (i+1)+ 1rr (i))/2)**2-((rr (i)+rr (i-1))/2)**2)*((zz (j+1)-zz (j-1))/2) BG=(T (i,j)-0.0)*(((rr (i+1)+rr (i))/2)**2- 1((rr (i)+rr (i-1))/2)**2)/(zz (j+1)-zz (j)) BB=(T (i,j)-T (i-1,j))*(((rr (i)+rr (i-1))/2)* ! 1(zz (j+1)-zz (j-1)))/(rr (i)-rr (i-1)) BD=(T (i,j)-T (i+1,j))*(((rr (i+1)+rr (i))/2)* 1(zz (j+1)-zz (j-1)))/(rr (i+1)-rr (i)) BK=(T (i,j)-T (i,j-1))*(((rr (i+1)+rr (i))/2)**2- 1((rr (i)+rr (i-1))/2)**2)/(zz (j)-zz (j-1)) TN (i,j)=T (i,j)+(BK+BG+BB+BD)/A10 170 continue c guney sağ köşe 12
Page 133
113
i=nnr j=nnz A10=-ro*cp/(rksub*dt)*rdamla**2*(((rr (i+1)+rr (i))/2)**2- 1((rr (i)+rr (i-1))/2)**2)*((zz (j+1)-zz (j-1))/2) BG=(T (i,j)-0.0)*(((rr (i+1)+rr (i))/2)**2-((rr (i)+ 1rr (i-1))/2)**2)/(zz (j+1)-zz (j)) BB=(T (i,j)-T (i-1,j))*(((rr (i)+rr (i-1))/2)* 1(zz (j+1)-zz (j-1)))/(rr (i)-rr (i-1)) BD=(T (i,j)-0.0)*(((rr (i+1)+rr (i))/2)*(zz (j+1)- 1zz (j-1)))/(rr (i+1)-rr (i)) BK=(T (i,j)-T (i,j-1))*(((rr (i+1)+rr (i))/2)**2- 1((rr (i)+rr (i-1))/2)**2)/(zz (j)-zz (j-1)) TN (i,j)=T (i,j)+(BK+BG+BB+BD)/A10 do 129 j=1,nnz do 129 i=1,nnr 129 T(i,j)=TN(i,j) c write(*,*)TN(kedge,1),kedge,1 ! open(86, file='Result86.doc') write(86,*) TN(kedge,1),kedge,1 qtot=0 write(*,*) i ,j , (T(i,1),i=1,nnr) open(87, file='Result87.doc') write(87,*) i ,j ,(T(i,1),i=1,nnr) if(nyaz.eq.50000)go to 777 go to 888 777 open(88, file='Result88.doc') do 810 j=1,30 do 810 i=1,61 write(88,*) i ,j ,T(i,j) 810 continue j=1 do 778 i=1,31
Page 134
114
Fr=1/(rksub/(h_i*rrr)+(1-rr(i))*((conang)-asin((1-rr(i))/ 1(2/sin(conang))))*rksub/(rk)) open(66, file='Result66.dat') write(66,*) i, Fr 778 continue 888 continue tq=0 taver=0 qa=0.0 bbr0=0.0 tcm=0.0 do 133 i=1,kedge-1 Fr=1/(rksub/(h_i*rrr)+(1-rr(i))*((conang)-asin((1-rr(i))/ 1(2/sin(conang))))*rksub/(rk)) Frp=1/(rksub/(h_i*rrr)+(1-rr(i+1))*((conang)-asin((1-rr(i+1))/ 1(2/sin(conang))))*rksub/(rk)) c open(89, file='Result89.dat') c write(89,*) i ,Fr ,Frp qtot=qtot+(Fr+Frp)/2*(3.1416)*(rr(i+1)**2-rr(i)**2)* 1(1.-(T(i,1)+T(i+1,1))/2) tq=tq+(Fr+Frp)/2*(3.1416)*(rr(i+1)**2-rr(i)**2)* 1(1.-(T(i,1)+T(i+1,1))/2)*(T(i,1)+T(i+1,1))/2 taver=taver+(3.1416)*(rr(i+1)**2-rr(i)**2)* 1(T(i,1)+T(i+1,1))/2 qa=qa+(Fr+Frp)/2*(rr(i+1)**2-rr(i)**2)*(1.-(T(i,1)+T(i+1,1))/2) bbr0=bbr0+(Fr+Frp)/2*(rr(i+1)**2-rr(i)**2) tcm=tcm+(Fr+Frp)/2*(rr(i+1)**2-rr(i)**2)*((T(i,1)+T(i+1,1))/2) c write(*,*)qtot,tq,taver,qa,bbr0,tcm 133 continue r0=1/bbr0 tcm=tcm*r0
Page 135
115
rcon=(tcm-taver)/qa c write(*,*)qa,taver,tcm,r0,rcon if(nyaz.eq.50000)go to 156 go to 127 156 continue do 126 j=1,nnz do 126 i=1,nnr if(nyaz.eq.0)go to 126 write(9,*)rr(i),zz(j),tn(i,j) 126 continue do 141 i=1,nnr if(nyaz.eq.0)go to 141 write(8,*) i,rr(i),T(i,1) 141 continue END
Page 136
116
APPENDIX B
Table B.1 Variation of nondimensional radial distance rri
i rri i rri
1 0 32 1.0001
2 0.4588306 33 1.000136
3 0.6018929 34 1.000185
4 0.7071356 35 1.000251
5 0.7845566 36 1.000341
6 0.8415107 37 1.000464
7 0.8834086 38 1.000631
8 0.9142304 39 1.000858
9 0.9369043 40 1.001166
10 0.9535841 41 1.001585
11 0.9658545 42 1.002154
12 0.9748811 43 1.002929
13 0.9815215 44 1.003981
14 0.9864064 45 1.005412
15 0.9900 46 1.007356
16 0.9926436 47 1.01
17 0.9945883 48 1.013594
18 0.9960189 49 1.018479
19 0.9970714 50 1.025119
20 0.9978456 51 1.034145
21 0.9984151 52 1.046416
22 0.9988341 53 1.063096
23 0.9991423 54 1.08577
24 0.999369 55 1.116591
25 0.9995359 56 1.158489
26 0.9996585 57 1.215443
27 0.9997488 58 1.292864
28 0.9998152 59 1.398107
29 0.999864 60 1.541169
30 0.9999 61 1.735642
31 1.0000
Page 137
117
Table B.2 Variation of nondimensional axial disance zj
j Zj
1 0
2 9.9999997E-05
3 1.5085906E-04
4 2.2758459E-04
5 3.4333198E-04
6 5.1794742E-04
7 7.8137073E-04
8 1.1787686E-03
9 1.7782793E-03
10 2.6826956E-03
11 4.0470897E-03
12 6.1054020E-03
13 9.2105530E-03
14 1.3894954E-02
15 2.0961799E-02
16 3.1622775E-02
17 4.7705825E-02
18 7.1968563E-02
19 0.1085711
20 0.1637894
21 0.2470911
22 0.3727593
23 0.5623413
24 0.8483428
25 1.279802
26 1.930698
27 2.912632
28 4.39397
29 6.628703
30 9.999999
31 15.08591
Page 138
118
APPENDIX C
( )
( )[ ]( ) ( )
( )( ) zrrr
k
kkrrarr
rhk
rrT
dtTTNCp
io
s
sii
i
s
ioji
jiji
∆−
−−−+
−−
=−
2*2*2
2*2*,
,, sin21sin1
11
θθ
ρ
( )
( )[ ]( ) ( )
( )( ) zrrr
k
krrarr
rhk
rrT
dtTTNCp
io
s
ii
is
ioji
jiji
∆−
−−−+
−−
=−
2*2*2
2*2*,
,,
1
sin21sin11
11
π
πΔT
ΔT θθ
ρ
( )
( )[ ]( ) ( )
( )( )
rrπ
πΔT
ΔT
zrrr
krrarr
rh
rrT
dtTTNCp
io
ii
i
ioji
jiji
∆−
−−−+
−−
=−
2*2*2
2*2*,
,,
1
sin21sin11
11
θθ
ρ
( ) rπV zrrr io ∆−= 2*2*2
( ) ( )[ ]( ) ( )
( )
rπΔTΔT
−−−+
−−=−
krrarr
rh
rrTdt
TTNVCp
ii
i
iojijiji
1
sin21sin11
11 2*2*,
,,
θθ
ρ
Page 139
119
( )[ ]( ) ( )
( )
rπΔTrr
−−−+
−−=∆
∆
krr
arrrh
rrTt
U
ii
i
ioji
1
sin21
sin11
11 2*2*,
θθ
( )[ ]( ) ( )
( )
−−−+
−−=∆
∆
krrrarr
h
rrTt
U
ii
i
ioji
θθ
sin21sin11
11 2*2*, πΔTr2
( )[ ]( ) ( )
( ) rr
ΔTπr2
−−−+
−−=∆
∆
krrrarr
h
rrTt
U
ii
i
ioji
θθ
sin21sin11
11 2*2*,
( )[ ]( ) ( )
( )
−−−+
−−=∆
∆
krrarr
h
rrTt
U
ii
i
ioji
1
sin21sin11
11 2*2*,
θθ
r
r1ΔTπr2
( )[ ]( ) ( )
( ) s
s
2
kk
r
r1ΔTπr
−−−+
−−=∆
∆
krrarr
h
rrTt
U
ii
i
ioji
1
sin21sin11
11 2*2*,
θθ
( )[ ]( ) ( )
( )
πk
rk
rΔΔTss
s
−−−+
−−=∆
∆
krrarr
h
rrTt
U
ii
i
ioji
θθ
sin21sin1
11 2*2*,
Page 140
120
APPENDIX D
MATHCAD PROGRAM SOURCE
B = ks/(hi*r) A = ks/k
water thermal conductivityA 0.01:= k 0.645
Wm K⋅
⋅:=hi 1.5281966 107⋅W
m2 K⋅⋅:=
ks A k⋅:=
ks 6.45 10 3−× m-1 K-1 W= substrate thermal cond.
B 0.001:=
rks
hi B⋅:= r 4.220661 10 7−× m=
i 1 32..:= rri 1 0.0001 e 0.307011346 30 i−( )⋅[ ]⋅−:=
Page 141
121
i123456789
1011121314151617181920212223242526272829303132
= rri0.26435770.45883050.60189280.70713550.78455650.84151070.88340860.91423040.93690430.95358410.96585450.97488110.98152150.9864064
0.990.99264360.99458830.99601890.99707140.99784560.99841510.99883410.99914230.999369
0.99953580.99965850.99974880.99981520.9998641
0.99990.99992640.9999459
=
rr1 0:=
rr1 0=
rr32 1.0001:=rr31 1:=
rr31 1= rr32 1.0001=
ci 1+ rri:= di 1− rri:=
c2 0= rr2 0.45883=d2 0.60189=c3 0.45883= rr3 0.60189=d3 0.70714=
Page 142
122
Fr1 1,
Fr2 1,
Fr3 1,
Fr4 1,
Fr5 1,
Fr6 1,
Fr7 1,
Fr8 1,
Fr9 1,
Fr10 1,
Fr11 1,
Fr12 1,
Fr13 1,
Fr14 1,
Fr15 1,
Fr16 1,
Fr17 1,
Fr18 1,
Fr19 1,
Fr20 1,
Fr21 1,
Fr22 1,
Fr23 1,
Fr24 1,
Fr25 1,
Fr26 1,
Fr27 1,
Fr28 1,
Fr29 1,
Fr30 1,
Fr31 1,
130.862
172.456
208.584
254.283
309.266
372.567
442.27
515.548
589.013
659.279
723.544
779.967
827.756
867.019
898.478
923.182
942.275
956.853
967.881
976.162
982.349
986.952
990.367
992.894
994.764
996.142
997.159
997.908
998.46
998.867
1 103×
:= Fr1 1, 130.862=
Page 143
123
T1 1,
T2 1,
T3 1,
T4 1,
T5 1,
T6 1,
T7 1,
T8 1,
T9 1,
T10 1,
T11 1,
T12 1,
T13 1,
T14 1,
T15 1,
T16 1,
T17 1,
T18 1,
T19 1,
T20 1,
T21 1,
T22 1,
T23 1,
T24 1,
T25 1,
T26 1,
T27 1,
T28 1,
T29 1,
T30 1,
T31 1,
0.311
0.377
0.427
0.481
0.535
0.586
0.632
0.671
0.703
0.729
0.749
0.765
0.776
0.785
0.792
0.796
0.796
0.792
0.784
0.771
0.754
0.735
0.714
0.693
0.672
0.653
0.635
0.619
0.605
0.592
0.546
:=
Page 144
124
Q1 Fr1 1,rr2 rr1+
2
2
⋅ 1 T1 1,−( )⋅ π⋅:= Q31 Fr31 1, rr31( )2 rr30( )2− ⋅ 1 T31 1,−( )⋅ π⋅:=
Q1 14.9082668= Q31 0.2852424=
Q_num Q1 Q31+
2
30
i
Fri 1, 1 Ti 1,−( )⋅ π⋅di rri+
2
2 rri ci+
2
2
−
⋅∑=
+:=
Q_num 4.2988591 102×=
q_num Q_num:=
Q_num 4.298859 102×=
Q_nondim Q_numksk
⋅:=
Q_nondim 4.29886=
∆T 100 K⋅:=
Q Q_num ∆T⋅ r⋅ ks⋅:=
Q 1.17029 10 4−× W=
Page 145
125
i 1 31..:=
Aidi rri+
2
2 rri ci+
2
2
−
:=
A2 0.22865=A1 0.0526313=
A31 rr31( )2 rr30( )2− :=
A31 1.9999000 10 4−×=
Atotal1
31
i
Ai∑=
:=
Atotal 1.0001=
Tave1
31
i
Ti 1, Ai⋅∑=
1
31
i
Ai∑=
:=
Tave 0.5113038=
Page 146
126
APPENDIX E
RESULTS FOR TEMPERATURE DISTRIBUTIONS
E.1 Variation of temperature at 0~ =z for B=0.001
The variation of temperature at surface of the substrate for B=0.001 is given
in Table E.1.
Table E.1 Variation of temperature at 0~ =z for B=0.001
A=0.01 A=0.1 A=1 A=10 A=100 i T(i,1) T(i,1) T(i,1) T(i,1) T(i,1) 1 0.3106135 0.045532327 0.004769023 0.000479172 4.79387E-05 2 0.3773975 0.061821498 0.00658744 0.000663074 6.63516E-05 3 0.4270595 0.076788969 0.008315541 0.000838436 8.39138E-05 4 0.4808818 0.096911058 0.010729923 0.00108453 0.000108568 5 0.5349712 0.1230729 0.014037632 0.001423542 0.000142556 6 0.5860518 0.1561735 0.01852545 0.001887195 0.000189068 7 0.6317708 0.1968873 0.024575265 0.002518939 0.000252527 8 0.6708666 0.2454018 0.03268791 0.003378353 0.000338972 9 0.7030749 0.3010484 0.043499671 0.004546815 0.000456733
10 0.7288389 0.3621536 0.057812735 0.006135007 0.000617269 11 0.7489945 0.4260538 0.076601349 0.008296785 0.000836562 12 0.7645004 0.4895033 0.1010156 0.011247218 0.001137553 13 0.7762852 0.5492517 0.1323845 0.015308141 0.001555282 14 0.7851455 0.6027421 0.172189 0.021028802 0.002159408 15 0.7916369 0.6483152 0.2217385 0.02952856 0.00315679 16 0.7956765 0.6847119 0.2799933 0.042563334 0.005067232 17 0.7963092 0.7106807 0.3409383 0.060886819 0.008468523 18 0.7924716 0.7258815 0.3967182 0.082890183 0.013373389 19 0.7837956 0.731277 0.4425085 0.1060846 0.019319503 20 0.7706501 0.7285375 0.476979 0.128551 0.025797645 21 0.7538646 0.7194945 0.5008005 0.1492081 0.032441419 22 0.7345064 0.7059135 0.5154217 0.1675633 0.039031234
Page 147
127
Table E.1 Continued
23 0.7137122 0.6894032 0.5224884 0.1834537 0.045449365 24 0.692559 0.6713825 0.5236323 0.196877 0.051638413 25 0.6719363 0.6530092 0.5203689 0.2079109 0.057582419 26 0.6525478 0.6351943 0.5140572 0.2166172 0.063276142 27 0.6347483 0.6184675 0.5058011 0.2230693 0.06874641 28 0.6187428 0.603165 0.4964925 0.2272762 0.073968105 29 0.6045951 0.5894565 0.4868447 0.2293213 0.078850679 30 0.5922233 0.577344 0.4773751 0.2294721 0.083282277 31 0.5457392 0.5311556 0.4359659 0.2182481 0.100253 32 0.4952526 0.4806055 0.3866988 0.1813098 0.074846126 33 0.4807645 0.4661795 0.3731548 0.1721687 0.069206908 34 0.463277 0.4488239 0.3572161 0.1620884 0.063442037 35 0.4424717 0.4282475 0.3387543 0.1511778 0.057707202 36 0.4175362 0.4036739 0.3172139 0.1392523 0.051946461 37 0.3877646 0.3744407 0.2921671 0.1261885 0.046103764 38 0.3527331 0.3401676 0.2634492 0.1119909 0.040163793 39 0.312106 0.3005674 0.2309847 0.096698813 0.034120888 40 0.266027 0.2558205 0.1950693 0.080502935 0.028024027 41 0.2151868 0.2066305 0.1563757 0.063714415 0.021951541 42 0.1615861 0.1549499 0.1164661 0.046955761 0.016074512 43 0.1086013 0.1040216 0.07775528 0.031118196 0.010636308 44 0.061712097 0.059064649 0.043999501 0.017553767 0.006026259 45 0.026921984 0.025762085 0.019181389 0.007669768 0.002662554 46 0.007815152 0.007481705 0.005585331 0.00225084 0.000794969 47 0.00128525 0.001231507 0.000923816 0.000376548 0.000135697 48 0.000107046 0.000102678 7.74617E-05 3.19658E-05 1.17488E-05 49 4.29506E-06 4.12414E-06 3.12881E-06 1.30662E-06 4.88895E-07 50 8.20178E-08 7.88316E-08 6.01205E-08 2.53844E-08 9.64985E-09 51 7.48317E-10 7.19895E-10 5.51677E-10 2.35286E-10 9.07126E-11 52 3.29175E-12 3.16933E-12 2.43951E-12 1.05005E-12 4.09987E-13 53 7.05076E-15 6.79365E-15 5.25051E-15 2.27926E-15 9.00168E-16 54 7.41809E-18 7.15254E-18 5.54867E-18 2.42769E-18 9.68882E-19 55 3.86191E-21 3.72604E-21 2.90062E-21 1.27843E-21 5.1517E-22 56 1.0008E-24 9.66163E-25 7.54585E-25 3.3487E-25 1.3616E-25 57 1.29729E-28 1.25309E-28 9.81671E-29 4.38475E-29 1.79788E-29 58 8.44362E-33 8.16016E-33 6.41107E-33 2.88116E-33 1.19072E-33 59 2.76791E-37 2.67629E-37 2.10836E-37 9.53025E-38 3.96806E-38 60 3.49904E-42 3.37433E-42 2.47609E-42 0 0 61 0 0 0 0 0
Page 148
128
E.2 Variation of temperature at 51099.9~ −= xz for B=0.001
The variation of temperature at surface of the substrate for B=0.001 is given
in Table E.2.
Table E.2 Variation of temperature at 51099.9~ −= xz for B=0.001
A=0.01 A=0.1 A=1 A=10 A=100 i T(i,2) T(i,2) T(i,2) T(i,2) T(i,2) 1 0.3016622 0.044130005 0.004620865 0.000464272 4.64479E-05 2 0.3667386 0.059924327 0.006382866 0.000642457 6.42883E-05 3 0.415191 0.074440353 0.008057406 0.000812368 8.13044E-05 4 0.4677662 0.093960606 0.010397005 0.001050814 0.000105192 5 0.5206746 0.1193488 0.01360241 0.00137929 0.000138124 6 0.5707127 0.1514856 0.01795168 0.001828542 0.00018319 7 0.6155651 0.1910372 0.023815252 0.002440677 0.000244678 8 0.6539742 0.2382039 0.031679098 0.003273442 0.000328439 9 0.685658 0.2923557 0.042160999 0.004405741 0.00044255
10 0.7110304 0.3518886 0.056041025 0.005944932 0.000598122 11 0.7308981 0.4142299 0.074268013 0.008040401 0.000810671 12 0.7461953 0.4762267 0.097965702 0.010901271 0.001102495 13 0.7578266 0.5347045 0.1284405 0.014841522 0.001507768 14 0.766575 0.5871449 0.1671633 0.020400193 0.002094964 15 0.7729723 0.6318812 0.2154573 0.028683715 0.00306928 16 0.7768704 0.6675761 0.2723181 0.041432761 0.00494819 17 0.777177 0.6928127 0.3317393 0.059382454 0.008306253 18 0.7726845 0.7070687 0.3858187 0.08089865 0.013151838 19 0.7629623 0.7112001 0.4296567 0.1034578 0.01901661 20 0.7483981 0.7068596 0.4618609 0.1250951 0.02538288 21 0.7298979 0.6959297 0.4830741 0.1446722 0.031872135 22 0.7086392 0.6802748 0.4947665 0.1616284 0.038247105 23 0.6858854 0.6616265 0.4986634 0.175723 0.044364315 24 0.6628479 0.6415385 0.496536 0.1868786 0.050127357 25 0.6405432 0.6213089 0.490094 0.1951193 0.055458769
Page 149
129
Table E.2 Continued
26 0.6198167 0.6019989 0.4809499 0.2005442 0.060261499 27 0.6011819 0.5843071 0.470496 0.2034238 0.064442948 28 0.5850146 0.5687507 0.4599213 0.2041991 0.067890927 29 0.5714785 0.5556026 0.450122 0.2034922 0.070542581 30 0.5604525 0.5448232 0.4415858 0.2019562 0.072438762 31 0.5250885 0.5099537 0.4117421 0.1920367 0.07645455 32 0.4877947 0.4729722 0.3781968 0.1728496 0.0676945 33 0.4754777 0.4607776 0.3672205 0.1665259 0.064629033 34 0.4597041 0.4451822 0.3532931 0.158589 0.060770083 35 0.4401086 0.4258466 0.3362327 0.1491061 0.056251682 36 0.415973 0.4020922 0.3156011 0.1380456 0.051180523 37 0.3867191 0.373387 0.2911262 0.1254785 0.045698244 38 0.3520289 0.3394611 0.2627732 0.1115673 0.039944131 39 0.3116346 0.300097 0.2305487 0.096446 0.034000456 40 0.2657169 0.2555127 0.1947935 0.080354027 0.02795816 41 0.2149896 0.2064359 0.156207 0.063629046 0.021916132 42 0.1614671 0.1548331 0.1163682 0.046908982 0.016056119 43 0.1085354 0.1039574 0.077702917 0.031094419 0.010627333 44 0.06168038 0.059033893 0.043975085 0.017543074 0.006022337 45 0.026909873 0.025750369 0.019172281 0.00766589 0.002661147 46 0.007811972 0.00747864 0.005582972 0.00224985 0.000794609 47 0.001284762 0.001231037 0.000923456 0.000376397 0.000135642 48 0.000107007 0.000102641 7.7433E-05 3.19537E-05 1.17443E-05 49 4.29354E-06 4.12269E-06 3.12769E-06 1.30614E-06 4.88716E-07 50 8.19895E-08 7.88043E-08 6.00996E-08 2.53754E-08 9.64642E-09 51 7.48063E-10 7.1965E-10 5.51488E-10 2.35204E-10 9.0681E-11 52 3.29065E-12 3.16827E-12 2.43868E-12 1.0497E-12 4.09847E-13 53 7.04842E-15 6.79139E-15 5.24875E-15 2.27849E-15 8.99863E-16 54 7.41564E-18 7.15017E-18 5.54683E-18 2.42688E-18 9.68557E-19 55 3.86064E-21 3.72482E-21 2.89966E-21 1.27801E-21 5.14999E-22 56 1.00047E-24 9.65848E-25 7.54338E-25 3.34759E-25 1.36115E-25 57 1.29687E-28 1.25268E-28 9.81351E-29 4.38331E-29 1.79729E-29 58 8.44088E-33 8.15752E-33 6.40899E-33 2.88022E-33 1.19033E-33 59 2.76701E-37 2.67543E-37 2.10768E-37 9.52715E-38 3.96677E-38 60 3.49904E-42 3.37433E-42 2.47609E-42 0 0 61 0 0 0 0 0
Page 150
130
E.3 Variation of temperature at 0~ =z for B=0.01
The variation of temperature at surface of the substrate for B=0.01 is shown
in Figure E.1 and Figure E.2 .
0,00
0,04
0,08
0,12
0,16
0,20
0,24
0,28
0 0,2 0,4 0,6 0,8 1 1,2 1,4 1,6 1,8
Nondimensional Radial Distance
Non
dim
ensi
onal
Con
dens
er S
urfa
ce T
empe
retu
re A=0,01
A=0,1
A=1
A=10
A=100
Figure E.1 Variation of nondimensional temperature as a function of nondimensional
radial distance at nondimensional axial distance 0~ =z for B=0.01
Page 151
131
0,00
0,04
0,08
0,12
0,16
0,20
0,24
0,28
0,99 0,995 1 1,005 1,01
Nondimensional Radial Distance
Non
dim
ensi
onal
Con
dens
er S
urfa
ce T
empe
retu
reA=0,01
A=0,1
A=1
A=10
A=100
Figure E.2 Variation of nondimensional temperature as a function of nondimensional
radial distance at nondimensional axial distance 0~ =z for B=0.01
Page 152
132
E.4 Variation of temperature at 0~ =z for B=0.1
The variation of temperature at surface of the substrate for B=0.1 is shown in
Figure E.3 and Figure E.4.
0,000
0,004
0,008
0,012
0,016
0,020
0,024
0,028
0,032
0 0,2 0,4 0,6 0,8 1 1,2 1,4 1,6 1,8
Nondimensional Radial Distance
Non
dim
ensi
onal
Con
dens
er S
urfa
ce T
empe
retu
re
A=0,01
A=0,1
A=1
A=10
A=100
Figure E.3 Variation of nondimensional temperature as a function of nondimensional
radial distance at nondimensional axial distance 0~ =z for B=0.1
Page 153
133
0,000
0,004
0,008
0,012
0,016
0,020
0,024
0,028
0,032
0,99 0,995 1 1,005 1,01
Nondimensional Radial Distance
Non
dim
ensi
onal
Con
dens
er S
ufac
e Te
mpe
retu
re
A=0,01
A=0,1
A=1
A=10
A=100
Figure E.4 Variation of nondimensional temperature as a function of nondimensional
radial distance at nondimensional axial distance 0~ =z for B=0.1
Page 154
134
E.5 Variation of temperature at 0~ =z for B=1
The variation of temperature at surface of the substrate for B=1 is shown in
Figure E.5 and Figure E.6.
0,0E+00
4,0E-04
8,0E-04
1,2E-03
1,6E-03
2,0E-03
2,4E-03
2,8E-03
3,2E-03
3,6E-03
0,0 0,2 0,4 0,6 0,8 1,0 1,2 1,4 1,6 1,8
Nondimensional Radial Distance
Non
dim
ensi
onal
Con
dens
er S
urfa
ce T
empe
retu
re
A=0,01
A=0,1
A=1
A=10
A=100
Figure E.5 Variation of nondimensional temperature as a function of nondimensional
radial distance at nondimensional axial distance 0~ =z for B=1
Page 155
135
0,0E+00
4,0E-04
8,0E-04
1,2E-03
1,6E-03
2,0E-03
2,4E-03
2,8E-03
3,2E-03
3,6E-03
0,99 0,995 1 1,005 1,01
Nondimensional Radial Distance
Non
dim
ensi
onal
Con
dens
er S
urfa
ce T
empe
retu
re A=0,01
A=0,1
A=1
A=10
A=100
Figure E.6 Variation of nondimensional temperature as a function of nondimensional
radial distance at nondimensional axial distance 0~ =z for B=1
Page 156
136
E.6 Variation of temperature at 0~ =z for B=10
The variation of temperature at surface of the substrate for B=10 is shown in
Figure E.7 and Figure E.8.
0,0E+00
3,0E-05
6,0E-05
9,0E-05
1,2E-04
1,5E-04
1,8E-04
2,1E-04
2,4E-04
2,7E-04
3,0E-04
3,3E-04
0,0 0,2 0,4 0,6 0,8 1,0 1,2 1,4 1,6 1,8
Nondimensional Radial Distance
Non
dim
ensi
onal
Con
dens
er S
urfa
ce T
empe
retu
re
A=0,01
A=0,1
A=1
A=10
A=100
Figure E.7 Variation of nondimensional temperature as a function of nondimensional
radial distance at nondimensional axial distance 0~ =z for B=10
Page 157
137
0,0E+00
3,0E-05
6,0E-05
9,0E-05
1,2E-04
1,5E-04
1,8E-04
2,1E-04
2,4E-04
2,7E-04
3,0E-04
3,3E-04
0,99 0,995 1 1,005 1,01
Nondimensional Radial Distance
Non
dim
ensi
onal
Con
dens
er S
urfa
ce T
empe
retu
re
A=0,01
A=0,1
A=1
A=10
A=100
Figure E.8 Variation of nondimensional temperature as a function of nondimensional
radial distance at nondimensional axial distance 0~ =z for B=10
Page 158
138
E.7 Variation of temperature at 0~ =z for B=100
The variation of temperature at surface of the substrate for B=100 is shown in
Figure E.9 and Figure E.10.
0,0E+00
4,0E-06
8,0E-06
1,2E-05
1,6E-05
2,0E-05
2,4E-05
2,8E-05
3,2E-05
3,6E-05
0,0 0,2 0,4 0,6 0,8 1,0 1,2 1,4 1,6 1,8
Nondimensional Radial Distance
Non
dim
ensi
onal
Con
dens
er S
urfa
ce T
empe
retu
re
A=0,01
A=0,1
A=1
A=10
A=100
Figure E.9 Variation of nondimensional temperature as a function of nondimensional
radial distance at nondimensional axial distance 0~ =z for B=100
Page 159
139
0,0E+00
4,0E-06
8,0E-06
1,2E-05
1,6E-05
2,0E-05
2,4E-05
2,8E-05
3,2E-05
3,6E-05
0,99 0,995 1 1,005 1,01
Nondimensional Radial Distance
Non
dim
ensi
onal
Con
dens
er S
urfa
ce T
empe
retu
reA=0,01
A=0,1
A=1
A=10
A=100
Figure E.10 Variation of nondimensional temperature as a function of
nondimensional radial distance at nondimensional axial distance 0~ =z for B=100
Page 160
140
E.8 The data of average temperature
Table E.3 The data of average temperature
B A r (mm) r (m) avT~
0.001 0.01 4.22066E-04 4.22066E-07 5.11304E-01 0.0013 0.01 3.24666E-04 3.24666E-07 4.91463E-01 0.0016 0.01 2.63791E-04 2.63791E-07 4.72242E-01 0.002 0.01 2.11033E-04 2.11033E-07 4.48222E-01 0.004 0.01 1.05517E-04 1.05517E-07 3.55036E-01 0.006 0.01 7.03444E-05 7.03444E-08 2.93293E-01 0.008 0.01 5.27583E-05 5.27583E-08 2.49794E-01 0.01 0.01 4.22066E-05 4.22066E-08 2.17541E-01 0.1 0.01 4.22066E-06 4.22066E-09 3.20628E-02 1 0.01 4.22066E-07 4.22066E-10 3.36844E-03
10 0.01 4.22066E-08 4.22066E-11 3.38566E-04 100 0.01 4.22066E-09 4.22066E-12 3.38742E-05
0.001 0.1 4.22066E-03 4.22066E-06 1.55351E-01
0.0013 0.1 3.24666E-03 3.24666E-06 1.53035E-01 0.0016 0.1 2.63791E-03 2.63791E-06 1.50392E-01 0.002 0.1 2.11033E-03 2.11033E-06 1.46752E-01 0.004 0.1 1.05517E-03 1.05517E-06 1.30368E-01 0.006 0.1 7.03444E-04 7.03444E-07 1.17706E-01 0.008 0.1 5.27583E-04 5.27583E-07 1.07723E-01 0.01 0.1 4.22066E-04 4.22066E-07 9.95985E-02 0.1 0.1 4.22066E-05 4.22066E-08 2.60900E-02 1 0.1 4.22066E-06 4.22066E-09 3.28297E-03
10 0.1 4.22066E-07 4.22066E-10 3.37672E-04 100 0.1 4.22066E-08 4.22066E-11 3.38652E-05
0.001 1 4.22066E-02 4.22066E-05 2.79299E-02
0.0013 1 3.24666E-02 3.24666E-05 2.78007E-02 0.0016 1 2.63791E-02 2.63791E-05 2.75924E-02 0.002 1 2.11033E-02 2.11033E-05 2.72685E-02 0.004 1 1.05517E-02 1.05517E-05 2.56462E-02 0.006 1 7.03444E-03 7.03444E-06 2.43094E-02 0.008 1 5.27583E-03 5.27583E-06 2.32130E-02 0.01 1 4.22066E-03 4.22066E-06 2.22895E-02 0.1 1 4.22066E-04 4.22066E-07 1.10563E-02 1 1 4.22066E-05 4.22066E-08 2.66074E-03
10 1 4.22066E-06 4.22066E-09 3.29083E-04 100 1 4.22066E-07 4.22066E-10 3.37759E-05
Page 161
141
Table E.3 Continued
0.001 10 4.22066E-01 4.22066E-04 3.95484E-03 0.0013 10 3.24666E-01 3.24666E-04 3.93876E-03 0.0016 10 2.63791E-01 2.63791E-04 3.91659E-03 0.002 10 2.11033E-01 2.11033E-04 3.88417E-03 0.004 10 1.05517E-01 1.05517E-04 3.73326E-03 0.006 10 7.03444E-02 7.03444E-05 3.61439E-03 0.008 10 5.27583E-02 5.27583E-05 3.51810E-03 0.01 10 4.22066E-02 4.22066E-05 3.43710E-03 0.1 10 4.22066E-03 4.22066E-06 2.35543E-03 1 10 4.22066E-04 4.22066E-07 1.11805E-03
10 10 4.22066E-05 4.22066E-08 2.66603E-04 100 10 4.22066E-06 4.22066E-09 3.29167E-05
0.001 20 8.44132E-01 8.44132E-04 2.15283E-03
0.0013 20 6.49332E-01 6.49332E-04 2.13604E-03 0.0016 20 5.27583E-01 5.27583E-04 2.11995E-03 0.002 20 4.22066E-01 4.22066E-04 2.09997E-03 0.004 20 2.11033E-01 2.11033E-04 2.02053E-03 0.006 20 1.40689E-01 1.40689E-04 1.96244E-03 0.008 20 1.05517E-01 1.05517E-04 1.91635E-03 0.01 20 8.44132E-02 8.44132E-05 1.87795E-03 0.1 20 8.44132E-03 8.44132E-06 1.36623E-03 1 20 8.44132E-04 8.44132E-07 7.39698E-04
10 20 8.44132E-05 8.44132E-08 2.24383E-04 100 20 8.44132E-06 8.44132E-09 3.20279E-05
0.001 50 2.11033E+00 2.11033E-03 9.86604E-04
0.0013 50 1.62333E+00 1.62333E-03 9.64385E-04 0.0016 50 1.31896E+00 1.31896E-03 9.48419E-04 0.002 50 1.05517E+00 1.05517E-03 9.32517E-04 0.004 50 5.27583E-01 5.27583E-04 8.87801E-04 0.006 50 3.51722E-01 3.51722E-04 8.62404E-04 0.008 50 2.63791E-01 2.63791E-04 8.43873E-04 0.01 50 2.11033E-01 2.11033E-04 8.29008E-04 0.1 50 2.11033E-02 2.11033E-05 6.40791E-04 1 50 2.11033E-03 2.11033E-06 3.96817E-04
10 50 2.11033E-04 2.11033E-07 1.58746E-04 100 50 2.11033E-05 2.11033E-08 2.97045E-05
Page 162
142
Table E.3 Continued
0.001 70 2.95446E+00 2.95446E-03 7.54305E-04 0.0013 70 2.27266E+00 2.27266E-03 7.30049E-04 0.0016 70 1.84654E+00 1.84654E-03 7.13303E-04 0.002 70 1.47723E+00 1.47723E-03 6.97333E-04 0.004 70 7.38616E-01 7.38616E-04 6.56889E-04 0.006 70 4.92410E-01 4.92410E-04 6.36622E-04 0.008 70 3.69308E-01 3.69308E-04 6.22672E-04 0.01 70 2.95446E-01 2.95446E-04 6.11819E-04 0.1 70 2.95446E-02 2.95446E-05 4.81013E-04 1 70 2.95446E-03 2.95446E-06 3.10225E-04
10 70 2.95446E-04 2.95446E-07 1.35160E-04 100 70 2.95446E-05 2.95446E-08 2.83843E-05
0.001 100 4.22066E+00 4.22066E-03 5.77478E-04
0.0013 100 3.24666E+00 3.24666E-03 5.51346E-04 0.0016 100 2.63791E+00 2.63791E-03 5.33722E-04 0.002 100 2.11033E+00 2.11033E-03 5.17365E-04 0.004 100 1.05517E+00 1.05517E-03 4.79031E-04 0.006 100 7.03444E-01 7.03444E-04 4.62020E-04 0.008 100 5.27583E-01 5.27583E-04 4.51138E-04 0.01 100 4.22066E-01 4.22066E-04 4.43038E-04 0.1 100 4.22066E-02 4.22066E-05 3.53363E-04 1 100 4.22066E-03 4.22066E-06 2.36932E-04
10 100 4.22066E-04 4.22066E-07 1.11931E-04 100 100 4.22066E-05 4.22066E-08 2.66654E-05
Page 163
143
E.9 Variation of average temperature for A=1
The variation of average nondimensional condenser surface temperature
under the droplet for the substrate A=1 is shown in Figure E.11.
0
0,5
1
1,5
2
2,5
3
0 0,5 1 1,5 2 2,5 3 3,5 4 4,5
r (m)x10-5
Aver
age
Non
dim
ensi
onal
Con
dens
er S
urfa
ce T
empe
ratu
re T
avx1
0-2
A=1
Figure E.11 Variation of average nondimensional condenser surface temperature at
the drop base area as a function of drop radius for A=1
Page 164
144
E.10 Variation of average temperature for A=0.01
The variation of average nondimensional condenser surface temperature
under the droplet for the substrate A=0.01 is shown in Figure E.12.
0
0,5
1
1,5
2
2,5
3
3,5
4
4,5
5
5,5
0 0,5 1 1,5 2 2,5 3 3,5 4 4,5
r (m)x10-7
Aver
age
Non
dim
ensi
onal
Con
dens
er S
urfa
ce T
empe
ratu
re T
avx1
0-
1
A=0.01
Figure E.12 Variation of average nondimensional condenser surface temperature at
the drop base area as a function of drop radius for A=0.01
Page 165
145
APPENDIX F
RESULTS FOR HEAT TRANSFER AND HEAT FLUX
F.1 The data and results of heat transfer and heat flux
Table F.1 The data and results of heat transfer and heat flux
B A r(m) Q (W) Q'' (W/m2) 0.001 0.01 4.22066E-07 1.17029E-04 2.09121E+08
0.0013 0.01 3.24666E-07 8.62193E-05 2.60364E+08 0.0016 0.01 2.63791E-07 6.73424E-05 3.08047E+08 0.002 0.01 2.11033E-07 5.12893E-05 3.66586E+08 0.004 0.01 1.05517E-07 2.07299E-05 5.92661E+08 0.006 0.01 7.03444E-08 1.15878E-05 7.45406E+08 0.008 0.01 5.27583E-08 7.47826E-06 8.55204E+08 0.01 0.01 4.22066E-08 5.24898E-06 9.37916E+08 0.1 0.01 4.22066E-09 8.04513E-08 1.43755E+09 1 0.01 4.22066E-10 8.49955E-10 1.51875E+09
10 0.01 4.22066E-11 8.54789E-12 1.52738E+09 100 0.01 4.22066E-12 8.55275E-14 1.52825E+09
0.001 0.1 4.22066E-06 3.91765E-03 7.00027E+07
0.0013 0.1 3.24666E-06 2.93780E-03 8.87151E+07 0.0016 0.1 2.63791E-06 2.33231E-03 1.06688E+08 0.002 0.1 2.11033E-06 1.81320E-03 1.29597E+08 0.004 0.1 1.05517E-06 8.02713E-04 2.29493E+08 0.006 0.1 7.03444E-07 4.84076E-04 3.11390E+08 0.008 0.1 5.27583E-07 3.32956E-04 3.80764E+08 0.01 0.1 4.22066E-07 2.46716E-04 4.40846E+08 0.1 0.1 4.22066E-08 6.55726E-06 1.17169E+09 1 0.1 4.22066E-09 8.28440E-08 1.48030E+09
10 0.1 4.22066E-10 8.52540E-10 1.52336E+09 100 0.1 4.22066E-11 8.55050E-12 1.52785E+09
Page 166
146
Table F.1 Continued
0.001 1 4.22066E-05 7.63545E-02 1.36434E+07
0.0013 1 3.24666E-05 5.75401E-02 1.73759E+07 0.0016 1 2.63791E-05 4.59237E-02 2.10071E+07 0.002 1 2.11033E-05 3.59723E-02 2.57109E+07 0.004 1 1.05517E-05 1.65841E-02 4.74134E+07 0.006 1 7.03444E-06 1.04044E-02 6.69281E+07 0.008 1 5.27583E-06 7.42300E-03 8.48884E+07 0.01 1 4.22066E-06 5.68856E-03 1.01646E+08 0.1 1 4.22066E-07 2.79429E-04 4.99300E+08 1 1 4.22066E-08 6.71788E-06 1.20039E+09
10 1 4.22066E-09 8.30895E-08 1.48469E+09 100 1 4.22066E-10 8.52799E-10 1.52383E+09
0.001 10 4.22066E-04 1.26607 2.26228E+06
0.0013 10 3.24666E-04 9.40480E-01 2.84005E+06 0.0016 10 2.63791E-04 7.44040E-01 3.40350E+06 0.002 10 2.11033E-04 5.78737E-01 4.13647E+06 0.004 10 1.05517E-04 2.65166E-01 7.58101E+06 0.006 10 7.03444E-05 1.67568E-01 1.07791E+07 0.008 10 5.27583E-05 1.20763E-01 1.38103E+07 0.01 10 4.22066E-05 9.35421E-02 1.67146E+07 0.1 10 4.22066E-06 6.05973E-03 1.08279E+08 1 10 4.22066E-07 2.83212E-04 5.06059E+08
10 10 4.22066E-08 6.73430E-06 1.20332E+09 100 10 4.22066E-09 8.31142E-08 1.48513E+09
0.001 20 8.44132E-04 3.00230 1.34117E+06
0.0013 20 6.49332E-04 2.19769 1.65913E+06 0.0016 20 5.27583E-04 1.72241 1.96973E+06 0.002 20 4.22066E-04 1.32894 2.37462E+06 0.004 20 2.11033E-04 6.00005E-01 4.28849E+06 0.006 20 1.40689E-04 3.77956E-01 6.07817E+06 0.008 20 1.05517E-04 2.72249E-01 7.78351E+06 0.01 20 8.44132E-05 2.10980E-01 9.42476E+06 0.1 20 8.44132E-06 1.42272E-02 6.35548E+07 1 20 8.44132E-07 7.51447E-04 3.35682E+08
10 20 8.44132E-08 2.26811E-05 1.01320E+09 100 20 8.44132E-09 3.23497E-07 1.44511E+09
Page 167
147
Table F.1 Continued
0.001 50 2.11033E-03 10.19946 7.28998E+05 0.0013 50 1.62333E-03 7.19997 8.69694E+05 0.0016 50 1.31896E-03 5.50426 1.00714E+06 0.002 50 1.05517E-03 4.15095 1.18674E+06 0.004 50 5.27583E-04 1.78767 2.04436E+06 0.006 50 3.51722E-04 1.11016 2.85652E+06 0.008 50 2.63791E-04 7.95035E-01 3.63677E+06 0.01 50 2.11033E-04 6.14513E-01 4.39218E+06 0.1 50 2.11033E-05 4.26789E-02 3.05044E+07 1 50 2.11033E-06 2.53489E-03 1.81179E+08
10 50 2.11033E-07 1.00400E-04 7.17601E+08 100 50 2.11033E-08 1.87547E-06 1.34048E+09
0.001 70 2.95446E-03 16.59215 6.05056E+05
0.0013 70 2.27266E-03 11.50315 7.08919E+05 0.0016 70 1.84654E-03 8.67836 8.10159E+05 0.002 70 1.47723E-03 6.46079 9.42407E+05 0.004 70 7.38616E-04 2.70063 1.57572E+06 0.006 70 4.92410E-04 1.65955 2.17864E+06 0.008 70 3.69308E-04 1.18262 2.76006E+06 0.01 70 2.95446E-04 9.11648E-01 3.32445E+06 0.1 70 2.95446E-05 6.34776E-02 2.31480E+07 1 70 2.95446E-06 3.89724E-03 1.42118E+08
10 70 2.95446E-07 1.67654E-04 6.11374E+08 100 70 2.95446E-08 3.51289E-06 1.28103E+09
0.001 100 4.22066E-03 28.55229 5.10188E+05
0.0013 100 3.24666E-03 19.38997 5.85535E+05 0.0016 100 2.63791E-03 14.39876 6.58649E+05 0.002 100 2.11033E-03 10.54893 7.53976E+05 0.004 100 1.05517E-03 4.23600 1.21106E+06 0.006 100 7.03444E-04 2.56260 1.64844E+06 0.008 100 5.27583E-04 1.81185 2.07201E+06 0.01 100 4.22066E-04 1.390438 2.48451E+06 0.1 100 4.22066E-05 9.64120E-02 1.72274E+07 1 100 4.22066E-06 6.10133E-03 1.09022E+08
10 100 4.22066E-07 2.83596E-04 5.06745E+08 100 100 4.22066E-08 6.73595E-06 1.20362E+09
Page 168
148
F.2 Variation of heat transfer and heat flux for A=0.01
The variation of heat transfer and heat flux under the droplet for the substrate
A=0.01 is shown in Figure F.1 and Figure F.2, respectively.
0
0,2
0,4
0,6
0,8
1
1,2
0 0,5 1 1,5 2 2,5 3 3,5 4 4,5
r (m)x10-7
Q (W
)x10
+4
A=0.01
Figure F.1 Variation of heat transfer with drop radius for A=0.01
Page 169
149
0
2
4
6
8
10
12
14
16
0 0,5 1 1,5 2 2,5 3 3,5 4 4,5
r (m)x10-7
Q''
(W/m
²)x10
+8A=0.01
Figure F.2 Variation of heat flux with drop radius for A=0.01
Page 170
150
F.3 Variation of heat transfer and heat flux for A=100
The variation of heat transfer and heat flux under the droplet for the substrate
A=100 is shown in Figure F.3 and Figure F.4, respectively.
0
5
10
15
20
25
30
0 0,5 1 1,5 2 2,5 3 3,5 4 4,5
r (m)
Q (W
)
A=100
Figure F.3 Variation of heat transfer with drop radius for A=100
Page 171
151
0
20
40
60
80
100
120
140
0 0,01 0,02 0,03 0,04 0,05
r (m)x10-3
Q''
(W/m
²)x10
+7
A=100
Figure F.4 Variation of heat flux with drop radius for A=100
Page 172
152
F.4 The data and results of nondimensional heat transfer (Qnd)
Table F.2 The data and results of nondimensional heat transfer (Qnd)
B A r(mm) r(m) Qnd 0.001 0.01 4.22066E-04 4.22066E-07 4.29901 0.001 0.1 4.22066E-03 4.22066E-06 14.39082 0.001 1 4.22066E-02 4.22066E-05 28.04752 0.001 10 4.22066E-01 4.22066E-04 46.50722 0.001 20 8.44132E-01 8.44132E-04 55.14280 0.001 50 2.11033E+00 2.11033E-03 74.93275 0.001 70 2.95446E+00 2.95446E-03 87.07002 0.001 100 4.22066E+00 4.22066E-03 104.88283
0.0013 0.01 3.24666E-04 3.24666E-07 4.11725 0.0013 0.1 3.24666E-03 3.24666E-06 14.02895 0.0013 1 3.24666E-02 3.24666E-05 27.47730 0.0013 10 3.24666E-01 3.24666E-04 44.91099 0.0013 20 6.49332E-01 6.49332E-04 52.47334 0.0013 50 1.62333E+00 1.62333E-03 68.76438 0.0013 70 2.27266E+00 2.27266E-03 78.47326 0.0013 100 3.24666E+00 3.24666E-03 92.59346
0.0016 0.01 2.63791E-04 2.63791E-07 3.95793 0.0016 0.1 2.63791E-03 2.63791E-06 13.70773 0.0016 1 2.63791E-02 2.63791E-05 26.99088 0.0016 10 2.63791E-01 2.63791E-04 43.72964 0.0016 20 5.27583E-01 5.27583E-04 50.61589 0.0016 50 1.31896E+00 1.31896E-03 64.70069 0.0016 70 1.84654E+00 1.84654E-03 72.86503 0.0016 100 2.63791E+00 2.63791E-03 84.62621
0.002 0.01 2.11033E-04 2.11033E-07 3.76805 0.002 0.1 2.11033E-03 2.11033E-06 13.32094 0.002 1 2.11033E-02 2.11033E-05 26.42762 0.002 10 2.11033E-01 2.11033E-04 42.51785 0.002 20 4.22066E-01 4.22066E-04 48.81623 0.002 50 1.05517E+00 1.05517E-03 60.99117 0.002 70 1.47723E+00 1.47723E-03 67.80746 0.002 100 2.11033E+00 2.11033E-03 77.49935
Page 173
153
Table F.2 Continued
0.004 0.01 1.05517E-04 1.05517E-07 3.04591 0.004 0.1 1.05517E-03 1.05517E-06 11.79452 0.004 1 1.05517E-02 1.05517E-05 24.36751 0.004 10 1.05517E-01 1.05517E-04 38.96170 0.004 20 2.11033E-01 2.11033E-04 44.08032 0.004 50 5.27583E-01 5.27583E-04 52.53357 0.004 70 7.38616E-01 7.38616E-04 56.68751 0.004 100 1.05517E+00 1.05517E-03 62.24092
0.006 0.01 7.03444E-05 7.03444E-08 2.55394 0.006 0.1 7.03444E-04 7.03444E-07 10.66903 0.006 1 7.03444E-03 7.03444E-06 22.93132 0.006 10 7.03444E-02 7.03444E-05 36.93197 0.006 20 1.40689E-01 1.40689E-04 41.65068 0.006 50 3.51722E-01 3.51722E-04 48.93589 0.006 70 4.92410E-01 4.92410E-04 52.25211 0.006 100 7.03444E-01 7.03444E-04 56.47965
0.008 0.01 5.27583E-05 5.27583E-08 2.19761 0.008 0.1 5.27583E-04 5.27583E-07 9.78445 0.008 1 5.27583E-03 5.27583E-06 21.81368 0.008 10 5.27583E-02 5.27583E-05 35.48820 0.008 20 1.05517E-01 1.05517E-04 40.00239 0.008 50 2.63791E-01 2.63791E-04 46.72682 0.008 70 3.69308E-01 3.69308E-04 49.64724 0.008 100 5.27583E-01 5.27583E-04 53.24417
0.01 0.01 4.22066E-05 4.22066E-08 1.92812 0.01 0.1 4.22066E-04 4.22066E-07 9.06269 0.01 1 4.22066E-03 4.22066E-06 20.89593 0.01 10 4.22066E-02 4.22066E-05 34.36111 0.01 20 8.44132E-02 8.44132E-05 38.74996 0.01 50 2.11033E-01 2.11033E-04 45.14638 0.01 70 2.95446E-01 2.95446E-04 47.84006 0.01 100 4.22066E-01 4.22066E-04 51.07577
Page 174
154
Table F.2 Continued
0.1 0.01 4.22066E-06 4.22066E-09 0.29552 0.1 0.1 4.22066E-05 4.22066E-08 2.40870 0.1 1 4.22066E-04 4.22066E-07 10.26436 0.1 10 4.22066E-03 4.22066E-06 22.25938 0.1 20 8.44132E-03 8.44132E-06 26.13053 0.1 50 2.11033E-02 2.11033E-05 31.35470 0.1 70 2.95446E-02 2.95446E-05 33.31060 0.1 100 4.22066E-02 4.22066E-05 35.41532
1 0.01 4.22066E-07 4.22066E-10 0.03122 1 0.1 4.22066E-06 4.22066E-09 0.30431 1 1 4.22066E-05 4.22066E-08 2.46770 1 10 4.22066E-04 4.22066E-07 10.40331 1 20 8.44132E-04 8.44132E-07 13.80156 1 50 2.11033E-03 2.11033E-06 18.62299 1 70 2.95446E-03 2.95446E-06 20.45123 1 100 4.22066E-03 4.22066E-06 22.41218
10 0.01 4.22066E-08 4.22066E-11 0.00314 10 0.1 4.22066E-07 4.22066E-10 0.03132 10 1 4.22066E-06 4.22066E-09 0.30522 10 10 4.22066E-05 4.22066E-08 2.47373 10 20 8.44132E-05 8.44132E-08 4.16576 10 50 2.11033E-04 2.11033E-07 7.37601 10 70 2.95446E-04 2.95446E-07 8.79783 10 100 4.22066E-04 4.22066E-07 10.41742
100 0.01 4.22066E-09 4.22066E-12 0.00031 100 0.1 4.22066E-08 4.22066E-11 0.00314 100 1 4.22066E-07 4.22066E-10 0.03133 100 10 4.22066E-06 4.22066E-09 0.30531 100 20 8.44132E-06 8.44132E-09 0.59416 100 50 2.11033E-05 2.11033E-08 1.37785 100 70 2.95446E-05 2.95446E-08 1.84343 100 100 4.22066E-05 4.22066E-08 2.47434
Page 175
155
F.5 Variation of nondimensional heat transfer (Qnd) and dimensional heat
transfer (Q) for B=0.01, 0.1, 1, 10, 100
Variation of nondimensional heat transfer (Qnd) and dimensional heat transfer
(Q) for B=0.01 is shown in Figure F.5 and Figure F.6, respectively.
0
6
12
18
24
30
36
42
48
54
0 20 40 60 80 100
A
Qnd
B=0.01
Figure F.5 Variation of Qnd with A for B=0.01
Page 176
156
0
0,2
0,4
0,6
0,8
1
1,2
1,4
1,6
0 20 40 60 80 100
A
Q (W
) B=0.01
Figure F.6 Variation of Q with A for B=0.01
Page 177
157
Variation of nondimensional heat transfer (Qnd) and dimensional heat
transfer (Q) for B=0.1 is shown in Figure F.7 and Figure F.8, respectively.
0
4
8
12
16
20
24
28
32
36
0 20 40 60 80 100
A
Qnd
B=0.1
Figure F.7 Variation of Qnd with A for B=0.1
Page 178
158
0
0,01
0,02
0,03
0,04
0,05
0,06
0,07
0,08
0,09
0,1
0 20 40 60 80 100
A
Q (
W )
B=0.1
Figure F.8 Variation of Q with A for B=0.1
Page 179
159
Variation of nondimensional heat transfer (Qnd) and dimensional heat transfer
(Q) for B=1 is shown in Figure F.9 and Figure F.10, respectively.
0
4
8
12
16
20
24
0 20 40 60 80 100
A
Qnd
B=1
Figure F.9 Variation of Qnd with A for B=1
Page 180
160
0
1
2
3
4
5
6
7
0 20 40 60 80 100
A
Q (W
) x10
-3
B=1
Figure F.10 Variation of Q with A for B=1
Page 181
161
Variation of nondimensional heat transfer (Qnd) and dimensional heat transfer
(Q) for B=10 is shown in Figure F.11 and Figure F.12, respectively.
0
1
2
3
4
5
6
7
8
9
10
11
0 20 40 60 80 100
A
Qnd
B=10
Figure F.11 Variation of Qnd with A for B=10
Page 182
162
0
0,5
1
1,5
2
2,5
3
0 20 40 60 80 100
A
Q (W
) x10
-4
B=10
Figure F.12 Variation of Q with A for B=10
Page 183
163
Variation of nondimensional heat transfer (Qnd) and dimensional heat transfer
(Q) for B=100 is shown in Figure F.13 and Figure F.14, respectively.
0
0,5
1
1,5
2
2,5
0 20 40 60 80 100
A
Qnd
B=100
Figure F.13 Variation of Qnd with A for B=100
Page 184
164
0
1
2
3
4
5
6
7
0 20 40 60 80 100
A
Q (W
) x10
-6B=100
Figure F.14 Variation of Q with A for B=100
Page 185
165
F.6 Variation of nondimensional drop resistance for B=0.001 and A=1
The variation of nondimensional drop resistance for B=0.001 and A=1 is
given in Table F.3.
Table F.3 Variation of nondimensional drop resistance for B=0.001 and A=1
i Fr
1 1.503384 2 2.079615 3 2.628648 4 3.39832 5 4.457397 6 5.902899 7 7.867437 8 10.52983 9 14.12915
10 18.98219 11 25.50465 12 34.23413 13 45.85363 14 61.20789 15 81.30518 16 107.2838 17 140.3291 18 181.5126 19 231.5603 20 290.5285 21 357.5433 22 430.6468 23 506.9167 24 582.8731 25 655.1416 26 720.8043 27 778.2587 28 826.7162 29 866.3265 30 898.1007 31 1000
Page 186
166
F.7 Variation of heat transfer and heat flux with A for r=4.22x10⁻⁶ m
Variation of heat transfer and heat flux with A for r=4.22x10⁻⁶ m is shown in
Figure F.15 and Figure F.16, respectively.
3,8
4,2
4,6
5
5,4
5,8
6,2
0 2 4 6 8 10
A
Q (W
)x10
-3
Figure F.15 Variation of heat transfer with A for r=4.22x10⁻⁶ m
Page 187
167
0,65
0,75
0,85
0,95
1,05
1,15
0 2 4 6 8 10
A
Q''
(W/m
²)x10
+8
Figure F.16 Variation of heat flux with A for r=4.22x10⁻⁶ m