Journal of Alloys and Compounds, 215 (1994) 293-301 293 JALCOM 1226
A thermodynamic evaluation of the Ag-Pb-Sb system
B y u n g - Z u Lee , C h a n g - S e o k O h a n d D o n g N y u n g L e e * Department of Metallurgical Engineering and Center for Advanced Materials Research, Seoul National University, Shinrim-2-dong, Kwanak-gu, Seoul 151-742 (South Korea)
(Received January 11, 1994; in final form March 18, 1994)
Abstract
The Ag-Pb-Sb ternary system and its low order Ag-Pb, Pb-Sb and Ag-Sb binary systems have been evaluated thermodynamically by applying the tAra'HAD method. A set of the Gibbs energy parameters of the various phases in the individual systems has been obtained through a computer-operated optimization procedure with the available experimental information. The calculated thermodynamic quantities and phase equilibria are in close agreement with the literature values. Parameters describing the Gibbs energies of all the phases used in this calculation and the calculated results are presented.
1. Introduction
Because Ag and Sb exist as impurity elements in the refining process of Pb, understanding of the thermo- dynamic behaviour of each element in the liquid alloy and of the phase relationships is important. However, very limited thermodynamic information on the Ag-Pb-Sb system has been reported and, furthermore, a thermodynamic evaluation of the Ag-Sb system, which is a prerequisite to the overall assessment of the Ag-Pb-Sb system, has not yet been made. Reviews of the thermochemical information on as well as ther- modynamic evaluations of the Ag-Pb and Pb-Sb systems have already been made by Karakaya and Thompson [1] and Ashtakala et al. [2] respectively. In order to calculate the phase equilibria of the Ag-Pb-Sb ternary system, its low order Ag-Pb, Pb-Sb and Ag-Sb binary systems should be consistently evaluated a priori by using the same Gibbs energy functions for the pure elements. Since the lattice stability data of the pure elements used in the previous work [1, 2] were selected from different sources, employing the reported Gibbs energy parameters to calculate the phase equilibria of the Ag-Pb-Sb system may lead to erroneous results. Therefore in the present study the Ag-Pb and Pb-Sb systems were re-evaluated and the Ag-Sb system was evaluated by adopting the lattice stability data in the Scientific Group Thermodata Europe (SGTE) database [3] which are now accepted world wide.
The other purpose of this study is to check the consistency between the different types of experimental
*Author to whom correspondence should be addressed.
data from various sources and to provide a critical assessment of the thermodynamic properties of the Ag-Pb-Sb system and its low order Ag-Pb, Pb-Sb and Ag-Sb systems.
2. Experimental information
2.1. A g - P b system The Ag-Pb system has a liquid and two terminal
f.c.c, phases. The phase boundary data of this system have been reported by many investigators and a detailed review can be found elsewhere [1]. The liquidus points over the entire concentration range were determined by Petrenko [4] using thermal analyses and by Friedrich [5] using thermal analyses with a metallographic method. The Ag liquidus points near the eutectic point were measured by Kleppa [6] using the equilibration of liquid alloys with solid Ag and by Preckshot and Hudrlik [7] using diffusion analyses. The two results show close agreement and are believed to be more reliable than those obtained by thermal analyses because of the insensitivity of cooling curve measurements when the two-phase region is very wide. In addition, the Pb liquidus points were determined by Esdaile and Siviour [8] using a high shear technique. Akopyan et al. [9] determined the solid solubilities of Pb in Ag solid solution by thermoelectric power and lattice parameter measurements. The solid solubilities of Ag in Pb solid solution were determined by Seith and Keil [10] using diffusion experiments and by Tsumuraya and Ohno [11] using electrical resistivity and lattice parameter mea- surements.
2 9 4 B.-Z. Lee et aL / Thermodynamic evaluation of Ag-Pb-Sb system
The mixing enthalpies of the liquid alloy were mea- sured by Castanet et al. [12] at 1280 K, by Itagaki and Yazawa [13] at 1273 K using calorimetry and by Jacob and Jeffes [14] at 1100 K using an e.m.f, method. The activities of Pb in the liquid alloy were measured electrochemically by Iwase et al. [15], Jacob and Jeffes [14] and Hager and Wilkomirsky [16] at 973-1273 K, 1000-1100 K and 1048-1223 K respectively.
2.2. Pb-Sb system The Pb-Sb system consists of liquid, f.c.c. (Ph) and
rhombohedral (Sb) phases. Several constitutional ex- periments of this system have been published in the literature. The liquidus points were determined by Dean [17] using thermal analyses with a metallographic method, by Blumenthal [18] using thermal analyses and by Moser et al. [19]. The solid solubilities of Sb in Pb solid solution were determined by Pellini and Rhines [20] and Obinata and Schmid [21]. In addition, the solid solubility data of Pb in Sb solid solution were determined by Oelsen et al. [22].
Wittig and Gehring [23], Yazawa et al. [24] and Kawakami [25] measured the mixing enthalpies of the liquid alloy at 973, 945 and 1073 K respectively using calorimetry. Also, Hultgren et al. [26] reported the mixing enthalpies of the liquid alloy at 905 K in their compilation. The mixing enthalpies of the f.c.c. (Pb) solid solution were measured by Diller et al. [27] at 525 K using solution calorimetry. The activities of Pb in the liquid alloy were measured by Seltz and Dewitt [28], Kohand and Lee [29], and Elliott and Chipman [30] at 643-903, 693-853 and 773 K respectively using an e.m.f, method. Moser et al. [19] measured the partial molar Gibbs free energies of Pb in the liquid alloy at 905 K using an e.m.f, method.
2.3. A g - S b system The Ag-Sb system exhibits five phases, i.e. liquid,
f.c.c. (Ag), h,c.p. ((), AgaSb (e) and rhombohedral (Sb). All the phases except the rhombohedral (Sb) phase show a solubility range. The phase boundary data of this system have been reported by several authors. Petrenko [31], Reynolds and Hume-Rothery [32] and Heycock and Neville [33] reported liquidus data mea- sured by differential thermal analyses. Weibke and Efinger [34] confirmed the h.c.p. (sO and Ag3Sb (e) phases by X-ray analyses and determined the solid phase boundaries. Recently Feschotte et al. [35] mea- sured the solid solution phase boundaries and invariant equilibria using differential thermal and X-ray analyses around the Ag3Sb (e) concentration region; in contrast with previous work [34], no order-disorder transfor- mation was detected in the m g 3 S b ( e ) phase.
Kawakami [25], Ehrlich [36] and Predel and Emam [37] reported calorimetrically measured mixing enthalpy
T A B L E 1. D e r i v e d i n t e r a c t i o n p a r a m e t e r s ( J m o l -~ ) o f s t a b l e
p h a s e s o f t h e A g - P b , P b - S b , A g - S b a n d A g - P b - S b s y s t e m s
data of the liquid alloy at 1323 K in the range 0.182<Xsb~<0.792, at 1248 K in the range 0.075 ~ < X s b ~ < 0 . 9 and at 1273 K over the whole con- centration range respectively. Because the oldest data of Kawakami are in disagreement with those of the other workers, Ehrlich's results, which were selected in Hultgren et al.'s compilation [38], and Predel and Emam's data were used in the present optimization procedure. The partial molar Gibbs free energies of Ag in the liquid alloy have been measured using an e.m.f, method by Nozaki et al. [39] at 1300 K, by Okajima and Sakao [40] at 893 K and by Vecher and Gerasimov [41] at 903-1103 K. Those of Sb at 1273-1473 K in the" liquid alloy have been determined from vapour pressure measurements by Hino et al. [42], while selected values at 1250 K were also found in Hultgren et al.'s compilation [38].
With regard to the thermodynamic parameters of the solid phases, Kleppa [43] reported mixing enthalpies of the f.c.c. (Ag), h.c.p. ( 0 and Ag3Sb (e) phases measured at 723 K using liquid tin solution calorimetry in the range 0.063 ~<Xsb ~ 0.933. Because the reported
B.-Z. Lee et al. / Thermodynamic evaluation o f Ag-Pb-Sb system 295
T A B L E 2. Compar ison between the calculated and measured invariant equil ibrium data of the Ag-Pb , Pb-Sb and Ag-Sb systems
System Invariant This study Previous study Reference
Ag A t o m i c F r a c t i o n P b Fig. 1. Calculated A g - P b phase diagram together with experi- mental values.
1 1 0 0
dlOOO 9 0 0
error of the experiments is of the same order as the measured values, they are not considered very reliable.
2.4. Ag-Pb-Sb system The Ag-Pb-Sb system has liquid, f.c.c. (Ag, Pb),
h.c.p. (0 , Ag3Sb (e) and rhombohedral (Sb) phases, but no ternary compounds have been reported so far. Blumenthal [18] reported the measured phase bound- aries in the Pb-rich region at various Ag and Sb contents, as well as the liquidus projection, isothermal liquidus lines and compositions of liquid phases in the invariant equilibria. Based on that work, the composition of each phase in three invariant equilibria, U1, U2 and El, was evaluated by Rainer [44]. Recently Moon and Lee [45]
0 . 0 0 . 2 0 . 4 0 . 6 0 . 8 1 .0 Ag A t o m i c F r a c t i o n P b
Fig. 2. Calculated mixing enthalpies of the liquid A g - P b system at 1273 K together with measu red data.
measured Sb activities in the liquid phase at 1250 K employing both isothermal and isopicstic equilibrium methods and claimed that the liquid phase showed a regular solution behaviour.
3. Thermodynamic model
Two thermodynamic models were employed to de- scribe the Gibbs energies of phases in the binary and ternary systems. One is the substitutional solution model and the other is the two-sublattice model [46]. Only the Ag3Sb (e) phase appearing in the Ag-Sb system was represented by the two-sublattice model. The other
296 B.-Z. Lee et aL / Thermodynamic evaluation of Ag-Pb-Sb system
1 . 0 ' ' I ' I I I I I I ' I t I I I I I I I I I I I ' I ' ' ' I ' ' I I I I I I I I ' I t ' ' I J I l
N i/ 0.8 .,
. ~ 0.6 /
.p-'4
< 0.4
0.2
0.0 0.2 0.4 0.6 0.8 1.0 Ag A t o m i c F r a c t i o n Pb
Fig. 3. Calculated activities of Ag and Pb in the liquid Ag-Pb system at 1273 K together with measured data.
8 0 i l l l l ' l l l ' l l l l l l l l l l l l l l l ' ' ' ' ' l ' * ' ' ' ' ' ' t t l l l l l l l l l O A 973K945K Wittigyazawa[23][24]
Here Xi denotes the atomic fraction of pure substance i and °Gi is the Gibbs energy function of pure element i with respect to its stable modification at 298.15 K according to the S a T E description. The binary inter- action parameters L~.: are represented by the well- known Redlich-Kister polynomials and the ternary in- teraction parameter L;j.k is given as a function of composition and temperature.
B.-Z. Lee et al. / Thermodynamic evaluation o f A g - P b - S b system 2 9 7
1300
1200
1100
1000
900
~ 800
~ 700
600 t
500- ,, 0.0 Ag
I l t l l l l l l l , l l l ~ t t l l l l t ~ l l l l l l , , ~ l l l l l l l l l l l l ~ l l
(3 R e y n o l d s [ 3 2 ]
[] H e y c o e k [ 3 3 ]
/', W e i b k e [ 3 4 ]
* F e s e h o t t e [ 3 5 ]
0.z 0 . 4 . . . . . . b.'6 ... . . . 0'.'8 . . . . . . i .0 A t o m i c F r a c t i o n Sb
Fig. 7. Calculated Ag-Sb phase diagram together with experimental values.
1.0 X \ (3 1 3 0 0 K N o z a k i [ 3 9 ] ~ y
\ \ \ [] 1250K Hultgren [38] / \ l Z 7 3 r
~ / / / / A & \ \ \ o 0.4
/ \ / \
0.2 / / / \ \
0.0 ~ 0.0 0.2 0.4 0.6 0.8 1.0 Ag A t o m i c F r a c t i o n Sb
Fig. 9. Calculated activities of Ag and Sb in the liquid Ag-Sb system at 1273 K together with measured data.
1500
o i000-
500-
~ o
-500
~:J~ -1000
~i~ -15o0 !
- oooi -25ooi
I l l l l l l l l l l l l l t l l l ~ l l l l ~ l l l l l l B l l l l . t t J l l J l l L t J J l l
- - 3 0 0 0 : ~ O 1 2 7 3 K P r e d e l [ 3 7 ]
[] ~ 1 2 5 0 K H u l t g r e n [ 3 8 ] - 3500 : . . . . . . . . . . . . . . . . . . . . . . . . . . . . . , . . . . . . . . . . . . . . . . . . .
0.0 0.2 0.4 0.6 0.8 1.0 Ag A t o m i c F r a c t i o n Sb
Fig . 8. C a l c u l a t e d m i x i n g e n t h a l p i e s o f t h e l i q u i d A g - S b s y s t e m
a t 1273 K t o g e t h e r w i t h m e a s u r e d d a t a .
1.o S b
o¢ ~ o ~,b = 0.9 0.8 . ,~____~ [ ] ~ =
~ z x - b = ° ' a 0.69
::::oO°:oo
i .... i i ...... 0.0 "(,,,,,,, .... , . . . . .
Ag 0.0 0.2 0.4 0.6 0.8 1.0 Pb A t o m i c F r a c t i o n
Fig . 10. C a l c u l a t e d ac t iv i t i e s o f S b in t h e l i q u i d A g - P b - S b s y s t e m
a t 1 2 5 0 K t o g e t h e r w i t h m e a s u r e d d a t a .
3.2. Two-sublattice model The Ag3Sb (e) phase exhibits the fl-Cu3Ti prototype
structure. Based on the atomic occupations in the unit cell of the fl-Cu3Ti phase [47], the Ag3Sb (e) phase was described by the formula unit (Ag, Sb)3(Ag,Sb)l.
The Gibbs energy per formula unit is given as
e __ V I V II o/"2~e --I- V I V I I o f 2e Gm - - ~Ag~t Ag 'UAg:Ag - - ~ A g X Sb U A g : S b
I II O E V I VI I Ot"2e + Y s b Y A g a S b : A g + x S b ~tSb u S b : S b
+ 3RT(Y[Ag In Y~g + yIb in ylb)
+ RT(Y~g In Y~g + yi~ In Ynb)+ eXG~ (3)
where
ex e __ V I V I VII l e -4- V I V I V II I e Gm - - Z A g ~tSb Jt AgLJAg, Sb:Ag - - ~ A g x S b J ' S b a'J Ag, Sb:Sb
- t - V I VI I VII l e Sb "~ V I VI I V I I ] e ~tAg ~t Ag ~t SbL, Ag:Ag, x S b X A g Jt SbL"Sb:Ag, Sb
V I V I VI I VII l e ~t Ag ~t Sb ~t Ag Jt Sbk 'Ag, Sb;Ag, Sb ( 4 )
Here Y~ denotes the site fraction of component i on sublattice I. The parameter °G~g:Ag represents the Gibbs energy of the hypothetical Ag3Sb (e) phase when each sublattice is filled with only Ag. The symbol [:] separates components in different sublattices and [,] components in the same sublattice. Because of insufficient exper- imental data, all the interaction parameters of eqn. (4) could not be accurately obtained. Therefore some in-
298 B.-Z. Lee et aL / Thermodynamic evaluation of Ag-Pb-Sb system
1.o Sb
og7 0 . 8 ~ b" / \ \ ,,oo.o/\y \
"\
Ag 0.0 0.2 0.4 o.6 0.8 1.0 P b A t o m i c F r a c t i o n
Fig. 11. Calculated isoenthalpies of mixing (J tool -1) for the liquid Ag-Pb--Sb system at 1273 K.
teraction parameters were estimated empirically until phase relations could be well reproduced.
4. Results and discussion
All the Gibbs energies of the elements and the interaction parameters of the phases optimized using the available experimental thermodynamic and phase equilibrium data are given in Table 1.
4.1. Ag-Pb system The calculated phase diagram of the Ag-Pb system
is shown in Fig. 1 together with the literature values from various authors. The calculated invariant equi- librium is also given in Table 2 compared with the earlier assessment by Karakaya and Thompson [1]. Although a smaller number of excess Gibbs energy parameters for describing the liquid phase were em- ployed than in the previous evaluation, the overall calculated phase boundaries as well as the temperature and composition of each phase participating in the eutectic reaction show excellent agreement with the experimental values.
The calculated thermodynamic quantities of the liquid alloy are presented in Figs. 2 and 3. As shown in Fig. 2, the calculated mixing enthalpies of the liquid alloy at 1273 K reproduce the various experimental data fairly well except for the values measured by Castanet et al. [12]. The calculated activities of Ag and Pb in the liquid alloy at 1273 K along with measured data are given in Fig. 3, which shows excellent agreement between the calculated results and the experiments.
T(°C) = 200 + 50Z
(a)
t.o Sb
~ 0 . ~
~¢~ 0.6
.4 2 o.
Ag 0.0 o.z 0.4 0.6 0.8 1.0 Pb Atomic F r a c t i o n
( b )
0.6 Pb 0.4 Sb
£
0.6 Pb Atomic F r a c t i o n 0.0 Sb
Pb
0.0 Ag 40.0 Sb
~ 2 grid in at.% axes in at.%
/ x ? T _ / ~ ( s b ) ( c ) ~ 250°
~0". 280 °
/X /X /X .,
40.0 Ag 304° Pb 60.0 Pb Fig. 12. (a) Calculated liquidus projection and isothermal liquidus lines of the Ag-Pb-Sb system. (b) Calculated liquidus projection and isothermal liquidus lines in a Pb-rich region of the Ag-Pb-Sb system. (c) Measured liquldus projection and isothermal liquidus lines in a Pb-rich region of the Ag-Pb~Sb system.
4.2. Pb-Sb system Figure 4 shows the calculated phase diagram of the
Pb-Sb system together with the various measured phase
B.-Z. Lee et al. I Thermodynamic evaluation of Ag-Pb-Sb system 299
320 J t I
310- ~ ~ Blumenthal [18] /
300-
280
~ 270-
e. 250 \ • 240- ~ ~/'~ :'
/ L + Pb + Sb 230- Pb + Sb +
220 0 0.05 0. 0 0.15 .20
(o) Weight Frac t ion Sb
320
310-
300-
290-
280-
.~ 2 7 0 -
~' 260-
250-
240 -
230-
220-
(b)
B,.m:nth.1 EI ,/f
L_ L + Pb + Sb
Pb + Sb +
I I 0/15 0.05 0.10 0.20
Weight Fract ion Sb
E,-,
0
(c)
t I , =,ume t.aa E'OI/
~ A A A A Ax',X//A A A A
P b + S b + e
0. ' i0 0.05 0.15 0.20
Weight Fract ion Sb
360
340
.~ 320
d ~ 3oo
~ 2 6 0 -
~ L ~ 260-~
240- L + P b
+ Sb 220
(d)
lame7 + P b ~
/
P b + S b + ~
0 0.02 0.04 0.06
Weight Fraction Ag
Fig. 13. Calculated vertical sections at (a) 0.4 wt.% Ag, (b) 0.8 wt.% Ag, (c) 2 wt.% Ag and (d) 10 wt.% Sb.
TABLE 3. Comparison between the calculated and measured invariant equilibrium data of the Ag-Pb-Sb system
Invariant Temperature (K) Phase Composition (at.%) equilibrium
Exp. Calc. XAg Xpb Xsb
Exp. Calc. Exp. Calc. Exp. Calc.
Ut 570 565.3 L + (Ag) ~- ~'+ (Pb)
U2 545 554.0 L + ~ r ~ e + ( P b )
E1 517.7 512.8 L ~ (Sb) + e+ (Pb)
L 3.74 4.20 93.95 91.86 2.32 3.94 (Ag) 94.65 92.88 0 0.81 5.35 6.31 s r 91.04 89.32 0 0 8.96 10.68 (Pb) 0 1.59 99.15 98.25 0.85 0.16
L 2.91 3.859 87.43 88.68 9.66 7.47 s r 84.64 84.64 0 0 15.36 15.36 e 78.14 76.19 0 0 21.86 23.81 (Pb) 0 0.15 96.64 97.03 3.36 2.82
300 B.-Z. Lee et al. / Thermodynamic evaluation of .4g-Pb-Sb system
Ag-Pb Pb-Sb Ag-Pb-Sb Ag-Sb
~ 7 6 . 8 I e ,
L $ (Ag) +(Pb)
L# (Pb)+(Sb)
I (AX)+¢+(Pb) l
L+~'~(Pb) - -
¢ +~+tPb) [ L+E:+(P'b
I
(Sb) +l:+(Pb)
L ~ • + (Sb)
Fig. 14. Calculated reaction scheme for the Ag-Pb-Sb system. Temperatures are given in kelvins.
boundary data. The agreement between the calculated and experimental phase boundaries is quite satisfactory over the whole concentration and temperature range. Although slight differences between the calculated Pb solidus line and older measured data [20] are observed, this discrepancy is acceptable considering that the f.c.c. (Pb) phase was described by a simple regular solution model and the overall agreement is satisfactory. The calculated invariant equilibria are given in Table 2 and show excellent agreement with the previous results calculated by Ashtakala et al. [2].
The calculated mixing enthalpies of the liquid alloy at 905 K are shown in Fig. 5 along with the experimental data. Although the measured mixing enthalpies exhibit very small negative values and are scattered in the overall concentration range, the calculated results sup- port Wittig and Gehring's measurements. Figure 6 compares the calculated activities of Pb and Sb as a function of composition in the liquid alloy at 748 K with the measured data, where good agreement between the calculated and measured values is obtained.
4.3. Ag-Sb system Comparison of the calculated phase diagram of the
Ag-Sb system with the experimental results is made in Fig. 7. The agreement between the calculated and measured phase diagrams is generally satisfactory, but the calculated phase boundaries including the AgaSb (e) phase disagree a little with the recent data of Feschotte et al. [35] in that the calculated solution range of the Ag3Sb (e) phase is shifted to Sb-rich concentrations. This disagreement between the cal- culated and measured results may be attributed to the following reasons. Firstly, it was difficult to obtain interaction parameters of the Ag3Sb (e) phase owing to a lack of experimental data as mentioned above. Secondly, there has been no unambiguous method of evaluating the lattice stabilities of elements in the
required metastable states up to now, which is a common stumbling block whenever assessing phase equilibria containing phases with complex modifications. Further experimental data, especially thermodynamic quantities of the solid phases, may improve the calculated phase diagram.
The calculated mixing enthalpies of the liquid alloy at 1273 K are in very good agreement with the ex- perimental values as shown in Fig. 8. The calculated values show a minimum near Xsb=0.2 as in the ex- perimental data, but are less exothermic in that region than the measured data. Figure 9 shows the calculated activities of Ag and Sb in the liquid alloy at 1273 K along with the experimental data. The calculated ac- tivities of both elements are in satisfactory agreement with the experimental data. The calculated Sb activities in the liquid phase at 1273 K show a negative deviation in the low Sb concentration region, but deviate positively as the Sb concentration increases. This behaviour to- gether with the S-shaped enthalpy curve is consistent with the combination of the compound-forming ten- dency, e.g. the Ag-rich Hume-Rothery phase, and the eutectic equilibrium in the middle region, which also relates to the relative valency effect between noble and high valency metals. Table 2 lists the experimental and calculated invariant equilibria of this system.
4.4. Ag-Pb-Sb system The calculated isoactivities of Sb in the liquid alloy
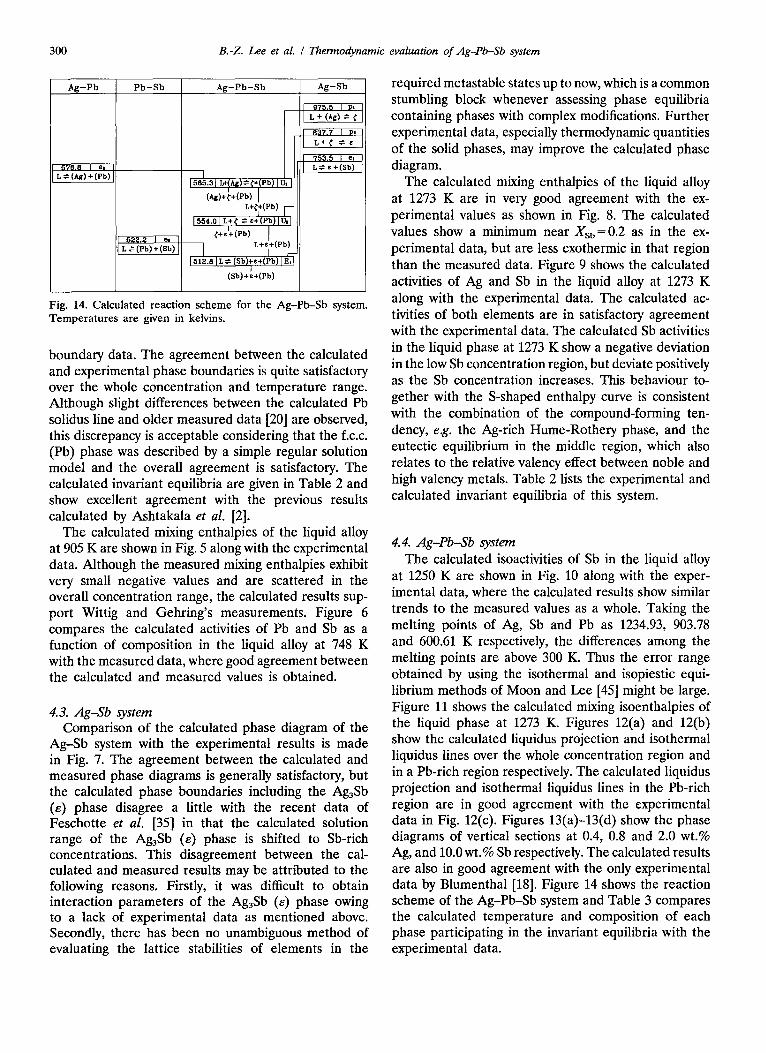
at 1250 K are shown in Fig. 10 along with the exper- imental data, where the calculated results show similar trends to the measured values as a whole. Taking the melting points of Ag, Sb and Pb as 1234.93, 903.78 and 600.61 K respectively, the differences among the melting points are above 300 K. Thus the error range obtained by using the isothermal and isopiestic equi- librium methods of Moon and Lee [45] might be large. Figure 11 shows the calculated mixing isoenthalpies of the liquid phase at 1273 K. Figures 12(a) and 12(b) show the calculated liquidus projection and isothermal liquidus lines over the whole concentration region and in a Pb-rich region respectively. The calculated liquidus projection and isothermal liquidus lines in the Pb-rich region are in good agreement with the experimental data in Fig. 12(c). Figures 13(a)-13(d) show the phase diagrams of vertical sections at 0.4, 0.8 and 2.0 wt.% Ag, and 10.0 wt.% Sb respectively. The calculated results are also in good agreement with the only experimental data by Blumenthal [18]. Figure 14 shows the reaction scheme of the Ag-Pb-Sb system and Table 3 compares the calculated temperature and composition of each phase participating in the invariant equilibria with the experimental data.
B.-Z. Lee et al. / Thermodynamic evaluation of A g - P b ~ b system 301
5. Concluding remarks
Thermodynamic evaluations of the Ag-Pb, Pb-Sb, Ag-Sb and Ag-Pb-Sb systems have been performed through computer-operated optimization procedures. Agreement between the experimental and calculated data is very good except for the Ag3Sb (e) phase boundary in the Ag-Sb system, which emphasizes the need for further experimental data on the solid phases in this system.
Acknowledgments
All the results in this study have been calculated using the computer programme The~o-Calc [48]. This study has been supported by the Ministry of Education Research Fund for Advanced Materials in 1993 and partly by the Korea Science and Engineering Foundation through the Research Center for Thin Film Fabrication and Crystal Growing of Advanced Materials, Seoul National University, Korea.
References
1 I. Karakaya and W.T. Thompson, Bull. Alloy Phase Diag., 8 (1987) 326.
2 S. Ashtakala, A.D. Pelton and C.W. Bale, Bull. Alloy Phase Diag., 2 (1981) 86.
3 A.T. Dinsdale, Calphad, 15 (1991) 317. 4 G.J. Petrenko, Z. Anorg. Chem., 53 (1907) 200. 5 K. Friedrieh, Metallurgie, 3 (1906) 396. 6 0 . J . Kleppa, Z Phys. Chem., 60 (1956) 446. 7 G.W. Preckshot and R.E. Hudrlik, Trans. Metall. Soc. AIME,
218 (1960) 516. 8 J.D. Esdaile and N.G. Siviour, MetaU. Trans. A, 10 (1979)
382. 9 R.A. Akopyan, S. Kh. Mamedova and E.R. Kerimov, Izv.
V.U.Z. Tsvetn. MetaU., 6 (1983) 83. 10 W. Seith and A. Keil, Z. Phys. Chem. 13, 22 (1933) 350. 11 K. Tsumuraya and Y. Ohno, Mater. Sci. Eng., 17 (1975) 169. 12 R. Castanet, Y. Claire and M. Lafitte, J. Chim. Phys., 66
(1969) 1276. 13 K. Itagaki and A. Yazawa, J. Jpn. Inst. Met., 32 (1968) 1294. 14 K.T. Jacob and J.H.E. Jeffes, J. Chem. Thermodyn., 3 (1971)
433. 15 M. Iwase, K. Fujimura and T. Mori, Trans. Jpn. Inst. Met.,
19 (1978) 377. 16 J.P. Hager and I.A. Wilkomirsky, Trans. Metall. Soe. AIME,
242 (1968) 183.
17 R.S. Dean, J. Am. Chem. Soc., 45 (1923) 1683. 18 B. Blumenthal, Trans. AIME, 156 (1944) 240. 19 Z. Moser, K.L. Komarek and A. Mikula, Z. Metallkd., 67
(1976) 303. 20 W.S. Pellini and F.N. Rhines, Trans. AIME, 152 (1943) 65. 21 I. Obinata and E. Schmid, Metallwirtschafi, 12 (1933) 101. 22 W. Oelsen, F. Johannsen and A. Podgornik, Erzmetall, 9
(1956) 459. 23 F.E. Wittig and E. Gehring, Ber. Bunsenges. Phys. Chem., 71
(1967) 372. 24 A. Yazawa, T. Kawashima and K. Itagaki, Z Jpn. Inst. Met.,
32 (1968) 1288. 25 M. Kawakami, Sci. Rep. Tohoku Imp. Univ., 19 (1930) 521. 26 R. Hultgren, P.D. Desai, D.T. Hawkins, M. Gleiser and K.K.
Kelley, Selected Values of the Thermodynamic Properties of Binary Alloys, American Society for Metals, Metals Park, OH, 1973, p. 1260.
27 L.W. Diller, R.L. Orr and R. Hultgren, J. Phys. Chem., 64 (1960) 1736.
28 H. Seltz and B.J. Dewitt, J. Am. Chem. Soc., 61 (1939) 2594. 29 C.S. Kohand and S.P. Lee, J. Korean Inst. Met., 6 (1968) 105. 30 J.F. Elliott and J. Chipman, J. Am. Chem. Soc., 73 (1951)
2682. 31 G.I. Petrenko, Z. Anorg. Chem., 50 (1906) 139. 32 P.W. Reynolds and W. Hume-Rothery, J. Inst. Met., 60 (1937)
365. 33 C.T. Heycock and F.H. Neville, Philos. Trans. R. Soc. (Lond.)
A, 189 (1987) 52. 34 F. Weibke and I. Efinger, Z. Elektrochem., 46 (1940) 53. 35 P. Feschotte, F. Monachon and Ph~ Durussel, J. Alloys Comp.,
186 (1992) L17. 36 K. Ehrlich, Inaugural Dissertation, Ludwig-Maximilians-Univ-
ersit~it, Mfinchen, 1965. 37 B. Predel and A. Emam, Z. Metallkd., 64 (1973) 496. 38 R. Hultgren, P.D. Desai, D.T. Hawkins, M. Gleiser and K.K.
Kelley, Selected Values of the Thermodynamic Properties of Binary Alloys, American Society for Metals, Metals Park, OH, 1973, p. 89.
39 T. Nozaki, M. Shimoji and K. Niwa, Ber. Bunsenges. Phys. Chem., 70 (1966) 207.
40 K. Okajima and H. Sakao, Trans. JIM, 15 (1974) 51. 41 A.A. Vecher and Ya. I. Gerasimov, Proc. Acad. Sci. USSR,
139 (1961) 742. 42 M. Hino, T. Azakami and M. Kameda, J. Jpn. lnst. Met., 39
(1975) 1175. 43 O.J. Kleppa, J. Phys. Chem., 60 (1956) 846. 44 S.-F. Rainer, in G. Petzow and G. Effenberg (eds.), Ternary
Alloys, Vol. 2, VCH, Weinheim, 1988, p. 443. 45 N.I. Moon and Y.H. Lee, J. Korean Inst. Met. Mater., 30
(1992) 388. 46 M. Hillert and L.-I. Staffanson, Acta Chem. Scand., 24 (1970)
3618. 47 T. Hahn (ed.), International Tables for Crystallography, Vol.
A, Kluwer, 1989, p. 190. 48 B. Sundman, B. Jansson and J.-O. Andersson, Calphad, 9