56

A Thesis
Submitted to the Faculty
of
Drexel University
By
Andrew M. King
in partial fulfillment of the requirements
for the degree
of
Master of Science in Environmental Engineering
May 2013

© Copyright 2013
Andrew M. King. All Rights Reserved.

ii
Dr. Paul Block (advisor)
Dr. Sabrina Spatari (thesis committee member)
Dr. Mira Olson (thesis committee member)
Dr. Charles N. Haas (department head)
iii
Acknowledgments....................................................................................................... ii
List of Tables.............................................................................................................. v
List of Figures............................................................................................................. vi
Abstract....................................................................................................................... viii
Chapter I: Literature Review....................................................................................... 1
1. Background..................................................................................................... 1
2. Power Generation and Ethiopia...................................................................... 1
3. Hydrology of the Blue Nile Basin................................................................... 4
4. Climatology of the Blue Nile Basin................................................................ 6
5. Hydropolitics of the Nile River Basin............................................................. 9
Chapter II: Methodology and Modeling Framework.................................................. 11
1. Hydrology Model............................................................................................ 11
2. Grand Ethiopian Renaissance Dam: Hydropower and Reservoir Model........ 13
Chapter III: Grand Ethiopian Renaissance Dam Performance................................... 19
1. Time to Full Supply Level (FSL).................................................................... 19
2. Power Generation............................................................................................ 21
3. Reservoir Releases.......................................................................................... 25
Chapter IV: Interactive Tool to Promote Hydropolitical Discussion.......................... 29
1. Background and Motivation............................................................................ 29
2. Tool Overview................................................................................................ 30
2 a. Design Specifications................................................................................. 30
2 b. Precipitation Trend..................................................................................... 31
2 c. Filling Policy.............................................................................................. 34
2 d. Tool Outputs............................................................................................... 35
Chapter V: Conclusions and Thesis Contribution....................................................... 39

iv
1. Discussion....................................................................................................... 39
2. Summary......................................................................................................... 41

v
Table 1. Overview of binned precipitation trends from suite of GCMs with associated
probability........................................................................................................................ 13
Table 2. Statistical data from GCM weighted power generation (2014–2031) for five
filling policies.................................................................................................................. 24

vi
Figure 1. Map of the Upper Blue Nile Basin within Ethiopia and location of the
Grand Renaissance Dam.................................................................................................. 5
Figure 2. Inter-annual and intra-annual precipitation variability within the Blue Nile
Basin, and monthly streamflow at Roseires, Sudan........................................................ 6
Figure 3. GCM precipitation projections over the Blue Nile Basin during the 21st
Century............................................................................................................................ 8
Figure 4. Median time to FSL under stationary climatic conditions............................... 19
Figure 5. Median time to FSL for various precipitation trends....................................... 21
Figure 6. Cumulative power generation during reservoir filling stage for eight
precipitation trends and four filling policies....................................................................
22
Figure 7. Expected cumulative power generation by GCM weighting...........................
23
Figure 8. Average monthly reservoir releases from GERD until the FSL is reached.....
26
Figure 9. Overview of tool operations sequence.............................................................
30
Figure 10. Prompt initiating selection of GERD design parameters...............................
31
Figure 11. Selection of GERD power capacity...............................................................
31
Figure 12. Input MOL of the GERD...............................................................................
31
Figure 13. Prompt initiating selection of climate change induced precipitation trend....
32
Figure 14. Selection of precipitation trend......................................................................
32
Figure 15. CDF of precipitation trends prior to user selection........................................
33
Figure 16. CDF of precipitation trends after user selection............................................
33
Figure 17. Prompt initiating selection of reservoir filling policy....................................
34
Figure 18. Brief description of both filling policy types presented to user.....................
34

vii
Figure 19. User designates filling policy type.................................................................
35
Figure 20. Fractional impoundment filling policy interface............................................
35
Figure 21. Threshold based filling policy interface.........................................................
35
Figure 22. Prompt to re-run tool....................................................................................
36
Figure 23. Tool output screen I summarizing GERD performance parameters..............
37
Figure 24. Tool output screen II summarizing GERD performance parameters.............
38
viii
Africa’s largest hydropower facility is currently under construction on the main stem of
the Blue Nile River in Ethiopia. Construction of the estimated $5 billion Grand Ethiopian
Renaissance Dam (GERD) began in 2011 and is slated to be fully operational in late
2017. The GERD is poised to facilitate regional development with a 63 billion cubic
meter reservoir and 6,000 MW of power generating capacity. Of keen interest to the
water managers within the Nile River Basin is the transient filling stage of the massive
reservoir. To date, however no reservoir filling rate policy has been established. This
policy will have clear implications on the GERD’s ability to generate hydropower in the
near-term and coincidentally impact people and livelihoods in the downstream nations of
Sudan and Egypt through reduced streamflow availability. Implications of climate
variability and emerging climate change within Ethiopia cast further uncertainty on
potential filling policies and system operations. To address this challenge, numerous
filling policies are evaluated through a climate-sensitivity approach to estimate impacts
on reservoir filling time, hydropower production, and downstream flows. This provides
viable and timely points of comparison for regional water managers and politicians
negotiating system operations in the midst of ongoing project construction.

1
Ethiopia encompasses 1,270,000 km2 of mountainous terrain on the eastern “horn
of Africa”. The topography of Ethiopia is characterized by mountains and plateaus at the
center surrounded by lowlands. The Ethiopian highlands receive relatively high rainfall
which flows through the lowlands, often crossing international boundaries. Neighboring
countries include Djibouti, Entrea, Kenya, Somalia, and Sudan. No rivers flow into
Ethiopia from the bordering countries. Ethiopia’s population is approximately 89 million,
making it the most populous landlocked country in the world. It is estimated that Ethiopia
has a per capita water availability of 1900 m3/capita/year
[1] elevating it above the ‘scarcity
threshold’ of 1000 m3/capita/year
[2]. This number fluctuates within Ethiopia due to the
spatial and temporal variability of water resources and is projected to decrease with
population growth and increased living standards. Ethiopia is divided into 12 basins, with
the western basins accounting for most of the national water availability. The largest of
these constituents is the Blue Nile Basin, endowed with 55% of the country’s water[1]
.
The development of Ethiopia into a budding industrial nation seems to be already
underway. In 2005, Ethiopia’s Gross Domestic Product was $12.3 billion, and by 2016 it
is projected that GDP will quadruple to $50.6 billion[3]
. Concurrent with this growth,
Ethiopia’s population is expected to reach 97 million by 2016. This rapid growth
generates a greater demand for power and the infrastructure to support it. The Ethiopian
2
Electricity and Power Company (EEPCo) seems poised to meet this challenge, working
proactively to meet the goal of 100-percent electricity access over the next six years[4]
.
This aggressive transmission and distribution plan has already yielded promising results
with electricity access rising from 22 percent to 46 percent over a 5-year period
beginning in 2007[3]
. This shift to a centralized power transmission and distribution
system ensures that Ethiopians will rely less on biomass fuel for cooking and heating,
yielding health and environmental benefits.
While EEPCo has shown strong interest regarding the implementation of large
scale wind and geothermal energy generation, their potential pales in comparison to the
immense opportunity that rests in hydropower generation. The total capacity for
geothermal energy development within Ethiopia is approximately 1,000 MW[5]
. Wind
energy within Ethiopia is feasibility up to approximately 10,000 MW; however to date,
no wind power generation facilities have been completed except for the ongoing
construction of the small-scale 120 MW Ashegoda Wind Farm Project and the 51 MW
Adama Wind Farm[6]
. Solar power only comprises a small fraction (~6.4 MW) of power
capacity within Ethiopia, dominated by isolated, off-grid users such as telecom networks,
housing, schools, and health facilities[7]
. The variability of wind and solar power, both
spatially and temporally, limit the implementation opportunities which exist within
Ethiopia, but may provide buffered energy security to regions prone to frequent dry
spells[8]
. Water, colloquially termed Ethiopia’s “white oil”, has the immense unharnessed
capacity to undeniably shift the industrialization capabilities of this developing nation.
Ethiopia ranks second, only to the Democratic Republic of Congo, in economically
3
feasible hydropower production among all African nations with an estimated capacity of
30,000 MW[9]
.
Currently, Ethiopia acquires the majority of its energy from 15 different
hydropower plants ranging in capacity from 11.4 MW to 460 MW, totaling
2,210.6 MW[10]
. EEPCo’s strategic energy development plan targets 10,000 MW by
2020; with such an ambitious goal the necessity for large-scale hydropower projects
becomes evident. Achieving the planned energy development will be inordinately
exigent, from engineering to economics to policy, but not unprecedented. The Grand
Ethiopian Renaissance Dam (GERD), situated on the Blue Nile River immediately
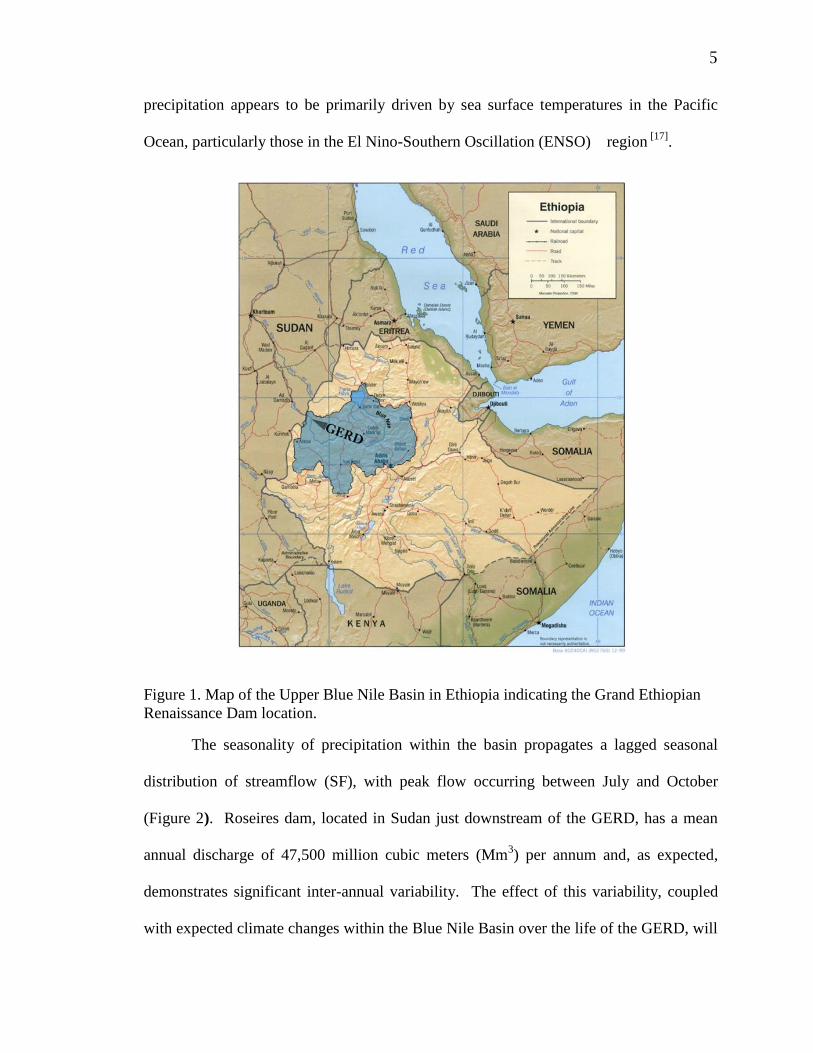
upstream of the Sudanese border, is a cornerstone piece of this plan (Figure 1). Upon
completion it will be the largest hydropower producer in all of Africa, in addition to
being the first dam and reservoir system within Ethiopia on the main stem of the Blue
Nile River[11]
, accelerating Ethiopia’s transition into a power-generation hub. The
estimated cost of the project is $5 billion, more than 15% of Ethiopia’s GDP, and will be
financed internally through national bonds[12]
. Increased power transmission and
distribution, both national and international, will parallel growth in power production.
Twelve domestic transmission and distribution projects, as well as two international
interconnection projects transmitting power to both Kenya and Sudan are currently under
construction[13]
.
Construction of the hydropower project started in mid-2011 and is slated to be
fully operational by 2017. The GERD is not only unique for its 6,000MW of potential[14],
[10], almost three times the existing potential in Ethiopia, but for the substantial
hydrologic implications it poses for downstream countries. The policies adopted for
4
filling and managing the massive reservoir, with a total storage volume of over 60,000
million cubic meters (Mm3), will directly impact the millions of people in downstream
countries who rely on the Blue Nile’s waters. Implications of climate variability and
emerging climate change within Ethiopia cast further uncertainty on potential filling
policies and system operations.
The Blue Nile River flows 800 km south and then west from its origins in Lake
Tana, proceeds into Sudan, and continues 650 km north-west until it converges with the
White Nile. The Upper Blue Nile basin subsumes 176,000 km2, or 17 percent of the area
of Ethiopia (Figure 1). The Blue Nile River contributes approximately 60% of the Nile
River flow at Aswan Dam, Egypt, highlighting the stark implications of filling the
GERD[15]
. Upon completion the GERD reservoir will encompass 1,680 square
kilometers. The large reservoir surface area, coupled with the high potential for
evapotranspiration, particularly during the persistence of dry periods indicates another
variable which will affect the transient filling period as well as subsequent full supply
level (FSL) operation.
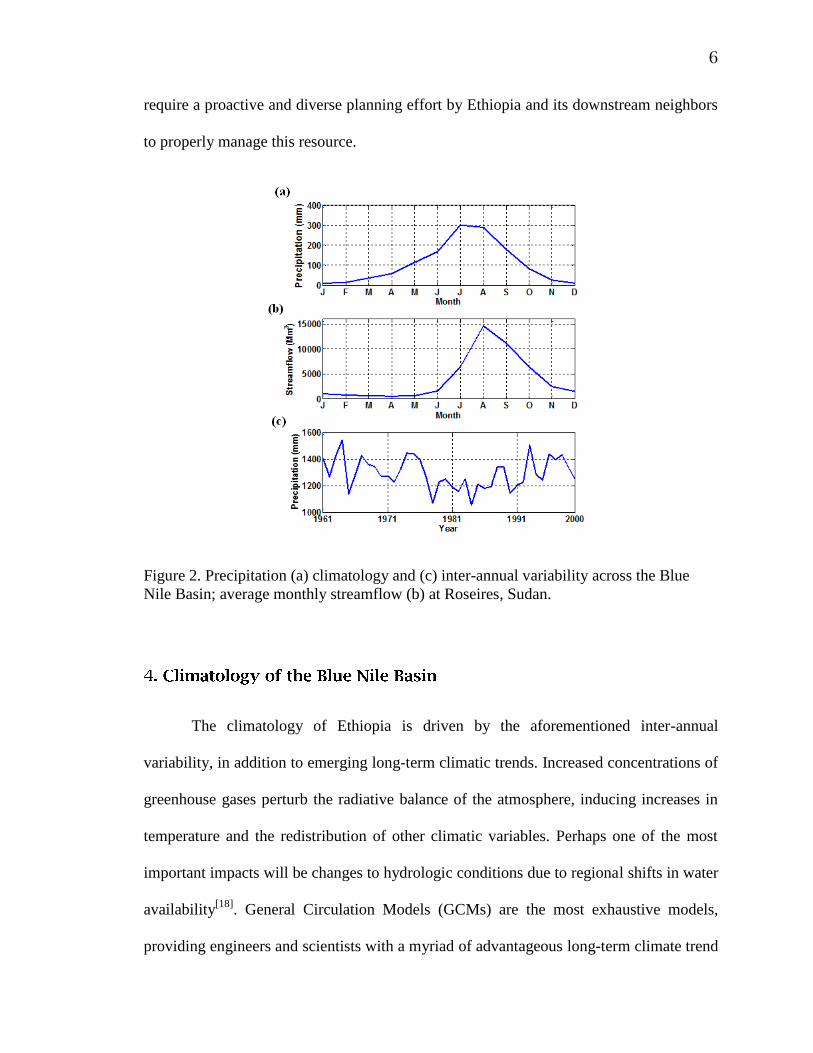
Precipitation within the Upper Blue Nile is characterized by high month-to-month
variability with nearly three-quarters typically falling between June-September (Figure
2)[16]
. The Upper Blue Nile basin receives an average of 1,300 mm of precipitation per
annum. Year-to-year variations are considerable, ranging from 1050 mm to more than
1550 mm across the historical record (Figure 2). This large inter-annual variation in
5
precipitation appears to be primarily driven by sea surface temperatures in the Pacific
Ocean, particularly those in the El Nino-Southern Oscillation (ENSO) region [17]
.
Figure 1. Map of the Upper Blue Nile Basin in Ethiopia indicating the Grand Ethiopian
Renaissance Dam location.
The seasonality of precipitation within the basin propagates a lagged seasonal
distribution of streamflow (SF), with peak flow occurring between July and October
(Figure 2). Roseires dam, located in Sudan just downstream of the GERD, has a mean
annual discharge of 47,500 million cubic meters (Mm3) per annum and, as expected,
demonstrates significant inter-annual variability. The effect of this variability, coupled
with expected climate changes within the Blue Nile Basin over the life of the GERD, will
6
require a proactive and diverse planning effort by Ethiopia and its downstream neighbors
to properly manage this resource.
Figure 2. Precipitation (a) climatology and (c) inter-annual variability across the Blue
Nile Basin; average monthly streamflow (b) at Roseires, Sudan.
The climatology of Ethiopia is driven by the aforementioned inter-annual
variability, in addition to emerging long-term climatic trends. Increased concentrations of
greenhouse gases perturb the radiative balance of the atmosphere, inducing increases in
temperature and the redistribution of other climatic variables. Perhaps one of the most
important impacts will be changes to hydrologic conditions due to regional shifts in water
availability[18]
. General Circulation Models (GCMs) are the most exhaustive models,
providing engineers and scientists with a myriad of advantageous long-term climate trend

7
projections. While these models serve as a useful tool and platform for further analyses,
they possess many inherent flaws. Most of the problems that plague GCMs are
systematic, indicating the ability to develop more sophisticated models over time as the
error sources are eliminated. Systematic sources of error present in GCM methodology
include[19]
:
Gaps exist in data acquisition, which drive GCM processing, due to insufficient
ocean monitoring stations
Incomplete understanding of feedback loops between atmosphere and ocean,
particularly related to clouds
Exclusion of regionalized presence of anthropogenic aerosols which act to
dampen the effects of global warming on the short term
Unexpected changes in the flow of carbon between the atmosphere, terrestrial
biosphere, and ocean
Horizontal resolution on the magnitude of 500 km due to limited computing
power[20]
Vertical scale and working variables (i.e. precipitation) mismatches inhibiting
hydrologic modeling[18]
Limitations aside, GCMs provide beneficial information, pertinent to long-term
water resource management. The GERD will impose acute water management
responsibilities upon all of the Nile Basin countries, necessitating the integration of
climate change data into the planning stage. GCMs uniformly project an increase in
future temperatures over eastern Africa, however for precipitation there is less consensus
on the direction and magnitude of the change[21], [22]
.

8
GCMs predict a uniform temperature increase of 2⁰C to 5⁰C, and consequently a
2-14% increase in potential evapotranspiration, by the year 2081-2098[23]
. Figure 3a
illustrates GCM precipitation projections over the Blue Nile Basin for the a1b scenario, a
middle-of-the-road, balanced energy future. By the decade encompassing 2060
( , the spread in projections has become quite evident. This spread may be
captured in a probability density function (Figure 3b) to indicate the likelihood of percent
changes in precipitation by 2060.
Figure 3. (a) GCM precipitation projections over the Blue Nile Basin during the 21st
century; adapted from Gianini (2008). (b) Probability density function of percent
changes in precipitation for 2060.
A common technique to defining the implications of future changes on water
management systems is the downscaling of GCM precipitation projections to force
hydrology and management models (for Ethiopia, see e.g., [23], [24]). While this
approach has many advantages, results are clearly dependent on which GCM projections
are selected. Typically a few projections are selected across the range of possibilities,
though assigning probabilities to the likelihood of such a projection occurring is difficult.
Yet from a water manager’s perspective, quantitatively understanding the risks and

9
uncertainties being faced is critical for action. Thus a sensitivity approach is proposed,
evaluating a range of plausible projections spanning expected changes (Figure 3b), and
subsequently weighting model outputs by the likelihood of those changes as inferred by
the GCMs. Further details are provided in the Methodology section.
Water rights within the Nile Basin stem from a colonial agreement between Egypt
and the United Kingdom in 1929. This agreement bestowed Egypt with almost exclusive
rights to the Nile River. In 1959, after almost a decade of negotiations between Egypt and
Sudan the United Arab Republic and Sudan Agreement For The Full Utilization of the
Nile Waters (Agreement of 1959; 6519 U.N.T.S. 63) was signed. Egypt was allocated
75% of the Nile River’s water, with the remaining 25% granted to Sudan. Thus, the legal
and equitable right to the use of Nile basin water in Ethiopia is unclear. According to
international water law, it is incumbent upon Ethiopia to engage with Sudan and Egypt to
agree on mutually acceptable water sharing practices[25]
.
As of February 2011, six (Ethiopia, Kenya, Uganda, Rwanda, Tanzania, and
Burundi) of the nine Nile basin countries have signed the Entebbe Agreement as a part of
the Nile Basin Initiative. The Nile Basin Initiative seeks “to achieve sustainable socio-
economic development through the equitable utilization of, and benefit from, the
common Nile Basin water resources.” While the GERD in its essence remains an
engineering endeavor, the political context surrounding the project amplifies the
challenge the Nile Basin countries are burdened with. Whittington et al. (2005) presented

10
four economic pressures, which serve as a foundation for hydropolitical discussion within
the Nile Basin:
1. “Withdraw water for irrigation as far upstream as possible – before you lose it
through evaporation and seepage”
2. “Withdraw water for irrigation as far downstream as possible in order to take full
advantage of hydroelectric power generation facilities”
3. “Store water upstream to reduce evaporation losses”
4. “Withdraw water where its user value is greatest”
The optimization of these four constraints becomes critical when trying to achieve the
goals set forth by the Nile Basin Initiative. The World Bank has pushed for increased
investment in multipurpose water infrastructure that would make Ethiopia more “water-
resilient”, and promote long-term sustainable economic growth[27]
. The GERD’s primary
function will be hydropower generation, not providing the World Bank’s desired variety
of functions and benefits. This has led to the refusal of international donors to support the
GERD project, necessitating the development of the national bond system.

11
Climate changes aside, historical hydroclimatic conditions are sure not to be
repeated. Even if precipitation and streamflow statistics remain unchanged, the
sequencing of dry and wet spells will undoubtedly vary, directly affecting the rate at
which the reservoir is expected to fill. Therefore, to capture the uncertainty in possible
year-to-year variability under baseline (no climate change) conditions, plausible
streamflow and evaporation sequences are created by bootstrapping historical
precipitation and temperature observations, accounting for climatic persistence, and
processing them through a rainfall-to-runoff hydrology model[28], [29]
. One hundred
stochastic time-series were created, each fifty years in length, the expected (economic)
life of the dam.
The hydrology model is a variant of the Watbal model, calibrated to the Blue Nile
Basin[30], [31]
. The model is semi-distributed, lumping soil and vegetation type throughout
the basin, but applying climatic inputs on a 0.5° x 0.5° grid across the basin. The model
operates on average-monthly time-steps, using a conceptualized, one-dimensional bucket
approach that combines the root zone and upper soil layers together to simulate changes
in soil moisture and runoff. The model contains a water balance module consisting of
three parameters: surface runoff, sub-surface runoff, and maximum catchment water-
holding capacity. Although the soil moisture dynamics are simplified, the model has
been shown to adequately represent runoff changes due to climate fluctuations[30], [31]
.
The model uses monthly average inputs of precipitation, mean daily temperature, and the

12
diurnal temperature range from the CRU TS 2.1 dataset[32]
. The Hargreaves equation is
used to determine potential evapotranspiration[33]
. As a final process, the model converts
runoff into Blue Nile River streamflow, and computes net evaporation, at critical points
throughout the basin, including the GERD, which will be used as inputs to the
hydropower model[28]
.
Only a small number of streamflow stations exist within the basin, none of which
adequately represent inflow at the proposed reservoir. Therefore, the hydrology model is
calibrated against observed long-term streamflow data at the Roseires dam, located 60
km north-west of the Sudan-Ethiopia Border . Using cross-validation, the modeled and
observed data appear strongly correlated over the length of the time-series (annual
correlation = 0.91; monthly correlation = 0.96). Inflow into the GERD reservoir is
inferred from these results. This is considered sufficient given the focus here on
comparing filling policies under varying climatic conditions, and less on reporting
absolute benefits.
To account for potential changes, linear trends are added to the one-hundred
precipitation and temperature time-series previously assembled over the assumed project
life of fifty years, 2011-2060. The temperature trend is modeled to linearly increase by
2.5 degrees Celsius, a middle of the road projection according to most GCMs[21]
. For
precipitation, the aforementioned sensitivity-type assessment is adopted, considering the
possibility of both increasing and decreasing linear trends, ranging from +20% to -20%
by 2060; this encompasses the current range from the available suite of GCMs (Figure 3).
The probability density function displayed in Figure 3b demonstrates both the range of
plausible scenarios, as well as the probabilistic dominance of certain precipitation trends.

13
The probability of any discrete precipitation trend occurring is negligible, thus
precipitation bins were created possessing lumped probabilities of trend occurrence
(Table 1).
Table 1. Summary of binned precipitation trends from GCM ensemble
In the above table, PT indicates the magnitude of precipitation trend. Analyzing potential
hydrologic impacts of climate change from a probabilistic standpoint quantifies the
uncertain implications of climate change plaguing politicians and water resource
managers.
The rate at which streamflow is impounded in the reservoir has inherent
implications on hydropower generation and downstream consequences for Sudanese and
Precipitation
Trend Bin Range
Probability of
Occurrence
14
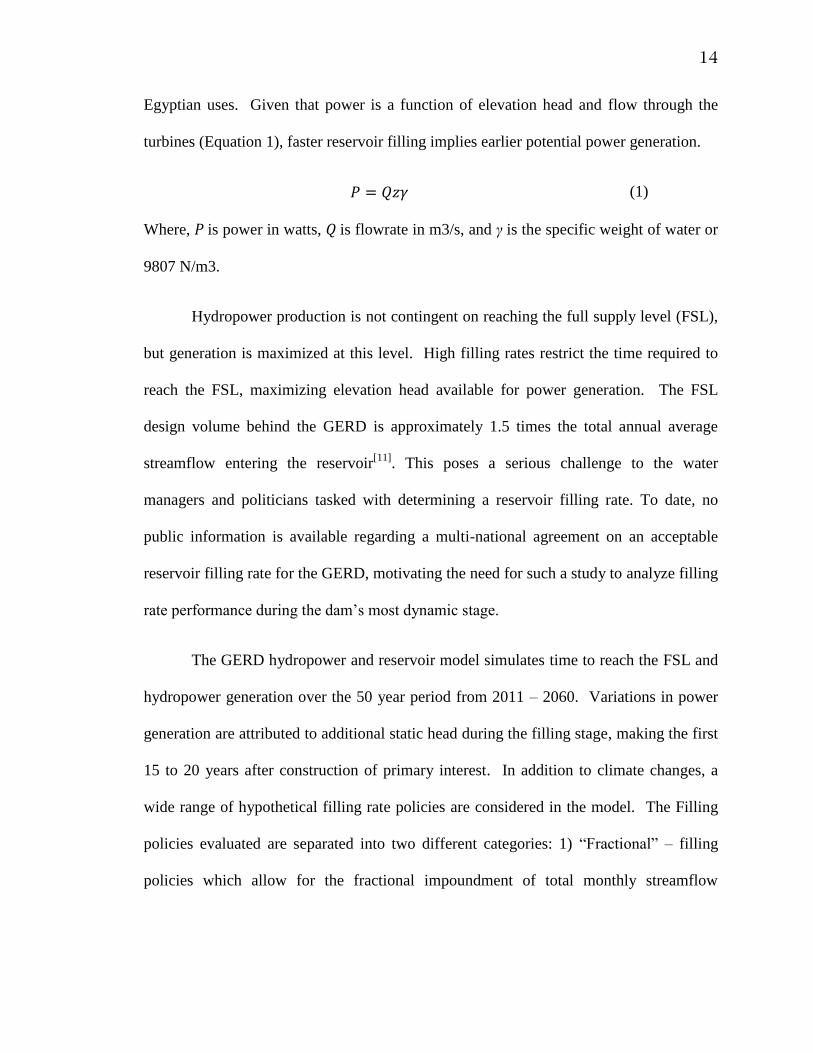
Egyptian uses. Given that power is a function of elevation head and flow through the
turbines (Equation 1), faster reservoir filling implies earlier potential power generation.
(1)
Where, P is power in watts, Q is flowrate in m3/s, and γ is the specific weight of water or
9807 N/m3.
Hydropower production is not contingent on reaching the full supply level (FSL),
but generation is maximized at this level. High filling rates restrict the time required to
reach the FSL, maximizing elevation head available for power generation. The FSL
design volume behind the GERD is approximately 1.5 times the total annual average
streamflow entering the reservoir[11]
. This poses a serious challenge to the water
managers and politicians tasked with determining a reservoir filling rate. To date, no
public information is available regarding a multi-national agreement on an acceptable
reservoir filling rate for the GERD, motivating the need for such a study to analyze filling
rate performance during the dam’s most dynamic stage.
The GERD hydropower and reservoir model simulates time to reach the FSL and
hydropower generation over the 50 year period from 2011 – 2060. Variations in power
generation are attributed to additional static head during the filling stage, making the first
15 to 20 years after construction of primary interest. In addition to climate changes, a
wide range of hypothetical filling rate policies are considered in the model. The Filling
policies evaluated are separated into two different categories: 1) “Fractional” – filling
policies which allow for the fractional impoundment of total monthly streamflow
15
entering the reservoir; 2) “Threshold” – water retention rates dependent on monthly
streamflow exceeding the historical average streamflow (HASF) or a fraction thereof.
Five discrete filling rates applying both policy categories were initially evaluated
for the GERD. Three policies consider fractions of total monthly streamflow entering the
reservoir, impounding 5%, 10%, or 25%. The two “threshold” policies allow the GERD
to retain 1) any quantity greater than the historical average streamflow (> 1*HASF), or 2)
any quantity greater than 90% of the historical average streamflow (> 0.90*HASF). The
fraction-based policies thus ensure that Ethiopia will be able to impound water each year,
reducing flow to downstream users. Conversely, the threshold-based policies do not
guarantee impoundment; when streamflow is below the historical average (or 90% of the
historical average), all inflow must be passed downstream, although it can be routed
through the turbines for hydropower generation.
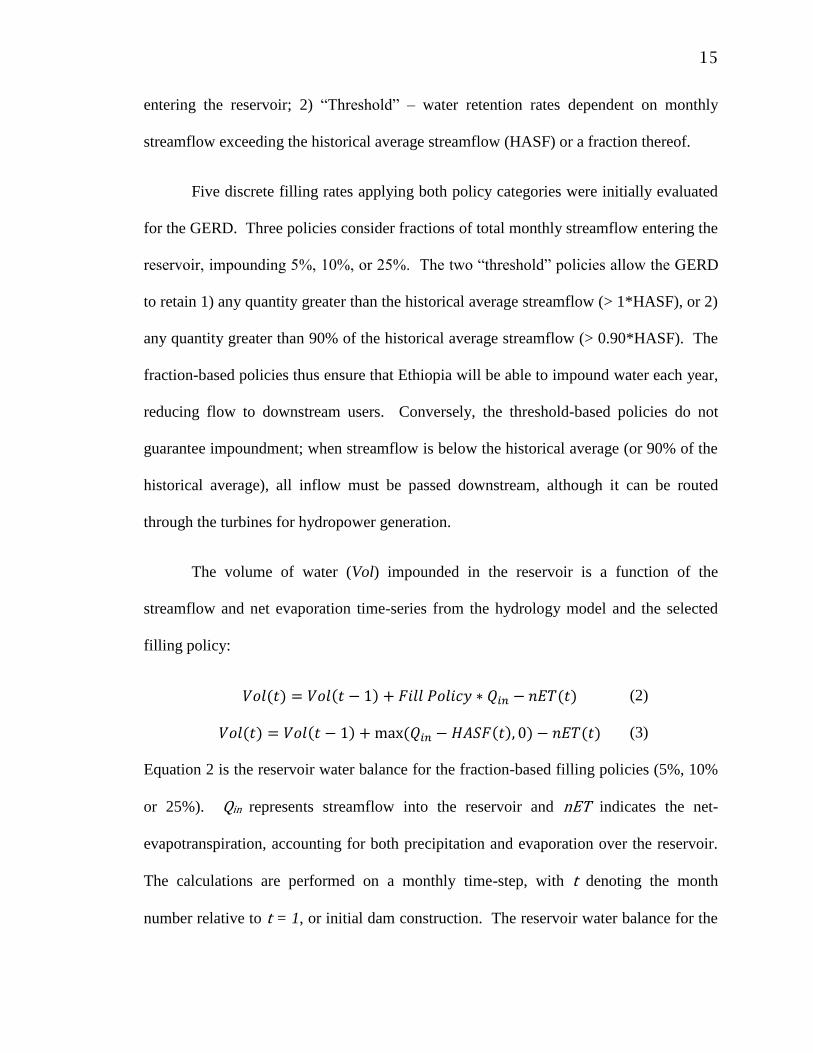
The volume of water (Vol) impounded in the reservoir is a function of the
streamflow and net evaporation time-series from the hydrology model and the selected
filling policy:
(2)
(3)
Equation 2 is the reservoir water balance for the fraction-based filling policies (5%, 10%
or 25%). Qin represents streamflow into the reservoir and nET indicates the net-
evapotranspiration, accounting for both precipitation and evaporation over the reservoir.
The calculations are performed on a monthly time-step, with t denoting the month
number relative to t = 1, or initial dam construction. The reservoir water balance for the

16
threshold-based filling policies is given in Equation 3. As specified earlier, and evident
by Equation 2 and 3, fractional filling policies operate with unimpeded water retention,
but threshold policies restrict impoundment to months when Qin > HASF.
Construction staging of the GERD assumes that during the first three years of
construction (2011 – 2014 or t = 1 to 36), no impoundment occurs, hence, no power
generation. During the final three years of construction (2014 – 2017 or t = 37 to 72),
filling of the reservoir can occur up to 15 percent of the FSL, or approximately 9,000
Mm3
[11]. Two of the 375 MW Francis turbines will be operational during this time
period, creating 750 MW of power generating potential. The model assumes that the
Francis turbines have an efficiency of η = 0.95[34]
. Equation 1 then becomes modified,
accounting for turbine efficiency, yielding:
(4)
Upon completion of construction in 2017, the reservoir can continue to fill until it
reaches the FSL (volume = 63,350 Mm3; reservoir elevation = 640 masl). The minimum
operating level (MOL) – the height at which the facility can begin generating power to
capacity – is 590 masl. Until the reservoir surpasses the MOL, power generation can only
occur up to 750 MW. When fully operational (i.e. MOL exceeded), 16 ~ 375 MW
Francis turbines will provide the 6,000 MW of hydropower potential. Typically,
hydropower facilities will apply a load factor to energy production. The load factor is
calculated by dividing the total amount of energy a plant produced during a period of
time by the amount of energy the plant would have yielded if operating at full production
capacity. The load factor for the GERD is estimated at 33%[35]
, equating to approximately
1,730 MW per month (based on 5,250 MW hydropower potential). Applying a load
17
factor allows the facility managers to regulate production based upon fluctuations in
power demand, as well as ensure that power production is relatively constant with time.
This model assumes that power production is a function of streamflow and not facility
operation. Therefore upon reaching the FSL, peak streamflow months generate power up
to 6,000 MW, but dry months generate substantially less. Average monthly hydropower
outputs from the model at FSL were 1,734 MW per month (based on 5,250 MW
hydropower potential), on par with load factor predictions. Though the model assumes
6,000 MW of hydropower potential, these calculations were done using 5,250 MW
potential to compare results with existing literature.
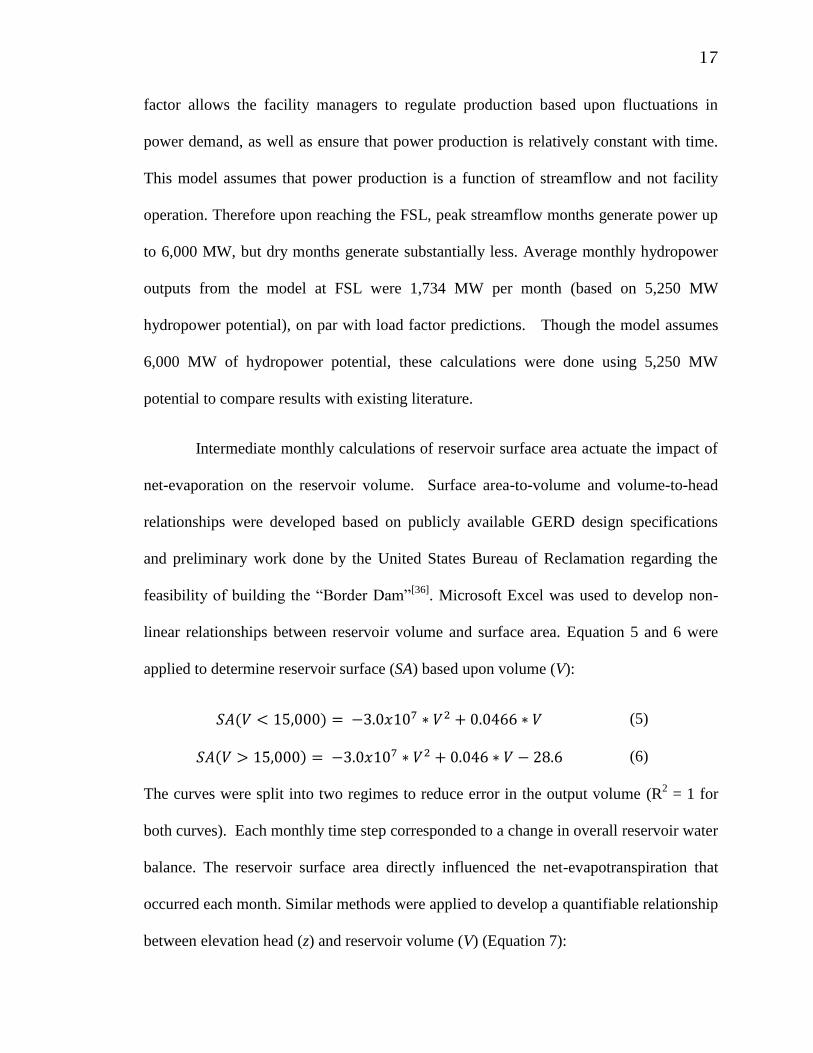
Intermediate monthly calculations of reservoir surface area actuate the impact of
net-evaporation on the reservoir volume. Surface area-to-volume and volume-to-head
relationships were developed based on publicly available GERD design specifications
and preliminary work done by the United States Bureau of Reclamation regarding the
feasibility of building the “Border Dam”[36]
. Microsoft Excel was used to develop non-
linear relationships between reservoir volume and surface area. Equation 5 and 6 were
applied to determine reservoir surface (SA) based upon volume (V):
(5)
(6)
The curves were split into two regimes to reduce error in the output volume (R2 = 1 for
both curves). Each monthly time step corresponded to a change in overall reservoir water
balance. The reservoir surface area directly influenced the net-evapotranspiration that
occurred each month. Similar methods were applied to develop a quantifiable relationship
between elevation head (z) and reservoir volume (V) (Equation 7):

18
(8)
The eight climate change scenarios were coupled with the five filling policies,
yielding a total of 40 unique filling policy-climate scenario combinations, each comprised
of 100 simulations. Model results for comparison include the time required to the FSL,
cumulative power generation during the filling stage, and average monthly reservoir
releases during the filling stage.
19
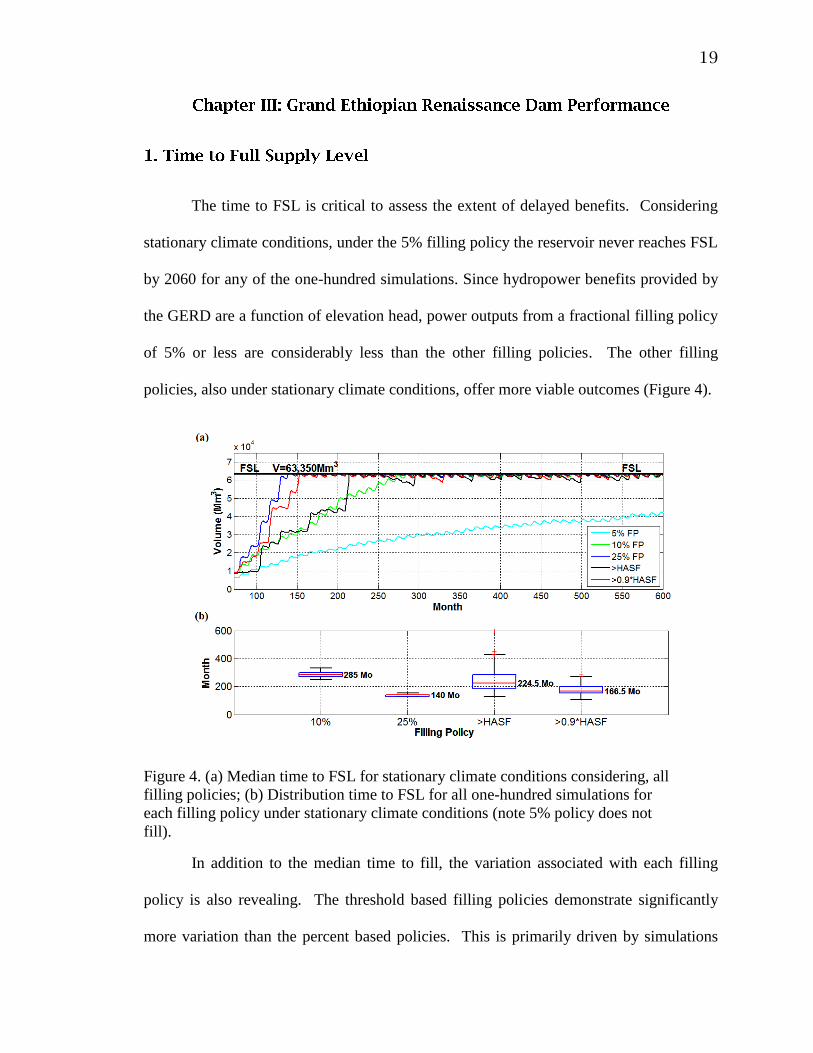
The time to FSL is critical to assess the extent of delayed benefits. Considering
stationary climate conditions, under the 5% filling policy the reservoir never reaches FSL
by 2060 for any of the one-hundred simulations. Since hydropower benefits provided by
the GERD are a function of elevation head, power outputs from a fractional filling policy
of 5% or less are considerably less than the other filling policies. The other filling
policies, also under stationary climate conditions, offer more viable outcomes (Figure 4).
Figure 4. (a) Median time to FSL for stationary climate conditions considering, all
filling policies; (b) Distribution time to FSL for all one-hundred simulations for
each filling policy under stationary climate conditions (note 5% policy does not
fill).
In addition to the median time to fill, the variation associated with each filling
policy is also revealing. The threshold based filling policies demonstrate significantly
more variation than the percent based policies. This is primarily driven by simulations
20
containing numerous consecutive dry (wet) years early in the simulation in which the
streamflow threshold is unsurpassed (surpassed) and thus time to FSL is extended
(decreased). This demonstrates the latent risk of such threshold policies, where water
impoundment is not guaranteed. Clearly years for which impoundment is disallowed
occur more frequently under the >1*HASF policy than the >0.9*HASF policy, resulting
in greater overall variance. As either of the filling policy rates increases the variation in
time required to reach FSL decreases. This result is most evident in the 25% filling rate,
with a range of time required to reach the FSL of 127 to 154 months, as compared to 248
to 333 months for the 10% filling rate.
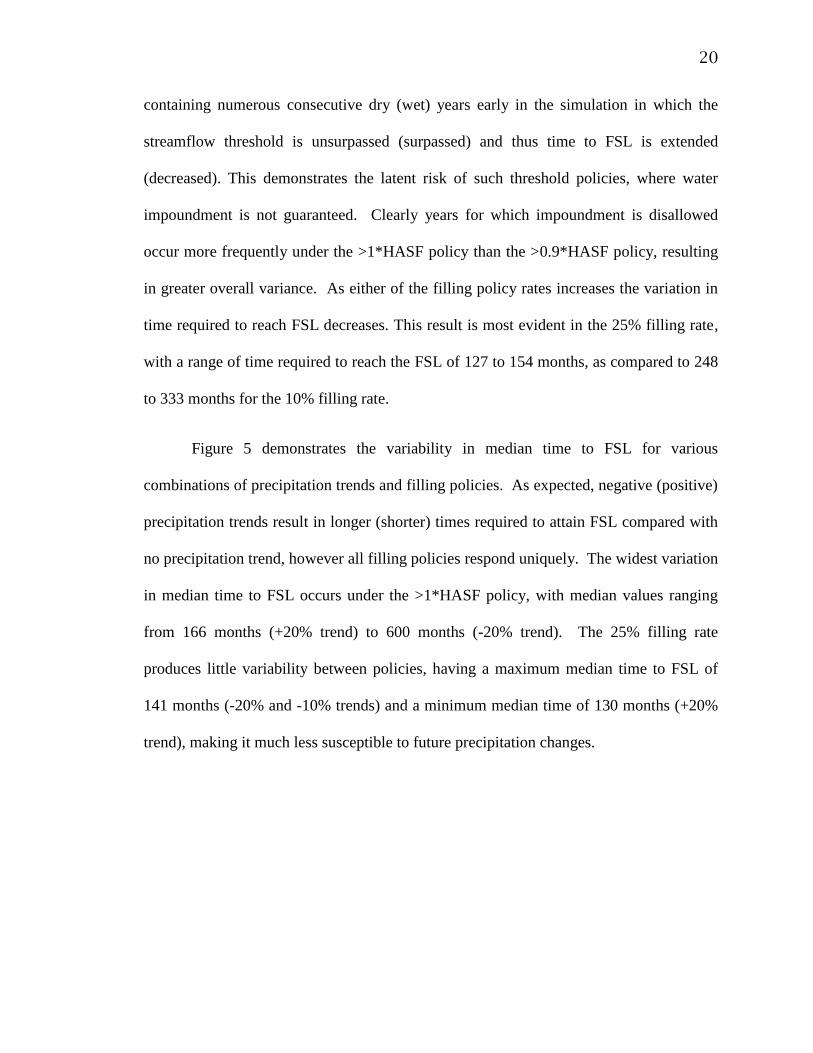
Figure 5 demonstrates the variability in median time to FSL for various
combinations of precipitation trends and filling policies. As expected, negative (positive)
precipitation trends result in longer (shorter) times required to attain FSL compared with
no precipitation trend, however all filling policies respond uniquely. The widest variation
in median time to FSL occurs under the >1*HASF policy, with median values ranging
from 166 months (+20% trend) to 600 months (-20% trend). The 25% filling rate
produces little variability between policies, having a maximum median time to FSL of
141 months (-20% and -10% trends) and a minimum median time of 130 months (+20%
trend), making it much less susceptible to future precipitation changes.
21
Figure 5. Median time to FSL for various precipitation trends (by 2060) and filling
policies (Note: >1*HASF does not fill for -20% precipitation trend).
Although time to FSL is related to power production, it is not necessarily a direct
indicator, given that power generation may commence for head levels above the MOL.
Power generation compared across all climate change scenarios indicates the overall
robustness of a filling policy considering the uncertainty in future climate projections. As
expected, power generation during wetter future climate scenarios will typically
outperform drier scenarios. Cumulative power generation from the 10%, 25% and the
two threshold filling policies over the suite of climate change scenarios relates the overall
performance (Figure 6).
22
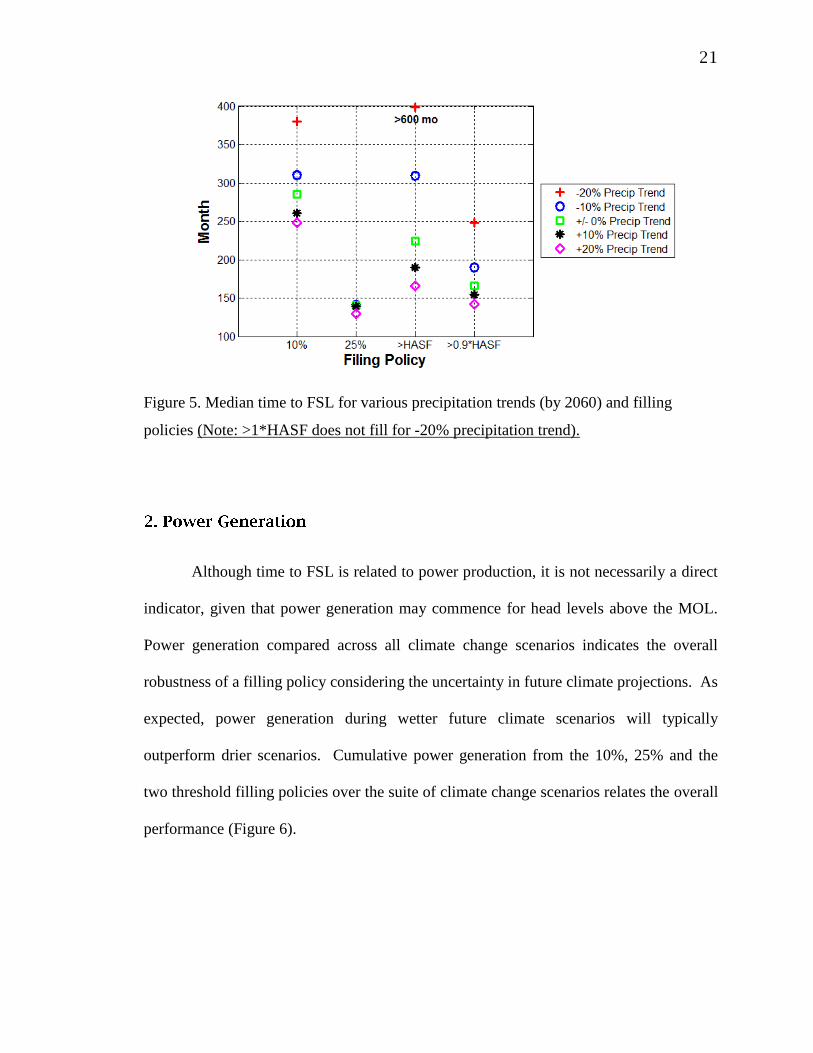
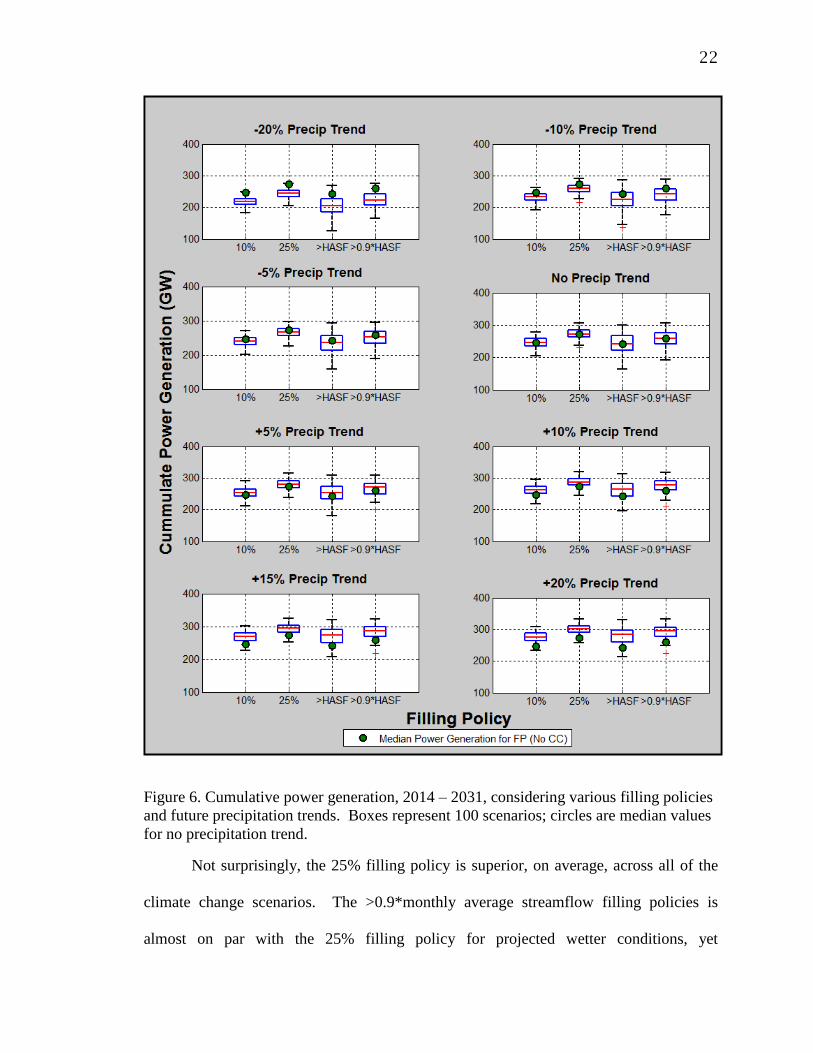
Figure 6. Cumulative power generation, 2014 – 2031, considering various filling policies
and future precipitation trends. Boxes represent 100 scenarios; circles are median values
for no precipitation trend.
Not surprisingly, the 25% filling policy is superior, on average, across all of the
climate change scenarios. The >0.9*monthly average streamflow filling policies is
almost on par with the 25% filling policy for projected wetter conditions, yet
23
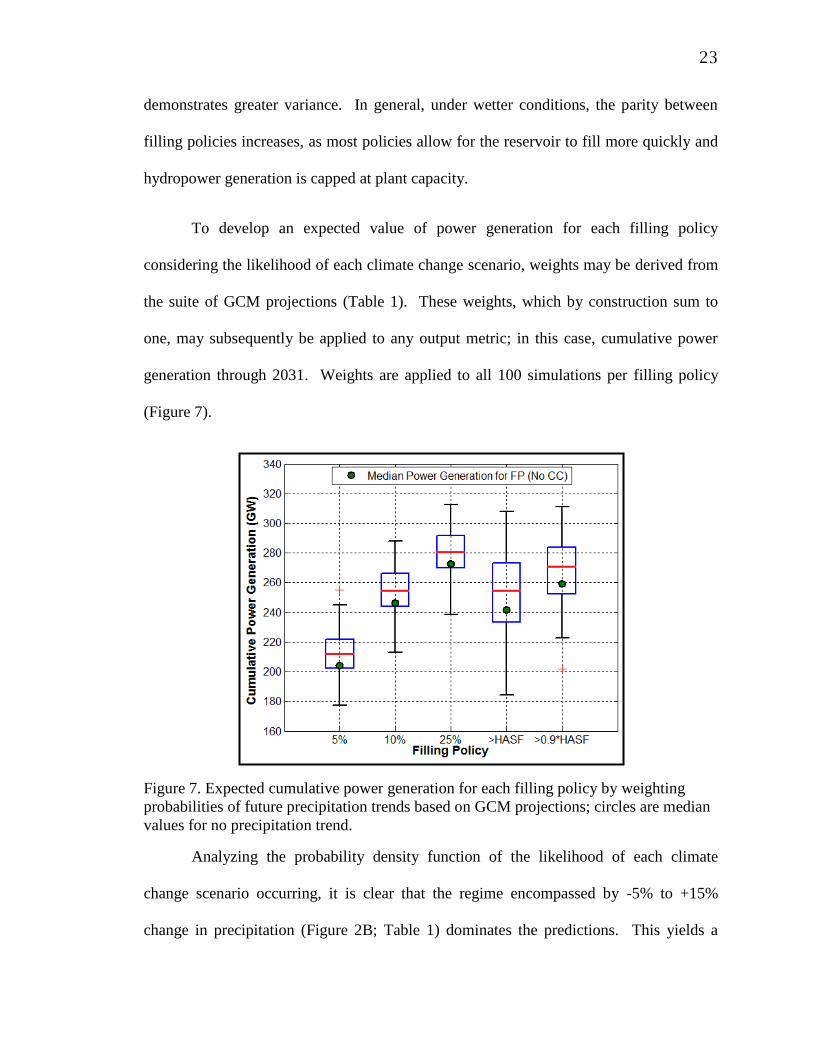
demonstrates greater variance. In general, under wetter conditions, the parity between
filling policies increases, as most policies allow for the reservoir to fill more quickly and
hydropower generation is capped at plant capacity.
To develop an expected value of power generation for each filling policy
considering the likelihood of each climate change scenario, weights may be derived from
the suite of GCM projections (Table 1). These weights, which by construction sum to
one, may subsequently be applied to any output metric; in this case, cumulative power
generation through 2031. Weights are applied to all 100 simulations per filling policy
(Figure 7).
Figure 7. Expected cumulative power generation for each filling policy by weighting
probabilities of future precipitation trends based on GCM projections; circles are median
values for no precipitation trend.
Analyzing the probability density function of the likelihood of each climate
change scenario occurring, it is clear that the regime encompassed by -5% to +15%
change in precipitation (Figure 2B; Table 1) dominates the predictions. This yields a
24
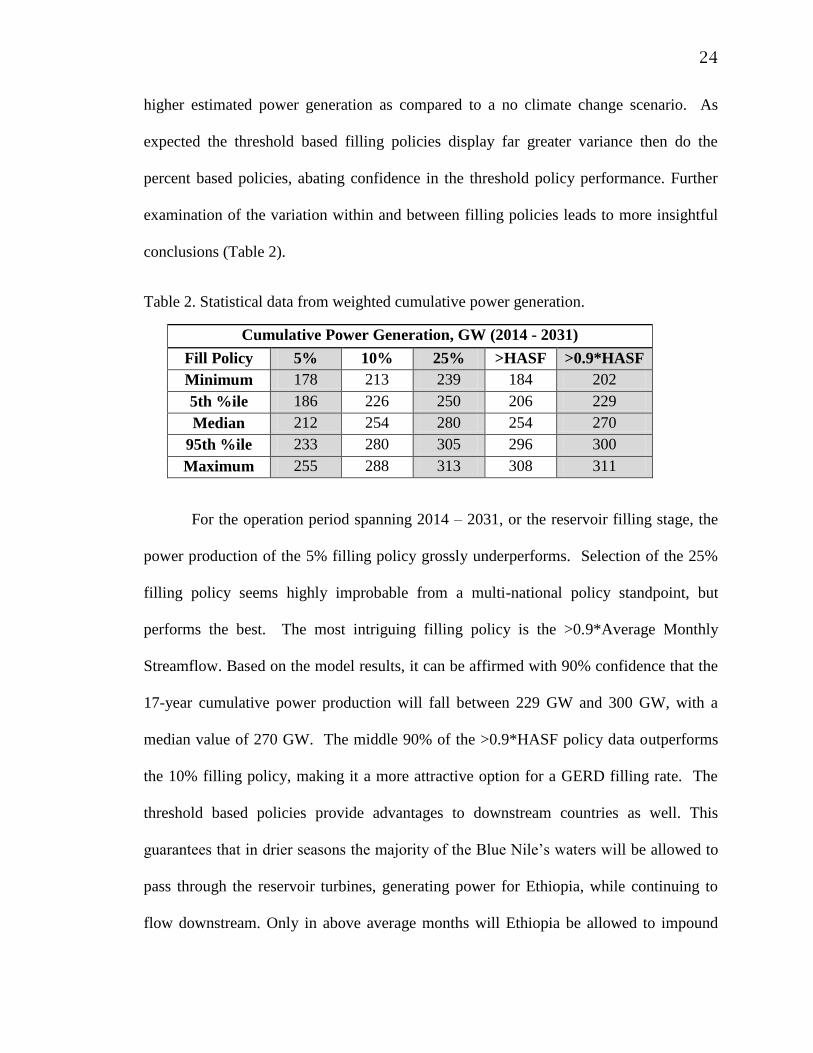
higher estimated power generation as compared to a no climate change scenario. As
expected the threshold based filling policies display far greater variance then do the
percent based policies, abating confidence in the threshold policy performance. Further
examination of the variation within and between filling policies leads to more insightful
conclusions (Table 2).
Table 2. Statistical data from weighted cumulative power generation.
Cumulative Power Generation, GW (2014 - 2031)
Fill Policy 5% 10% 25% >HASF >0.9*HASF
Minimum 178 213 239 184 202
5th %ile 186 226 250 206 229
Median 212 254 280 254 270
95th %ile 233 280 305 296 300
Maximum 255 288 313 308 311
For the operation period spanning 2014 – 2031, or the reservoir filling stage, the
power production of the 5% filling policy grossly underperforms. Selection of the 25%
filling policy seems highly improbable from a multi-national policy standpoint, but
performs the best. The most intriguing filling policy is the >0.9*Average Monthly
Streamflow. Based on the model results, it can be affirmed with 90% confidence that the
17-year cumulative power production will fall between 229 GW and 300 GW, with a
median value of 270 GW. The middle 90% of the >0.9*HASF policy data outperforms
the 10% filling policy, making it a more attractive option for a GERD filling rate. The
threshold based policies provide advantages to downstream countries as well. This
guarantees that in drier seasons the majority of the Blue Nile’s waters will be allowed to
pass through the reservoir turbines, generating power for Ethiopia, while continuing to
flow downstream. Only in above average months will Ethiopia be allowed to impound
25
some of the streamflow. If the climatic trend in East Africa assumes increased
precipitation as the PDF of the GCMs predicts, then threshold policies could allow the
reservoir to retain large volumes over short time periods, expediting the filling rate.
Selecting a threshold filling policy still has latent risk for the Grand Renaissance
dam performance. Even if a long-term wetter trend comes to fruition, the persistence of
dry periods will still exist. The degree to which these dry periods will deviate from the
norm is impossible to say, but it is not entirely unlikely that it could result in multiple
seasons in which the Grand Renaissance dam will not be allowed to impound water.
Once the reservoir reaches the FSL this may not have a significant impact on power
generation, but problems could be manifested by alternative manners. Operationally this
could be a concern for the Grand Renaissance dam and should be analyzed in greater
detail when the water rights agreement is being drafted.
Egypt and Sudan both have great stake in selecting a mutually beneficial filling
policy. An immense volume of water is required to reach the reservoir FSL. 63,350
Mm3 of water will have to be diverted from the Blue Nile into the Grand Renaissance
dam, regardless of filling policy. A 5% filling rate would not be feasible for Ethiopia,
requiring over 50 years to fill the reservoir; nor would it be likely that Egypt and Sudan
accept a 25% filling rate, essentially reducing the streamflow they are accustomed to by
over 10,000 Mm3 per annum. A comparison of the simulated historical streamflow and
the streamflow released by the Grand Renaissance dam under the various filling policies
26
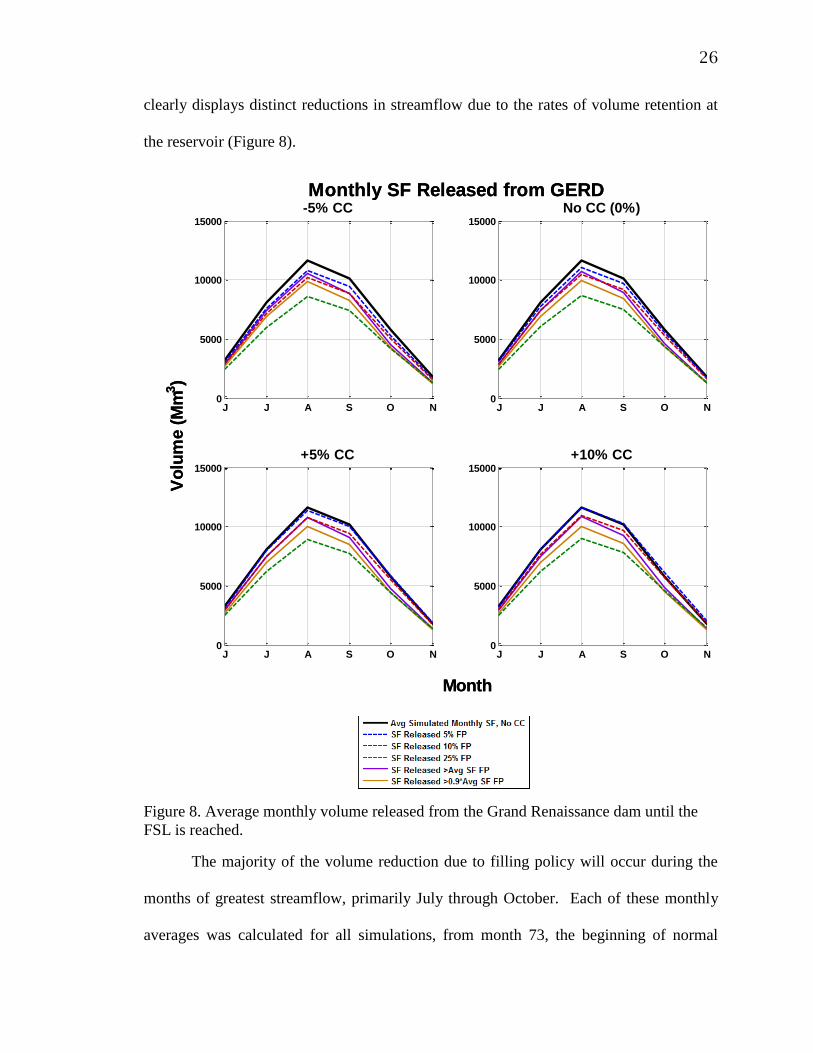
clearly displays distinct reductions in streamflow due to the rates of volume retention at
the reservoir (Figure 8).
Figure 8. Average monthly volume released from the Grand Renaissance dam until the
FSL is reached.
The majority of the volume reduction due to filling policy will occur during the
months of greatest streamflow, primarily July through October. Each of these monthly
averages was calculated for all simulations, from month 73, the beginning of normal
J J A S O N0
5000
10000
15000
No CC (0%)
J J A S O N0
5000
10000
15000
-5% CC
J J A S O N0
5000
10000
15000
+5% CC
J J A S O N0
5000
10000
15000
+10% CC
MonthMonth
Monthly SF Released from GERDMonthly SF Released from GERDV
olu
me (
Mm
3)
Vo
lum
e (
Mm
3)
27
operation, to time required to reach the FSL. The time to the FSL varied between filling
policies and simulations necessitating a normalization of filling time required for each
policy to provide accurate comparison. While the 25% filling policy prescribes
maximum restriction to the streamflow, it will reach the FSL quickly, returning Blue Nile
streamflow to baseline flow the fastest. The 5% filling policy will have the alternate
effect, taking the longest amount of time to bring the Grand Renaissance dam to the FSL.
Based on the model results, a 5% reduction is quite nominal compared to the 25% filling
policy, with the other three filling policies falling in the middle. These streamflow
outputs can be compared with anticipated power generation to ascertain the existing
trade-off relationship. Under wetting climate trends the threshold filling policies allow
greater volumes of water to flow downstream (i.e. the threshold is surpassed more often),
whereas the percent based filling policies will continue to restrict Blue Nile flow, based
on the assigned impoundment fraction, until the FSL is reached.
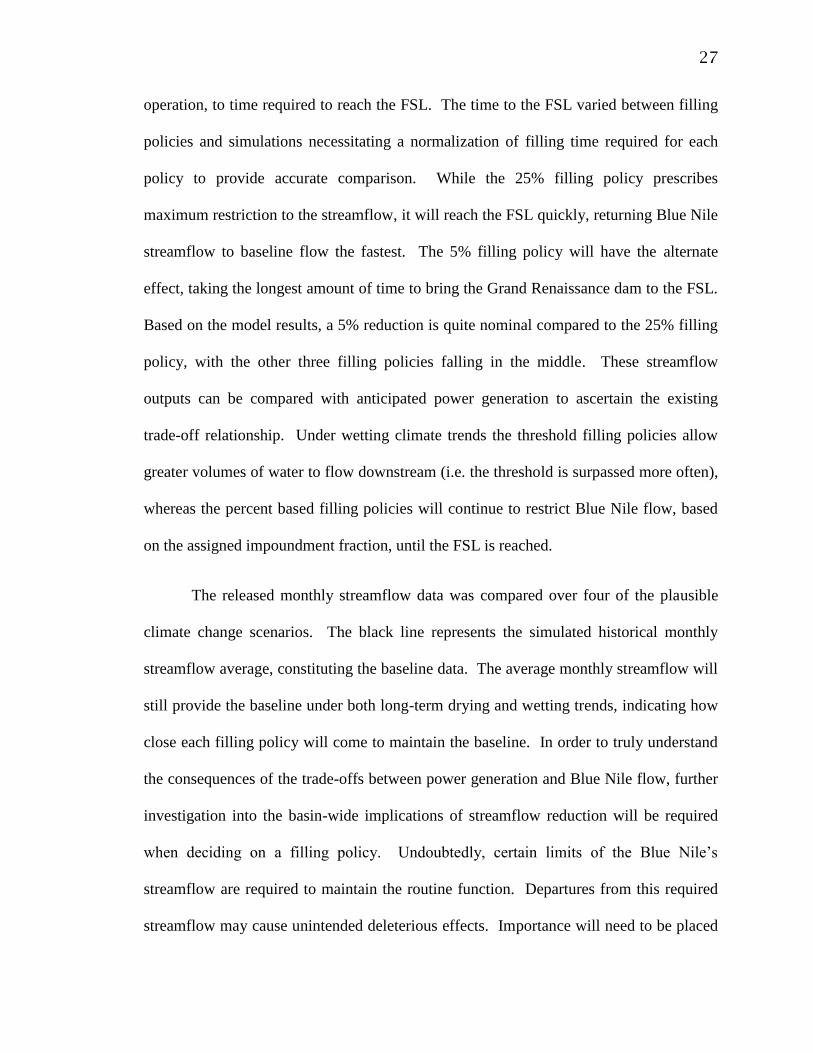
The released monthly streamflow data was compared over four of the plausible
climate change scenarios. The black line represents the simulated historical monthly
streamflow average, constituting the baseline data. The average monthly streamflow will
still provide the baseline under both long-term drying and wetting trends, indicating how
close each filling policy will come to maintain the baseline. In order to truly understand
the consequences of the trade-offs between power generation and Blue Nile flow, further
investigation into the basin-wide implications of streamflow reduction will be required
when deciding on a filling policy. Undoubtedly, certain limits of the Blue Nile’s
streamflow are required to maintain the routine function. Departures from this required
streamflow may cause unintended deleterious effects. Importance will need to be placed

28
on quantitatively identifying a feasible range of streamflow reductions, which minimizes
the services provided by the Blue Nile that will be threatened by the attenuation.

29
The preliminary analysis of multiple filling policies under specified GERD design
parameters serves as a basis for discussion for water managers within the Nile Basin. The
insight provided by these results demonstrates the ability to develop filling policies which
appease all countries within the Nile River Basin. Transparent tradeoff exists between
many of the variables assessed, such as hydropower production and effluent streamflow
from the GERD. To facilitate rapid assessment of an increased sequence of scenarios,
both filling policy and precipitation trend, a tool driven by user defined inputs was
created in MATLAB.
The tool allows for multiple policies to be compared simultaneously, assessing the
aforementioned performance parameters of time to FSL, anticipated power generation,
and reservoir releases. The same precipitation trend scenarios (-20% to +20%) were
adopted using the bin methodology. The user may choose between either of the two
filling policy types, fractional or threshold, and assign a discrete impoundment rate
within the system boundaries. An additional component was added to the tool, allowing
the user to prescribe certain design parameters of the GERD. This function was
incorporated due to lack of available GERD design data and identification of inconsistent
values for researched design parameters.
The minimum operating level of the dam directly affects anticipated power
generation. Upon surpassing the MOL the GERD can commence with power generation
up to capacity. Conflicting sources place the MOL for the GERD between 590 masl and
30
622 masl. This results in a total required reservoir volume prior to full operation of 11.6
Bm3 and 36.9 Bm
3, for the MOL of 590 masl and 622 masl, respectively. This 25 Bm
3
difference obligates several years of additional filling to surpass the MOL delaying
maximum hydropower benefits. The overall hydropower production capacity has been
documented as both 5,250 MW and 6,000 MW from various sources. Thus, the program
allows the user to assign values to these two design parameters.
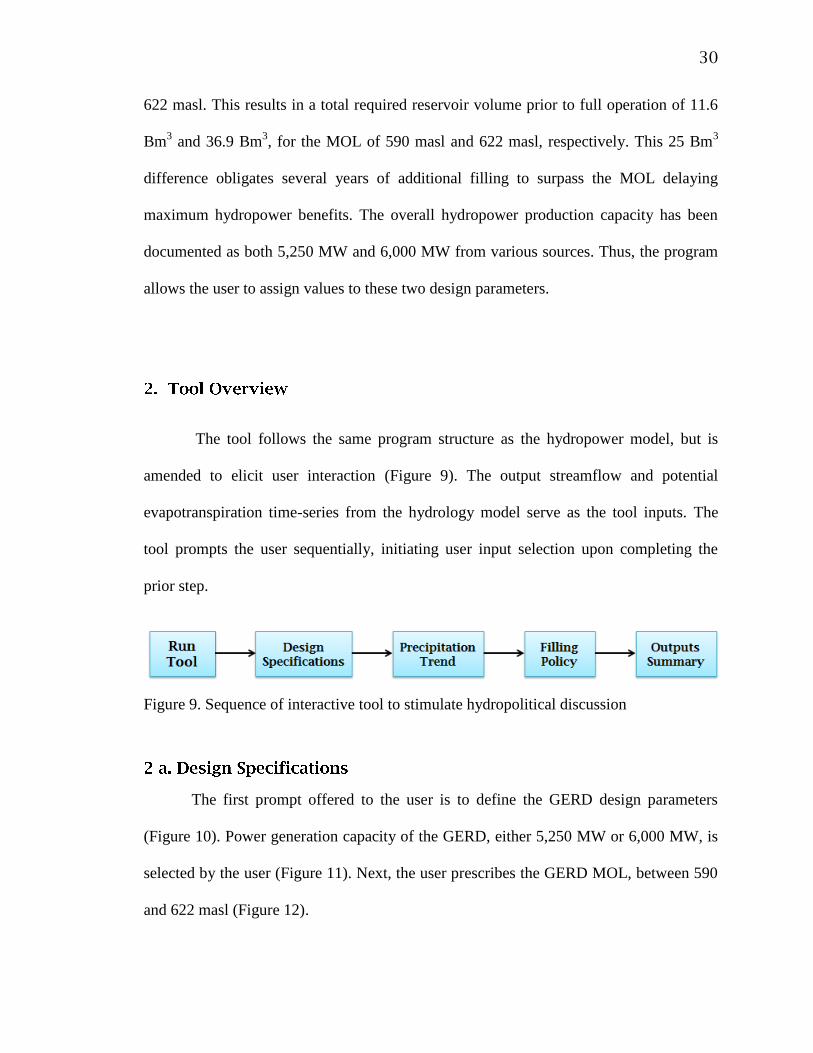
The tool follows the same program structure as the hydropower model, but is
amended to elicit user interaction (Figure 9). The output streamflow and potential
evapotranspiration time-series from the hydrology model serve as the tool inputs. The
tool prompts the user sequentially, initiating user input selection upon completing the
prior step.
Figure 9. Sequence of interactive tool to stimulate hydropolitical discussion
The first prompt offered to the user is to define the GERD design parameters
(Figure 10). Power generation capacity of the GERD, either 5,250 MW or 6,000 MW, is
selected by the user (Figure 11). Next, the user prescribes the GERD MOL, between 590
and 622 masl (Figure 12).

31
Figure 10. Prompt to initiate selection of GERD design parameters
Figure 11. User selects GERD power generation capacity
Figure 12. User enters the MOL of the GERD
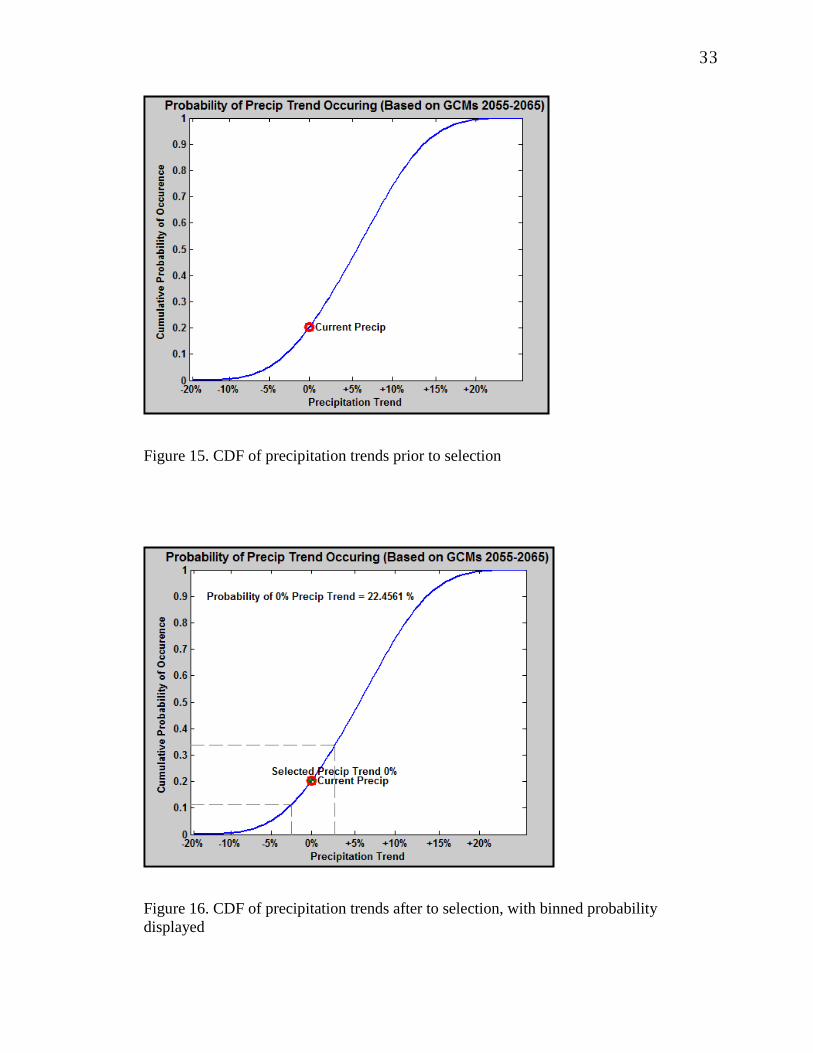
After completing the GERD design specification the interface allows the user to
select the climate change induced precipitation trend (Figure 13; Figure 14). In order to
facilitate the selection of a precipitation trend a cumulative distribution function (CDF) of
the data is presented to the user (Figure 15). Once the user selects the precipitation trend,

32
the probability of the binned precipitation trend is added to CDF (Figure 16). This is done
to demonstrate to the user the overall likelihood this precipitation trend occurring to
promote comparison among the different trends.
Figure 13. Prompt initiating selection of climate change engendered precipitation trend
Figure 14. User assigns precipitation trend
33
Figure 15. CDF of precipitation trends prior to selection
Figure 16. CDF of precipitation trends after to selection, with binned probability
displayed

34
Finally, the user is prompted to select their desired filling policy (Figure 17). The
tool provides a brief definition of the two different filling policy types to assist the user in
their decision (Figure 18; Figure 19). Fractional filling policies allow for any filling rate
to be chosen between 5% and 50% of the influent monthly streamflow (Figure 20).
Threshold based filling policies allow for a filling rate between >0.75*HASF and
>1.25*HASF (Figure 21). Once the user selects their filling policy and rate, the tool runs
the selected hydropower program, with all of the user input parameters.
Figure 17. Prompt initiating selection of reservoir filling policy
Figure 18. Brief description of both filling policy type presented to user

35
Figure 19. User designates filling policy type
Figure 20. Fractional impoundment filling policy interface
Figure 21. Threshold based filling policy interface
The model then runs with specific functions driven by the input parameters. The
goal of the tool was to design an easy-to-use, but informative method to compare an array
of plausible GERD design specifications, precipitation trends, and filling rates. The
output “Resulting GERD Performance” page, which displays after assigning all the
parameters values, summarizes key variables that are produced due to the selected
36
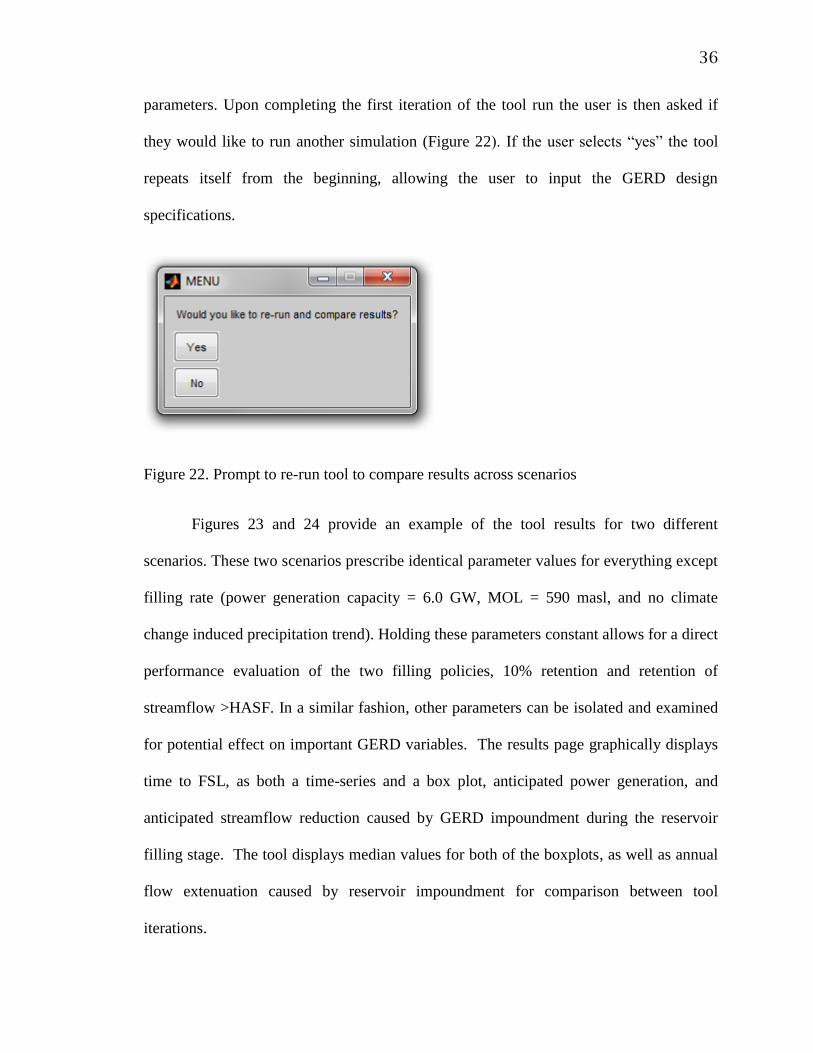
parameters. Upon completing the first iteration of the tool run the user is then asked if
they would like to run another simulation (Figure 22). If the user selects “yes” the tool
repeats itself from the beginning, allowing the user to input the GERD design
specifications.
Figure 22. Prompt to re-run tool to compare results across scenarios
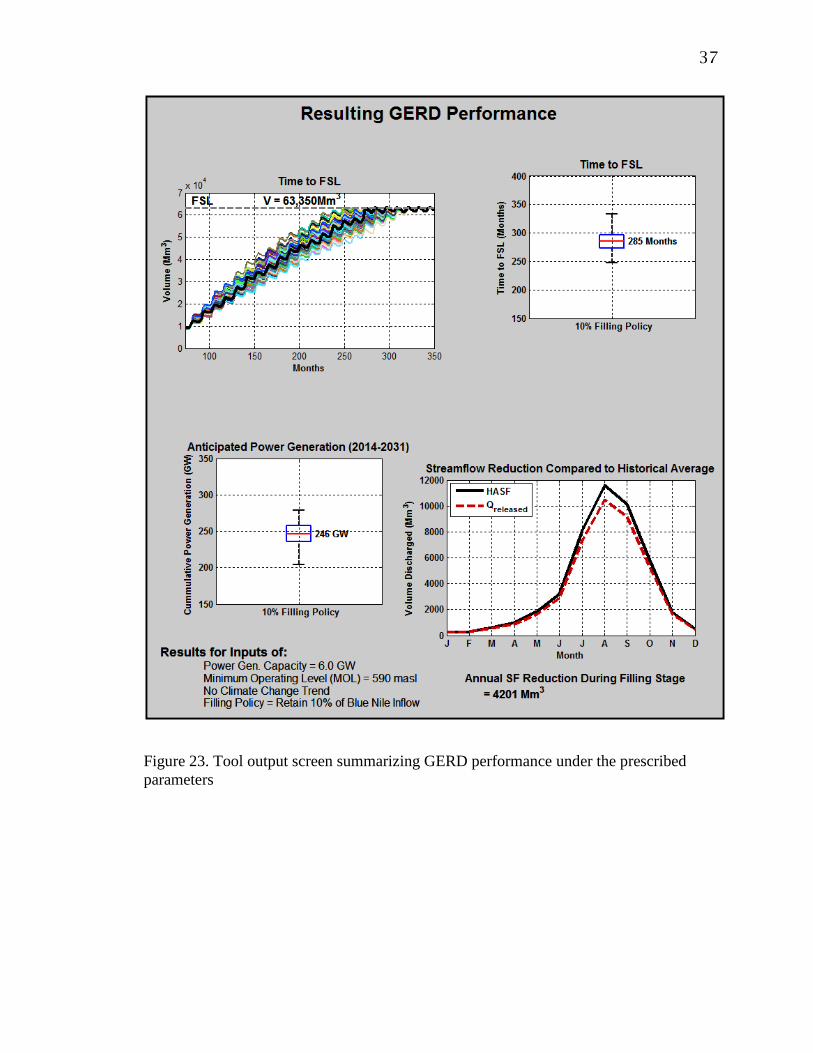
Figures 23 and 24 provide an example of the tool results for two different
scenarios. These two scenarios prescribe identical parameter values for everything except
filling rate (power generation capacity = 6.0 GW, MOL = 590 masl, and no climate
change induced precipitation trend). Holding these parameters constant allows for a direct
performance evaluation of the two filling policies, 10% retention and retention of
streamflow >HASF. In a similar fashion, other parameters can be isolated and examined
for potential effect on important GERD variables. The results page graphically displays
time to FSL, as both a time-series and a box plot, anticipated power generation, and
anticipated streamflow reduction caused by GERD impoundment during the reservoir
filling stage. The tool displays median values for both of the boxplots, as well as annual
flow extenuation caused by reservoir impoundment for comparison between tool
iterations.
37
Figure 23. Tool output screen summarizing GERD performance under the prescribed
parameters

38
Figure 24. Tool output screen summarizing GERD performance under the prescribed
parameters

39
The methods applied in this analysis demonstrate a novel alternative to the
customary downscaling method of GCM informed hydrologic modeling. This sensitivity
approach can be amended and applied to a myriad of climate influenced hydrologic
operations. Additional refinement to the methodology can potentially result in more
accurate outputs. The GERD provides a momentous and timely application of this
sensitivity technique, but hopefully it is only the beginning. Incorporating long-term
climatic change projections into infrastructure planning, particularly water resources, is
critical to designing sustainable systems that will function as desired for the duration of
their intended life.
The sensitivity approach allows all GCM data incorporated in the analysis to have
a stake in climate change predictions. This method does not rely solely on one GCM
output, which consequently ignores potentially informative results from other GCMs.
Through the incorporation of an ensemble of GCM projections the probabilities are
drawn from each GCM without prejudice, encompassing all model outcomes. The
precipitation trend bins used in this analysis offer adequate resolution, which can be
easily mitigated through smaller bins. This could prove advantageous when examining
expected outputs, such as weighted power generation (Figure 7). Further refinement to
this analysis could be achieved by looking at each GCM individually, and correct or
eliminate certain GCM projections based on model bias. For example, Figure 3a displays
one time-series that predicts a 25% increase in precipitation over the next century. This

40
prediction is significantly higher than any of the other GCMs within the suite. Further
analysis into the specific GCM baseline conditions and inputs could yield insightful
results as to why it predicts such a wetter Blue Nile Basin over the next 90 years.
The transient filling period of the GERD is approximately 20 years, thus focusing
more on the short-term climate change implications and decadal hydrologic variability
may improve the model results. Examining Figure 3a, it is clear that the GCM projections
for 2060 differ from those in 2030. Since the primary time frame of interest is 2011-2031,
performing the sensitivity analysis about this range (2025-2035) would produce more
substantial predictions. The stochastic precipitation data created in the hydrology model
characterizes the inter and intra-annual variability which exists in the Blue Nile Basin.
Decadal hydrologic variability is of particular importance to this analysis due to the time
frame. Further assessment into the effects of decadal variability on model performance,
and subsequent application, could improve overall model accuracy.
The creation of a tool to facilitate discussion and comparison of results intends to
further decrease the amount of data the end user becomes exposed to. The multitude of
plausible, filling policy, precipitation trend, and GERD design specifications leads to an
overabundance of data. Providing water resource managers with a platform to quickly
analyze varying parameters at their discretion will hopefully lead to more informed
decision-making. Perhaps the best venue for a tool such as this is online, allowing
unlimited access and use for interested participants.
The results from this analysis focus on the upstream effects of filling the GERD.
Equally important are the downstream fluctuations in water availability due to the GERD,
41
during both the filling and operational stage. The data garnered from this study should be
subsequently applied into further analyses to fully understand the implications for
downstream countries. In turn, this could provide feedback which informs GERD
modeling by means of streamflow attenuation limits imposed by downstream water
requirements.
Regional water managers and politicians have yet to establish a reservoir filling
policy for the Grand Ethiopian Renaissance Dam on the Blue Nile River, scheduled for
completion in 2017. This policy will have clear implications on the dam’s ability to
generate hydropower in the near-term and coincidentally impact people and livelihoods
in Sudan and Egypt through reduced streamflow availability. Climate variability and
change only serve to confound the challenge. To address this, numerous filling policies
across a range of future climate scenarios are evaluated to estimate impacts on reservoir
filling time, hydropower production, and downstream flows.
A sensitivity approach to climate change assessment is adopted here, effectively
using GCM-based projections to inform rather than drive the process. In lieu of
downscaling and correcting future GCM precipitation time-series for model input, a
common approach, the tendency or signal of these projections is applied in the form of
weights on model outputs. This has multiple advantages, not the least of which is the
ability to assess outcomes from a probabilistic, or risk-based, perspective; in the common
downscaling approach, running hundreds of scenarios is rarely feasible. The proposed

42
approach also leans on the strengths of hydroclimatic observations, coupling past
variability with plausible future trends.
Ethiopia, Sudan, and Egypt all have a vested interest in selecting a mutually
beneficial policy. Win-win solutions are possible, but may require coordination and
cooperation beyond a filling policy (e.g., full basin management.) Regardless, it appears
Ethiopia is clearly marching forward with the Grand Renaissance Dam and other
hydropower development plans, with the idea of bringing economic growth and strength
to the region. While this is laudable, prospective projects deserve proper assessment,
particularly regarding future climate and policy risks, given their enormous financial
investment and streamflow implications on downstream countries. If the past does not
represent the future, then neither should planning methodologies. This advanced
planning, if undertaken, can inform not only project viability, but also optimal
sequencing and location of future projects, and the necessity of adequate system
flexibility. The future is unclear, but the planning process need not be.
43
[1] Negash, F. 2012 Managing water for inclusion and sustainable growth in
Ethiopia: Key challenges and priorities. European Report on Development.
[2] Falkenmark, M. 1989 The massive water scarcity threatening Africa – why isn’t
it being addressed. Ambio. 18, 2, 1112-1118.
[3] 2012 Water, water everywhere. Power Engineering International. 20, 7, 36-37.
[4] ENA. 2008 EEPCo set to push access to electricity to 100 percent in 10 years.
Nazret.com.
[5] Japanese Embassy of Ethiopia 2008 Study on the Energy Sector in Ethiopia.
Report of the Embassy of Japan in Ethiopia. 1-16
[6] Woldegebriel, E.G. 2012 Ethiopia turns to wind power to boost energy security.
Alertnet.com.
[7] Ethio Resource Group 2012 Solar energy vision for Ethiopia: Opportunities for
creating a photovoltaic industry in Ethiopia. International Solar Energy
Institute.
[8] Mulugetta, Y. & Drake, F. 1996 Assessment of solar and wind energy resources
in Ethiopia. Solar Energy. 57, 5, 323-334.
[9] Bartle, A. 2002 Hydropower potential and development activities. Energy
Policy. 30, 1231-1239.
[10] Ethiopian Electric and Power Corporation 2012 Available from: Eepco.gov.et.
[11] Than, K. 2011 Ethiopia moves forward with massive Nile dam project. National
Geographic Daily News
[12] Manson, K. 2012 Nile dam: Water wars averted for now. Financial Times.
Available from: www.ft.com
[13] Ethiopian Electric and Power Corporation 2012 Transmission projects under
construction. Available from: Eepco.gov.et.
44
[14] 2012 Power: Ethiopia. Africa Research Bulletin. Blackwell Publishing.
[15] Hurst, H.E. 1952 The Nile. England: Constable and Company.
[16] Conway, D. 2000 The climate and hydrology of the Upper Blue Nile, Ethiopia.
Geographical Journal. 166, 49-62.
[17] Block, P., and Rajagopalan, B. 2007 Interannual Variability and Ensemble
Forecast of Upper Blue Nile Basin Kiremt Season Precipitation. Journal of
Hydrometeorology, 8, 3, 327-343.
[18] Xu, C. 1999 Climate change and hydrologic models: A review of existing gaps
and recent research developments. Water Resources Management. 13,
369-382.
[19] Aubrecht, G.J., 2005 Energy: Physical, environmental, and social impact (3rd
Edition). Addison-Wesley Publishing.
[20] Cubasch, U. & Cess, R.D. 1990 Processes and modeling. Climate Change: the
IPCC Scientific Assessment. 69–91. Cambridge University Press.
[21] Solomon, S. et al. 2007 Technical summary in: Climate Change 2007: The
physical science basis. Contribution of working group I to the fourth
assessment report of the intergovernmental panel on climate change.
Cambridge University Press.
[22] Giannini, A. et al. 2008 A global perspective on African climate. Climate
Change. 90, 359-383.
[23] Elshamy, M.E., Seierstad, I.A. & Sorteberg, A. 2009 Impacts of climate change
on Blue Nile flows using bias-corrected GCM scenarios. Hydrology and
Earth System Sciences. 13, 551-565.
[24] Kim, U. & Kaluarachchi, J.J. 2009 Climate change impacts on water resources in
the Upper Blue Nile River Basin, Ethiopia. Journal of the American Water
Resources Association. 45, 6, 1361-1378.
[25] General Assembly of the United Nations. Convention on the Law of Non-
navigational Uses of International Watercourses. 1997 Official Records of
the General Assembly, Fifty-first Session, Supplement No. 49.
[26] Whittington, D., Wu, X. & Sadoff, C. 2005 Water resources management in the
Nile Basin: The economic value of cooperation. Water Policy. 227-252.
45
[27] Hammond, M. 2013 The Grand Ethiopian Renaissance Dam and the Blue Nile:
Implications for transboundary water governance. Global Water Forum.
Discussion Paper 1306.
[28] Block, P. & Strzepek, K. 2010 Economic analysis of large-scale upstream river
basin development on the Blue Nile in Ethiopia considering transient
conditions, climate variability, and climate change. Journal of Water
Resources Planning and Management. 136, 2, 156-166.
[29] Block, P. 2011 Tailoring seasonal climate forecasts for hydropower operations.
Hydrology and Earth System Sciences. 15, 1355-1368.
[30] Yates, D. 1996 WatBal: An integrated water balance model for climate impact
assessment of river basin runoff. International Journal of Water Resources
Development. 12, 2, 121-139.
[31] Yates, D. & Strzepek, K. 1998 Modeling the Nile Basin under climate change.
Journal of Hyrologic Engineering. 3, 2, 98-108.
[32] Mitchell, T.D. & Jones, P.D. 2005 An improved method of constructing a
database of monthly climate observations and associated high resolution grids.
International Journal of Climatology. 25, 693-712.
[33] Hargreaves, G.H. & Samani, Z.A. 1982 Estimating potential evapotranspiration.
Journal of the Irrigation and Drainage Division. 108, 3, 225-230.
[34] Dixon, S.L. 1997 Fluid Mechanics, Thermodynamics of Turbomachinery (4th
Edition). Butterworth-Heinemann. Burlington, Massachusetts.
[35] Beyene, M., 2011 How efficient is The Grand Ethiopian Renaissance Dam?
Available from: http://www.internationalrivers.org
[36] Bureau of Reclamation, U.S. Department of Interior. 1964 Land and water
resources of the Blue Nile Basin: Ethiopia. Main Report and Appendices
I-V, GPO, Washington, D.C.


