Visual sensory substitution: Initial testing of a custom built visual to tactile device Dustin Wayne Venini Bachelor of Science A thesis submitted for the degree of Master of Philosophy at The University of Queensland in 2017 School of Psychology
Transcript
!!
!
Visual sensory substitution: Initial testing of a custom built visual to tactile
device Dustin Wayne Venini
Bachelor of Science
A thesis submitted for the degree of Master of Philosophy at
The University of Queensland in 2017
School of Psychology
! !
! ii
Abstract
Vision loss is among the major causes of disability. It is estimated that over 285 million people
worldwide are visually impaired, with 39 million considered blind and 246 million having low
vision. To reduce the burden of disease and increase the quality of life for this group, numerous
initiatives are currently under way to aid with the rehabilitation of blind and vision-impaired people.
One of the means in which people have attempted to supply visual information to blind people is
through the use of sensory substitution devices (SSDs). The core concept of an SSD is taking
information normally gained through one sensory modality (e.g. sight) and replacing it with
information normally gathered through a different sensory modality (e.g. touch, or sound). For this
thesis a custom visual to tactile SSD was developed with improved spatial and temporal resolution
compared to a commonly used device.
Chapter 2 includes the development of our tactile SSD and initial tests of the spatial and
temporal resolution using two different resolutions. Increased performance in the high-resolution
conditions was found for sensitivity, and motion detection/discrimination but not for object
discrimination tasks. In Chapter 3, object localisation and level of distracting information was tested
across tasks that included increasing amounts of cue information. We found that localisation ability
remained consistent regardless of the increase in information presented with the device.
Overall the results of my thesis suggest that our custom-built device performs similar to
existing devices in object localisation and discrimination tasks but performed at its best in tasks
involving motion stimuli. Critically the studies presented here support the continuation of increased
spatial and temporal resolution in SSDs and suggest that we are still not reaching the full potential
of what can be achieved with this technology.
! !
! iii
Declaration by author
This thesis is composed of my original work, and contains no material previously published or
written by another person except where due reference has been made in the text. I have clearly
stated the contribution by others to jointly-authored works that I have included in my thesis.
I have clearly stated the contribution of others to my thesis as a whole, including statistical
assistance, survey design, data analysis, significant technical procedures, professional editorial
advice, financial support and any other original research work used or reported in my thesis. The
content of my thesis is the result of work I have carried out since the commencement of my higher
degree by research candidature and does not include a substantial part of work that has been
submitted to qualify for the award of any other degree or diploma in any university or other tertiary
institution. I have clearly stated which parts of my thesis, if any, have been submitted to qualify for
another award.
I acknowledge that an electronic copy of my thesis must be lodged with the University Library and,
subject to the policy and procedures of The University of Queensland, the thesis be made available
for research and study in accordance with the Copyright Act 1968 unless a period of embargo has
been approved by the Dean of the Graduate School.
I acknowledge that copyright of all material contained in my thesis resides with the copyright
holder(s) of that material. Where appropriate I have obtained copyright permission from the
copyright holder to reproduce material in this thesis and have sought permission from co-authors
for any jointly authored works included in the thesis.
! !
! iv
Publications during candidature Groening, J., Venini, D., Srinivasan, M. (2017). In search of evidence for the experience of pain in honeybees: A self-administration study. Scientific Reports. Naughtin, C. K., Horne, K., Schneider, D., Venini, D., York, A., & Dux, P. E. (2017). Do implicit and explicit belief processing share neural substrates? Human Brain Mapping. Retell, J. D., Venini, D., & Becker, S. I. (2015). Oculomotor Capture by New and Unannounced Color Singletons During Visual Search. Attention, Perception, and Psychophysics. Conference presentations/abstracts during candidature Venini, D., Groening, J., & Srinivasan, M. (2016). Bees on the rocks – How does cold anaesthesia affect the defensive behaviour of honeybees? The 44th Meeting of the Australasian Society for the Study of Animal Behaviour. NSW, Australia: 5-8 July. Groening, J., Venini, D., & Srinivasan, M. (2016). We wouldn’t hurt a bee – In search of evidence for pain perception in honeybees. The 44th Meeting of the Australasian Society for the Study of Animal Behaviour. NSW, Australia: 5-8 July. Venini, D., Ditges, E., Sibbald, N., Jach, H., & Becker, S. I. (2016). Object localisation using visual to tactile and visual to auditory sensory substitution. The 16th Annual Meeting of the Vision Sciences Society. St Pete Beach, Florida: 13-18 May. Venini, D., Ditges, E., Sibbald, N., Jach, H., & Becker, S. I. (2015). Object localisation in the visually impaired using visual to tactile sensory substitution. 5th Australasian Cognitive Neuroscience Society Conference. Auckland, New Zealand: 26-:29 November. Retell, J. D., Venini, D., & Becker, S. I. (2015). Oculomotor capture by the unexpected: exploring the temporal profile of surprise in visual search. The 15th Annual Meeting of the Vision Sciences Society. St Pete Beach, Florida: 15-20 May. Becker, S.I., Venini, D., Retell, J.D., Wardhani, I., & Wolfe, J.M (2015) Mirror blindness in visual search for unfamiliar shapes and faces. European Conference on Eye Movements. Vienna, Austria: 16-21 August. !Publications included in this thesis No publications included
! v
Contributions by others to the thesis
My advisor Stefanie Becker contributed to the conception and design of all studies presented in this
thesis. Our two engineers, Ernst Ditges and Nicholas Sibbald contributed to the design and
fabrication of the custom sensory substitution device. Stefanie Becker also made comments and
suggestions throughout the thesis. Two summer research students Hayley Jach and Dusty O’Shea
assisted with data collection in the tactile SSD and auditory SSD tasks respectively.
Statement of parts of the thesis submitted to qualify for the award of another degree
None
Research Involving Human or Animal Subjects
This research was granted Institutional Research Ethics Approval under the title “Testing A Sensory
Substitution Device”. Ethics approval # 2012001418 by the Medical Research Ethics Committee.
See Appendix A.
! !
! vi
Acknowledgments As expected, this journey took considerably longer than anticipated and many people have come
and gone throughout that time. If I tried to list out everyone that has been supportive and helpful
throughout this MPhil I would certainly end up missing someone and rapidly run out of space. As
with all large projects, it is never a solo effort, so to everyone who I have crossed paths throughout
my degree, thank you!
The defining moment in this project ever coming to fruition was Stefanie Becker’s
willingness to take me on as an RA many years ago. She was the driving force to allow me access
into the world of research and help foster my ideas and motivation into something rewarding and
challenging. Most supervisors would have never agreed to take on a project of this scope, especially
in the context of an MPhil. While it was certainly not short of technological challenges I appreciate
that you were willing to help me work through it all.
I also want to thank Srini Srinivasan for his support throughout this MPhil. Srini has been a
shining example of what to aspire to as a scientist. His continuous curiosity and humility has been
unmatched in all the years I have known him. Additionally, I am eternally grateful for the
opportunity to work with him on the various honeybee projects as an RA. The experience
fundamentally changed the way I view the world.
Additionally I want to thank Jason Tangen and Paul Dux who both provided valuable
mentoring (and paid RA/tutoring work) throughout my degree.
I have been fortunate to have a fantastic set of officemates that became like extended family
throughout my degree. Emily Harris, Gianni Ribeiro, Tarli Young, Sarah Bentley, Mia McLanders,
and Zahra Mirnajafi, you are all absolutely wonderful people and I am forever grateful to have
shared this office (home) with you all.
Finally, I want to thank my family (both immediate and extended) who have been
consistently supportive throughout this university journey. Thank you for encouraging me every
step of the way. I will never forget it.
! vii
Financial support This research was supported in part by a UQ Research Scholar scholarship.
! viii
Keywords sensory substitution, artificial vision, electrotactile, blind, visually impaired, object localisation, object discrimination, assistive technology Australian and New Zealand Standard Research Classifications (ANZSRC) ANZSR code: 080602, Computer-Human Interaction 80% ANZSR code: 170112, Sensory Processes, Perception and Performance 20% Fields of Research (FoR) Classification FoR code: 1701, Psychology 60% FoR code: 0806, Information Systems 40%
! ix
Table of contents !Abstract………………………………………………………………………ii
Declaration by author………………………………………………………iii
Publications during candidature……………………………………………iv
Conference abstracts………………………………………………………..iv
Publications included in this thesis…………………………………………iv
Contributions by others to this thesis……………………………………….v
Statement of parts of the thesis submitted to qualify for the award of
another degree………………………………………………………………v
Research involving human or animal subjects……………………………...v
Acknowledgements…………………………………………………………vi
Financial support……………………………………………………………vii
Keywords…………………………………………………………………...viii
Australian and New Zealand Standard Research Classifications
(ANZSRC)………………………………………………………………….viii
Fields of Research (FoR) Classification……………………………………viii
Table of Contents…………………………………………………………….ix
List of figures…………………………………………………………………x
Chapter 1…………………………………………………………………...x
Chapter 2…………………………………………………………...………x
Chapter 3……………………………………………………………...……x
Chapter 4…………………………………………………………………...xi
List of tables…………………………………………………………………xi
Chapter 3……………………………………………………………………xi
List of Abbreviations Used In the Thesis……………………………………xii
Chapter 1 - Introduction and Overview……………………………………..1
Chapter 2 - Device development and initial testing………………………...10
Chapter 3 - Object localisation using SSDs………………………………...29
Chapter 4 - General discussion and conclusions…………………………....51 References…………………………………………………………………..57 Appendix A…………………………………………………………………61
! x
List of figures Chapter 1 Figure 1. Visual to tactile sensory substitution by Paul Bach y Rita Figure 2. The vOICe soundscape creation system by Peter Meijer Figure 3. Basic structure and setup of the bionic eye project Chapter 2 Figure 1. Image of the camera mounted goggles Figure 2. TDU components schematic Figure 3. Close up image of the tongue board and electrode array Figure 4. Image processing sequence Figure 5. Normalisation plots Figure 6. Target circle size in staircase measure Figure 7. Pixel sensitivity for high and low resolutions Figure 8. Shape discrimination accuracies Figure 9. Motion detection and direction performance Chapter 3 Figure 1. Visual representation of the three localisation tasks Figure 2. Localisation error for the tactile device Figure 3. Response time values for the tactile device Figure 4. Error heat maps for the tactile device Figure 5. Localisation error for the auditory device Figure 6. Response time values for the auditory device Figure 7. Error heat maps for the auditory device Figure 8. Heat map plot for control task
! xi
Chapter 4 Figure 1. Depth information List of tables Chapter 3 Table 1. Participant demographics for blind and visually impaired individuals
! xii
List of abbreviations used in this thesis SSD Sensory substitution device TDU Tongue display unit RGB Red, green, and blue colour space PC Personal computer AIHW Australian Institute of Health and Wellbeing PCB Printed circuit board SPI Serial peripheral interface !
Chapter 1: Introduction and Overview ! !
! 1
Introduction
According to the 1998 Survey of Disability, Ageing and Carers (AIHW, 2005), loss of sight is the
primary cause for disability in 2% of the total population (349,800 people). In 2004, the Australian
Institute of Health and Welfare (AIHW) estimated the total cost of vision disorders in Australia to
be $9.85 billion for that year (AIHW, 2005). Globally, a large proportion of blind individuals reside
in developing countries, which highlights the need to render practical assistive solutions also
appropriately affordable.
To date, several assistive devices are available for blind and vision-impaired people. The
improvements in assistive tools for the blind extend beyond simply improving on the deficient
sensory modality and are often vital to provide access to potential employment and general
independence in society. The advancement of basic technologies such as mobile phones already
provide a significant improvement in the ability for visually impaired persons to interact
successfully with the world.
Early SSDs involved the use of items such as the white cane (Strong, 2009). This is still one
of the primary tools used by visually impaired and blind individuals today. Modern canes are made
of highly durable materials and are designed to be foldable for easy of portability and storage when
not in use. Apart from providing information about objects that are close to the user, they serve
purposes above and beyond navigation itself. The cane is also a strong visual cue for nearby
individuals to be aware that the person near them is visually impaired or blind. This creates its own
natural safety net to alert others if the person is navigating into dangerous areas or appears to be
having other difficulties. The primary limiting factor of the white cane is that its sensory input
region is limited to the length of the cane. For practical and safety purposes, it is not sensible for the
cane to be significantly longer.
Modern sensory substitution devices aim to extend the distance capabilities of the device to
the limits of modern digital sensors. With digital video cameras or sonic sensors, the potential range
of inputs often exceeds natural vision (Heyes, 1984; Lehav, 2012). While there is an extensive
range of niche navigational assistive technologies, modern video-based SSDs tend to be either
visual to tactile, or visual to auditory devices.
Visual to tactile sensory substitution
Paul Bach-y-Rita initiated pioneering work on tactile sensory substitution in the late 1960s. The
initial sensory substitution device (SSD) was conceptually similar to braille in that it used the tactile
sense as a substitute for vision. The first visual to tactile SSD required the user to hold a video
! 2
camera that was connected to a computer that translated the video images to black-and-white
images. As seen in Figure 1., using a chair equipped with small vibrating motors, Bach-y-Rita could
project a low-resolution tactile impression of each camera frame to the surface of the skin (Bach-y-
Figure 1. One of the early versions of a visual to tactile sensory substitution device by the research group of Bach y Rita, et al. Images are captured by the T.V camera, converted into a lower resolution pixel image, and then displayed to the user through the tactile pins built into the chair. In this example the user would be feeling the image of the letter X. Image from White et al. (1970). The devices used in sensory substitution rapidly advanced beyond the tactile chair of Bach-y-Rita.
Visual to tactile sensory substitution is still occasionally conveyed using small vibrotactile arrays
(4x4 to 10x10), but modern devices have transitioned to higher resolution electrotactile arrays. This
shift to electrotactile devices had several advantages. First, the electrodes can be packed quite
densely on the array, producing a higher spatial resolution. Currently available devices usually
consist of a 20x20 electrotactile array; hence have a resolution of 400 pixels. Second, electrotactile
devices have considerably lower power requirements than vibro-tactile devices (Kaczmarek,
! 3
Webster, Bach-y-Rita, & Tompkins, 1991). Electrotactile arrays can also use small (microvolt) and
fast (microsecond) pulses to display a tactile image. This increased speed means that images can be
updated at a rate rivalling a “real-time” coupling with the input. Numerous studies attempting to
optimise the placement of tactile arrays have demonstrated that the tongue is an ideal location for
electrotactile stimulation due to its high sensitivity and spatial resolution (Essick, Chopra, Guest, &
By comparison, visual to tactile SSDs seem more promising. The current refresh rate of
tactile SSDs is 5 frames per second, which has also proven too slow for correct assessments of
(faster) moving objects. However, overall, tactile SSDs seem to be more promising, primarily
because they (1) do not block a vital sense of blind people, and (2) because it would be possible to
increase the spatial and temporal resolution whereas this may be problematic with the current
concept of auditory SSDs that rely visual information by a stream of sounds that is modulated in a
serial fashion (by a left-to-right scan).
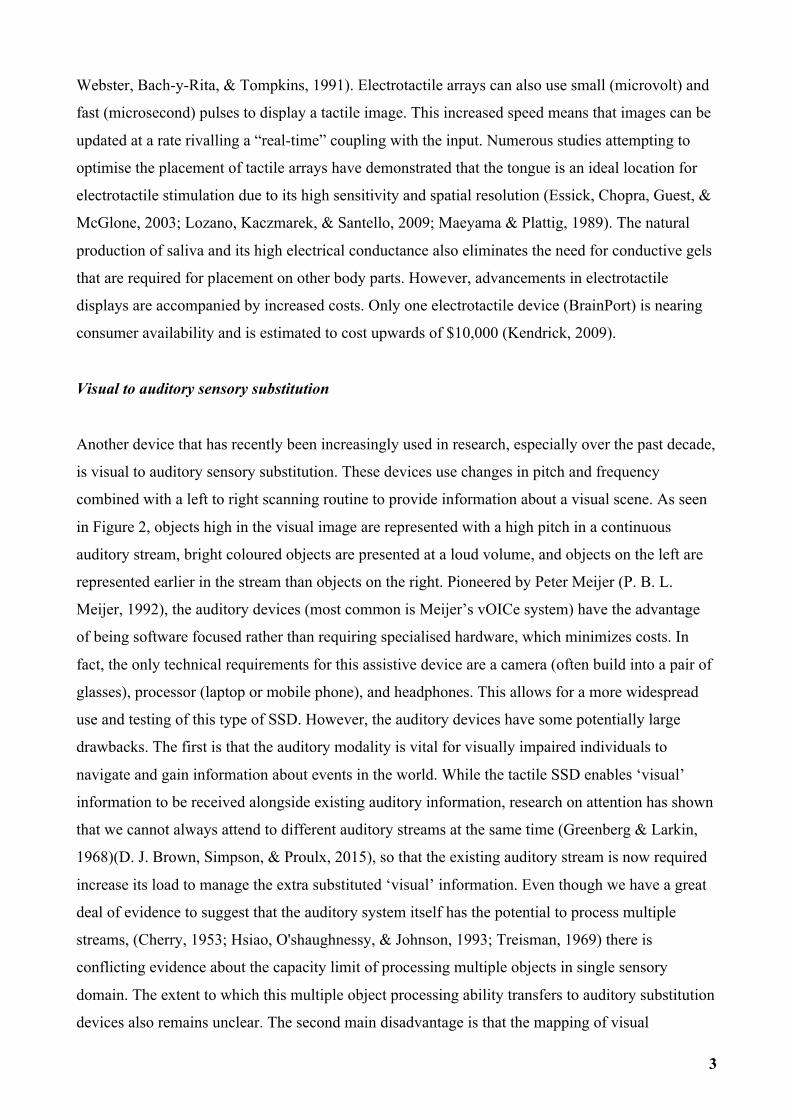
Figure 2. Equipment setup and image processing algorithm for the vOICe. Images from a video camera (mounted to a pair of sunglasses) are captured and scanned left to right to create a soundscape that is presented to the user once per second. Pixels at the top of the image have a higher pitch, and pixels that are brighter sound louder. Taken from Proulx, Stoerig, Ludowig, and Knoll (2008).
! 5
Bionic eyes
One common question that is often raised regarding visual sensory substitution specifically is if the
technology is being made obsolete with the advancements in bionic eyes. Bionic eyes involve the
implanting of a light sensor on the retina and a subsequent transmitter to send the captured
information to the optic nerve or directly into the visual cortex. It is important to acknowledge that
this is a technology that is also rapidly advancing but is not necessarily a competing technology
with sensory substitution. Bionic eyes necessarily have specific structural requirements such as an
intact retina, intact optic nerve or intact visual cortex. Sensory substitution devices can be used
regardless of whether the visual impairment is caused by damage at the eye itself, optic nerves, or
visual cortex, and thus, can help patients who would not be eligible for the bionic eye. Moreover,
SSDs are self-contained external devices that can be used or set aside as the situation is appropriate,
and hence, can be used in conjunction with retinal implants. One of the major selling points of
sensory substitution is that it is a non-invasive technology. Bionic eyes have a lifespan and will
require replacement and maintenance over time (Chader, Weiland, & Humayun, 2009; Ho et al.,
2015; Humayun, De Juan, & Dagnelie, 2016; Humayun et al., 2012). Each adjustment requires an
additional surgical procedure that is expensive and adds additional safety risks to the patient.
Fortunately, the frequency of replacement is continuing to decrease over time and later generation
implantable bionic eyes should be more stable and reliable (K. D. Brown et al., 2009). SSDs only
require an external sensor and an appropriate area of the body to place the sensor (such as skin for
tactile or ears for auditory). Overall, the bionic eye and sensory substitution can be regarded as
complementary technologies rather than competing technologies. The critical question is only
whether sensory substitution can indeed provide practically useful information to vision-impaired
people, so that the technology will be used widely.
Figure 3. Image of a retinal implant bionic eye. The camera sensor array (right) captures light which is transmitted by the processing unit (VPU) and then passed directly to the nervous system. The system comprises of an implant which is attached to the eye (left), an input camera mounted to a pair of glasses (right), and the processing unit. Image taken from Humayun et al. (2012)
! 6
Current areas of research
Research on SSDs can be roughly classified into three major categories: object localisation,
discrimination, and identification. Object localisation is most important for obstacle avoidance and
everyday interactions with objects such as grasping an object, catching or throwing a ball, etc. It
also plays an important role in orienting and navigation. Despite its importance, only few studies
have examined our ability to localise objects with an auditory or tactile SSD. Most importantly, the
dependent measures used in many of the localisation studies are time (how long did the user take to
successfully locate the object), or accuracy of judgment (did the user locate the correct object),
rather that measurements of physical distance (when the user reached for the object, by how many
cm did they miss the target) (D. J. Brown, Macpherson, & Ward, 2011; Proulx et al., 2008). Most
studies to date focussed on object discrimination or identification tasks (Maidenbaum, Abboud, &
Amedi, 2014). Discrimination is defined as our ability to distinguish between different objects, and
in a typical discrimination task, the range of possible objects is typically limited and the participant
typically knows which objects are likely to be present. An example of typical a discrimination task
is to indicate whether a line is oriented horizontally or vertically. By contrast, in an object
recognition or identification task, the participant typically has to report which object is present, and
the range of possible objects is much larger, and often less well defined. An example for an
identification or recognition tasks is the task to identify the face of a well-known person (e.g., actor,
politician). In the SSD literature, the task is typically to distinguish between different letters of the
alphabet, or simple objects (Striem-Amit, Cohen, Dehaene, & Amedi, 2012). Thereby, the range of
possible objects is much narrower than in the usual tasks, often comprising less than 10 objects, so
that these tasks could be just as well be labelled discrimination tasks. Below I will provide a brief
overview of the state of research between localisation and discrimination (see Chapter 2 for a more
in depth overview), and then outline some empirical gaps in the literature.
Localisation versus discrimination
As indicated above, object localisation tasks have been largely neglected in SSD research, perhaps,
because it is commonly assumed that people can localise objects with current video-based SSDs. It
is also intuitive that, once distal object attributions have been established and sensations are felt as
‘objects in space’ rather than ‘sensation on the tongue’ (or ‘sound in the ear)’, the location of
objects is rather obvious (Auvray et al., 2005). However, localisation in this sense is conceived
somewhat as an all or nothing concept. There is little research assessing how precise people can be
at localising objects under controlled settings. This however could be important, as the success of
! 7
an SSD will not only depend on whether it is possible to localise objects, but how quickly,
effortlessly and precise localisation is (chapter 2 will cover this in more detail).
Another potential problem is that previous studies often used tasks that involved presenting
objects at a limited range of fixed locations (Auvray, Hanneton, & O'Regan, 2007; Levy-Tzedek,
Hanassy, Abboud, Maidenbaum, & Amedi, 2012). With this, there is no need for the participant to
rely heavily on the information provided by the SSD to perform any high precision localisation
tasks. If the number of target locations is less than the users’ working memory span, then the task
can be completed using only slight cues from the SSD which turns localisation tasks into detection
tasks.
Overlooking localisation ability could also be potentially detrimental in other tasks such as
discrimination tasks, as discriminating between different objects could become considerably more
difficult when the distance of the two objects is unknown(Renier et al., 2005). For instance, how
would someone be able to tell the difference between a golf ball and a soccer ball if the golf ball
was 10cm from the sensor and the soccer ball was 100 cm? It quickly becomes apparent how
challenging simple tasks can become when one variable in either localisation or discrimination
tasks is missing (i.e., if it is either unclear what object is presented, or how far away the object is).
There are a number of strategies that can often be taught to help people work around these types of
issues. One such strategy could be based on motion parallax. The simplest demonstration of motion
parallax is what occurs when you look out of the window of a moving vehicle. Objects close to you,
such as road signs move past rapidly, but objects far away, such as a mountain seem like they are
not moving at all. If you apply this concept to a camera-based SSD, then motion of the camera
would make objects close move quickly across the display while objects farther away would move
slowly, if at all. Another strategy to infer distance can be object occlusion. If the sensor camera is
moved left to right over a scene then objects that are in front of others will block the image of
objects behind from appearing on the device.
However, as will be discussed in the next section, it is currently far from clear whether
current SSDs would support training of motion parallax and similar strategies, and how the training
should be tailored for optimally training participants.
Training and learning
How best to train users to use sensory substitution devices still remains an area of contention. It is
generally safe to assume that more experience is almost always better but if the overarching goal is
to convince people to try out this type of technology it is important to ensure that the time and
energy demands of training do not outweigh the benefits. Training on a SSD has often been
! 8
described as being similar to learning a new language (Deroy & Auvray, 2012). Depending on the
level and duration of visual impairment it may take considerable time to learn all the appropriate
associations between camera sensor input and the sensations on the SSD. Generally it seems as
though people learn quite rapidly with the task so it makes sense for the training to just ensure that
participants are comfortable with the basic concepts of the device and then have ample time to
freely explore to learn what their capabilities are. At this point in time there is not sufficient
evidence to support a single true training method that is most ideal for any participant. There are
two primary training methods that stand out in the literature. The first is from the BrainPort group
and the second is from the vOICe group.
The standard training protocol for the BrainPort (Nau, Pintar, Arnoldussen, & Fisher, 2015)
involves the progression through the following 9 levels:
1. Basic familiarisation with the functionality of the device as well as simple maintenance
information (such as changing the batteries, and troubleshooting).
2. Basic shape discrimination. This involves presenting various high contrast shapes (white shapes
on black background) and allowing the participants to explore the sensations associated with
features of the shapes (edges, corners, etc.).
3. Identifying high-contrast symbols. The presented shapes increased in complexity and included
symbols and letters that could be combined into words. Some of the symbols would be of a more
practical nature such as exit or restroom signs.
4. Scene topography and functional reach. This stage involves higher-level conceptual training and
allowed the participants to experience potentially unfamiliar concepts such as shadows, perspective,
and changes in SSD sensation based on the relationships between objects (such as stacking blocks).
5. Preambulation techniques and safety. This level prepared users for interaction with more real
world environments and developed safety techniques such as scanning into the distance to reduce
risk of falls and recognising structural features (doors, windows, or stairs).
6. Early navigation. This stage introduces basic landmark information and trains users to be able to
navigate towards a fixed point in the environment.
7. Navigation. Participants now progress to learning how to navigate using contrast information
between walls and the floor.
8. Advanced navigation. This stage builds on the previous stage by introducing additional objects
and obstacles that may be present during navigational tasks.
9. Advanced and personalised skills. For the final stage, participants were provided with an
individually tailored program based on their own unique needs. Training typically transitioned into
the home setting at this point and often integrated with their existing tools (cane or guide dog).
! 9
The standard training protocol for the vOICe (P. Meijer, 2017) is based around a similar 8
stages:
1. Basic introduction. Setting up the software based on users device and establishing appropriate
volume levels.
2. Image to sound mappings. Explanations and examples of the mapping system used with the
vOICe (left and right, up and down, dark and light).
3. Reaching and grasping. This stage is presented as one of most important for all of the training.
The training involves high repetitions of reaching for a high contrast object (white plastic brick on
black cloth) on a table. It is recommended that this grasping task be performed daily (30 min) for at
least two weeks.
4. Interpreting distance and size. This stage is designed to train the user to become familiar with
how the size of an object changes as a function of its distance from the user. Users are instructed to
practice perceiving the changes in sensation as they move forward and away from objects. This
practice should be done daily (30 min) for at least 2 weeks.
5. Visual perspective. Similar to the previous stage, users are now trained to understand how the
SSD sensations change based on changes in the angle of the object.
6. Visual landmarks. This stage introduces users to using fixed objects in the environment as a
reference point for navigation.
7. Training schedule. Users are now encouraged to follow a training schedule of 30 minutes of
“reaching and grasping” and “interpreting distance and size” in weeks 1 and 2. For weeks 3 onward
(for at least one year), 15 minutes of “reaching and grasping” and “interpreting distance and size” as
well as use of the vOICe in daily environments that are best suited to the user.
8. Performance checklist. The final stage involves a user being able to answer five basic questions
before reaching their end goal.
- Can you perform the “reaching and grasping” task with 2 bricks simultaneously in one grab within
three soundscapes (3 seconds)?
- Can you walk around freely in a home environment without touching walls or furniture?
- Can you walk across a room to a specified object and reach out and touch it?
- Can you turn around several times in a room and still reorient yourself?
- If you drop an object can you easily locate it with the vOICe and grab it in one movement?
Both training protocols prioritise a simple introduction and non-cluttered object detection and
localisation. End goal performance still tends to be based around navigational components for
! 10
someone intending to transition out into the real world with the device. It still remains unclear what
the ideal timeframe is for progression from one step to the next. It also remains unclear whether it is
best for training to be centred on a task based focus (where the training is targeted at developing a
single specific skill set) (Haigh, Brown, Meijer, & Proulx, 2013) or generalised (where the training
provides users with a wider range of different skills that are more widely applicable) (Proulx,
Brown, Pasqualotto, & Meijer, 2014; Proulx et al., 2016). As far as I am aware, no one has yet
reported any results of SSD performance across various types of training methods to determine
overall which is the best path forward. One concern is that we may end up training participants for
the task rather than for generalised applicable use. Fortunately, there is growing evidence to suggest
that specific skill training can potentially be generalised into a higher-level strategy set that would
be implemented over longer time courses (D. J. Brown & Proulx, 2013; Kim & Zatorre, 2008,
2011).
The first overarching question of this thesis is as follows:
How precisely can blind or visually impaired persons localise objects in space using sensory
substitution and what can we do to maximise their ability to increase this precision?
! 11
Chapter 2: Device development and initial testing
! 12
The aim of this study was to test a new, custom-built electro-tactile SSD that can aid the
rehabilitation of blind and vision-impaired people. As will be described later in more detail, the
electro-tactile SSD tested at The University of Queensland has a higher spatial and temporal
resolution than currently available devices (e.g., BrainPort, Wicab Inc, Middleton, WI, USA), and
uses a slightly different method of presentation, so that it was important to test its potential
usefulness for the intended population.
The overarching aim of the project was to build a modern, video-based SSD that can
potentially improve the quality of life for blind and vision-impaired people, and assess its
performance characteristics. In the design of such SSDs, a first important point to consider is which
type of SSD would have the highest chances of eventually succeeding in the task of aiding
orientation and navigation. As argued above, visual-to-tactile SSDs have the central advantage over
visual-to-auditory SSDs that they do not block a vitally important sense of blind and vision-
impaired people. In fact, of the human senses, only the tactile sense seems to be reasonably ‘idle’
and seems to have adequate performance characteristics to serve as a vehicle for the kind of
broadband information transfer required for substituted visual information (Kaczmarek et al., 1991).
Among the visual-to-tactile SSDs are electrotactile and vibrotactile SSDs. Both devices
translate visual images from a video camera into black-and-white images that can be translated into
tactile activation of a tactile array. The primary difference is that vibro-tactile arrays typically
consist of small vibration motors that transfer sensation to the skin, while electrotactile passes small
current directly to the underlying mechanoreceptors.
Historically, the primary reason for choosing electrotactile over vibrotactile arrays was that
the energy consumption of vibrotactile arrays was forbiddingly high, requiring batteries that would
have been impossible to implement in a mobile device. Fortunately, advancements in technology
have been able to reduce this problem (Novich & Eagleman, 2015; Stronks, Parker, Walker, Lieby,
& Barnes, 2015) and the size and energy consumption in vibrotactors continues to improve with
advancements in microelectronics. Another important advantage of electrotactile arrays is the
precision in which visual images can be rendered. Because of the large surface area required for
vibrotactile SSDs, the overall surface area required to display images of a reasonable spatial
resolution is too large. With an electrotactile display over 1000 pixels can be easily fitted on the
surface of a section of the tongue. With vibrotactile displays, the entire body surface would be
required to reach a similar resolution, resulting in more complicated (and potentially, less intuitive)
transformations of visual information from the camera input to tactile activation. Moreover, as
vibrotactors have longer latencies, presenting an entire image would also result in a reduced
Additionally, electrotactile devices have clear practical advantages. For instance, the fact
that participants hold the tongue display against the tongue renders it easy to mount and dismount
the device and to control the activation (e.g., start or stop sensation as necessary, shift it to slightly
different regions, etc.): If the sensation becomes uncomfortable or the user wishes to take a break,
he or she can simply lift the display off the tongue surface. The downside is that removing the
device from the mouth would also be required to eat or drink and potentially to speak (the tongue
based devices do have the potential to be mounted in waterproof casing in a retainer that would
address these potential issues). A vibrotactile display would require a more complicated and time
consuming process to attach and release from the user as needed. There have been attempts to
address this issue with some of the smaller tactile arrays that could be attached using a strap around
the wrist, but there is the inherent tradeoff between increased ease of placement and surface area
required for high-resolution arrays.
In conclusion, there are multiple good reasons to focus development efforts on electro-
tactile SSDs. In this regard, it is however interesting to note that currently available electro-tactile
SSDs do not seem to be performing at the highest possible level. The currently available BrainPort
device has a spatial resolution of 20x20 electrodes (400 pixels resolution) on a spatial array that
could easily fit more electrodes (e.g., to reach 800 pixels resolution). Moreover, its temporal
resolution seems to be 5Hz – which is arguably too slow to represent fast moving objects such as
cars, which would seem relevant to ensure safe travelling. At the beginning of the current project,
the BrainPort was also not commercially available, which necessitated creating and manufacturing a
custom-built electro-tactile SSD for the current project.
The custom-built SSD at The University of Queensland currently has a spatial resolution of
32x32 (1,024 electrodes) that are spread over a similar area as the electrodes of the BrainPort
device, using a similar architectural design (double-ring electrodes; see the methods for details).
Moreover, the custom-built SSD has a much faster refresh rate than the normal refresh rate of
customary video cameras, so that the actual temporal resolution is the same as that of the video
camera (typically 30Hz).
Admittedly, it is currently unknown whether these improvements in spatial and temporal
resolution will translate into any real benefits for the user. To date, no empirical study has
systematically examined the realistic information processing capacity of substituting modalities, or
the effects of increasing the spatial or temporal resolution of current SSDs in this range (20 x 20 to
32 x 32; 5Hz vs. 30Hz; but see (Bach-y-Rita, Kaczmarek, Tyler, & Garcia-Perez, 1998; D. J.
Brown, Simpson, & Proulx, 2014; Buchs, Maidenbaum, Levy-Tzedek, & Amedi, 2016). One of the
principal aims of the current study was to examine whether our custom-built SSD performs as well
! 14
(or better) than the currently available electro-tactile SSDs. Specifically, we assessed whether the
device supports object localization, discrimination and motion detection/discrimination.
In the present study, we slightly varied the testing protocols, amongst other things, by
testing naïve, untrained participants. The reasons for this deviation from previous protocols were
twofold. First, inspection of previous studies (for details, see below) revealed that the methods were
not detailed enough to exactly replicate the testing conditions used the BrainPort studies (Grant et
al., 2016; Nau, Bach, & Fisher, 2013; Nau et al., 2015). (Note that testing SSDs like the BrainPort
requires knowledge of the exact distance to the objects, the area covered by the camera, and refresh
rates, etc.). Given that an exact and accurate comparison between our device and the BrainPort was
hence unattainable, we opted for omitting training sessions and tested all participants after a short
familiarization phase.
The reasons for this deviation were that extensive training phases could be considered
notable limitations of current SSDs. Modern video-based SSDs often require long training sessions
in order to reach high levels of performance. This may include training over the span of weeks or
months rather than hours (Grant et al., 2016; Nau et al., 2013; Nau et al., 2015). This is a possible
limitation, as more users will be using these devices if they immediately support simple object
localization and discrimination. A second problem for studies using extensive training periods is
that they are more difficult to replicate, as it is impossible to include sufficient information about
the training to allow other labs to replicate the results. It is also difficult to gauge whether training
should be standardized: Our own pilot tests revealed that the most effective training probably
depends on the level of visual impairment of the user, as well as their experience with vision. For
example, an early blind participant may need training in how to interpret basic visual concepts such
as how an object increases in size with decreases of the distance and can occlude other objects, or
how the speed at which an object moves across the display may imply its distance from the camera
(motion parallax). Explanations and training on basic functions of how a camera works is also often
necessary in congenitally blind participants. It was not uncommon in early stages of training to see
a participant associate motion on the display with motion of the object when it was actually their
panning of the camera that was leading to motion on the display. Given these uncertainties, and the
clear advantages of assessing how an SSD performs ‘straight out of the box’ with untrained
participants, in the current study we did not implement an extensive training regime. Instead, we
simplified some of the tasks used in previous studies (Grant et al., 2016; Nau et al., 2013; Nau et al.,
2015), and assessed whether our custom-built SSD would support localization, discrimination and
motion detection tasks after a brief familiarization phase.
To test whether an increase in spatial and temporal resolution can benefit a (naïve) user of
the device, we systematically varied the spatial and temporal resolution of our device. To date, only
! 15
few studies have systematically investigated the effects of different spatial resolutions on SSD-
mediated performance. Work by Bach y Rita (Bach-y-Rita et al., 1998) tested the discrimination
ability of tactile SSD users while using objects of varying pixel resolution (4x4, 5x5, 6x6, 7x7) and
found that discrimination accuracy increased from sixty percent at 4x4 resolution) to over 80
percent at 7x7 resolution (chance performance was 33 percent). This would be expected across
items using such a low overall resolution but even their highest resolution does not reach the level
where more fine-grained features could be presented in an object (e.g. variations in facial
expression, letters of a word, etc.). In the auditory domain there has been some work looking at
performance using a SSD where the resolution of the target images varied from 4x4 to 32x32 pixels
(4x4, 8x8, 16x16, and 32x32) (D. J. Brown et al., 2014). Participants were presented with six
different objects using the SSD and were tasked with matching them to the appropriate visual
images. Performance significantly improved from 4x4 to 8x8 but then plateaued and there was no
significant improvement in the 16x16 and 32x32 resolutions. It is difficult to interpret whether this
data is representative of a performance ceiling with the device itself, the stimuli used, the task
training, combinations of all. Thus, it is possible that the stark limitations of current SSDs are
rooted in the limited spatial and temporal resolution of current devices.
With all of this information in mind, the principal aim of the first study was to investigate
whether increasing the spatial and temporal resolution above current tactile SSDs would benefit
performance in visual acuity and motion detection tasks. To that aim, we tested our custom-built
SSD in two spatial resolution settings (16x16 vs. 32x32) and two temporal resolution settings (5Hz
vs. 30Hz), across three different tasks; a light detection task, object discrimination task and motion
discrimination and detection task, respectively. The decision to use 16x16 pixels as the low-
resolution option was made due to practical limitations. We were unable to build additional tongue
boards of custom resolution so had to use existing boards with half the pixels activated. If the
higher-resolution SSD confers reliable and immediate benefits in visual acuity and this aids
performance, performance should be better across all three tasks with the higher temporal/spatial
resolution than with the lower temporal/spatial resolution. A corresponding results pattern would
also demonstrate that the temporal and spatial resolution of the tactile sense exceeds that of
currently available SSDs, which resolves a currently highly speculative debate.
Previous research conducted with the BrainPort primarily focused on measures of visual
acuity such as the BaLM test, FraCT test (Bach, 1996), and BaGa test (Wilke et al., 2007), as well
as discrimination measures such as word or object identification. The BaLM test (Bach, Wilke,
Wilhelm, Zrenner, & Wilke, 2010) consists of a light perception task, time resolution task, light
localisation task, and a motion detection task. Nau et al. (2013) tested BrainPort users on the BaLM
task and found their participants performed below chance for all of the tasks prior to training.
! 16
Training consisted of a structured regiment of 15 hours spanning across 5 consecutive days. After
the training sessions there were significant improvements above chance level for the light
perception (50% pre, 91% post, correct) and light localisation (12.5% pre, 45.8% post, correct), but
not for time resolution (50% pre, 56.3% post) or motion detection (12.5% pre, 16.7% post). Even
with the training it was not surprising to still see poor performance in temporal based tasks due to
the low temporal resolution in the BrainPort (i.e., 5 Hz). Performance with the BrainPort in the
object and word recognition tasks was also at zero for baseline measures. Performance significantly
improved for object recognition after training but not until 3 months post-training in the word
identification task (Nau et al., 2015). In a similar longitudinal study with the BrainPort participants
were still able to perform object discrimination but not able to perform word discrimination after 12
months of use (Grant et al., 2016).
As mentioned above, in the present study we opted to omit long training phases and instead
test all participants after a brief familiarization phase, to see whether changes in the temporal and
spatial resolution translate into immediate benefits (and in which tasks).
We chose to test participants on a sensitivity task, shape discrimination task, and a motion
detection/discrimination task. The sensitivity task used a target circle that became increasingly
smaller depending on detection accuracy (using a 2 down 1 up staircase procedure). The shape
discrimination task required participants to simply discriminate between a square and a circle. The
motion detection/discrimination task involved firstly, detecting the lateral position of an object, and
secondly, determining whether the object was presented static, or moved into its position.
The second overarching question of this thesis is as follows:
Can we increase the spatial and temporal resolution of electrotactile displays and will this increase
in resolution lead to increased performance using SSDs?
In the following, we will briefly describe the technical specifications of our SSD before
detailing the methods used to test the effects of high vs. low temporal and spatial resolution.
Methods.
1. Description of the custom-built SSD
The custom-built SSD consisted of an external video camera to capture scene images, a processing
unit to convert the images into a format suitable to display on a low resolution tactile board, an SSD
! 17
controller than can manage the electric current and pulse frequency for the user, and a display board
that can fit on the tongue (see below for details).
The SSD developed at UQ centrally consists of 4 components:
1. A USB web cam (Microsoft LifeCam, native spatial resolution: 1280x720; max. temporal
resolution: 30fps, field of view: 68.5˚) conveys video images via USB to the laptop computer. As
shown in the Figure below, for testing the SSD, the web cam was removed from its plastic casing
and mounted inside a hole drilled into the centre of a pair of ski goggles, using foam tape to
completely blacken out light. These measures ensured that the video camera was always mounted at
a stable position on the participants’ head, while simultaneously depriving sighted and partially
sighted participants of all visual inputs.
Figure 1. Blackened out ski goggles were used to house the input camera (Left). A modified
webcam was fitted into the back of goggle lens (Right). The ski goggles provided a comfortable and
stable base to ensure the camera position remained consistent throughout the tasks.
2. A laptop computer (Dell i7-4610M, 3.00GHz, 8GB RAM) was used to pre-process the video
images (e.g., with openCV in Python. See image processing section below). The data are then sent
via USB cable (virtual COM port; Baud Rate: 115,200 bps) to the custom-made Controller unit
(which is also powered via the USB connection; 5V).
3. Controller unit. The controller unit contains two printed circuit boards (PCBs), one of which is
connected to the volume knob (potentiometer) at the outside of the controller unit, which allows
participants to adjust the voltage of the tactile display (0-20V). The other PCB is an Arduino Mega
2560 with a microprocessor (ATmega 2560, 16 MHz, 256kB flash memory, 8kB SRAM) that
! 18
controls the tactile display. The microcontroller sends information via the serial peripheral interface
(SPI) bus (clock frequency: 7.1 MHz) and a 10-way ribbon cable to a hand-held PCB.
Figure 2. The 4 components of our custom SSD (from left to right). Camera sensor (webcam
mounted into the pair of ski goggles), image processing (laptop or PC), control unit (an Arduino
was used for our device), and tongue display (the positioning of the array on the tongue is such that
the top of an image is felt at the tip of the tongue and the bottom of the image is felt at the back of
the tongue).
4. Hand-held PCB. This is a custom-made 4-layer printed circuit board (PCB) that contains 2 chips
(HV5522 and HV4622; often used, e.g., for electroluminescent displays) that are covered by black
heat shrink, so that the chips are protected and participants can comfortably grasp the PCB. The
chips are connected via copper tracks on the PCB to the tactile display (size: 3cm x 3cm), which
consists of a matrix of 32x32 gold-plated double-ring electrodes. As shown in Figure 3, each
electrode in the tactile display consists of two components; a central ring (diameter: 0.35mm)
surrounded by an outer ring (diameter: 0.75mm, spacing: 0.1mm). When activated, electrical
current flows from the central ring to the outer ring. The double-ring concept was chosen because it
prevents spillover to neighbouring electrodes (as measured with Logic Analyzer), and led to the
most agreeable tactile sensations. Other prototypes (e.g., current flowing from a central ring
electrode to a continuous, straight track) led to rather ‘biting’ tactile sensations. All PCBs were
construed with the Eagle 6.5 software, and manufactured by PCBcart (using Gerber files).
Figure 3. Image of the 32x32 pixel gold plated electrode array used as the tongue board (Left).
Each pixel is made of an inner and outer ring (Middle) connected by parallel channels (Right, blue
linest). Each pixel can be activated at will, similar to an LCD computer screen.
! 19
Data flow
Operation.
The tongue display is controlled via a microcontroller containing a custom-written C-program that
allows presenting a tactile image on the tongue display. Tactile images are encoded by a number
string consisting of 1s (on) and 0s (off) that can be sent to the microcontroller using HyperTerminal,
Matlab, or Python. The C-program then parses the string into column and row information, which is
transferred via a ribbon cable into two chips located on the hand-held PCB. Each chip controls the
current of the 32 rows and 32 columns, respectively. The chips generate the tactile image by
applying an electrical potential to all columns of the tactile display that contain white pixels, and
serially applying a brief electrical pulse to all of the 32 rows in turn (i.e., sequentially switching the
current on and off for rows 1-32). This method (which is generally used in LED/LCD controllers
and tactile SSDs to avoid an excess of cabling) guarantees that, on the tactile display, only
electrodes that correspond to the white pixels in the image will carry electrical current.
Physically, a tactile image is presented sequentially from the tip of the tongue towards the
back; however, as the current switches rapidly across the different rows, the resulting sensation is
still one of an entire image, not of separate sections of the tactile display being switched on or off
(similar to LCD displays). Switching through the rows with a speed of 1 ms/row is sufficient for a
reliable tactile sensation and will allow presenting a complete tactile image within 32ms (resulting
in a ~30 Hz refresh rate for entire images). The microprocessor and chips are capable of supporting
much higher refresh rates (up to 500 Hz); however, most participants require activations of 500µs
(0.5ms) per row for reliable tactile sensations at their preferred voltage level (usually between 4V
and 6V), so that the practical maximum temporal resolution of the tactile display is 62.5 Hz.
The three primary settings that determine the refresh rate are the repetition count, image
delay, and row duration. Manipulating the repetitions of the display controls the subjective
experience of pulse intensity. The repetition count is the number of times an individual image is
presented on the array before accepting a new image from the camera. The image delay is the gap in
time between the repetitions and the new image to present. The row duration is the amount of time
each individual row is activated on each repetition. The standard presentation timing of an image
would look something like this:
Image = (Σ row delays + image delay) x repetitions
! 20
The default setting for each image is 5 presentations of 10µs bursts with a 10µs delay between new
images. This was found to produce the most reliable sensation during initial pilot testing and maps
onto settings used by earlier electrotactile researchers (Kaczmarek et al., 1985; Kaczmarek et al.,
1991; Lozano et al., 2009).
Image processing.
When the tactile display is used together with the web cam, the laptop computer processes the
image from the web cam, by taking a central cut-out of 480x480 pixels (25.6˚ field of view). Each
image is converted to a grey scale image and down-sampled to a 32x32 bitmap by averaging the
brightness of the neighbouring 225 native pixels. The resulting bitmap is then thresholded so that
each bright pixel (e.g., RGB value above 105, 105, 105) is represented as white, all others as black.
The bitmap information is coded into a string (e.g,. 101100010…; with 1 representing white pixels
and 0 black pixels), with the first number in the string referring to the pixel on the top left and last
to the pixel on the bottom right of the image.
Figure 4. Image processing sequence. Initial camera image is converted to grayscale (Left),
downsampled to 32x32 pixels, then the individual pixel values are thresholded to determine which
pixels will be active or turned off (Right). The threshold value can be adapted as necessary
depending on the amount of light present in the environment. E.g. in outdoor daylight settings the
overall threshold may need to be lowered so that the contrasts within the object are more clear.
2. Study
Participants
Participants were 6 (4m/2f) (mean age=27.5) volunteers from The University of Queensland.
Participants had normal vision and but were blindfolded for the purpose of the experiment by
wearing the blackened-out camera mounted goggles.
! 21
Methods
All participants completed a basic voltage setting, normalisation routine, and 3 visual acuity tasks
(staircase dot task, stationary/motion task, and square/circle task), further described below.
Normalisation routine
It is well known that the sensitivity of the tongue decreases from the tip to the back, so that the
same stimulation will evoke a stronger sensation at the tip of the tongue than at the back
(Chekhchoukh & Glade, 2012; Tyler, Braum, & Danilov, 2009). The overall sensitivity of the
tongue as well as the decline in sensitivity towards the back of the tongue varies between different
participants, rendering it necessary to adjust the voltage over different sections of the tongue
individually for each participant. There does also appear to be variation in sensitivity across the
width of the tongue with the edges typically being more sensitive than the middle but our device is
unable to adjust intensities along this axis currently.
In order to map out this tongue sensitivity, participants were first presented with a 4x32
pixel horizontal rectangle on the tongue display. The rectangle was activated for 1 second at the tip
of the tongue then after a 1 second delay was presented again slightly farther back on the tongue.
The tongue display was initially set to present each of the 4 activated rows for 0.5ms, with
sufficient repetitions so that the overall stimulus duration for a bar was 1s. Afterwards, the rectangle
was immediately presented in the adjacent position, shifted by 4 rows, and the process repeated 8
times until the rectangle had moved from the tip to the back of the tongue. The participant was
asked to count the number of presentations they felt and to report if any were equally strong.
Typically, participants reported feeling only the first 3-4 activations at the tip of the tongue, which
subjectively decreased in intensity, and nothing towards the back of the tongue. To achieve equal
intensity, the rows on the tongue display that stimulate the back of the tongue were set at longer
presentation durations (e.g., 1.5ms). The presentation of all 8 bars was repeated until the participant
could reliably feel the 8 rectangle presentations and reported that they were equally strong.
All participants who completed the normalisation procedure (N=6) chose overall voltages
between (4.2V and 6.8V), and row presentations durations between 0.5ms (tip of the tongue) and
2.5ms (back of the tongue). All participants chose row presentation durations that increased
markedly and in an approximately linear fashion from the tip (or middle) of the tongue to the back
of the tongue consistent with results seen in previous research (Chekhchoukh & Glade, 2012). The
results of our normalisation test also show the common effect of decreased sensitivity in the
! 22
posterior segments of the tongue (Pleasonton, 1970). This procedure worked well consistently with
our device to achieve reliable normalisation. It is unclear if a similar procedure is used for
normalisation in the BrainPort or if that device is capable of making only row intensity changes
(like ours) or is able to adjust on an individual pixel basis.
Figure 5. Average voltage intensity as a function of tongue position using the electrotactile SSD.
The orientation of the display is such that it moves from the tip of the tongue (Position 1) to back of
the tongue (Position 8). Longer row activation duration is required the farther from the tip of the
tongue the image is presented due to the decreased sensitivity that is generally found in the back
portions of the tongue. Sensitivity is almost uniformly high for all participants on the tip of the
tongue.
Description of Tasks
For all tasks participants were seated at a table wearing the SSD goggles at a distance of 50cm from
the display. Images were displayed on a 17in CRT monitor with a spatial resolution of 1280x1024
and a temporal refresh rate of 85Hz. Distance from camera (1280x720 resolution with a field of
view of 68.5 degrees) to computer monitor was held constant by use of a chinrest, but participants
were free to rotate their head as needed. The chinrest provided a means to maintain consistency of
object size on the display but still allowed the participants to actively explore the display while still
providing a neutral point to ensure the computer monitor remained in their field of view. At this
distance a square of 10x10 screen pixels correspond to 1 pixel on the electrotactile display. As
! 23
previously mentioned the goggles are completely blacked out so for purposes of the experiment,
participants had no light perception.
To assess whether or not the higher spatial and temporal resolution of our SSD could confer
any advantages compared to the settings used on the standard BrainPort, we compared two spatial
and two temporal resolutions across 3 tasks. One spatial resolution corresponded to the standard
native resolution of our device (32x32), and was compared with a low-resolution condition (16x16),
which was achieved by switching off every other pixel on the tongue display. Second, to test
whether a higher temporal resolution of stimuli can confer any advantages in detecting or
discriminating moving stimuli, we varied the temporal resolution between the standard native
temporal resolution of our device (~30 Hz) and a low temporal resolution condition (5 Hz) that
corresponded to the reported standard temporal resolution of the BrainPort V100 (Nau et al., 2013;
Nau et al., 2015). Some of the previous studies performed using the BrainPort reported mixed
results in object discrimination and measures of “visual acuity” but it is unclear if the performance
differences were also due to the older version of the BrainPort (10x10 or 12x12 resolution)
compared to the newer version (20x20 resolution). Kupers and Ptito (2014) found no behavioural
performance differences between blind and sighted controls in their object discrimination task using
squares, triangles, and the letter E but “visual acuity” scores were reported as being high in previous
tasks using the same letter E (Chebat, Rainville, Kupers, & Ptito, 2007).
Task 1: Sensitivity at different spatial resolutions
The central aim of the first task was to assess whether the increased spatial resolution of our SSD
would convey an advantage in a light detection task, in which the target became increasingly
smaller (see Nau et al. (2013), for a similar task). In the task, participants were asked to detect a dot
that was either present or absent on the computer monitor (50% each), gradually decreased in size
according to a staircase procedure. This task provides some insight into the just noticeable
difference level that may be attainable with a higher resolution SSD. This is also an area of research
that is recently growing in the vibrotactile domain (Stronks, Walker, Parker, & Barnes, 2017).
At the beginning of Task 1, a white circle of 100 pixels in diameter was presented centrally
on the CRT monitor while the participants observed the screen using the SSD. The participant had
to report via key press whether the stimulus was present or absent. The experiment was run using a
2-up-1-down staircase procedure. That is, for every 2 correct responses in a row the stimulus size
was decreased by 10 pixels and for every incorrect response it was increased by 10 pixels. To arrive
at a measure for sensitivity, the experiment continued until 8 response reversals were recorded. A
response reversal is defined as the point where a response changes from correct to incorrect or from
! 24
incorrect to correct. The final sensitivity is computed as the average resolution of the switch values
after dropping the first 2 switches (Garcia-Perez, 1998).
This task was performed at two separate spatial resolutions on the tongue display. In the
high-resolution condition all 32x32 pixels could potentially be activated by the white target dot. In
the low-resolution condition every other pixel was deactivated resulting in a 16x16 resolution
display. Participants were not made aware of which resolution they were using during the
experiment. The spatial resolution condition was blocked, with the order of blocks being
counterbalanced across participants (to control for possible training effects).
Task 2: Shape discrimination
The shape discrimination task was designed to measure possible influences of spatial resolution on
shape discrimination ability. Similar to Kupers and Ptito (2014), participants were presented with
either a filled square (400x400 pixels) or a filled circle (radius: 200 pixels) on the monitor, and had
to report with a key press whether the presented object was a square or a circle. The image
remained on the monitor until a key was pressed. Participants were asked to respond as quickly as
they could. Prior to beginning the task, participants were presented with each shape once and were
encouraged to actively explore the image by “looking” around the display to feel the change in
sensation that occurs with the contrast at the edges of the object. The spatial resolution of the tactile
display was varied between 32x32 and 16x16 across two different blocks. Participants completed
24 trials in each of the two different spatial resolution conditions, with the order of conditions being
counterbalanced across participants.
Task 3: Motion detection and motion discrimination
The third task was a 4 alternative forced choice task, designed to measure simultaneously (1) how
well participants could detect the presence vs. absence of motion, and (2) discriminate two different
movement directions (or endpoint locations of a stimulus). Participants were presented with a
100x100 pixel square (10x10 pixels on the tongue display) that could appear either on the left or the
right side of the display (stationary condition), or was presented in the centre and moved to the left
or right position over the span of approximately 1 second (motion condition; 50% of all trials). The
object then remained on the right or left until a response was made. Participants had to supply two
responses: With the first key press (L or R key) they reported whether the square was on the left or
the right side on the last frame (i.e., at the end of the trial), and with the second key press (S or M
key) they reported whether the square had been static or whether it had moved to that location from
! 25
the centre. (Earlier pilot tests had revealed that people were prone to feel the last position of a
moving object the strongest, whereas they sometimes failed to register the starting position.)
To assess whether increasing the temporal resolution of the SSD would increase
participant’s ability to detect motion or discriminate right/left locations, we varied the temporal
refresh rate of the tactile display. In the high temporal resolution condition, the tactile display was
refreshed at a rate of 30Hz (i.e., 30 image presentations per second). In the low temporal resolution
condition, the tactile display was refreshed at a rate of 5Hz (5 image presentations per second), and
the old image was presented repeatedly during the other refreshes, to ensure equal activation across
both conditions. The temporal resolution conditions were blocked, with the order being
counterbalanced across participants. Participants completed 48 trials in total.
Results
Task 1: Pixel sensitivity at different spatial resolutions
The mean performance in the pixel sensitivity task is depicted in Figure 6. As shown in the figure,
participants could more reliably distinguish between target present and target absent trials in the
high-resolution condition, especially as the target decreased in size. The average acuity score
(derived from the average of the last 6 reversals of the staircase) was 18 pixels (1.8 SSD pixels) in
the high-resolution condition, and 31.3 pixels (3.1 SSD pixels) in the low-resolution condition (See
Figure 7). This difference in sensitivity between the two resolutions was significant, as determined
by a two-tailed, paired t-test, t(5) = -3.53, p=0.017.
! 26
Figure 6. Average target circle size (in screen pixels) presented using the electrotactile SSD across trials using the two-down one-up staircase procedure for both high-resolution (blue) and low-resolution (red) conditions. Plot represents stimulus size across trials (trial numbers can vary since the overall number is based on the amount of correct to incorrect “switches” that occur during the task).
Figure 7. Average minimal circle size (pixel sensitivity) for the high-resolution 32 x32 pixel (left)
and low-resolution 16 x 16 pixel (right) conditions using the electrotactile SSD. Circle size
diameter is measured in screen pixels.
Task 2: Shape discrimination
! 27
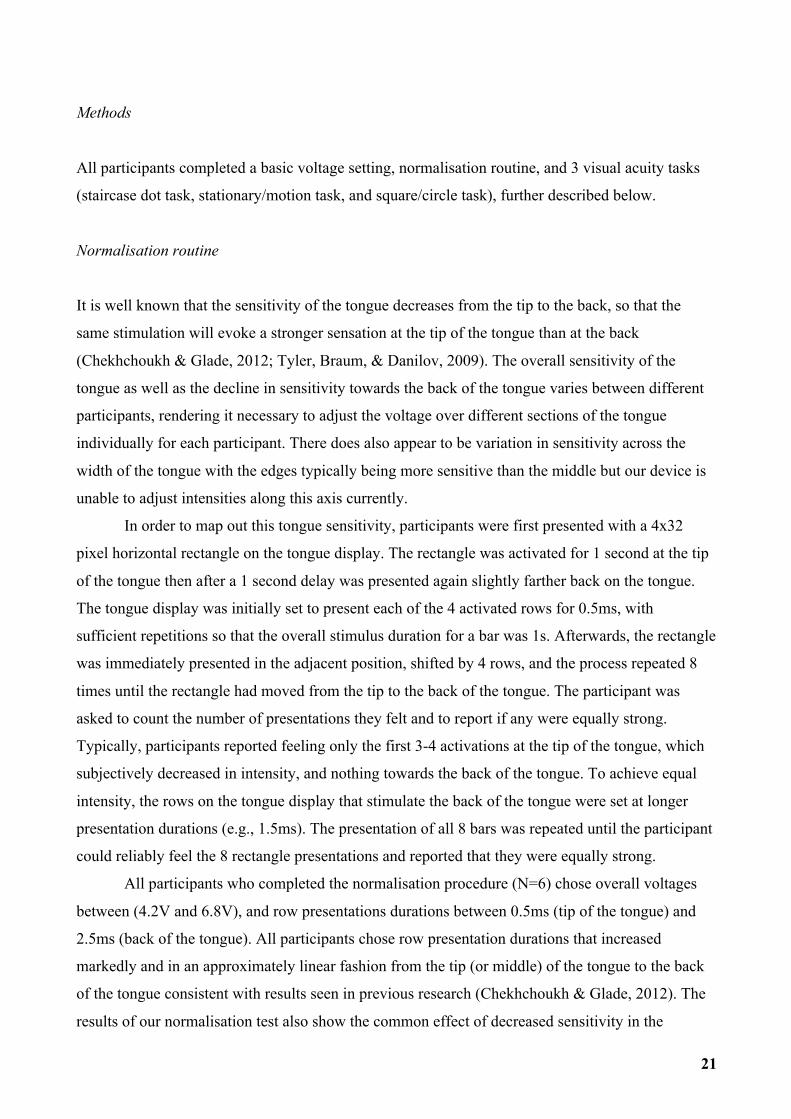
As seen in Figure 8, shape discrimination performance was similar for the high-resolution display
(52.77%) and the low-resolution display (mean=53.47%). There was no significant difference in
accuracy between the two different resolutions, t(5) = -0.08, p=0.94. Performance was also not
significantly better than chance in the high resolution, t(5) = 0.46, p=0.661, or low resolution
condition, t(5) = 0.88, p=0.419, indicating that participants were unable to discriminate between the
circle and square with the SSD (and without prior training).
Figure 8. Shape discrimination accuracy (proportion of trials the target object was selected
correctly) for high-resolution 32x32 (left) and low-resolution 16x16 (right) conditions using the
electrotactile SSD. Chance performance was 50%.
Task 3: Motion detection and motion discrimination
The results showed that participants were significantly more accurate in the high refresh rate
condition (mean=73.61%) compared to the low refresh rate condition (mean=50.69%), t(5) = 6.5,
p=0.001. Participants were not significantly better at determining stimulus location in the high
refresh rate condition (mean=96.53%) compared to the low refresh rate condition (mean=93.75%),
t(5) = 2, p=0.102. However, participants were better at distinguishing moving from stationary
targets with the high temporal refresh rate of 30Hz (mean=77.08%), than with the temporal refresh
rate of 5Hz (mean=56.94%), t(5) = -3.53, p=0.017.
! 28
Figure 9. Motion discrimination performance (proportion of trials where motion or no motion was
selected correctly) for the high (30hz) and low (5hz) refresh rate conditions (left plot) using the
electrotactile SSD. Motion direction accuracy (proportion of trials where the correct direction was
selected) for the high and low refresh rate conditions using the electrotactile SSD (right plot).
Chance performance for both conditions was 50%.
Discussion
The first performance tests of the new SSD yielded promising results. We found that participants
were reliably able to feel the smallest pixel activation, and that in the high-resolution condition, this
allowed detecting objects measuring ~10 pixels whereas in the low-resolution condition, it required
objects to be ~20 pixels large to be detected. These results suggest that participants can profit from
a tactile display with a higher spatial resolution, especially with small visual stimuli. The results of
the second, shape discrimination tasks showed no differences between a low vs. high spatial
resolution display, and at-chance performance across both conditions. These results show that a
higher spatial resolution does not automatically offer an immediate advantage across all tasks.
Possibly, longer training sessions are necessary to allow discriminating between different (similar)
shapes with an electro-tactile SSD. Finally, the results of the motion detection and discrimination
task revealed that increasing the temporal resolution was beneficial in allowing participants to
detect motion more accurately. As expected, the increased temporal resolution did not confer an
advantage in the localisation part of the task, as the location of a stationary stimulus was present
until response, allowing participants sufficient time to determine stimulus location. The latter result
clearly shows that worse performance in the motion detection task was not due to a generally
weaker activation or signal in the low-resolution condition, but that the low temporal refresh rate
selectively impaired motion detection. The finding that participants can still profit from a higher
temporal resolution is important, as it shows that the tongue is sufficiently sensitive to process
! 29
moving stimuli with a high temporal resolution. Another important finding is that performance was
persistently above chance in the present/absent task and motion/localisation task, even without any
training with the SSD.
The results seem to suggest that localisation ability is quite intuitive with the device. Even
without training with the device, participants were able to reach near perfect performance in the
left/right aspect of the discrimination task and were far above chance in the ability to distinguish the
location with the combination of either moving or stationary stimuli. Granted, these are tasks using
high contrast and simple objects but it means it is possible that new users of the device can rapidly
develop simple baseline abilities to build on. It is important for users to be able to achieve realistic
goals quickly and still have room to build on their newly developed abilities, to avoid high attrition
rates that are quite common in assistive technologies (Phillips & Zhao, 1993).
The one unfortunate finding was that participants struggled with the object discrimination
task. It is possible that this was due to the two stimuli evoking too similar sensations on the device
to be readily discriminated. This also seemed to be a problem faced by the work of Kupers and Ptito
(2014) who also found participants performing near chance using discrimination tasks that included
squares and circles. This is in contrast to the results in the auditory domain from D. J. Brown et al.
(2011) who, at least after some training, found participants performing considerably better at object
discrimination out of a set of objects that also included circles and squares. The differences in
activated vs. non-activated pixels between a square and a circle are not nearly as pronounced in the
native resolution of the SSDs as on the computer monitor (or potentially in the auditory domain).
While there does seem to be increased performance with the increase in spatial resolution it doesn’t
necessarily translate across tasks. It remains unclear how much of an increase in spatial resolution
would be required to boost performance in tasks requiring more fine-grained object discrimination.
The relative size of the chosen objects to the display may also have been problematic. In order to
control for object size across participants there was only one size presented for each of the two
objects and participants were unable to “zoom in” or manipulate the size or shape of the target
objects. In the future it might be beneficial to include a large range of sizes between the objects to
examine if there is an ideal range where the object is large enough to be able to focus on individual
features but not so large as to take unreasonable amounts of time to explore the whole object with
the device. Another potential explanation for the poor performance on the square/circle task could
be a “blurring” effect that can occur with the edges of an object presented on a tactile display. This
is typically due to the display not being able to target specific mechanoreceptors on the tongue. This
would not cause any issues with large-scale image differences such as something appearing on the
left or the right of the display but could lead to discrimination issues when the task requires
discriminating a flat edge of a square from the curvature of a circle. Moreover, the body of the
! 30
object also creates a large-scale sensation that would need to be isolated from the border to allow
such fine-grained discrimination. A possible solution would be to use edge detection algorithms on
the camera images that display only the borders of the object on the device.
Still, the two primary development goals of the device (increased spatial and temporal
resolution compared to the BrainPort) appear to have been successful that they yielded immediate
performance improvements. The results showed a significant improvement in sensitivity (aka
detection of small objects) when participants were using a 32x32 array compared to a 16x16 array,
and a significant improvement in motion detection performance with the 30hz refresh rate
compared to the 5hz refresh rate. It should be noted that this performance increase was found
specifically in a part of the task that required distinguishing moving from non-moving stimuli.
The new SSD did not show any traces of performance impairments, compared to the
reduced spatial or temporal resolution of the BrainPort; which means:
1. Increasing the density of the electrodes does not appear to have any adverse effects (such as
sensory overload).
2. Failure to correct possible left/right imbalance in sensitivity of the tongue edges does not appear
to lead to adverse effects.
3. Displaying a stimulus in a serial manner across different rows that are successively switched on
and off does not appear to cause adverse effects.
Also of note was that moving stimuli were among the most noticeable stimuli with the high
temporal resolution, and the fast refresh rates mean that changes in stimuli could be detected more
immediately and in a more fine-grained fashion. This has important implications in navigation and
detecting moving items such as cars, other pedestrians, etc. Potentially the BrainPort could be
significantly improved by increasing the temporal refresh rate. Overall it was advantageous to have
a device with the temporal refresh rate high enough to allow participants to experience motion
reliably on the device.
! 31
Chapter 3: Object localisation using SSDs
! 32
One of the core functions of interacting with the world is the ability to determine where objects are
in space. This ability is especially important for people who are blind or visually impaired, who
often require tools to assist in solving this problem for their daily activities.
The major advantage of these modern SSDs over more traditional assistive devices such as
the cane or a guide dog is their potential to provide information about objects located at a much
greater distance from the user. Even normally sighted persons tend to be familiar with situations in
which they have had to navigate a dark room in the middle of the night to find a specific object such
as a light switch. Even with the added bonus of being familiar with the environment and knowing
the general vicinity of where the light switch should be often results in time-consuming tactile
search, where the hands are required to explore the exact location of the light switch. The difference
of the cane to a modern video-based SSD can be gauged easily by stretching out one arm and
comparing the amount of information that would be available to the fingertip versus the sheer
volume of information that is visible beyond the extended arm. The extended range of modern
SSDs also brings a manifold increase in the amount of information available compared to the
limited sensory inputs available in peri-personal space.
The first obvious advantage of adding the information stream from a visual sensor is simply
increasing the information that is accessible to the user to make decisions. This reduces the need for
the blind user to manually move around and manually explore the entire environment around them
(which can often be quite dangerous, especially outdoors in unfamiliar places). Additionally (as
emphasised in the vOICe training manual) the extended range of a SSD allows for more time to
make decisions when navigating the environment. Using a short-range sensor such as a cane means
that there is only a limited amount of time for initiating an avoidance movement from an object or
danger. With longer range there is time to anticipate upcoming events, such as the edge of the road,
a wall, or other pedestrians. It is important to remember that SSDs wouldn’t necessarily need to
replace devices that users are already comfortable using (such as the white cane or guide dog) but
can offer an augmentation for situations in which those devices are not sufficient. There has already
been a growing community of blind individuals that are finding more and more creative uses for
sensory substitution technologies and have used SSDs, for instance, to aid activities such as rock
climbing and photography. Still, one of the most important uses of a modern, video-based SSD is
probably that it will support localisation of objects at a distance far beyond the reach of a cane.
Previous research has shown that current SSDs support successful localization without much
training: With SSDs it has already been shown that after a short training phase of only 1 hour, blind
or blindfolded participants can localise visual objects, and after 5-7 hours of training, blind or
blindfolded participants can successfully discriminate between different orientations and simple
shapes (Auvray et al., 2007; Poirier, De Volder, Tranduy, & Scheiber, 2007; Proulx et al., 2008;
! 33
Stiles & Shimojo, 2015; Tyler et al., 2009; Wan, Wood, Reutens, & Wilson, 2010). While these
results are encouraging, video-based SSDs have also been criticised. In Chapter 2, we considered
and rejected the notion that the bandwidth of information processing, and/or the spatial or temporal
resolution of the tactile sense may not be sufficient to process information of modern, video-based
SSDs. Specifically, as most devices work using a video camera input which allows for the potential
of large fields of view and high resolution imaging. Even low-resolution cameras provide 640x480
resolution that is over 300,000 data points. To display the information in current tactile or auditory
SSDs, the information is downsampled – to 20x20 in the BrainPort, and 176x64 in the vOICe. One
concern with the downsampling is that the remaining resolution is not high enough to allow
identification of complex objects. For instance, authors Weiland et al argued that we would need at
least a resolution of 30x30 to distinguish complex objects such as different faces (Weiland, Liu, &
Humayun, 2005). If correct, this would mean that the BrainPort currently does not have a high
enough resolution to allow fine-grained discriminations. On the other hand, it has been pointed out
that the tactile and hearing modality have a more limited bandwidth than the visual sense, which
could lead to sensory flooding if the resolution is increased further (Deroy & Auvray, 2012;
Loomis, 1981; Maeyama & Plattig, 1989).
Remarkably, there have been minimal empirical studies examining the realistic information
processing capacity of substituting modalities, or the effects of increasing the spatial or temporal
resolution of current SSDs (Bach-y-Rita et al., 1998; D. J. Brown et al., 2014; Buchs et al., 2016).
In a chapter 2, I introduced a new tactile SSD, which was similar to the BrainPort in design
and had a similar sized tongue-board, but had a higher spatial and temporal resolution than the
BrainPort (32x32 pixels and 30Hz refresh rate, compared with 20x20 and ~5Hz reported for
BrainPort; REFs). Comparing the high resolution (32x32, 30Hz) SSD with a lower resolution SSD
(16x16, 30Hz) in a range of different tests showed that the higher tactile resolution conveyed
advantages in the detection of small objects. However, untrained participants performed at chance
in a shape discrimination task (discriminating a square from a circle), both with high and low
resolution SSDs. Motion detection and discrimination of motion directions was again significantly
better for the SSD that had a higher temporal resolution. Collectively, these results show that even
untrained participants can benefit from increases in spatial and temporal resolution, although these
benefits may be limited to simple tasks (especially without training). In other words, the current
development of video-based SSDs has probably not exhausted the processing capacity of the
substituting modalities (touch, hearing).
Another potential limitation that has not been discussed, but is far more likely to limit
performance with SSDs concerns the parallel processing of multiple objects (D. J. Brown & Proulx,
2016). One hallmark of the visual system is that it has sophisticated scene segmentation and figure-
! 34
background segmentation mechanisms that allow extracting multiple objects in parallel. For
example, visual perception is characterised by efficient grouping mechanisms that can operate, for
instance, on spatial proximity, or group objects of identical colours and/or motion direction
(Duncan & Humphreys, 1989; Han, Humphreys, & Chen, 1999). This in turn allows us to
appreciate grouped objects at a ‘local’ or ‘global’ level (e.g., a circle consisting of red dots can be
viewed either as a continuous circle or an aggregation of dots). In addition, the visual system often
‘fills in’ information (amodal completion), so that, for instance, an array of four corners facing each
other (Kanisza figure) can be perceived as a square, even though a good portion of the sides is
actually missing. These and other Gestalt principles are known to govern vision, but have not been
reported for other modalities, or at least not to the same extent (Duncan & Humphreys, 1989; Han
et al., 1999).
Gestalt principles such as grouping and figure-ground segmentation are probably the
foundations for our ability to distinguish an object from its background, and the ability to process
multiple objects in parallel. Amodal completion would become important once an object is only
partially visible (e.g., because it is occluded). These mechanisms are also probably essential for our
ability to successfully interact with visual objects. For instance, in reaching for an object, SSD users
would already have to process two objects simultaneously, as at least the user’s hand would enter
the visual field. In sighted individuals, reaching is usually ‘visually guided’, as the eyes fixate on a
target in advance (Hayhoe & Ballard, 2005), and movement trajectories are modified on-line on the
basis of visual information (Veerman, Brenner, & Smeets, 2008). In basic tasks such as pouring a
cup of tea, the hand holding the kettle is brought closer to the cup utilizing an ‘allocentric reference
frame’ or allocentric encoding strategy, where the position of one objects is continuously updated in
reference to another object (Pasqualotto & Esenkaya, 2016; Pasqualotto, Spiller, Jansari, & Proulx,
2013; Volcic & Kappers, 2008). Processing of multiple objects in parallel would appear to be a
prerequisite for adopting an allocentric reference frame. In the absence of parallel processing
capacity, individuals would have to use an egocentric reference frame to complete the task – that is,
encode each object’s location in relation to their own position, which is presumably less efficient
and more error-prone. Moreover, at some stage the objects will be so close to each other in space
that such an egocentric encoding strategy will not be feasible anymore, at which stage it would
become necessary to process both objects simultaneously.
So far, it is unknown whether current SSDs support processing of multiple objects, thus
enabling visually guided actions or allocentric encoding of objects. As will be briefly reviewed
below, only few studies measured localisation ability in simple reaching tasks, mostly with single
objects, and using procedures that do not allow determining how precisely (or with what precision)
SSDs will support object localisation.
! 35
Do SSDs support efficient localization of objects?
Some of the earlier SSD localisation work by Jansson (1983) briefly explored the localisation
ability of participants by testing how precisely they could intercept a moving ball coming towards
them down an inclined table. While the participants were able to reliably track and hit the ball, the
two participants were highly trained (over 100 hours of experience), rendering it difficult to
determine whether their ability was actually due to high localisation precision conveyed by the
device alone, or other strategies learned through extended experience with the tasks (e.g. hearing
the ball moving).
In a subsequent study, Levy-Tzedek et al. (2012) assessed an auditory SSD regarding its
ability to support efficient reaching for objects. The results showed good localisation of a single
object (0.5cm error) in the reaching task. However, the target locations were tightly fixed (only 4
possible locations), and the participant’s reaching trajectory was restricted in that the hand moved
over a stable surface (Levy-Tzedek et al., 2012). However, tasks in which the target positions are
fixed and the movement of the hand is restricted probably do not provide a good estimate of the
error observed in more natural reaching tasks. In line with this contention, Auvray et al. (2007)
found a much larger reaching error in ecologically more valid conditions, when the target distance
could vary between 1-80 cm, and the hand had to move unrestricted through empty space. The
results of this study showed an average error of ~8 cm. Errors of 0.5cm were found only when the
target was immediately in front of the camera. Errors up to 14 cm occurred once the camera was
near the extreme of 70cm from the target.
It is important to note that all of these studies were using blindfolded sighted participants
rather than blind participants. A study by Auvray et al. (2007) revealed that blind participants
performed significantly worse than sighted participants in some aspects of localisation tasks. The
participant’s task was to view an object on a table using the SSD and commit its position to
memory. Once the object was removed the participant had to place a second object into the
remembered position. Both sighted and blind participants had left-right positional errors of around 5
cm but blind participants additionally undershot or overshot the target by 8 cm more than sighted
participants. These results indicate that localisation tasks can profit from prior visual experience,
either at the stage of encoding locations into memory, or at the stage of executing an action
execution towards memorised locations, at least in the forward direction (Renier & De Volder,
2010). Additionally, there has been extensive study of localisation from the perspective of time
taken to find target locations as well as binary hit or miss target selection. Work by Proulx et al.
(2008) used novel LED configurations as a method to determine the speed that participants could
! 36
find target objects in space, though the focus of this work was more on the role of naturalistic
learning and the influence of sensory deprivation. D. J. Brown et al. (2011) also explored
localisation ability and accuracy but through the use of a 3x3 square grid. Participants were asked to
find an object located at one of the 9 positions on the grid. Accuracy was based on correct or
incorrect square selection. Unfortunately the error ranges for the incorrect trials were not reported,
e.g. when participants selected the wrong location did they generally select one of the adjacent
squares or was it a larger error.
Collectively, the results show that SSDs support reasonably accurate localisation of single
objects even in untrained participants, allowing them to successfully interact with objects after a
short familiarization period. A more in-depth interpretation of the reaching error is difficult, since
none of the studies collected baseline measures of the reaching error when participants use vision to
complete the task.
In our study, we included an experiment in which participants had to complete a localisation
task using their vision, to allow gauging the localisation error of current SSDs. However, a
localisation error of ~5cm (where the reaching motion to find an object in space leads to a landing
position that is less than 5cm from the target object) is unlikely to be practically relevant, as it will
still yield successful interactions with objects in most situations (especially in any scenario where
the object itself is more than 5cm wide). More importantly, none of the previous studies clarified
whether SSDs would support processing of multiple objects or visually guided actions, as none of
them systematically varied the number of objects in the visual field, or the visibility of the
participant’s hand. Moreover, previous studies tested different kinds of SSDs, including an
electrotactile and auditory SSD, with different performance capabilities. For instance, the auditory
vOICe SSD has a much higher spatial resolution (176x64) than the tactile BrainPort SSD (20x20).
In the standard settings, however, the BrainPort has a higher temporal resolution (5 Hz) than the
vOICe (1 Hz; see also Chapter 2). It is currently unknown whether these slow refresh rates would
support visually guided actions.
The present study
The central research questions of the present study were whether current video-based SSDs would
support processing of multiple objects, and whether this in turn would allow visually guided
actions, and/or lead participants to adopt an allocentric or egocentric encoding strategy when
multiple objects are present in the visual field (Pasqualotto & Esenkaya, 2016; Pasqualotto et al.,
2013). Moreover, to assess whether the different performance attributes of current video-based
SSDs may support different aspects of human behaviour, we addressed this question using an
! 37
electrotactile SSD similar to the BrainPort (Study 1), and an auditory SSD, the vOICe (Study 2).
The tactile SSD used in Study 1 had a higher temporal and spatial resolution than the BrainPort
(32x32, at ~30Hz; as discussed in Chapter 2). The auditory device we used in Study 2 was the
vOICe, and was operated using the default settings (as described in Chapter 1).
To examine whether participants could perform visually guided pointing actions with either
SSD, the participants’ task was to localise a white dot on a black touch screen monitor with the
SSD, and touch it with their right index finger. Across three blocks of trials, we systematically
increased the amount of information available to participants to perform this task: In the first block,
only the white dot was visible, while the participant’s hand was rendered invisible (‘dot only’
condition). In the second block, the white dot and the participant’s hand were visible, so that
participants were provided with immediate feedback about their hand position (‘hand visible’
condition). This should theoretically allow performing the action in a visually guided manner with
the SSD. In the third block, we additionally rendered two sides of the monitor frame visible
(‘reference frame’ condition). As the location of the target dot, the position of the hand and
reference frame were visible in this condition, participants could theoretically adopt an allocentric
encoding strategy and encode the target dot position relative to the monitor frame.
If video-based SSDs allow simultaneous processing of multiple objects, pointing
movements should be more accurate in the ‘hand visible’ condition than in the ‘dot only’ condition.
Moreover, if current SSDs additionally support allocentric encoding of an object position,
performance should be better in the ‘reference frame’ condition than in the other two conditions. On
the other hand, if there are hard limitations on parallel processing of information in the tactile sense,
performance should systematically decline as information increases across the three conditions.
Study 1: Object localisation in the blind/visual impaired using an electrotactile SSD
Since the intended users for this technology would be those who are blind or visually impaired we
decided to work with a small number of blind users for initial testing with the device. We would
first provide some training with the device so users would have an understanding of the basic
principles of the device, and explain some rules of visual processing (e.g., that the size of an object
increases the closer it is to the camera, and rules concerning object occlusion). Participants were
then subjected to a normalization procedure, in which they were asked to adjust the electrotactile
activation such that it was even across different sections of the tongue.
Method.
! 38
Participants. Participants were primarily recruited through the disability unit at the University of
Queensland and local blind community groups. Six visually impaired participants (4 females, mean
age=31.33yrs) participated in study 1. All of our participants were classified as “legally blind”.
Three of the participants had no vision, and three had “some light perception” (see table 1 for more
information). All participants were wearing blackened-out goggles during the experiment, so that
they had no light perception and were effectively blindfolded. To be eligible to undertake the
experiment all participants were required to first complete a medical screening questionnaire and
information sheet. Participants were free to withdraw from the experiment at any stage.
Participant Sex Age Remaining
vision Duration Braille Handed Tasks
completed 1 F 52 3% 14 yrs N R All 2 M 31 0% 16 yrs Y R All 3 F 24 No cone
function Lifetime N R All
4 F 24 0% Lifetime Y L All 5 M 31 Some light
perception 10 yrs N R All
6 F 26 0% Lifetime Y R All 7 F 60 4% 53 yrs Y R Training 8 M 30 Some light
perception Lifetime Y R Training
Table 1. Demographics for blind and vision-impaired participants in Study 1. Two participants
were unable to continue beyond the initial training due to scheduling conflicts.
Apparatus
Control and display computers
A laptop computer (Dell i7-4610M, 3.00GHz, 8GB RAM) was used as the processing computer for
the SSD. A PC desktop (Dell i7, 3.00GHz, 8GB RAM) connected to a 3M MicroTouch 15’
touchscreen monitor was used for stimuli presentation. Stimuli were presented using Psychopy
software (Peirce, 2009).
The tactile SSD
The sensory substitution device used for study two was a custom-designed visual to
electrotactile sensory substitution device (for more specific details see Chapter 2). The input was
provided by a video camera (Microsoft LifeCam, native spatial resolution: 1280x720; field of view:
! 39
68.5˚), that was integrated into the goggles between the participant’s eyes, and the output was
provided by a 32x32 hand-held electrotactile array (size: 3cm x 3cm) of 1,024 gold plated double-
ring electrodes that was placed on the participant’s tongue.
Images from the video camera were pre-processed by taking a central cutout of 480x480
pixels (25.6˚ field of view). This cutout was converted to a greyscale image and down-sampled to a
32x32 bitmap by averaging the brightness of the neighboring 225 native pixels. The resulting
bitmap was then thresholded so that pixels above a certain luminance threshold (e.g., RGB values
above 100, 100, 100) were represented as white, and all others as black. The thresholded 32x32
bitmap was then fed into a microcontroller, which applied an electrical current to all rows and
columns of the tactile display that corresponded to white regions in the bitmap.
Images were sampled from the video camera at 30 Hz and the electrotactile display refreshed
images at 30 Hz.
Familiarization and Pre-Training
Participants were seated at a 1m x 1m square table covered by black fabric. To familiarise
participants with the device, they were asked to locate a small white washrag positioned at a
random location on the table. When participants could reliably reach for and touch the cloth in
various positions on the table, they advanced onto the next set of tasks. For the next step of training
participants were presented with a white foam rectangle of approximately 4cm in width, 20cm in
length, and 1cm thick. Initially they were asked just simply move the rectangle in front of the
camera so they could get a sense of the relationship between motions and sensations with the SSD.
Once they were comfortable with the basic concept the experimenter moved the rectangle in front
of the camera either left to right, right to left, up to down, or down to up. This was done 10 times in
a randomised order (randomisation determined by computerised script). If participants were able to
perform these discriminations above 75% (chance is 25%) they moved to the final training task. All
participants were able to perform far above chance (all were above 80% performance). The final
training task involved some basic object discrimination. Participants were presented with a small
white box, a white telephone handle, a white sphere, and a white cup that was all placed on the table
in different positions. Participants were asked to discriminate between the objects and report where
each of these object was. We did not measure discrimination performance as the task was provided
mainly as an exploratory exercise for the participants to gain some experience with different shapes
that they could feel with their hands as well as explore with the SSD. The entire training took
approximately 1 hour to complete.
! 40
General Procedure
For the experimental task, participants were seated 50cm from the touch-screen display. The
monitor was placed on a black felt covered table and the area surrounding the table was blackened
out as well. The goal for each of the 3 tasks was to find and touch the location on the touch screen
that contained a white disk (6.5cm diameter). The disk could appear in one of 32 possible locations
evenly distributed across the display.
On each trial, we recorded the x, y position of the target dot position, and computed the
precision as the distance of this location from the first position that the participant touched.
Response times were also recorded and were based on the onset of the target dot to the point in time
when the participant released their finger from the touch-screen. After each response, participants
were provided with verbal feedback on their accuracy for that trial (e.g. “Dot was 2 finger-widths to
the left”). Prior to each trial, participants had to adjust their head position such that the goggle-
mounted camera pointed towards the centre of the display (guided by experimenter feedback). Once
they were centered, participants pressed the spacebar to initiate the next trial. Short breaks were
allowed at any point during the experiment to reduce fatigue and potential adaptation to the tactile
sensation.
Procedure
The experiment consisted of three blocked tasks (‘dot only’, ‘hand visible’, and ‘reference frame’).
The tasked were ordered in this sequence so that the amount of information displayed would slowly
increase with each task.
Task 1: Dot only. In the “dot only” condition, the lighting conditions in the room were
adjusted so that the white target disk (See Figure 1. left) was the only object displayed on the
tongue display (excluding the participant’s hand and monitor frames). After participants initiated
the trial, the target disk was presented in one of 32 locations on the display. Participants then used
the SSD to find the disk and touch the display at the location they thought the disk was located. The
disk remained visible on the screen until the participant had made their selection, and verbal
feedback was provided after each trial.
Task 2: Hand visible. In the “hand visible” condition, in addition to the white disk being
displayed, the lighting in the room was adjusted so that the participant’s hand was also displayed
(See Figure 1, middle) on the tongue display (when it entered the image). Prior to the start of each
trial, participants positioned their hand such that the upper portion of the fingers was typically
! 41
visible. Once the hand entered into the visual field of the camera, the hand was fully displayed to
the tongue, along with the (non-occluded portions of) target dot.
Figure 1. Visual representations of the imagery presented on the SSD for each of the three tasks.
From left to right: ‘dot only’, ‘hand visible’, and ‘reference frame’. The light levels in the testing
room are adjusted in each condition to ensure that only the dot is visible (dot only condition), or the
hand can be visible if in the field of view (hand visible condition), or the added border frame is
visible (reference frame condition). Images are taken from screenshots of the visual information
that is displayed on the tongue board of the SSD
Task 3: Reference frame. The reference frame condition was the same as the “hand visible”
condition, with the addition of a white foam border (4cm wide) that was placed on two of the four
sides of the display (see Figure 1, right panel for an illustration). In this task participants could
detect the disk, the participant’s hand, and two of the borders of the display.
Each task was completed over two 1-hour sessions consisting of 32 trials each, for a total of
64 trials per task. Each participant completed one session per week over a total of 6 weeks.
Results
The ‘dot only’ condition showed a mean localisation error of 6.78cm and a mean response time of
14.93 seconds. (See figure 2). Paired-sample t-tests showed that the added hand position
information in the “hand visible” condition did not produce any significant difference in localisation
error (M=6.79cm, SD=1.74); t(5)=-0.02, p=0.96, or in response time (M=20.15 seconds, SD=9.59);
t(5)=-1.71, p=0.15 (see Fig. 4 and 5). Similarly, the ‘reference frame’ condition did not differ
significantly from the ‘dot only’ condition with regard to the localisation error (M=7.63cm,
SD=1.37); t(5)=-1.33, p=0.24, but resulted in a significant increase in response time (M=22.05
seconds, SD=8.47) compared to the ‘dot only’ condition; t(5)=-2.84, p=0.04 (see Fig. x and x).
! 42
Figure 2. Localisation error (distance in cm from the centre of the target circle to the point on the screen selected by the participant) for the ‘dot only’, ‘hand visible’, and ‘reference frame’ conditions. Participants were using the electrotactile SSD.
Figure 3. Response time (measured in seconds from when the image is presented on the display
until the participant makes a touch selection on the screen) for the ‘dot only’, ‘hand visible’, and
‘reference frame’ conditions. Participants were using the electrotactile SSD.
! 43
Figure 4. Localisation error heat maps for the ‘dot only’ condition (Left), ‘hand visible’ condition
(Middle), and ‘reference frame’ condition (Right) using the electrotactile SSD. Position 0,0
represents the centre of the target object (target was a 6cm diameter circle) on the screen. Heat
maps represent the distribution of target selection in relation to target location. Darkest areas
represent most selected regions around the target.
Discussion
In this study with a sample of blind participants we found that the baseline localisation errors were
reasonably small and in line with what has been reported in previous work (Auvray et al., 2007;
Levy-Tzedek et al., 2012; Proulx et al., 2008). Importantly, we did not observe an improvement in
performance with the additional information from the ‘hand visible’ and ‘reference frame’
conditions. We did see a significant increase in response times for the reference frame condition
that contained the largest volume of information on the display. One potential explanation for this
result is that the increase in information has both positive and negative influences on localisation
ability. The information may help to provide some clues about the individual’s hand position in
relation to the target, but at the same time adds a distracting element to the task. Participants may
confuse their hand or the reference frame with the target in some situations. As a result of this, the
additional information may have worked like a distractor, elevating response times (Bravo &
Nakayama, 1992). Participants may have processed the additional information, but this came at a
cost (i.e., processing was not automatic), and no significant benefit.
Overall we were able to draw two main conclusions:
1. It is possible to process more than one object with tactile SSDs (as performance did not differ
between the hand visible condition and the baseline), but the tactile system cannot immediately
! 44
support visually guided actions, and the attempts to use guidance comes at some form of cost
(though non-significant).
2. The tactile system does not automatically apply an allocentric reference frame or encoding
strategy OR, if it does, the resolution of the tongue or the tactile display wasn’t high enough to
allow the tactile system to capitalize on this information (as performance was worse in the reference
frame condition).
Study 2: Object localisation using an auditory SSD
To test whether the results of Study 1 generalize to a visual-to-auditory SSD, we next tested the
same tasks and procedures with the vOICe, which is currently the most frequently used visual-to-
auditory SSD. This SSD takes an image from a video camera and creates a “soundscape” once per
second. This soundscape is presented left to right with light colored objects at a louder volume than
dark objects, and objects higher in the image having a higher pitch sound than objects low in the
image. Due to the difficulty of recruiting blind participants and the additional training required we
opted to test blindfolded sighted participants for this study.
Method
Participants
Participants were 12 normally sighted students (4 M, mean age = 24.6) recruited from the
University of Queensland and Queensland University of Technology. Participants were
compensated $10 for each 1hr session.
The auditory SSD
For this study we used a freely available visual to auditory sensory substitution device described in
the introduction called the vOICe (P. B. L. Meijer, 1992), together with the same goggle-mounted
camera setup as used in Study 1. The vOICe captures an image from the video camera and converts
it into a “soundscape” that consists of a frequency- and loudness-modulated tone that serially
reflects the objects scanned in the image, from the left to the right within a particular timeframe
(typically, 1s). Regions in the image that are brighter are represented with a louder volume while
darker regions evoke softer sounds. Regions on the top of the image are presented with a higher
! 45
pitch while regions at the bottom of the image are presented with a lower pitch. The soundscape is
interrupted after a single scan has finished, which typically takes 1s, to indicate that a new image is
going to be presented (which is again scanned from left to right).
Familiarization and Pre-Training
As part of the first session participants spent approximately 30 minutes on basic training tasks to get
familiar with the way the vOICe algorithm works and to learn the relationship between the head
mounted camera and the sounds from the device. Familiarity training was performed as in Study 1
but due to using blindfolded sighted participants it was unnecessary to train them in the visual
concepts involved with video cameras. Participants were able to progress through the training tasks
faster than the blind users in Study 1.
Task
The same three tasks were used in this study as in Study 1, viz., a “dot only”, “hand visible”, and
“reference frame” condition. Deviating from Study 1, the order of the ‘hand visible’ and ‘reference
frame’ conditions were counterbalanced. Moreover, instead of verbal feedback, the experimenter
moved the participant’s hand from the chosen location to the actual location of the disk after each
trial to provide more precise feedback about the accuracy of the pointing movement.
Results
Within-subjects t-tests revealed no significant improvement in localisation accuracy between the
‘dot only’ and ‘hand visible’ condition, t(11)=0.58, p=0.577. The ‘reference frame’ condition also
did not lead to a significant improvement in localisation accuracy over the ‘dot only’ condition,
t(11)=-1.11, p=0.291. There was no significant difference between localisation error in the ‘hand
visible’ and ‘reference frame’ conditions, t(11)=-1.81, p=0.098. Contrary to Study 1, we did not
find a significant increase in response time between the ‘dot only’ and ‘hand visible’ conditions,
t(11)=1.61, p=0.136. We also did not find a significant increase in response time between the ‘dot
only’ condition and the ‘reference frame’ condition, t(11)=1.01, p=0.136. Similarly, there was no
significant difference between response times in the ‘hand visible’ and ‘reference frame’ condition,
t(11)=-1.21, p=0.252. However, it should be noted that the response times were longer with the
auditory SSD than with the tactile SSD used in Study 1.
! 46
Figure 5. Localisation error (distance in cm from centre of target circle to where participants
touched the screen) using the vOICe for ‘dot only’ (target circle is the only object on the display),
‘hand visible’ (if participants’ hand moves into the view of the camera it appears on the display),
and ‘reference frame’ (the screen has a white border on the edges which can be sensed with the
SSD) conditions.
Figure 6. Response time (in seconds, from target onset to user response) for ‘dot only’ (target circle
is the only object on the display), ‘hand visible’ (if participants’ hand moves into the view of the
camera it appears on the display), and ‘reference frame’ (the screen has a white border on the
edges which can be sensed with the SSD) conditions.
! 47
Figure 7. Localisation error heat maps for the ‘dot only’ condition (Left), ‘hand visible’ condition
(Middle), and ‘reference frame’ condition (Right), Position 0,0 represents the centre of the target
object (target was a 6cm diameter circle) on the screen. Heat maps represent the distribution of
target selection in relation to target location. Darkest areas represent most selected regions around
the target.
Discussion
The auditory SSD showed similar results as the tactile SSD: Across the three conditions increasing
information to include location information about the participants’ hand or the monitor frame did
not lead to a significant improvement in localisation ability. Contrary to Study 1, there was also no
significant increase in response time in the ‘hand visible’ and ‘reference frame’ conditions. There
are multiple possible explanations for this difference: First, response times were longer with the
auditory SSD than with the tactile SSD, indicating that the localization task was more difficult with
the auditory device, or at least did not allow the participants to respond reasonably early. Especially
in the ‘reference frame’ condition, individual trials took such a long time that participants were
likely to speed up their responses, amongst other things, because the repetitive sound of the border
became more of an irritant than an assistant in that condition. Many participants reported that the
‘reference frame’ condition was “annoying”, mainly due to the constant sound that is heard by the
presentation of the border on the bottom of the display (creates a constant low tone) and the
repetitive loud sound emitted by the edge of the display (creates a repetitive on/off tone with each
image scan).
The margin of error overall was similar between the auditory and tactile SSDs. The tactile
displays seemed to support faster responses, but the auditory displays were more accurate. Both
seem to have advantages and disadvantages in specific areas of localisation. The slower scan time
for the auditory devices also create complications especially when combined with multiple
! 48
distractors, as each additional distractor tends to require more individual scans (as seen by the
higher overall response times in study 2) for the user to make discriminations between the number
and position of target vs. distractor objects on the display.
Study 3: Control experiment using sighted participants
Studies 1 and 2 showed that tactile and auditory SSDs both supported object localization, including
when multiple objects were present in the display, although neither of them showed benefits
associated with visually guided actions or allocentric encoding in untrained participants. The
differences in localization ability with tactile and auditory SSDs mapped onto the performance
characteristics of the devices, specifically, the temporal and spatial resolution of either device.
Moreover, the localization error observed with either device was in line with previous results
reported in the literature.
However, it is currently still unclear whether the localization error is due solely to the need
to interpret the location of novel sensory inputs, or whether it could have resulted from simply
asking participants to make pointing movements while they were blindfolded. Blindfolding the
participants meant that the reaching movements could not be visually guided in any of the
conditions, which may already explain the localization error. In this case, the errors could not be
clearly attributed (only) to the quality of encoding the dot in space using an SSD, but would in part
be due to a motor error in the reaching movement.
To assess the minimal pointing error with blindfolded participants, we ran a simple control
experiment using a memory-reaching task with sighted participants, to see if the localisation error
might be largely driven by the reaching component of the motor process rather than a misjudgment
of where they think the target is located in space. In the control Study 3, participants had to perform
the same task as in the dot only condition. However, instead of using an SSD, they were instructed
to simply look at the monitor, remember the location of the target dot, then to shift the black
goggles over their eyes so that they were effectively blindfolded, and initiate the pointing
movement to the target dot. Participants were instructed to blindfold themselves using both of their
hands on the goggles, to prevent themselves from positioning their pointing hand correctly
preemptively.
If the localization error in Studies 1 and 2 was mainly due to a motor error in the reaching
movement, then the control task should show a similar error as observed in Studies 1 and 2. If, on
other hand, the localization error reflected uncertainties in the location of the target that
accompanies new sensory inputs delivered by the SSDs, then the localisation error should be
significantly smaller in the present control experiment than observed in the ‘dot only’ conditions of
! 49
Studies 1 and 2. This holds because participants in Study 3 were allowed to visually encode the
target location, which should ensure accurate encoding. Essentially, we would expect to see an
average localisation error less than 6-8cm but higher than zero due to the lack of online feedback
with the goggles.
Method
Participants
Participants were 6 normally sighted male volunteers (mean age 27.3yrs) recruited from the
University of Queensland.
Procedure
The task was the same as the “dot only” condition of Studies 1 and 2, except that participants were
able to view the dot with their eyes at the start of the trial. Once participants were confident about
the location of the dot they covered their eyes by lowering the goggles over their eyes, using both
hands. Participants then reached forward and touched the screen at the location they thought the dot
was. 32 trials were completed for each participant.
With this, the task was most comparable to the ‘dot only’ conditions of the Studies 1 and 2
with the SSDs, as participants were required to make a pointing movement without on-line
feedback about their hand position. Deviating from Studies 1 and 2, participants had to execute the
movement to the memorized location of the target dot rather than receiving continuous inputs about
its location via an SSD. However, as memorizing the location of visually encoded objects is a
highly trained task that usually shows high accuracies, this requirement should not cause any large
impairment in localization accuracy. Since participants did not see the location they touched on the
screen, they received the same verbal feedback on their localization error as in Study 1.
Results.
We found a mean reaching error of 2.41cm for this group of 6 participants. The mean errors ranged
from 1.93cm to 3.15cm across different participants. As seen in Figure 8, the overall error range
was considerably low in relation to the size of the target circle (6cm diameter). Response times
were not recorded for this task as participants also had to perform the task of mounting the goggles,
! 50
which prevented a clean measurement of the time needed to perform the task of interest (i.e.,
pointing to the dot).
Figure 8. Combined localisation error heat map for all 6 participants in the sighted control-
reaching task. Error values are in cm but of note, the target object was 6cm in diameter so almost
the entire volume of error is located within the target object space.
Discussion
The results of Study 3 showed error rates that were considerably lower compared to SSD
Studies 1 and 2. Thus, the error observed in Studies 1 and 2 with the different SSDs are not due
purely to the lack of online feedback during the reaching component of the task, but to errors in the
mental representation of where the object is in space. It is promising that the error did not increase
with the increase in location uncertainty. In all previous tasks participants were able to touch the
edges of the monitor at any time to make sure they were positioned correctly in relation to the
monitor. The experimenter would also re-adjust participants if they seemed to be drifting (if the
participant was reaching off to the side of the display).
Study 2 and 3 General Discussion
The results of Study 1 demonstrated a consistent error range of 6-8cm for our blind participants.
Contrary to our expectations this error did not significantly change by the addition of information in
! 51
the form of hand position or a reference frame on the display. Interestingly, while we were not
specifically testing the differences between audio and tactile sensory substitution devices, the
observed error and range of error was similar using both devices and with both blind and sighted
participants.
The main finding of Studies 1 and 2 was that there did not seem to be an increase in
performance with an increase in reference information. There are a number of possible reasons for
this result. Firstly it could be that the increase in information was simply too much to process,
which could manifest in the increase in response times observed in the reference frame condition. It
is possible that multiple objects were perceived on the device but the breakdown was in the ability
to discriminate between which one was the target object and which was simply surrounding
information. We did run some analyses that separated trials where the dot was close to the marked
border from trials where it was close to the unmarked border but did not find a significant
difference. It is also possible that the increase in information on the display meant that the target
and distractors began to fuse together to form one image since the participants were not sufficiently
skilled with using the device to make the fine discriminations between the different sensations. It is
still possible that there was some improvement on certain trials with the increase in information but
it was simply washed out by trials where the information acted as a distractor. This could be
explored further by requiring participants to report the position of the target as well as the border
edges on each trial.
How does this all relate back to the original questions of interest?
How precisely can blind or visually impaired persons localise objects in space using sensory
substitution and what can we do to maximise their ability to increase this precision?
We seemed to see an error of around 6cm using these devices. The error appears to be a
combination of motor reaching error (approximately 2cm) and positional error from the SSD
information stream (4cm). With this in mind, it seems like prioritising training towards
strengthening the confidence in users of the relationship between the sensors and objects in space is
key. One potential training strategy could be to use physical tactile objects together with a motion
tracking system to assess reaching accuracy, so that the users can get immediate tactile feedback
about the exact position of the object. An additional advantage of this approach over the one used in
Studies 1-3 is that the distance between distracting objects and the target can be varied over a larger
distance. Moreover, localisation performance can then also be trained and tested with objects that
also vary in height and distance to the observer, above and beyond the standard x-axis and y-axis.
! 52
As seen in Study 1 the addition of cue information does not necessarily add an immediate benefit to
the localisation ability of a user as there needs to be confidence that the target object can remain in
focus while using the cue to fine tune the distance judgments.
Importantly, our tasks all prioritised a finger pointing approach rather than a reaching and
grabbing approach that would often be used when interacting with physical objects in the world.
The range of localisation precision that is required will in turn vary largely based on the task.
Targeting errors around 6cm would not generally be detrimental for someone interacting with
objects in day-to-day use as the 6cm error would still typically mean some part of the person’s hand
would touch the object when grasping. One potential training routine to improve the fine grain
precision may be to gradually decrease the size of target objects throughout the training routine for
participants. Previous studies have often varied the distance from the user to target (Auvray et al.,
2007) which varies the size of the object on the display but in a reverse manner (object gets larger
as the person gets closer to it). Because of the stable nature of the target sizes in our tasks it may be
that participants are never pushed to an appropriate level to necessitate improving their fine grain
localisation ability.
! 53
Chapter 4: General discussion and conclusions
! 54
In the preceding chapters I reported the development and testing of our own custom visual to tactile
SSD. We successfully developed a visual to tactile sensory substitution device with an electrotactile
display with higher spatial resolution (32x32 compared to 20x20) and temporal resolution (30hz
compared to 5hz). Initial testing on sensitivity measures demonstrated that users of the device could
reliable detect activations down to a single pixel. Unfortunately, this did not appear to immediately
translate into improved performance in object discrimination ability with our square/circle task.
Notably there was high performance in detection of motion as well as direction of motion with the
high temporal resolution of the device. The high spatial resolution appeared to allow blind
participants to reach reasonably high levels of localisation performance. Interestingly the outcomes
of testing parallel processing in the localisation tasks lead to a two-fold response. The additional
information did not seem to lead to increased performance but it also did not appear to impair
performance. This suggests that users are potentially capable of processing information presented to
the display in parallel but additional training is likely to be necessary in order for that additional
information to be managed in a way that will increase performance.
Implications for sensory substitution devices
Our custom-made electrotactile SSD showed improved performance in the detection of small light
patches and moving objects with higher spatial and/or temporal resolution, even after minimal
training. These results indicate that it may be beneficial to continue to push against the limitations
of current SSDs and further increase the spatial and temporal resolution when possible. Most
noticeably, the increase in temporal resolution seem to provide the most immediate improvements
for users especially with regard to the speed in which users can detect changes in the environment.
With the temporal resolution of 30Hz, moving stimuli were recognised with high accuracies, and
according to anecdotal reports, were among the stimuli that could most readily be recognised on the
tongue display. The increase in the temporal resolution of the SSD also seems to be one of the most
vital improvements for the safety of users, as the ability to detect potential obstacles and hazards
quickly is of paramount importance for their safety.
It is also apparent that performance differences between tactile and auditory displays are
likely to be minimal overall. It is likely that any possible differences between tactile and auditory
SSDs may only be evident after longer amounts of training and more experience with the device.
Each offers its own opposing advantages and limitations, which will also naturally vary depending
on the type of task used. This is something that both users and experimenters will need to take into
consideration before choosing which device is best for them.
! 55
Implications for localisation
Our primary findings for localisation ability using sensory substitution devices were that the
baseline performance was quite high in relation to what had previously been reported in the
literature. Our attempt to improve performance via increase in simultaneous information did not
yield tangible benefits. However, none of the previous studies has systematically investigated the
influence of additional objects on SSD performance. Our results indicate that observers were still
able to perform satisfactorily in a localisation task, even when we significantly increased the
number of objects presented in the display. These results demonstrate that it is possible to process
and successfully discriminate multiple objects with a tactile and auditory SSD, which is of
paramount importance in everyday situations that typically contain multiple objects or background
noise. The results are all the more promising, as this ability was demonstrated in congenitally as
well as late blind participants and sighted (blindfolded) participants who all had only minimal
training with either device.
Previous studies have consistently shown significant performance increments with extended
training and familiarity, especially with electrotactile SSDs (Grant et al., 2016; Nau et al., 2013;
Nau et al., 2015). Thus, it would be interesting to test whether blind or vision-impaired participants
would adopt a more allocentric encoding strategy and gain the ability to filter distractors with
extended use of the device. The limiting factor in localisation ability appears to be linked more to
the initial calibration and training components for participants being comfortable in the
relationships between the sensory input from the device and objects out in the world. A large
portion of the localisation error was potentially driven by errors in the perceived location of the
object. Fortunately this means that the error is likely to decrease over time as participants become
more and more comfortable with the device. It is important for future researchers with this
technology to spend reasonable amounts of time training participants in localisation tasks as well as
discrimination tasks as these two components are inherently linked.
Future directions
Because of the rapid increase in performance that seems to occur within the first few hours of use
with the devices it has been difficult to definitively determine where the spatial limitations are or
where the true ceiling performance occurs. The long-term studies run previously (Grant et al., 2016;
Nau et al., 2013; Nau et al., 2015) seem to suggest that people can eventually learn to discriminate
between letters, words, and more complex shapes but we don’t yet know whether the learning
! 56
would be quicker, or performance higher, if a device with a higher spatial and temporal resolution
was used.
Another area that has seen some minor attention is the discrepancy between congenitally
blind and late blind persons. Unsurprisingly there appears to be drastic differences in sensory
processing and also strategies used to interact with the world. In our testing sample we only had the
opportunity to work with 2 individuals who were congenitally blind and both demonstrated
considerably different strategic approaches to the tasks. One of the participants primarily used
auditory-based strategies to interact with the world while the other was biased towards tactile.
Naturally, the tactile participant was immediately comfortable using the tactile device and was able
to easily translate previously used strategies to the device. The auditory-based participant required
considerable more explanations and practice with the device to gain an understanding of how the
visual images were being represented in tactile space. This seems to be an area that is often
overlooked by researchers who are generally of normal vision and are designing technology and
working with tasks that have always been applied through a visual process. As far as I’m aware no
one has attempted to design tasks or stimuli that take these drastically different world structures into
consideration. Assuming there is any intention to make sensory substitution technology available to
the full range of blind and visually impaired persons this is a demographic that still requires
extensive research to adjust the technology that is congruent with their mental models of the world
There remains a strong relationship between object localisation and object recognition that
has yet to be thoroughly explored. It seems from most previous work that the localisation aspect is
largely taken for granted as in lab settings objects are generally fixed to specific distances within a
known range. It became abundantly clear working with people during the training phase that if you
present novel objects or situations to someone using the device that it could take quite a lot of time
to figure out the base truth of the situation. In a lab setting this is fine and sometimes enjoyable for
the participant but when this is moved out into a real-world situation where localisation and
discrimination are often the vital task to maintain safety then the acceptable margin of error changes
considerably. It would be interesting to look further into tasks in which one aspect of the
localisation/discrimination relationship is held constant while the other is manipulated
Additionally, providing depth information with these devices has become an increasing
possibility with recent technical advancements in sensor miniaturisation. Some preliminary work
with depth information is also beginning in trials with retinal prostheses (Barnes et al., 2015;
McCarthy, Walker, Lieby, Scott, & Barnes, 2014). Depth information provides the obvious benefits
to object localisation but also provides a means of image segmentation to assist in solving the
! 57
problem of how to disentangle simultaneous objects that are presented to the display. I did conduct
some minor preliminary testing with depth information using the Microsoft Kinect. At the time the
device was too large to be used for practical testing in our studies but it did serve as a proof of
concept that we could implement image segmentation according to different distances from the
user, and that this can be implemented at the level of the electrotactile SSD. There are two
possibilities to render distance information on the SSD: First, for a graded representation of depth
information, the rapid refresh rate of the electrotactile array can be exploited. Since images from the
Kinect camera can be sliced based on the distance they are from the observer it is possible to
present specific sections of an image more frequently than others. This allows objects that are closer
to be felt as a strong activation on the tongue and objects farther away to induce a weaker sensation.
Second, it is possible to completely filter out information beyond a certain distance (e.g., 1, 2, 3m)
and omit it, to free the image of distracting information. As seen in Figure 1, a cluttered scene
(Figure 1. Left) can be segmented into different sections based on distance (Figure 1. Middle) or
cleaned of distracting information by only presenting information from a specific depth plane
(Figure 1. Right). The distance information can be used when we wish to present multiple objects
simultaneously but also in a way that allows them to be distinguishable from one another (Figure 1.
Middle). The single depth images are used when we are trying to present an important object alone
without the additional noise of the surroundings (Figure 1. Right).
Figure 1. Three stages of image processing for depth information. Raw photo (Left), heat map
based on depth camera values (brighter is closer, darker is farther away) (Middle), and segmented
image where only the pixels at a pre-determined distance are presented (Right). Images are taken
using the Microsoft Kinect sensor.
The possibility of merging auditory and tactile devices into a single device is also possible.
After conducting tests using both tactile and auditory devices using the same head mounted camera
setup it was conceptually possible for these two devices to be fused. It is not yet known whether the
fusion of two substituting modalities would improve useability for participants or would create an
overwhelming situation similar to the information bottlenecks that appeared in some of our tasks
! 58
using a large number of simultaneous stimuli. This fusion approach could also provide the
possibility of adding additional dimensions to the images presented to the user (such as using
auditory to represent colour while using the tactile display for the raw images). A similar approach
has been used in a different auditory SSD called the EyeMusic (Levy-Tzedek, Riemer, & Amedi,
2014) which uses differing musical instruments to represent colours in the auditory stream. This
additional information stream was successfully exploited to improve visual acuity measures with
the device. This suggests that increasing the number of information streams does have the ability to
theoretically increase performance across a wide range of tasks but as seen in our earlier studies,
appropriate training would be necessary to avoid sensory overload.
The first aim of this thesis was to develop a novel visual to tactile sensory substitution
device with increased spatial and temporal resolution compared to existing devices. Additionally, I
wanted to test whether this increase in spatial and temporal resolution would lead to measurable
increases in performance with the device, specifically the ability to accurately localise objects in
space. The findings within suggest that increases in spatial and temporal resolution of SSDs can
lead to increased performance and the increased resolution also allows for an increased number of
information streams to be tapped into. Even though this technology has now been available for well
over forty years it remains clear that we have not even come close to tapping into the true
capabilities of sensory substitution.
! !
! 59
References AIHW. (2005). Vision problems among older Australians. (Bulletin no. 27). Arno, P., Capelle, C., Wanet-Defalque, M., Catalan-Ahumada, M., & Ceraart, C. (1999). Auditory
coding of visual patterns for the blind. Perception, 28(8), 1013-1029. Auvray, M., Hanneton, S., Lenay, C., & O'Regan, K. (2005). There is something out there: distal
attribution in sensory substitution, twenty years later. Journal of Integrative Neuroscience, 4(4), 505-521.
Auvray, M., Hanneton, S., & O'Regan, K. (2007). Learning to perceive with a visuo-auditory sensory substitution system: localisation and object recognition with "The vOICe". Perception, 36(3), 416-430.
Bach, M. (1996). The Freiburg Visual Acuity Test-variability unchanged by post-hoc re-analysis. Optometry & Vision Science, 73(1), 49-53.
Bach, M., Wilke, M., Wilhelm, B., Zrenner, E., & Wilke, R. (2010). Basic quantitative assessment of visual performance in patients with very low vision. Investigative Ophthalmology & Visual Science, 51(2), 1255-1260.
Bach-y-Rita, P., Collins, C. C., Saunders, F. A., White, B., & Scadden, L. (1969). Vision substitution by tactile image projection. Nature, 221(5), 963-964.
Bach-y-Rita, P., Kaczmarek, K. A., Tyler, M. E., & Garcia-Perez, M. (1998). Form perception with a 49-point electrotactile stimulus array on the tongue: a technical note. Journal of Rehabilitation Research and Development, 35(4), 427-430.
Bancroft, T., & Servos, P. (2011). Distractor frequency influences performance in vibrotactile working memory. Experimental Brain Research, 208(4), 529-532.
Barnes, N. M., Scott, A. F., Stacey, A., McCarthy, C., Feng, D., Petoe, M. A., & Walker, J. (2015). Enhancing object contrast using augmented depth improves mobility in patients implanted with a retinal prosthesis. Investigative Ophthalmology & Visual Science, 56(7), 755.
Bravo, M., & Nakayama, K. (1992). The role of attention in different visual-search tasks. Perception & Psychophysics, 51(5), 465-472.
Brown, D. J., Macpherson, T., & Ward, J. (2011). Seeing with Sound? Exploring different characteristics of a visual-to-auditory sensory substitution device. Perception, 40(9), 1120-1135.
Brown, D. J., & Proulx, M. J. (2013). Increased signal complexity improves the breadth of generalization in auditory perceptual learning. Neural Plasticity, 2013.
Brown, D. J., & Proulx, M. J. (2016). Audio-Vision substutution for blind individuals: addressing human information processing capacity limitations. IEEE Journal of Selected Topics in Signal Processing, 10(5), 924-931.
Brown, D. J., Simpson, A. J., & Proulx, M. J. (2014). Visual objects in the auditory system in sensory substitution: how much information do we need? Multisensory Research, 27(5-6), 337-357.
Brown, D. J., Simpson, A. J., & Proulx, M. J. (2015). Auditory scene analysis and sonified visual images. Does consonance negatively impact on object formation when using complex sonified stimuli? Frontiers in Psychology, 6, 1522.
Brown, K. D., Connell, S. S., Balkany, T. J., Eshraghi, A. E., Telischi, F. F., & Angeli, S. A. (2009). Incidence and indications for revision cochlear implant surgery in adults and children. The Laryngoscope, 119(1), 152-157.
Buchs, G., Maidenbaum, S., Levy-Tzedek, S., & Amedi, A. (2016). Integration and binding in rehabilitative sensory substitution: increasing resolution using a new Zooming-in approach. Restorative Neurology and Neuroscience, 34(1), 97-105.
Capelle, C., Trullemans, C., Arno, P., & Veraart, C. (1998). A real-time experimental prototype for enhancement of vision rehabilitation using auditory substitution. IEEE Transactions on Biomedical Engineering, 45(10), 1279-1293.
! 60
Chader, G. J., Weiland, J., & Humayun, M. S. (2009). Artificial vision: needs, functioning, and testing of a retinal electronic prosthesis. Progress in Brain Research, 175, 317-332.
Chebat, D., Rainville, C., Kupers, R., & Ptito, M. (2007). Tactile-'visual' acuity of the tongue in early blind individuals. NeuroReport, 18(18), 1901-1904.
Chebat, D., Schneider, F. C., Kupers, R., & Ptito, M. (2011). Navigation with a sensory substitution device in congenitally blind individuals. NeuroReport, 22(7), 342-347.
Chekhchoukh, A., & Glade, N. (2012). Influence of sparkle and saccades on tongue electro-stimulation-based vision substitution of 2D vectors. Acta Biotheoretica, 60, 41-53.
Cherry, E. C. (1953). Some experiments on the recognition of speech, with one and with two ears. The Journal of the Acoustical Society of America, 25(5), 975-979.
Deroy, O., & Auvray, M. (2012). Reading the world through the skin and ears: a new perspective on sensory substitution. Frontiers in Psychology, 3, 1-13.
Duncan, J., & Humphreys, G. W. (1989). Visual search and stimulus similarity. Psychological Review, 96(3), 433.
Essick, G. K., Chopra, A., Guest, S., & McGlone, F. (2003). Lingual tactile acuity, taste perception, and the density and diameter of fungiform papillae in female subjects. Physiology and Behaviour, 80, 289-302.
Garcia-Perez, M. (1998). Forced-choice staircases with fixed step sizes: asymptotic and small-sample properties. Vision Research, 38(12), 1861-1881.
Grant, P., Spencer, L., Arnoldussen, A., Hogle, R., Nau, A. C., Szlyk, J., . . . Seiple, W. (2016). The functional performance of the BrainPort V1000 device in persons who are profoundly blind. Journal of Visual Impairment & Blindness, 110(2).
Greenberg, G. Z., & Larkin, W. D. (1968). Frequency-response characteristic of auditory observers detecting signals of a single frequency in noise: the probe-signal method. The Journal of the Acoustical Society of America, 44(6), 1513-1523.
Haigh, A., Brown, D. J., Meijer, P., & Proulx, M. J. (2013). How well do you see what you hear? The acuity of visual-to-auditory sensory substitution. Frontiers in Psychology, 4, 1-13.
Han, S., Humphreys, G. W., & Chen, L. (1999). Uniform connectedness and classical Gestalt principles of perceptual grouping. Perception & Psychophysics, 61(4), 661-674.
Hayhoe, M., & Ballard, D. (2005). Eye movements in natural behaviour. Trends in Cognitive Sciences, 9(4), 188-194.
Heyes, A. D. (1984). Sonic Pathfinder: A programmable guidance aid for the blind. Electronics and Wireless World, 90, 26-29.
Ho, A. C., Humayun, M. S., Dorn, J. D., Da Cruz, L., Dagnelie, G., Handa, J., . . . Greenberg, R. J. (2015). Long-term results from an epiretinal prosthesis to restore sight to the blind. Ophthalmology, 122(8), 1547-1554.
Hsiao, S. S., O'shaughnessy, D. M., & Johnson, K. O. (1993). Effects of selective attention on spatial form processing in monkey primary and secondary somatosensory cortex. Journal of Neurophysiology, 70(1), 444-447.
Humayun, M. S., De Juan, E., & Dagnelie, G. (2016). A quarter century of retinal prosthesis research and development. Ophthalmology, 123(10), 89-97.
Humayun, M. S., Dorn, J. D., Da Cruz, L., Dagnelie, G., Sahel, J., Stanga, P. E., . . . Greenberg, R. J. (2012). Interim results from the international trial of Second Sight's visual prosthesis. Ophthalmology, 119(4), 779-788.
Jansson, G. (1983). Tactile guidance of movement. International Journal of Neuroscience, 19, 37-46.
Kaczmarek, K. A., Bach-y-Rita, P., Tompkins, W. J., & Webster, J. G. (1985). A tactile vision-substitution system for the blind: computer-controlled partial image sequencing. IEEE Transactions on Biomedical Engineering, 32(8), 602-608.
Kaczmarek, K. A., Webster, J. G., Bach-y-Rita, P., & Tompkins, W. J. (1991). Electrotactile and vibrotactile displays for sensory substitution. IEEE Transactions on Biomedical Engineering, 38(1), 1-16.
! 61
Kendrick, M. (2009). Tasting the light: device lets the blind "see" with their tongues. Scientific American, 13.
Kim, J. K., & Zatorre, R. J. (2008). Generalized learning of visual-to-auditory substitution in sighted individuals. Brain Research, 1242, 263-275.
Kim, J. K., & Zatorre, R. J. (2011). Tactile-auditory shape learning engages the lateral occipital complex. Journal of Neuroscience, 31(21), 7848-7856.
Kupers, R., Chebat, D., Madsen, K., Paulson, O., & Ptito, M. (2010). Neural correlates of virtual route recognition in congenital blindness. Proceedings of the national academy of sciences, 107(28), 12716-12721.
Kupers, R., & Ptito, M. (2014). Compensatory plasticity and cross-modal reorganization following early visual deprivation. Neuroscience and Biobehavioural Reviews, 41, 36-52.
Lehav, O. (2012). Improving orientation and mobility skills through virual environment for people who are blind: past research and future potential. Proc. of the 9th Intl Conf. Disability, Virtual Reality & Associated Technologies, 393-398.
Lenay, C., Canu, S., & Villon, P. (1997). Technology and perception: the contribution of sensory substitution systems. IEEE Proceedings of the Second International Conference on Humanizing the Information Age, 44-53.
Lenay, C., Gapenne, O., Hanneton, S., Marque, C., & Genouelle, C. (2003). Sensory substitution: limits and perspectives. Touching for Knowing, 275-292.
Levy-Tzedek, S., Hanassy, S., Abboud, S., Maidenbaum, S., & Amedi, A. (2012). Fast, accurate reaching movements with a visual-to-auditory sensory substitution device. Restorative Neurology and Neuroscience, 30(4), 313-323.
Levy-Tzedek, S., Riemer, D., & Amedi, A. (2014). Color improves "visual" acuity via sound. Frontiers in Neuroscience, 8, 1-7.
Loomis, J. M. (1981). On the tangibility of letters and braille. Perception, 10, 5-27. Lozano, C. A., Kaczmarek, K. A., & Santello, M. (2009). Electrotactile stimulation on the tongue:
intensity perception, discrimination and cross-modality estimation. Somatosensory Motor Research, 26, 50-63.
Maeyama, T., & Plattig, K. (1989). Minimal two-point discrimination in human tongue and palate. American Journal of Otolaryngology, 10(5), 342-344.
Maidenbaum, S., Abboud, S., & Amedi, A. (2014). Sensory substitution: closing the gap between basic research and widespread practical visual rehabilitation. Neuroscience and Biobehavioural Reviews, 41, 3-15.
McCarthy, C., Walker, J., Lieby, P., Scott, A. F., & Barnes, N. (2014). Mobility and low contrast trip hazard avoidance using augmented depth. Journal of Neural Engineering, 12(1), 016003.
Meijer, P. (2017). The vOICe training manual. Retrieved from https://www.seeingwithsound.com/manual/The_vOICe_Training_Manual.htm
Meijer, P. B. L. (1992). An experimental system for auditory image representations. IEEE Transactions on Biomedical Engineering, 39(2), 112-121.
Nau, A. C., Bach, M., & Fisher, C. (2013). Clinical tests of ultra-low vision used to evaluate rudimentary visual perceptions enabled by the BrainPort vision device. Translational Vision Science and Technology, 2(3).
Nau, A. C., Pintar, C., Arnoldussen, A., & Fisher, C. (2015). Acquisition of visual perception in blind adults using the BrainPort artificial vision device. American Journal of Occupational Therapy, 69(1), 1-8.
Novich, S. D., & Eagleman, D. M. (2015). Using space and time to encode vibrotactile information: towards an estimate of the skin's achievable thoroughput. Experimental Brain Research, 233(10), 2777-2788.
Pasqualotto, A., & Esenkaya, T. (2016). Sensory substitution: the spatial updating of auditory scenes "Mimics" the spatial updating of visual scenes. Frontiers in Behavioural Neuroscience, 10.
! 62
Pasqualotto, A., Spiller, M. J., Jansari, A. S., & Proulx, M. J. (2013). Visual experience facilitates allocentric spatial representation. Behavioural Brain Research, 236(175-179).
Peirce, J. W. (2009). Generating stimuli for neuroscience using PsychoPy. Frontiers in Neuroinformatics, 2(10).
Phillips, B., & Zhao, H. (1993). Predictors of assistive technology abandonment. Assistive Technology, 5(1), 36-45.
Pleasonton, A. K. (1970). Sensitivity of the tongue to electrical stimulation. Journal of Speech and Hearing Research, 13(3), 635-644.
Poirier, C., De Volder, A., Tranduy, D., & Scheiber, C. (2007). Pattern recognition using a device substituting audition for vision in blindfolded sighted subjects. Neuropsychologia, 45(5), 1108-1121.
Proulx, M. J., Brown, D. J., Pasqualotto, A., & Meijer, P. (2014). Multisensory perceptual learning and sensory substitution. Neuroscience and Biobehavioural Reviews, 41(16-25).
Proulx, M. J., Gwinnutt, J., Dell'Erba, S., Levy-Tzedek, S., de Sousa, A. A., & Brown, D. J. (2016). Other ways of seeing: From behaviour to neural mechanisms in the online "visual" control of action with sensory substitution. Restorative Neurology and Neuroscience, 34(1), 29-44.
Proulx, M. J., Stoerig, P., Ludowig, E., & Knoll, I. (2008). Seeing 'where' through the ears: effects of learning-by-doing and long-term sensory deprivation on localisation based image-to-sound substitution. PLoS ONE, 3(3).
Renier, L., Collignon, O., Poirier, C., Tranduy, D., Vanlierde, A., Bol, A., . . . De Volder, A. (2005). Cross-modal activation of visual cortex during depth perception using auditory substitution of vision. Neuroimage, 26(2), 573-580.
Renier, L., & De Volder, A. (2010). Vision substitution and depth perception: early blind subjects experience visual perspective through their ears. Disability and Rehabilitation: Assistive Technology, 5(3), 175-183.
Schinazi, V. R., Thrash, T., & Chebat, D. (2016). Spatial nagivation by congenitally blind individuals. Wiley Interdisciplinary Reviews: Cognitive Science, 7(1), 37-58.
Stiles, N. R. B., & Shimojo, S. (2015). Auditory Sensory Substitution is Intuitive and Automatic with Texture Stimuli. Scientific Reports, 5.
Striem-Amit, E., Cohen, L., Dehaene, S., & Amedi, A. (2012). Reading with sounds: sensory substitution selectively activates the visual word form area in the blind. Neuron, 76, 640-652.
Strong, P. (2009). The history of the white cane. Retrieved from http://www.acb.org/tennessee/white_cane_history.html
Stronks, H. C., Parker, D. J., Walker, J., Lieby, P., & Barnes, N. (2015). The feasibility of coin motors for use in a vibrotactile display for the blind. Artificial Organs, 39(6), 480-491.
Stronks, H. C., Walker, J., Parker, D. J., & Barnes, N. (2017). Training improves vibrotactile spatial acuity and intensity discrimination on the lower back using coin motors. Artificial Organs, 41(11), 1059-1070.
Treisman, A. M. (1969). Strategies and models of selective attention. Psychological Review, 76(3), 282.
Tyler, M. E., Braum, J. G., & Danilov, Y. (2009). Spatial mapping of electrotactile sensation threshold and intensity range on the human tongue: initial results. 31st Annual International IEEE EMBS Conference.
Veerman, M. M., Brenner, E., & Smeets, J. B. (2008). The latency for correcting a movement depends on the visual attribute that defines the target. Experimental Brain Research, 187(2), 219-228.
Volcic, R., & Kappers, A. M. (2008). Allocentric and egocentric reference frames in the processing of three-dimensional haptic space. Experimental Brain Research, 188(2), 199-213.
Wan, C. Y., Wood, A. G., Reutens, D. C., & Wilson, S. J. (2010). Congenital blindness leads to enhanced vibrotactile perception. Neuropsychologia, 48, 631-635.
! 63
Weiland, J., Liu, W., & Humayun, M. S. (2005). Retinal Prosthesis. Annual Review of Biomedical Engineering, 7, 40.
White, B. W., Saunders, F. A., Scadden, L., Bach-y-Rita, P., & Collins, C. C. (1970). Seeing with the skin. Perception & Psychophysics, 7(1), 23-27.
Wilke, R., Bach, M., Wilhelm, B., Durst, W., Trauzettel-Klosinski, S., & Zrenner, E. (2007). Testing visual functions in patients with visual prostheses. Artificial Sight, 91-110.