Page 1
i
DESIGN AND DEVELOPMENT OF A MEDICAL TELEMETRY
SYSTEM
A THESIS SUBMITTED TO
THE GRADUATE SCHOOL OF APPLIED SCIENCES
OF
NEAR EAST UNIVERSITY
by
İSMAİL ÇALIKUŞU
In Partial Fulfilment of the Requirements for
the Degree of Master of Science
in
Biomedical Engineering
NICOSIA 2012
Page 2
ii
ABSTRACT
Medical telemetry is very important because every second is very crucial for a patient’s life
as the health condition of the patient is required to be sent to a health specialist as soon as
possible. For example, if the heart stops, the person doesn’t survive for more than a few
minutes. Medical telemetry systems are very advanced with developing technologies such
as wireless and Ethernet systems. Ethernet and wireless technology play important roles
together in the medical telemetry systems because of their continuous high speed and high
data transmission rates. Electrocardiogram signal (ECG) and blood oxygen saturation
(SpO2) signals are two of the important indicators directly related to heart-pulmonary
system. Monitoring and following of ECG and SpO2 offers us a good indication of heart
functionality. Therefore, it is crucial to design and develop a homemade inexpensive
device for measuring the Heart Rate and SpO2. In addition to this, data is required to be
sent instantly so that it can be monitored and analysed remotely by the health specialist.
In the medical telemetry system designed and developed by the author, ECG and SPO2
signals are obtained using instrumentation amplifiers with filters, and are sent with serial
Ethernet board to a remote place for analysis. Signals are transmitted in text format using
suitable Ethernet boards. The developed system allows a health specialist to send data
easily and cheaply to any required place.
Key words: Medical Telemetry, Biotelemetry, ECG, SPO2, Ethernet.
Page 3
iii
ÖZET
Medikal telemetri sistemlerinin kullanımı hayati bir öneme sahiptir. Çünkü hastanın
hayatta kalabilmesi için hastanın durumunun sağlık uzmanına mümkün olabildiğince hızlı
bir şekilde yollanması gerekmektedir. Örneğin, kalbin çalışması durursa kişi birkaç
dakikadan fazla hayatını devam ettiremez. Medikal telemetri sistemleri gelişen kablosuz ve
Ethernet sistemleri teknolojileri ile birlikte önemli bir ilerleme kaydetmiştir. Ethernet ve
kablosuz teknolojileri sürekli yüksek hız ve veri iletim hız oranlarıyla medikal telemetri
sistemlerinde önemli bir işleve sahiptir. Elektrokardiyogram (EKG) ve kandaki oksijen
doyumu (SPO2) sinyalleri kalbin dolaşım sistemleri hakkında iki önemli gösterge
niteliğindedir. EKG ve SPO2’nin görüntülenmesi ve izlenmesi kalbin çalışma fonksiyonu
hakkında bize önemli bilgiler sunacaktır. Bu yüzden, SPO2 ve kalbin atış hızını ölçebilen
ve uzak bir yerde bulunan sağlık personeline anlık olarak gönderebilen ev tipi cihazların
tasarlanması hasta açısından hayati bir önem arz etmektedir.
Yazarın gerçekleştirmiş olduğu sistemde EKG ve SPO2 sinyalleri enstrumantasyon
yükselteçleri kullanılarak tasarlanmış olup analiz için uzak istasyona gönderilmiştir.
Sinyaller text (metin) formatında Ethernet portu kullanılarak iletilmiştir. Sistem sağlık
personeline gerekli herhangi bir yere verinin kolayca ve ucuz bir şekilde yollama imkânı
sağlamaktadır.
Anahtar Sözcükler: Medikal telemetri, biyotelemetri, EKG, SPO2, Ethernet.
Page 4
iv
LIST OF CONTENTS
ABSTRACT.....................................................................................................................ii
ÖZET...............................................................................................................................iii
CONTENTS ................................................................................................................... .iv
ACKNOWLEDGEMENTS……………………………………………………..….……vi
LIST OF FIGURES………..…………………………………………………………….vi
LIST OF TABLES…..…………………………………………………………………..ix
ABBREVIATIONS USED……………………………………………………………....x
CHAPTER 1, INTRODUCTION..................................................................................1
CHAPTER 2, THE HUMAN HEART ........................................................................ 4
2.1 Overview .................................................................................................................... 4
2.2. Heart Structure ........................................................................................................... 4
2.3. Mechanism of Heart Working ................................................................................... 5
2.4 Heart Conduction System and Electrical Activity of Heart ....................................... 7
2.5 Placement of ECG Recording Surface Electrodes ..................................................... 9
2.5.1 ECG Limb Leads .................................................................................................. 10
2.5.2 ECG Augmented Limb Leads ............................................................................... 11
2.5.3 ECG Chest Leads .................................................................................................. 12
2.6 Other types of ECG Leads ........................................................................................ 13
2.6.1 Esophageal ECG Leads ......................................................................................... 13
2.6.2 Intracardiac ECG .................................................................................................. 14
2.6.3 Endotracheal ECG ................................................................................................. 15
2.6.4 Intracoronary ECG ................................................................................................ 15
2.7 Summary ................................................................................................................... 15
CHAPTER 3, THE ECG MACHINE . ...................................................................... 16
3.1 Overview ................................................................................................................ 17
3.2.ECG History ............................................................................................................ 18
3.3.ECG Instrumentation ............................................................................................... 19
3.4.Biopotential Electrodes for ECG ............................................................................. 21
3.4.1.Electrode Electrode Interface ................................................................................ 21
3.4.2.Polarization..... ....................................................................................................... 23
3.4.3. Electrical Characteristics .................................................................................... 25
3.4.4.Practical Electrodes for Biomedical Mesurements ................................................ 27
3.4.4.1.Body Surface Biopotential Electrodes ................................................................ 27
3.4.4.2.Metal Plate Electrodes ....................................................................................... 28
3.4.2.Electrodes for Chronic Patient's Monitoring ......................................................... 29
3.4.3.Intracavitary and Intratissue Electrodes..... ........................................................... 32
3.4.4.Microelectrodes ..................................................................................................... 35
3.4.5.Summary ................................................................................................................ 36
CHAPTER 4, SPO2 ..................................................................................................... 38
4.1 Overview .................................................................................................................. 38
4.2.Principles of Pulse Oximetry .................................................................................... 38
Page 5
v
4.3. History of Pulse Oximetry ....................................................................................... 42
4.4.Pulse Oximeter Instrumentation .............................................................................. 43
4.5. Summary .................................................................................................................. 45
CHAPTER 5, MEDICAL TELEMETRY SYSTEMS .............................................. 46
5.1 Overview ................................................................................................................. 46
5.2 General Description of Medical Telemetry ............................................................. 46
5.3 Brief History of Medical Telemetry System ........................................................... 47
5.4. Types of Medical Telemetry Systems ..................................................................... 48
5.4.1 Single Channel Medical Telemetry Systems ........................................................ 48
5.4.2 Multi Channel Medical Telemetry Systems .......................................................... 49
5.5 Summary ................................................................................................................... 50
CHAPTER 6, DESIGN OF A TELEMETRY SYSTEM ......................................... 51
6.1 Overview ................................................................................................................ 52
6.2 Medical Telemetry System ...................................................................................... 52
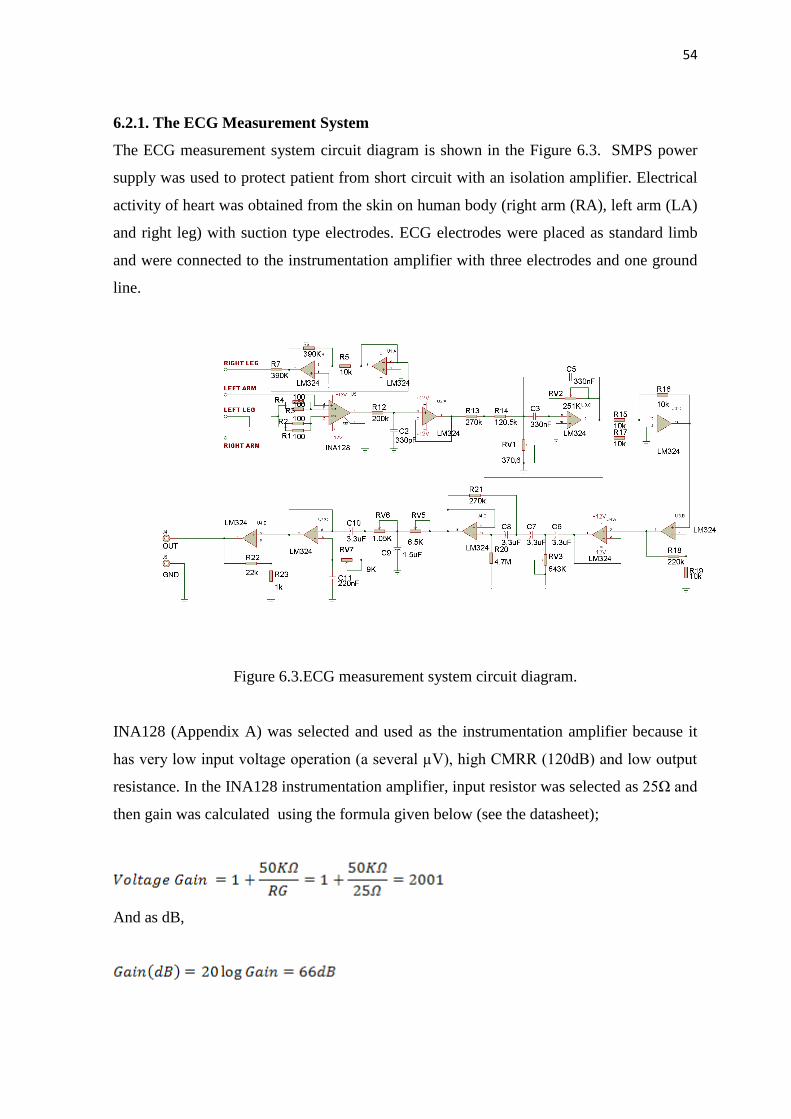
6.2.1 The ECG Measurement System ........................................................................... 53
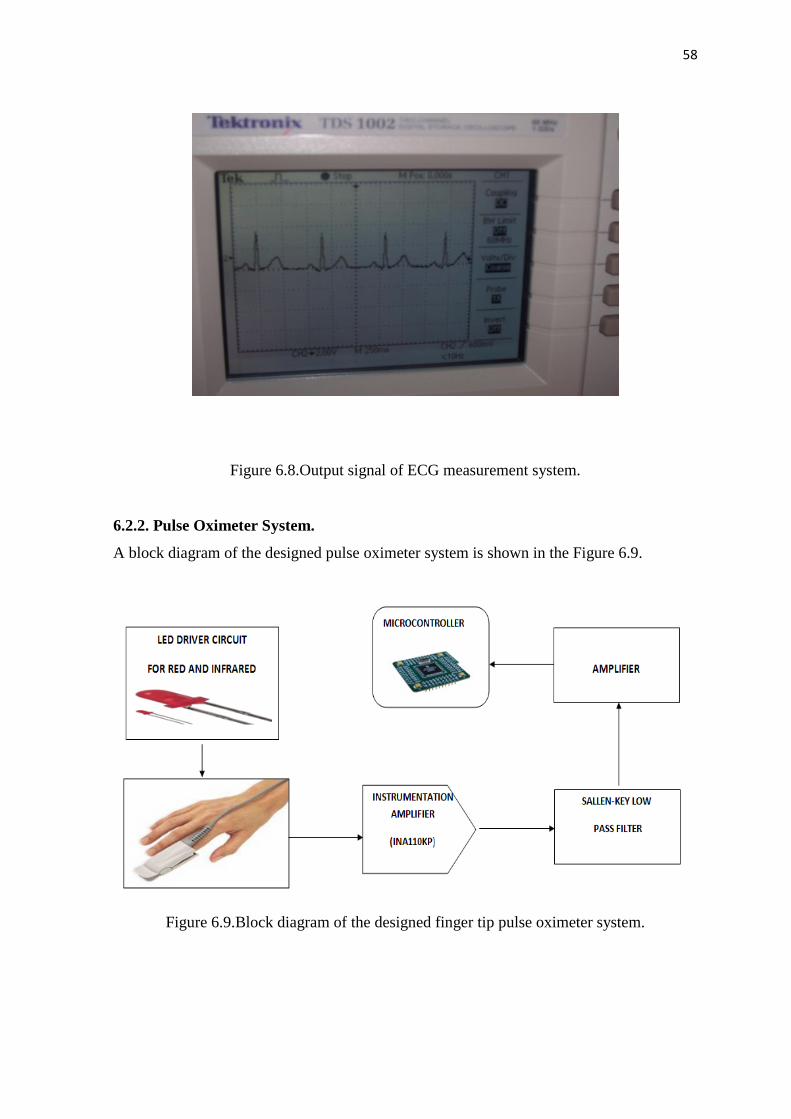
6.2.2 Pulse Oximeter System .......................................................................................... 57
6.2.3 Microcontroller System ......................................................................................... 61
6.3 Software of Medical Telemetry System ................................................................... 64
6.4 Summary .................................................................................................................. 64
CHAPTER 7, RESULTS AND DISCUSSSION ....................................................... 66
CHAPTER 8, CONCLUSIONS ................................................................................. 72
REFERENCES .............................................................................................................. 74
APPENDIX A INA128 Instrumentation Amplifier block diagram .............................. 76
APPENDIX B Nellcorr Pulse Oximeter Probe Pinout for disposable .......................... 77
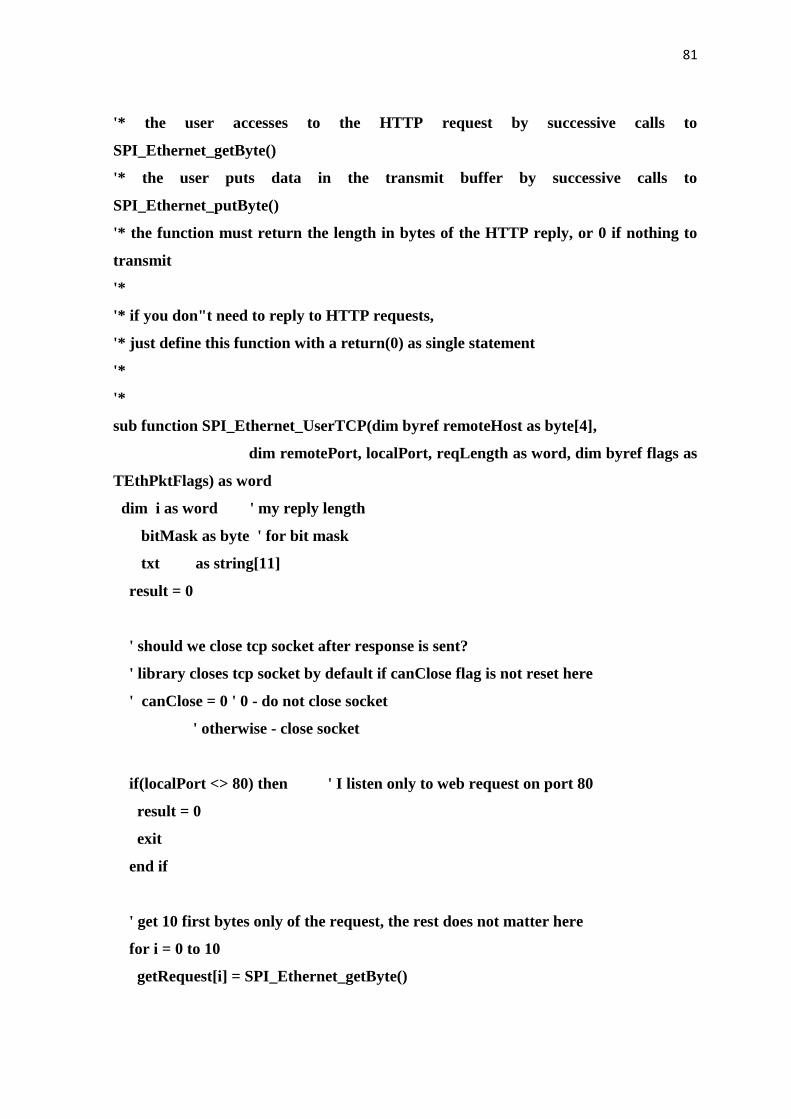
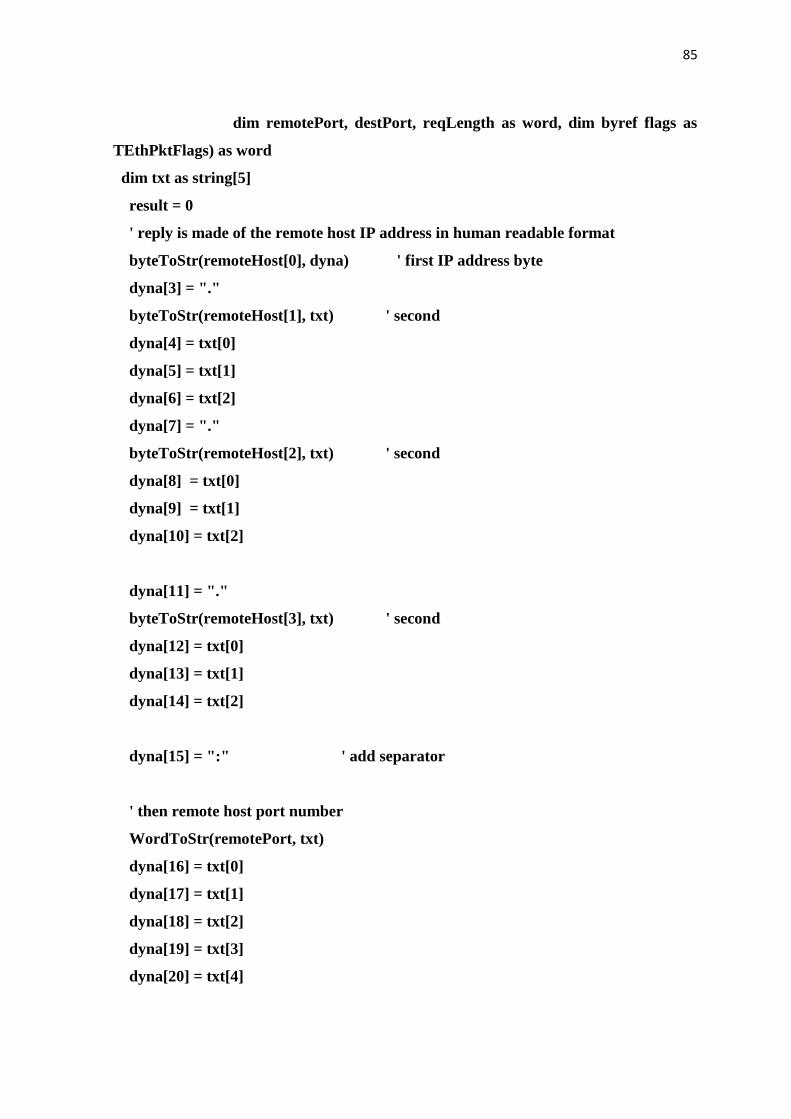
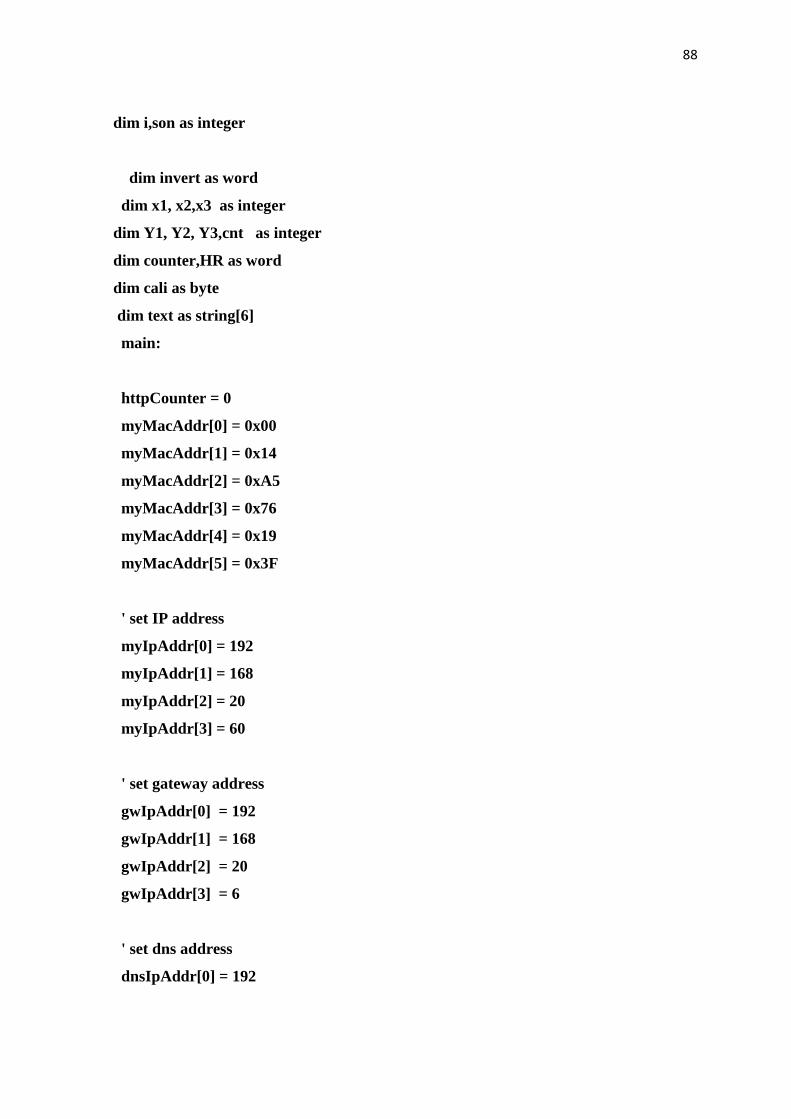
APPENDIX C Software of design system ..................................................................... 78
APPENDIX D Pulse Oximeter Signal which eliminated DC effect ............................. 92
Page 6
vi
ACKNOWLEDGEMENTS
First and foremost I offer my sincerest gratitude to my supervisor, Prof. Dr. Dogan
Ibrahim, who has supported me throughout my thesis with his patience and knowledge. I
attribute the level of my Masters Degree to his encouragement and effort and without him
this thesis, too, would not have been completed or written. One simplify could not wish for
a better or friendlier supervisor. My thanks and appreciation goes to my thesis committee
members. I am greatly indebted to my administrator, Ass. Prof. Dr Terin Adalı, for her
relationship and guidance. I am also thankful for the contributions and comments of the
teaching staff of the Department of Biomedical Engineering, especially Prof.Dr.D.İbrahim
for his kind help.
I am especially grateful to Ass.Prof.Dr Uğur Fidan from Turkey for being a constant
source of encouragement and helped me gain self confidence. Here also I would like to
thank to my colleagues and friends at the Department of Biomedical Engineering who
helped me one way the other. In addition to this, I would like to thank my school
headmaster Selçuk ATAKAN and my teacher friends for their relationship and friendlier
behaviour.
My final words go to my family. I want to thank my family, whose love and guidance is
with me in whatever I pursue.
Page 7
vii
LIST OF FIGURES
Figure 2.1 Place of heart in the chest .............................................................................. 4
Figure 2.2 Heart wall layers ............................................................................................ 5
Figure 2.3 Structure of the heart ...................................................................................... 7
Figure 2.4 Heart conduction system ............................................................................... 8
Figure 2.5 The ECG wave ............................................................................................... 9
Figure 2.6 Standard ECG limb leads ............................................................................. 10
Figure 2.7 ECG augmented limb leads ......................................................................... 11
Figure 2.8 ECG chest leads ........................................................................................... 12
Figure 2.9 Esophageal ECG wave ................................................................................ 13
Figure 2.10 Intracardiac ECG and electrode ................................................................. 14
Figure 3.1 Einthoven ECG machine .............................................................................. 17
Figure 3.2 Modern ECG machine .................................................................................. 18
Figure 3.3 Block Diagram of typical single channel ECG circuit ................................ 19
Figure 3.4 Instrumentation amplifier ............................................................................. 20
Figure 3.5 Electrode-electrode interface........................................................................ 22
Figure 3.6 The equivailent circuit for a biopotential electrode ..................................... 26
Figure 3.7 An exp. of biopotential electrode impedance as a function of frequency ... 26
Figure 3.8 Metal plate electrode .................................................................................. 28
Figure 3.9 Suction type electrode for ECG .................................................................. 29
Figure 3.10 Recessed type electrodes ........................................................................... 30
Figure 3.11 Examples of Different type electrodes ....................................................... 31
Figure 3.12 Examples of different internal electrodes ................................................. 33
Figure 3.13 Microelectrodes ......................................................................................... 35
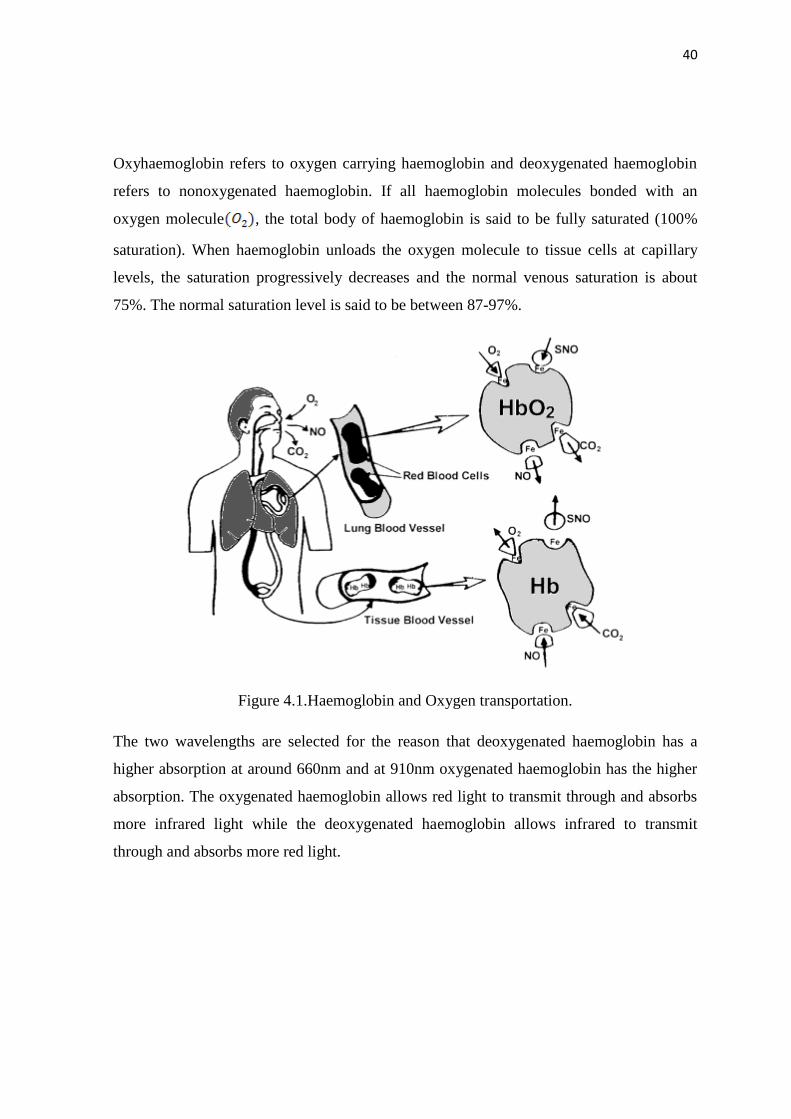
Figure 4.1 Haemoglobin and Oxygen Transportation .................................................. 39
Figure 4.2 Absorption coefficient two types ................................................................. 40
Figure 4.3 Schematic of finger pulse oximeter idea ..................................................... 40
Figure 4.4 Normal detected signal in red and infrared for SPO2 ................................. 41
Figure 4.5 Browse hand held Pulse Oximetry ............................................................... 43
Figure 4.6 Block diagram of finger tip pulse oximeter ................................................ 43
Page 8
viii
Figure 4.7 Timing signals for the LED drivers such as red and infrared ..................... 44
Figure 5.1 Block diagram of medical telemetry system ............................................... 46
Figure 5.2 Block Diagram of a Single Channel Telemetry System ............................. 48
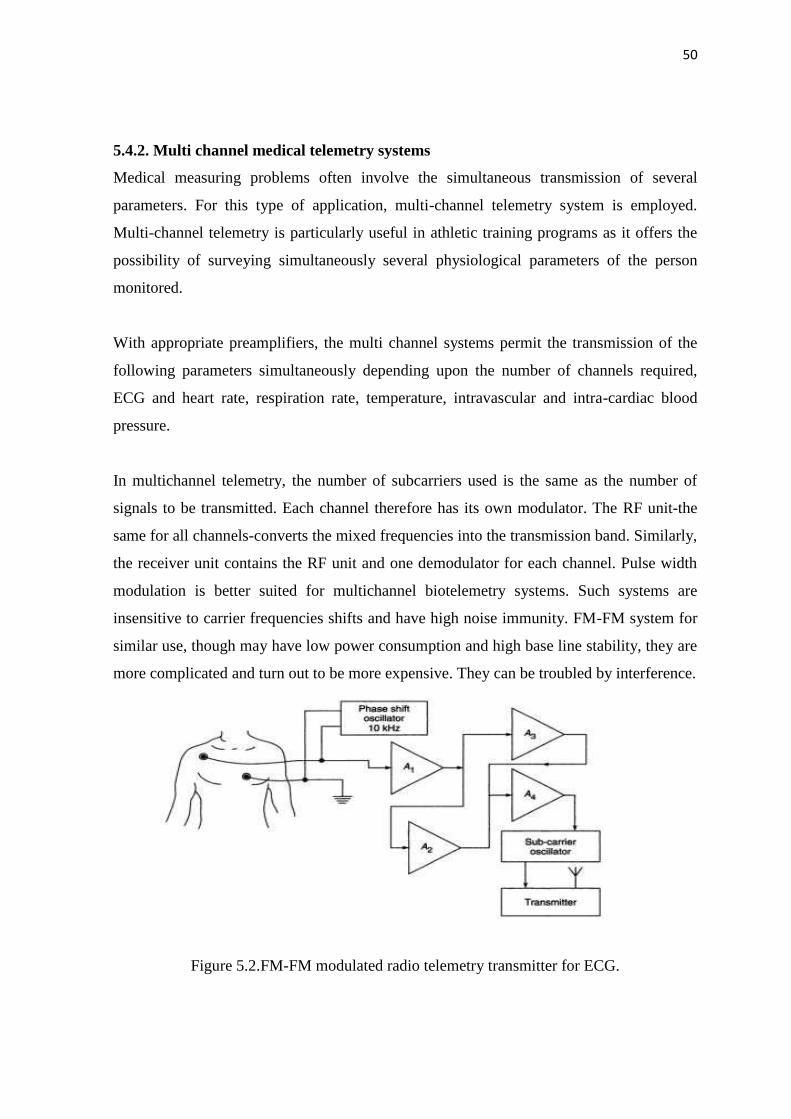
Figure 5.3 FM-FM modulated radio telemetry transmitter for ECG ........................... 49
Figure 6.1 Block diagram of Medical Telemetry design system .................................. 51
Figure 6.2 Block diagram of ECG measurement system .............................................. 52
Figure 6.3 ECG Measurement system circuit ............................................................... 53
Figure 6.4 The output signal ECG signal from INA128KP ......................................... 54
Figure 6.5 Block diagram of medical telemetry system ............................................... 46
Figure 2.1 Place of heart in the chest .............................................................................. 4
Figure 2.2 Heart wall layers ............................................................................................ 5
Figure 2.3 Structure of the heart ...................................................................................... 7
Figure 2.4 Heart conduction system ............................................................................... 8
Figure 2.5 The ECG wave ............................................................................................... 9
Figure 2.6 Standard ECG limb leads ............................................................................. 10
Figure 2.7 ECG augmented limb leads ......................................................................... 11
Figure 2.8 ECG chest leads ........................................................................................... 12
Figure 2.9 Esophageal ECG wave ................................................................................ 13
Figure 2.10 Intracardiac ECG and electrode ................................................................. 14
Figure 3.1 Einthoven ECG machine .............................................................................. 17
Figure 3.2 Modern ECG machine .................................................................................. 18
Figure 3.3 Block Diagram of typical single channel ECG circuit ................................ 19
Figure 3.4 Instrumentation amplifier ............................................................................. 20
Figure 3.5 Electrode-electrode interface........................................................................ 22
Figure 3.6 The equivailent circuit for a biopotential electrode ..................................... 26
Figure 3.7 An ex. of biopotential electrode impedance as a function of freq ............... 26
Figure 3.8 Metal plate electrode .................................................................................. 28
Figure 3.9 Suction type electrode for ECG .................................................................. 29
Figure 3.10 Recessed type electrodes ........................................................................... 30
Figure 3.11 Examples of Different type electrodes ....................................................... 31
Figure 3.12 Examples of different internal electrodes ................................................. 33
Figure 3.13 Microelectrodes ......................................................................................... 35
Page 9
ix
Figure 4.1 Haemoglobin and Oxygen Transportation .................................................. 39
Figure 4.2 Absorption coefficient two types ................................................................. 40
Figure 4.3 Schematic of finger pulse oximeter idea ..................................................... 40
Figure 4.4 Normal detected signal in red and infrared for SPO2 ................................. 41
Figure 4.5 Browse hand held Pulse Oximetry ............................................................... 43
Figure 4.6 Block diagram of finger tip pulse oximeter ................................................ 43
Figure 4.7 Timing signals for the LED drivers such as red and infrared ..................... 44
Figure 5.1 Block diagram of medical telemetry system ............................................... 46
Figure 5.2 Block Diagram of a Single Channel Telemetry System ............................. 48
Figure 5.3 FM-FM modulated radio telemetry transmitter for ECG ........................... 49
Figure 6.1 Block diagram of Medical Telemetry design system .................................. 51
Figure 6.2 Block diagram of ECG measurement system .............................................. 52
Figure 6.3 ECG Measurement system circuit ............................................................... 53
Figure 6.4 The output signal ECG signal from INA128KP ......................................... 54
Figure 6.5 Notch filter circuit for ECG ........................................................................ 55
Figure 6.6 Sallen Key High Pass Filter for ECG .......................................................... 56
Figure 6.7 Sallen Key Low Pass Filter for ECG ........................................................... 56
Figure 6.8 Output signal of ECG measurement system .............................................. 57
Figure 6.9 Block diagram of finger tip pulse oximeter system .................................... 57
Figure 6.10 The output signal for red and infra-red light ............................................ 59
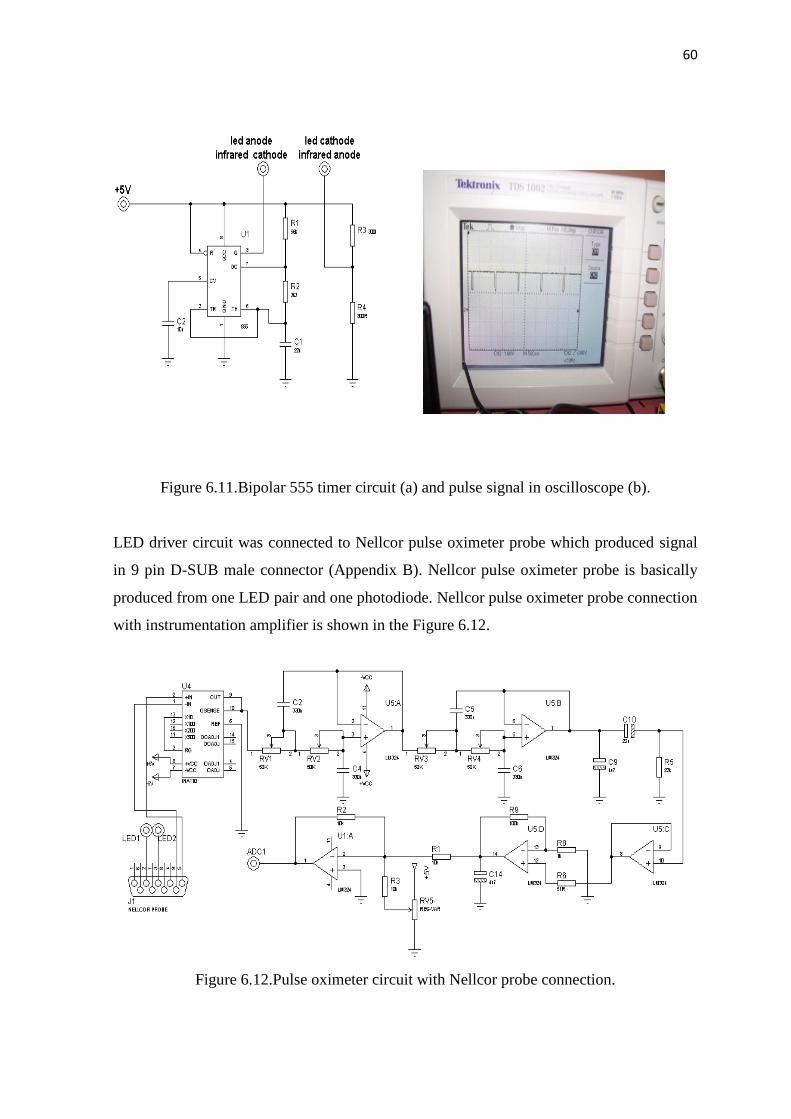
Figure 6.11 Bipolar 555 Timer circuit and pulse signal in oscilloscope ....................... 60
Figure 6.12 Pulse oximeter circuit with nellcor probe connection ................................ 60
Figure 6.13 The output signal of INA110KP instrumentation amplifier circuit ........... 61
Figure 6.14 The output signal from Pulse Oximeter system ......................................... 62
Figure 6.15 Pin diagram of DSPIC30F6014A .............................................................. 63
Figure 6.16 Microcontroller and Serial Ethernet circuit system.................................... 64
Figure 7.1 The output signal of ECG system ............................................................... 68
Figure 7.2 The output signal of pulse oximeter system ................................................ 69
Figure 7.3 ECG and SPO2 signal monitoring in GLCD ................................................ 70
Page 10
x
ABBREVATIONS
LCD: Liquid Crystal Display
SPO2: Saturation Peak of Oxygen in blood.
CMRR: Common Mode Rejection Ratio
GLCD: Graphical Liquid Crystal Display
AC: Alternative Current
DC: Direct Current
PC: Personality Computer
PCM: Pulse Code Modulation
FM: Frequency Modulation
FSK: Frequency Shift Key
GPRS: General Packet Radio Service
ARX: Mach like operating system for Acorn Computer
PDA: Personal Digital Assistant
AC: Access Point
AV: Atrioventricular
aVR: Augmented Vector Right
LED: Light Emitting Diode
RA: Right Arm
LA: Left Arm
RL: Right Leg
LL: Left Leg
aVL: Augmented Vector Left
IR: Infrared
Page 11
xi
LF: Low Frequency
HF: High Frequency
DSP: Digital Signal Processing
SL:Semilunar
aVF: Augmented Vector Foot
RAM: Read Access Memory
EMG: Electromyography
BPF: Band Pass Filter
HR: Heart Rate
Page 12
xii
LIST OF TABLES
Table 3.1 The effect of electrode properties on electrode impedance ........................... 27
Page 13
1
CHAPTER 1
INTRODUCTION
Medical Telemetry is a way of transmitting data electronically from one point to another.
In a typical medical telemetry application, equipment record electronic data related to a
patient and then send this data to a desired central area where it can be displayed on LCD
or TV screens for qualified medical staff to monitor so that any urgent medical problems
can be attended to as soon as possible.
The doctors who admit a person to the hospital decide what level of care he or she needs.
Doctors send some patients to telemetry units when they are concerned about the long term
health problems of these people. For example, elderly patients who cannot go to hospitals
easily are usually sent to medical telemetry units where their health problems can be
monitored over long periods of times. Some medical telemetry equipments are placed at
patient’s home so that the health of the patient can be monitored remotely.
The most important medical parameters measured at telemetry units are the
electrocardiogram (or ECG), and level of the saturated oxygen in patient’s blood. These
two parameters tell a lot to a doctor about a patient’s health problems.
This thesis is about the design and development of a microcontroller based medical
telemetry device. The design is based using suitable sensors and electrodes to collect data
about a patient’s electrocardiogram and level of saturated oxygen in their bloods. The
collected information is sent over a serial Ethernet link to a remote location where the data
can be analysed by qualified doctors and health staff.
This thesis consists of 7 Chapters. Chapter 1 is the introduction.
Chapter 2 is related to the human heart. This Chapter described the basic operating
principles of the human heart. Every year, may people are admitted to hospitals because of
Page 14
2
heart related problems, e.g. heart disease or heart attack. For this reason, it is important to
have a good understanding of the human heart. The Chapter describes the typical electrical
signals present on a human heart.
Chapter 3 is about the electrocardiogram machine (ECG). The ECG machine detects the
signals emitted by the heart using suitable electrodes connected to the chest of a patient. By
analysing the ECG waveforms, doctors can tell a lot about the state of a patient’s heart.
The Chapter gives a brief introduction to the history of the ECG machine and the operation
of the machine is described together with the various methods that the electrodes can be
connected to the chest.
Chapter 4 is related to pulse oximetry. Pulse oximetry is a general term used for the non-
invasive measurement of the level of saturated oxygen in the blood. The Chapter describes
the basic principles of the pulse oximetry and explain the importance of knowing the
oxygen level in the blood.
Chapter 5 is about medical telemetry in general. The Chapter explains why medical
telemetry is important for the treatment of patients. In addition, the electronic parts of
various medical telemetry systems are given in detail. In general. The ECG and the level of
saturated oxygen are measured in medical telemetry systems. The way these signals are
measured and used in medical telemetry systems is described in detail in the Chapter.
Chapter 6 is about the medical telemetry system designed and developed by the author.
The system is based on using a microcontroller as the main processing unit. It is described
in the Chapter how the various system parts are put together, how the ECG and the
saturated oxygen levels are measured, and how the collected data is sent to a remote
location using an Ethernet based communication medium.
Chapter 7 gives the results of the tests carried out by the author. In addition, the benefits of
the designed system are given in this Chapter.
Finally, the conclusions are given in Chapter 8 of the thesis.
Page 15
3
1.1 Literature Search
The design of a medical telemetry system is not new. Many firms specialised in the design
of medical equipment has designed medical telemetry systems. This section describes the
features of some of the medical telemetry systems available in the market and discusses
why the system developed by the author has advantages compared to these systems.
Guler & Fidan [1] describe the design of a medical telemetry system based on using a
Radio Frequency (RF) data module to transmit the data. The collected data is converted
into digital format and sent to a remote location using Pulse Code Modulation (PCM)
techniques with a 9.6 Kps transmission speed. At the receiving end the received signal is
converted into analog form and displayed on a PC using the Sonic Foundry Sound
programme. One disadvantage of this system compared to the system designed by the
author is that the communication is established using radio waves. In general radio waves
have a limited coverage and are also prone to noise and attenuation. The system designed
by the author uses the Ethernet protocols and the range is very long as anyone with a
suitable internet link can access the system from anywhere in the world.
Di & Liu [2] describe the design of a medical telemetry system using the MSP430F149
microcontroller. The design in this paper is mainly based on a reflectance pulse oximeter
and the telemetry side is not discussed in detail.
Lee [3] reports a medical telemetry system based on using Frequency Shift Keying (FSK)
modulation techniques with radio waves. As with the system designed by Di & Liu, this
system suffers from the same problems of range and noise.
Boskovic & Despotovic [4] describe the design of a medical telemetry system to transmit
ECG signals via GPRS. Although this is an attractive concept, only the ECG data is
transmitted. In addition, the system is costly compared to the system designed by the
author.
Hong et al [5] describe a medical telemetry system where the communication is based on
using a PDA phone. The design reported in their paper is specialised as it uses the XigBee
Page 16
4
communication medium with a limited coverage. Such a system would be acceptable in
closed buildings, such as in a hospital or in a health clinic.
A medical telemetry system based on using the Bluetooth communication technology is
described by Villegas et al [6]. The problem with Bluetooth based systems is that the
coverage is rather limited and in general it is not possible to transmit over several hundred
meters. The use of such a system would be suitable in small hospitals or health clinics.
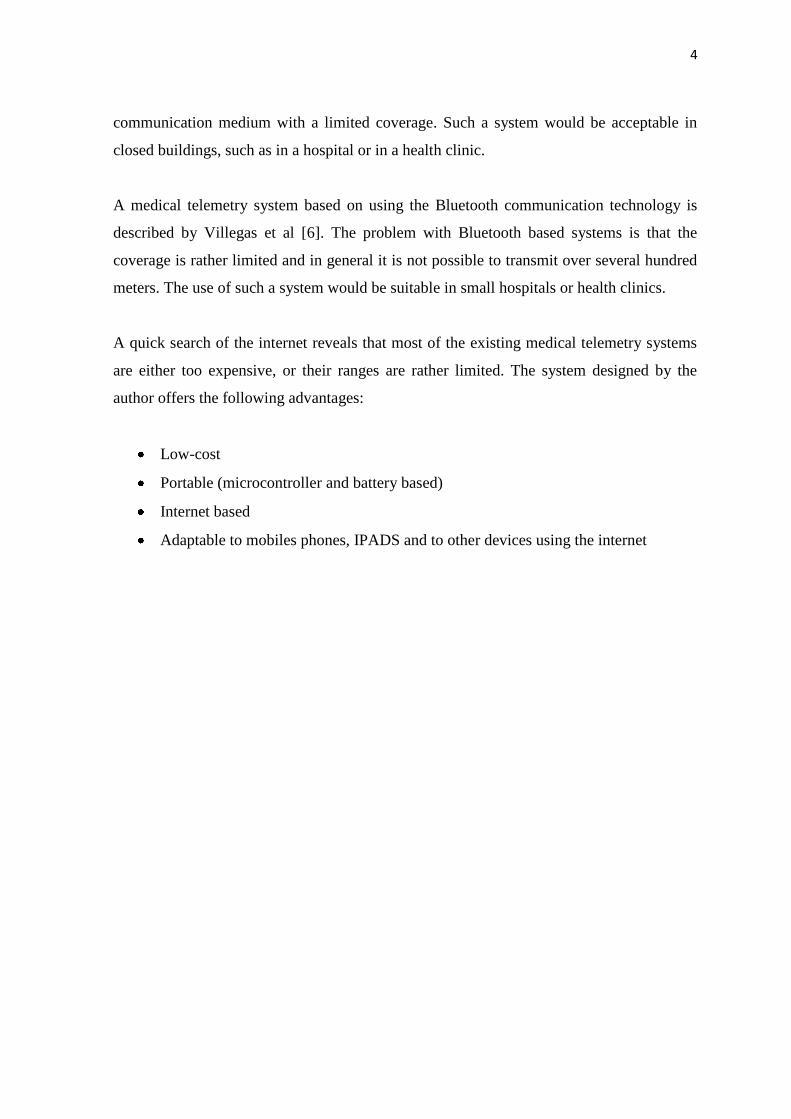
A quick search of the internet reveals that most of the existing medical telemetry systems
are either too expensive, or their ranges are rather limited. The system designed by the
author offers the following advantages:
Low-cost
Portable (microcontroller and battery based)
Internet based
Adaptable to mobiles phones, IPADS and to other devices using the internet
Page 17
5
CHAPTER 2
THE HUMAN HEART
2.1. Overview
Heart is a vital organ in the entire body with four chambers and it generates like a pump.
Heart pumping blood activity is needed to continue our life. Heart electrical activity is
measured with ECG electrodes which are connected to an ECG machine to monitor heart
electrical activities. This chapter is about the working principles of the human heart.
2.2. Heart Structure
Heart is the one of the most important organs in the body that acts like a pump. It is really
nothing more than a pump, which pumps blood through the body, beating from 60 to 120
per minute continuously in our life.
Figure 2.1.Place of heart in the chest.
The heart, the central organ of the cardiovascular system is located between the lungs in
the middle chest and protected by the pericardium. The muscular walls of heart consist of
Page 18
6
three major layers. The bulk of the walls is made up of a layer of cardiac muscle and is
called myocardium. Myocardium is the thick layer of cardiac muscle which is responsible
for the contraction and relaxation of the ventricles and atria. The muscle is enclosed on the
outside by the epicardium and on the inside by the endocardium. Endocardium is a smooth
membrane of endothelial cells that lines not only chambers of the heart, but the valves as
well. The heart is also covered completely by a protective sac called the pericardium. The
pericardium is an extremely tough membrane that acts as protection for the heart and is not
directly connected to the walls of the heart [7].
Figure 2.2.Heart wall layers.
2.3. Heart Working Mechanism
The heart (Figure 2.3) is the important key organ in the circulatory system which consists
of a network of blood vessels, such as arteries, veins and capillaries. The heart pumps the
blood which carries all the vital materials which help our bodies function and removes the
waste product. If the pumping action of the heart is disrupted, the body’s organs begin to
fail very quickly. For this reason, life itself is dependent on the efficient operation of the
heart.
Page 19
7
The heart has four valves: The tricuspid valve which is located between the right atrium
and right ventricle, the pulmonary or pulmonic valve, between the right ventricle and the
pulmonary artery, the mitral valve, between the left ventricle and the aorta. Each valve has
a set of flaps (also called leaflets or cups). The mitral valve has two flaps; the others have
three. Under normal situations, the valves permit blood to flow in only one direction.
Blood flow occurs only when there’s a difference in pressure across the valves that cause
them the open.
Blood returning to the heart from the body (venous blood that has already had oxygen
taken from it) enters the right atrium. Blood flows and is pumped from the right atrium
across the open tricuspid valve into the right ventricle.
As the right ventricle starts to contract the tricuspid valve closes (blood can only be
pumped forward) the pulmonary valve opens and blood pumped into the pulmonary
arteries. These arteries carry blood to the lungs to be oxygenated.
Oxygenated blood is returned to the heart by pulmonary veins. This oxygenated blood
enters the left atrium. Blood from the left atrium flows across an open mitral valve to enter
the left ventricle. As the left ventricle starts to contract the mitral valve closes and the
aortic valve opens as blood is pumped across it into the aorta. The aorta and arteries that
branch from it carry blood to the entire body. The left ventricle is the largest and most
forcefully contracting chamber of the heart. It must pump oxygen rich blood to the whole
body.
The heartbeat cycle consist of two components such as diastole and systole. Diastole
occurs when the heart is relaxed and not contracting. During diastole blood fills each of
atria and begins filling the ventricles. On the other hand, Systole occurs when electrical
impulse travelling down specialized conducting fibbers trigger the heart to contract. The
left and right atria contract at nearly the same time pumping remaining blood into the left
and right ventricle. Systole continues as the right and the left ventricle contract, pumping
blood to the lungs and body, several tenths of a second after the right and left atria have
contracted. Systole and diastole continuously alternate as long as the heart continues the
beat.
Page 20
8
Figure 2.3.Structure of the heart [8].
2.4. Heart Conduction System and Electrical Activities of the Heart.
Heart conduction system is the process that causes the heart muscles to expand and
contract rhythmically. The heart has a natural pacemaker that regulates the rhythm of heart
or rate of heart. The heart rate of contraction is controlled by the sinuatrial node (SA node),
often called pacemaker, is located in the upper wall of the right atrium, which is made up
of specialized myocardial cells called nodal cells.
Action potentials originate in the sinuatrial node and travel across the wall of atrium from
the sinuatrial node to the atrioventricular (AV) node. Action potentials pass slowly through
the AV node to give the atria time to contract. Then they pass rapidly along the
atrioventricular bundle, which extends from the atrioventricular node through the fibrous
skeleton into the intraventricular septum. The atrioventricular bundle divides into right and
left bundle branches, and action potentials descend rapidly to the apex of each ventricle
along the bundle branches. Then, action potentials are carried by purkinje fibbers (or
conduction pathways) from the bundle branches to the ventricular walls. The rapid
Page 21
9
conduction from the atrioventricular bundle to the ends of the purkinje fibbers allows the
ventricular muscle cells to contract in unison, providing a strong contraction. The normal
delay between the contraction of the atria and of the ventricles is 0.12 to 0.20 seconds. This
delay is perfectly timed to account for the physical passage of blood from the atrium to the
ventricle. Intervals shorter or longer than this range indicate possible problems.
Figure 2.4.Heart conduction system.
The Electrocardiogram or ECG (Figure 2.5) records the electrical activity that results when
the heart muscle cells in the atria and ventricles contract. Atrial contractions (both right
and left) show up as the P wave. Ventricular contraction (both right and left) also show as a
series of three waves, Q-R-S, known as the QRS complex. The third and last common
wave in an ECG is the T wave. This reflects the electrical activity produced when the
ventricles are recharging for the next contraction (repolarising). Interestingly, the letters P,
Q, R, S and T are not abbreviations for any actual words but were chosen many years ago
Page 22
10
for their position in the middle of alphabet. The electrical activity results in P, QRS, and T
waves that have a myriad of sizes and shapes. When viewed from multiple anatomic-
electrical perspectives (that is, leads), these waves can show a wide range abnormalities of
both the electrical conduction system and the muscle tissue of the heart’s four pumping
chambers[9].
Figure 2.5.The ECG wave.
2.5. Placement of ECG Recording Surface Electrodes
The ECG is recorded by placing an array of electrodes at specific locations on the human
body surfaces. Generally, electrodes are located on each arm, leg and six electrodes are
located on the chest and these electrode leads are connected to a device that measures
potential differences between selected electrodes to generate the characteristic ECG wave.
The limb leads are sometimes called as bipolar leads because every lead uses a single pair
of positive and negative electrodes. On the other hand, the augmented leads and chest leads
are unipolar leads because they have a single positive electrode with the other electrodes
coupled together electrically to serve as a common negative electrode.
Page 23
11
Figure 2.6.Standard ECG limb leads.
2.5.1. ECG limb leads
ECG limb leads are shown in Figure 2.6. Lead I has the positive electrode on the left arm
and the negative electrode on the right arm, therefore measuring the potential difference
across the chest between the two arms. In this and the other two limb leads, an electrode is
placed on the right leg is used as a reference electrode for recording purposes. Lead II and
lead III are not more different than Lead I. Lead II has the positive electrode which is
placed on the left leg and the negative electrode which is placed on the left arm. Lead III
has the positive electrode o the left leg and the negative electrode on the left arm. These
three bipolar limb leads roughly form on equilateral triangle with the heart at the center tat
is called Einthoven triangle is honour of Willem Einthoven who invented the
electrocardiogram in 1901. Whether the limbs leads are attached to the end of the limb
(wrists or ankles) or at the origin of the limbs (shoulder and upper thigh) makes virtually
no difference in the recording since the limb can be viewed as a wire conductor originating
from a point on the trunk of the body. The electrode located in the right leg is used as a
ground.
Page 24
12
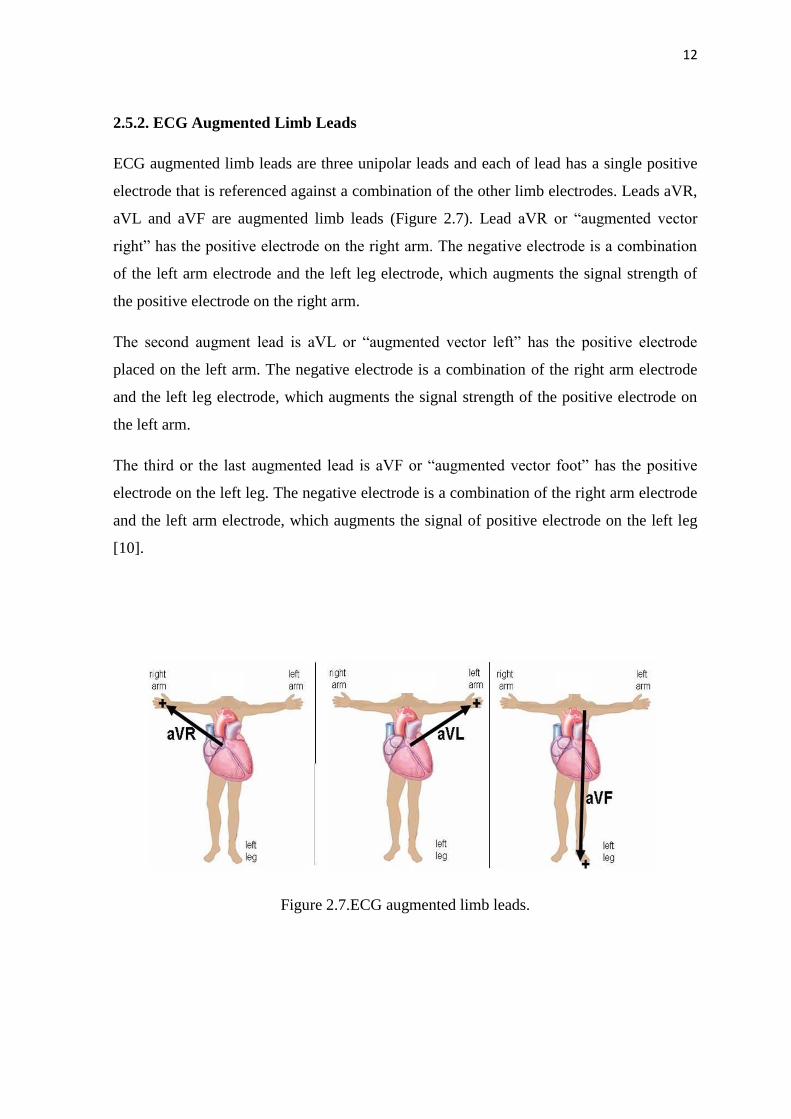
2.5.2. ECG Augmented Limb Leads
ECG augmented limb leads are three unipolar leads and each of lead has a single positive
electrode that is referenced against a combination of the other limb electrodes. Leads aVR,
aVL and aVF are augmented limb leads (Figure 2.7). Lead aVR or “augmented vector
right” has the positive electrode on the right arm. The negative electrode is a combination
of the left arm electrode and the left leg electrode, which augments the signal strength of
the positive electrode on the right arm.
The second augment lead is aVL or “augmented vector left” has the positive electrode
placed on the left arm. The negative electrode is a combination of the right arm electrode
and the left leg electrode, which augments the signal strength of the positive electrode on
the left arm.
The third or the last augmented lead is aVF or “augmented vector foot” has the positive
electrode on the left leg. The negative electrode is a combination of the right arm electrode
and the left arm electrode, which augments the signal of positive electrode on the left leg
[10].
Figure 2.7.ECG augmented limb leads.
Page 25
13
2.5.3. ECG Chest Leads
The precordial leads V1, V2, V3, V4, V5 and V6 are placed directly on the chest. Because
of their close proximity to the heart, they do not require augmentation and these leads are
considered to be unipolar. The precordial leads view the heart’s electrical activity in the so
called horizontal plane. Leads V1, V2 and V3 are referred to as the right precordial leads
and V4, V5 and V6 are referred to as the left precordial leads.
The QRS complex should be negative in lead V1 and positive in lead V6. The QRS
complex should show a gradual transition from negative to positive between leads V2 and
V4. The equiphasic lead is referred t as transition lead. When the transition occurs earlier
than lead V3, it is referred to as a late transition. There should also be a gradual increase in
the amplitude of the R wave between lead V1 and V4. This is known as R wave
progression. Poor R wave progression is a nonspecific finding. It can be caused by
conduction abnormalities, myocardial infarction, cardiomyopathy, and other pathological
conditions.
Figure 2.8.ECG chest leads.
Page 26
14
2.6. Other types of ECG leads.
The electric potentials of the heart can be measured not only from a surface ECG but also
from body cavities adjacent to the heart itself.
2.6.1. Esophageal ECG
The concept of esophageal ECG (Figure 2.9) is not new; some researchers have
demonstrated the usefulness of this approach in the diagnosis of complicated arrhythmias.
The esophageal electrodes are incorporated into an esophageal stethoscope and are welded
to convential ECG wires. A prominent P wave is usually displayed in the presence of atrial
depolarization, and its relation to the ventricular electrical activity can be examined. To
observe a bipolar esophageal ECG, the electrodes are connected to the right and left are
terminals and lead I is selected on the monitor. Several investigators have described
devices that allow both ECG recording from the esophagus and pacing of the heart using
the same device. Esophageal electrodes have been found particularly useful in patients
with emphysema or in critically ill patients in whom satisfactory surface ECG cannot be
obtained.
Figure 2.9.Esophageal ECG wave.
Page 27
15
2.6.2. Intracardiac ECG
For many years, long saline-filled central venous catheters have been used to record
Intracardiac ECG. More recently, Chattarjee, described the use of a modified balloon-
tipped flotation catheter for recording intracavitary ECG. The multipurpose pulmonary
artery catheter that is currently available has all the features of a standard pulmonary artery
catheter. In addition, three atrial and two ventricular electrodes have been incorporated into
the catheter. These electrodes permit recording of intracavitary ECG and the establishment
of atrial or AV pacing. The diagnostic capabilities with this catheter are great because
atrial, ventricular, or AV nodal arryhmias and conduction blocks can be demonstrated. The
large voltages obtained from the intracardiac electrodes are relatively insensitive to
electrocautery interference, thus making them useful for intraaortic balloon pump
triggering. Other pulmonary artery catheters have ventricular and atrial ports that allow
passage of pacing wires. These catheters can also be used for diagnostic purposes, as well
as for therapeutic interventions (pacing) [11].
Figure 2.10.Intracardiac ECG and electrode.
Page 28
16
2.6.3. Endotracheal ECG
The endotracheal ECG allows monitoring of the ECG when it is impractical or impossible
to monitor the surface ECG. The endotracheal ECG consists of a standard endotracheal
tube in which two electrodes have been embedded with nanotechnology. This device may
be most useful for the diagnosis of atrial arrhythmias.
2.6.4. Intracoronary ECG
The clinical use, during angioplasty, of a coronary guide wire for the recording of
intracoronary ECG was first reported during 1985. The major advantage was perceived to
be greater defection of acute ischemia then with surface ECG [12].
2.7. Summary
Heart is the chambered muscular organ in vertebrates that pumps blood received from the
veins in to the arteries, thereby maintaining the flow of blood through the entire circulatory
system. The four valves are located in the heart; the two atrioventricular valves, which are
between the atria and the ventricles, are called as mitral valve and tricuspid valves. The
two other valves are semilunar (SL) valves, which are in the arteries leaving the heart, are
the aortic valve and the pulmonary valve.
Heart conduction system is due to electrical impulses from heart muscles or SA node that
causes the heart to beat. This electrical activity occurring in the ventricles and atrials is
taken with electrodes to transmission to a machine called an ECG machine and this signal
is named as Electrocardiogram, or ECG. ECG signal can be taken from the surface of body
with surface electrodes, but it can also be taken from esophageal, intercoronary,
intercardiac and endotracheal region of the human body with special electrodes.
Page 29
17
CHAPTER 3
THE ECG MACHINE
3.1. Overview
Developments in the medical technologies in the past have contributed to significant
improvements in patients’ care. Partly because of the technological advances, within the
last 20 years the life expectancy has shifted from about 72 years to 80 years, and still
increases. At the same time, the costs of health care have increased due to novel more
expensive medical treatment. The challenges for engineers are to develop new or improve
the methods of preventive care and decrease the costs of instrumentation as well as of
personnel and maintenance. Especially Microsystems technologies offer numerous ways to
generate miniaturized medical systems, since material costs and reliability can be superior
to other technologies. Furthermore, miniaturizing such systems increases the patient
comfort considerably.
Cardiovascular diseases are the main cause of death within the population in the age of 44 -
64 years, and the second most frequent cause of death of people between 24 and 44 years.
In Turkey about 500,000 people suffer from a heart attack annually. An early recognition
of attack symptoms and warning of the patient or doctor would enable preventive actions
to avoid the attack and thus reduce the risk of irreparable damage to organs, or even death.
Monitoring risk groups, such as people who recently were subject to a bypass surgery or
pacemaker implantation, has proven to effectively decrease the number of heart attacks.
Long term recording of ECG (electrocardiogram) is a standard procedure in current cardiac
medicine, but the devices are capable of monitoring the heart function for a time period of
only a few days, whereas much longer recording times are of clinical interest [13]. This
chapter describes the basic principles of the ECG machine.
Page 30
18
3.2. ECG History
The development of the ECG began with the discovery of the electronic potential of living
tissue. This electromotive effect was first investigated by Aloysius Luigi in 1787. Through
his experiments, he demonstrated that living tissues, particularly muscles, are capable of
generating electricity. Afterwards, other scientists studied this effect in electronic potential.
The variation of the electronic potential of the beating heart was observed as early as 1856,
but it was not until Willem Einthoven invented the string galvanometer that a practical,
functioning ECG machine could be made.
The string galvanometer was a device composed of a coarse string that was suspended in a
magnetic field. When the force of the heart current was applied to this device, the string
moved, and these deflections were then recorded on photographic paper. The first ECG
machine was introduced by Einthoven in 1903 (Figure 3.1). It proved to be a popular
device, and large-scale manufacturing soon began soon in various European countries.
Early manufacturers include Edelman and Sons of Munich and the Cambridge Scientific
Instrument Company. The ECG was brought to the United States in 1909 and
manufactured by the Hindle Instrument Company.
Page 31
19
Figure 3.1.Einthoven ECG machine
Improvements to the original ECG machine design began soon after its introduction. One
important innovation was reducing the size of the electromagnet. This allowed the machine
to be portable. Another improvement was the development of electrodes that could be
attached directly to the skin. The original electrodes required the patient to submerge the
arms and legs into glass electrode jars containing large volumes of a sodium chloride
solution. Additional improvements included the incorporation of amplifiers, which
improved the electronic signal, and direct writing instruments, which made the ECG data
immediately available. The modern ECG machine (Figure 3.2) is similar to these early
models, but microelectronics and computer interfaces have been incorporated, making
them more useful and powerful. While these newer machines are more convenient to use,
they are not more accurate than the original ECG built by Einthoven [14].
Figure 3.2.Modern ECG Machine
Page 32
20
3.3. ECG Instrumentation.
Figure 3.3 shows the block diagram of a typical single-channel electrocardiograph. In that
chain it is apparent that all filtering is done in the analog domain, while the
microprocessor, micro controller, or digital signal processing (DSP) is used principally for
communication and other downstream purposes. Thus the powerful computational
properties of the digital core are not readily available to deal with the signal in its
essentially raw state. In addition, sophisticated analog filters can be costly to the overall
design due to their inflexibility- and the space, cost, and power they require.
Figure 3.3.Block diagram of typical single channel ECG circuit.
Electrical activity of the heart is taken from human with electrodes, which are fixed on
specific places on human body. There are many different electrodes types commercially
available. They should have an adhesive area to fix them properly to the skin, clip-on
wires, and a conductive gel, for stable low-noise recording. Active electrodes can also be
used to improve the resolution of the recording.
Page 33
21
Single channel ECG is generally uses three electrodes (three lead configuration) that may
be placed at locations suited to the application. Three pairs of the electrodes are differential
voltage inputs and one serves as a reference. This reference electrode and its associated
circuit offer a large reduction of common mode voltage magnitude by actively reducing the
voltage difference between patient and the ECG amplifier common by means of the so-
called driven right-leg circuit design. This connection is electrically safe for the patient,
which is shown in the Figure 3.3.
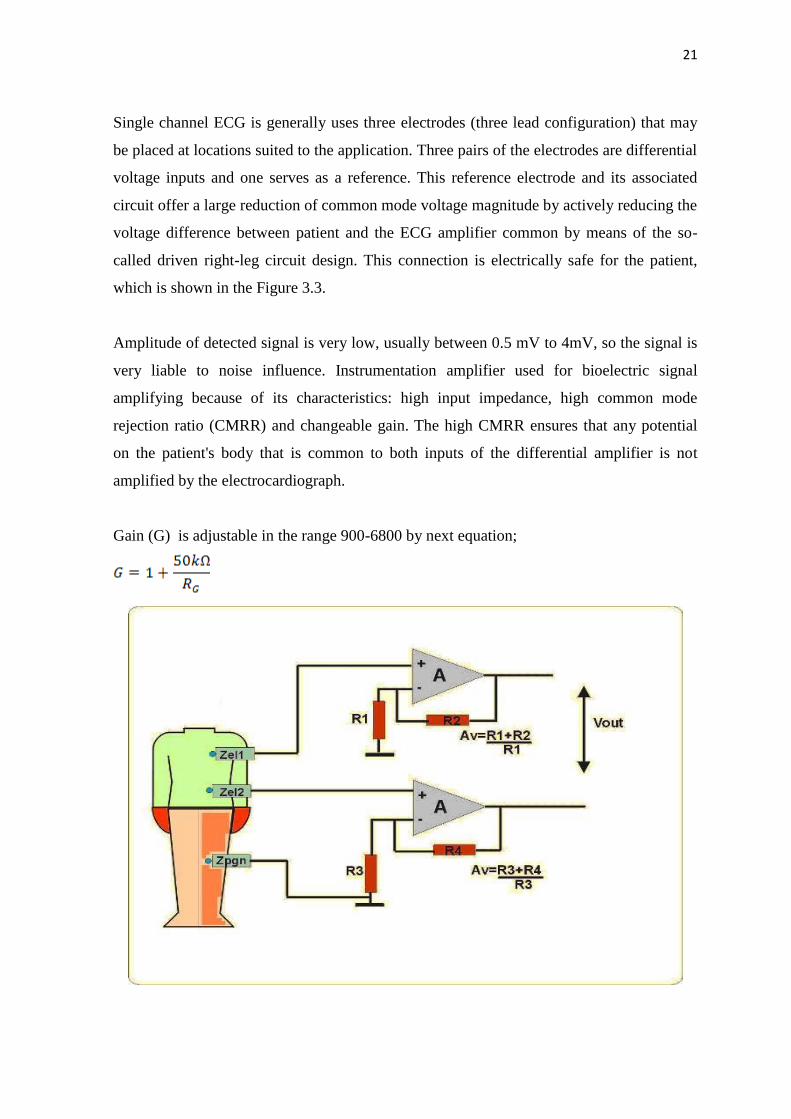
Amplitude of detected signal is very low, usually between 0.5 mV to 4mV, so the signal is
very liable to noise influence. Instrumentation amplifier used for bioelectric signal
amplifying because of its characteristics: high input impedance, high common mode
rejection ratio (CMRR) and changeable gain. The high CMRR ensures that any potential
on the patient's body that is common to both inputs of the differential amplifier is not
amplified by the electrocardiograph.
Gain (G) is adjustable in the range 900-6800 by next equation;
Page 34
22
Figure 3.4.Instrumentation amplifier.
.
ECG signal is liable to following types of noise; baseline wander- low frequency (LF)
noise, which arises from respiration and other physiology actions, power line noise- high
frequency (HF) noise of 50 Hz/60 Hz and muscle noise- arises from action of other
muscles in human body.
Baseline wander noise is eliminated by HP filter. Cutoff frequency of the low pass filter is
equal to the lowest frequency of the slowest heart rate (about 40 bpm). It is about 0.67 Hz,
so the chosen cutoff frequency is 0.5Hz.
3.4 Biopotential electrodes for ECG
Many important human physiological signals are electrical. An electrical connection is
necessary to connect the patient to the device. One of the most common biomedical
sensors is basically an electrode to measure and record potentials and currents in the body.
This seems to be a very simple function, but in fact an electrode recording biopotential is
actually a transducer, converting ionic currents in the body into electronic currents in the
electrode. This transduction function greatly complicates electrode design. To understand
how such electrodes work, we first must discuss some of the basic properties of an
electrode-electrolyte interface.
3.4.1. Electrode-Electrolyte interface
The electrode-electrolyte interface is illustrated Figure 3.5. The electrode only has one type
of charge carrier (electron), whereas the electrolyte has two types of charge carriers (cation
and anion). The direction of current flow is noted in the figure. For charge to cross the
interface, something must happen at the interface since there are no free electrons in the
electrolyte and there are no cations or anions in the electrode.
Page 35
23
Figure 3.5.Electrode-electrolyte interface.
At the interface, charge is exchanged through chemical reactions, which can be
generally represented as:
Where n is the valence of C and m is the valence of A. Note this equation assumes that the
electrode contains some atoms of the same material as the cation and that this material in
the electrode at the interface can become oxidized to from a cation and one or more free
electrons. Similarly, an anion coming to the electrode-electrolyte interface can be oxidized
to a neutral atom, giving off one or more free electrons to the electrode.
To better understand this interaction, consider what happens when we place a piece of
metal into a solution containing ions of that metal. These ions are cations, and the solution
must have an equal number of anions to insure electrical neutrality of the solution. Initially
the cation reaction above goes predominately to the left or right depending on the
concentration of cations in solution and the equilibrium conditions for that particular
reaction. The local concentration of cations in the solution at the interface changes, which
affects the anion concentration as well. The net result is that charge neutrality is not
maintained, and the electrolyte surrounding the metal is at a different electric potential
from the rest of the solution. This is true even when no current flows across the interface.
Page 36
24
A potential difference knows as the half-cell potential is determined by the metal involved,
the concentration of its ions in solution, and the temperature. The standard half cell
potential, E0, is the potential for 1M concentration solution at 25 °C when no current flows
across the interface. This potential can’t be measured in the lab since two electrodes are
needed to make this measurement (i.e., induce a current). To avoid this problem,
electrochemists have adopted the convention that the standard half cell potential is the
potential difference between a particular electrode in 1M solution to a hydrogen electrode
in 1M solution. The hydrogen electrode is based on the reaction
where H2 gas bubbled over a platinum electrode is the source of hydrogen molecules.
3.4.2. Polarization
In normal operation, the potential difference from the standard half-cell potential (i.e., half-
cell potential) is determined primarily by temperature and ionic activity of the electrolyte.
Ionic activity can be defined as the availability of an ionic species to enter into reaction.
This process is often characterized by the reaction rate k.
The reaction rate for a process overcoming an energy barrier ∆G is
Where R is the natural gas constant and T is temperature in °K. For an electrode electrolyte
interface, the energy barrier describes ionic dissociation across the interface. The electrical
energy associated with this energy barrier is simply the product of free charge and the
electrical potential (i.e., half-cell potential). Therefore, the energy barrier DG is related to
the potential as
Page 37
25
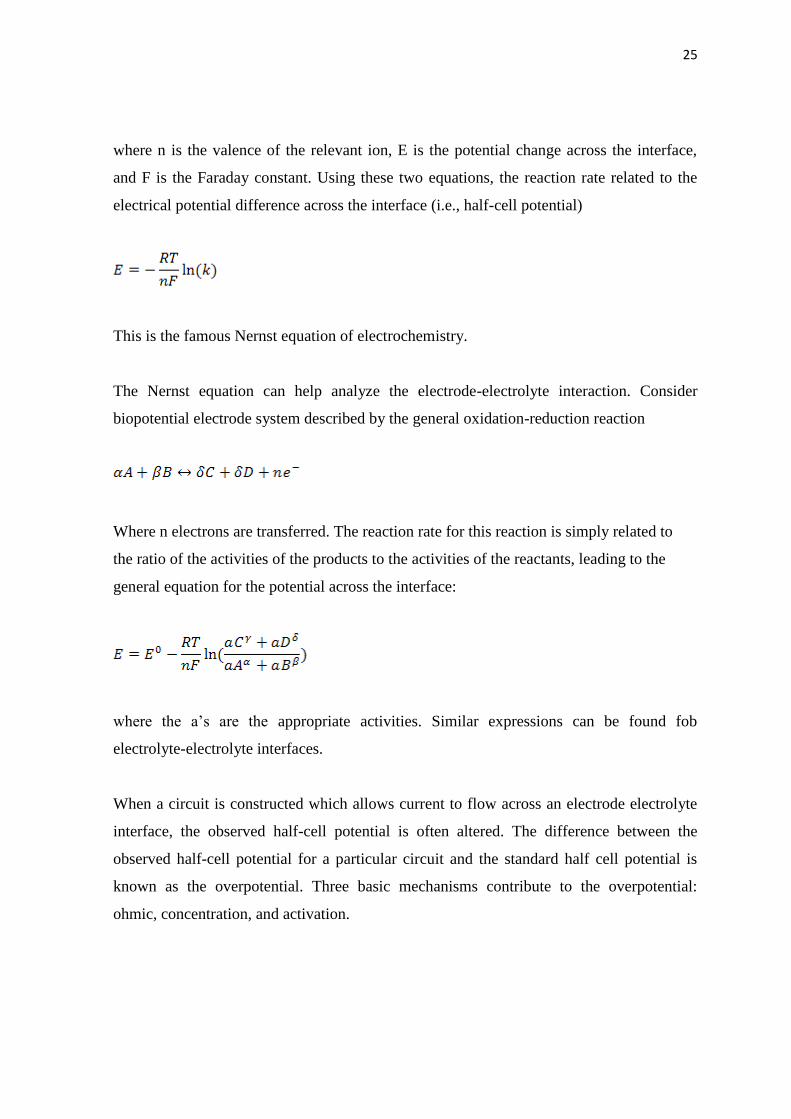
where n is the valence of the relevant ion, E is the potential change across the interface,
and F is the Faraday constant. Using these two equations, the reaction rate related to the
electrical potential difference across the interface (i.e., half-cell potential)
This is the famous Nernst equation of electrochemistry.
The Nernst equation can help analyze the electrode-electrolyte interaction. Consider
biopotential electrode system described by the general oxidation-reduction reaction
Where n electrons are transferred. The reaction rate for this reaction is simply related to
the ratio of the activities of the products to the activities of the reactants, leading to the
general equation for the potential across the interface:
where the a’s are the appropriate activities. Similar expressions can be found fob
electrolyte-electrolyte interfaces.
When a circuit is constructed which allows current to flow across an electrode electrolyte
interface, the observed half-cell potential is often altered. The difference between the
observed half-cell potential for a particular circuit and the standard half cell potential is
known as the overpotential. Three basic mechanisms contribute to the overpotential:
ohmic, concentration, and activation.
Page 38
26
The ohmic overpotential is the voltage drop across the electrolyte itself due to the finite
resistivity of the solution. These ohmic losses need not be linear with current - this is
especially true in low concentration electrolytes. Overall, this is usually not a big voltage in
high concentration solutions.
The concentration overpotential results from changes in ionic concentration near the
electrode-electrolyte interface when current flows. With excess charge due to a finite
current, oxidation-reduction reaction rates at the interface change, altering the equilibrium
concentration of ions - this changes the half-cell potential.
Charge transfer in the oxidation-reduction reaction at the interface is not entirely
reversible. For metal ions to be oxidized, they must overcome an energy barrier. If the
direction of current flow is one way, then either oxidation or reduction dominates, and the
height of the barrier changes. This energy difference produces a voltage between the
electrode and the electrolyte, known as the activation overpotential.
These three polarization mechanisms add, yielding the overpotential of an electrode:
where Vr is the ohmic over potential, Vc is the concentration over potential, and Va is the
activation over potential. Note that over potentials impede current flow across the
interface.
3.4.3 Electrical Characteristics
The electric characteristics of biopotential electrodes are generally nonlinear and a function
of the current density at their surface. Thus, having the devices represented by linear
models requires that they be operated at low potentials and currents. Under these idealized
conditions, electrodes can be represented by an equivalent circuit of the form shown in
Figure 3.6. In this circuit Rd and Cd are components that represent the impedance
associated with the electrode–electrolyte interface and polarization at this interface. Rs is
Page 39
27
the series resistance associated with interfacial effects and the resistance of the electrode
materials themselves.
The battery Ehc represents the half-cell potential described above. It is seen that the
impedance of this electrode will be frequency dependent, as illustrated in Figure 3.6. At
low frequencies the impedance is dominated by the series combination of Rs and Rd,
whereas at higher frequencies Cd bypasses the effect of Rd so that the impedance is now
close to Rs. Thus, by measuring the impedance of an electrode at high and low frequencies,
it is possible to determine the component values for the equivalent circuit for that
electrode.
Figure 3.6.The equivalent circuit for a biopotential electrode.
Page 40
28
Figure 3.7.An example of biopotential electrode impedance as a function of frequency.
Table 3.1.The effect of electrode properties on electrode impedance
Property Change in Property Changes in electrode impedance
Surface area ↑ ↓
Polarization ↑ ↑ At low frequency
Surface Roughness ↑ ↓
Radius of curvature ↑ ↓
Surface Contamination ↑ ↑
↑- Increase in Quantity ↓-Decrease in property.
The electrical characteristics of electrodes are affected by many physical properties of
these electrodes. Table 3.1 lists some of the more common physical properties of
electrodes and qualitatively indicates how these can affect electrode impedance.
3.4.4. Practical Electrodes for Biomedical Measurements
Many different forms of electrodes have been developed for different types of biomedical
measurements. To describe each of these would go beyond the constraints of this article,
but some of the more commonly used electrodes are presented in this section. The reader is
referred to the monograph by Geddes for more details and a wider selection of practical
electrodes.
3.4.4.1. Body-Surface Biopotential Electrodes
This category includes electrodes that can be placed on the body surface for recording
bioelectric signals. The integrity of the skin is not compromised when these electrodes are
applied, and they can be used for short-term diagnostic recording such as taking a clinical
electrocardiogram or long-term chronic recording such as occurs in cardiac monitoring.
Page 41
29
3.4.4.1.1. Metal Plate Electrodes
The basic metal plate electrode consists of a metallic conductor in contact with the skin
with a thin layer of an electrolyte gel between the metal and the skin to establish this
contact. Examples of metal plate electrodes are seen in Figure 3.8. Metals commonly used
for this type of electrode include German silver (a nickel–silver alloy), silver, gold, and
platinum.
(a) (b) (c)
Figure 3.8.Metal plate electrode a) schematic b) picture c) disposable metal type.
Sometimes these electrodes are made of a foil of the metal so as to be flexible, and
sometimes they are produced in the form of a suction electrode (Figure 3.9) to make it
easier to attach the electrode to the skin to make a measurement and then move it to
another point to repeat the measurement. These types of electrodes are used primarily for
diagnostic recordings of biopotentials such as the electrocardiogram or the
electroencephalogram.
Page 42
30
Figure 3.9.Suction type electrode for ECG.
3.4.4.2 Electrodes for Chronic Patient Monitoring
Long-term monitoring of biopotentials such as the electrocardiogram as performed by
cardiac monitors places special constraints on the electrodes used to pick up the signals.
These electrodes must have a stable interface between them and the body, and frequently
nonpolarizable electrodes are, therefore, the best for this application. Mechanical stability
of the interface between the electrode and the skin can help to reduce motion artifact, and
so there are various approaches to reduce interfacial motion between the electrode and the
coupling electrolyte or the skin. Figure 3.10 is an example of one approach to reduce
motion artifact by recessing the electrode in a cup of electrolytic fluid or gel. The cup is
then securely fastened to the skin surface using a double-sided adhesive ring. Movement of
the skin with respect to the electrode may affect the electrolyte near the skin–electrolyte
interface, but the electrode–electrolyte interface can be several millimeters away from this
location, since it is recessed in the cup. The fluid movement is unlikely to affect the
recessed electrode–electrolyte interface as compared to what would happen if the electrode
was separated from the skin by just a thin layer of electrolyte.
Page 43
31
Figure 3.10.Recessed electrode types.
The advantages of the recessed electrode can be realized in a simpler design that lends
itself to mass production through automation. This results in low per-unit cost so that these
electrodes can be considered disposable. Figure 3.11.a illustrates such an electrode in cross
section. The electrolyte layer now consists of an open-celled sponge saturated with a
thickened (high-viscosity) electrolytic solution. The sponge serves the same function as the
recess in the cup electrodes and is coupled directly to a silver–silver chloride electrode.
Frequently, the electrode itself is attached to a clothing snap through an insulating-
adhesive disk that holds the structure against the skin. This snap serves as the point of
connection to a lead wire. Many commercial versions of these electrodes in various sizes
are available, including electrodes with a silver–silver chloride interface or ones that use
metallic silver as the electrode material. A modification of this basic monitoring electrode
structure is shown in Figure 3.11.b In this case the metal electrode is a silver foil with a
surface coating of silver chloride. The foil gives the electrode increased flexibility to fit
more closely over body contours. Instead of using the sponge, a hydrogel film (really a
sponge on a microscopic level) saturated with an electrolytic solution and formed from
materials that are very sticky is placed over the electrode surface. The opposite surface of
Page 44
32
the hydrogel layer can be attached directly to the skin, and since it is very sticky, no
additional adhesive is needed. The mobility and concentration of ions in the hydrogel layer
is generally lower than for the electrolytic solution used in the sponge or the cup. This
results in an electrode that has a higher source impedance as compared to these other
structures. An important advantage of this structure is its ability to have the electrolyte
stick directly on the skin. This greatly reduces interfacial motion between the skin surface
and the electrolyte, and hence there is a smaller amount of motion artifact in the signal.
This type of hydrogel electrode is, therefore, especially valuable in monitoring patients
who move a great deal or during exercise.
Figure 3.11.Examples of different skin electrodes. a) disposable electrode with electrolyte-
impregnated sponge b) disposable hydrogel electrode c) Thin film electrode d) carbon-
filled elastomeric dry electrode.
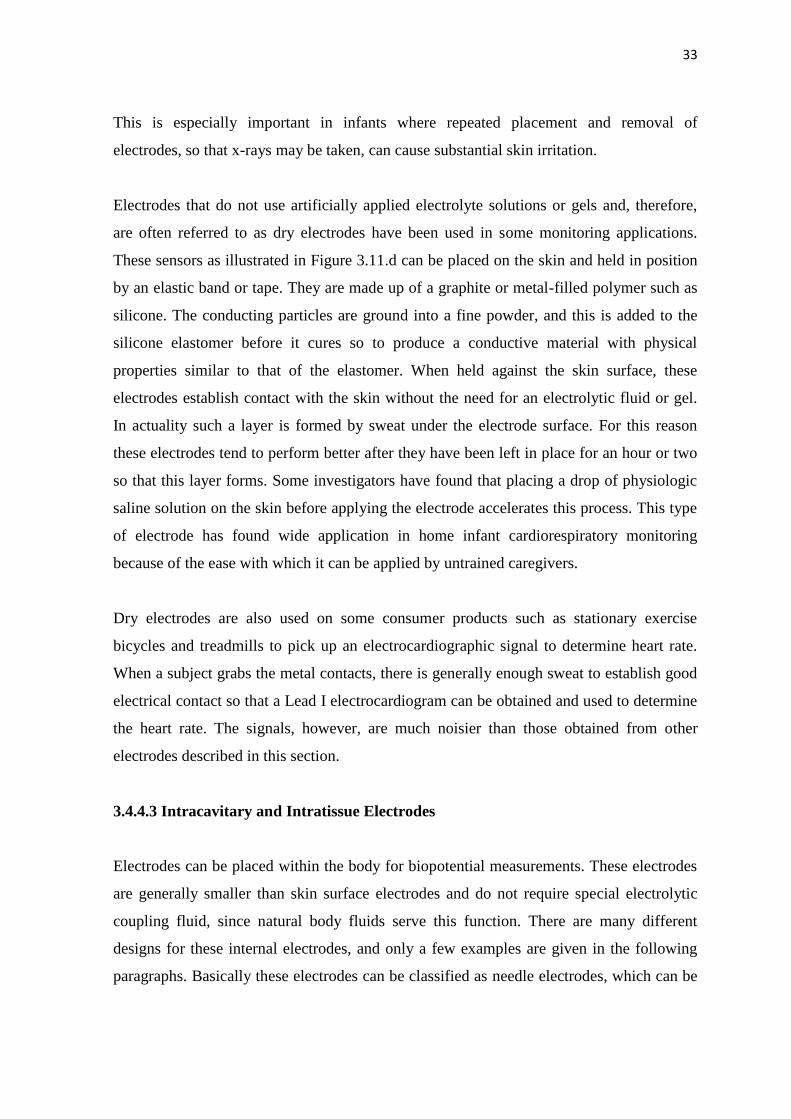
Thin-film flexible electrodes such as shown in Figure 3.11.c have been used for monitoring
neonates. They are basically the same as the metal plate electrodes; only the thickness of
the metal in this case is less than a micrometer. These metal films need to be supported on
a flexible plastic substrate such as polyester or polyimide. The advantage of using only a
thin metal layer for the electrode lies in the fact that these electrodes are x-ray transparent.
Page 45
33
This is especially important in infants where repeated placement and removal of
electrodes, so that x-rays may be taken, can cause substantial skin irritation.
Electrodes that do not use artificially applied electrolyte solutions or gels and, therefore,
are often referred to as dry electrodes have been used in some monitoring applications.
These sensors as illustrated in Figure 3.11.d can be placed on the skin and held in position
by an elastic band or tape. They are made up of a graphite or metal-filled polymer such as
silicone. The conducting particles are ground into a fine powder, and this is added to the
silicone elastomer before it cures so to produce a conductive material with physical
properties similar to that of the elastomer. When held against the skin surface, these
electrodes establish contact with the skin without the need for an electrolytic fluid or gel.
In actuality such a layer is formed by sweat under the electrode surface. For this reason
these electrodes tend to perform better after they have been left in place for an hour or two
so that this layer forms. Some investigators have found that placing a drop of physiologic
saline solution on the skin before applying the electrode accelerates this process. This type
of electrode has found wide application in home infant cardiorespiratory monitoring
because of the ease with which it can be applied by untrained caregivers.
Dry electrodes are also used on some consumer products such as stationary exercise
bicycles and treadmills to pick up an electrocardiographic signal to determine heart rate.
When a subject grabs the metal contacts, there is generally enough sweat to establish good
electrical contact so that a Lead I electrocardiogram can be obtained and used to determine
the heart rate. The signals, however, are much noisier than those obtained from other
electrodes described in this section.
3.4.4.3 Intracavitary and Intratissue Electrodes
Electrodes can be placed within the body for biopotential measurements. These electrodes
are generally smaller than skin surface electrodes and do not require special electrolytic
coupling fluid, since natural body fluids serve this function. There are many different
designs for these internal electrodes, and only a few examples are given in the following
paragraphs. Basically these electrodes can be classified as needle electrodes, which can be
Page 46
34
used to penetrate the skin and tissue to reach the point where the measurement is to be
made, or they are electrodes that can be placed in a natural cavity or surgically produced
cavity in tissue. Figure 3.12 illustrates some of these internal electrodes.
A catheter tip or probe electrode is placed in a naturally occurring cavity in the body such
as in the gastrointestinal system. A metal tip or segment on a catheter makes up the
electrode. The catheter or, in the case where there is no hollow lumen, probe, is inserted
into the cavity so that the metal electrode makes contact with the tissue. A lead wires down
the lumen of the catheter or down the center of the probeconnects the electrode to the
external circuitry.
Figure 3.12.Examples of different internal electrodes. (a) Catheter or probe electrode (b)
needle electrode (c) coaxial needle electrode (d) coiled wire electrode
Page 47
35
The basic needle electrode shown in Figure 3.12.b consists of a solid needle, usually made
of stainless steel, with a sharp point. An insulating material coats the shank of the needle
up to a millimeter or two of the tip so that the very tip of the needle remains exposed.
When this structure is placed in tissue such as skeletal muscle, electrical signals can be
picked up by the exposed tip. One can also make needle electrodes by running one or more
insulated wires down the lumen of a standard hypodermic needle. The electrode as shown
in Figure 3.12.c is shielded by the metal of the needle and can be used to pick up very
localized signals in tissue.
Fine wires can also be introduced into tissue using a hypodermic needle, which is then
withdrawn. This wire can remain in tissue for acute or chronic measurements. Caldwell
and Reswick and Knutson et al. have used fine coiled wire electrodes in skeletal muscle for
several years without adverse effects.
The advantage of the coil is that it makes the electrode very flexible and compliant. This
helps it and the lead wire to endure the frequent flexing and stretching that occurs in the
body without breaking.
The relatively new clinical field of cardiac electrophysiology makes use of electrodes that
can be advanced into the heart to identify aberrant regions of myocardium that cause life
threatening arrhythmias. These electrodes may be similar to the multiple electrode probe or
catheter shown in Figure 3.12.a or they might be much more elaborate such as the
“umbrella” electrode array in Figure 3.12.d In this case the electrode array with multiple
electrodes on each umbrella rib is advanced into the heart in collapsed form through a
blood vessel in the same way as a catheter is passed into the heart. The umbrella is then
opened in the heart such that the electrodes on the ribs contact the endocardium and are
used to record and map intracardiac electrocardiaogram. Once the procedure is finished,
the umbrella is collapsed and withdrawn through the blood vessel. A similar approach can
be taken with an electrode array on the surface of a balloon. The collapsed balloon is
advanced into one of the chambers of the heart and then distended. Simultaneous
recordings are made from each electrode of the array, and then the balloon is collapsed and
withdrawn.
Page 48
36
3.4.4.4. Microelectrodes
The electrodes described in the previous paragraphs have been applied to studying
bioelectric signals at the organism, organ, or tissue level but not at the cellular level. To
study the electric behaviour of cells, electrodes that are themselves smaller than the cells
being studied need to be used. Three types of electrodes have been described for this
purpose: etched metal electrodes, micropipette electrodes, and metal-film-coated
micropipette electrodes. The metal microelectrode is essentially a sub miniature version of
the needle electrode described in the previous section (Figure 3.13.a). In this case, a strong
metal wire such as tungsten is used. One end of this wire is etched electrolytically to give
tip diameters on the order of a few micrometers. The structure is insulated up to its tip, and
it can be passed through the membrane of a cell to contact the cytosol. The advantage of
this type of electrode is that it is both small and robust and can be used for
neurophysiologic studies. Its principal disadvantage is the difficulty encountered in its
fabrication and high source impedance [15].
Figure 3.13.Microelectrodes a) metal b) micropipette c) thin metal film on pipette.
Page 49
37
The second and most frequently used type of microelectrode is the glass micropipette. This
structure, as illustrated in Figure 3.14.b consists of a fine glass capillary drawn to a very
narrow point and filled with an electrolytic solution. The point can be as narrow as a
fraction of a micrometer, and the dimensions of this electrode are strongly dependent on
the skill of the individual drawing the tip. The electrolytic solution in the lumen serves as
the contact between the interior of the cell through which the tip has been impaled and a
larger conventional electrode located in the shank of the pipette. These electrodes also
suffer from high source impedances and fabrication difficulty.
A combined form of these two types of electrodes can be achieved by depositing a metal
film over the outside surface of a glass micropipette as shown in Figure 3.14.c. In this case,
the strength and smaller dimensions of the micropipette can be used to support films of
various metals that are insulated by an additional film up to a point very close to the actual
tip of the electrode structure. These electrodes have been manufactured in quantity and
made available as commercial products. Since they combine the features of both the metal
and the micropipette electrodes, they also suffer from many of the same limitations. They
do, however, have the advantage of flexibility due to the capability of being able to make
films of different metals on the micropipette surface without having to worry about the
strength of the metal, as would be the case if the metal were used alone [16].
3.5. Summary
An electrocardiograph is a device that measures and records the electrocardiogram (ECG),
the electrical activity generated by the heart. Electrodes placed on special locations on the
body help conduct the ECG to the electrocardiograph. The electrical current generated by
the heart is conducted through the pairs of electrodes and leads, and is amplified, recorded,
and processed by the electrocardiograph. Each electrode is special to take signal from body
according to location of body such as microelectrode. The different features and modules
of a typical electrocardiograph include the protection circuitry, preamplifier, memory
system, micro controller and communication module.
Page 50
38
The protection circuit prevents any damage due to high voltages that may appear as inputs
to the electrocardiograph. The preamplifier stage consists of a different amplifier with a
high CMRR (Common mode rejection ratio). The high CMRR ensures that any potential
on the patient’s body that is common to both inputs of the differential amplifier is not
amplified by the electrocardiograph.
The input of the driver amplifier circuitry is ac-coupled and this prevents the output of
further amplifier stages from saturating due to the offset in the input signal. The ECG is
then filtered with an upper corner frequency (3 dB) of 150 Hz and amplified sufficiently so
that it can be recorded. Modern electrocardiographs include an analog-to-digital converter
(ADC) to digitize the signal. Data segments of the ECG from each lead, and other relevant
information of the patient can be stored in memory. A microcomputer in the
electrocardiograph also enables the operator to select leads to record, process ECG signals,
perform preliminary arrhythmia analysis and other related tasks.
Page 51
39
CHAPTER 4
PULSE OXIMETRY
4.1. Overview
Pulse oximetry or SPO2 is a non-invasive method allowing the monitoring of the
oxygenation of patients’ haemoglobin level in the blood and in addition calculating heart
rate. Therefore, pulse oximeters are generally used for this purpose, as well as it is integral
part of numerous medical procedures, including patient monitoring in the operating room
and intensive care situations, pulmonary evaluations, and neonatal diagnoses, oral
surgeries, and the use of general anesthesia.
In a pulse oximeter system, a clip with optical electronics is usually attached to finger, toe,
or ear so that light can be transmitted through the skin from one side of the clip and
received on the other side with a photodiode. Good arterial blood flow is required to
measured oxygen saturation with haemoglobin cells. Generally, most of pulse oximeter
applications use optical techniques such as led and infra-red (IR) system.
4.2. Principles of Pulse Oximetry
A typical Pulse Oximeter uses the basic principle of a pair of small LEDs operating at two
different wavelengths; one red LED with a wavelength of 660nm, the other, an infrared
LED with a wavelength of 910nm. The LEDs are designed to be placed opposite a
photodiode that detects the light from the LEDs. Absorption on each wavelength differs
significantly for the oxyhaemoglobin and deoxygenated haemoglobin. Therefore from the
difference of the absorption of the red and infrared light the ratio between
oxy/deoxyhaemoglobin can be calculated. As the amount of blood in the capillaries
depends on the actual blood pressure, which varies around the heart pulse cycle, the heart
rate can also be measured.
Haemoglobin (Figure 4.1) is an active oxygen carrying part of the red cells which is a
compound of iron and four polypeptide chains. Each chain is linked to one atom of iron,
each of which can carry four molecules of oxygen. Each molecule of oxygen has two
atoms of oxygen so each haemoglobin molecule can carry eight atoms of oxygen.
Page 52
40
Oxyhaemoglobin refers to oxygen carrying haemoglobin and deoxygenated haemoglobin
refers to nonoxygenated haemoglobin. If all haemoglobin molecules bonded with an
oxygen molecule , the total body of haemoglobin is said to be fully saturated (100%
saturation). When haemoglobin unloads the oxygen molecule to tissue cells at capillary
levels, the saturation progressively decreases and the normal venous saturation is about
75%. The normal saturation level is said to be between 87-97%.
Figure 4.1.Haemoglobin and Oxygen transportation.
The two wavelengths are selected for the reason that deoxygenated haemoglobin has a
higher absorption at around 660nm and at 910nm oxygenated haemoglobin has the higher
absorption. The oxygenated haemoglobin allows red light to transmit through and absorbs
more infrared light while the deoxygenated haemoglobin allows infrared to transmit
through and absorbs more red light.
Page 53
41
Figure 4.2.Absorption coefficient for two types.
Generally a finger is placed between the source (LEDs) and the receiver (photodiode)
acting as a translucent site with good blood flow. Once these absorption levels are detected
from the finger the ratio of absorption at different wavelengths can be obtained.
Figure 4.3.Schematic of finger pulse oximeter idea.
Page 54
42
The normal pulse oximeter waveform is shown in Figure 4.4. Red and infrared signals are
modulated by the cycling blood volume in perfuse tissues. At high saturation of oxygen
(SaO2), the red pulse amplitude (AC/DC where is AC is the alternating component and DC
is the average component) is smaller than in the infrared while the relative amplitudes are
reversed at low saturation. Note the signal shape is inverted from a blood pressure
waveform. The incremental increase in the tissue blood concentration at systole results in
less light reaching the photo detector than at systole [17].
Figure 4.4.Normal detected light signal in Red and infrared for SpO2.
Haemoglobin bound to oxygen called oxygenated haemoglobin (HbO2) and Haemoglobin
not bound to oxygen is called deoxygenated haemoglobin (Hb). The oxygen saturation is
the ratio of the oxygenated haemoglobin to the haemoglobin in the blood, as defined by the
following equation.
Where C(Hb)=Concentration of deoxygenated haemoglobin.
=Concentration of oxygenated haemoglobin.
Page 55
43
4.3. History of Pulse Oximetry
Oximetry is the measurement of transmitted light through a translucent measuring site to
determine a patient’s oxygen status noninvasively. Oximetry measurements can be traced
to the early 1930’s when German investigators used spectrophotometers (instrument that
measure different wavelengths and intensities of light) to research light transmission
through human skin. In 1934, one investigator reported measuring oxygen saturation in
blood flowing through closed vessels in animals.
In 1939, German researchers showed the use of an oxygen meter that used red and infrared
light to compensate for changes in tissue thickness, blood content, light intensities and
other variables. After three years then, a British researcher, Millikan, used two
wavelengths of light to produce a practical, lightweight aviation finger oxygen meter for
which he coined the word oximeter. He noted that light transmitted through a red filter
was oxygen-saturation-sensitive and light passing through a green filter was independent
of oxygen saturation. It was later determined that oxygen insensitive signals were-not due
to the green light filter but instead to infrared light.
Following to ground work of the early scientist; wood and Shaw further developed the
principles of the pulse oximeter during 1940 to 1964. In 1972, Takuo Aoyagi, a Japanese
bio-engineer, invented the pulse oximeter after measuring oxygen saturation by sending
light through the tissues. In the late 1970’s, Biox corporation in Colorado made significant
advances in pulse Oximetry, 2 wavelength measurements. They first introduced the use of
Light Emitting Diodes (LED’s) for the red and infrared light sources [18].
Since the early 1980’s, this non-invasive method of monitoring the arterial oxygen
saturation level in patient’s blood has become a standard method in the clinical
environment because of its simple application and the high value of the information it
provides. Before the advent of pulse Oximetry, the common practice was to draw blood
from patients and analyse the samples at regular intervals- several times a day, or even
several times an hour- using large hospital laboratory equipment. The most common pulse
oximeters still use the 2-wavelength method of light transmission. A big advantage of
small fingertip pulse oximeters today is their small size, recording capability and computer
Page 56
44
connectivity capability. A new generation pulse Oximetry is shown in Figure 4.5 which is
used in hospital.
Figure 4.5.Browse hand held Pulse Oximetry [19].
4.4. Pulse oximeter instrumentation
A basic block diagram of circuit for a pulse oximeter is shown in figure 4.6.
Figure 4.6.Block diagram of Finger tip pulse oximeter [20].
Page 57
45
In order to build finger (or earlobe) probes which are small and unobtrusive, we need
miniature light sources and detectors. LEDs which work in the red and Near-Infrared
(NIR) part of the spectrum are readily available. However, the average power which can be
obtained from standard LEDs is limited and a very sensitive detector (such as a
photomultiplier tube) would be required to detect the small amount of light transmitted
through the finger.
This problem can be overcome by using special- purpose LEDs which have been
developed: red LEDs are now manufactured with internal lensing systems to give high
intensity outputs. Similarly, high current NIR LEDs are designed to be pulsed so that the
peak power available from them can be increased without increasing the average power.
This makes it possible to detect the light transmitted through the finger with a simple,
compact, solid-state photodetector such as photodiode.
If we pulse both light sources, we can then use a single photodetector in the finger probe,
since silicon devices are responsive to light having visible and NIR wavelengths. We
could, for example, use timing circuits to supply, say, 50µs pulses to the red and NIR LED
drivers at a repetition rate of 1 kHz, as shown Figure 4.7.
Figure 4.7.Timing signals for the LED drivers such as red and infrared.
In this mode of operation, high-intensity light outputs can be obtained with the NIR LED
with currents of up to 1A over a low duty cycle. The transmitted light detected by the
photodiode is amplified and converted. At this point in the circuit the signal is fed to two
identical sections, one for each of the transmitted wavelengths.
Page 58
46
Since the light is pulsed, we need to use a sample-and-hold circuit to reconstitute the
waveforms at each of the two wavelengths. The same timing circuits which were used to
control the red and NIR LED drivers are also used to provide the control pulses for the
corresponding sample-and-hold circuits. The output from these circuits is then filtered with
a band-pass filter (with 0.5 Hz and 10 Hz cut-off frequencies) in order to remove primarily
the DC component but also high frequency noise. The resulting signals thus represent the
cardiac-synchronous information in the waveforms and these are further amplified before
they are converted to digital format for subsequent analysis by the microprocessor [21].
4.5. Summary
A pulse oximeter measures the amount of oxygen in a patient’s blood by in patient’s blood
by sensing the amount of light absorbed by the blood in capillaries under the skin in human
blood. In a typical device, a sensing probe is attached to the patient’s finger with a spring-
loaded clip or an adhesive band. On one side of the probe is a pair of Light - Emitting
diodes (LEDs) and on the other side is a photodiode. One of the LEDs produces red light
and the other produces infrared light. Pulse Oximetry depends on the optical characteristics
of haemoglobin, the blood protein carries oxygen. When haemoglobin is more highly
oxygenated, it becomes more transmissive to red light and more absorptive to infrared
light. When haemoglobin contains little oxygen, it becomes relatively more transmissive to
infrared, and more absorptive to red light. This property means that by measuring the ratio
of red light to infrared light passing through the patient’s finger, the probe can produce a
signal proportional to the amount of oxygen in blood. In addition, the surge of blood on
each heart beat generates a signal representative of the patient’s pulse rate.
Page 59
47
CHAPTER 5
MEDICAL TELEMETRY SYSTEMS
5.1. Overview
Medical Telemetry is a method of measuring biological parameters from a distance. It is in
fact modification of existing methods of measuring physiological variables to a method of
transmission of resulting data. The transmission of data from the point of generation to the
point of reception can be done in various ways. In medical telemetry, the measurements as
analog signals in suitable form are transmitted which are received and decoded as actual
measurements at the receiving end. A medical telemetry system basically consists of
transmitter and receiver or decoder.
5.2. General Description of Medical Telemetry.
Medical Telemetry is the wireless transmission of automatically measured physiological
data from the point of sensing to a remote location. Medical Telemetry is a vital constituent
in the field of medical sciences. Use of wires to transmit data may be eliminated by
wireless technology. Medical Telemetry, using wireless diagnosis, can monitor
electronically the symptoms and movement of patients. In medical telemetry we transmit
the measured signal to a remote place by means of a medium for communication. A radio
wave is a typical example of the medium.
Figure 5.1.Block diagram of Medical telemetry system.
Page 60
48
The essential blocks of a medical telemetry system are shown in Figure 5.1. Any quantity
that can be measured in the biomedical field is adaptable to medical telemetry system.
Bioelectrical parameters include measurements like electrocardiogram (ECG),
electromiyogram (EMG), and Electroencephalogram (EEG). In the medical telemetry
system biological parameters is taken from human body with transducers. Transducer is a
substance or device, such as piezoelectric cell, electrodes, thermocouple, thermistor,
convert biological variables into an electrical signal. Parameters are measured as the
variation of resistance, capacitance and inductance. The signal conditioner amplifies and
modifies this signal for effective transmission. Transmission line connects the signal input
blocks to the read-out device by wire or wireless means.
5.3. Brief History of Medical Telemetry Systems.
In the early days of human space flight, National American Space Association (NASA)
utilized medical telemetry to provide biomedical data from orbiting astronauts to medical
personnel at the NASA Johnson Space Center (Manned Space Flight enter in the early
1960’s). Biomedical data transmitted to Earth from space included astronauts heart rate,
body temperature, ECG, Oxygen ( ) and carbon dioxide ( ) concentration. Further
research and technology from NASA was instrumental in driving telemetry and medical
telemetry into civil health care.
Distance medicine has been around for most of this century. In the early days, doctors
treated patients in remote locations via wireless radio and by sending diagnostic samples
through the mail. Today, communication is done digitally, and it is called medical
telemetry. On an extended space flight, the need to consult, diagnose and deliver effective
medical care when the doctor is far away from the patients is crucial. Scientists are
developing hardware and software to facilitate this process.
Page 61
49
5.4. Types of Medical Telemetry Systems
5.4.1. Single Channel Medical Telemetry Systems.
Electrocardiogram is the most commonly monitored medical condition sent by wireless
telemetry. It is known that monitoring of the ECG and cardiac rate gives sufficient
information on the loading of the cardiovascular system.
Figure 5.2 shows the block diagram of a single channel telemetry system suitable for
transmission of electrocardiogram. The telemetry transmitter which consist of ECG
amplifier, sub-carrier oscillator and UHF transmitter along with dry cell batteries.
Telemetry Receiver, consisting of a high frequency unit and a demodulator, to which an
electrocardiograph can be connected to record, a cardioscope to display and a magnetic
tape recorder to store ECG. A heart rate meter with an alarm facility can be provided to
monitor continually beat-to-beat heart rate of subject.
Figure 5.2.Block diagram of a single channel telemetry system.
Some ECG telemetry systems operate in the 450-470 MHz band, which is well-suited for
transmission within a hospital and has the advantage of having a large number of channels
available.
Page 62
50
5.4.2. Multi channel medical telemetry systems
Medical measuring problems often involve the simultaneous transmission of several
parameters. For this type of application, multi-channel telemetry system is employed.
Multi-channel telemetry is particularly useful in athletic training programs as it offers the
possibility of surveying simultaneously several physiological parameters of the person
monitored.
With appropriate preamplifiers, the multi channel systems permit the transmission of the
following parameters simultaneously depending upon the number of channels required,
ECG and heart rate, respiration rate, temperature, intravascular and intra-cardiac blood
pressure.
In multichannel telemetry, the number of subcarriers used is the same as the number of
signals to be transmitted. Each channel therefore has its own modulator. The RF unit-the
same for all channels-converts the mixed frequencies into the transmission band. Similarly,
the receiver unit contains the RF unit and one demodulator for each channel. Pulse width
modulation is better suited for multichannel biotelemetry systems. Such systems are
insensitive to carrier frequencies shifts and have high noise immunity. FM-FM system for
similar use, though may have low power consumption and high base line stability, they are
more complicated and turn out to be more expensive. They can be troubled by interference.
Figure 5.2.FM-FM modulated radio telemetry transmitter for ECG.
Page 63
51
5.5. Summary
Medical telemetry is defined as a way to transmit data electronically from one point to
another. In the medical telemetry system, machines record electronic data related to each
patient. Specific body functions are measured using transducers, which convert biological
variables into electrical signals. These signals are amplified using suitable instrumentation
amplifiers. Then, the signal is converted into digital form and sent using a wireless
transmitter. The receiving system receives the signals with an antenna, converts them into
suitable form and then displays them. Telemetry systems can be singles a multichannel. In
the single telemetry systems, one signal is sent, where in multichannel systems, more than
one signal is sent.
,
Page 64
52
CHAPTER 6
DESIGN OF A MEDICAL TELEMETRY SYSTEM
6.1. Overview
Electrocardiogram and oxygen saturation level in blood are very crucial for human life. For
this reason, in emergency conditions, these parameters must be sent very quickly as every
second is very important to patient’s life. Therefore, Medical Telemetry is used for sending
these parameters or other biological parameters. This chapter describes the medical
telemetry system designed and developed by the author.
6.2. Medical Telemetry System.
The block diagram of the medical telemetry system designed and developed by the author
is shown in Figure 6.1.
Figure 6.1.Block diagram of medical telemetry design system.
Page 65
53
In the medical telemetry system, two biological parameters were measured such as ECG
and oxygen saturation level (pulse Oximetry) in blood. This system was designed of two
parts like hardware and software.
Medical telemetry system hardware includes two main components: microcontroller unit
and serial Ethernet board, used for taking biological parameters from the patient as
electrical signals and then sending the digital data over the Ethernet.
The measurement system was designed to obtain ECG and and these signals.
Transmitter system consists of ECG and measurement circuit board which takes
signals from the human body. Transmitter system consists of three parts such as ECG
measurement unit, pulse oximeter system, and Ethernet system. Firstly, ECG measurement
system was designed and its block diagram is shown in the Figure 6.2.
Figure 6.2.Block diagram of the designed ECG measurement system.
Page 66
54
6.2.1. The ECG Measurement System
The ECG measurement system circuit diagram is shown in the Figure 6.3. SMPS power
supply was used to protect patient from short circuit with an isolation amplifier. Electrical
activity of heart was obtained from the skin on human body (right arm (RA), left arm (LA)
and right leg) with suction type electrodes. ECG electrodes were placed as standard limb
and were connected to the instrumentation amplifier with three electrodes and one ground
line.
Figure 6.3.ECG measurement system circuit diagram.
INA128 (Appendix A) was selected and used as the instrumentation amplifier because it
has very low input voltage operation (a several µV), high CMRR (120dB) and low output
resistance. In the INA128 instrumentation amplifier, input resistor was selected as 25Ω and
then gain was calculated using the formula given below (see the datasheet);
And as dB,
Page 67
55
Right leg driver circuit was used to eliminate interference noise by actively cancelling the
interference. The output of the ECG signal from INA128P, which includes electrical
noise, can be seen in Figure 6.4.
Figure 6.4.The output ECG signal from INA128KP
Signal filtering is necessary to help isolate the frequencies found in the ECG signal from
the noise. With three lead systems, the majority of the noise comes from the electrical
activity in the muscles on the arm, or electromyography (EMG) noise. EMG signals are
present in a wide frequency band which overlaps with the ECG signal in the lower
frequencies. For this reason, it is impossible to completely remove EMG noise from the
ECG signal. Therefore, it was helpful for the patients relax and remain still while the data
was being collected. The ECG signals were amplified by the instrumentation amplifier and
fed into the noise filtering circuits consisting of different stages. The first stage was notch
filter which was used to eliminate corrupting power line frequency noise in the ECG
signal. The design of the notch filter is shown in the Figure 6.5.
Page 68
56
Figure 6.5.Notch filter circuit for ECG.
The notch filter was designed with a cut-off frequency of 50 Hz and then summing
amplifier was used to remove 50Hz noise. When the trimmers were set to RV1=370.6Ω,
RV2=251K, and capacitors to C3=C5=330pF, the cut off frequency was measured to be
50Hz.
Before the notch filter, signal level was reduced because the signal was amplified 22 times
by the inverting amplifier. The second stage was designed as Second order Sallen-Key
Butterworth high pass filter (Figure 6.6) with cut-off frequency set to 0.043Hz to eliminate
very low undesired noise signals as in some applications, the QRS wave was seen between
0.05 to 1 Hz. Sallen-Key Butterworth type low pass and high pass filter were used because
they have the flattest possible pass-band magnitude response [21]. The cut off frequency is
calculated with R20, R21, C7, and C8 and was obtained as 0.043 Hz using following
equation.
Page 69
57
Figure 6.6.Sallen-Key Butterworth high pass filter for ECG.
The maximum frequency component present in the ECG signal is around 250 Hz. But a
cut-off frequency of 100 Hz is usually sufficient and is often used in the design low pass
filters in ECG applications. For this reason, the third or last stage of modified Sallen-Key
Butterworth low pass filter (Figure 6.7) was set to 100Hz to reject high frequency
undesirable signals When RV6=1.05KΩ, RV7=9KΩ, C10=3.3µF, C11=220nF, the cut off
frequency was obtained as 100 Hz using the following equation. Figure 6.8 shows the
filtered signal as a clear signal.
Figure 6.7.Modified Sallen-Key Butterworth low pass filter for ECG.
Page 70
58
Figure 6.8.Output signal of ECG measurement system.
6.2.2. Pulse Oximeter System.
A block diagram of the designed pulse oximeter system is shown in the Figure 6.9.
Figure 6.9.Block diagram of the designed finger tip pulse oximeter system.
Page 71
59
Pulse Oximeter is an opto-electronic non-invasive medical instrument, capable of
measuring and recording the changes in SpO2 at the finger tip. Pulse oximeter system is
used to measure the saturated oxygen level in the blood as this parameter is important and
plays an important role in the oxygen transportation in the body. Haemoglobin shows
different absorption effects for red and Infra-red lights and this difference effect is shown
in the output signal of the pulse oximeter. (Figure 6.10).
Figure 6.10.The output signal for red and infra-red light
LED driver circuit was used for red and infra-red driving in every 500µS because this
pulse rate was optimal for driving the Nellcor pulse oximeter probe. A 555 timer circuit
was used to generate pulse, and the pulse length was adjusted with resistors and capacitors.
The 555 timer circuit and pulse signal are shown in the Figure 6.11.
Page 72
60
Figure 6.11.Bipolar 555 timer circuit (a) and pulse signal in oscilloscope (b).
LED driver circuit was connected to Nellcor pulse oximeter probe which produced signal
in 9 pin D-SUB male connector (Appendix B). Nellcor pulse oximeter probe is basically
produced from one LED pair and one photodiode. Nellcor pulse oximeter probe connection
with instrumentation amplifier is shown in the Figure 6.12.
Figure 6.12.Pulse oximeter circuit with Nellcor probe connection.
Page 73
61
Burr Brown INA110KP was selected as the instrumentation amplifier due to its high
CMRR rate and low voltage operation. It’s very high input impedance and low input bias
current make the INA110KP ideal for applications requiring input filters or input
protection circuitry. Because of selecting RG = 10, the voltage gain was 10, or 20dB in
decibel due to the instrumentation amplifier. Photodiode was connected between positive
and negative inputs of the current to voltage converter which was used for fixing to current
change. The output signal of instrumentation amplifier, which is includes high frequency
signals, was obtained which is shown in the Figure 6.13.
Figure 6.13.The output signal of INA110KP instrumentation amplifier circuit.
The noise signal was removed from the pulse oximeter signal with a second order Sallen-
Key low pass filter, having a cut-off frequency of 10 Hz. Second order low pass Sallen-
Key Butterworth low pass type filter was used two times to remove the noise from the
LED and the infrared signals. Cut-off frequency was selected to be about 10 Hz because it
was enough to remove the high frequency signals from the pulse oximetry measurements.
Cut-off frequency was calculated with the following equation using RV1, RV2, C2, C4
and, cut-off frequency was obtained as 9.64Hz nearly 10Hz.
Page 74
62
After using the low pass Sallen-Key filter twice, the signal was amplified and the final
output waveform is shown in Figure 6.14. In the pulse oximeter system signal, outgrowth
is symbolized as R wave signal in the ECG. In addition, the duration between peak to peak
symbolizes the heart beat duration.
Figure 6.14.The output signal from Pulse oximeter system.
6.2.3. The Microcontroller system
DSPIC30F6014A was selected as the microcontroller due to its high performance with 12
bit Analog to Digital Converter (ADC). This is an 80-pin processor having large program
memory. DSPIC30F6014A pin diagram is shown in Figure 6.15. The circuit diagram of the
Page 75
63
microcontroller and the Ethernet controller board are shown in Figure 6.16
Figure 6.15.Pin diagram of DSPIC30F6014A.
Page 76
64
Figure 6.16.Microcontroller and serial Ethernet circuit diagram.
DSPIC30F6014 (dsPIC) was used as the main component of the system because all the
biological data was collected and temporarily stored in it, and data was sent out from the
processor using a serial Ethernet board. Power was provided from SMPSS power supply
in 12V output. Data was taken with 12-bit ADC and meanwhile digital data, which was
converted from analog ECG and pulse oximeter signals according to Nyquist theorem
principle, were plotted on a 128x64 type graphics LCD (GLCD). According the Nyguist
theorem digital sampling frequency must be at least twice the highest frequency
component in the signal. Microcontroller oscillation was provided using a 10MHz crystal
oscillator, and two capacitors. In addition, DSPIC30F6014A can be operated until 80 MHz
for advanced applications such as digital signal processing. For data sending, Ethernet
Page 77
65
board system was used which employs a 28-pin ENC28J60 10BASE-T type stand-alone
Ethernet controller chip that interfaces using the standard SPI serial bus, making it ideal for
adding Ethernet to dsPICs and other microcontrollers that do not feature an on-chip
Ethernet controller.
6.3. Software of Medical Telemetry System
The software of the Medical Telemetry System was written using the MikroBasic PRO for
DSPIC 5.40 language because of its ease of use and large code library. Software was
started with ADC control process and PORTB was defined as input. GLCD and Ethernet
Board were declared according to GLCD connection and Ethernet board with
DSPIC30F6014A. For plotting the captured signal continuously on the GLCD,
GLCD_DOT instruction was used and horizontal and vertical axes calibrated accordingly.
In the Ethernet software, HTML code was embedded in program code and between the
Ethernet board and destination board communication was provided with IPADRESS, like
168.68.20.1. Software listing is given in detail in Appendix C.
6.4. Summary
The medical telemetry system contains two important and crucial measurement systems,
such as ECG and SPO2, or pulse oximeter signal. The ECG measurement system consists
of one INA128KP as an instrumentation amplifier to amplify very low input signals, a
notch Filter to eliminate 50Hz noise from the city electrical main supply, one low pass and
one high pass filter to filter out the noise between 0.5Hz and 100Hz. The ECG signal was
obtained from the skin surface with suction type electrodes. The second measurement
system is the pulse oximeter system consisting of one instrumentation amplifier, and two
second order low pass filters to eliminate upper frequencies from 10Hz. These two signals
are collected with two 12-bit ADC in DSPIC30F6014A and data is sent using an Ethernet
Board. Digitized data from ECG and pulse oximeter signals are displayed and monitored
on a 128x64 pixel GLCD monitor.
Page 78
66
CHAPTER 7
RESULTS AND DISCUSSION
A medical telemetry system has been designed and developed as a device that enables the
study of the performance of ECG and blood oxygen saturation levels, by detecting the
electrical activities in the body. The designed medical telemetry system presents faithful
reproduction of the signals detected from the body, and makes them available for further
processing by a doctor or a health specialist, located at distant locations.
The system is designed using readily available electronic components and software and it
can be easily modified to suit different applications. It can serve for the data collection to
help the doctor in work of ECG and pulse oximeter.
In the design of the medical telemetry system, two important parameters are measured such
as ECG signal and Pulse Oximeter signal using electronic circuits. In the single channel
ECG measurement system, ECG signal was taken from the body surface with suction type
ECG electrodes which are made from Ag/AgCl. INA128KP is selected as the
instrumentation amplifier because it has very low voltage operation, high CMRR and low
output impedance. Careful selection and use of two second order Sallen-Key Butterworth
filters provided a noise free signal. The filtered signal is converted into digital from by a
microcontroller module. The microcontroller formats the signal and sends it to an Ethernet
card for transmission over a network.
The main requirements of a medical telemetry system can be summarized as follows:
Low cost
Portable
Battery operated
Safe operation
Page 79
67
User friendly
Fast
Clean, noise free outputs
Long distance transmission
Capable of sending important medical parameters (e,g, ECG and SPO2)
Accessible using network devices (e.g. mobile phones and iPAD)
The above are the basic requirements and additional requirements can be sought depending
upon specific applications. The system designed and developed by the author satisfies all
of the above requirements.
The data communication module in most commercially available medical telemetry
systems are based on radio frequency (RF) techniques. Here, a pair of RF transmitter and
receiver modules are used. This approach has the disadvantage that the signal can easily be
contaminated by electromagnetic interference. In addition, the maximum distance that the
signal can be sent depends upon power of the transmitter and is limited in most cases, and
the signal is prone to attenuation. The system designed by the author on the other hand is
based on the Ethernet which is not affected by electromagnetic noise. The maximum
distance is also not a problem since the system can be accessed using a suitable network
technology, such as a mobile phone or an IPAD.
The ECG output signal obtained from the system is shown in Figure 7.1. As can be seen
from this figure, the output waveform is clean and is free from any electrical noise. This
shows that the selection of the filtering circuits and the cut off frequencies have been
acceptable. Addition of external knobs to adjust the filter frequencies could be a useful
modification to the system to obtain clear and noise free waveforms in all applications.
The Heart Rate (HR) can easily be calculated by developing software to calculate the time
between the waveform peaks, using for example microcontroller timer modules. Such
information can be displayed at the bottom of the display to help doctors to quickly
analyze the results.
Page 80
68
In addition, the system can be miniaturized by using digital filters instead of analog filters
used in the current design. Another advantage of using digital filters will be that the
response will be independent of environmental effects such as the temperature, ageing, and
component tolerances. The digital filtering modification will require the implementation of
a digital filtering algorithm in the microcontroller and the addition of an external digital to
analog converter module to the system.
Figure 7.1.The output signal of the designed ECG system.
Second designed measurement system is the pulse oximeter that provides non-invasive and
continuous information about the percent of oxygen that is combined with haemoglobin in
the blood. A pulse oximeter is often referred to as a hypoxemia monitor because it can
continuously reflect changes in a patient’s arterial oxygen saturation. In the system
designed by the author, this part of the system was designed using an instrumentation
amplifier and two second order Sallen-Key Butterworth type low-pass filter circuits. The
detection of red and infrared signals were done using photodiodes in a Nellcor type pulse
oximeter probe. This photodiode was connected between two inputs of the instrumentation
amplifier used as a transimpedance amplifier to detect the light intensity and to use current
to voltage converter with instrumentation amplifier for detecting light absorption.
The output waveform of the pulse oximeter signal is shown in Figure 7.2. As can be seen
from this figure, the waveform is clear and readable. The signal shown in this figure has
DC component superimposed on it and thus the waveform is not central on the
Page 81
69
oscilloscope. This DC component can be removed if desired by using a suitable capacitor
to block the DC offset. Like the ECG system, Heart Rate (HR) can be calculated by
developing software to calculate the time between the waveform peaks, using timers.
Otherwise, the SPO2 rate can be calculated using minimum and maximum values of SPO2
signal by developing software.
Figure 7.2.The output signal of the designed pulse oximeter system.
The designed medical telemetry system measures both the ECG signal and the level of
saturated oxygen in the blood and then plots them together on a 128 x 64 pixel graphical
LCD display (GLCD), as shown in Figure 7.3. The top waveform is the ECG, while the
bottom waveform is the saturated oxygen level. The advantage of displaying both
parameters on the same graph is that the doctor or the health specialist can quickly analyse
the patient’s condition by looking at the graphs. The disadvantage of GLCD is its size that
is very small, and the resolution is not enough for analysing ECG details by the doctor. For
this reason, it is advisable to use large size GLCDs with high pixel rates.
Page 82
70
Figure 7.3.ECG and saturated oxygen signals plotted on a GLCD display.
The collected ECG and the saturated oxygen data are initially digitised by the
microcontroller and stored on the local microcontroller memory. This data is then
successfully sent to a remote location using the IPV4 protocols over a serial Ethernet link.
A small serial Ethernet board was connected to the microcontroller output ports. The
microcontroller was programmed to send the collected medical data via this serial Ethernet
board to the health specialist that may be located at a remote location. Use of a serial
Ethernet board simplified the overall design considerably and also reduces its cost.
The collected data is actually in HTML text format and thus it can be accessed by any
mobile device (e.g. a mobile phone, an IPAD etc) that has connectivity to the internet. It
should also be possible to send the data to a PC after some minor modifications so that the
data can be analysed further and plotted in real-time if desired.
Some medical telemetry systems are based on the GPRS technology [4]. Such systems
have limited data storage memories and distortion problems with very low speed and high
cost compared to the system developed by the author.
Page 83
71
In spite of these advantages, there are some disadvantages and limits of the system.
Causing electromagnetic pollution of the system is inevitable. It is though that this
electromagnetic distortion can be cause damage to environment. Effects of physical
condition like as electric and electromagnetic fields, humidity, temperature to the
electronic circuits of the system are the other limits of the system. Moreover, it is possible
that Trojans, viruses and hackers can give the damage to software on microcontroller and
receiver parts. For this reason, it might be necessary to take security precautions with
software and extra equipments.
Because the designed medical telemetry system is low-cost and portable, further
developments are possible. For example, all the system components can be placed on a
small PCB and the system can be commercialised for use in homes, hospitals and in health
clinics.
Page 84
72
CHAPTER 8
CONCLUSIONS AND SUGGESTIONS FOR FUTURE WORK
Hospitals and other medical institutions employ medical telemetry devices to monitor
patients’ vital signs and other important biological parameters and transmit this
information via radio waves or wireless systems to a remote location, such as to doctors or
nurses, or to other health specialists, using medical telemetry systems.
Medical telemetry systems continue to improve with the development of new
communication technologies. In early days of medical telemetry, radio frequency waves
have been used for communication, then internet technologies such as 3G and PDA have
replaced the conventional medical telemetry systems.
The medical telemetry system designed and developed by the author is based on using the
Ethernet to send the vital medical information of a patient to a remote doctor or a medical
specialist. One of the benefits of the designed system is that it is low-cost and portable. As
such, the system can be used at homes, especially in the care of elderly people who cannot
go to hospitals easily.
The designed system senses and then transmits the ECG and SPO2 signals of the patient
using the Ethernet technology. The system for example can be connected to an internet
based mobile phone or to an IPAD and the data can easily be sent to the required place
without the need of any other communication equipment. As the designed system is based
on Ethernet protocols, any doctor or any specialist with a mobile phone can easily monitor
a patient’s medical condition in real-time and at any place and at any time of the day.
The designed medical telemetry system can be developed further in several ways. One
such development could be the design of a web based central monitoring system to keep
track of the medical information from all patients registered to the system.
Page 85
73
Another further development could be the interpretation of the results automatically and
then sending alarm messages to doctors for emergency cases. For example, important
anomalies (e.g. heart attack) can be detected in the ECG waveforms and this information
can be sent as alarm condition to the doctors instead of sending the full ECG waveforms.
The same alarm conditions can also be sent as urgent messages using the standard SMS
messaging services. Such an addition to the system will make the system more responsive,
especially when dealing emergency situations as this will give the opportunity to the doctor
to visit the patient as early as possible.
The size of the designed electronic circuit can be minimized using nanotechnology
components. It may then become possible to keep the system attached to the patient at all
times. Wearable ECG and SPO2 sensors can be used with flexible connections to help the
patient move freely. As the system is portable, it should then be possible to it not just at
home but at any place and at any time.
Finally, the system can be further developed so that it can be controlled from a remote
location using a suitable web service, e.g. email. In such an application the doctor may be
required to request the data at any time by sending appropriate email or mobile phone
messages to the system.
Page 86
74
REFERENCES
[1] Güler N., Fidan U. (2005).Wireless Transmission of ECG Signal., Journal of Medical
Systems., Volume 30, Number 3,231-235. DOI:10.1007/s10916-005-7980-5.
[2] Di G., Tang X., Liu W. (2007). A Reflectance Pulse Oximeter Design Using the
MSP430F149. IEEE/ICME International Conference on Complex Medical Engineering.
1082-1084.
[3] Lee H., Park D. (2000). Bio-Medical FM-FM-FSK Radiotelemetry System for Multi-
Signal Transmission, Proceedings of the 22nd
Annual Conference, IEEE. 1053-1055.
[4] Boskovic A., Despotovic M.(2005). An Efficient Approach to ECG Signal
Transmission via GPRS.,IEEE. 76-79. doi:1-4244-0049-X/05/$20.00
[5] Hong J., Kim J., Cha E., Lee T. (2007). A Wireless 3-Channel ECG Transmission
System Using PDA Phone, IEEE Computer Society, 462-465.
doi:10.1109/ICCIT.2007.318.
[6] Villegas G., Wong S., and students. A Portable ECG monitoring device with Bluetooth
and Holter capabilities for Telemedicine Applications. Proceedings of the 28th
IEEE
EMBS Annual International Conference, 5244-5247.
[7] Rangraz P., Behnam H.(2008).Modelling Heart Wall Motion in Echocardiography
System, 4th
Kuala Lumpur International Conference on Biomedical Engineering., Volume
21/1 . 599-602.
[8]Coverings A. Structure of Heart. Retrieving from October 6, 2011, from
http://media.wiley.com/product_data/excerpt/62/EHEP0018/EHEP001862.pdf
[9]Concept 3: Electrical activity of Hearth.(2011). Pearson Education., Retrieved from
http://www.phschool.com/science/biology_place/biocoach/cardio1/electrical.htm
[10] Klabunde R.E. (2011). Cardiovascular Physiology Concepts., Second Edition.,
Lipincott Williams & Wilkins Press.
[11]Saunders W.B .(1979). Anaesthesia. Fifth Edition. Churchill Livingstone Press.
Page 87
75
[12] Karilainen A., Hansen S., Müller J. (2005). Dry and Capacitive Electrodes for Long-
Term ECG Monitoring., IEEE Transactions on Ultrasonics, Ferroelectrics and Frequency
Control. Vol. 51. No. 11. Pp 154-161.
[13]Retrieved February 2, 2002 from http://www.madehow.com/Volume-3/ECG-
Machine.html#ixzz0k8hEJ4y9
[14] Hampton J.R., The ECG in Practice.(2000)., Churchill Livingstone Press., Fourth
Edition.
[15] O’Donnell M., Mich U., Webster. (2005). Biopotential Electrodes. Retrieved from
Arizona State University Biomedical Engineering Lecture Notes Website:
http://www.spx.arizona.edu/classes/bme517/lecture/_electrodes.pdf.
[16] Bronzino J.D., Medical Devices and Systems. (2006)., Third Edition., Taylor and
Francis Group Press.
[17]Chew N., The History of Pulse Oximeter. Retrieved December 2, 2011, from
http://www.ehow.com/about_5052102_history-pulse-oximetry.html.
[18]Barker S., Hay B., Miyasaka K., Poets C. (2000). Retrieved November 23, 2011, from
http://www.oximetry.org/pulseox/principles.html.
[19]Li Y.T., Pulse Oximetry.(2001) , Department of Electronic Engineering.
[20]Townsend N., Medical Electronics Term 2001, Retrieved from Oxford University
Robotic research group website :
http://www.robots.ox.ac.uk/~neil/teaching/lectures/med_elec/notes6.pdf.
[21]Trump B., Stitt R., Sallen-Key Low Pass Filter Design Program, Burr-Brown
Application Press, (602), 746-750.
Page 88
76
APPENDIX A
INA128P Instrumentation Amplifier block diagram.
Page 89
77
APPENDIX B
Nellcor Pulse Oximeter Pinout for disposable.
Connector End
Pin
Pin Name Description
9 Phototransistor
Cathode
Green wire
5 Phototransistor
Anode
White wire; phototransistor detects level of IR
and/or red light transmitted through the finger.
7 Shield Cable shield, connects the copper shield the over
the transistor.
2 LED1 Red wire; anode of IR LED, cathode of the red
LED
3 LED2 Black wire; cathode of IR LED, anode of the red
LED
Page 90
78
APPENDIX C
Program listing of designed Medical Telemetry System.
program calikusu
dim
SPI_Ethernet_Rst as sbit at LATG13_bit ' for writing to output pin always use latch
SPI_Ethernet_CS as sbit at LATG12_bit ' for writing to output pin always use latch
SPI_Ethernet_Rst_Direction as sbit at TRISG13_bit
SPI_Ethernet_CS_Direction as sbit at TRISG12_bit
' end ethernet NIC definitions
dim myMacAddr as byte[6] ' my MAC address
myIpAddr as byte[4] ' my IP address
gwIpAddr as byte[4] ' gateway (router) IP address
ipMask as byte[4] ' network mask (for example : 255.255.255.0)
dnsIpAddr as byte[4] ' DNS server IP address
'************************************************************
'* ROM constant strings
'************************************************************
const httpHeader as string[31] = "HTTP/1.1 200 OK"+chr(10)+"Content-type: "
' HTTP header
const httpMimeTypeHTML as string[13] = "text/html"+chr(10)+chr(10) '
HTML MIME type
const httpMimeTypeScript as string[14] = "text/plain"+chr(10)+chr(10) '
TEXT MIME type
const httpMethod as string[5] = "GET /"
'*
'* web page, splited into 2 parts as
'* when coming short of ROM, fragmented data is handled more efficiently by linker
'*
'* this HTML page calls the boards to get its status, and builds itself with javascript
'*
Page 91
79
const indexPage as string[735] =
"<meta http-equiv=" + Chr(34) + "refresh" + Chr(34) + " content=" +
Chr(34) + "3;url=http://192.168.20.60" + Chr(34) + ">" +
"<HTML><HEAD></HEAD><BODY>"+
"<h1>dsPIC + ENC28J60 Mini Web Server</h1>"+
"<a href=/>Reload</a>"+
"<script src=/s></script>"+
"<table><tr><td valign=top><table border=1 style="+chr(34)+"font-
size:20px ;font-family: terminal ;"+chr(34)+"> "+
"<tr><th colspan=2>ADC</th></tr>"+
"<tr><td>AN10</td><td><script>document.write(AN10)</script></td></tr>"+
"</table></td><td><table border=1 style="+chr(34)+"font-size:20px
;font-family: terminal ;"+chr(34)+"> "+
"<tr><th colspan=2>PORTB</th></tr>"+
"<script>"+
"var str,i;"+
"str="+chr(34)+chr(34)+"; "+
"for(i=0;i<8;i++)"+
"{str+="+chr(34)+"<tr><td bgcolor=pink>BUTTON
#"+chr(34)+"+i+"+chr(34)+"</td>"+chr(34)+"; "+
"if(PORTB&(1<<i)){str+="+chr(34)+"<td
bgcolor=red>ON"+chr(34)+";}"+
"else {str+="+chr(34)+"<td bgcolor=#cccccc>OFF"+chr(34)+";}"+
"str+="+chr(34)+"</td></tr>"+chr(34)+";}"+
"document.write(str) ;"+
"</script>"
const indexPage2 as string[470] =
"</table></td><td>"+
Page 92
80
"<table border=1 style="+chr(34)+"font-size:20px ;font-family: terminal
;"+chr(34)+"> "+
"<tr><th colspan=3>PORTD</th></tr>"+
"<script>"+
"var str,i;"+
"str="+chr(34)+chr(34)+"; "+
"for(i=0;i<8;i++)"+
"{str+="+chr(34)+"<tr><td bgcolor=yellow>LED
#"+chr(34)+"+i+"+chr(34)+"</td>"+chr(34)+"; "+
"if(PORTD&(1<<i)){str+="+chr(34)+"<td
bgcolor=red>ON"+chr(34)+";}"+
"else {str+="+chr(34)+"<td bgcolor=#cccccc>OFF"+chr(34)+";}"+
"str+="+chr(34)+"</td><td><a
href=/t"+chr(34)+"+i+"+chr(34)+">Toggle</a></td></tr>"+chr(34)+";}"+
"document.write(str) ;"+
"</script>"+
"</table></td></tr></table>"+
"This is HTTP request
#<script>document.write(REQ)</script></BODY></HTML>"
dim getRequest as byte[15] ' HTTP request buffer
dyna as char[30] ' buffer for dynamic response
httpCounter as word ' counter of HTTP requests
txt as string[11]
'*******************************************
'* user defined functions
'*******************************************
'*
'* this function is called by the library
Page 93
81
'* the user accesses to the HTTP request by successive calls to
SPI_Ethernet_getByte()
'* the user puts data in the transmit buffer by successive calls to
SPI_Ethernet_putByte()
'* the function must return the length in bytes of the HTTP reply, or 0 if nothing to
transmit
'*
'* if you don"t need to reply to HTTP requests,
'* just define this function with a return(0) as single statement
'*
'*
sub function SPI_Ethernet_UserTCP(dim byref remoteHost as byte[4],
dim remotePort, localPort, reqLength as word, dim byref flags as
TEthPktFlags) as word
dim i as word ' my reply length
bitMask as byte ' for bit mask
txt as string[11]
result = 0
' should we close tcp socket after response is sent?
' library closes tcp socket by default if canClose flag is not reset here
' canClose = 0 ' 0 - do not close socket
' otherwise - close socket
if(localPort <> 80) then ' I listen only to web request on port 80
result = 0
exit
end if
' get 10 first bytes only of the request, the rest does not matter here
for i = 0 to 10
getRequest[i] = SPI_Ethernet_getByte()
Page 94
82
next i
getRequest[i] = 0
' copy httpMethod to ram for use in memcmp routine
for i = 0 to 4
txt[i] = httpMethod[i]
next i
if(memcmp(@getRequest, @txt, 5) <> 0) then ' only GET method is supported
here
result = 0
exit
end if
Inc(httpCounter) ' one more request done
if(getRequest[5] = "s") then ' if request path name starts with s, store
dynamic data in transmit buffer
' the text string replied by this request can be interpreted as javascript statements
' by browsers
result = SPI_Ethernet_putConstString(@httpHeader) ' HTTP header
result = result + SPI_Ethernet_putConstString(@httpMimeTypeScript) ' with
text MIME type
' add AN10 value to reply
WordToStr(ADC1_Get_Sample(10), dyna)
txt = "var AN10="
result = result + SPI_Ethernet_putString(@txt)
result = result + SPI_Ethernet_putString(@dyna)
txt = ";"
Page 95
83
result = result + SPI_Ethernet_putString(@txt)
' add PORTB value (buttons) to reply
txt = "var PORTB="
result = result + SPI_Ethernet_putString(@txt)
WordToStr(PORTB, dyna)
result = result + SPI_Ethernet_putString(@dyna)
txt = ";"
result = result + SPI_Ethernet_putString(@txt)
' add PORTD value (LEDs) to reply
txt = "var PORTD="
result = result + SPI_Ethernet_putString(@txt)
WordToStr(PORTD, dyna)
result = result + SPI_Ethernet_putString(@dyna)
txt = ";"
result = result + SPI_Ethernet_putString(@txt)
' add HTTP requests counter to reply
WordToStr(httpCounter, dyna)
txt = "var REQ="
result = result + SPI_Ethernet_putString(@txt)
result = result + SPI_Ethernet_putString(@dyna)
txt = ";"
result = result + SPI_Ethernet_putString(@txt)
else
if(getRequest[5] = "t") then ' if request path name starts with t,
toggle PORTD (LED) bit number that comes after
bitMask = 0
if(isdigit(getRequest[6]) <> 0) then ' if 0 <= bit number <= 9, bits 8 & 9
does not exist but does not matter
bitMask = getRequest[6] - "0" ' convert ASCII to integer
Page 96
84
bitMask = 1 << bitMask ' create bit mask
PORTD = PORTD xor bitMask ' toggle PORTD with xor
operator
end if
end if
end if
if(result = 0) then ' what do to by default
result = SPI_Ethernet_putConstString(@httpHeader) ' HTTP header
result = result + SPI_Ethernet_putConstString(@httpMimeTypeHTML) ' with
HTML MIME type
result = result + SPI_Ethernet_putConstString(@indexPage) ' HTML page
first part
result = result + SPI_Ethernet_putConstString(@indexPage2) ' HTML page
second part
end if
' return to the library with the number of bytes to transmit
end sub
' *
' * this function is called by the library
' * the user accesses to the UDP request by successive calls to Ethernet_getByte()
' * the user puts data in the transmit buffer by successive calls to Ethernet_putByte()
' * the function must return the length in bytes of the UDP reply, or 0 if nothing to
transmit
' *
' * if you don't need to reply to UDP requests,
' * just define this function with a return(0) as single statement
' *
' *
sub function SPI_Ethernet_UserUDP(dim byref remoteHost as byte[4],
Page 97
85
dim remotePort, destPort, reqLength as word, dim byref flags as
TEthPktFlags) as word
dim txt as string[5]
result = 0
' reply is made of the remote host IP address in human readable format
byteToStr(remoteHost[0], dyna) ' first IP address byte
dyna[3] = "."
byteToStr(remoteHost[1], txt) ' second
dyna[4] = txt[0]
dyna[5] = txt[1]
dyna[6] = txt[2]
dyna[7] = "."
byteToStr(remoteHost[2], txt) ' second
dyna[8] = txt[0]
dyna[9] = txt[1]
dyna[10] = txt[2]
dyna[11] = "."
byteToStr(remoteHost[3], txt) ' second
dyna[12] = txt[0]
dyna[13] = txt[1]
dyna[14] = txt[2]
dyna[15] = ":" ' add separator
' then remote host port number
WordToStr(remotePort, txt)
dyna[16] = txt[0]
dyna[17] = txt[1]
dyna[18] = txt[2]
dyna[19] = txt[3]
dyna[20] = txt[4]
Page 98
86
dyna[21] = "["
WordToStr(destPort, txt)
dyna[22] = txt[0]
dyna[23] = txt[1]
dyna[24] = txt[2]
dyna[25] = txt[3]
dyna[26] = txt[4]
dyna[27] = "]"
dyna[28] = 0
' the total length of the request is the length of the dynamic string plus the text of
the request
result = 28 + reqLength
' puts the dynamic string into the transmit buffer
SPI_Ethernet_putBytes(@dyna, 28)
' then puts the request string converted into upper char into the transmit buffer
while(reqLength <> 0)
SPI_Ethernet_putByte(SPI_Ethernet_getByte())
Dec(reqLength)
wend
' back to the library with the length of the UDP reply
end sub
' Glcd module connections
dim GLCD_D7 as sbit at RD7_bit
GLCD_D6 as sbit at RD6_bit
GLCD_D5 as sbit at RD5_bit
GLCD_D4 as sbit at RD4_bit
Page 99
87
GLCD_D3 as sbit at RD3_bit
GLCD_D2 as sbit at RD2_bit
GLCD_D1 as sbit at RD1_bit
GLCD_D0 as sbit at RD0_bit
GLCD_D7_Direction as sbit at TRISD7_bit
GLCD_D6_Direction as sbit at TRISD6_bit
GLCD_D5_Direction as sbit at TRISD5_bit
GLCD_D4_Direction as sbit at TRISD4_bit
GLCD_D3_Direction as sbit at TRISD3_bit
GLCD_D2_Direction as sbit at TRISD2_bit
GLCD_D1_Direction as sbit at TRISD1_bit
GLCD_D0_Direction as sbit at TRISD0_bit
dim GLCD_CS1 as sbit at LATB3_bit
GLCD_CS2 as sbit at LATB2_bit
GLCD_RS as sbit at LATB4_bit
GLCD_RW as sbit at LATB5_bit
GLCD_EN as sbit at LATB6_bit
GLCD_RST as sbit at LATB7_bit
GLCD_CS1_Direction as sbit at TRISB3_bit
GLCD_CS2_Direction as sbit at TRISB2_bit
GLCD_RS_Direction as sbit at TRISB4_bit
GLCD_RW_Direction as sbit at TRISB5_bit
GLCD_EN_Direction as sbit at TRISB6_bit
GLCD_RST_Direction as sbit at TRISB7_bit
' End Glcd module connections
dim ADCresult as word
ADCresult1 as word
casi as word
Page 100
88
dim i,son as integer
dim invert as word
dim x1, x2,x3 as integer
dim Y1, Y2, Y3,cnt as integer
dim counter,HR as word
dim cali as byte
dim text as string[6]
main:
httpCounter = 0
myMacAddr[0] = 0x00
myMacAddr[1] = 0x14
myMacAddr[2] = 0xA5
myMacAddr[3] = 0x76
myMacAddr[4] = 0x19
myMacAddr[5] = 0x3F
' set IP address
myIpAddr[0] = 192
myIpAddr[1] = 168
myIpAddr[2] = 20
myIpAddr[3] = 60
' set gateway address
gwIpAddr[0] = 192
gwIpAddr[1] = 168
gwIpAddr[2] = 20
gwIpAddr[3] = 6
' set dns address
dnsIpAddr[0] = 192
Page 101
89
dnsIpAddr[1] = 168
dnsIpAddr[2] = 20
dnsIpAddr[3] = 1
' set subnet mask
ipMask[0] = 255
ipMask[1] = 255
ipMask[2] = 255
ipMask[3] = 0
ADPCFG = ADPCFG or 0xFBFF ' all digital but rb10(AN10)
PORTB = 0
TRISB = 0xFFFF ' set PORTB as input for buttons and adc
PORTD = 0
TRISD = 0 ' set PORTD as output,
' Configure AN pins as digital
Glcd_Init()
Glcd_Fill(0x00)
TRISB.13=1
TRISB.10=1
TRISB.1=1
counter=0
X2 = 0
X3= 0
for i=0 to 10
Glcd_Fill(0x00)
Glcd_Write_Text("ISMAILCALIKUSU", 1, 1, 2)
Delay_ms(100)
Glcd_Write_Text("MASTER THESIS",1,3,2)
Delay_ms(100)
Page 102
90
Glcd_Write_Text("BIOMEDICAL",2,5,2)
Delay_ms(100)
Glcd_Write_Text("ENGINEERING",2,7,2)
Delay_ms(1000)
next i
Glcd_Fill(0x00)
ADC1_Init()
'*
'* starts ENC28J60 with as
'* reset bit on RC0
'* CS bit on RC1
'* my MAC & IP address
'* full duplex
'*
'SPI2_Init()
' for faster SPI communication use Spi2_Init_Advanced settings
Spi2_Init_Advanced(_SPI_MASTER, _SPI_8_BIT, _SPI_PRESCALE_SEC_1,
_SPI_PRESCALE_PRI_4,
_SPI_SS_DISABLE, _SPI_DATA_SAMPLE_MIDDLE,
_SPI_CLK_IDLE_LOW, _SPI_IDLE_2_ACTIVE)
SPI_Ethernet_Init(myMacAddr, myIpAddr, _SPI_Ethernet_FULLDUPLEX) '
init ethernet module
SPI_Ethernet_setUserHandlers(@SPI_Ethernet_UserTCP,
@SPI_Ethernet_UserUDP)' set user handlers
' dhcp will not be used here, so use preconfigured addresses
SPI_Ethernet_confNetwork(ipMask, gwIpAddr, dnsIpAddr)
HR=0
counter=0
while TRUE ' do forever
Page 103
91
SPI_Ethernet_doPacket() ' process incoming Ethernet packets
ADCresult1=ADC1_Read(14)
ADCresult= ADC1_Read(10)
Y3=ADCresult1 *64/4096
Y2 = ADCresult * 64 /4096
Y3=not Y3
Y2=not Y2
IntToStr(HR, text)
Glcd_Write_Text("ECG WAVE HR:"+text,2,0,1)
Glcd_Write_Text("SPO2 WAVE ",2,4,1)
Glcd_Dot(x3,y3+28,1)
Glcd_Dot(x2,y2+58,1)
delay_us(500)
inc(x2)
inc(x3)
if x3>127 then
x3=0
Glcd_Fill(0x00)
end if
x1=x2
if x2 > 127 then
x2 = 0
Glcd_Fill(0x00)
end if
if counter>=20 then
HR=60000/counter
end if
wend
end.
Page 104
92
APPENDIX D
Pulse Oximeter Signal often eliminating the noise and DC offset.