A Three-Dimensional Analysis of Bilateral Directional Asymmetry in the Human Clavicle Emam ElHak Abdel Fatah, 1 * Natalie R. Shirley, 2 Mohamed R. Mahfouz, 1 and Benjamin M. Auerbach 3 1 Department of Mechanical, Aerospace and Biomedical Engineering, University of Tennessee, Knoxville, TN 37996 2 Department of Anatomy, DeBusk College of Osteopathic Medicine, Lincoln Memorial University, Harrogate, TN 37752 3 Department of Anthropology, University of Tennessee, Knoxville, TN 37996 KEY WORDS morphological variation; statistical bone atlas; computed tomography scans; computer-automated bone measurements; muscle attachment ABSTRACT This study presents a novel three- dimensional analysis using statistical atlases and auto- mated measurements to assess diaphyseal morphology of the clavicle and its relationship to muscle asymmetry. A sample of 505 individuals (285 males, 220 females) from the William McCormick Clavicle Collection was CT scanned, segmented, and added to a statistical bone atlas that captures correspondence between homologous points on the bone surfaces. Muscle attachment sites were localized on the atlas and then propagated across the entire population. Cross-sectional contours were extracted at 5% increments along the entire bone, as well as at muscle attachment sites and the clavicle waist; maximum and minimum dimensions of each cross-sectional contour were calculated. In addition, the entire three-dimensional surface was examined for asymmetry by analyzing the magnitude and directional differences between homologous points across all bone surfaces in the dataset. The results confirm the existing studies on clavicle asymmetry, namely that the left clavi- cle is longer than the right, but the right is more robust than the left. However, the patterns of asymmetry are sexually dimorphic. Males are significantly asymmetric in all dimensions and at muscle and ligament attach- ment sites (P < 0.05), whereas female asymmetry is more variable. We hypothesize that this is related to absolute and relative differences in male muscle strength compared to females. However, an area with no muscle attachments on the posterior midshaft was sig- nificantly asymmetric in both sexes. We suggest that this is a curvature difference caused by opposing muscle actions at the medial and lateral ends of the bone. Am J Phys Anthropol 149:547–559, 2012. V V C 2012 Wiley Periodicals, Inc. Studies of skeletal asymmetry typically use a standard set of osteometric measurements that capture the length and robusticity of the element(s) being investigated to quantify the direction and magnitude of asymmetry. Directional asymmetry (DA) refers to significant unimo- dal population-level deviations from bilateral symmetry that most likely arises from lateralized behaviors (Auer- bach and Raxter, 2008). This information is customarily expressed in terms of the percentage of DA (Steele and Mays, 1995; Mays et al., 1999; Auerbach and Ruff, 2006; Auerbach and Raxter, 2008). This method measures the direction and magnitude of asymmetry by calculating the difference between a left and right pair of measure- ments, standardized by the mean of the left and right measurements [%DA 5 {(R2L)/[(R1L)/2]})3100%]. These studies have elucidated several important trends regarding human skeletal asymmetry. The magni- tude of asymmetry in human limb bones is greater in the upper limb than in the lower limb (Auerbach and Ruff, 2006; Kujanova et al., 2008). Within the upper limb, bilateral DA favors the right side, with diaphyseal lengths and diameters being absolutely greater in the right humerus, radius, and ulna than in the left (Schultz, 1937; Steele and Mays, 1995; Auerbach and Ruff, 2006). However, the clavicle deviates slightly from this pattern in that the left clavicle is longer than the right (Parsons, 1916; Mays et al., 1999; Auerbach and Raxter, 2008). Bilateral DA has been interpreted fre- quently as the manifestation of behavioral laterality related to activity and locomotion (Jones et al., 1977; Ruff and Jones, 1981; Ruff, 2000; Shaw and Stock, 2009; Marchi and Shaw, 2011), as whole limb asymmetry pat- terns differ between species (Jones et al., 1977; Sarring- haus et al., 2005; Stock et al., 2012). Other explanations focus on genetic and hormonal influences (Helmkamp and Falk, 1990), developmental differences in vascular supply to paired structures (von Bonin, 1962), and envi- ronmental stressors such as malnutrition and extreme climates (Schell et al., 1985). Nonetheless, biomechanical stresses remain the primary explanation for limb asym- metry (Ruff, 2000). One way in which the asymmetrical manifestations of biomechanical stresses have been addressed is by examining entheses. Entheses, or muscle stress markers (MSMs), have a complex etiology, wherein genetics, hor- mones, body size and activity levels, among other fac- tors, combine to influence their size and shape (Schlecht, 2012). Within anthropological studies, MSMs are often Additional Supporting Information may be found in the online version of this article. *Correspondence to: Emam ElHak Abdel Fatah, University of Tennessee Mechanical, Aerospace, Biomedical Engineering Depart- ment, 301 Perkins Hall, Knoxville, TN 37996. E-mail: [email protected]Received 29 May 2012; accepted 8 September 2012 DOI 10.1002/ajpa.22156 Published online 17 October 2012 in Wiley Online Library (wileyonlinelibrary.com). V V C 2012 WILEY PERIODICALS, INC. AMERICAN JOURNAL OF PHYSICAL ANTHROPOLOGY 149:547–559 (2012)
Transcript
A Three-Dimensional Analysis of Bilateral DirectionalAsymmetry in the Human Clavicle
Emam ElHak Abdel Fatah,1* Natalie R. Shirley,2 Mohamed R. Mahfouz,1 and Benjamin M. Auerbach3
1Department of Mechanical, Aerospace and Biomedical Engineering, University of Tennessee, Knoxville, TN 379962Department of Anatomy, DeBusk College of Osteopathic Medicine, Lincoln Memorial University, Harrogate, TN 377523Department of Anthropology, University of Tennessee, Knoxville, TN 37996
KEY WORDS morphological variation; statistical bone atlas; computed tomography scans;computer-automated bone measurements; muscle attachment
ABSTRACT This study presents a novel three-dimensional analysis using statistical atlases and auto-mated measurements to assess diaphyseal morphology ofthe clavicle and its relationship to muscle asymmetry. Asample of 505 individuals (285 males, 220 females) fromthe William McCormick Clavicle Collection was CTscanned, segmented, and added to a statistical boneatlas that captures correspondence between homologouspoints on the bone surfaces. Muscle attachment siteswere localized on the atlas and then propagated acrossthe entire population. Cross-sectional contours wereextracted at 5% increments along the entire bone, aswell as at muscle attachment sites and the claviclewaist; maximum and minimum dimensions of eachcross-sectional contour were calculated. In addition, theentire three-dimensional surface was examined forasymmetry by analyzing the magnitude and directional
differences between homologous points across all bonesurfaces in the dataset. The results confirm the existingstudies on clavicle asymmetry, namely that the left clavi-cle is longer than the right, but the right is more robustthan the left. However, the patterns of asymmetry aresexually dimorphic. Males are significantly asymmetricin all dimensions and at muscle and ligament attach-ment sites (P < 0.05), whereas female asymmetry ismore variable. We hypothesize that this is related toabsolute and relative differences in male musclestrength compared to females. However, an area with nomuscle attachments on the posterior midshaft was sig-nificantly asymmetric in both sexes. We suggest thatthis is a curvature difference caused by opposing muscleactions at the medial and lateral ends of the bone.Am J Phys Anthropol 149:547–559, 2012. VVC 2012 Wiley
Periodicals, Inc.
Studies of skeletal asymmetry typically use a standardset of osteometric measurements that capture the lengthand robusticity of the element(s) being investigated toquantify the direction and magnitude of asymmetry.Directional asymmetry (DA) refers to significant unimo-dal population-level deviations from bilateral symmetrythat most likely arises from lateralized behaviors (Auer-bach and Raxter, 2008). This information is customarilyexpressed in terms of the percentage of DA (Steele andMays, 1995; Mays et al., 1999; Auerbach and Ruff, 2006;Auerbach and Raxter, 2008). This method measures thedirection and magnitude of asymmetry by calculatingthe difference between a left and right pair of measure-ments, standardized by the mean of the left and rightmeasurements [%DA 5 {(R2L)/[(R1L)/2]})3100%].These studies have elucidated several important
trends regarding human skeletal asymmetry. The magni-tude of asymmetry in human limb bones is greater inthe upper limb than in the lower limb (Auerbach andRuff, 2006; Kujanova et al., 2008). Within the upperlimb, bilateral DA favors the right side, with diaphyseallengths and diameters being absolutely greater in theright humerus, radius, and ulna than in the left(Schultz, 1937; Steele and Mays, 1995; Auerbach andRuff, 2006). However, the clavicle deviates slightly fromthis pattern in that the left clavicle is longer than theright (Parsons, 1916; Mays et al., 1999; Auerbach andRaxter, 2008). Bilateral DA has been interpreted fre-quently as the manifestation of behavioral lateralityrelated to activity and locomotion (Jones et al., 1977;Ruff and Jones, 1981; Ruff, 2000; Shaw and Stock, 2009;
Marchi and Shaw, 2011), as whole limb asymmetry pat-terns differ between species (Jones et al., 1977; Sarring-haus et al., 2005; Stock et al., 2012). Other explanationsfocus on genetic and hormonal influences (Helmkampand Falk, 1990), developmental differences in vascularsupply to paired structures (von Bonin, 1962), and envi-ronmental stressors such as malnutrition and extremeclimates (Schell et al., 1985). Nonetheless, biomechanicalstresses remain the primary explanation for limb asym-metry (Ruff, 2000).One way in which the asymmetrical manifestations
of biomechanical stresses have been addressed is byexamining entheses. Entheses, or muscle stress markers(MSMs), have a complex etiology, wherein genetics, hor-mones, body size and activity levels, among other fac-tors, combine to influence their size and shape (Schlecht,2012). Within anthropological studies, MSMs are often
Additional Supporting Information may be found in the onlineversion of this article.
DOI 10.1002/ajpa.22156Published online 17 October 2012 in Wiley Online Library
(wileyonlinelibrary.com).
VVC 2012 WILEY PERIODICALS, INC.
AMERICAN JOURNAL OF PHYSICAL ANTHROPOLOGY 149:547–559 (2012)
associated with differences in activity patterns amonghuman populations (Hawkey and Merbs, 1995; Weiss,2004). In these articles, for example, larger MSMs havebeen associated with sexual dimorphism in activity typeor intensity (Eshed et al., 2004), as well as changes asso-ciated with age (Wilczak, 1998; Weiss, 2007). Thus,asymmetry in activity should relate to size and shapeasymmetry in entheses, and thus potentially provideindirect evidence that lateralized behaviors influenceobserved asymmetries in clavicular shape.More recent studies, however, have cautioned against
equating differences in the size of any given enthesisand the strength of its associated muscle (Zumwalt,2006; Weiss, 2007; Weiss et al., 2012). This follows thegrowing appreciation for the complexity of developmentin these skeletal features (Schlecht, 2012). Discussion ofthe interaction of factors influencing the morphology ofMSMs is beyond the scope of this article. However, theserecent articles importantly caution against reductionismin modeling the effects of any factor on any skeletalmorphology. This stated, current evidence supports therelationship between the size of entheses with bonestrength, and so some ultimate correlate of MSMs withthe loading mechanics of the skeleton (Niinimaki, 2012).What is clear from the literature is that a number of fac-tors likely contribute to the size, shape, and surface areaof muscle and tendon insertions. In the present analysis,muscle attachment site mapping is used to examinewhether asymmetry in clavicular entheses is related tothe overall pattern of asymmetry observed in diaphysealcurvature and dimensions.Biomechanically, the clavicle acts as a strut for the
upper limb and serves as an attachment site for a num-ber of back, neck, chest, and shoulder muscles and liga-ments: trapezius, sternocleidomastoid, pectoralis major,deltoid, subclavius, the coracoclavicular, and acromiocla-vicular ligaments. The complex arrangement of muscleattachments may partially explain the clavicle’s distinc-tive shape; however, some of this explanation undoubt-edly lies in its unique development (Ljunggren, 1979;Voisin, 2001, 2006). The clavicle is the first bone to ossifyand the last bone to fuse. Two primary ossification cen-ters appear around 6 weeks in utero and unite to form asingle center about a week later (Scheuer and Black,2000). It undergoes both intramembranous and endo-chondral ossification during development and assumesadult form in utero. The lateral epiphysis appears andunites just before the second decade of life (17–19 years)(Todd and D’Errico, 1928), but the medial epiphysis fusesduring the mid- to late-20s, and this process occurs overa period of roughly 10 years (Scheuer and Black, 2000;Langley-Shirley and Jantz, 2010).Two of the most recent analyses of asymmetry in the
human clavicle have used linear dimensions to examinethe potential effects of loading and development on thisbone. Mays et al. (1999) used a skeletal collection ofadults and subadults from medieval England to addresssome of the complex factors that have been suggested aspossible causes of clavicle asymmetry. They examinedcurvature (using two-dimensional measurements fromradiographs), length, robusticity, vascularization, andthe morphology of muscle attachment sites and con-cluded that clavicle asymmetry was due most likely tolaterality in mechanical loading. Auerbach and Raxter(2008) also found that activity patterns and loadingbehavior contribute significantly to clavicle asymmetry,with diaphyseal breadths being more sensitive than
lengths to the effects of loading. However, they add thatthe unique developmental pathway of the clavicle mayaccount for the atypical pattern of asymmetry observedin this bone. Thus, though the metrics in these studieswere able to establish a consistent pattern of asymmetry,neither was capable of assessing the hypothesized fac-tors that influenced those directional biases.Given the complex, three-dimensional loadings that
occur in the clavicle, an alternative approach may aug-ment these prior investigations. Recent advances in com-puter modeling have enabled more detailed and sophisti-cated analyses of skeletal size and shape than are possiblewith traditional osteometrics. Our research group hasused statistical bone atlases as a method to investigate sexand ancestry differences, as well as a means to automatebony landmark approximation and measurement calcula-tion (Mahfouz et al., 2007a,b, 2009, 2012; Shirley, 2009). Abone atlas is an average mold, or template mesh, that cap-tures the primary shape variation in a skeletal elementand allows for the comparison of global shape differencesbetween groups or populations and facilitates computer-generated measurements. Three-dimensional models areconstructed by segmenting a set of computed tomographyscans. Each of these models consists of tens of thousandsof triangular faces and vertices that are used to align themodels in the atlas and to provide standardization, nor-malization, and landmark correspondence across the data-set. The power of a statistical bone atlas lies in the factthat it allows for the extraction of size and/or shape infor-mation from a large sample of bones with a high degree ofaccuracy and precision. Furthermore, nontraditional meas-urements, as well as any number of novel analyses acrossall points of the atlas are possible, as will be demonstratedin the present analysis. Shirley’s (2009) investigation ofsex dimorphism in clavicular morphology revealed that thestatistical bone atlas is an effective tool for studying thiscomplex bone. Although two dimensions have merits fordetermining DA in size and a limited interpretation ofshape, three dimensions more effectively facilitate exami-nations of skeletal elements with complex curvatures.This study will add to the existing literature by con-
ducting a novel three-dimensional analysis of length,robusticity, curvature, and muscle attachment areas onthe clavicle. Muscle attachment sites were mapped ontothe clavicle atlas to examine the relationship betweenthese sites and areas of significant asymmetry in malesand females to address the question of biomechanicalfactors influencing asymmetry. The clavicle atlas pro-vides the opportunity to conduct analyses over the entirebone surface (comprised of 15,000 vertices), to describevariation at a high resolution with [150 measurementsat pre-determined locations, and to visualize differencesin size and shape between the left and right sides acrossa large sample of adult males and females. This analysiswill demonstrate that the atlas is an effective tool toevaluate and visualize skeletal asymmetry in more thantwo dimensions. The three-dimensional approach usedhere will allow us to test the muscle attachment hypoth-esis and to examine the nuances of asymmetry in thiscomplex skeletal element.
MATERIALS AND METHODS
Sample and data acquisition
The sample for this study is a subset of the WilliamMcCormick Clavicle Collection at the University ofTennessee. The McCormick Collection consists of
548 E.E.A. FATAH ET AL.
American Journal of Physical Anthropology
clavicles from 2,694 Americans with mid- to late-20thcentury birth years. The collection is derived from thepost-industrial East Tennessee region, so the results ofthis study cannot be universalized to all human groups.In this analysis, right and left clavicles from 505 individ-uals (285 males, 220 females) were selected using twocriteria. First, only adults above 30 years of age wereused to ensure complete union of the medial epiphysis.Second, only normal, non-pathological, and non-fracturedbones were selected, as antemortem fractures affect bonedimensions. The clavicles were packed into foam boxesand CT scanned using 0.625 3 0.625 3 0.625-mm cubicvoxels. The DICOM images acquired from the CT scanswere then manually segmented, and surface modelswere generated as shown in supporting information Fig-ure S1. This segmentation process has been proven reli-able with a negligible inter-observer error rate of 0.163mm, intra-observer error of 0.105 mm, and pairwiseinter-observer variability of 0.269 mm (Mahfouz et al.,2007a,b, 2012).
Statistical atlas
The segmented bone models were then added to thestatistical atlas. A statistical atlas is a powerful tool forskeletal analyses because it allows for point correspond-ences and ensures that the surface points on each bone
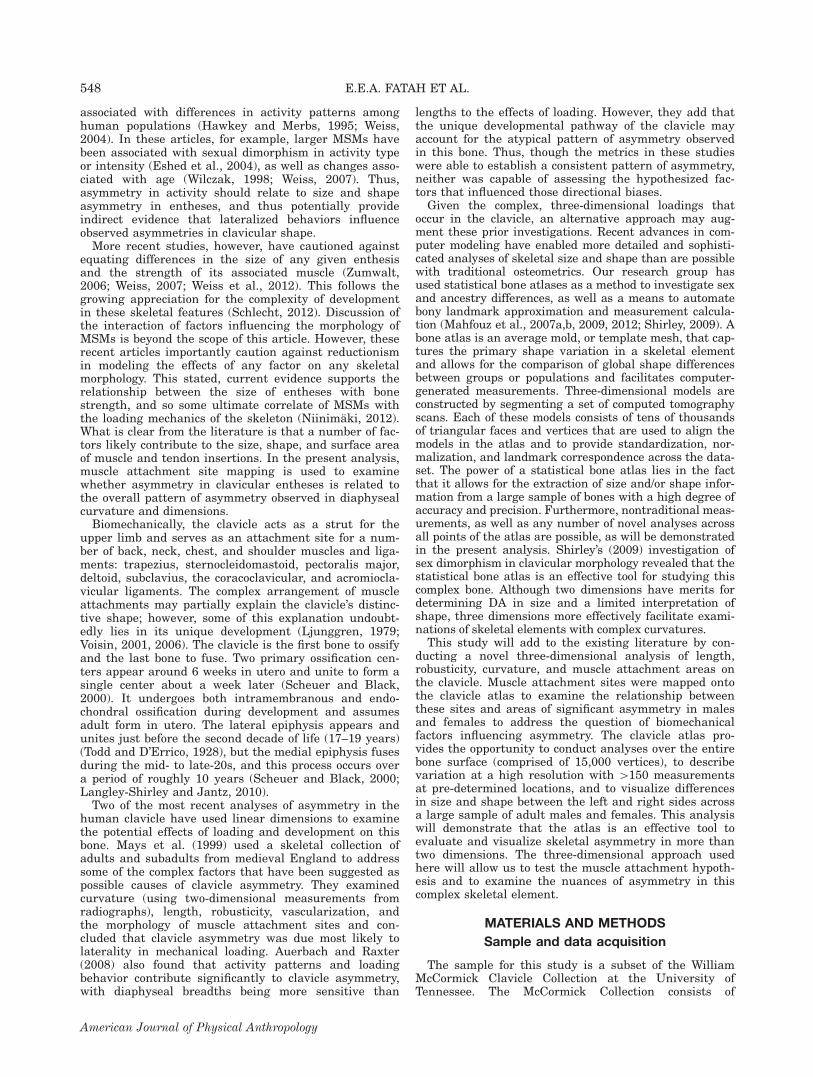
are homologous across the entire population of bones inthe atlas. Figure 1 provides a detailed outline of thealgorithm used to add bones to the statistical atlas.Briefly, a template mesh was first generated from atraining set consisting of all bones and remeshed adap-tively to ensure that areas of greater curvature have amore dense point distribution than areas of lesser curva-ture. To add bones to the atlas, the template mesh (atlas)was aligned to the new mesh (from the bone model to beadded) using the principal axis as a reference. Featurepoints (i.e., the ridges and more prominent areas on thebone) on both meshes were then detected, and the fea-ture points on the template mesh were then matched tothose on the new mesh and rigidly aligned. This stepwas followed by affine deformation of the template mesh,which then undergoes an iterative free-form deformationstep under the constraints of the matching points withinan adaptive fuzzy sphere and a specified normal direc-tion tolerance. The search sphere adapts its radiusaccording to the relative root mean square (RMS) dis-tance error between the template mesh that undergoesthe deformation and the new mesh to be added. Thefinal step involves relaxing the deformed template meshto match exactly to the new mesh to be added and calcu-lating the correspondence between point indices of themeshes. The RMS error was then calculated between theoutput model from the atlas and the original mesh to be
Fig. 1. Flow chart illustrating the procedure of adding bone models to the clavicle atlas. 1. Template and model to be added arealigned using principal axes. 2. Feature points (i.e., ridges and prominent points) are calculated on both the template and model tobe added. 3. Feature points are matched. 4. Affine deformation is used to match template model features with features of model tobe added. 5. Affine transformation is applied to the entire template bone model. 6. Template model constrained free-form deforma-tion is applied (i.e., an iterative process where each point on the template model is moved to match the shape of the model to beadded). 7. Correspondence between models is computed (i.e., the homologous anatomical points between the template and the modelto be added are tagged).
549BILATERAL DIRECTIONAL ASYMMETRY IN THE CLAVICLE
American Journal of Physical Anthropology
added. The process of adding a bone to the atlas assurescorrespondence between homologous anatomical regions(i.e., landmarks, muscle, and ligament attachment sites)across the entire population. In this study, four clavicleatlases were constructed: right male, right female, leftmale, and left female.
Automatic analysis
To fully identify morphometric differences due toasymmetry and sexual dimorphism, a two-step featureextraction methodology was implemented as shown insupporting information Figure S2. This methodologyfacilitated two objectives essential to this analysis. (1)The method eliminates inter- and intra-observer errorwith automatic landmarking and computer-automatedmeasurements. In general, computer-automated meas-urements guarantee 100% precision of the output meas-urements; however, they do not guarantee 100% accu-racy, and this is due to the possibility of the presence ofbias or systemic error. However, bias error can bedetected easily and, in the case of comparative studiesperformed with the same measurement system for allgroups, this error will not affect the outcome, as it willbe constant across all groups being compared. (2) Thisthree-dimensional analysis enabled us to evaluate theentire bone surface for morphological differences, includ-ing important muscle and ligament attachment sites.This method expands the capacities of two-dimensionalanalyses as it allows for the examination of both intrin-sic and extrinsic surface properties that may be other-wise difficult to capture, especially in the case of spa-tially complex bone shapes.
Landmarking and cross-sectional analyses. Land-marks were automatically calculated on each bone in theatlas. Figure 2 outlines the method used to calculatelandmarks and extract cross-sectional data along theentire bony surface. First, the medial axis was calculatedby finding the bone surface that intersects with planesthat are normal to the principal axis every 5% of theoverall bounding box length (i.e., maximum length). The5% increments begin at the lateral end of the clavicle(0%) and proceed towards the medial end (100%). Eachof these planes was then rotated to find the contour thatgives the minimum cross-sectional diameter. The meanof these contours represents the points of the medialaxis. An iterative regression procedure was then per-formed to fit polylines between these points. The lengthof each segment was then calculated, as well as theangle between each segment. The second step involvesfinding the waist contour, which is the contour with thesmallest circumference. Area, circumference, maximumdiameter, and minimum diameter were calculated foreach cross-sectional contour and the waist contour. Anadditional measurement was calculated to estimate theprecise location of the waist along the shaft of each bone.Next, to find more biomechanically relevant cross-sec-
tional contours than might be offered by the 5% shaftincrements, cross-sectional contours along specific mus-cle attachment sites were identified. Figure 3 outlinesthe method of muscle attachment site localization andcross-sectional contour calculation at these sites. First, amean bone for the population was calculated and usedas a reference bone to localize five muscle attachmentsites (trapezius, sternocleidomastoid, pectoralis major,subclavius, and deltoid). In addition, the attachment
Fig. 2. Automatic algorithm for calculating cross-section contours and the medial axis. 1. Calculate the principal axis. 2. Calcu-late maximum length using the bounding box. 3. Divide maximum length into 5% intervals (these intervals define the center pointof a set of planes normal to the principal axis). 4. Rotate each plane to find the plane that minimizes the cross-sectional area of theintersecting bone contour. 5. Find the waist contour. 6. Calculate area, circumference, maximum, and minimum diameter of eachcontour. 7. Use the center points of these contours to define the medial axis points. 8. Fit polylines in the medial axis points. 9. Cal-culate the length of each segment and the angles between segments.
550 E.E.A. FATAH ET AL.
American Journal of Physical Anthropology
sites for the costoclavicular and conoid ligaments weremapped onto the bone atlas. As entheses are difficult todetect on some areas of the clavicle, and particularly infemales, a standard anatomical text was referenced toapproximate muscle and ligament attachment sites(Gray’s Anatomy of the Human Body, available online athttp://www.bartleby.com). These sites were then propa-gated across the entire sample using the statistical atlasand its ability to generate correspondence betweenhomologous anatomical sites. Three cross-sectional con-tours were calculated along each muscle attachment siteat 20%, 50%, and 80% of the length of the bounding boxof each site (i.e., the total length of the muscle attach-ment site). As with the 5% increment contours, area, cir-cumference, maximum diameter, and minimum diameterwere calculated for each cross-sectional contour of themuscle attachment sites.For each measurement, percent DA (%DA), percent
absolute asymmetry (%AA), and percent bias were calcu-lated for both males and females as outlined below. Per-cent bias was used as a means of calculating asymmetryas a count variable. This calculation was chosen becauseit offers a different way of expressing DA, as it elimi-nates potential problems associated by the use of de-scriptive statistics in calculating %DA (%DA is a signednumber and can lead to the generation of mean andstandard deviation values that do not reflect the truedifferences between populations).
%DA ¼ ðRight� LeftÞAverageðRightþ LeftÞ � 100
Fig. 3. Diagrammatic chart showing the identification of the muscle attachment sites and contour calculations at these sites. 1.An expert locates muscle attachment sites on a mean model generated from the bone population in the atlas. 2. Atlas correspon-dence is used to propagate muscle attachment sites to all models. 3. Muscle attachment site length is calculated using the boundingbox. 4. Minimum cross-section contours at 20%, 50%, and 80% of the attachment length are located. 5. Area, circumference, maxi-mum, and minimum diameter of each contour is calculated.
3D surface analysis. Both the size and shape of a skel-etal element must be considered to fully explore areas ofpotential asymmetry. Figure 4 outlines the surface anal-ysis carried out in this study. To identify asymmetricaldifferences in size, left and right models for each individ-ual were first aligned by extracting the homogenoustransformation using the corresponding points acrossmodels (Mahfouz et al., 2007a,b, 2012). After this align-ment, the distance between each homologous point pairon the left and right model was then calculated for eachindividual across the entire population. From these dis-tances, the average distance, standard deviation, andRMS distance for each individual was calculated, and anaverage distance map for both males and females wasgenerated.To isolate size and examine the shape differences,
right and left models were aligned and normalized to thesame size using point correspondences. The same analy-sis described above for the un-normalized bones was per-formed on the normalized dataset. To identify sites onthe bone with statistically significant asymmetry, the leftand right models for each individual were aligned,and the mean model of both sides was calculated. The
551BILATERAL DIRECTIONAL ASYMMETRY IN THE CLAVICLE
American Journal of Physical Anthropology
distance between every point on the mean model andeach corresponding point on both left and right modelswas calculated. Paired sign tests were then performedon these distances for each point across the population,giving a P value for each point on the model. These Pvalues were then used to generate a surface map show-ing areas of significant difference between the right andleft clavicle for both sexes.
Statistical analysis
All measurements were analyzed for asymmetry differ-ences within and between the sexes. The mean andstandard deviation were calculated for each measure-ment, and a chi-square goodness-of-fit test was used totest for normality. Statistical significance of asymmetri-cal differences within each sex was calculated using thepaired t-test for normally distributed variables; pairedsigned tests were used in cases of non-normality, as thistest does not assume symmetry of the two distributionsbeing compared. To test for significant differencesbetween the sexes two sample t-tests were used for nor-
mally distributed variables, and two-sample Kolmogorov-Smirnov tests were used in cases of non-normality.
RESULTS
Cross-sectional analyses
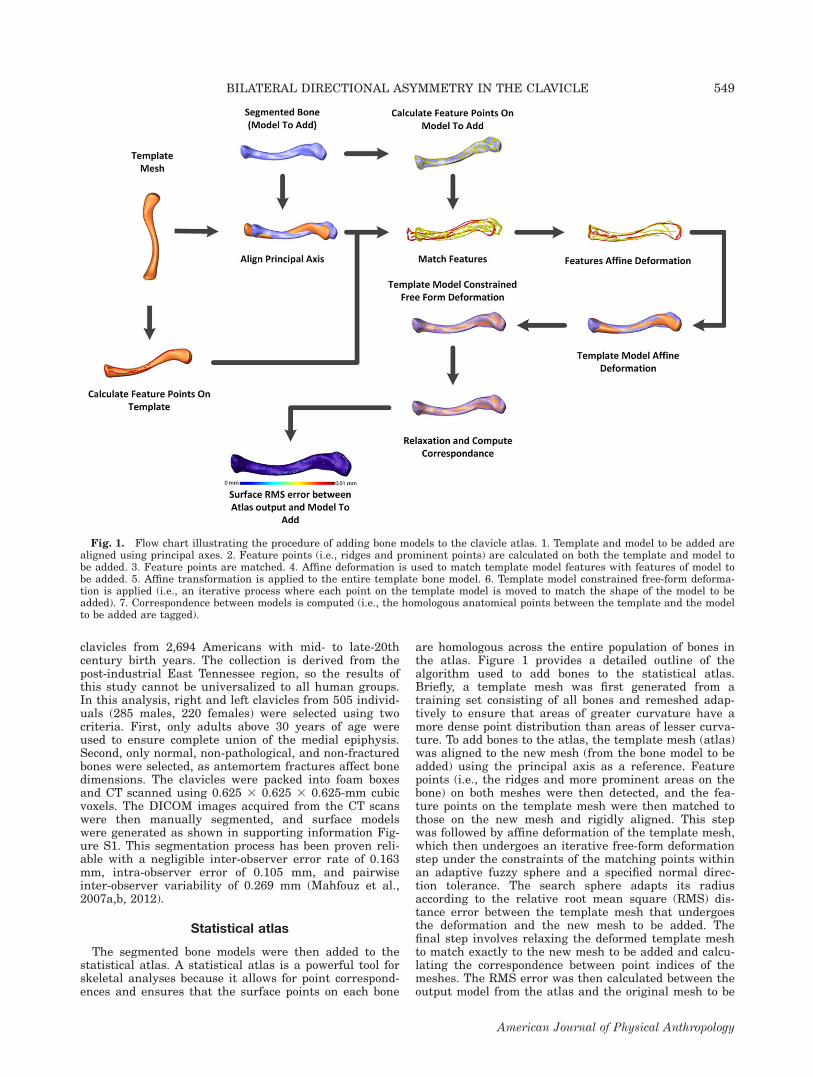
Results of the contour analysis at each 5% length in-crement are presented in Table 1. Measurements arepresented for the increments of greatest interest to thisdiscussion. Overall, the results agree with previous stud-ies (Parsons, 1916; Mays et al., 1999; Auerbach andRaxter, 2008) in that the left clavicle is longer than theright, and the right clavicle is more robust than the left(Fig. 5). There were no significant differences in the loca-tion of the clavicle waist between the left and rightsides. For males, all measurements were significantlydifferent between the left and right clavicle. However,the results of the female analysis are more variable.From 10–55%, all measurements are significantly differ-ent between the right and left clavicle except the mini-mum diameter of the contours; then, from 80–95%, thereis significant asymmetry in all measurements except the
Fig. 4. Flow chart outlining paired and two-sample 3D surface analysis performed on clavicle. a) Non-normalized paired surfaceanalysis: 1. Align left and right clavicle for each individual (rotate and translate). 2. Calculate distance between each correspondingpoint on the left and right model. 3. Calculate mean and standard deviation of the distance for each point across the population. b)Normalized paired surface analysis: 1. Align left and right clavicle for each individual (rotate, translate, and scale) using General-ized Procrustes Analysis. 2. Calculate the distance between each corresponding point on left and right model. 3. Calculate meanand standard deviation of the distance for each point across the population. c) Identifying areas of significant asymmetrical differen-ces: 1. For each individual, calculate the mean bone using the left and right clavicle. 2. Calculate the distance between each corre-sponding point on left and right mean model. 3. Calculate the distance between each corresponding point on left and right meanmodel. 4. For each individual, compute the P value of each point between the left and left mean and between the right and rightmean using the paired sign test. 5. Rank the points using calculated P values.
552 E.E.A. FATAH ET AL.
American Journal of Physical Anthropology
maximum diameter of the contours. In other words,there appears to be a notable ‘‘twist’’ in the female clavi-cle near midshaft that is not evident in the male clavicle,where the significantly asymmetrical dimension changesfrom the maximum diameter at the lateral end to theminimum diameter at the medial end. Typically, themaximum diameter of the lateral end is in the anterior-posterior direction; the medial end is rounder and morevariable, but the minimum diameter is often in the ante-rior-posterior direction. Figure 6 compares the contoursat 10% increments from the left and right clavicle of atypical male and female from this sample.Table 2 presents the results of the contour analysis at
the muscle attachment sites. Again, males were signifi-cantly asymmetric (right-biased) at all locations exceptthe maximum diameter of the contour located at thelateral portion of the trapezius insertion. Although notdepicted in this Table, both of the ligament attachmentsites (conoid and costoclavicular) were significantly right-biased, as well. The contour differences at the femalemuscle attachment sites followed the patterns observed inthe cross-section increments. The medial muscle attach-ments (pectoralis major and sternocleidomastoid) weremore robust on the right side except for the maximumcontour diameters. The midshaft and lateral muscle
attachment sites (subclavius, deltoid, and trapezius) weremore robust on the right side except for the minimumcontour diameters. Although not depicted in the Table,the ligament attachments followed the same convention,with the contour at the costoclavicular ligament not regis-tering significant for the maximum diameter and the min-imum contour diameter of the conoid ligament registeringinsignificant. Figure 7 presents the asymmetry bias ineach of the measurements at muscle attachment sites.Figure 8 compares the contours at the 20, 50, and 80%increments of each muscle attachment site. Lookingclosely at Table 2, it is noteworthy that, for some of thesignificant measurements, the standard deviation isgreater than the mean value (e.g., waist area was 1.4%greater on the right side in males, but the standard devia-tion was 3%). This is due to the fact that %DA is a signedvalue, and, because of bias in its calculation, it may notrepresent the true mean of the population. Using %Biasas a measure of asymmetry avoids this problem. This isevident by examining both Table 2 and Figure 7 wheresome of the areas had values below 50, but in Table 2,these values are positive, indicating a non-significantright bias.Table 3 shows the measurements at the cross-section
contours and the muscle attachment sites in which the
TABLE 1. Contour measurements at each cross-section for males (M) and females (F)
a Insignificant asymmetry differences (P [ 0.05).A and C, cross-sectional area and circumference, respectively; ML, overall length; Mx and Mn, maximum and minimum diametersof the cross-section. DA, directional asymmetry; AA, absolute asymmetry; SD, standard deviation; WP, waist point.WP describes the location of the waist on the diaphysis. Negative values indicate a left bias; positive values indicate a right bias.
553BILATERAL DIRECTIONAL ASYMMETRY IN THE CLAVICLE
American Journal of Physical Anthropology
magnitude of asymmetry (as reflected by AA) is signifi-cantly different between males and females. The magni-tude of asymmetry for maximum length is significantlygreater in males than in females. However, the remain-ing significant differences show greater magnitudes ofasymmetry in females except for the contours at the del-toid origin and trapezius insertion on the lateral end,where the magnitude of asymmetry is significantlygreater in males. Tables S1 and S2 in supporting infor-mation present descriptive statistics of each measure-ment at cross-section contours and muscle attachmentsites, including power tests to indicate the number ofbones that would be required for the measurement toregister significant at a 5 0.05. Finally, results of themedial axis analysis are shown in Table 4. There are nosignificant differences between the lengths and angles ofthe segments in males, hence curvature asymmetry isminimal. However, females exhibit significant differencesin segment angles, indicating curvature differencesbetween the left and right clavicle.
3D surface analysis
Figure S3 in supporting information offers a visualiza-tion of the morphological differences between a left andright clavicle from an individual male and female in thisstudy sample. The un-normalized and normalized dis-tance maps are shown in supporting information FiguresS4 and Figure 9, respectively. These maps show the av-erage distance between homologous points on the left
Fig. 5. Histogram of maximum length and cross-sectional contours at 10% increments and maximum length. Asymmetry is pre-sented as a count variable, where values >50 are right-biased and <50 are left-biased. See Table 1 for abbreviations.
Fig. 6. Contour differences at 10% increments, where 10% 5lateral end and 90% 5 medial end. The vertical direction is ante-rior-posterior, and the horizontal direction is superior-inferior.
554 E.E.A. FATAH ET AL.
American Journal of Physical Anthropology
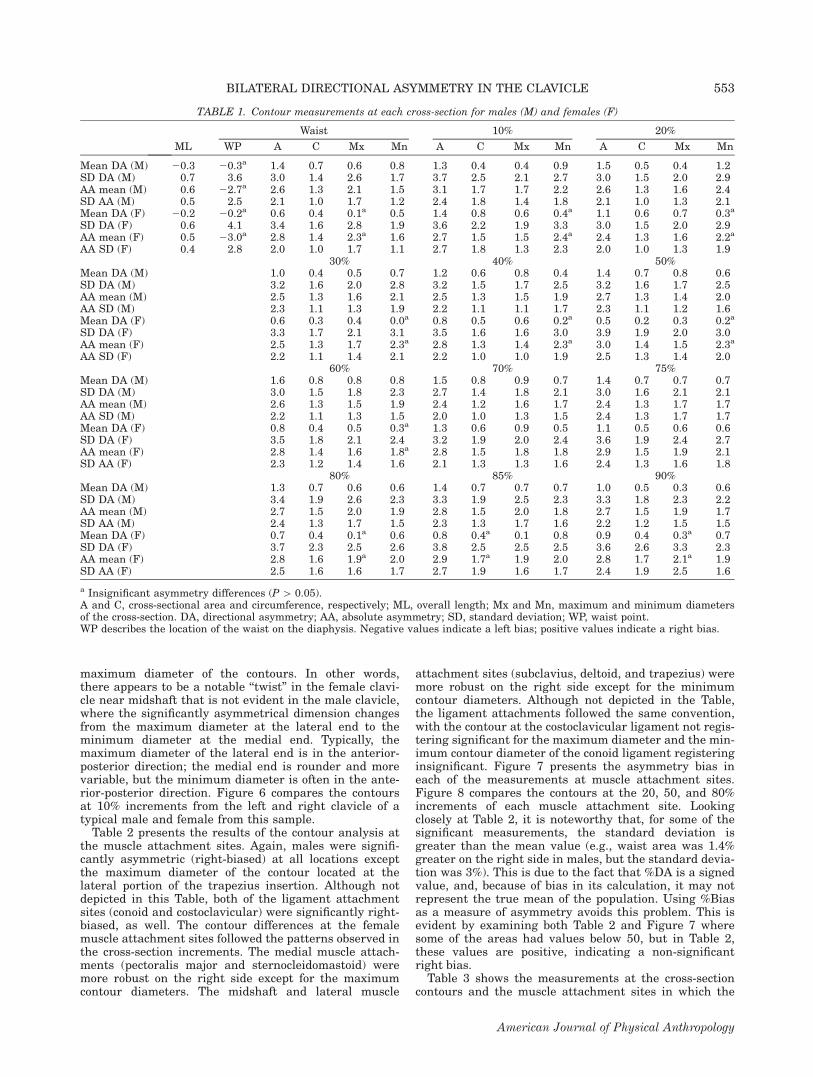
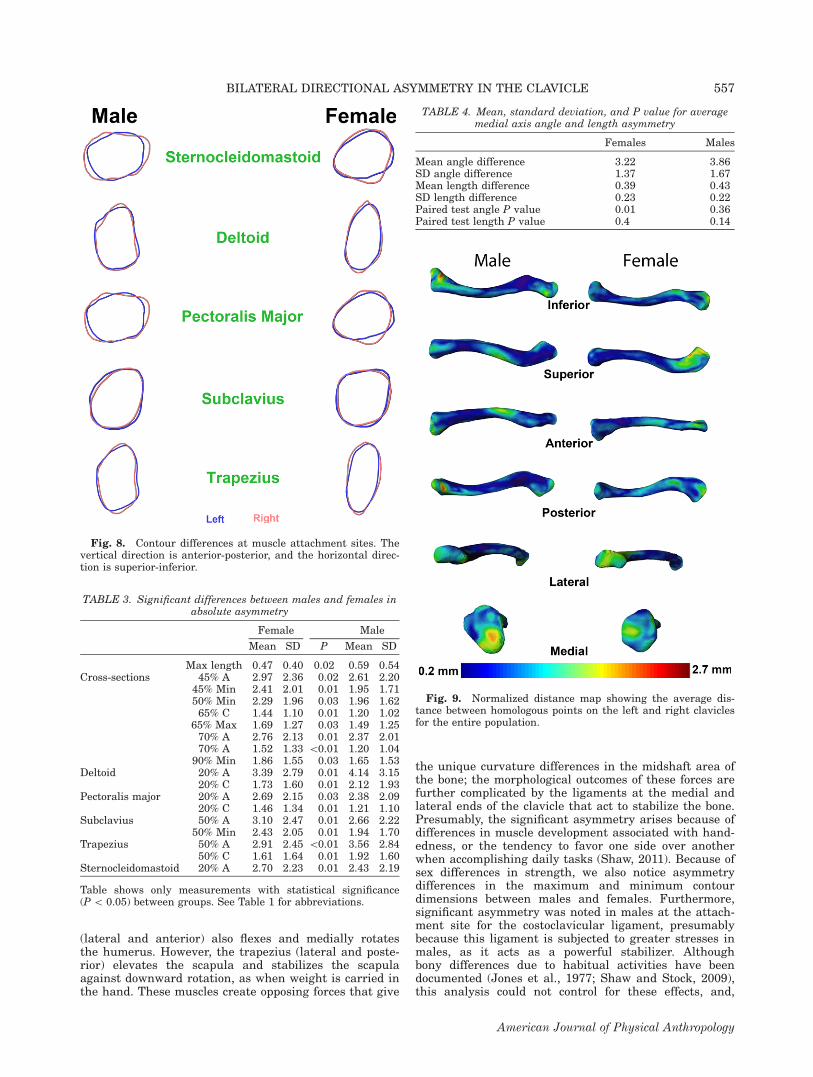
and right clavicles for the entire population. In thisstudy, an average RMS error of 0.01 mm was achievedfor all bones as shown in supporting informationTable S3. The un-normalized distance map shown insupporting information Figure S4 reflects primarily sizedifferences. The greatest differences in this figure are inthe maximum length, as reflected by the hotspots on theends of the bone. The muscle attachment sites onthe lateral end of the clavicle also show up (primarilythe deltoid origin), but to a lesser extent than maximumlength. The normalized distance map (Fig. 9) reflectsprimarily shape differences. For males, the greatestasymmetry is at the medial end on the inferior portionof the bone in the area of the costoclavicular ligament.For females, the greatest differences are at the lateralend (deltoid origin and trapezius insertion). Additionally,an area in the midshaft registers for both sexes,although more so in males; the implications of this areawill be discussed in the conclusions.
Figure 10 presents the surface map showing the sig-nificant differences between the left and right claviclesbased on the P values from paired sign tests. The pairedsign test was used to compare the distance between ev-ery point on a mean model and each corresponding pointon the left and right models across the entire population.The most significant differences for both sexes (shown inblue) are in the lateral end (superior surface), midshaft(inferior surface), and medial end (anterior surface). Themajority of these areas are muscle attachment sites (Fig.11). In Figure 11, the P values were thresholded so thatP [ 0.1 are red and P \ 0.1 are blue. In addition, themuscle attachment sites were superimposed onto themodel to show the location of the areas of significantasymmetry in relation to these sites. The attachmentsites that register as significant areas of asymmetry arepectoralis major and deltoid (anteriorly) and subclavius(inferiorly). As shown in the normalized distance maps,there is an area on the posterior midshaft that registers
TABLE 2. Asymmetry of contour measurements at each muscle attachment site for males (M) and females (F)
a Insignificant asymmetry differences (P [ 0.05).See Table 1 for abbreviations.
555BILATERAL DIRECTIONAL ASYMMETRY IN THE CLAVICLE
American Journal of Physical Anthropology
highly significant and, in males, a small area on themedial end. The former will be discussed below, andthe latter is the attachment site for the costoclavicularligament.
DISCUSSION
The results confirm the existing studies on clavicleasymmetry, namely that the left clavicle is longer thanthe right, but the right is more robust than the left,most likely on account of lateralized behaviors (Parsons,1916; Mays et al., 1999; Auerbach and Raxter, 2008). Inaddition, by analyzing all points across the clavicle atlasand overlaying the areas of significant asymmetry withmuscle attachment sites, this analysis has substantiatedarguments about the biomechanical factors contributingto clavicle asymmetry. However, the pattern of asymme-try differs between males and females. Males are signifi-cantly asymmetric in all dimensions and muscle and lig-ament attachment sites, whereas female asymmetry ismore variable. We hypothesize that this has to do withthe absolute and relative differences in male musclestrength compared to females. Although it is natural forcertain muscles to be stronger than others, specificallythose that are used more frequently or for more arduoustasks, absolute muscle strength is greater in males thanin females (Brown et al., 2010). These strength differen-ces can be explained by the anthropometric differencesbetween males and females. Females are smaller thanmales, and, from a biomechanical perspective, longer le-ver arms provided by longer bones combined with largervolumes of muscle tissue produce larger torques (Vasa-vada et al., 2008).
Another explanation for sexual dimorphism in musclestrength lies in the differences in muscle fiber composi-tion between males and females, where women havehigher proportions of Type 1 muscle fibers and largerType 1 muscle fiber size and area compared to men(Simoneau and Bouchard, 1989; Staron et al., 2000;Jaworowski et al., 2002; Wuest et al., 2008). Type 1 mus-cle fibers are the weakest and are associated withsmaller motor units, therefore, Vasavada et al. (2008)maintain that this factor should be considered in addi-tion to anthropometric differences in explaining strengthdifferences between males and females. Interestingly,the descending trapezius is one such muscle with signifi-cantly smaller muscle fiber size in women (Lindman etal., 1991). As the magnitude of asymmetry was greaterin females for all contour measurements except those atthe trapezius and deltoid, this hypothesis may offer arelevant interpretation of sexual dimorphism in musclestrength.Whatever the cause, we hypothesize that the sex
dimorphism in absolute strength accounts for the male-female differences in clavicle size and shape asymmetry,and the generally greater strength of the muscles on theright side of the body in the majority of individualsaccounts for the greater robusticity of the right claviclecompared to the left. One area that registered signifi-cantly asymmetric in both sexes was on the posteriormidshaft—an area with no muscle attachments (Fig. 11).We suggest that this difference is a curvature differencecaused by the differential action of the muscles on themedial and lateral ends of the bone. The pectoralis major(medial and anterior) acts to adduct, medially rotate,and flex the humerus at the shoulder joint; the deltoid
Fig. 7. Histogram of cross-sectional contours at muscle attachment sites. Asymmetry is presented as a count variable, wherevalues >50 are right-biased and <50 are left-biased. See Table 1 for abbreviations.
556 E.E.A. FATAH ET AL.
American Journal of Physical Anthropology
(lateral and anterior) also flexes and medially rotatesthe humerus. However, the trapezius (lateral and poste-rior) elevates the scapula and stabilizes the scapulaagainst downward rotation, as when weight is carried inthe hand. These muscles create opposing forces that give
the unique curvature differences in the midshaft area ofthe bone; the morphological outcomes of these forces arefurther complicated by the ligaments at the medial andlateral ends of the clavicle that act to stabilize the bone.Presumably, the significant asymmetry arises because ofdifferences in muscle development associated with hand-edness, or the tendency to favor one side over anotherwhen accomplishing daily tasks (Shaw, 2011). Because ofsex differences in strength, we also notice asymmetrydifferences in the maximum and minimum contourdimensions between males and females. Furthermore,significant asymmetry was noted in males at the attach-ment site for the costoclavicular ligament, presumablybecause this ligament is subjected to greater stresses inmales, as it acts as a powerful stabilizer. Althoughbony differences due to habitual activities have beendocumented (Jones et al., 1977; Shaw and Stock, 2009),this analysis could not control for these effects, and,
TABLE 4. Mean, standard deviation, and P value for averagemedial axis angle and length asymmetry
Females Males
Mean angle difference 3.22 3.86SD angle difference 1.37 1.67Mean length difference 0.39 0.43SD length difference 0.23 0.22Paired test angle P value 0.01 0.36Paired test length P value 0.4 0.14
Fig. 9. Normalized distance map showing the average dis-tance between homologous points on the left and right claviclesfor the entire population.
Fig. 8. Contour differences at muscle attachment sites. Thevertical direction is anterior-posterior, and the horizontal direc-tion is superior-inferior.
TABLE 3. Significant differences between males and females inabsolute asymmetry
Female Male
Mean SD P Mean SD
Max length 0.47 0.40 0.02 0.59 0.54Cross-sections 45% A 2.97 2.36 0.02 2.61 2.20
45% Min 2.41 2.01 0.01 1.95 1.7150% Min 2.29 1.96 0.03 1.96 1.6265% C 1.44 1.10 0.01 1.20 1.02
65% Max 1.69 1.27 0.03 1.49 1.2570% A 2.76 2.13 0.01 2.37 2.0170% A 1.52 1.33 \0.01 1.20 1.04
90% Min 1.86 1.55 0.03 1.65 1.53Deltoid 20% A 3.39 2.79 0.01 4.14 3.15
20% C 1.73 1.60 0.01 2.12 1.93Pectoralis major 20% A 2.69 2.15 0.03 2.38 2.09
20% C 1.46 1.34 0.01 1.21 1.10Subclavius 50% A 3.10 2.47 0.01 2.66 2.22
50% Min 2.43 2.05 0.01 1.94 1.70Trapezius 50% A 2.91 2.45 \0.01 3.56 2.84
50% C 1.61 1.64 0.01 1.92 1.60Sternocleidomastoid 20% A 2.70 2.23 0.01 2.43 2.19
Table shows only measurements with statistical significance(P \ 0.05) between groups. See Table 1 for abbreviations.
557BILATERAL DIRECTIONAL ASYMMETRY IN THE CLAVICLE
American Journal of Physical Anthropology
consequently, this factor is outside of the realm of thisstudy’s conclusions.Importantly, moreover, this study has shown that sta-
tistical bone atlases are powerful tools for analyzing dif-ferences in skeletal morphology, especially (though notlimited to) bilateral asymmetry. The atlas enables a com-plete 3D surface analysis between homologous points onbone surfaces, which effectively captures more informa-tion about bony differences than 2D methods, particu-larly in the case of bones with complex morphologies andcurvature patterns. Computer-automated landmarkingand measurement extraction reduces observer error andenables rapid data collection from large datasets. Fur-thermore, once the skeletal elements are added to theatlas and digital library, they are available for any num-ber of analyses, thereby eliminating the need to returnto skeletal assemblages for additional data collection.Initially, we attempted to use measurements that were
comparable to the standard clavicle osteometrics takenwith calipers (maximum length, sagittal diameter at mid-shaft, and vertical diameter at midshaft). However, two ofthese measurements are highly problematic, regardless ofwhether data collection is done manually or computer-automated: sagittal and vertical diameters at midshaft. Itis not possible to find the true sagittal and vertical orien-tations of the clavicle unless the bone is in vivo. As aresult, a certain amount of observer error is intrinsic tothese measurements. Furthermore, although sagittal di-ameter is typically greater than vertical diameter, this isnot always the case, and this difference is not necessarilysignificant. As bone is typically laid down where neededand resorbed where not needed (usually in response to bio-mechanical stresses), and bone is stronger (and presum-ably thicker) in the dimensions in which it is commonlyloaded, we maintain that taking maximum and minimumdiaphyseal measurements may be more biomechanicallyrelevant. Research supports the hypothesis that bones candiffer in size and shape depending on the manner, fre-quency, and intensity with which they are mechanically
loaded (Ruff, 2000; Shaw and Stock, 2009; Marchi andShaw, 2011). Consequently, the maximum and minimumdiameters of each contour were used in this analysisbecause they addressed the primary research question ofasymmetry in relation to biomechanical stresses.In conclusion, the use of statistical atlases and com-
puter-automated measurements for three-dimensionalanalyses of intra- and intermorphological variation acrosspopulations has proven to be a powerful tool to examineclavicular asymmetry and test the muscle attachment hy-pothesis (Mahfouz et al., 2007a,b, 2009, 2012; Shirley,2009). Testing this hypothesis is not as transparent in abone such as the clavicle, where entheses are not as devel-oped as in the direct load-bearing skeletal elements. Con-sequently, this project addressed the question by examin-ing the size and shape of the areas where muscles and lig-aments attach to the clavicle. The atlas enabled athorough examination of these areas, and we were able toconclude that clavicle asymmetry is attributable to biome-chanical factors. Blind analyses of bony anatomy withoutconsideration of the functional components of the skeletalelements—individually and as an anatomical whole—canbe uninformative and misleading. The use of three-dimen-sional automated methods in this study to assess clavicleasymmetry revealed significant differences in biomechani-cally relevant areas, thus raising the need to expand thisanalysis in the future to include additional bones to obtaina more complete picture from both functional and develop-mental perspectives. Finally, we suggest the use of %Biasas a measure for asymmetry to avoid problems of calculat-ing descriptive statistics on %DA, which may result inmisrepresentations of the true asymmetrical differences.
LITERATURE CITED
Auerbach BM, Raxter MH. 2008. Patterns of clavicular bilateralasymmetry in relation to the humerus: variation amonghumans. J Hum Evol 54:663–674.
Fig. 10. Surface map showing significant differencesbetween the left and right clavicles based on the P values frompaired sign tests.
Fig. 11. Surface map of thresholded P values (P > 0.1 5 redand P < 0.1 5 blue) with super-imposed muscle attachmentsites (green).
558 E.E.A. FATAH ET AL.
American Journal of Physical Anthropology
Auerbach BM, Ruff CB. 2006. Limb bone bilateral asymmetry:variability and commonality among modern humans. J HumEvol 50:203–218.
Brown RE, Edwards DL, Jakobi JM. 2010. Sex differences inforce steadiness in three positions of the forearm. Eur J ApplPhysiol 110:1251–1257.
Eshed V, Gopher A, Galili E, Hershkovitz I. 2004. Musculoskel-etal stress markers in Natufian hunter-gatherers and Neo-lithic farmers in the Levant: the upper limb. Am J PhysAnthropol 123:303–315.
Hawkey DE, Merbs CF. 1995. Activity-induced musculoskeletalstress markers (MSM) and subsistence strategy changes amongancient Hudson Bay Eskimos. Int J Osteoarchaeol 5:324–338.
Helmkamp RC, Falk D. 1990. Age- and sex-associated variationsin the directional asymmetry of Rhesus macaque forelimbbones. Am J Phys Anthropol 83:211–218.
Jaworowski A, Porter MM, Holmbaeck AM, Downham D, LexellJ. 2002. Enzyme activities in the tibialis anterior muscle ofyoung moderately active men and women: relationship withbody composition, muscle cross-sectional area and fibre typecomposition. Acta Physiol Scand 176:215–225.
Jones HH, Priest JD, Hayes WC, Tichenor CC, Nagel DA. 1977.Humeral hypertrophy in response to exercise. J Bone JointSurg 59:204–208.
Kujanova M, Bigoni L, Veleminska J, Veleminsky P. 2008. Limbbones asymmetry and stress in Medieval and recent popula-tions of Central Europe. Int J Osteoarchaeol 18:476–491.
Langley-Shirley NR, Jantz RL. 2010. A Bayesian approach toage estimation in modern Americans from the clavicle. J For-ensic Sci 55:571–583.
Lindman R, Eriksson A, Thornell LE. 1991. Fiber type composi-tion of the human female trapezius muscle: enzyme-histo-chemical characteristics. Am J Anat 190:385–392.
Mahfouz MR, Abdel-Fatah EE, Bowers LS, Scuderi G. 2012.Three-dimensional morphology of the knee reveals ethnic dif-ferences. Clin Orthop Relat Res 470:172–185.
Mahfouz MR, Abdel-Fatah EE, Merkl BC, Mitchell JW. 2009.Automatic and manual methodology for three-dimensionalmeasurements of distal femoral gender differences and femo-ral component placement. J Knee Surg 22:294–304.
Mahfouz MR, Badawi A, Merkl BC, Abdel-Fatah EE, PritchardE, Kesler K, Moore MK, Jantz RL, Jantz LM. 2007a. Patellasex determination by 3D statistical shape models and nonlin-ear classifiers. Forensic Sci Int 173:161–170.
Mahfouz MR, Merkl BC, Fatah EE, Booth R, Argenson JN.2007b. Automatic methods for characterization of sexualdimorphism of adult femora: distal femur. Comput MethodsBiomech Biomed Engin 10:447–456.
Marchi D, Shaw CN. 2011. Variation in fibular robusticityreflects variation in mobility patterns. J Hum Evol 61:609–616.
Mays S, Steele J, Ford M. 1999. Directional asymmetry in thehuman clavicle. Int J Osteoarchaeol 9:18–28.
Niinimaki S. 2012. The relationship between musculoskeletalstress markers and biomechanical properties of the humeraldiaphysis. Am J Phys Anthropol 147:618–628.
Parsons FG. 1916. On the proportions and characteristics of themodern English clavicle. J Anat 51:71–93.
Ruff CB. 2000. Biomechanical analyses of archaeological humanskeletons. In: Katzenberg MA, editor. Biological anthropologyof the human skeleton. New York: Wiley-Liss.
Ruff CB, Jones HH. 1981. Bilateral asymmetry in cortical bone ofthe humerus and tibia: sex and age factors. Hum Biol 53:69–86.
Sarringhaus LA, Stock JT, Marchant LF, McGrew WC. 2005.Bilateral asymmetry in the limb bones of the chimpanzee(Pan troglodytes). Am J Phys Anthropol 128:840–845.
Schell LM, Johnston FE, Smith DR, Paolone AM. 1985. Direc-tional asymmetry of body dimensions among white adoles-cents. Am J Phys Anthropol 67:317–322.
Scheuer L, Black S. 2000. Developmental juvenile osteology.New York: Academic Press.
Schlecht SH. 2012. Understanding entheses: bridging the gapbetween clinical and anthropological perspectives. Anat Rec295:1239–1251.
Schultz AH. 1937. Proportions, variability and asymmetries ofthe long bones of the limbs and clavicles in man and apes.Hum Biol 9:281–328.
Shaw CN. 2011. Is ‘hand preference’ coded in the hominin skele-ton? An in-vivo study of bilateralmorphological variation.J Hum Evol 61:480–487.
Shaw CN, Stock JT. 2009. Habitual throwing and swimmingcorrespond with upper limb diaphyseal strength and shape inmodern human athletes. Am J Phys Anthropol 140:160–172.
Shirley NR. 2009. Age and sex estimation from the human clav-icle: an investigation of traditional and novel methods. Disser-tation. Knoxville: The University of Tennessee.
Simoneau JA, Bouchard C. 1989. Human variation in skeletalmuscle fiber-type proportion and enzyme activities. Am JPhysiol 257:E567–E572.
Staron RS, Hagerman FC, Hikida RS, Murray TF, Hostler DP,Crill MT, Ragg KE, Toma K. 2000. Fiber type composition ofthe vastus lateralis muscle of young men and women. J Histo-chem Cytochem 48:623–629.
Steele J, Mays S. 1995. Handedness and directional asymmetryin the long bones of the human upper-limb. Int J Osteoar-chaeol 5:39–49.
Stock JT, Davies T, Sarringhaus L, Shaw CN. 2012. Threedimensional quantification of upper limb bilateral asymmetryamong modern humans and great apes. Am J Phys Anthropol147:278–279.
Todd T, D’Errico J. 1928. The clavicular epiphyses. Am J Anat41:25–50.
Vasavada AN, Danaraj J, Siegmund GP. 2008. Head and neckanthropometry, vertebral geometry and neck strength inheight-matched men and women. J Biomech 41:114–121.
Voisin J-L. 2001. Evolution de la morphologie claviculaire ausein du genre Homo. Consequences architecturales et fonc-tionnelles sur la ceinture scapulaire. L’Anthropologie 105:449–468.
Voisin J-L. 2006. Clavicle, a neglected bone: morphology andrelation to arm movements and shoulder architecture in pri-mates. Anat Rec A Discov Mol Cell Evol Biol 288A:944–953.
von Bonin G. 1962. Anatomical asymmetries of the cerebralhemispheres. In: Mountcastle VB, editor. Interhemisphericrelations and cerebral dominance. Baltimore: Johns HopkinsPress.
Weiss E. 2007. Muscle markers revisited: activity pattern recon-struction with controls in a central California Amerind popu-lation. Am J Phys Anthropol 133:931–940.
Weiss E, Corona L, Schultz B. 2012. Sex differences in musculo-skeletal stress markers: problems with activity pattern recon-structions. Int J Osteoarchaeol 22:70–80.
Wilczak CA. 1998. Consideration of sexual dimorphism, age,and asymmetry in quantitative measurements of muscleinsertion sites. Int J Osteoarchaeol 8:311–325.
Wuest RC, Morse CI, de Haan A, Jones DA, Degens H. 2008.Sex differences in contractile properties and fatigue resistanceof human skeletal muscle. Exp Physiol 93:843–850.
Zumwalt A. 2006. The effect of endurance exercise on the mor-phology of muscle attachment sites. J Exp Biol 209:444–454.
559BILATERAL DIRECTIONAL ASYMMETRY IN THE CLAVICLE