A TRIDENT SCHOLAR o PROJECT REPORT IM FILE COP NO. 151 THE EFFECTS OF TRANSOM GEOMETRY ON THE RESISTANCE OF LARGE SURFACE COMBATANTS UNITED STATES NAVAL ACADEMY ANNAPOLIUS, MARYLAND ". NOV 0 3 I988I T his document has been approved for public" reles and sale; its distribution is unlimited. 88 11 3 J
Transcript
A TRIDENT SCHOLARo PROJECT REPORT IM FILE COP
NO. 151
THE EFFECTS OF TRANSOM GEOMETRY ON THE
RESISTANCE OF LARGE SURFACE COMBATANTS
UNITED STATES NAVAL ACADEMYANNAPOLIUS, MARYLAND
". NOV 0 3 I988I
T his document has been approved for public"
reles and sale; its distribution is unlimited.
88 11 3 J
SICURITY CLASSIFICATION OP THIS PAOE ( on Dot inhered)HIAD WC TRUCTION
REPORT DOCUMENTATION PAGE strong COMPLZ u O FORMI. REPORT NUMuEP ' 12. GOVT ACC9eSSION NO. 3. TWRTIPECNT'S CATALOG NUMSIER
U.S.N.A. - TSPR; no. 151 (1988)
4. TITLE (end Subtitle) S. TYPE OP R1PORT a PCRIOD COVERED
THE EFFECTS OF TRASOM GEOMETRY N 'rHE RESISTANCE Final 1987/88OF LARGE SURFACE COMBATANTS. Fn ____9__/88
S. PERPleORMING ORO. REKPORT NUM1111
7. AUTHOR(a) S. CONTRACT OR GRANT NUM9R(s)
Thomao K. Kioo
S- PERFORMINO ORGANIZATION NAME AND AODRESI 10. PROGRAM gLEMENT, PROJCT, TASKA REA A WOqK UNIT NUMEERS
UJni t,> States Naval Academy, Annapolis.
I". CONTROLLINO OFFICE NAME AND ADORES3 12. REPORT DATE
10 June 1988UnLtod StatiL tval Academy, Annapolis. 13. NUMUERM OF PAGES
9314. MONItORINO AGENCY NAME & AODOR SS(I dilierent from Controlling Office) 1. SCURITY CLASS, (of thie rep.)
i., OlC kAISI JICATIONi'DOWNGRADING
I6, DISTRIBUTION STATEMENT (of this Report)
Thi document hao been approved for public releace;, its distribution isUNL fMITED.
17. DISTRISUTION STATEMENT (ol the ebstract entered In Stock 20, It different trome Report)
IS. SUPPLEMENTARY NOTES
Acc. pttfri by the U. ". Trident 'cholaz' Committee.
9, KYE WORDS (Cintinue an ,voreof side IfI neaesary and Identily by lek num ber).:,h.L) 'it:l~t.ce . / ,
Hulls ( (*avl architecture"irjHydir,),. n aJm ic 3, ( { { .
I'0 KA~ fRACT (Confinfie an reverse ade It necessary' and Idenilly by block number)
r--Thiu report preoento the results of 'n Inveatigation into the calm waterr,nL, tance characteriLtica of a series of transom sterned ship., -'he researchw, . ,onducttd az a Trident 3cholar project fit the U.S. Naval Acade-m. Fivetrtnjom : hape,3 and their corresponding %fter-bodies were designed to examineth.! i'fect, ()' lrri't 'anm bewn fit the transom on ship resistance. There were two,r~fjt and two berm variationa from a common baseline hull, The forebody was --p ,,
(oVER)
D IJ1 1473 EOITION OF INOV 6 IS OSSOLETC UNCLaSSIFIES 'N 0102. Li. 014. 6601 SECURITY CLASIIFICATION OP THIS PAO* (utn Dote Wweoo
I I i . I I I . I i I I I .IiU! ! ,,..
VNCT,A "TFTT'SECURITY CLASSIFICATION OF THIS PAGE (fte. Does Zntred)
held constant for all five designs. Each of the variations represented typicalsurface combatants of the frigate/destroyer family. Models were built of eachhull and still water resistance tests were run in the 380 foot towing tankat the 11. S. Naval Academy's Hydromechanics Laboratory. Analytical studies ofeach hull were performed using existing potential flow code algorithms.
V/
I
1 Acr !' : For7_
"4.,. ... " 1
S N 0 1 0 2 L F 0 1 4 . 6O 1 U C A S F E
SE URT -A S O T1S D nSECRIY CAUNFCASSI4 F TIS ED 'hnDtaEt
*curve. As was expected, at the high end of the speed
range, the cruiser stern shape became increasingly
inferior to the transom stern shape as far as resistance
is concerned. At 32 knots for example, the cruiserm
sterned hull requires 11.6 percent more EHP than the
transom sterned hull. The two curves became coincident at
about 23 knots. Below 22 knots, the cruiser stern hull
exhibits lower EHP than the transom stern hull.
To show clearly the relatively small changes in EHP
due to the systematic transom shape variations, a
"percent difference from baseline values" format was
developed. For Figures 26 and 27, the ordinate has the
pform:
% Difference in EHP =((EHP-EHPBASELINE)/EHPBASELINE) XI00
Figure 26 shows the effect of transom draft
variation while Figure 27 shows the effect of transom
beam over the speed range for the standard (design)
displacement. The continuous curves shown in Figures 26
and 27 represent the experimental predictions of the
effects of transom draft and beam on EHP. These figures
show clear, but not dramatically large, differences in
EHP throughout the entire speed range tested due to
transom geometry differences. The most significant trends
b
54
II
6 441-4
I %4 -4
4-1
-~~ .440--4 X
* C4 w(
0 0 0
v. 0.> g
4i ~- N >
dH NI3N83AI
55
Ic
II
I I
I C4
14
imw
:1 n
0.0
/ .- C
'- -', Ow
00
4-0
41.-4
r V
S1'_ I
1-1 NJ 33N3J(
a I -I I -
1~ '0 1-41.
.. . . ... "' g l~i l m~iiiul ~ * mmllmh~~lm~-ql i- l I - - I 2
56
shown are those for speeds greater than 20 knots. At the
low speed end of the plot, the high speed trends tend to
reverse, but it must be remembered that the differences
represent a few percent of a much smaller horsepower (see
Figure 25) than at higher speeds. A 2 percent difference
in EHP at 16 knots represents about 37 horsepower, while
a 2 percent difference at 25 knots represents about 186
horsepower.
To compare the flow code predictions with the
experimental predictions just described, Figures 28
through 33 are presented. In every figure, the faired
experimental curves of Figures 26 and 27 are repeated to
facilitate comparison. Figures 28 and 29 show the XYZFS
predictions as discrete plot symbols. In contrast to the
apparently good agreement in Figure 25, the lack of
correlation with the faired curves indicates to the
author that the XYZFS flow code is not sufficiently
sensitive to discern the effects of small changes in
transom geometry. While this may seem to contradict the
work of Hoyle et alI0 , it must be remembered that the
bulb geometry changes investigated by Midshipman Hoyle
were at the extreme bow whereas the transom geometry
variations were at the stern where greater viscous flow
effects must certainly exist. The other flow code
predictions fared no better.
57
V '0
o (1) tI
".4 0 14 I41.3 C44) 0
U) ) to.4 0- 0 ~ 1
(ai , I 4-lao
-4 4 400
44 4. ".ato 4) in tn4 3 CA to >
0 .4 13 0. 14
0 +- -4 >
0 .- 4
~j 14 0.0.0)
~~ 3 '~~~ U) *4O > aa
JH3~~~4- NN3Na3J~
58
4J0
a. 04 4 )
'U 4
41 4
U) 4- 0)
S0 I
0 N ci'--4 0 4 > a
00 0)cn
Li~L 0 . 04
+1w w
0 .4 t
0 )
I "-40
0
I-o
04 - I
_H NILju333I(
59
* Figure 30 and 31 show the discrete points computed by the
interpolation method of Wilson et a15 . Recalling that
Wilson's work was based on XYZFS, it is not surprising
that the agreement with the experimental trends is
similarly poor. Figures 32 and 33 show the experimental
curves from Figures 26 and 27 plotted with the discrete
points computed by SRPM.
A very rough Prohaska form factor analysisII was
performed on the data for each hull form configuration.
Although the results must be considered approximate,
since the number of data points acquired at extreme low
speeds was very small, the form factors for the different
transoms were found to differ by as much as 2 percent.
While such results must be validated by more extensive
experimentation at Froude numbers between 0.1 and 0.2,
n the tentative conclusion is that much of the difference
in resistance among the forms tested could be attributed
to form resistance phenomena rather than to wavemaking
resistance. This conclusion supports the earlier
statement of the greater viscous flow influence for
geometric changes at or near the stern of the ship.
Figures 34 and 35 show the effects of transom draft and
transom beam respectively for the heavier displacement
condition. Only experimental trends are shown.
b
60
N4
/Q* 0
'4j 0I 0
o 0 +I4. Q 0
r- toJ --
+4[1
w 0 4l
U)0
0I -4~-
4
44 W N LI-4
Nd N 1.4
w- L4 tO 0) $44 x 2.4c 0)
0 o 41-(a t4 ) .0 0
'IP V
(J + '
dH3 NI 30N383-4JIG %
61
-40
04.-4
) -I
EltN)
to > >
L~J ) 4
1-
0 0o N0 p a
w~(L 0 Q,
-- -
.41 1
M) 4
0(.
N.0 w
C1 N
* dH3 NI :3N a3iJIa %
62
-4I~
41 4'1.
44 %.40
: 3 0 4 -4I
$44 C14Q ' 0f 7\1 0
*2) P-i $4 (n
a 0 U) 04
0. 0
C) co w~C
4)E
dH3 NI3N8J1(
63
0
V 0 a.s:-4to 4o5 0 4 .
. /o
m *aCI0
IA0 4.1 -
.) 0 C
023 44 4
C1 w w
IfIi
It w4C
r- z 0
014/ 00
dH3~CN NIOWNd--A(
64
*
lvi --000J
0 \Z LFl,-4
C4 w
in
N a -4)
0 0O0 )
r-40
0. 4 0
• 1,- .4,
'\\ 0
' 0 C'J
I 3 14 W* 0. '-4 .. >
' I - :I I
I I I I I-
l,--4o - (3-l ai%/ I I I I"p
0 c1H3 NI 3ON3;11i4IQ
e0
65
co~
II
r.40
4j r- 4 J44 >
t ow
ko 14 0 -0
--/ j* wc,
N .
*1-
d0 NI> 3 3 -Aa- ..4 4)
I °/ 4)-
l4 I I I I
z d 3 I N/3..0I
II0
- - -- nN ulln~minill l I U / I l • I
66
CONCLUSIONS
Relatively small changes in transom geometry have been
shown to cause small but measurable changes in a ship's
calm water EHP. Experimental data indicate that:
U(1) For a fixed transom sectional area,
beam, and displacement:
* a) A deep transom causes up to a
2 percent increase in EHP at high
speeds above a Froude number of 0.38.
At low speeds, below a Froude
number of 0.38, the deep transom shows
a marginal advantage in EHP of as
much as 1 percent.
b) A shallow transom causes up to a
2 percent decrease in EHP at high
* speeds above a Froude number of 0.38.
At low speeds, below a Froude
number of 0.38, the shallow transom
* shows an addition to EHP of as much
as 2 percent.
S u n | mIm m lmm. .
67
(2) For a fixed transom sectional area,
transom draft, and displacement:
a) a wide transom causes up to a
3 percent decrease in EHP at high
speeds above a Froude number of 0.29.
At low speed, below a Froude
number of 0.29, the wide transom shows
an increase to EHP by as much as 1.75
percent.
b) a narrow transom cause an increase in
EHP throughout the entire tested
i speed range.
(3) While the wide, shallow transom offers
n the least resistance in the higher speed
range, there is no clear best
configuration at low speeds.
(4) At high speeds, the hull that trims the
most tends to have the highest
resistance. This is especially true with
the beam variation series. For the draft
variation series, no significant trim
difference was observed.
68
(5) When displacement is increased 20% above
a nominal design condition the relative
order of the transom variations remains
but the resistance (and thus EHP)
increases 21 percent.
(6) The narrow beam transom, which exhibited
the highest resistance - especially at
higher speeds - clearly caused the
greatest surface wave disturbance in the
towing tank.
(7) The transom ventilation speed is
relatively insensitive to transom beam
and draft variations at a fixed transom
area ratio, AT/AX. Saunders'
rule-of-thumb Froude number tends to predict
transom ventilation at slightly lower speeds.
While one hypothetical ship size was chosen for
illustrative purposes, the model data included can be
expanded using conventional Froude scaling techniques to
any reasonable ship size typical of frigates, destroyers,
or cruisers.
69
5 Flow codes do not appear sensitive enough to discern
properly the effects of small transom geometry changes.
However, they are able to approximate ship resistance and
could be used for preliminary design powering estimates.
SUGGESTIONS FOR FUTURE RESEARCH
The present systematic series should be expanded to
include immersed transom areas greater and lesser than
the area used in this project. These extensions should
use the same rationale as developed in this project. Both
beam and draft should be varied while holding immersed
transom area constant. This would allow examination of
the effect of varying immersed transom area on ship
resistance. In addition, this would verify the results of
* the present study concerning the effects of transom beam
and draft. Further series should also focus on the
effects of concave and convex buttock lines and
waterlines on resistance.
Modifications to the basic transom shape should also
be examined. A transom with rapidly increasing beam above
the waterline (i.e., flare) should be tested to see if
the resistance benefits of medium beam transom at low
speeds can be combined with the resistance benefits of
b wide beam transoms at high speeds. A systematic stern
L
70
wedge series should also be designed and tested on the
five hulls designed in this project. Eventually, the
effects of transom geometry studied in calm water should
be quantified similarly in various ambient wave
conditions representative of real ocean operation. Both
motions and added resistance should be studied.
ACKNOWLEDGMENTS
The author of this Trident Scholar Report wishes to
gratefully acknowledge the assistance of the following
people:
Dr. Chu Chen of Naval Sea Systems Command foranalyzing the transom series using XYZ Free Surface.
Mr. Tom Price of the U.S. Naval Academy TechnicalSupport Department for the production of the sternstested in this project.
Mr. John Hill and the entire staff of the NavalAcademy Hydromechanics Laboratory for theirassistance in all phases of this project.
And most importantly, Dr. Roger Compton who servedas the Trident Scholar Advisor for this project.
• I m ,, H l /l E H l . ..
REFERENCES 71
1. "Test of Transom Sterns on Destroyers," UnitedStates Experimental Experimental Model BasinReport 339, November 1932.
2. Gillmer, Thomas C., "Tank Tests of SeveralTransom-Stern Configurations on Destroyer EscortType Hulls," United States Naval AcademyHydromechanics Laboratory Report E-3, December 1961.
3. Saunders, Capt. Harold E., USN (ret.),Hydrodynamics in Ship Design, The Society of NavalArchitects and Marine Engineers, New York, 1957.(Volume II pp. 530-531)
4. Jenkins, D., Nagle, T., and O'Dea, J., "FlowCharacteristics of a Transom Stern Ship," DavidTaylor Naval Ship Research and Development CenterReport 81/057, September 1981.
5. Thomason, T.P., Wilson, M.B., "Study of TransomStern Ship Hull Form and Resistance," David TaylorNaval Ship Research and Development Center Report85/072, April 1986.
6. Principles of Naval Architecture, The Society ofNaval Architects and Marine Engineers, New York,1967. (pp. 341-364)
7. Eggers, K.W.H., Sharma, S.D., and Ward, L.W., "AnAssessment of Some Experimental Methods for
*Determining the Wavemaking Characteristics of a ShipForm," Transactions of the Society of NavalArchitects and Marine Engineers, 1967.
8. Dawson, C.W., "A Practical Computer Method forSolving Ship-Wave Problems," Proceedings of theSecond International Conference in Numerical ShipHydrodynamics, September 1977. (pp. 30-38)
9. Gertler, M., "A Reanalysis of the Original Test DataFor the Taylor Standard Series," David W. TaylorModel Basin Report 806, March 1954.
10. Cheng, B.H., Hays, B., Hoyle, J.W., Johnson, B., andNehrling, B., "A Bulbous Bow Design Methodology forHigh-Speed Ships," Transactions of the Society ofNaval Architects and Marine Engineers, 1986.
11. Harvald, S. A., Resistance and Propulsion of Ships,Wiley-Interscience Ocean Engineering Series,New York, 1983. (pp. 101-103)
p
72
APPENDIX A
* TRANSOM SERIES MEASURED
DATA PLOTS WITH FAIRED CURVES
NOTE: HULL FORMS ARE IDENTIFIED AS FOLLOWS:
TS/a//b 8r/_ 7r
WHERE a = MULTIPLIER FOR DISPLACEMENT
b = MULTIPLIER FOR TRANSOM BEAM
6 c = MULTIPLIER FOR TRANSOM DRAFT
6 w ., ., . -,*w ... m g nmm l . n
5 73
i U.S. Naval Academy* 380' Towing Tank
TransomSeries DataT/ For
7 Sl0&/l. 0BT1 /l. 3TT
1988 Tride;nt ScholarMid'n Thomas K. Kiss
3 CTM
52
L =L 11.33 ft
WSAM - 14.25 ft 2
&M 171.3 lbs
Zero Static Trim
CFM 650F Fresh Water
- ~ - 5 7 V /S
FIGURE Al
74
U.S. ['aval Academy380' Towing Tank
TransomSeries Data
ForTS/1.0A/I.OBT/1.3TT
c,1 1988 Trident Scholar XMid'n Thomas K. Kiss
-- ------- ----- ----
LF - 1133xft
U-C L
LWLM 14.25 ft21
&M 171.3 lbs A
Zero Static Trim
650F Fresh Water E
7vr
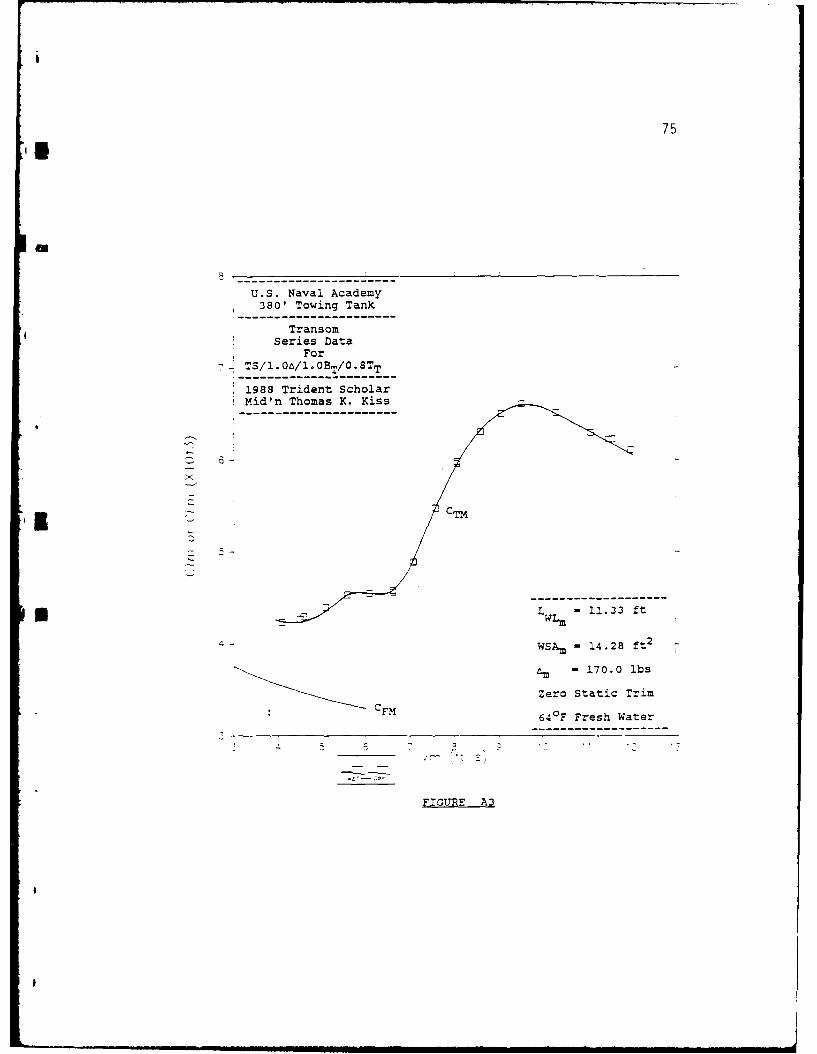
FIGURE A2
75
U.S. Naval Academy380' Towing Tank
TransomSeries Data
For OS-TS/1.0&/l.OBT/O.T
*1988 Trident scholar*Mid'n Thomas K. Kiss
x
L IL - 11.33 ft
WSAm -14.28 ft2
AM - 170.0 lbs
Zero Static TrimCFM 64OF Fresh Water
FIGURE A3
76
0.2 - - - - - - - - - - -
U.S. Naval Academy380' Towing Tank
TransomSeries Data
ForTS/l.O/1.0BT/0.8TT
01 1988 Trident ScholarM 1 id'n Thomas K. Kiss
WSAm = 14.28 ft 2
Zero Static Trim
5 40 Fresh Water
Z64FP
I,-6 7 5 C "2 "
-C..~i L / "-11 33 f
6 FIGURE A4
-- ------------------
S-
77
U.S. Naval Academy380' Towing Tank
TransomSeries Data
For7 J TS/l.Oa/O.8BT/1.OTT
1988 Trident ScholarMid'n Thomas K. Kiss
1- CTM
z 5-i
L - 11.33 ft
4 WSAm - 14.24 ft2
I' 171.2 lbs
Zero Static TrimFM 620F Fresh Water
25 5 7 9 'C-IV 's
FIGURE AS
78
0.2 - - - - - - - - - -
U.S. Naval Academy380' Towing Tank
----Transom----Series Data
ForITS/1.0Oi/O.8BT/l.OTT
0.1 21 988 Trident ScholarIMid'n Thomas K. Kiss
Fp
0_
L WM- 11.33 ft
WSAM - 14.24 ft2
am 171.2 lbs AP
EZero Static Trim
620 F Fresh Water
-, 5 6 7 720Vr
FIGURE A6
79
U.S. Naval Academy1 3801 Towing Tank
TransomSeries Data
7 For
1988TrientScholarMid'n Thomas K. Kiss
- 5
L 11.33 ft
4 1WSAM 14.28 ft2
am 170.1 lbs
Zero Static Trim
620 F Fresh Water
3 4 5 6 a
FIGURE A7
80
0.2 -- - -- - -- - -
U.S. Naval Academy380' Towing Tank
TransomSeries Data
ForTS/l. Oa/1.2BT/1. OTT
01 1988 Trident ScholarMid'n Thomas K. Kiss
Z Fp
0
L - 11.33 ft
WS m - 14.28 ft2 A
&m 170.1 lbs
Zero Static Trim
626F Fresh Water-C.2-----------------------
3 4 5 6 7 5 CV'
FIUR A
81
U.S. Naval Academy380' Towing Tank
Transom4 Series DataFor7 - TS/1'2&/I'0T/I"0OTT/
1988 Trident ScholarMid'n Thomas K. Kiss
- I
(2H
5z
L - 11.33 ft
WSA - 15.47 ft 2
&m = 204.8 lbs
Zero Static TrimCFM
..--..---- _ 660F Fresh Water
5 6 7 C 2 ~Vr/
FIGURE A9
82
0.2 - - - - - - - - - - -
U.S. Naval Academy3801 Towing Tank
TransomSeries Data
For
1988 Trident ScholarMid'n Thomas K. Kiss F
I---------------------------- ________
I E.Z. FP X
I0
6A
83
U.S. Naval Academy380' Towing Tank
Transom4 Series Data
For7 -11TS/1.2&/l.0BTr/1.3TT
1988TrientScholarMid'n Thomas K. Kiss
C 6TM
L 11.33 ft
4 WS =15.50 ft2
=~ 205.6 lbs
Zero Static Trim
FM 65OF Fresh Water- - - - - - - - - - - - - -
.3 5 5 7
FIGRE AllS
84
U.S. Naval Academy380' Towing Tank
4 TransomSeries Data
For0.1 TS/l.2L/1.OBT/l. 3 TT
1988 Trident ScholarMid'n Thomas K. Kiss
FP
AP
L =11.33 ftWLM
0.1WSAM 15.50 ft2
am 205.6 lbs L
Zero Static Trim
65OF Fresh Water
5 6 7r. -
* FIGURE A12
85
U8
U.S. Naval Academy380' Towing Tank
TransomSeries Data
7 For71TS/1. 2 A/l.OBT/O.STT
1988 Trident ScholarMid'n Thomas K. Kiss
C-I
UL - 11.33 ft* WLM
WSAm - 15.52 ft2
&m 204.0 lbs
Zero Static Trim
* M 640F Fresh Water
.3 5 6 7 V -r -
FIGUR~E A13
86
0.2 - - - - - - - - - - -
U.S. Naval Academy3801 Towing Tank
g TransomSeries Data
Forci TS/l.2&/l.OBT/O.STT F-1988Trident ScholarMid'n Thomas K. Kiss
-. C
--11.33 ftWIM
IW5 - .5.5-2 ft 2 A
am =204'.0 lbs
Zero Static Trim
640F Fresh Water
36
FIGURE A14
87
U.S. Naval Academy3801 Towing Tank
Transom4 Series Data
For7] TS/l.2A/O.8BT/l.OTT7]1988 Trident Scholar
Mid'n Thomas K. Kiss
x
: 7
L -11.33 ft
WSAM - 15.49 ft2
&M 205.4 lbs
Zero Static Trim
7r 620F Fresh Water
-- -- -- - -- -- -
FIGURE A15
88
U.S. Naval Academy3801 Towing Tank
0.7 TS/l.2a/0.8BT/l.0TT
- - - - - - - -0
198 Tri.en Scht a
WMidnToa .Ks
L - 215.4 lbt
*Zero Static Trim ____
I620F Fresh Water
44
FIGU'RE A16
89
-U.S. -NavalAcademy380' Towing Tank
TransomSeries Data
7! ForTS/1. 2A/1. 2BT/l. OTT
1988 Trident ScholarpMid'n Thomas K. Kiss
LWL = 11.33 ft
U WSAm -15.51 ft2
CFM Am - 204.1 lbs
_______ Zero Static Trim
I620 F Fresh Water
7Vm ('/s ic i 2
FIGURE A17
90
0.2-
U.S. Naval Academy380' Towing Tank
TransomSeries Data
For
1988 Trident Scholar FMid'n Thomas K. Kiss
~- 0 -
LuLCnC
Am 204.1 lbs
Zero Static Trim
620? Fresh Water ..
-02 -
3 4 5 7 7 1
FIURE A18
li
91
APPENDIX B
Feb SAMPLE FLOW CODE RESULTS
L1
SSSSSSIS RRRRRRRR 22pPPPPPP MM MM 92
SS RR RR PP PP MMM MMMSS RR RR PP PP MMMM MM.IM
SSSSSSS RRRRRRRR PPPPPPPP MM MM MM MM55 RR RR PP MM MM MM MMS5 RR RR PP MM MMM MM