A Two-Step Theory and Test of Democratic Waves * Christian Houle † Mark Andreas Kayser ‡ Jun Xiang § February 2015 Abstract Scholars, observing clustering in transitions to democracy, argue that democratization diffuses across borders as citizens in autocracies demand the same reforms they wit- ness in neighboring states. We disagree. The present paper asserts that the diffusion of democracy literature rests on weak theoretical foundations and does not properly test for diffusion. We advance an alternative two-step argument to explain clustering of democratization: (1) economic shocks, which are clustered spatially and tempo- rally, induce the breakdown of authoritarian regimes; then (2) democratic diffusion, in turn, influences whether a fallen dictatorship will be replaced by a democracy or a new autocracy. Diffusion, despite playing an important role, is insufficient to explain the clustering of transitions, notably because it cannot account for the timing of the waves. Using data on 125 autocracies from 1875 to 2004, we show that economic crises trigger authoritarian breakdowns, while diffusion determines whether the new regime is democratic or authoritarian. * Thanks to John Ahlquist, Leonardo Baccini, Horace Bartilow, Bill Bernhard, Cristina Bodea, Marc Capelovitch, Michael Colaresi, Lawrence Ezrow, Erik Gartzke, Kristian Gleditsch, Bob Goodin, Matt Grossmann, Mark Hallerberg, Paul Kenny, Soo Yeon Kim, Patrick Kuhn, David Leblang, Arndt Leininger, Rene Lindst¨adt, Katja Michaelowa, Layna Mosley, Thomas Pl¨ umper, Stephanie Rickard, Julian Schumacher, Ken Shadlen, Frederick Solt, Corwin Smidt, Hugh Ward and Dwayne Woods for helpful comments, to Carles Boix for generously sharing data, to Jude Hays for sharing some code, and to Elizabeth Lane for outstanding research assistantship. Previous versions of this paper have benefited greatly from presentations at the International Political Economy Society, the University of Essex, the London School of Economics and Michigan State University. † Michigan State University, [email protected]‡ Hertie School of Governance, Berlin, [email protected]§ Rutgers University, [email protected]
Transcript
A Two-Step Theory and Test ofDemocratic Waves∗
Christian Houle†
Mark Andreas Kayser‡
Jun Xiang§
February 2015
Abstract
Scholars, observing clustering in transitions to democracy, argue that democratizationdiffuses across borders as citizens in autocracies demand the same reforms they wit-ness in neighboring states. We disagree. The present paper asserts that the diffusionof democracy literature rests on weak theoretical foundations and does not properlytest for diffusion. We advance an alternative two-step argument to explain clusteringof democratization: (1) economic shocks, which are clustered spatially and tempo-rally, induce the breakdown of authoritarian regimes; then (2) democratic diffusion,in turn, influences whether a fallen dictatorship will be replaced by a democracy or anew autocracy. Diffusion, despite playing an important role, is insufficient to explainthe clustering of transitions, notably because it cannot account for the timing of thewaves. Using data on 125 autocracies from 1875 to 2004, we show that economic crisestrigger authoritarian breakdowns, while diffusion determines whether the new regimeis democratic or authoritarian.
∗Thanks to John Ahlquist, Leonardo Baccini, Horace Bartilow, Bill Bernhard, Cristina Bodea, Marc Capelovitch, Michael
Colaresi, Lawrence Ezrow, Erik Gartzke, Kristian Gleditsch, Bob Goodin, Matt Grossmann, Mark Hallerberg, Paul Kenny,Soo Yeon Kim, Patrick Kuhn, David Leblang, Arndt Leininger, Rene Lindstadt, Katja Michaelowa, Layna Mosley, ThomasPlumper, Stephanie Rickard, Julian Schumacher, Ken Shadlen, Frederick Solt, Corwin Smidt, Hugh Ward and Dwayne Woodsfor helpful comments, to Carles Boix for generously sharing data, to Jude Hays for sharing some code, and to Elizabeth Lane foroutstanding research assistantship. Previous versions of this paper have benefited greatly from presentations at the InternationalPolitical Economy Society, the University of Essex, the London School of Economics and Michigan State University.
Transitions, as evident in Table 1, are not only clustered temporally but also spatially.
Indeed, they are more finely clustered in time and space than Huntington’s three long waves
would suggest.3 Countries from the same regions have tended to be affected by the global
waves of democratization around the same time.4 This trend is also apparent in Figure 2,
2We use the measure of democracy of Boix, Miller and Rosato (2013) (see below).
31828-1922, 1944-1962, 1974-2007.
4Of course, regions can be defined differently and many of these countries in a given wave
differ notably geographically, economically and culturally. This section categorizes regions
4
Table 1: Transitions to Democracy by Region
Americas Africa Middle East/Asia Europe
Chile (1909) Sudan (1965) Philippines (1946) France (1848)Cuba (1909) Ghana (1970) Pakistan (1950) Greece (1864)Argentina (1912) Gambia (1972) Japan (1952) France (1870)Uruguay (1919) Ghana (1979) Indonesia (1955) U.K. (1885)Chile (1934) Nigeria (1979) Myanmar (1960) Luxembourg (1890)Colombia (1937) Uganda (1980) South Korea (1960) Belgium (1894)Cuba (1940) Sudan (1986) Turkey (1961) Netherlands (1897)Uruguay (1942) Benin (1991) Lebanon (1971) Denmark (1901)Guatemala (1945) Cape Verde (1991) Pakistan (1972) Portugal (1911)Brazil (1946) Sao Tome (1991) Thailand (1975) Sweden (1911)Costa Rica (1948) Mali (1992) Thailand (1983) Germany (1919)Ecuador (1948) Central Afr. Rep. (1993) Turkey (1983) Italy (1919)Panama (1950) Niger (1993) Bangladesh (1986) Austria (1920)Panama (1952) Madagascar (1993) Philippines (1986) Ireland (1922)Peru (1956) Guinea-Bissau (1994) Pakistan (1988) Greece (1926)Honduras (1957) Malawi (1994) South Korea (1988) Spain (1931)Argentina (1958) Mozambique (1994) Mongolia (1990) Greece (1944)Colombia (1958) South Africa (1994) Nepal (1991) Austria (1946)Guatemala (1958) Ghana (1997) Sri Lanka (1991) France (1946)Venezuela (1959) Niger (1999) Thailand (1992) Italy (1946)Argentina (1963) Senegal (2000) Taiwan (1996) Greece (1974)Peru (1963) Kenya (2002) Indonesia (1999) Portugal (1976)Dominican Rep. (1966) Lesotho (2002) Cyprus (1977)Guatemala (1966) Sierra Leone (2002) Spain (1977)Honduras (1971) Burundi (2005) Poland (1989)Argentina (1973) Comoros (2006) Bulgaria (1990)Bolivia (1979) Liberia (2006) Czechoslovakia (1990)Brazil (1979) Hungary (1990)Ecuador (1979) Romania (1991)Peru (1980) Albania (1992)Bolivia (1982) Lithuania (1992)Honduras (1982) Russia (1992)Argentina (1983) Latvia (1993)El Salvador (1984) Albania (1997)Nicaragua (1984) Croatia (2000)Grenada (1984) Yugoslavia (2000)Uruguay (1985) Georgia (2004)Guatemala (1986)Suriname (1988)Chile (1990)Suriname (1991)Panama (1991)Guyana (1992)Mexico (2000)Peru (2001)Ecuador (2003)Paraguay (2003)Antigua & Barbuda (2004)
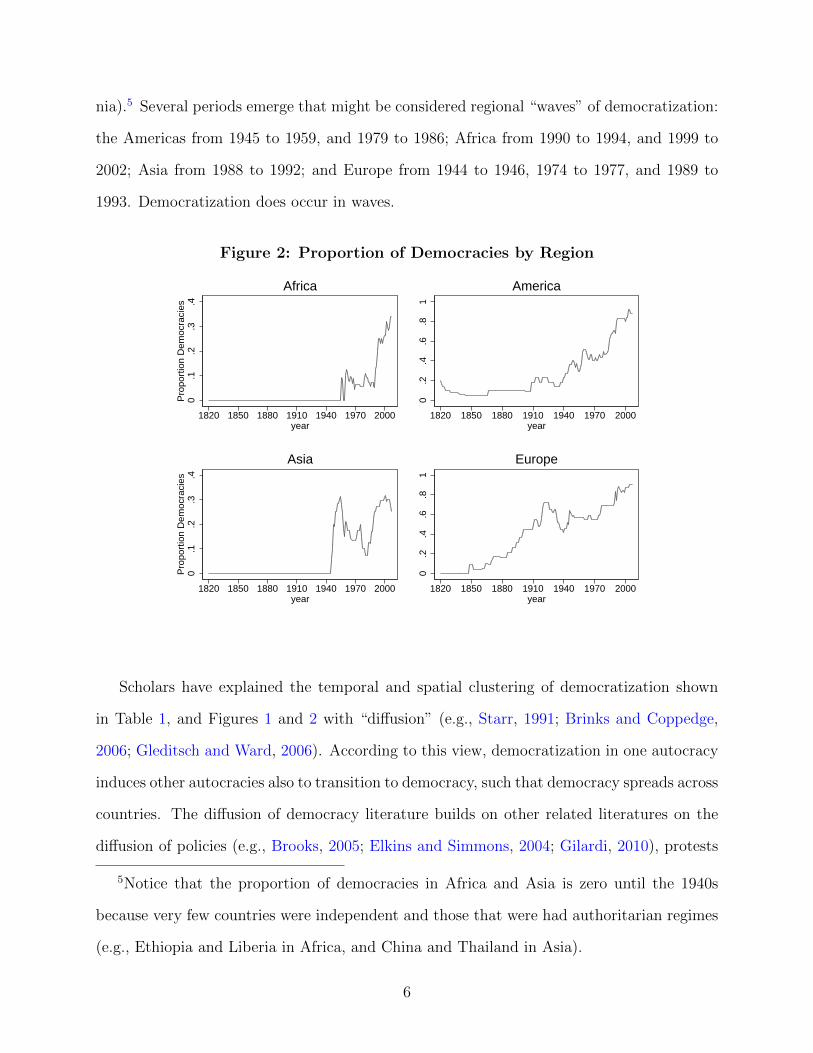
which shows the evolution in the proportion of democracies for each continent (except Ocea-
on a broad (continental) level to illustrate basic relationships as simply as possible. The
statistical tests in the following section will define regions more precisely by measuring the
distance between countries.
5
nia).5 Several periods emerge that might be considered regional “waves” of democratization:
the Americas from 1945 to 1959, and 1979 to 1986; Africa from 1990 to 1994, and 1999 to
2002; Asia from 1988 to 1992; and Europe from 1944 to 1946, 1974 to 1977, and 1989 to
1993. Democratization does occur in waves.
Figure 2: Proportion of Democracies by Region
0.1
.2.3
.4P
ropo
rtio
n D
emoc
raci
es
1820 1850 1880 1910 1940 1970 2000year
Africa
0.2
.4.6
.81
1820 1850 1880 1910 1940 1970 2000year
America
0.1
.2.3
.4P
ropo
rtio
n D
emoc
raci
es
1820 1850 1880 1910 1940 1970 2000year
Asia
0.2
.4.6
.81
1820 1850 1880 1910 1940 1970 2000year
Europe
Scholars have explained the temporal and spatial clustering of democratization shown
in Table 1, and Figures 1 and 2 with “diffusion” (e.g., Starr, 1991; Brinks and Coppedge,
2006; Gleditsch and Ward, 2006). According to this view, democratization in one autocracy
induces other autocracies also to transition to democracy, such that democracy spreads across
countries. The diffusion of democracy literature builds on other related literatures on the
diffusion of policies (e.g., Brooks, 2005; Elkins and Simmons, 2004; Gilardi, 2010), protests
5Notice that the proportion of democracies in Africa and Asia is zero until the 1940s
because very few countries were independent and those that were had authoritarian regimes
(e.g., Ethiopia and Liberia in Africa, and China and Thailand in Asia).
6
and revolutions (e.g., Hale, 2013; Weyland, 2009), civil wars (e.g., Salehyan and Gleditsch,
2006) and human rights (e.g., Pegram, 2010), for instance.
Table 2 lists some of the most prominent empirical tests of the diffusion of democracy.
As shown in the last column of Table 2, all studies, with the partial exceptions of Leeson
and Dean (2009) and Ahlquist and Wibbels (2012), find strong evidence in favor of diffusion.
The main drawback with these studies is neglecting the dynamics implied by diffusion. As
shown in the third column of Table 2, rather than demonstrating temporally proximate
transitions – i.e., that democratization abroad induces democratization at home – most
authors have shown that countries near democracies are more likely to democratize, no
matter how long ago the neighbors democratized. For example, Brinks and Coppedge (2006)
show that states converge to the Polity score level of their neighbors. The actual cause of
democratization, however, and an explanation for geographic, let alone temporal, clustering
are left unaddressed. The central finding of the diffusion of democratization literature – that
democratic neighbors are a strong predictor of democratization at home – is indisputably
important. It, however, neither explains the temporal clustering of democratization nor
democratization itself.
The few studies that have looked at the effect of transition abroad on transition at home
often suffer from other limitations. For example, as shown in column 4 of Table 2, a number
of early studies did not employ multivariate regression analysis (e.g., O’Loughlin et al.,
1998; Starr, 1991; Starr and Lindborg, 2003). Others have looked at the effect of change in
democracy abroad but have omitted the issue of regime transition. For example, Leeson and
Dean (2009) examine how changes in the Polity score abroad affect change in the Polity score
at home. However, they do not account for whether variation in the Polity score is caused by
the breakdown of democracy, democratization or an increase in the quality of democracy in
already democratic states. Differentiating between these possibilities is important because
the previous empirical literature has found that the variables that affect the establishment of
democratic regimes are different than those that affect their survival (Houle, 2009; Przeworski
7
Tab
le2:
Em
pir
ical
Stu
die
son
Dem
ocr
ati
cD
iffusi
on
Stu
die
sD
V:
Tran
siti
on
at
hom
e?
IV:
Tran
siti
on
ab
road
?M
ult
ivaria
teR
egress
ion
sE
vid
en
ce
of
Dem
ocrati
cD
iffu
sion
?
Sta
rr(1
991)
Yes
Yes
No
Yes
O’L
ou
gh
lin
etal.
(1998)
Yes
Yes
No
Yes
Sta
rran
dL
ind
borg
(2003)
Yes
Yes
No
Yes
Doore
nsp
leet
(2004)
Yes
No
Yes
Yes
(%d
emocr
aci
es)
Wej
ner
t(2
005)
No
No
Yes
Yes
(ch
an
ge
inth
ed
em.
level
)(A
VG
dem
.le
vel
)
Bri
nks
an
dC
op
ped
ge
(2006)
No
No
Yes
Yes
(ch
an
ge
inth
ed
em.
level
)(d
iff.
b/t
AV
Gd
em.
level
of
nei
gh
.an
dd
em.
level
at
hom
e)G
led
itsc
han
dW
ard
(2006)
Yes
Yes
Yes
Yes
Lee
son
an
dD
ean
(2009)
No
No
Yes
Str
on
gst
ati
stic
ally,
wea
ksu
bst
anti
vel
y(c
han
ge
inth
ed
em.
level
)(c
han
ge
inth
eA
VG
dem
.le
vel
)
Teo
rell
(2010)
No
No
Yes
Yes
(ch
an
ge
inth
ed
em.
level
)(A
VG
dem
.le
vel
)
Cso
rdas
an
dL
ud
wig
(2011)
No
No
Yes
Yes
(ch
an
ge
inth
ed
em.
level
)(A
VG
dem
.le
vel
)
Ah
lqu
ist
an
dW
ibb
els
(2012)
Yes
Yes
Yes
Yes
,b
ut
sen
siti
ve
tom
od
elsp
ecifi
cati
on
Str
an
det
al.
(2013)
No
No
Yes
Yes
(ch
an
ge
inth
ed
em.
level
)(d
iff.
b/t
AV
Gd
em.
level
of
nei
gh
.an
dd
em.
level
at
hom
e)W
ejn
ert
(2014)
No
No
Yes
Yes
(ch
an
ge
inth
ed
em.
level
)(A
VG
dem
.le
vel
)
Gu
nit
sky
(2014)
No
Yes
Yes
Yes
,b
ut
sen
siti
ve
tom
od
elsp
ecifi
cati
on
(dem
.le
vel
)
Note
:Thevariablesuse
dby
theauth
ors
are
indicate
din
pare
nth
ese
s.
8
et al., 2000). In fact, as discussed below, diffusion is likely to play a larger role during the
consolidation of democracies than during the transition to democracy itself.
Only two studies listed in Table 2 use regression analysis to test the effect of democrati-
zation abroad on democratization at home. Gleditsch and Ward (2006) show that having a
neighbor that has democratized increases the likelihood of democratization at home during
the same year. Ahlquist and Wibbels (2012) obtain similar results, although their findings
are not robust to model specification.
Perhaps even more importantly, the diffusion literature has not developed plausible mech-
anisms to explain why democratization abroad induces democratization at home. Beside
neighbor emulation, its main mechanism rests on the “demonstration effect” – when the
masses witness that their counterpart in a neighboring country were able to overthrow a
regime similar to theirs, they realize that their own authoritarian regime is not impervious
and they also learn about the most effective means to bring it down. For example, after
the democratization of Serbia in 2000, pro-democratic forces throughout the Balkans and
Central Asia used the same combination of street protests and electoral victories to end
dictatorships as initially used in Serbia. More recently, the successful overthrow of authori-
tarian regimes in Tunisia and Egypt spurred waves of protests throughout the Middle East
and North Africa (without, however, resulting in the widespread adoption of democracy).
Just as in the cases of Tunisia and Egypt these protests have taken place in town squares
and usually on prayers days.
This mechanism, however, remain largely untested and the most visible cases, such as
the Arab Spring, employ revolts or regime change in neighbors, not democratization as the
cross-border impetus. For most authors, the mere existence of waves is taken as evidence
in favor of this mechanism, and diffusion more generally, even though other explanations
may account for this wave-like pattern. While the demonstration effect and other diffusion
mechanisms, such as emulation, may constitute credible explanations of the contagion of
policies, values, and protests across countries, for example, they are much less convincing
9
explanations of the clustering of transitions to democracy. This is because the transition
from autocracy to democracy is not only conditional on mass behavior or on elite behavior
but on both. As Houle (2009) explains, in contrast to democratic breakdown which requires
only a decision by the elite to seize power, democratization requires both demand from the
masses and an elite decision to accommodate them. Ideas can diffuse internationally among
the elite – witness the international spread of pension reforms (Brooks, 2005), economic
liberalization (Elkins and Simmons, 2004) or cut-backs in unemployment benefits (Gilardi,
2010) – and even across the masses – consider the spread of revolts against authoritarian
governments across multiple countries during the Arab Spring of 2011. Diffusion, however,
is much less likely to occur with democratization.
Diffusion is, in fact, double-edged in the case of authoritarian breakdown: it affects not
only the ability of the masses to demand democracy but also that of the ruling elite to resist
them (Koesel, Bunce and Wolchik, 2011; Koesel and Bunce, 2013). The population indeed
learns from successful regime transitions abroad, but the ruling elite also learn from the
mistakes of fallen dictators. Koesel, Bunce and Wolchik (2011), for example, explain how
dictators in Saudi Arabia, Azerbaijan, China and Russia have used the experiences of fallen
autocracies during the Color Revolutions and Arab Spring to develop more effective means
to retain power at home. The same type of adaptation by the ruling elite can also be seen
more widely during the Arab Spring, during which autocrats have learned from the cases
of Tunisia, Egypt and Yemen, and adopted more repressive measures, particularly in Libya
and Syria.
Bratton and van de Walle (1997) make a similar argument about the role of diffusion
during the regional wave of democratization in sub-Saharan Africa during the early 1990s. In
some countries, such as Togo, dictators have adapted their strategy in light of the experiences
of countries like Benin and Zambia. In a study of counter-summit protests, Della Porta and
Tarrow (2012) demonstrate that both protestors and governments have adapted their protest
and anti-protest techniques as a results of past experiences. Della Porta and Tarrow (2012)
10
call this process “interactive diffusion” and “coevolution”.
In some instances protests that spread across countries may be successful at overthrowing
autocracies and establishing democracy, but as illustrated by the 1848 revolutions and the
Arab Spring, such instances are rare. In the words of Hale (2013), “cascading can occur in
protest calling for regime change as well as revolution in the name of regime change, but these
rarely lead to actual regime change [toward democracy]” (p. 331). In fact, democratization is
rarely the result of the overthrow of authoritarian regimes by the population (Miller, 2014).
These arguments do not imply that diffusion has no effect. It is possible that cases of
successful democratization abroad can demonstrate to the local population that the regime
is not infallible as well as show which type of protest techniques are the most likely to
destabilize the regime. However, we cannot simply assume – as the literature on the diffusion
of democratization has done – that this demonstration effect will straight forwardly lead
to waves of democratization. Nor can we conflate diffusion of protest with diffusion of
democracy. The latter requires that democratization induces democratization.
In fact, even some recent studies looking at policy convergence – for which, as mentioned
above, this explanation is more convincing – have found that previous empirical tests have
substantially overestimated the true effect of diffusion because of the failure to properly
account for alternative explanations, such as the presence of domestic triggers that inde-
pendently but synchronously affect similar countries (or states) and common shocks that
simultaneously affect neighbors (e.g., Boehmke, 2009; Hennessy and Steinwand, 2014). Hale
(2013) also makes the related point that although waves of protests and revolutions can be
caused by diffusion, “common external causes and contemporaneous domestic triggers can
cause events outwardly resembling them” (p. 331).
This argument has two important implications. First, diffusion can have different effects
on the establishment of democracy and on its survival. While transitions to democracy
are the results of a compromise between different groups, transitions away from democracy
almost never are (Houle, 2009); meaning that diffusion does not have two opposite effects
11
for the latter. Therefore, previous studies that have confounded the effect of diffusion on
transitions to democracy with its effect on transitions away from democracy (e.g., Leeson
and Dean, 2009) have most likely overestimated the former.
Second, diffusion may have very different effects on the breakdown of an authoritarian
regime and on the choice of establishing a democracy (as oppose to another dictatorship)
once the regime has broken down. Following the collapse of an autocracy, pro-democracy
ideas can more easily influence the form of the new regime. Therefore, while diffusion on its
own is unlikely to explain the occurrence of waves – notably because it cannot account for
the timing of the breakdown of authoritarian regimes – it does play a key role by fostering
democratization after the collapse of the regime. This latter insight is central to the argument
we present below.
A Theory of Clustered Democratization
We advance a two-step argument to explain clustering and waves in democratization. Nei-
ther step, on its own, is new to the literature or even controversial. Taken together, however,
they offer a strong alternative to the dominant diffusion explanation of clustered democ-
ratization. First, we theorize that economic crises, which are themselves clustered among
neighbors, cause the breakdown of authoritarian regimes; hence triggering the transition
process. Second, once the regime has fallen, diffusion influences the form of the new regime.
Countries that find themselves in neighborhoods dominated by democracies are more likely
to opt for democracy as opposed to a new autocracy.
Economic Shocks Induce Authoritarian Breakdowns
Rather than democratic diffusion, it is economic shocks – either domestic or international
in origin – that initiate the transition process by causing the breakdown of authoritarian
rule. Authoritarian regimes collapse when they can no longer afford the payments necessary
12
for patronage and co-optation or the upkeep of the forces necessary for repression. Crises,
be they debt-driven, currency, financial, trade-driven or simply contractionary, all pose a
threat to autocratic governments because they impinge on the government’s ability to pay-
off potential rivals and to finance repression. Research on the functioning and stability of
autocratic regimes commonly describes them as relying on a combination of patronage and
repression to remain in power. Rivals are coopted in a process, to paraphrase Geddes (1999),
in which “both mass and elite are better off supporting the ruling party and opponents are
trapped investing in the survival of the autocratic status-quo.” When economic crises disrupt
patronage networks and weaken the tools of repression, however, the elite’s grip on power
can slip, clearing the way for democratization (Bueno de Mesquita et al., 2003).
Autocratic rulers’ legitimacy might also be especially susceptible to deterioration of ma-
terial conditions. Lacking the democratic legitimacy conferred by elections, autocrats rely on
what Huntington (1991) dubs “negative legitimacy” – autocracies can only be perceived as
legitimate by the population if they perform well economically and politically (for example,
by maintaining political order). The vulnerability of autocratic governments to economic
performance is reflected in their management of the economy. Many authoritarian regimes,
to take an example best documented in Latin America, preferred creating inefficient pa-
tronage positions in state owned enterprises to implementing economic reforms necessary
to move to more sophisticated stages of import substituting industrialization (O’Donnell,
1973; Linz and Stepan, 1978). When the debt crises of the 1980s caused the collapse of
their economies, their wariness of economic instability proved correct as previously co-opted
elites and newly unemployed workers overturned many autocratic regimes (Richards, 1986;
Markoff and Baretta, 1990). Even in large samples of autocratic states from a broad swath of
regions, economic crisis is associated with regime change (Haggard and Kaufman, 1995; Tan-
neberg, Stefes and Merkel, 2013). Further evidence suggests that droughts (e.g., Bruckner
and Ciccone, 2011), earthquakes (e.g., Rahman et al., 2013), and increasing food prices (e.g.,
Hendrix, Haggard and Magaloni, 2009) also destabilize autocracies.
13
Establishing the economy as the primary trigger of authoritarian reversals, however, is not
the same as explaining waves of transitions. Economic performance may best explain author-
itarian breakdowns at home but it certainly does not explain breakdowns abroad. Clusters
emerge because neighboring economies tend to be interdependent and to share many charac-
teristics. Neighbors are likely to experience similar domestic economic shocks simultaneously
and to be affected in a similar way by the same international shocks. National economies,
pace North Korea, are almost never autarkic. Trading economies are highly dependent on
regional and international business cycles and in more recent decades international financial
markets have played an increasingly important role. For geographic and historical reasons,
economies in given regions have similar natural resource and factor endowments and histor-
ically many have followed similar development strategies. As a consequence, a key part of
our argument emphasizes that national economic outcomes covary regionally and even inter-
nationally. Domestic economic variables drive domestic regime change but the correlation of
domestic economic performance subjects multiple countries to synchronous shocks, enabling
similarly synchronous democratization.
Moreover, countries in geographic proximity are likely to experience the same natural
catastrophes, such as droughts, which can, in turn, fuel unrest. For example, Bruckner and
Ciccone (2011) note that most of West Africa experienced an important drought in the early
1990s, just before the third wave of democratization swept through the region. In addition,
fluctuations in the international price of commodities also tend to affect all countries of
the same region in the same way, because they depend on the importation/exportation of
the same goods. For example, the Middle East – the region that is the most dependent
on food imports – witnessed numerous food riots after the sharp increase in food prices in
2007-08 (Hendrix, Haggard and Magaloni, 2009). The deterioration in the terms of trade
of commodities like coffee and cacao in the 1980s also contributed to recessions throughout
sub-Saharan Africa.
Even a casual consideration of history associates several of the clusters of democratization
14
in Table 1 with common regional economic shocks, such as the 1980s debt crisis in Latin
America, or purely domestic economic shocks that affected similar economies synchronously.
Economic crises – whether they originate as a currency crisis such as the 1997 East Asian
Financial Crisis, debt crisis such as began in Mexico in 1982, or credit crisis such as began in
2008 – can all induce waves of regime reversals. Because geographically clustered states hold
similar economic positions and similar economic structures – weakly collateralized lending
in East Asia in the late 1990s, petro-dollar fueled debt in Latin America in the early 1980s
– waves of democratization are often regionally clustered.
What has often been claimed to be evidence in favor of the role of diffusion during regime
transition is in fact evidence of the role of the economy. For example, Ulfelder (2009) finds
that diffusion played a key role in instigating only 7 out of 43 recent episodes of liberalization
that he examined. In 33 of them, he found that the main immediate cause of the breakdown
of the dictatorship was an economic crisis. Moreover, six of the seven cases where diffusion
played an important role are countries previously under Soviet influence in Eastern Europe
as well as Mongolia – Mali being the only exception. Yet there is much evidence that what
created the wave of democratization in Eastern Europe and Mongolia was not diffusion
per se, but the end of the Brezhnev doctrine, which had been abandoned by Gorbachev in
1988 (Thompson, 2001; Janos, 2000). Without the threat of a Soviet invasion, communist
regimes throughout Eastern Europe would most likely have fallen before 1989 (Boix and
Stokes, 2003). It thus seems that even in these cases, a common (political) shock – the end
of the Brezhnev doctrine – rather than diffusion triggered the wave of transitions.6
This situation is even clearer in other regional waves. Joseph (1997), for example, argues
that the wave of democratization in sub-Saharan Africa in the early 1990s was triggered
6In this paper, we focus on the role of economic shocks to explain the breakdown of
authoritarian regimes. However, political shocks, such as the abandonment of the Brezhnev
doctrine, may also induce regime reversals (e.g., see Boix, 2011; Gunitsky, 2014). We account
for some political shocks in Table 8.
15
by the economic crisis of the 1980s, which was itself partially caused by the deterioration
of the terms of trade of most African countries. The economic crisis forced the ruling
elite to continually increase their debt level, which prevented them from maintaining the
patronage networks which formed the basis of the regimes. As argued by Bratton and van de
Walle (1997, p.100), “Perversely, the economic crisis undercut the material foundations of
neopatrimonial rule: With ever fewer resources to distribute, political elites faced a growing
problem of how to maintain control of clientelist networks.” Consequently, African countries
became increasingly dependent on international donors. In exchange for further support,
international donors imposed structural adjustment programs, aimed at decreasing the size
of African governments and at making them more efficient. This further decreased the
capacity of these regimes to hold to power, for example, by providing highly paid jobs in
the public sector. Notice that this explanation relates to the common economic difficulties
experienced by similar economies – not diffusion.
A common economic shock also seems to have triggered another celebrated cluster of
democratization, that in Latin America in the 1980s. Following independence, many Latin
American countries turned to the policies of import substitution (ISI) in an attempt to
industrialize. They systematically overvalued their currencies in order to make the import of
machine tools and industrial materials more affordable. This had the unintended consequence
of making their own mostly agricultural commodity exports more expensive on world markets
which, in turn, reduced inflows of foreign currency, depleted reserves and stoked inflation.
Unsound fiscal and monetary positions, however, were not an impediment for lending from
Western banks flushed with petrodollars from the 1973 and 1979 oil embargoes.
This pattern of cheap petrodollar loans to cover the hard currency needs of Latin Amer-
ican countries running trade deficits from ISI policies came to an abrupt halt, however, in
1979 when Paul Volcker, the chairman of the US Federal Reserve Board, worried about US
inflation and raised interest rates. Suddenly, multiple developing countries in Latin America
(and elsewhere) could not afford to refinance their debts leading to the debt crisis and the
16
beginning of what is sometimes called the “lost decade” in Latin America (Oatley, 2006;
Frieden, 2006, ch.14 & 16, respectively). Interestingly, it was also this period that saw de-
mocratization arrive 12 times in the region, beginning with Bolivia, Brazil and Ecuador in
1979 and continuing to Guatemala in 1986. As with Africa in the 1990s, it was a common
economic shock imposed on countries in similar economic positions that provided the impe-
tus for geographically and temporally clustered democratization. Diffusion of policy ideas
might explain the regional adoption of ISI policies that eventually placed most countries
in the region in a similar economic position. But the most direct cause for the wave of
democratization was most likely simultaneous debt crises in multiple countries that dam-
aged autocrats’ patronage networks and undermined their ability to buy off and repress the
opposition.
Diffusion Promotes Democratization After the Breakdown
Not all authoritarian reversals, however, result in the establishment of democracies. Coun-
tries have experienced economic crises throughout history but democracy is a relatively new
phenomenon. Countries facing economic difficulties before the first democracies were estab-
lished often suffered political instability and/or regime reversals but, in the end, remained
authoritarian. It is only once democracy becomes available as a model that could be em-
ulated that economic crises could plausibly induce democratization. As shown in Figure 1,
there is a clear temporal trend in the proportion of democracies in the world; suggesting that
whether an economic crisis eventually leads to democracy or not depends on other factors.
The second part of our argument is that fallen autocracies become more likely to be
replaced by democracies rather than other autocracies when they find themselves in envi-
ronments dominated by democracies. Demonstration effects and emulation matter here more
than in the first stage for the simple reason that the elite is less able to employ coercion after
an autocracy has collapsed. It is much easier for the population to prevent new autocracies
from taking hold or, after the regime has broken down, to tilt the balance of power toward
17
factions of the elite that support democracy, than to topple an already consolidated autoc-
racy and install democracy. As argued by Miller (2012), after an autocracy breaks down, the
elite is in a position of weakness and is more vulnerable to pressure from the masses to adopt
democracy. Therefore, to a large extent, the effect of diffusion is no longer double-edged.
The masses are encouraged to demand democracy, and even learn which tactics to use, when
transitions have succeeded in neighboring states.
Moreover, elites face the choice of trying to establish a new autocracy or yielding to the
establishment of a democracy. Like the masses, they also learn from recent experience abroad,
especially in similar neighboring states. If neighbors’ transitions have avoided retaliation
against old regime elites and protected their property rights – often a precondition for the
elite to accede – then they are more likely to support democracy.7
Democracy promotion by foreign actors is also likely most successful following autocratic
breakdowns. Regional organizations with many democratic members, for example, have been
shown to promote democracy among non-democratic members, notably through sanctions
(Pevehouse, 2005). Again, it is easier for regional organizations to prevent the emergence
of new autocracies than to depose the authoritarian ruling elite – which has access to the
full resources the state – through the use of sanctions. These arguments are consistent
with the findings of Marinov and Goemans (2013) according to which coups often lead to
democratization in periods dominated by democratic super powers.8 It is more difficult
to establish a new autocracy – even after staging a successful coup – in an environment
dominated by democracies because such a regime would lack international support.
To use the examples above, although economic crises caused the breakdowns of autoc-
7Acemoglu and Robinson (2006) have suggested that transitions to democracy are more
likely where capital controls are absent precisely due to this reason.
8Marinov and Goemans (2013) find that coups foster democratization only during the
post-Cold War period. However, their analysis is limited to the 1945-2005 period. Therefore,
their argument could be extended to other periods dominated by democracies.
18
racies throughout Latin America and Africa in the 1980s and 1990s respectively, it is the
context at the time that explains why they eventually transitioned to democracy rather than
new forms of autocracies. Thus, in the second step of our theory and of our empirical tests,
the proportion of neighbors who are democratic – which is a proxy for the extent to which
a country finds itself in an environment conducive to democracy – predicts the probability
of a given country that has experienced an autocratic breakdown adopting democracy.
Data
Our unit of analysis is the country-year. Our main sample covers around 5,500 observations
on 125 autocracies between 1875 and 2004. Contrary to most previous studies that focus
on very short periods, ours covers the vast majority of transitions. Our sample is restricted
to non-democracies. We rely on the binary indicator of Boix, Miller and Rosato (2013) to
classify regimes. Regimes are defined as democratic if office holders are selected through free
and fair elections and at least 50 percent of the male adult population has the right to vote.
Summary statistics for all variables included in the analysis are available in Table A1 of the
online appendix.
Testing Strategy and Dependent Variables
We divide our empirical section into two main parts. First, we test the effect of democratic
diffusion and economic shocks on transition from autocracy to democracy. A transition in
year t occurs if a regime that was classified by Boix, Miller and Rosato (2013) as authoritarian
at the end of year t − 1 becomes democratic in year t. Following Przeworski et al. (2000),
Boix (2003) and Dunning (2008a), among others, we use dynamic probit models. These
estimate the likelihood that a country that starts the year as authoritarian will democratize
before the end of the year.
In the second part of the analysis, we follow Kennedy (2010) and Miller (2012) and
19
decompose the transition process into two sequences: (1) the breakdown of the authoritarian
regime; and (2) the establishment of a democracy following the breakdown. We estimate the
effect of diffusion and economic shocks on the two sequences using Heckman probit models
(de Ven and Praag, 1981). In the first stage, we run a probit model in which the dependent
variable is a dummy variable for whether an autocracy has collapsed or not. The second
stage runs a probit model with only cases in which an authoritarian breakdown has occurred.
The dependent variable takes the value one if the regime is replaced by a democracy and
zero if it is replaced by another autocracy.
We measure authoritarian breakdowns as cases in which an irregular leader turnover
occurred. To identify irregular turnovers, we use the data set of Miller (2012), who himself
relies on the Archigos data set (Goemans, Gleditsch and Chiozza, 2009). However, while
transitions from an autocracy to another autocracy almost inevitably involve the use of
violence, transitions from autocracy to democracy can occur without violence. Whereas
the former are (almost) always covered by Archigos, some transitions to democracy are
not. Consequently, our variable Authoritarian Breakdown takes the value one if during a
given year an autocracy has (1) experienced an irregular leader turnover (as defined by the
Archigos) and/or (2) has transitioned to democracy (as defined by Boix, Miller and Rosato,
2013). In the second stage, our dependent variable Transition to Democracy is once again
based on the definition of regimes of Boix, Miller and Rosato (2013).
Table A2 of the online appendix lists all authoritarian breakdowns covered in the empir-
ical analysis. Authoritarian breakdowns resulting in a transition to democracy are shown in
bold.
Independent Variables
Diffusion: This paper adopts two strategies to capture diffusion. First, as most previous
authors, we use the proportion of an autocracy’s neighbors that are democratic (% democ-
racies). A neighbor is defined as any country that shares a border or that is within 400 miles
20
by water. However, as discussed above, this measure is problematic because it does not
capture the temporal dimension of diffusion. As illustrated by the example of Mexico and
the United States, if an autocracy democratizes after it had a democratic neighbor for an
extended period of time, then it cannot be considered as evidence that democratic diffusion
drives waves of transitions to democracy. Diffusion must take place within a reasonable
period.
Therefore, we define a second set of diffusion variables. These capture the change within
a given period in the proportion of neighbors that are democratic.9 We calculate three dif-
fusion variables that cover between one and three years, with each variable scaled from -1 to
1. For example, the Change % democracies last 2 years variable measures the proportion of
neighbors that are democratic today minus the proportion that were democratic two years
ago. It thus gives the change in the proportion of neighbors that are democratic over the last
two years. A value of one signifies that while none of a country’s neighbors were democracies
two years ago, they are now all democracies.
Economic Shocks : We use a number of variables to capture economic shocks. Our main
variable is the average growth rate of GDP per capita that a country has experienced over
the last three years. We use moving averages instead of simply the lagged value of growth
for two reasons. First, moving averages are less sensitive to outliers. Second, we should
not expect only growth during the last year to affect the legitimacy of a regime as well as
its capacity to finance patronage and repression. As discussed below, results are unchanged
when we use the average growth rate over the last 1-5 years. Data on growth, and GDP per
capita (see below), are taken from the data set of Boix (2011).
We also use rainfall both as an exogenous instrument for growth (see Table 6) and as
an independent variable. We employ the precipitation data set of Matsuura and Willmott
9In Table A8 of the online appendix, we show that the results are unchanged when we
use the change in the number (rather than proportion) of neighbors that are democratic.
21
(2007), which covers, among other states, 113 autocracies from 1960 to 2006. Since a large
proportion of the dictatorships during that period are found in warm weather countries
with economies dependent on agriculture, we expect low rainfall levels to lower growth and
induce authoritarian breakdowns (see Bruckner and Ciccone, 2011, on how droughts promote
democratization in sub-Saharan Africa).
In order to make sure that we do not simply capture differences in rainfall levels across
countries, we use a variable (Rain deviation) which captures the deviation, in percentage, in
precipitations between that within a given year and the average annual precipitation that
a country has received between 1960 and 2006. The use of rainfall as an instrument and
independent variable enables us to be confident that our results are not driven by endogeneity.
Different types of economic crises (not only growth crises) can induce waves of democ-
ratization. For example, as discussed above the debt crisis of the 1980s played a significant
role during the wave of democratization in Latin America. High debt levels are likely to
prevent authoritarian rulers from having access to resource enabling them to maintain their
patronage networks and to fund repression. Other types of crises, such as inflation and
banking crises, can also have similar effects.
Consequently, we also include variables capturing other types of crises. Our variables
(RR crises and LV crises) indicate whether a country is experiencing a crisis, according
to Reinhart and Rogoff (2011) or Laeven and Valencia (2013) respectively. Reinhart and
Rogoff (2011) include external debt, banking, stock market and inflation crises, and cover
59 autocracies from 1875 to 2004. These data, as is also the case with those of Laeven
and Velencia, are publicly available and have been vetted by multiple scholars who have
employed them in other research. The data set of Laeven and Valencia (2013), for its
part, includes external debt and banking crises in 108 autocracies from 1971 to 2004. The
variable RR/LV crises merges both data sets and indicates whether a country is experiencing
a crisis according to either definition. Since these alternative economic crises often happen
concurrently to growth crisis, we cannot include a separate control for growth rate. Therefore,
22
the variables RR crises, LV crises and RR/LV crises also take the value one if a country is
experiencing a growth crisis (defined as a growth rate below -2% in the last three years).
Control Variables
Many economic variables, that are not directly related to international shocks, such as eco-
nomic development (e.g. Lipset, 1959) and natural resources (e.g. Ross, 2001), have been
claimed to affect democracy. The analysis thus controls for GDP per capita (Boix, 2011)
and oil income (Haber and Menaldo, 2011). Other scholars associate the social and cultural
context with democracy and democratization. Islam and Catholicism are thought to be
harmful and Protestantism conducive to democracy (e.g. Huntington, 1991). In addition,
some scholars suggest that divided societies are less likely to establish and maintain demo-
cratic institutions (e.g. Dahl, 2000). Variables measuring the proportion of the population
that is Muslim, Catholic and Protestant are included, as well as variables measuring ethnic
and religious fractionization (Przeworski et al., 2000).
In addition, previous studies find that countries that have experienced many transitions
in the past are more likely to experience transitions in the future (e.g. Epstein et al., 2006).
We add a variable measuring the number of democratic breakdowns that a country has
experienced. We also include a dummy variable for former British colonies (Przeworski
et al., 2000). In Table 8, we include a series of control variables to account for political
shocks: change in the U.S. share of hegemonic power (taken from Gunitsky, 2014); dummy
variables for polarized, neutral and pro-democratic international orders (taken from Boix,
2011); alliances dummy variables (taken from Boix, 2011); and a dummy variable for pro-
democratic hegemonic shocks meant to capture the effect of the end of the two world wars
and the Cold War. Finally, in the Heckman probit models, the first stage, in which the
dependent variable is whether an autocracy breaks down, we include the age of the regime,
its square and its cube.10
10Heckman probit models require the inclusion of additional variables in the first stage
23
Empirical Analysis
Are Economic Shocks Clustered?
Before estimating the determinants of democratization, we show that countries from the
same regions indeed tend to experience economic shocks simultaneously. Table 3 reports
the proportion of autocracies experiencing diverse types of crises classified depending on
whether none, some, or all of their neighbors are in the midst of a crisis. The variable
Droughts indicates whether a country has a yearly rainfall below the 20th percentile of its
country specific distribution between 1960 and 2006, and Growth crises indicates whether a
country has experienced a growth rate below -2 percent in the last three years. Autocracies
are clearly more likely to experience shocks when their neighbors also do. In addition to
this analysis, we ran multiple regressions that suggest that crises in neighbors are associated
with crises at home. For all types of shocks shown in Table 3, the effect of the proportion
of crises in neighbors is significant at the one percent level in all regressions, irrespectively
of the control variables we include (among the list used in the paper) and whether country
fixed-effects are included are not (available upon request). Shocks, indeed, do occur in
clusters.
Table 3: Proportion of Autocracies that Experience an Economic CrisisAre Neighbors in the Midst of a Crisis?
None Some All
Growth crises 8.02% 40.85% 67.61%
Droughts 8.31% 29.64% 71.74%
RR crises 29.96% 36.26% 60.17%
LV crises 6.56% 31.76% 43.12%
Note: The proportion of autocracies that experience an economic crisis when none, some or all of their neighbors experience acrisis, tabulated by type of economic crisis. The variable Growth crises indicates whether a country has experienced a growthrate below -2 percent in the last three years. The variable Droughts indicates whether a country has a yearly rainfall belowthe 20th percentile of its country specific distribution between 1960 and 2006. The variable RR crises indicates whether acountry is experiencing a crisis as defined by Reinhart and Rogoff (2011). The variable LV crises indicates whether a countryis experiencing a crisis as defined by Laeven and Valencia (2013).
regression.
24
Figure 3: Proportion of Countries Experiencing a Growth Shock by Region
1800 1850 1900 1950 2000
0.0
0.2
0.4
0.6
0.8
1.0
Africa
year
prop
ortio
n of
gro
wth
sho
ck
1800 1850 1900 1950 2000
0.0
0.2
0.4
0.6
0.8
1.0
America
year
prop
ortio
n of
gro
wth
sho
ck
1800 1850 1900 1950 2000
0.0
0.2
0.4
0.6
0.8
1.0
Asia
year
prop
ortio
n of
gro
wth
sho
ck
1800 1850 1900 1950 2000
0.0
0.2
0.4
0.6
0.8
1.0
Europe
year
prop
ortio
n of
gro
wth
sho
ck
Note: The vertical axis indicates the proportion of countries in each continent that are experiencing a growth rate below −2%.The solid line in each plot depicts lowess smoother, bandwidth=.2.
Figure 3 presents the proportion of countries in a given continent in a given year that are
experiencing a growth crisis, defined as a growth rate of GDP per capita below -2 percent.
As shown in the figure, many of the regional waves identified in Figure 2 correspond to
periods of crisis. For example, as the first panel in the figure shows, the economies in about
80 percent of the countries in Africa were experiencing severe economic crises during the late
1980s and early 1990s. The Latin American debt crisis of the early 1980s is also apparent.
Does Diffusion Cause Democratization Waves?
Table 4 tests whether diffusion can account for the clustering of democratization. We use
dynamic probit models to estimate the effect of each explanatory variable on the probability
25
that a country that starts the year as an autocracy will transition to democracy within
that same year. In all tables, standard errors are clustered by country and explanatory
variables are lagged. Column 1 shows that, consistent with the findings of previous authors,
autocracies that have many democratic neighbors (% democracies) are much more likely to
democratize.
Table 4: Effect of Diffusion on Democratization(1) (2) (3) (4)
# Past trans. .255 .275 .271 .272(.047)∗∗∗ (.041)∗∗∗ (.041)∗∗∗ (.041)∗∗∗
N 5652 5606 5555 5496Pseudolog-lik. -487.828 -487.638 -486.967 -486.801
Note: Dynamic probit estimations. Robust standard errors clustered by country in parentheses. All explanatory variables arelagged. ***p < .01, **p < .05 and *p < .1.
However, as argued above, this variable does not capture the temporal dimension of
waves. In column 2-4, we instead use variables that capture transitions among neighbors.
Change % democracies last x years gives the difference between the proportion of a country’s
neighbors that are democratic today and x years ago, where x varies between one and three.11
Results show that the effect of diffusion is actually weak and short-lived. It is only
11We also ran analyzes looking at the effect of change in the proportion of democratic
neighbors over the last four and five years. The effect of diffusion is insignificant (available
26
statistically significant at the ten percent level in two of the three specifications. Moreover,
the size of its coefficient diminishes rapidly. These findings illustrate the importance of using
the appropriate measure of diffusion. The previous literature, by focusing on the effect of
the level of democracy abroad on change in democracy at home – instead of on the effect of
change in democracy abroad on change in democracy at home – has overestimated the effect
of diffusion.12 This is consistent with the previous literature which, with the exception of
Gleditsch and Ward (2006), has found that the effect of diffusion is weaker once one looks at
change in democracy abroad (e.g. Leeson and Dean, 2009). Section 2 of the online appendix
shows that these results are robust to the use of spatial probit models.
As implied by our argument, the coefficient on Growth rate is negative and statistically
significant at the one percent level in all regressions; meaning that autocracies are more
likely to transition to democracy when they experience low or negative growth. Given that,
as discussed above, economic conditions are correlated across neighbors, economic crises are
likely to explain, at least partially, why transitions occur in waves.
What, If Not Diffusion, Causes Democratization Waves?
The previous section has shown that diffusion cannot, on its own, account for existence of
waves. In this section we show that diffusion can contribute to the formation of waves but
only in an indirect manner. In order to understand the effect of diffusion on democratization,
we divide the transition process into two periods: (1) the breakdown of the authoritarian
regime; and (2) the choice to replace the collapsed autocracy by a democracy rather than
a new authoritarian regime. We show that while democratic diffusion plays an important
upon request).
12More specifically, diffusion measures using levels rather than change have underestimated
the uncertainty associated with their point estimates. Although coefficients sizes are similar
for level and (short-run) change diffusion variables, the former cannot be distinguished from
random sampling error at standard levels of significance.
27
role during the second stage, it has very little effect on the first one. Instead, economic
shocks, which often affect neighbors simultaneously, trigger the breakdown of authoritarian
regimes. It is the combination of economic shocks and democratic diffusion that explains
why transitions occur in waves.
Table 5 tests the effect of diffusion and economic growth using Heckman probit models.
The first stage runs a probit estimation of the likelihood that an autocracy breaks down.
The second stage runs a probit estimation of the likelihood that an autocracy that has just
collapsed, transitions to democracy as opposed to another authoritarian regime. Model 1
employs the proportion of neighbors that are democratic to measure diffusion. It shows that
autocracies that have many democracies as neighbors are not more likely to fall than those
that are encircled by other autocracies. However, once they have collapsed they are much
more likely to establish democracies. The top two panels of Figure 4 plot out the substantive
magnitude of the effects. The proportion of an autocracy’s neighbors that are democratic
exhibits no relationship with the probability that it will break down (top left panel) but
does substantially increase the probability that it subsequently adopts democracy (top right
panel).13
Models 2-4 redo the analysis with the variables capturing transitions to democracy among
neighbors. Again, diffusion affects the choice to establish a democracy after an authoritar-
13For the first stage, the predicted probabilities are calculated based on a probit model
using the entire sample. The predicted probabilities for the second stage are calculated
as a ratio of a bivariate normal over a univariate normal. The calculations use the select
sample. In addition, the 95 percent confidence intervals in both stages are computed based
on the Clarify method (King, Tomz and Wittenberg 2000). We draw 5,000 simulations. The
panels looking at authoritarian breakdowns and subsequent transitions to democracy use
different scales because the former are much rarer than the latter. While the likelihood that
an autocracy collapses within a year is 7.8 percent, the likelihood that a fallen autocracy
democratizes is nearly 25 percent (see Table A1).
28
Table
5:
Eff
ect
of
Diff
usi
on
an
dG
row
thon
Auth
ori
tari
an
Bre
akdow
ns
and
Tra
nsi
tions
toD
em
ocr
acy
(1)
(2)
(3)
(4)
Au
th.
Bre
ak.
Tr.
toD
em.
Au
th.
Bre
ak.
Tr.
toD
em.
Au
th.
Bre
ak.
Tr.
toD
em.
Au
th.
Bre
ak.
Tr.
toD
em.
%D
em.
.117
.881
(.104)
(.259)∗
∗∗
Ch
.%
dem
.la
styea
r-.
139
1.7
72
(.248)
(.593)∗
∗∗
Ch
.%
dem
.la
st2
yea
rs-.
009
.442
(.189)
(.498)
Ch
.%
dem
.la
st3
yea
rs.1
02
.032
(.205)
(.372)
Gro
wth
-.019
-.036
-.020
-.032
-.021
-.034
-.020
-.034
(.006)∗
∗∗(.
019)∗
(.006)∗
∗∗(.
020)
(.006)∗
∗∗(.
020)∗
(.006)∗
∗∗(.
020)∗
GD
Pp
c-.
079
.584
-.069
.815
-.068
.815
-.070
.833
(.051)
(.197)∗
∗∗(.
050)
(.214)∗
∗∗(.
050)
(.214)∗
∗∗(.
050)
(.216)∗
∗∗
Oil
-1.2
8e-
06
-.0004
-9.8
4e-
06
-.0005
-1.0
0e-
05
-.0005
-8.5
0e-
06
-.0005
(8.7
0e-
06)
(.0002)∗
∗∗(1
.00e-
05)
(.0002)∗
∗∗(1
.00e-
05)
(.0002)∗
∗∗(1
.00e-
05)
(.0002)∗
∗∗
Mu
slim
-.001
-.003
-.0008
-.002
-.0008
-.002
-.001
-.002
(.001)
(.003)
(.001)
(.003)
(.001)
(.003)
(.001)
(.003)
Cath
olic
.002
-.004
.003
-.004
.003
-.004
.003
-.004
(.001)∗
(.003)
(.001)∗
∗(.
003)
(.001)∗
∗(.
003)
(.001)∗
∗(.
003)
Pro
test
ant
-.001
.001
-.001
.005
-.001
.005
-.001
.006
(.002)
(.005)
(.002)
(.006)
(.002)
(.005)
(.002)
(.006)
Eth
nic
frac.
.0003
.006
.0002
.006
.0002
.006
.0004
.006
(.001)
(.003)∗
∗(.
001)
(.003)∗
(.001)
(.003)∗
∗(.
001)
(.003)∗
Rel
.fr
ac.
-.003
.0008
-.003
.002
-.003
.002
-.003
.001
(.002)∗
∗(.
004)
(.002)∗
(.005)
(.002)∗
(.005)
(.002)∗
(.005)
Bri
t.co
l.-.
097
.302
-.091
.325
-.083
.323
-.065
.320
(.093)
(.239)
(.093)
(.241)
(.093)
(.241)
(.092)
(.243)
#P
ast
tran
s..1
49
.193
.154
.174
.148
.163
.146
.163
(.047)∗
∗∗(.
077)∗
∗(.
047)∗
∗∗(.
090)∗
(.047)∗
∗∗(.
087)∗
(.046)∗
∗∗(.
093)∗
N5513
428
5471
422
5422
422
5366
417
Pse
ud
olo
g-l
ik.
-1423.7
63
-1614.0
92
-1403.1
26
-1591.7
43
-1398.2
98
-1588.5
47
-1381.1
81
-1570.8
22
Note
:H
eckm
an
pro
bit
esti
mati
on
s.T
he
firs
tst
age
run
sa
pro
bit
esti
mati
on
of
the
likel
ihood
that
an
au
thocr
acy
bre
aks
dow
n.
Th
ese
con
dst
age
run
sa
pro
bit
esti
mati
on
of
the
likel
ihood
that
an
au
tocr
acy
that
has
just
bro
ken
dow
ntr
an
siti
on
sto
dem
ocr
acy
as
op
pose
dto
an
oth
erau
thori
tari
an
regim
e.M
od
els
on
au
thori
tari
an
bre
akd
ow
nin
clu
de
the
age
of
the
regim
e,it
ssq
uare
an
dit
scu
be.
Rob
ust
stan
dard
erro
rscl
ust
ered
by
cou
ntr
yin
pare
nth
eses
.A
llex
pla
nato
ryvari
ab
les
are
lagged
.***p<
.01,
**p<
.05
an
d*p<
.1.
29
Figure 4: Effect of Diffusion on the Probability of Authoritarian Breakdown andTransition to Democracy
0.0 0.2 0.4 0.6 0.8 1.0
0.00
0.10
0.20
0.30
Authoritarian Breakdown
% Demo. Neighbors
Probability
0.0 0.2 0.4 0.6 0.8 1.0
0.0
0.2
0.4
0.6
0.8
1.0
Transition to Democracy after Breakdown
% Demo. Neighbors
Probability
-1.0 -0.5 0.0 0.5 1.0
0.00
0.10
0.20
0.30
Authoritarian Breakdown
Change In % Democracies Last Year
Probability
-1.0 -0.5 0.0 0.5 1.0
0.0
0.2
0.4
0.6
0.8
1.0
Transition to Democracy after Breakdown
Change In % Democracies Last Year
Probability
Note: Dashed lines give 95 percent confidence intervals. Top panels based on model 1 of Table 5. Bottom panels based onmodel 2 of Table 5.
ian breakdown, but not whether an autocracy collapses in the first place. Moreover, as also
found in Table 4, the effect of diffusion is short-lived. The bottom two panels of Figure
4 show the effect of democratization among neighbors on the probability of authoritarian
breakdown (bottom left) and democratization at home following an autocratic breakdown
(bottom right) computed based on model 2 of Table 5. Again, diffusion has no substantive
effect on authoritarian breakdown. In contrast, its effect on democratization after the col-
30
lapse of an authoritarian regime is large. Democratization by half of a country’s neighbors
in the last year is associated with a 50 percent probability of democratization domestically.
Figure 5: Effect of Economic Crises on the Probability of Authoritarian Break-down and Transition to Democracy
-20 -10 0 10 20
0.00
0.10
0.20
0.30
Authoritarian Breakdown
Growth Rate
Probability
-20 -10 0 10 200.0
0.2
0.4
0.6
0.8
1.0
Transition to Democracy after Breakdown
Growth Rate
Probability
-10 -5 0 5 10 15
0.00
0.10
0.20
0.30
Authoritarian Breakdown
Rain
Probability
-10 -5 0 5 10 15
0.0
0.2
0.4
0.6
0.8
1.0
Transition to Democracy after Breakdown
Rain
Probability
Note: Dashed lines give 95 percent confidence intervals. Top panels based on model 1 of Table 5. Bottom panels based onmodel 1 of Table 7. Rain gives the difference, in percentage, between the total amount of rain a country received in a given
year and the average yearly amount of rain that country has received between 1950 and 2006.
Economic growth, in contrast, demonstrates very different effects. While diffusion only
exhibits an effect on the choice of regime type after an authoritarian breakdown, growth
influences whether such a breakdown occurs. In all specifications in Table 5 that predict
breakdown, Growth rate is negative and statistically significant at the one percent level. The
31
top two panels of Figure 5 show the effect of economic growth on the predicted probabilities
of authoritarian breakdowns and democratic transitions post-breakdown, calculated based
on model 1 of Table 5. As shown in the figure, growth has a much more variable effect
on the second phase of the transition process and the standard errors are so wide that one
cannot make clear inferences. Growth does significantly lower the probability of authoritarian
breakdown in the first phase, however. A severe economic contraction is associated with
about a ten percent probability of authoritarian breakdown in each year. The main analysis
uses the average growth rate in the last three years. In addition, we have experimented
with moving averages of the growth rates over the last 1 to 5 years. Results are unchanged
(available upon request).
One potential problem with the estimation of the effect of growth on regime change
is endogeneity. It must be noted, however, that our main measure of growth gives the
average growth rate during the previous three years, which reduces the possibility of reverse
causation. We also introduce two instruments to show that our results are not driven by the
effect of transitions on growth.
First, we use the average growth rate in the world excluding that of the domestic country
as an instrument for growth. This instrument should satisfy the exclusion restriction, i.e.
world growth only affects transitions via the given countries growth. Moreover, the first-stage
regression suggests that this is a reasonably strong instrument (see Table A5 of the online
appendix). The F-statistics of the instrument are well-above 10, which is the threshold that
is usually used (Sovey and Green, 2011; Staiger and Stock, 1997).14 We then compute a
Wald test of exogeneity. The test suggests that growth is not endogeneous (p-value 0.41).15
14It must be noted that more recent work has suggested to increase the threshold some-
what, but the F-statistics reported here are above these revised thresholds.
15We have also computed a Smith-Blundell test of exogeneity and the results are unchanged
(Smith and Blundell, 1986; Rivers and Vuong, 1988). For information on the Wald tests of
exogeneity, see Wooldridge (2002), pp. 472-477.
32
Second, we follow Miguel, Satyanath and Sergenti (2004) and Bruckner and Ciccone
(2011), among others, and instrument for growth using rainfall data from Matsuura and
Willmott (2007).16 The data set covers 113 autocracies between 1960 and 2006. We expect
low rainfall levels to be associated with low growth rates. As explained above, our variable
(Rain deviation) captures the deviation, in percentage, between precipitations within a given
year and its average over the 1960-2006 period.17 As shown in Table 6, rainfall is not a weak
instrument of growth.18 Moreover, rainfall is unaffected by regime change and is unlikely
to impact regime change other than through its effect on growth. As before, we compute a
Wald test of exogeneity. It now suggests that growth is endogenous (p-values 0.023).
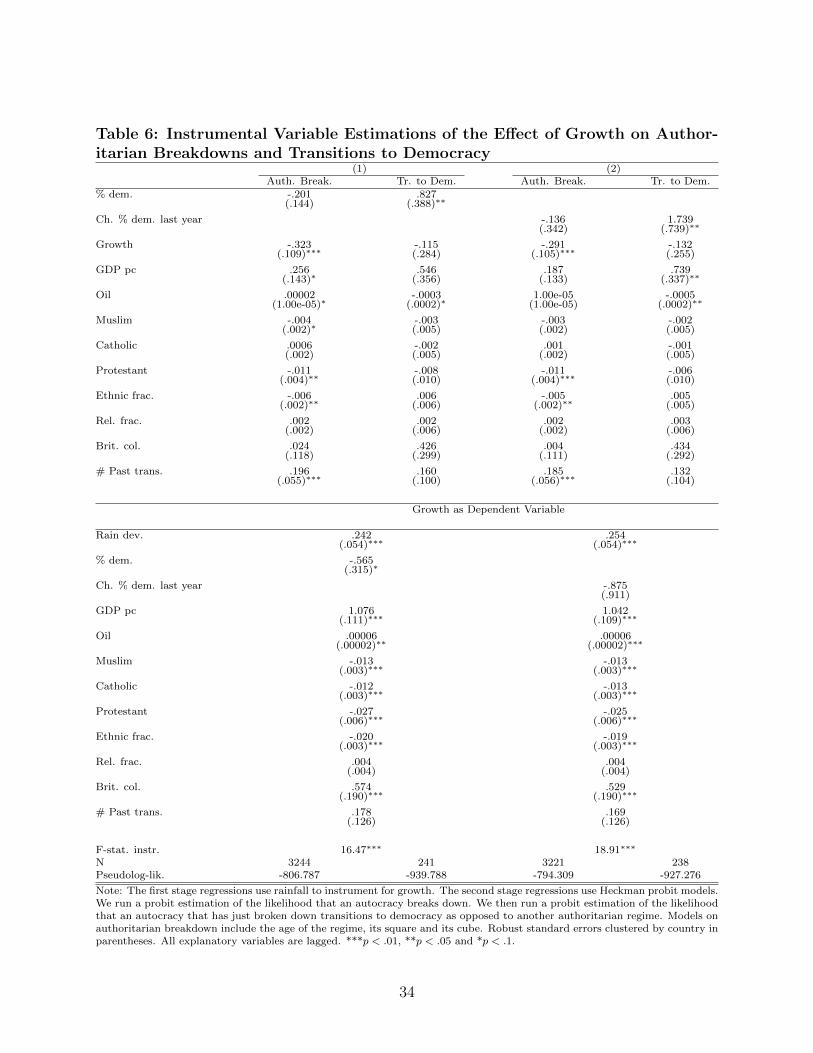
Table 6 reestimates models 1 and 2 of Table 5 using rainfall as an instrument for growth.
As before, we find that growth increases the likelihood that an autocracy collapses. Diffusion
again matters only for whether a democracy is established after the downfall of a dictatorship.
Column 1 of Table 7 uses rainfall as an independent variable rather than an instrument for
growth.19 Low precipitation levels are found to increase the likelihood of democratization
16It must be noted, however, that rainfall is a better instrument of agricultural growth
than industrial growth, and that each type of growth may affect regime breakdown differently
(Dunning, 2008b). See also Sovey and Green (2011) for some of the other limitations of using
rainfall as an instrument for growth.
17Since our growth variable is a three year moving average, we also use the three year
moving average of the rainfall variable in the instrumental variable estimations.
18The F-statistics of the instrument are above 10.
19We rely on % democracies as our key independent variable here because we do not argue
that democratization abroad triggers democratization at home, as the previous diffusion
literature has done. Rather, we argue that once a dictatorship has collapsed, it is more
likely to be replace by a democracy if the country finds itself in an environment dominated
by democracies, which is better measured by the proportion of neighbors that are democratic.
Table A6 of the online appendix shows that the results reported in Table 7 are robust when
33
Table 6: Instrumental Variable Estimations of the Effect of Growth on Author-itarian Breakdowns and Transitions to Democracy
(1) (2)Auth. Break. Tr. to Dem. Auth. Break. Tr. to Dem.
# Past trans. .196 .160 .185 .132(.055)∗∗∗ (.100) (.056)∗∗∗ (.104)
Growth as Dependent Variable
Rain dev. .242 .254(.054)∗∗∗ (.054)∗∗∗
% dem. -.565(.315)∗
Ch. % dem. last year -.875(.911)
GDP pc 1.076 1.042(.111)∗∗∗ (.109)∗∗∗
Oil .00006 .00006(.00002)∗∗ (.00002)∗∗∗
Muslim -.013 -.013(.003)∗∗∗ (.003)∗∗∗
Catholic -.012 -.013(.003)∗∗∗ (.003)∗∗∗
Protestant -.027 -.025(.006)∗∗∗ (.006)∗∗∗
Ethnic frac. -.020 -.019(.003)∗∗∗ (.003)∗∗∗
Rel. frac. .004 .004(.004) (.004)
Brit. col. .574 .529(.190)∗∗∗ (.190)∗∗∗
# Past trans. .178 .169(.126) (.126)
F-stat. instr. 16.47∗∗∗ 18.91∗∗∗
N 3244 241 3221 238Pseudolog-lik. -806.787 -939.788 -794.309 -927.276
Note: The first stage regressions use rainfall to instrument for growth. The second stage regressions use Heckman probit models.We run a probit estimation of the likelihood that an autocracy breaks down. We then run a probit estimation of the likelihoodthat an autocracy that has just broken down transitions to democracy as opposed to another authoritarian regime. Models onauthoritarian breakdown include the age of the regime, its square and its cube. Robust standard errors clustered by country inparentheses. All explanatory variables are lagged. ***p < .01, **p < .05 and *p < .1.
34
Table
7:
Eff
ect
of
Alt
ern
ati
ve
Eco
nom
icShock
son
Auth
ori
tari
an
Bre
akdow
ns
and
Tra
nsi
tions
toD
em
ocr
acy
(1)
(2)
(3)
(4)
Au
th.
Bre
ak.
Tr.
toD
em.
Au
th.
Bre
ak.
Tr.
toD
em.
Au
th.
Bre
ak.
Tr.
toD
em.
Au
th.
Bre
ak.
Tr.
toD
em.
%D
em.
.050
.828
-.005
.638
-.017
.885
.083
.834
(.112)
(.339)∗
∗(.
149)
(.354)∗
(.148)
(.348)∗
∗(.
118)
(.258)∗
∗∗
Rain
dev
.-.
047
-.037
(.015)∗
∗∗(.
041)
RR
cris
es.1
79
.164
(.068)∗
∗∗(.
208)
LV
cris
es.3
01
.325
(.085)∗
∗∗(.
189)∗
RR
/LV
cris
es.2
44
.132
(.057)∗
∗∗(.
150)
GD
Pp
c-.
113
.382
.042
.864
-.136
.403
-.077
.554
(.051)∗
∗(.
246)
(.070)
(.195)∗
∗∗(.
067)∗
∗(.
250)
(.058)
(.191)∗
∗∗
Oil
-2.1
6e-
06
-.0003
.00004
-.0003
-.00002
-.0008
-.00002
-.0004
(8.9
5e-
06)
(.0002)∗
(.0002)
(.0002)∗
(.00003)
(.0004)∗
∗(.
00003)
(.0002)∗
Mu
slim
.0002
-.002
-.004
-.007
-.002
-.004
-.001
-.003
(.002)
(.003)
(.002)∗
∗(.
006)
(.002)
(.004)
(.001)
(.003)
Cath
olic
.004
-.001
-.0003
-.008
.003
-.003
.002
-.005
(.002)∗
∗(.
004)
(.001)
(.002)∗
∗∗(.
002)
(.004)
(.001)
(.003)∗
∗
Pro
test
ant
-.002
-.005
-.002
.013
-.006
-.012
-.002
.0001
(.003)
(.006)
(.002)
(.008)∗
(.003)∗
(.008)
(.002)
(.005)
Eth
nic
frac.
-.0004
.007
.004
.003
-.002
.008
.0005
.006
(.002)
(.004)∗
(.002)∗
(.005)
(.002)
(.005)
(.002)
(.003)∗
Rel
.fr
ac.
-.0005
.002
-.009
-.003
-.0004
.0005
-.003
.003
(.002)
(.005)
(.003)∗
∗∗(.
007)
(.003)
(.006)
(.002)∗
(.005)
Bri
t.co
l.-.
101
.303
-.183
.669
-.058
.321
-.083
.224
(.092)
(.270)
(.164)
(.433)
(.105)
(.286)
(.102)
(.260)
#P
ast
tran
s..1
69
.171
.164
.037
.233
.158
.155
.181
(.055)∗
∗∗(.
085)∗
∗(.
053)∗
∗∗(.
159)
(.067)∗
∗∗(.
086)∗
(.049)∗
∗∗(.
077)∗
∗
N3419
253
3250
287
2331
166
4698
378
Pse
ud
olo
g-l
ik.
-854.5
87
-994.1
02
-908.7
96
-1041.1
19
-555.6
59
-648.5
95
-1245.7
64
-1425.6
8
Note
:H
eckm
an
pro
bit
esti
mati
on
s.T
he
firs
tst
age
run
sa
pro
bit
esti
mati
on
of
the
likel
ihood
that
an
au
thocr
acy
bre
aks
dow
n.
Th
ese
con
dst
age
run
sa
pro
bit
esti
mati
on
of
the
likel
ihood
that
an
au
tocr
acy
that
has
just
bro
ken
dow
ntr
an
siti
on
sto
dem
ocr
acy
as
op
pose
dto
an
oth
erau
thori
tari
an
regim
e.T
he
vari
ab
leRR
crises
ind
icate
sw
het
her
aco
untr
yis
exp
erie
nci
ng
acr
isis
as
defi
ned
by
Rogoff
an
dR
ein
hart
(2010).
Th
evari
ab
leLV
crises
ind
icate
sw
het
her
aco
untr
yis
exp
erie
nci
ng
acr
isis
as
defi
ned
by
Laev
enan
dV
ale
nci
a(2
013).
Th
evari
ab
leRR/LV
crises
ind
icate
sw
het
her
aco
untr
yis
exp
erie
nci
ng
acr
isis
as
defi
ned
by
eith
erR
ogoff
an
dR
ein
hart
(2010)
or
Laev
enan
dV
ale
nci
a(2
013).
Rain
deviation
giv
esth
ed
iffer
ence
,in
per
centa
ge,
bet
wee
nth
eto
tal
am
ou
nt
of
rain
aco
untr
yre
ceiv
edin
agiv
enyea
ran
dth
eaver
age
yea
rly
am
ou
nt
of
rain
that
cou
ntr
yh
as
rece
ived
bet
wee
n1950
an
d2006.
Mod
els
on
au
thori
tari
an
bre
akd
ow
nin
clu
de
the
age
of
the
regim
e,it
ssq
uare
an
dit
scu
be.
Robu
stst
an
dard
erro
rscl
ust
ered
by
cou
ntr
yin
pare
nth
eses
.A
llex
pla
nato
ryvari
ab
les
are
lagged
.***p<
.01,
**p<
.05
an
d*p<
.1.
35
and the relationship is highly significant. Using data from sub-Saharan Africa between
1980 and 2000, Bruckner and Ciccone (2011) have already reported that low rainfall fosters
democratization. In this paper, we extend this analysis beyond sub-Saharan Africa, and
show that rainfall (like growth) is most relevant to the breakdown of authoritarian regimes
rather than the subsequent transition to democracy. The bottom two panels of Figure 5 show
the effect of rainfall on the predicted probabilities of authoritarian breakdown and transition
to democracy. These findings provide further evidence that our results are not driven by the
endogeneity of growth.
Low growth is not the only economic factor that can prompt the breakdown of authori-
tarian regimes. For example, as argued above, the wave of democratization in Latin America
in the 1980s was, at least partially, triggered by the debt crisis of the 1980s. Models 2-4
thus consider the effects of alternative types of crises: banking crises, external debt crises,
inflation crises and stock market crises. Column 2 uses the variable RR crisis which takes
the value one if a country is experiencing a crisis as defined by Reinhart and Rogoff (2011)
– who cover banking, external debt, inflation and stock market crises – or a growth crisis (a
growth rate below -2% at least once over the last three years).
Model 3 reproduces model 2 but using the crises dataset of Laeven and Valencia (2013)
rather than that of Reinhart and Rogoff (2011). The dataset of Laeven and Valencia (2013)
covers only external debt and banking crises. Column 4 reruns the analysis but with a
dummy variable indicating whether a country is experiencing a crisis as defined by either
Reinhart and Rogoff (2011) or Laeven and Valencia (2013), or a growth crisis.20 In all three
cases, crises are found to substantially increase the likelihood that an autocracy breaks down,
but have only a negligible effect on the subsequent transition to democracy.
one uses Change % democracies last year instead.
20Results from model 4 should be interpreted with caution, however, since the data sets
of Laeven and Valencia (2013) covers fewer types of crises than that of Reinhart and Rogoff
(2011).
36
Tab
le8:
Eff
ect
of
Politi
cal
Shock
s,D
iffusi
on
and
Gro
wth
on
Auth
ori
tari
an
Bre
akdow
ns
and
Tra
nsi
tions
toD
em
ocr
acy
(1)
(2)
(3)
(4)
Au
th.
Bre
ak.
Tr.
toD
em.
Au
th.
Bre
ak.
Tr.
toD
em.
Au
th.
Bre
ak.
Tr.
toD
em.
Au
th.
Bre
ak.
Tr.
toD
em.
%D
em.
.078
.893
.054
.730
-.060
.642
.095
.849
(.110)
(.290)∗
∗∗(.
118)
(.283)∗
∗∗(.
122)
(.273)∗
∗(.
104)
(.289)∗
∗∗
Gro
wth
-.018
-.033
-.017
-.035
-.020
-.036
-.016
-.031
(.006)∗
∗∗(.
020)
(.006)∗
∗∗(.
020)∗
(.006)∗
∗∗(.
019)∗
(.006)∗
∗∗(.
02)
US
Sh
are
of
Heg
emon
icP
ow
er.5
12
2.4
61
(.477)
(1.1
92)∗
∗
Pola
rize
dO
rder
.103
.184
(.084)
(.205)
Dem
ocr
ati
cO
rder
.133
.407
(.099)
(.218)∗
Allia
nce
wit
hF
ran
ce.0
07
.256
(.383)
(.724)
Allia
nce
wit
hG
erm
any
-.567
.691
(.305)∗
(.734)
Allia
nce
wit
hJap
an
.823
-.153
(.296)∗
∗∗(.
900)
Allia
nce
wit
hR
uss
ia/U
SSR
-.198
-.616
(.099)∗
∗(.
635)
Allia
nce
wit
hU
S.3
62
.319
(.256)
(.366)
Allia
nce
wit
hU
S(C
old
War)
-.045
.042
(.252)
(.372)
Allia
nce
wit
hU
K-.
077
.767
(.258)
(.910)
Pro
-Dem
ocr
ati
cH
egem
on
icS
hock
s.2
41
.442
(.077)∗
∗∗(.
199)∗
∗
GD
Pp
c-.
078
.612
-.081
.586
-.097
.519
-.083
.642
(.052)
(.208)∗
∗∗(.
051)
(.209)∗
∗∗(.
047)∗
∗(.
211)∗
∗(.
05)∗
(.199)∗
∗∗
Oil
-8.5
7e-
06
-.0004
-1.7
2e-
06
-.0004
-1.1
0e-
06
-.0004
-7.9
8e-
07
-.0005
(1.0
0e-
05)
(.0002)∗
∗∗(8
.29e-
06)
(.0002)∗
∗(8
.10e-
06)
(.0002)∗
∗(8
.76e-
06)
(.0002)∗
∗∗
Mu
slim
-.0008
-.003
-.0008
-.002
-.0004
-.002
-.001
-.002
(.001)
(.003)
(.001)
(.003)
(.001)
(.003)
(.001)
(.003)
Cath
olic
.002
-.005
.002
-.004
.002
-.005
.002
-.005
(.001)∗
(.003)∗
(.001)∗
(.003)
(.001)
(.003)∗
(.001)∗
(.003)
Pro
test
ant
-.0006
.002
-.0007
.003
-.002
.0004
-.001
.002
(.002)
(.005)
(.002)
(.005)
(.002)
(.005)
(.002)
(.005)
Eth
nic
frac.
.0004
.005
.0001
.005
.0002
.004
.0002
.006
(.001)
(.003)
(.001)
(.003)
(.001)
(.003)
(.001)
(.003)∗
∗
Rel
.fr
ac.
-.004
.0002
-.004
-.0003
-.003
.002
-.003
.0003
(.002)∗
∗(.
004)
(.002)∗
∗(.
004)
(.002)
(.004)
(.002)∗
(.004)
Bri
t.co
l.-.
086
.351
-.128
.124
-.093
.172
-.108
.341
(.093)
(.262)
(.094)
(.296)
(.092)
(.277)
(.093)
(.256)
#P
ast
tran
s..1
55
.187
.145
.189
.124
.167
.15
.256
(.048)∗
∗∗(.
092)∗
∗(.
053)∗
∗∗(.
086)∗
∗(.
051)∗
∗(.
085)∗
∗(.
049)∗
∗∗(.
09)∗
∗
N5367
421
5254
418
5254
418
5513
428
Pse
ud
olo
g-l
ik.
-1397.9
05
-1583.9
5-1
384.3
52
-1568.4
77
-1374.4
97
-1556.8
73
-1418.6
24
-1607.1
45
Note
:H
eckm
an
pro
bit
esti
mati
on
s.T
he
firs
tst
age
run
sa
pro
bit
esti
mati
on
of
the
likel
ihood
that
an
au
thocr
acy
bre
aks
dow
n.
Th
ese
con
dst
age
run
sa
pro
bit
esti
mati
on
of
the
likel
ihood
that
an
au
tocr
acy
that
has
just
bro
ken
dow
ntr
an
siti
on
sto
dem
ocr
acy
as
op
pose
dto
an
oth
erau
thori
tari
an
regim
e.US
Share
ofHegem
onic
Power
mea
sure
sth
ean
nu
al
chan
ge
inth
ere
lati
ve
US
share
of
heg
emon
icp
ow
er(t
aken
from
Gu
nit
sky,
2014).
PolarizedOrder
takes
the
valu
e1
in1933-9
0,
an
dDem
ocraticOrder
takes
the
valu
e1
in1919-3
2an
d1991-2
000
(taken
from
Boix
,2011).
Pro-D
emocraticHegem
onic
Shocks
takes
the
valu
e1
du
rin
gyea
rsof
pro
-dem
ocr
acy
heg
emon
icsh
ock
s(1
917-2
2,
1943-4
7,
an
d1989-9
5).
Mod
els
on
au
thori
tari
an
bre
akd
ow
nin
clu
de
the
age
of
the
regim
e,it
ssq
uare
an
dit
scu
be.
Rob
ust
stan
dard
erro
rscl
ust
ered
by
cou
ntr
yin
pare
nth
eses
.A
llex
pla
nato
ryvari
ab
les
are
lagged
.***p<
.01,
**p<
.05
an
d*p<
.1.
37
As discussed in the theory section, common political shocks may also cause authoritar-
ian breakdowns (see Boix, 2011; Gunitsky, 2014). For example, the abandonment of the
Brezhnev doctrine by the USSR prompted the collapse of communist regimes throughout
Eastern Europe. Therefore, in Table 8, we rerun model 1 of Table 5 with different control
variables for political shocks.21 First, in model 1, we use the US Share of Hegemonic Power
variable of Gunitsky (2014). This variable gives the annual change in the relative share of
hegemonic power of the United States, calculated based on the Composite Index of National
Capabilities (CINC).22 It thus captures pro-democratic shifts in the international political
order.
Column 2 of Table 8 includes dummy variables for polarized (1933-90), neutral (1875-
1918) and pro-democratic (1919-1932; 1991-2000) international orders (taken from Boix,
2011).23 A polarized political order is defined as a political order in which there are many
hegemons with conflicting regimes, such as during the Cold War. Under such conditions,
even democratic hegemons may support authoritarian rulers. Neutral international orders
are periods during which hegemons with different regimes are allied. Lastly, a democratic
international order is when there is a single hegemon that is democratic, like after the end
of the Cold War.
In column 3, we include the alliance variables developed by Boix (2011). These indicate
whether a country is in an alliance with a given superpower.24 Autocracies that are in an
21Results reported in Table 8 are unchanged when we use Change % democracies last year
rather than % democracies to measure diffusion (available upon request).
22The CINC is a composite of six different indicators: energy consumption, military ex-
penditure, military personal, total and urban population, and iron and steel production.
Gunitsky (2014) thus assesses the number of hegemons and their relative power.
23Neutral Order is the excluded dummy variable.
24Following Boix (2011), we include a separate dummy variable for whether a country was
in an alliance with the United States during the Cold War. The rationale is that the United
38
alliance with a democratic superpower should be more likely to break down and democratize.
We also construct a variable Pro-Democratic Hegemonic Shocks that takes the value 1 during
years of pro-democracy hegemonic shocks (1917-22, 1943-47, and 1989-95). This admittedly
crude measure is meant to capture the effect of the end of the two world wars and the Cold
War. Results are shown in column 4 of Table 8.
In all models, results remain consistent with our hypothesis even when we control for
political shocks. It is important to note that we do dispute the fact that political shocks can
trigger waves of democratization. Instead, we believe that economic shocks also induce waves
of democratization. We view these explanations as complementary rather than contradictory.
Finally, the result that diffusion increases the likelihood that an autocracy transitions
to democracy after a breakdown could be driven exclusively by the post-Cold War period.
Therefore, in Table A7 of the online appendix we show that the results reported in models
1 and 2 of Table 5 are robust to the inclusion of a dummy variable for the post-Cold War
period. Moreover, consistent with Marinov and Goemans (2013), we find that authoritarian
reversals are much more likely to induce democratization in the post-Cold War period.
Stepping away from our main findings for a moment, the control variables in most in-
stances affect democratization in the same manner as found by the previous literature. For
example, like Miller (2012) and Kennedy (2010), we find that richer autocracies are less
likely to collapse, but that once they do, they are more likely to transition to democracy.
Our analysis also yields novel findings. Oil income, for instance, is found to have an am-
biguous effect on authoritarian breakdown but to substantially decrease the probability of
transition to democracy. This could be explained by the fact that oil increases both the
incentives of outsiders to take power and the capacity of the ruling elite to maintain power
through repression and co-option. However, once the regime is overthrown, the new ruling
elite has more incentives to hold on power and prevent elections, in order to retain control
over rents.
States was more likely to support autocrats during the Cold War.
39
Robustness Tests
The online appendix presents several additional robustness tests. First, the analysis pre-
sented in Table 5 starts in 1875, at a time where there were very few democracies. The fact
that we capture a large proportion of the transitions to democracy is an important advan-
tage of our analysis. Nonetheless, to make sure that our results are not driven by the fact
that very few democracies existed before the end of the 19th century, we rerun Table 5 with
samples covering the periods 1900-2004 (Table A3) and 1945-2004 (Table A4). Results are
unchanged.
Moreover, in Table A8, we rerun models 2-4 of Table 5 using the number (rather than
proportion) of neighbors that have democratized over the last x years (where x varies between
1 and 3). To make sure that our results are not driven by a single region, Table A9 redoes
model 1 of Table 5 while excluding each region in succession.25 In all instances, results are
unaltered.
Furthermore, one problem with looking at the implications of growth is that there are
observations with very high or very low growth rates. We have reduced this problem in the
main analysis by using three year moving averages of the growth rates. Still, while growth
varies between -33.291 and 158.606 percent within the sample, 99 percent of the observations
have growth rates between -20 and 20 percent. In Table A10 we thus redo models 1 and 2 of
Table 5 with only observations with growth rates between -20 and 20 percent. In addition,
Table A11 replicates models 1 and 2 of Table 5 with a dummy variable indicating whether
a country has experienced a growth shock (a growth rate below -2%) at least once over the
last three years rather than with the continuous growth rate variable. Results are robust.
This paper defines neighbors as countries that share a border or are separated by 400
miles of water or less. However, diffusion may not be restricted to direct neighbors. In Table
25We use the following regions: Latin America, sub-Saharan Africa, Middle East, Asia,
Eastern Europe and Western countries (Western Europe, Canada, the United States, Aus-
tralia and New Zealand).
40
A12 we reproduce models 1 and 2 of Table 5 while defining neighbors as countries from the
same region (regions are defined as explained in footnote 24). Moreover, when assessing the
performance of its leaders, the population does not necessarily only consider how its country
performs in isolation but also how it performs compared to other economies (see Kayser
and Peress, 2012). An economic crisis may not harm the legitimacy of a leader to the same
extent if many other countries are also experiencing economic crises. Therefore, Table A13
reproduces the first two columns of Table 5 but with a new variable (Benchmarked growth
rate) that gives the difference between the growth rate of a country and the average growth
rate in the world in a given year. Our results are robust.
The recent literature on democracy has insisted on the importance of including country
fixed effects in order to control for country-specific unobserved factors (e.g. Acemoglu et al.,
2008). Table A14 replicates Table 4 with country fixed effects.26 Results are again unaltered.
It is possible that the effect of growth on authoritarian breakdown and subsequent tran-
sition to democracy is contingent on whether a large proportion of a country’s neighbors are
democratic or not. Tables A15 and A16 reproduce models 1 and 2 of Tables 4 and 5 with
an interaction term between growth and diffusion. Results do not support this alternative
hypothesis. Rather growth and diffusion affect distinct moments of the transition process.
Finally, section 2 of the online appendix shows that the results reported in Table 4 are robust
to the use of spatial probit models.
Conclusion
This paper has contributed to the literature by providing a novel explanation for one of
the most important observations of the democratization literature, namely that transitions
to democracy happen in spatial and temporal clusters. Our explanation moves away from
the diffusion explanation that has dominated the literature. Rather, we advance a more
26Heckman probit models could not be run with country fixed effects.
41
nuanced two-stage argument. Economic shocks, that are themselves clustered, trigger the
transition process by causing the breakdown of authoritarian regimes. Democratic diffusion,
in turn, increases the likelihood that democracy will be adopted once the previous regime
has collapsed.
We test our hypothesis using a sample of 125 autocracies between 1875 and 2004. After
demonstrating that economic shocks are indeed clustered regionally, we show that diffusion,
on its own, cannot explain the occurrence of waves of democratization, notably because
it cannot account for the temporal dimension of the waves. We then use Heckman probit
models to show that economic crises are the primary driving forces of authoritarian reversals,
while the choice of adopting democratic institutions is mainly influenced by diffusion.
These findings suggest that, as already pointed out by Huntington (1991), the factors
that cause the breakdown of authoritarian regimes and the choice of installing a democracy
may be very different. Democratization occurs in waves because economic shocks, which are
themselves clustered in time and space, play a key role in authoritarian breakdown. Diffusion
alone cannot account for democratic waves but democratization in neighbors does influence
democratization at home once autocratic regimes have collapsed. Both factors contribute to
democratic waves, just at different steps.
42
References
Acemoglu, Daron and James Robinson. 2006. Economic Origins of Dictatorship and Democ-
racy. Cambridge University Press.
Acemoglu, Daron, Simon Johnson, James A Robinson and Pierre Yared. 2008. “Income and
Democracy.” American Economic Review 98(3):808–842.
Ahlquist, John S and Erik Wibbels. 2012. “Riding the Wave: World Trade and Factor-Based
Models of Democratization.” American Journal of Political Science 56(2):447–464.
Boehmke, Frederick. 2009. “Policy Emulation or Policy Convergence? Potential Ambiguities
in the Dyadic Event History Approach to State Policy Emulation.” Journal of Politics
71(03):1125–40.
Boix, Carles. 2003. Democracy and Redistribution. New York: Cambridge University Press.
Boix, Carles. 2011. “Democracy, development, and the international system.” American
Political Science Review 105(4):809–28.
Boix, Carles, Michael Miller and Sebastian Rosato. 2013. “A Complete Data Set of Political
Regimes, 1800–2007.” Comparative Political Studies 46(12).
Boix, Carles and Susan Carol Stokes. 2003. “Endogenous Democratization.” World politics
55(4):517–549.
Bratton, Michael and Nicolas van de Walle. 1997. Democratic Experiments in Africa: Regime
Transitions in Comparative Perspective. Cambridge University Press.
Brinks, Daniel and Michael Coppedge. 2006. “Diffusion is No Illusion: Neighbor Emulation
in the Third Wave of Democracy.” Comparative Political Studies 39:463–89.
43
Brooks, Sarah M. 2005. “Interdependent and Domestic Foundations of Policy Change: The
Diffusion of Pension Privatization Around the World.” International Studies Quarterly
49(2):273–294.
Bruckner, Markus and Antonio Ciccone. 2011. “Rain and the democratic window of oppor-
tunity.” Econometrica 79(3):923–947.
Bueno de Mesquita, Bruce, Alastair Smith, Randolph M. Siverson and James D. Morrow.
2003. The Logic of Political Survival. The MIT Press.
Csordas, Stefan and Markus Ludwig. 2011. “An Empirical Investigation of the Determinants
of Democracy: Trade, Aid and the Neighbor Effect.” Economics Letter 110:235–37.
Dahl, Robert A. 2000. On Democracy. Yale University Press.
de Ven, Wynand P.M.M. Van and Bernard M.S. Van Praag. 1981. “The demand for de-
ductibles in private health insurance: A probit model with sample selection.” Journal of
Econometrics 17(2):229–252.
Della Porta, Donatella and Sidney Tarrow. 2012. “Interactive Diffusion The Coevolution of
Police and Protest Behavior With an Application to Transnational Contention.” Compar-
ative Political Studies 45(1):119–152.
Doorenspleet, Renske. 2004. “The recent context of recent transitions to democracy.” Euro-
pean Journal of Political Research 43:309–35.
Dunning, Thad. 2008a. Crude Democracy: Natural Resource Wealth and Political Regimes.
Cambridge University Press Cambridge.
Dunning, Thad. 2008b. “Model Specification in Instrumental-Variables Regression.” Political
Analysis 16:290–302.
Elkins, Zachary and Beth Simmons. 2004. “The globalization of liberalization: Policy diffu-
sion in the international political economy.” American Political Science Review 98:171–190.
44
Epstein, David L., Robert Bates, Jack Goldstone, Ida Kristensen and Sharyn O’Halloran.
2006. “Democratic transitions.” American Journal of Political Science pp. 551–569.
Frieden, Feffry A. 2006. Global Capitalism: Its Fall and Rise in the Twentieth Century.
W.W. Norton and Co.
Geddes, Barbara. 1999. “What Do We Know about Democratization after Twenty Years?”
Annual Review of Political Science 2:115–44.
Gilardi, Fabrizio. 2010. “Who learns from what in policy diffusion processes?” American
Journal of Political Science 54(3):650–666.
Gleditsch, Kristian S. and Michael D. Ward. 2006. “Diffusion and the International Context
of Democratization.” International Organization 60(4):911–33.
Goemans, Hein, Kristian S. Gleditsch and Giacomo Chiozza. 2009. “Introducing Archigos:
A Data Set of Political Leaders.” Journal of Peace Research 46(02):169–183.
Gunitsky, Seva. 2014. “From Shocks to Waves: Hegemonic Transitions and Democratization
in the 20th Century.” International Organization Forthcoming, Fall.
Haber, Stephen and Victor Menaldo. 2011. “Do natural resources fuel authoritarianism? A
reappraisal of the resource curse.” American Political Science Review 105(1):1–26.
Haggard, Stephan and Robert R. Kaufman. 1995. The Political Economy of Democratic
Transitions. Princeton: Princeton University Press.
Hale, Henry. 2013. “Regime Change Cascades: What We Have Learned from the 1848
Revolutions to the 2011 Arab Uprisings.” Annual Review of Political Science 16:331–53.
Hendrix, Cullen, Stephan Haggard and Beatriz Magaloni. 2009. “Grievance and Opportunity:
Food Prices, Political Regimes, and Protests.” Working Paper.
45
Hennessy, Alexandra and Martin Steinwand. 2014. “The Sources of Pension Reforms in
Western Europe: Domestic Factors, Policy Diffusion, or Common Shock?” International
Interactions 40(04):477–505.
Houle, Christian. 2009. “Inequality and democracy: Why inequality harms consolidation
but does not affect democratization.” World Politics 61:589–622.
Huntington, Samuel P. 1991. The Third Wave: Democratization in the Late Twentieth
Century. Norman: University of Oklahoma Press.
Janos, Andrew C. 2000. East Central Europe in the modern world: the politics of the bor-
derlands from pre- to post-communism. Stanford University Press.
Joseph, Richard. 1997. “Democratization in Africa after 1989: Comparative and theoretical
perspectives.” Comparative Politics pp. 363–382.
Kayser, Mark Andreas and Michael Peress. 2012. “Benchmarking across borders: elec-
toral accountability and the necessity of comparison.” American Political Science Review
106(3):661–684.
Kennedy, Ryan. 2010. “The Contradiction of Modernization: A Conditional Model of En-
dogenous Democratization.” Journal of Politics 72(03):785–98.
King, Gary, Michael Tomz and Jason Wittenberg. 2000. “Making the Most of Statisti-
cal Analyses: Improving Interpretation and Presentation.” American Journal of Political
Science 44(2):341–355.
Koesel, Karrie and Valerie Bunce. 2013. “Diffusion-Proofing: Russian and Chinese Responses
to Waves of Popular Mobilizations Against Authoritarian Rulers.” Perspectives on Politics
11(03):753–68.
Koesel, Karrie, Valerie Bunce and Sharon Wolchik. 2011. Stopping the Diffusion of Popular
46
Protests Against Authoritarian Rule. In Annual Meeting of the American Political Science
Association, Seattle. pp. 1–4.
Laeven, Luc and Fabian Valencia. 2013. “Systemic banking crises database.” IMF Economic
Review 61(2):225–270.
Leeson, Peter T. and Andrea M. Dean. 2009. “The Democratic Domino Theory: An Empir-
ical Investigation.” American Journal of Political Science 53(3):533–551.
Linz, Juan J and Alfred Stepan. 1978. The Breakdown of democratic regimes, Latin Amer-
ica/edited by Juan J. Linz and Alfred Stepan. Johns Hopkins University Press.
Lipset, Seymour M. 1959. “Some social requisites of democracy: Economic development and
political legitimacy.” The American Political Science Review 53(1):69–105.
Marinov, Nikolay and Hein Goemans. 2013. “Coups and Democracy.” British Journal of
Political Science 44(04):799–825.
Markoff, John and Silvio R. Duncan Baretta. 1990. “Economic Crisis and Political Change
in Brazil: The 1960s and the 1980s.” Comparative Politics 22:421–44.
Matsuura, K and CJ Willmott. 2007. “Terrestrial precipitation: 1900–2006 gridded monthly
time series (version 1.01).” Cent. for Clim. Res., Dep. of Geogr., Univ. of Del., Newark,
Del .
Miguel, Edward, Shanker Satyanath and Ernest Sergenti. 2004. “Economic Shocks and
Civil Conflict: An Instrumental Variables Approach.” Journal of Political Economy
112(41):725–753.
Miller, Michael. 2012. “Economic Development, Violent Leader Removal, and Democratiza-
tion.” American Journal of Political Science 56(4):1002–20.
Miller, Michael. 2014. “Elections and Elite Violence on the Road to Democratization, 1800-
2010.” Presented at the American Political Science Association, 2014.
47
Oatley, Thomas. 2006. International Political Economy: Interests and Institutions in the
Global Economy. Longman Boston.
O’Donnell, Guillermo A. 1973. Modernization and bureaucratic-authoritarianism: Studies
in South American politics. Institute of International Studies, University of California
Berkeley.
O’Loughlin, John, Michael Ward, Corey Lofdahl, Jordin Cohen, David Brown, David Reilly,
Kristian Gleditsch and Michael Shin. 1998. “The Diffusion of Democracy, 1946-1994.”
Annals of the Association of American Geographers 88(04):545–74.
Pegram, Thomas. 2010. “Diffusion Across Political Systems: The Global Spread of National
Human Rights Institutions.” Human Rights Quarterly 32(03):729–60.
Pevehouse, Jon. 2005. Democracy from Above: Regional Organizations and Democratization.
Cambridge: Cambridge University Press.
Przeworski, Adam, Michael E. Alvarez, Jose A. Cheibub and Fernando Limongi. 2000.
Democracy and Development: Political Institutions and Well-Being in the World, 1950-
1990. New York: Cambridge University Press.
Rahman, Muhammad, Nejat Anbarci, Prasad Bhattacharya and Mehmet Ulubasoglu. 2013.
“The Shocking Origins of Political Transitions? Evidence from Earthquakes.” Working
Paper.
Reinhart, Carmen M and Kenneth S Rogoff. 2011. “From Financial Crash to Debt Crisis.”
American Economic Review 101(5):1676–1706.
Richards, Gordon. 1986. “Stabilization crises and the breakdown of military authoritarianism
in Latin America.” Comparative Political Studies 18(4):449–485.
Rivers, Douglas and Quang H. Vuong. 1988. “Limited Information Estimators and Exogene-
ity Tests for Simultaneous Probit Models.” Journal of Econometrics 39:347–66.
48
Ross, Michael L. 2001. “Does oil hinder democracy?” World politics 53(3):325–361.
Salehyan, Idean and Kristian Gleditsch. 2006. “Refugees and the Spread of Civil War.”
International Organization 60(02):335–66.
Smith, Richard J. and Richard W. Blundell. 1986. “An Exogeneity Test for a Simultaneous
Equation Tobit Model with an Application to Labor Supply.” Econometrica 54(3):679–85.
Sovey, Allison and Donald Green. 2011. “Instrumental Variables Estimation in Political
Science: A Readers’ Guide.” American Journal of Political Science 55(01):188–200.
Staiger, Douglas and James H. Stock. 1997. “Instrumental Variables Regression with Weak
Instruments.” Econometrica 65(03):557–586.
Starr, H. 1991. “Democratic dominoes: Diffusion approaches to the spread of democracy in
the international system.” Journal of Conflict Resolution pp. 356–381.
Starr, Harvey and Christina Lindborg. 2003. “Democratic Dominoes Revisited: The Hazards
of Governmental Transitions, 1974-1996.” Journal of Conflict Resolution 47(04):490–519.
Strand, Havard, Havard Hegre, Scott Gates and Marianne Dahl. 2013. “Why Waves? Global
Patterns of Democratization , 1820-2008.” Working Paper, PRIO .
Tanneberg, Dag, Christoph Stefes and Wolfgang Merkel. 2013. “Hard times and regime
failure: autocratic responses to economic downturns.” Contemporary Politics 19(1):115–
129.
Teorell, Jan. 2010. Determinants of democratization. Cambridge: Cambridge University
Press.
Thompson, Mark R. 2001. “To shoot or not to shoot: Posttotalitarianism in China and
Eastern Europe.” Comparative Politics pp. 63–83.
49
Ulfelder, Jay. 2009. “Pathways to Political Liberalization in Dictatorships.” Available at
SSRN 1532791 .
Wejnert, Barbara. 2005. “Diffusion, Development, and Democracy, 1800-1999.” American
Sociological Review 70(01):53–81.
Wejnert, Barbara. 2014. Diffusion of Democracy: The Past and Future of Global Democracy.
Cambridge: Cambridge University Press.
Weyland, Kurt. 2009. “The Diffusion of Revolution: ’1848’ in Europe and Latin America.”
International Organization 63(03):391–423.
Wooldridge, Jeffrey M. 2002. Econometric Analysis of Cross Section and Panel Data. MIT