Page 1
THE ENERGY EFFICIENCY POTENTIAL OF CLOUD-BASED SOFTWARE:
A U.S. Case Study
Eric Masanet Arman Shehabi
Lavanya Ramakrishnan Jiaqi Liang Xiaohui Ma
Benjamin Walker Valerie Hendrix
Pradeep Mantha
Page 2
!
!!
The Energy Efficiency Potential of
Cloud-Based Software: A U.S. Case
Study
!
Lawrence Berkeley National Laboratory
June, 2013
Research Team
Eric!Masanet! Arman!Shehabi!Jiaqi!Liang! Lavanya!Ramakrishnan!XiaoHui!Ma! Valerie!Hendrix!Benjamin!Walker! Pradeep!Mantha!! !McCormick)School)of)Engineering) Lawrence)Berkeley)National))Northwestern)University) Laboratory)! !!
Citation
Masanet,! E.,! Shehabi,! A.,! Ramakrishnan,! L.,! Liang,! J.,! Ma,! X.,!Walker,! B.,! Hendrix,! V.,! and! P.!Mantha!(2013).!The)Energy)Efficiency)Potential)of)CloudABased)Software:)A)U.S.)Case)Study.!Lawrence!Berkeley!National!Laboratory,!Berkeley,!California.!!
Acknowledgments
The! research! reported! in! this! report! was! conducted! by! Lawrence! Berkeley! National! Laboratory! with!support!from!Google.!!!Lawrence!Berkeley!National!Laboratory!is!supported!by!the!Office!of!Science!of!the!United!States!Department!of!Energy!and!operated!under!Contract!Grant!No.!DEWAC02W05CH11231.!!
Cover!photos!courtesy!of!the!National!Energy!Research!Scientific!Computing!Center!and!Google.! !
Page 3
!
!!
Table of Contents
Executive!Summary!.....................................................................................................................................!1!
Introduction!.........................................................................................................................................!1!
Case!study!results!................................................................................................................................!1!
Key!findings!and!outcomes!..................................................................................................................!2!
The!CLEER!Model!.................................................................................................................................!2!
Introduction!.................................................................................................................................................!3!
The!CLEER!Model!.................................................................................................................................!4!
U.S.!case!study!.....................................................................................................................................!6!
Case!Study!Approach!...................................................................................................................................!7!
U.S.!workers!using!email,!productivity,!and!CRM!software!.................................................................!7!
Present!day!hosting!of!business!software!...........................................................................................!8!
Present!day!data!center!characteristics!..............................................................................................!9!
Client!device!characteristics!..............................................................................................................!10!
Data!center,!network,!and!client!device!energy!use!.........................................................................!11!
Shifting!to!the!cloud!..........................................................................................................................!12!
Findings!......................................................................................................................................................!12!
Case!study!results!..............................................................................................................................!12!
Limitations!.........................................................................................................................................!14!
Conclusions!................................................................................................................................................!16!
Appendix:!Case!Study!Approach!and!Assumptions!...................................................................................!17!
U.S.!workers!using!email,!productivity,!and!CRM!software!...............................................................!17!
Present!day!hosting!of!email,!productivity,!and!CRM!software!........................................................!18!
Present!day!data!center!characteristics!............................................................................................!21!
Client!device!characteristics!..............................................................................................................!24!
Data!center,!network,!and!client!device!energy!use!.........................................................................!26!
Embodied!energy!and!emissions!.......................................................................................................!28!
Shifting!from!present!day!systems!to!the!cloud!................................................................................!29!
End!Notes!..................................................................................................................................................!32!
!
Page 4
!
1!!
Executive Summary
Introduction
The! energy! use! of! data! centers! is! a! topic! that! has! received!much! attention,! given! that! data! centers!currently!account!for!1W2%!of!global!electricity!use.!!However,!cloud!computing!holds!great!potential!to!reduce! data! center! energy! demand! moving! forward,! due! to! both! large! reductions! in! total! servers!through! consolidation! and! large! increases! in! facility! efficiencies! compared! to! traditional! local! data!centers.! ! However,! analyzing! the! net! energy! implications! of! shifts! to! the! cloud! can! be! very! difficult,!because!data!center! services!can!affect!many!different!components!of! society’s!economic!and!energy!systems.!!This!report!summarizes!research!by!Lawrence!Berkeley!National!Laboratory!and!Northwestern!University!to!address!this!net!energy!analysis!challenge!in!two!important!ways:!
1. We!developed! a! comprehensive! yet! user! friendly! openWaccess!model!for! assessing! the! net! energy! and! emissions! implications! of! cloud!services!in!different!regions!and!at!different!levels!of!market!adoption.!!The!model—named!the!Cloud!Energy!and!Emissions!Research!(CLEER)!Model—aims! to! provide! full! transparency! on! calculations! and! input!value!assumptions!so!that!its!results!can!be!replicated!and!its!data!and!methods! can! be! easily! refined! and! improved! by! the! global! research!community.!!The!CLEER!Model!has!been!made!freely!available!online.!
!
2. We!applied!the!CLEER!Model!in!a!case!study!to!assess!the! technical! potential! of! cloudWbased! business!software!for!reducing!energy!use!and!greenhouse!gas!emissions! in! the!United!States.! !We!focused!on!three!common! business! applications—email,! productivity!software,! and! customer! relationship! management!(CRM)! software—which!are!currently!used!by! tens!of!millions!of!U.S.!workers!(see!table!at!right).!!!
Case study results
We!used!the!CLEER!Model!to!analyze!the!technical)potential!for!energy!savings!associated!with!shifting!U.S.! business! software! to! the! cloud,!which! illustrates! the! energy! and! emissions! savings! that! could! be!realized!under!a!maximum!possible!adoption!scenario.!!Our!results!suggest!that!the!potential!for!energy!savings! is! substantial:! if! all! U.S.! business! users! shifted! their! email,! productivity! software,! and! CRM!software!to!the!cloud,!the!primary!energy!footprint!of!these!software!applications!might!be!reduced!by!as!much!as!87%!or!326!Petajoules.!!That’s!enough!primary!energy!to!generate!the!electricity!used!by!the!City!of!Los!Angeles!each!year!(23!billion!kilowattWhours).!
Figure! ESW1(a)! shows! that! most! of! our! estimated! energy! savings! were! associated! with! email! and!productivity! software,!owing! to! their!widespread!use! in!U.S.!businesses.! ! Figure!ESW1(b)!demonstrates!the!primary!driver!of!energy!savings,!namely,!a!substantial!reduction!in!required!data!center!energy!use!when!shifting!from!many!inefficient! local!data!centers!to!fewer!and!more!efficient!cloud!data!centers.!!
Page 5
!
2!!
Like!all!modeling!efforts,!our!estimates!are!not!without!uncertainties.!!Despite!these!uncertainties,!the!energy!savings!potential!of!cloudWbased!software!is!likely!to!be!substantial!on!a!national!scale!given!the!vast!differences!between!the!energy!efficiencies!of!local!and!cloud!data!centers.!!
!
Figure!ES*1:!Primary!energy!use!of!present*day!and!cloud*based!business!software!systems!by:!(a)!application!and!(b)!system!component.!
Key findings and outcomes
• The! CLEER! Model! provides! the! first! ever! openWaccess,! fully! transparent! systems! model! for!energy! analysis! of! cloud! systems! by! the! research! community.! ! Researchers! can! review,!scrutinize,!and!improve!upon!its!modeling!framework!and!input!assumptions,!which!should!help!enable!and!encourage!more!scientific!research!on!the!energy!impacts!of!digital!services.!!
• The! case! study! demonstrates! how! the! CLEER!Model! can! be! applied! to! research! questions! at!different! regional! scales! and! that! consider! all! societal! end! uses! of! energy! affected! by! cloud!services!for!more!robust!answers.!!!!
• Our!results!indicate!substantial!primary!energy!savings!if!U.S.!businesses!shift!common!software!applications!to!the!cloud.!!
• Our!results!further!highlight!the!need!for!more!comprehensive!and!credible!public!use!data!on!all! components! of! digital! service! systems—including! data! centers,! network! transmission!systems,!client!devices,!user!behavior,!and!present!day!energy!efficiency!practices—to!improve!the!accuracy!of!results!moving!forward.!
The CLEER Model
The! model! can! be! accessed! online! at! http://cleermodel.lbl.gov/.! ! The! modeling! approach! and! key!assumptions!can!be!reviewed!in!the!online!technical!documentation.!!Users!can!preload!the!input!value!assumptions! of! our! U.S.! business! software! case! study,! or! analyze! cloud! systems! questions! of! their!choosing!by!selecting!their!own!analysis!boundaries!and!providing!their!own!input!values.! !
Page 6
!
3!!
Introduction
The! energy! use! of! data! centers,! and! their! associated! emissions! of! greenhouse! gases! (GHGs)! and! air!pollutants,! is! a! topic! that! has! received! much! attention! in! both! the! public! media! and! the! scientific!research!community.1,2,3,4! !While!the!energy!requirements!of!data!centers!are! indeed!significant—they!currently!account!for!1W2%!of!global!electricity!use5—the!emergence!of!cloud!computing!holds!promise!for!reducing!global!data!center!energy!demand!in!the!near!future.!!The!primary!advantage!of!cloud!data!centers!is!that!they!leverage!virtualization!and!scalable!computing!strategies!to!maximize!the!utilization!of! servers,! which! drastically! reduces! the! number! of! servers! needed! to! provide! digital! services! when!compared!to!traditional!local!data!centers.!!Cloud!data!centers!are!also!typically!engineered!to!minimize!the! energy! needed! for! infrastructure! systems! (i.e.,! cooling! and! power! provision! systems),! with!many!cloud! data! centers! exhibiting! power! utilization! effectiveness! (PUE)! values! of! 1.1! or! less.6,7,8,9,10,11!!Combined,!high!server!utilizations!and!low!PUEs!have!made!cloud!computing!the!new!standard!for!best!practice!data!center!energy!efficiency.!!
A!small!but!growing!body!of!research!suggests!that!the!net!energy!benefits!of!cloud!computing!might!be!substantial! if! cloud! services! were! adopted! at! large! scales.! ! For! example,! some! recent! reports! and!corporate! case! studies! suggest! that! moving! applications! such! as! email,! customer! relationship!management! (CRM)! software,! groupware,! and! collaboration! software! from! local! data! centers! to! the!cloud!can!reduce!the!energy!associated!with!software!use!by!up!to!95%,!depending!on!the!efficiency!of!the!local!data!center!that!is!replaced.12,13,14,15!!
Cloud!data!centers!are!also!likely!to!play!an!increasing!role!in!reducing!demand!for!physical!goods!and!services! (a! process! known! as! dematerialization)! through! the! provision! of! digital! news! and!entertainment,! eWcommerce,! and! remote!work! and! collaboration! capabilities.! ! For! example,! lifeWcycle!assessment!studies!suggest!that!digital!music!can!reduce!the!carbon!dioxide!(CO2)!emissions!intensity!of!music!delivery!by!40%W80%!compared!to!compact!discs!and!that!digital!news!can!reduce!CO2!emissions!of! news! delivery! by! 1W2! orders! of! magnitude! compared! to! a! newspaper.16,17! As! cloud! data! centers!increasingly!replace!local!data!centers!for!providing!digital!services,!the!energy!and!emissions!benefits!of!dematerialization!might!be!even!greater!given!the!superior!energy!efficiency!of!cloud!data!centers.!
While!research!to!date!has!provided!intriguing!glimpses!of!the!cloud’s!potential!for!societal!energy!and!emissions!savings!in!specific!cases,!the!results!of!past!studies!can!be!difficult!to!synthesize!into!credible!conclusions!about!the!cloud’s!potential!on!a!broader!scales.!!In!particular,!the!following!issues!make!past!research!difficult!to!generalize:!
• Results! are! often! based! on! static,! caseWspecific! assumptions,! which! precludes! application! to!other!scenarios;!
• Often!key!assumptions!are!not!described!in!sufficient!detail!for!one!to!change!assumptions!and!arrive!at!new!results;!
• Proprietary! models! are! sometimes! used,! which! precludes! scientific! validation,! critique,! and!refinement!of!the!modeling!methods!by!the!research!community;!
• The! limitations! of! the!modeling!methods!may! not! be! discussed! in! sufficient! detail! for! proper!consideration!of!uncertainties!when!interpreting!results;!!
Page 7
!
4!!
• Rapid!change! in! information!technologies!and!user!behaviors!can!quickly!make!published!case!studies!obsolete;!and!
• Given!the!focus!on!case!results,!modeling!challenges!and!opportunities!for!future!research!are!not!always!discussed.!!!
The!above!issues!presently!serve!as!knowledge!barriers!to!the!energy!analysis,!corporate!planning,!and!policy! communities!who! seek! to! better! understand! the! environmental! implications! of! cloud! services.!!While!largeWscale!shifts!to!cloud!computing!are!clearly!already!underway,!a!better!understanding!of!the!energy! and!emissions! implications!of! these! shifts—both!positive! and!negative—is! critical! for! enabling!research!and!policy!decisions!that!can!steer!cloud!services!down!the!most!sustainable!pathways!in!the!years!ahead.!!!
This! report! summarizes! research! by! Lawrence! Berkeley! National! Laboratory! and! Northwestern!University!that!aims!to!overcome!these!knowledge!barriers!in!two!important!ways.!
First,! we! developed! a! comprehensive! yet! user! friendly! openWaccess! model! for!assessing!the!net!energy!and!emissions!implications!of!cloud!services!in!different!regions! and! at! different! levels! of! market! adoption.! ! The! Cloud! Energy! and!Emissions! Research! (CLEER)! Model! aims! to! provide! full! transparency! on!calculations!and!input!value!assumptions!so!that!its!results!can!be!replicated!and!its! data! and! methods! can! be! easily! refined! and! improved! by! the! research!community.! ! The!overarching!purpose!of! the!CLEER!Model! is! to!encourage!and!enable! open! scientific! research! on! the! positive! and! negative! impacts! of! cloud!services.!
Second,!we!applied!the!CLEER!Model!to!assess!the!technical!potential!of!cloudWbased!business!software!for! reducing! energy! use! and! CO2! emissions! in! the!United! States.! The! purpose! of! this! case! study!was!twofold.! ! First,! the! case! study! is! meant! to! show! how! the! CLEER! Model! can! be! applied! to! research!questions!at!different!regional!scales!and!that!consider!all!societal!end!uses!of!energy!affected!by!cloud!services!for!more!robust!answers.!!Second,!the!case!study!highlights!the!need!for!better!public!use!data!on! the! various! components! of! cloud! technology! systems! (e.g.,! data! centers,! network! transmission!systems,!and!client!IT!devices).!!The!case!study!uses!best!available!data!to!generate!credible!results,!but!also!documents!data!limitations!that!should!be!addressed!moving!forward!for!greater!analysis!certainty.!!As!such,!the!intent!is!to!help!synthesize!knowledge!from!past!work!while!providing!a!roadmap!for!more!efficient!knowledge!generation!in!future!work.!
The CLEER Model
The!CLEER!Model! is!based!on!a!bottomWup!analysis!of! the!major! societal! end!uses!of! energy! that! are!affected! by! cloud! systems,! including! data! centers,! data! transmission! systems,! client! IT! devices,!commercial! and! residential! buildings,! and! manufacturing,! transportation,! and! waste! management!systems.! ! It! further! includes!key! interrelationships!between! these!end!use!systems.! !The!scope!of! the!CLEER!Model!is!depicted!schematically!in!Figure!1.!!
Page 8
!
5!!
The!model!structure!provides!flexibility!to!assess!a!range!of!different!cloud!service!models,!technology!and! operations! configurations,! local! conditions! (e.g.,! electricity! grid! mix),! and! system! responses! in!different!regions,!thereby!ensuring!broad!applicability!of!results.!!It!is!designed!to!compare!in!a!credible!and! transparent!manner! the!energy!use!of!present!day! systems! for!providing!a!digital! (e.g.,! email)!or!physical! (e.g.,! DVDs)! service! to! the! energy! use! of! cloudWbased! systems! that! could! provide! that! same!service.!!At!different!scales!of!market!adoption,!the!CLEER!Model!quantifies!the!net!changes!in!regional!energy! use! between! present! day! and! cloudWbased! systems—accounting! for! changes! in! both! direct!energy! use! and! embodied!energy—and! calculates! the!resulting!net!changes! in!direct!and!embodied!GHG!emissions.!!Scale!is!defined!as!the!number!of! organizations! and/or! endWusers! who! shift! from! presentWday! to! cloudWbased! systems.!!!The!results!highlight!how!each!particular! component! of! the!overall! system! contributes! to!the! energy! footprints! of!presentWday! and! cloudWbased!systems,! as! well! as! which!components! account! for! the!net! energy! and! emissions!differences! between! the! two!systems.!!!
Each!of! the!energy!end!use! systems!depicted! in! Figure!1! is! represented!by!a! subWmodel! in! the!CLEER!Model!framework.!!Users!of!the!model!are!prompted!to!describe!each!relevant!end!use!system!in!their!analysis!in!terms!of!key!parameters!that!affect!the!energy!demand!of!that!end!use!system.!!For!example,!to!describe!presentWday!data!centers!for!providing!email,!the!user!must!specify!the!numbers!and!types!of! servers,! the! average! server! power,! the! number! of! external! hard! disk! drives! (HDDs),! and! the! PUE!associated!with!the!data!centers!that!presently!house!these!devices.!!The!user!then!describes!the!cloudWbased!data!centers!that!would!provide!the!email!service! in!terms!of!these!same!key!parameters.! !The!user!can!select!which!end!use!subWmodels!to!consider,!ranging!from!analysis!of!a!single!end!use!system!(e.g.,!data!centers)!to!inclusion!of!the!many!end!use!systems!that!might!be!necessary!from!a!lifeWcycle!perspective!(e.g.,!the!manufacturing!and!transportation!of!DVDs!compared!to!data!centers!and!network!data!transmission! for!streaming!video).! !Thus,!analysis!boundaries!can!be!tailored!to!the!needs!of! the!user!for!a!given!research!question.!!All!parameters!that!characterize!the!energy!demand!of!each!end!use!system!in!the!CLEER!Model!are!described!in!the!model’s!online!technical!documentation.!!!
The! CLEER! model! was! designed! to! provide! an! intuitive! web! interface! that! will! allow! the! research!community!to!generate!results!using!userWdefined!assumptions!and!data! inputs.! ! Its!output!results!are!
Page 9
!
6!!
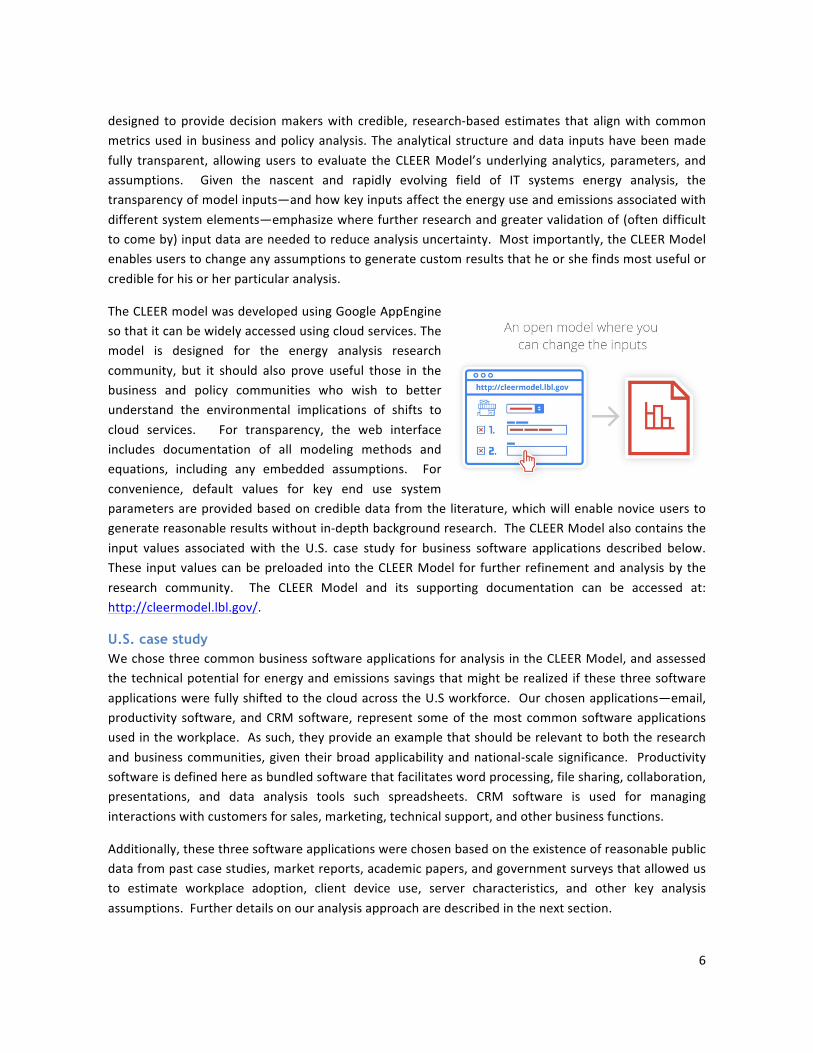
designed! to!provide!decision!makers!with! credible,! researchWbased!estimates! that! align!with! common!metrics!used! in!business!and!policy!analysis.!The!analytical!structure!and!data! inputs!have!been!made!fully! transparent,! allowing!users! to! evaluate! the!CLEER!Model’s! underlying! analytics,! parameters,! and!assumptions.! ! Given! the! nascent! and! rapidly! evolving! field! of! IT! systems! energy! analysis,! the!transparency!of!model!inputs—and!how!key!inputs!affect!the!energy!use!and!emissions!associated!with!different!system!elements—emphasize!where!further!research!and!greater!validation!of!(often!difficult!to!come!by)!input!data!are!needed!to!reduce!analysis!uncertainty.!!Most!importantly,!the!CLEER!Model!enables!users!to!change!any!assumptions!to!generate!custom!results!that!he!or!she!finds!most!useful!or!credible!for!his!or!her!particular!analysis.!!!
The!CLEER!model!was!developed!using!Google!AppEngine!so!that!it!can!be!widely!accessed!using!cloud!services.!The!model! is! designed! for! the! energy! analysis! research!community,! but! it! should! also! prove! useful! those! in! the!business! and! policy! communities! who! wish! to! better!understand! the! environmental! implications! of! shifts! to!cloud! services.! ! ! For! transparency,! the! web! interface!includes! documentation! of! all! modeling! methods! and!equations,! including! any! embedded! assumptions.! ! For!convenience,! default! values! for! key! end! use! system!parameters!are!provided!based!on!credible!data!from!the!literature,!which!will!enable!novice!users!to!generate!reasonable!results!without!inWdepth!background!research.!!The!CLEER!Model!also!contains!the!input! values! associated!with! the! U.S.! case! study! for! business! software! applications! described! below.!!These! input!values!can!be!preloaded! into!the!CLEER!Model! for! further!refinement!and!analysis!by!the!research! community.! ! The! CLEER! Model! and! its! supporting! documentation! can! be! accessed! at:!http://cleermodel.lbl.gov/.!!
U.S. case study
We!chose!three!common!business!software!applications!for!analysis!in!the!CLEER!Model,!and!assessed!the!technical!potential!for!energy!and!emissions!savings!that!might!be!realized!if!these!three!software!applications!were!fully!shifted!to!the!cloud!across!the!U.S!workforce.! !Our!chosen!applications—email,!productivity! software,!and!CRM!software,! represent! some!of! the!most!common!software!applications!used!in!the!workplace.!!As!such,!they!provide!an!example!that!should!be!relevant!to!both!the!research!and!business!communities,!given!their!broad!applicability!and!nationalWscale!significance.! !Productivity!software!is!defined!here!as!bundled!software!that!facilitates!word!processing,!file!sharing,!collaboration,!presentations,! and! data! analysis! tools! such! spreadsheets.! CRM! software! is! used! for! managing!interactions!with!customers!for!sales,!marketing,!technical!support,!and!other!business!functions.!
Additionally,!these!three!software!applications!were!chosen!based!on!the!existence!of!reasonable!public!data!from!past!case!studies,!market!reports,!academic!papers,!and!government!surveys!that!allowed!us!to! estimate! workplace! adoption,! client! device! use,! server! characteristics,! and! other! key! analysis!assumptions.!!Further!details!on!our!analysis!approach!are!described!in!the!next!section.!
Page 10
!
7!!
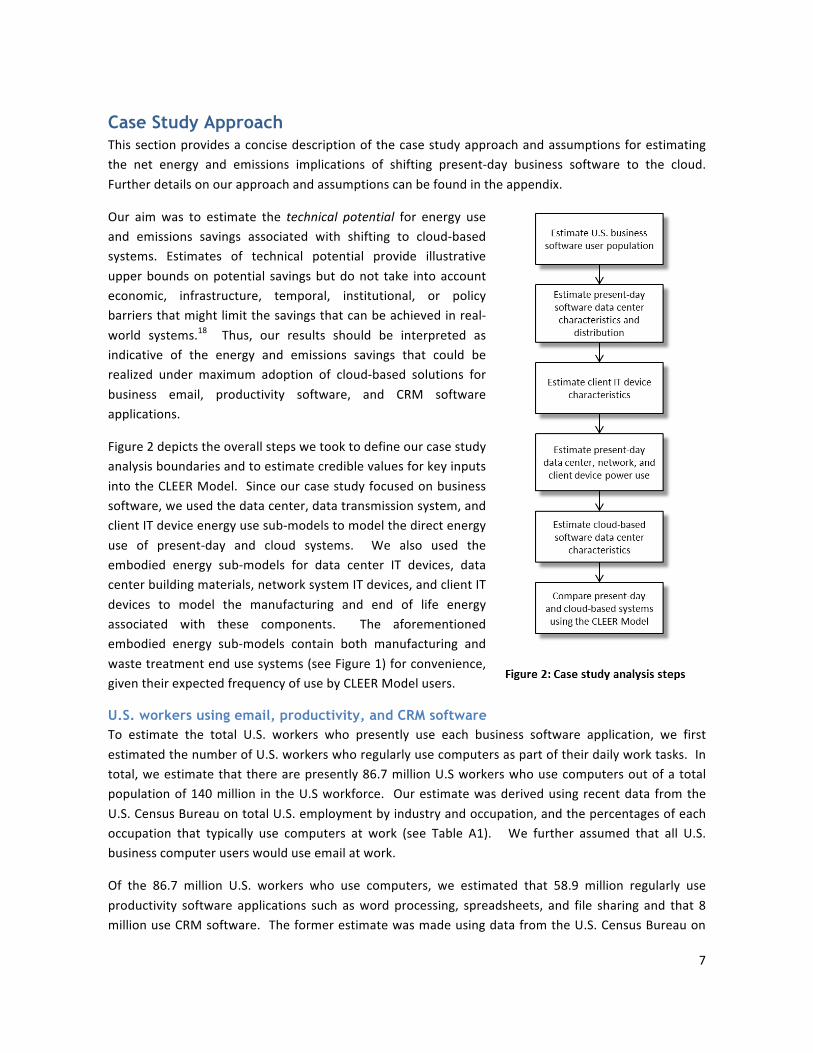
Case Study Approach
This!section!provides!a!concise!description!of!the!case!study!approach!and!assumptions!for!estimating!the! net! energy! and! emissions! implications! of! shifting! presentWday! business! software! to! the! cloud.!!Further!details!on!our!approach!and!assumptions!can!be!found!in!the!appendix.!
Our! aim!was! to! estimate! the! technical) potential! for! energy! use!and! emissions! savings! associated! with! shifting! to! cloudWbased!systems.! Estimates! of! technical! potential! provide! illustrative!upper!bounds!on!potential! savings!but!do!not! take! into!account!economic,! infrastructure,! temporal,! institutional,! or! policy!barriers!that!might!limit!the!savings!that!can!be!achieved!in!realWworld! systems.18! ! Thus,! our! results! should! be! interpreted! as!indicative! of! the! energy! and! emissions! savings! that! could! be!realized! under! maximum! adoption! of! cloudWbased! solutions! for!business! email,! productivity! software,! and! CRM! software!applications.!
Figure!2!depicts!the!overall!steps!we!took!to!define!our!case!study!analysis!boundaries!and!to!estimate!credible!values!for!key!inputs!into!the!CLEER!Model.! !Since!our!case!study!focused!on!business!software,!we!used!the!data!center,!data!transmission!system,!and!client!IT!device!energy!use!subWmodels!to!model!the!direct!energy!use! of! presentWday! and! cloud! systems.! ! We! also! used! the!embodied! energy! subWmodels! for! data! center! IT! devices,! data!center!building!materials,!network!system!IT!devices,!and!client!IT!devices! to! model! the! manufacturing! and! end! of! life! energy!associated! with! these! components.! ! The! aforementioned!embodied! energy! subWmodels! contain! both! manufacturing! and!waste!treatment!end!use!systems!(see!Figure!1)!for!convenience,!given!their!expected!frequency!of!use!by!CLEER!Model!users.!
U.S. workers using email, productivity, and CRM software
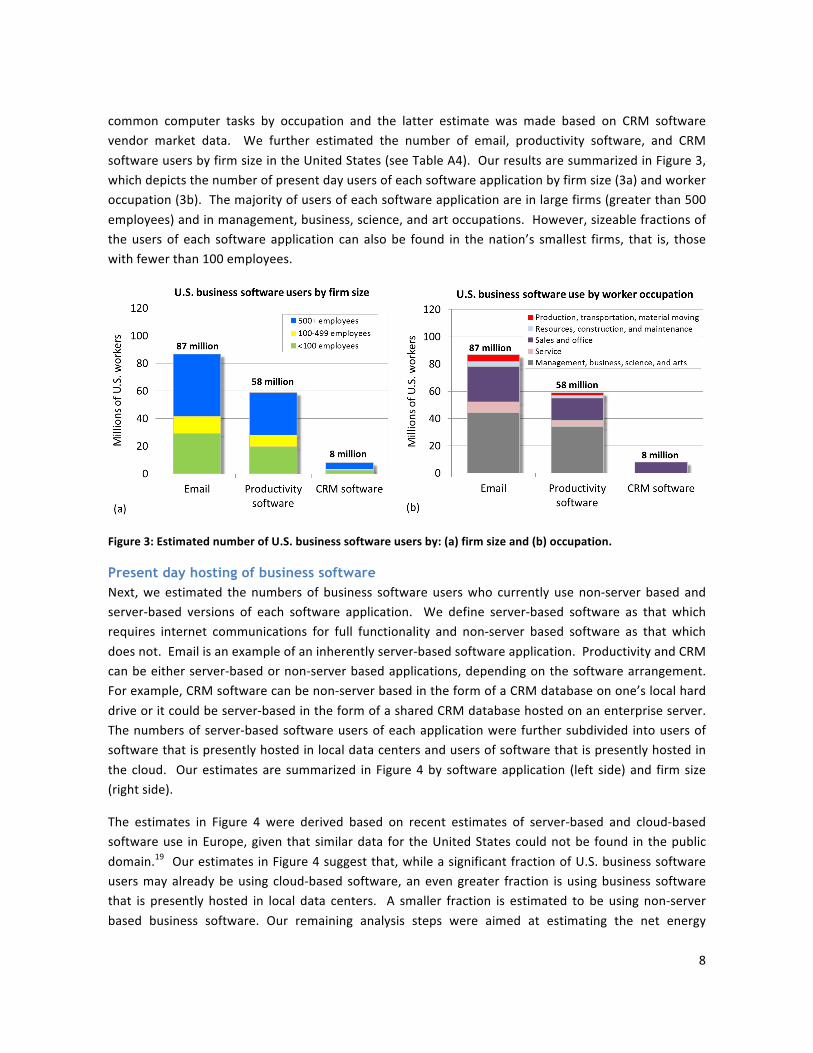
To! estimate! the! total! U.S.! workers! who! presently! use! each! business! software! application,! we! first!estimated!the!number!of!U.S.!workers!who!regularly!use!computers!as!part!of!their!daily!work!tasks.!!In!total,!we!estimate!that!there!are!presently!86.7!million!U.S!workers!who!use!computers!out!of!a!total!population!of!140!million! in! the!U.S!workforce.! !Our!estimate!was!derived!using!recent!data! from!the!U.S.!Census!Bureau!on!total!U.S.!employment!by!industry!and!occupation,!and!the!percentages!of!each!occupation! that! typically! use! computers! at! work! (see! Table! A1).! ! ! We! further! assumed! that! all! U.S.!business!computer!users!would!use!email!at!work.!
Of! the! 86.7! million! U.S.! workers! who! use! computers,! we! estimated! that! 58.9! million! regularly! use!productivity! software! applications! such! as!word! processing,! spreadsheets,! and! file! sharing! and! that! 8!million!use!CRM!software.!!The!former!estimate!was!made!using!data!from!the!U.S.!Census!Bureau!on!
Page 11
!
8!!
common! computer! tasks! by! occupation! and! the! latter! estimate! was! made! based! on! CRM! software!vendor! market! data.! ! We! further! estimated! the! number! of! email,! productivity! software,! and! CRM!software!users!by!firm!size!in!the!United!States!(see!Table!A4).!!Our!results!are!summarized!in!Figure!3,!which!depicts!the!number!of!present!day!users!of!each!software!application!by!firm!size!(3a)!and!worker!occupation!(3b).!!The!majority!of!users!of!each!software!application!are!in!large!firms!(greater!than!500!employees)!and!in!management,!business,!science,!and!art!occupations.!!However,!sizeable!fractions!of!the!users!of! each! software!application! can!also!be! found! in! the!nation’s! smallest! firms,! that! is,! those!with!fewer!than!100!employees.!!!
!
Figure!3:!Estimated!number!of!U.S.!business!software!users!by:!(a)!firm!size!and!(b)!occupation.!
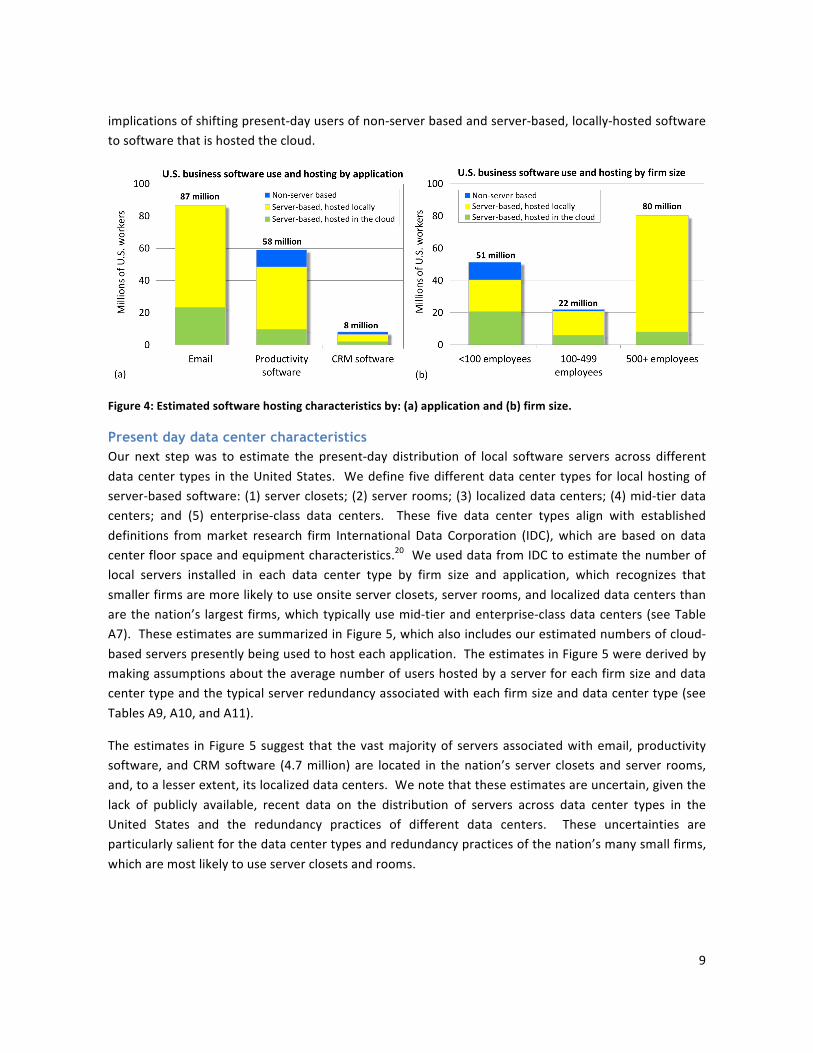
Present day hosting of business software
Next,!we!estimated! the!numbers!of! business! software!users!who! currently!use!nonWserver!based!and!serverWbased! versions! of! each! software! application.! !We! define! serverWbased! software! as! that! which!requires! internet! communications! for! full! functionality! and! nonWserver! based! software! as! that! which!does!not.!!Email!is!an!example!of!an!inherently!serverWbased!software!application.!!Productivity!and!CRM!can!be!either!serverWbased!or!nonWserver!based!applications,!depending!on!the!software!arrangement.!!For!example,!CRM!software!can!be!nonWserver!based!in!the!form!of!a!CRM!database!on!one’s!local!hard!drive!or!it!could!be!serverWbased!in!the!form!of!a!shared!CRM!database!hosted!on!an!enterprise!server.!!!!The!numbers!of!serverWbased!software!users!of!each!application!were!further!subdivided! into!users!of!software!that!is!presently!hosted!in!local!data!centers!and!users!of!software!that!is!presently!hosted!in!the!cloud.! !Our!estimates!are! summarized! in!Figure!4!by! software!application! (left! side)!and! firm!size!(right!side).!!!
The! estimates! in! Figure! 4! were! derived! based! on! recent! estimates! of! serverWbased! and! cloudWbased!software!use! in!Europe,!given! that!similar!data! for! the!United!States!could!not!be! found! in! the!public!domain.19! !Our!estimates!in!Figure!4!suggest!that,!while!a!significant!fraction!of!U.S.!business!software!users!may!already!be!using! cloudWbased! software,! an!even!greater! fraction! is!using!business! software!that! is! presently! hosted! in! local! data! centers.! ! A! smaller! fraction! is! estimated! to! be! using! nonWserver!based! business! software.! Our! remaining! analysis! steps! were! aimed! at! estimating! the! net! energy!
Page 12
!
9!!
implications!of!shifting!presentWday!users!of!nonWserver!based!and!serverWbased,!locallyWhosted!software!to!software!that!is!hosted!the!cloud.!
!
Figure!4:!Estimated!software!hosting!characteristics!by:!(a)!application!and!(b)!firm!size.!
Present day data center characteristics
Our! next! step!was! to! estimate! the! presentWday! distribution! of! local! software! servers! across! different!data!center!types! in!the!United!States.! !We!define!five!different!data!center!types! for! local!hosting!of!serverWbased!software:!(1)!server!closets;!(2)!server!rooms;!(3)! localized!data!centers;!(4)!midWtier!data!centers;! and! (5)! enterpriseWclass! data! centers.! ! These! five! data! center! types! align! with! established!definitions! from!market! research! firm! International! Data! Corporation! (IDC),!which! are! based! on! data!center!floor!space!and!equipment!characteristics.20!!We!used!data!from!IDC!to!estimate!the!number!of!local! servers! installed! in! each! data! center! type! by! firm! size! and! application,! which! recognizes! that!smaller!firms!are!more!likely!to!use!onsite!server!closets,!server!rooms,!and!localized!data!centers!than!are!the!nation’s! largest! firms,!which!typically!use!midWtier!and!enterpriseWclass!data!centers! (see!Table!A7).!!These!estimates!are!summarized!in!Figure!5,!which!also!includes!our!estimated!numbers!of!cloudWbased!servers!presently!being!used!to!host!each!application.!!The!estimates!in!Figure!5!were!derived!by!making!assumptions!about!the!average!number!of!users!hosted!by!a!server!for!each!firm!size!and!data!center!type!and!the!typical!server!redundancy!associated!with!each!firm!size!and!data!center!type!(see!Tables!A9,!A10,!and!A11).!!!
The!estimates! in!Figure!5!suggest! that! the!vast!majority!of! servers!associated!with!email,!productivity!software,! and!CRM!software! (4.7!million)!are! located! in! the!nation’s! server! closets!and! server! rooms,!and,!to!a!lesser!extent,!its!localized!data!centers.!!We!note!that!these!estimates!are!uncertain,!given!the!lack! of! publicly! available,! recent! data! on! the! distribution! of! servers! across! data! center! types! in! the!United! States! and! the! redundancy! practices! of! different! data! centers.! ! These! uncertainties! are!particularly!salient!for!the!data!center!types!and!redundancy!practices!of!the!nation’s!many!small!firms,!which!are!most!likely!to!use!server!closets!and!rooms.!!!
!
Page 13
!
10!!
!
Figure!5:!Estimated!installed!base!of!servers!for!each!business!software!application!by!data!center!type!
As!a!reality!check,!we!considered!that!IDC!and!Gartner!estimate!a!present!installed!base!of!11W12!million!servers!in!the!United!States!and!that!data!center!type!distribution!data!from!Bailey!et!al.!(2006)!suggest!that!roughly!53%!of!this!installed!base!may!be!found!in!server!closets,!server!rooms,!and!localized!data!centers.21,22,23!The!combined!IDC,!Gartner,!and!Bailey!et!al.!data!suggest!a!current!installed!base!of!6.1!million! servers! in!U.S.! server! closets,! server! rooms,!and! localized!data! centers.! !Our!estimate! that!4.7!million!of! these!6.1!million! servers!are!dedicated! to! local!hosting!of!email,!productivity! software,!and!CRM!software!seems!plausible!given!that:!(1)!small!firms!account!for!the!majority!of!these!data!center!space! types;! and! (2)! these! three!business! software!applications! likely! represent! the!dominant!uses!of!local! servers! for! small! firms.! ! However,! these! estimates! should! be! revisited! in! future! work.! Data!uncertainties!in!these!and!other!case!study!analysis!inputs!are!discussed!further!in!the!results!section.!
Client device characteristics
We! next! estimated! the! numbers! and! types! of! client! IT! devices! that! are! typically! used! for! business!software! access.! ! Figure! 6! summarizes! our! estimates! for! the! numbers! of! desktop! PCs,! notebook! PCs,!smart!phones,!and!tablet!PCs!that!are!used!for!email,!productivity!software,!and!CRM!software!by!U.S.!workers.!!These!estimates!were!derived!based!on!workplace!technology!survey!data!that!characterized!the! frequency!of!business!use!of!each!device!as!well! as! the! frequency!of!use!of!each!device! for!each!software!application!(see!Table!A14).!!We!further!estimated!that!desktop!PCs!would!use!a!wired!internet!connection! (e.g.,! fiber! to! building)! for! serverWbased! software! access,! that! notebook! PCs! would! use! a!wired!connection!70%!of!the!time!and!a!WiWFi!connection!30%!of!the!time,!and!that!smart!phones!and!tablets!would!use!a!WiWFi!connection!33%!of!the!time!and!a!cellular!data!connection!(3G/4G)!67%!of!the!time.! ! Our! estimates! for! smart! phone! and! tablet! network! access! are! based! on! a! recent! study! of! the!wireless!cloud!by!Bell!Labs!and!the!University!of!Melbourne.24!
Page 14
!
11!!
!
Figure!6:!Estimated!numbers!and!types!of!client!IT!devices!used!for!business!software!by!U.S.!workers!
Data center, network, and client device energy use
We!compiled!best!available!estimates!of!power!and!energy!use!for!data!center,!network!transmission,!and!client!IT!devices!from!the!public!literature!and!expert!elicitation;!these!estimates!are!summarized!in!Table!1.!!
We!classify!both!volume!servers!and!midrange!servers,!and!assume!that!all!local!hosting!of!business!software!occurs!on!the!former!and!all!cloud!hosting!of!business!software!occurs!on! the! latter! based! on! industry! data.25! Our! chosen! PUE!values! for! each! data! center! type! are! based! on! previously!published! values! for! each! data! center! type,! expert!elicitation,! and! energy! modeling! results! for! different! data!center!infrastructure!configurations.26!
The!estimates! for! the!energy! intensity!of!different!network!connection! types! are! based! on! average! values! drawn! from!the! literature,! which! included! modeled,! estimated,! and!measured! network! energy! intensity! values.! 27,28,29,30,31,32!Our!estimates!of!the!“on”!mode!power!use!for!business!client!IT!devices!are!drawn!from!U.S.!Department!of!Energy!data!on!appliance!energy!use!and!other!published!sources.33!
Lastly,!we!also! considered! the!embodied!energy!associated!with! each! of! the! devices! listed! in! Table! 1,! as! well! as! the!embodied! energy! of! data! center! building! materials.! ! We!compiled! estimates! from! published! data! in! the! lifeWcycle!assessment!literature!(see!Tables!A21!and!A22).!
Table!1:!Summary!of!power/energy!data!
Data!center!IT!devices!(W/device)! !
!!!!!!!!!Volume!server! 235!
!!!!!!!!!Midrange!server! 450!
!!!!!!!!!External!HDD!spindle! 26!
Data!center!PUE! !
!!!!!!!!!Server!closet! 2.5!
!!!!!!!!!Server!room! 2.1!
!!!!!!!!!Localized! 2!
!!!!!!!!!MidWtier! 2!
!!!!!!!!!EnterpriseWclass!! 1.5!
!!!!!!!!!Cloud! 1.1!
Network!data!transmission!(µJ/bit)! !
!!!!!!!!!Wired! 100!
!!!!!!!!!WiWFi! 100!
!!!!!!!!!Cellular!(3G/4G)! 450!
Client!IT!devices,!ON!mode!(W/device)! !
!!!!!!!!Desktop!PC! 75!
!!!!!!!!Notebook!PC! 25!
!!!!!!!!Flat!panel!display! 42!
!!!!!!!!Smart!phone! 3!
!!!!!!!!Tablet!computer! 5!
Page 15
!
12!!
Shifting to the cloud
Table! 2! summarizes! our! estimates! for! the! required! number! of! cloud! servers! and! external! HDDs! for!hosting!all!email,!productivity,!and!CRM!software!for!the!U.S.!workforce.!!Compared!to!the!present!day,!the!server!count!for!cloudWhosted!software!is!substantially!lower!due!to!the!much!higher!user!per!server!capabilities! of! cloudWbased! servers.! ! Further! details! on! the! assumptions! and! calculations! behind! the!estimates!in!Table!2!are!provided!in!the!appendix.!!
Table!2:!Number!of!data!center!IT!devices:!present!day!software!compared!to!cloud*based!software!
! ! Present!day!software! ! CloudWbased!software!
Software!application!! Volume!
server!Midrange!servers!
External!HDDs!
! Midrange!servers!
External!HDDs!
Email! ! 3,543,000! 12,780! 641,000! ! 47,700! 429,500!
Productivity!software!
! 1,237,000! 5,240! 306,000! ! 32,400! 291,900!
CRM!software! ! 68,500! 1,010! 32,800! ! 4,390! 39,500!
Findings
Case study results
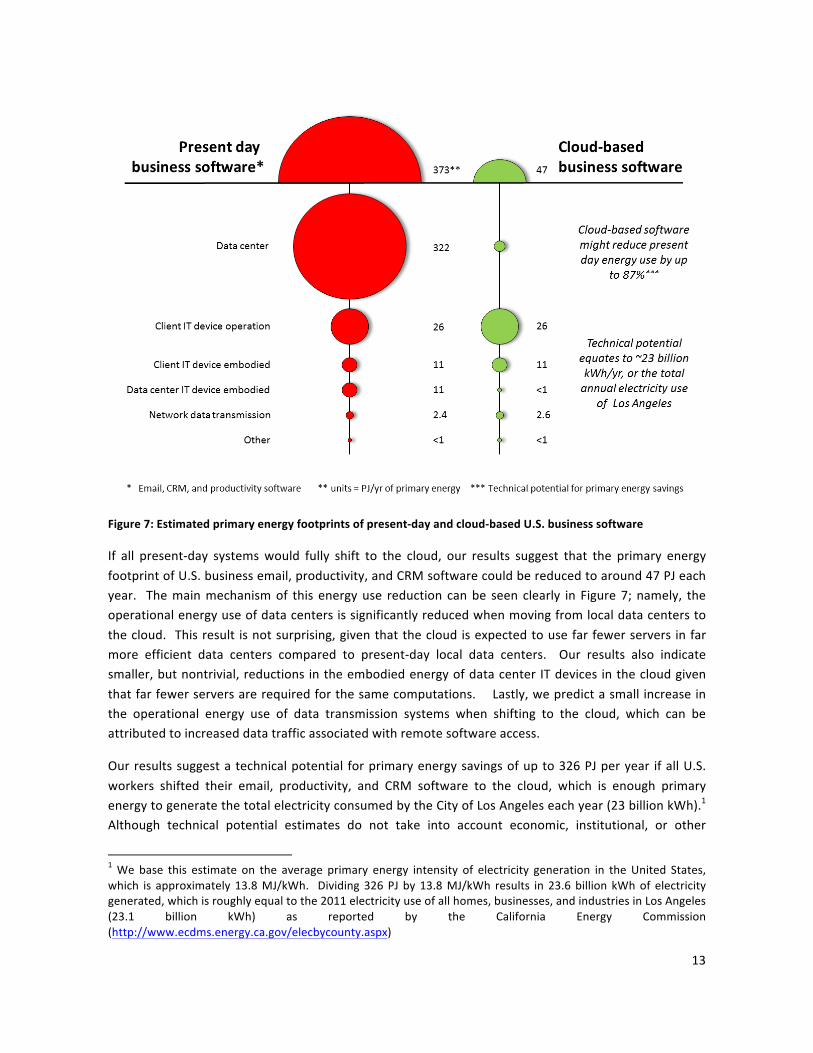
The! results! of! our! case! study! analysis! are! summarized! graphically! in! Figure! 7! and! in! greater! detail! in!Table!3.!!We!estimated!that!presentWday!systems!for!business!email,!productivity,!and!CRM!software!in!the!United!States!require!268,!98,!and!7!Petajoules!(PJ)!of!primary!energy!each!year,!respectively,!when!the!direct!energy!use!and!embodied!energy!of!all!system!components!are!considered.! !Combined,!the!presentWday!primary!energy!footprints!of!these!three!business!software!applications!add!up!to!as!much!as! 373! PJ! per! year.! ! In! reality,! there!may! be! some!overlap! in! the! energy! footprints! of! each! software!application! if! presentWday! data! centers! use! the! same! redundant! server! to! back! up! more! than! one!software!application.!Thus,!our!combined!estimate!of!373!PJ!per!year!should!be!interpreted!as!an!upper!bound.!!!
The!bubbles! in!Figure!7!shed!light!on!how!each!component!of!presentWday!systems!contributes!to!this!energy!footprint.!!Our!estimates!suggest!that!data!center!operations!account!for!the!vast!majority!(86%)!of!the!primary!energy!footprint!of!presentWday!systems,!followed!by!the!operational!energy!use!of!client!IT!devices.!!Also!notable!is!that!the!embodied!energy!associated!with!data!center!and!client!IT!devices!is!non!trivial,!which!reinforces!the!need!for!consideration!of!the!embodied!energy!of!IT!devices!in!analyses!of!digital!services!moving!forward.34!Conversely,!the!embodied!energy!of!data!center!building!materials!makes!a!negligible!contribution!to!the!overall!primary!energy!footprint.!
Page 16
!
13!!
!
Figure!7:!Estimated!primary!energy!footprints!of!present*day!and!cloud*based!U.S.!business!software!!
If! all! presentWday! systems!would! fully! shift! to! the! cloud,! our! results! suggest! that! the! primary! energy!footprint!of!U.S.!business!email,!productivity,!and!CRM!software!could!be!reduced!to!around!47!PJ!each!year.! ! The!main!mechanism!of! this! energy!use! reduction! can!be! seen! clearly! in! Figure!7;! namely,! the!operational!energy!use!of!data!centers!is!significantly!reduced!when!moving!from!local!data!centers!to!the!cloud.! !This!result! is!not!surprising,!given!that!the!cloud!is!expected!to!use!far!fewer!servers! in!far!more! efficient! data! centers! compared! to! presentWday! local! data! centers.! ! Our! results! also! indicate!smaller,!but!nontrivial,!reductions! in!the!embodied!energy!of!data!center! IT!devices! in!the!cloud!given!that!far!fewer!servers!are!required!for!the!same!computations.!! ! !Lastly,!we!predict!a!small! increase!in!the! operational! energy! use! of! data! transmission! systems! when! shifting! to! the! cloud,! which! can! be!attributed!to!increased!data!traffic!associated!with!remote!software!access.!!
Our!results!suggest!a!technical!potential! for!primary!energy!savings!of!up!to!326!PJ!per!year! if!all!U.S.!workers! shifted! their! email,! productivity,! and! CRM! software! to! the! cloud,! which! is! enough! primary!energy!to!generate!the!total!electricity!consumed!by!the!City!of!Los!Angeles!each!year!(23!billion!kWh).1!!Although! technical! potential! estimates! do! not! take! into! account! economic,! institutional,! or! other!
!!!!!!!!!!!!!!!!!!!!!!!!!!!!!!!!!!!!!!!!!!!!!!!!!!!!!!!!!!!!!1!We! base! this! estimate! on! the! average! primary! energy! intensity! of! electricity! generation! in! the!United! States,!which! is! approximately! 13.8!MJ/kWh.! !Dividing!326!PJ!by!13.8!MJ/kWh! results! in! 23.6!billion! kWh!of! electricity!generated,!which!is!roughly!equal!to!the!2011!electricity!use!of!all!homes,!businesses,!and!industries!in!Los!Angeles!(23.1! billion! kWh)! as! reported! by! the! California! Energy! Commission!(http://www.ecdms.energy.ca.gov/elecbycounty.aspx)!
Page 17
!
14!!
barriers! that! might! limit! the! realization! of! energy! savings! in! practice,! our! results! suggest! that! the!nationalWscale!potential!for!primary!energy!savings!through!shifts!to!cloudWbased!software!are! likely!to!be!substantial!even!at!less!than!full!market!adoption.!
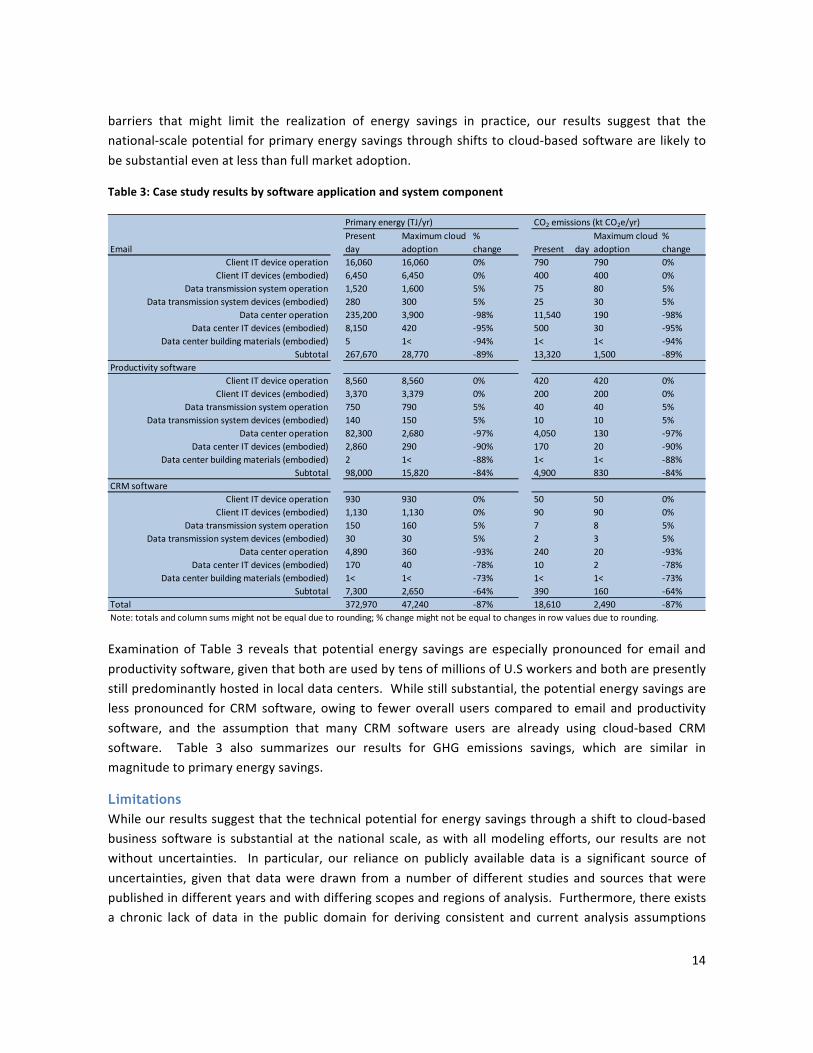
Table!3:!Case!study!results!by!software!application!and!system!component!
!
Examination!of! Table!3! reveals! that!potential! energy! savings! are!especially!pronounced! for! email! and!productivity!software,!given!that!both!are!used!by!tens!of!millions!of!U.S!workers!and!both!are!presently!still!predominantly!hosted!in!local!data!centers.!!While!still!substantial,!the!potential!energy!savings!are!less! pronounced! for! CRM! software,! owing! to! fewer!overall! users! compared! to! email! and!productivity!software,! and! the! assumption! that! many! CRM! software! users! are! already! using! cloudWbased! CRM!software.! ! Table! 3! also! summarizes! our! results! for! GHG! emissions! savings,! which! are! similar! in!magnitude!to!primary!energy!savings.!
Limitations
While!our!results!suggest!that!the!technical!potential!for!energy!savings!through!a!shift!to!cloudWbased!business! software! is! substantial! at! the!national! scale,! as!with!all!modeling!efforts,! our! results! are!not!without! uncertainties.! ! In! particular,! our! reliance! on! publicly! available! data! is! a! significant! source! of!uncertainties,! given! that! data!were! drawn! from!a! number! of! different! studies! and! sources! that!were!published!in!different!years!and!with!differing!scopes!and!regions!of!analysis.!!Furthermore,!there!exists!a! chronic! lack! of! data! in! the! public! domain! for! deriving! consistent! and! current! analysis! assumptions!
Primary'energy'(TJ/yr) CO2'emissions'(kt'CO2e/yr)
Email
Present'''''
day
Maximum'cloud'
adoption
%'''''
change Present'''''day
Maximum'cloud'
adoption
%'''''
change
Client'IT'device'operation 16,060 16,060 0% 790 790 0%
Client'IT'devices'(embodied) 6,450 6,450 0% 400 400 0%
Data'transmission'system'operation 1,520 1,600 5% 75 80 5%
Data'transmission'system'devices'(embodied) 280 300 5% 25 30 5%
Data'center'operation 235,200 3,900 O98% 11,540 190 O98%
Data'center'IT'devices'(embodied) 8,150 420 O95% 500 30 O95%
Data'center'building'materials'(embodied) 5 1< O94% 1< 1< O94%
Subtotal 267,670 28,770 O89% 13,320 1,500 O89%
Productivity'software
Client'IT'device'operation 8,560 8,560 0% 420 420 0%
Client'IT'devices'(embodied) 3,370 3,379 0% 200 200 0%
Data'transmission'system'operation 750 790 5% 40 40 5%
Data'transmission'system'devices'(embodied) 140 150 5% 10 10 5%
Data'center'operation 82,300 2,680 O97% 4,050 130 O97%
Data'center'IT'devices'(embodied) 2,860 290 O90% 170 20 O90%
Data'center'building'materials'(embodied) 2 1< O88% 1< 1< O88%
Subtotal 98,000 15,820 O84% 4,900 830 O84%
CRM'software
Client'IT'device'operation 930 930 0% 50 50 0%
Client'IT'devices'(embodied) 1,130 1,130 0% 90 90 0%
Data'transmission'system'operation 150 160 5% 7 8 5%
Data'transmission'system'devices'(embodied) 30 30 5% 2 3 5%
Data'center'operation 4,890 360 O93% 240 20 O93%
Data'center'IT'devices'(embodied) 170 40 O78% 10 2 O78%
Data'center'building'materials'(embodied) 1< 1< O73% 1< 1< O73%
Subtotal 7,300 2,650 O64% 390 160 O64%
Total 372,970 47,240 O87% 18,610 2,490 O87%
Note:'totals'and'column'sums'might'not'be'equal'due'to'rounding;'%'change'might'not'be'equal'to'changes'in'row'values'due'to'rounding.
Page 18
!
15!!
related! to! the! installed! base! of! servers,! the! use! of! different! data! center! types! by! firms! of! different!industries!and!sizes,!the!use!of!business!software!and!client!devices,!and!the!efficiency!and!redundancy!practices!of!data!center!operators.!!!
However,!a!primary!goal!of!the!CLEER!Model!and!our!case!study!is!to!highlight!the!need!for!better!and!more!transparent!public!use!data!moving!forward,!and!to!provide!a!userWfriendly!platform!for!utilizing!the!best!data!as!they!emerge!over!time.!!In!support!of!that!goal,!all!of!the!input!values!used!in!this!case!study!can!be!preloaded!into!the!CLEER!Model!for!scrutiny!and!refinement!by!the!research!community.!!All!input!values!and!data!sources!are!further!summarized!in!the!appendix!of!this!white!paper.!!!
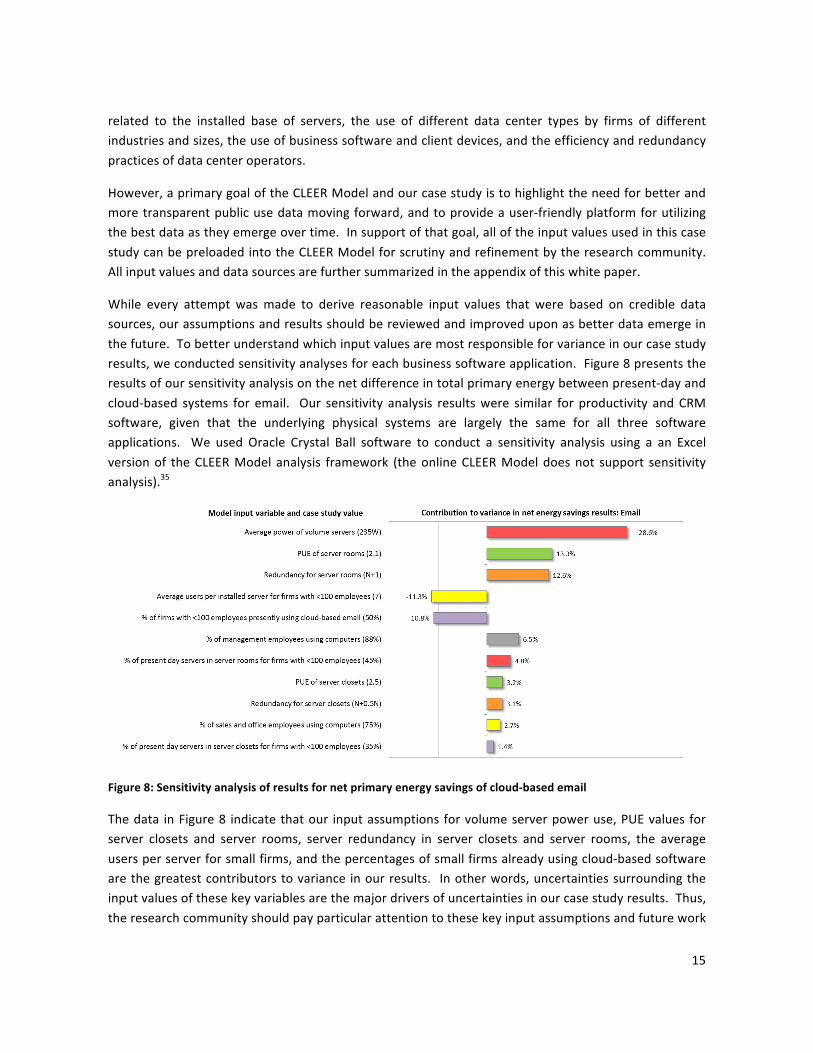
While! every! attempt! was!made! to! derive! reasonable! input! values! that! were! based! on! credible! data!sources,!our!assumptions!and!results!should!be!reviewed!and!improved!upon!as!better!data!emerge!in!the!future.!!To!better!understand!which!input!values!are!most!responsible!for!variance!in!our!case!study!results,!we!conducted!sensitivity!analyses!for!each!business!software!application.!!Figure!8!presents!the!results!of!our!sensitivity!analysis!on!the!net!difference!in!total!primary!energy!between!presentWday!and!cloudWbased! systems! for! email.! !Our! sensitivity! analysis! results!were! similar! for! productivity! and!CRM!software,! given! that! the! underlying! physical! systems! are! largely! the! same! for! all! three! software!applications.! !We! used! Oracle! Crystal! Ball! software! to! conduct! a! sensitivity! analysis! using! a! an! Excel!version!of! the!CLEER!Model! analysis! framework! (the!online!CLEER!Model!does!not! support! sensitivity!analysis).35!
!
Figure!8:!Sensitivity!analysis!of!results!for!net!primary!energy!savings!of!cloud*based!email!
The!data! in!Figure!8! indicate!that!our! input!assumptions! for!volume!server!power!use,!PUE!values! for!server! closets! and! server! rooms,! server! redundancy! in! server! closets! and! server! rooms,! the! average!users!per!server!for!small!firms,!and!the!percentages!of!small!firms!already!using!cloudWbased!software!are!the!greatest!contributors!to!variance! in!our!results.! ! In!other!words,!uncertainties!surrounding!the!input!values!of!these!key!variables!are!the!major!drivers!of!uncertainties!in!our!case!study!results.!!Thus,!the!research!community!should!pay!particular!attention!to!these!key!input!assumptions!and!future!work!
Page 19
!
16!!
should! focus! on! compiling! or! deriving! better! data! for! these! input! values! to! improve! the! accuracy! of!similar!analyses!moving!forward.!!!
It! also! bears! repeating! that! our! results! are! limited! to! estimates! of! the! technical! potential! for! energy!savings,!and!that!the!actual!savings!realized!may!be!limited!by!economic,! institutional,!policy,!or!other!barriers!in!practice.!!Furthermore,!our!results!represent!a!snapshot!of!today’s!technologies!and!business!practices,!but!these!technologies!and!practices!can!change!rapidly!for!both!cloudWbased!and!nonWcloud!based! software! systems.! ! However,! a! primary! benefit! of! the! CLEER!Model! is! that! it! allows! for! easy!update!of!input!values!over!time!to!reflect!technological!and!behavioral!change.!
Conclusions
This!report!introduces!the!CLEER!Model!as!the!first!openWaccess,!fully!transparent!model!for!estimating!the!net!energy!use!and!emissions!of!data!center!services!across!all!major!societal!end!uses!of!energy.!The!case!study!results!presented!here!suggest!that!a!shift!from!presentWday!systems!for!business!email,!productivity,!and!CRM!software!to!cloudWbased!systems!could!save!substantial!amounts!of!energy!if!fully!implemented!across!the!U.S.!workforce.! !Potential!energy!savings!could!be!as!high!as!326!PJ!per!year,!which!is!enough!primary!energy!to!meet!the!annual!electricity!needs!of!Los!Angeles,!the!nation’s!second!largest!city.!!Potential!savings!are!especially!pronounced!for!email!and!productivity!software,!which!are!used!by!a!large!number!of!employees!and!currently!rely!on!servers!that!are!widely!dispersed!in!mostly!smaller! data! centers! where! servers! are! underutilized.! ! Uncertainties! surrounding! input! data! and!ultimate! market! adoption! preclude! a! precise! estimate! of! the! technical! potential! for! energy! savings!associated! with! the! adoption! of! cloudWbased! software! in! the! United! States.! ! However,! these! energy!savings! are! likely! to! be! substantial! on! a! national! scale! despite! these! uncertainties! given! that! we!understand! the! driving! mechanism! behind! the! energy! savings! well:! namely,! the! shift! from! many!inefficient!local!data!centers!to!far!fewer!and!more!efficient!cloud!data!centers.!!!
The!case!study!also!demonstrated!the!function!and!value!of!the!CLEER!Model!as!a!comprehensive!and!transparent!resource!for!the!research!community.! !The!analytical!structure!and!data! inputs!have!been!made!fully!transparent,!allowing!users!to!evaluate!the!CLEER!Model’s!underlying!analytics,!parameters,!and! assumptions.! ! All! of! the! input! values! associated! with! the! case! study! presented! here! can! be!preloaded!into!the!CLEER!Model!for!review!and!improvement!by!other!researchers,!which!can!hopefully!enable!further!scientific!progress!on!understanding!the!net!energy!implications!of!cloudWbased!software!services.!!The!inclusion!of!subWmodels!for!all!important!societal!end!uses!of!energy!allow!for!application!of!the!CLEER!Model!to!more!complex!life!cycle!studies!of!cloud!systems,!such!as!digital!versus!physical!media!provision.!!Most!importantly,!the!CLEER!Model!enables!users!to!change!any!assumptions!or!input!values!to!generate!custom!results!that!he!or!she!finds!most!useful!or!credible!for!his!or!her!particular!analysis,!and!to!account!for!technology!and!behavioral!change!over!time.!!!
Our!hope! is! that,! together,! the!CLEER!Model!and!case!study!presented!here!can!provide! foundational!resources! from!which!other! researchers!and!decision!makers!who! seek! to!understand! the!net!energy!and!emissions!implications!of!cloud!services!can!build!more!comprehensive!and!impactful!analyses.!!We!further!hope!that!these!resources!can!enable!and!encourage!more!research!activity!and!interest,!as!well!as!demand!and!impetus!for!better!public!use!data!that!can!lead!to!more!accurate!and!useful!analyses.!
Page 20
!
17!!
Appendix: Case Study Approach and Assumptions
This! appendix! describes! the! case! study! approach! with! documentation! of! the! data! sources! and!assumptions!associated!with!each!input!value!in!the!CLEER!Model.!!The!input!values!presented!here!can!also! be! preloaded! into! the! CLEER!Model! for! further! analysis! by! selecting! the! appropriate! application!type!(email,!productivity,!or!CRM!software)!from!the!dropdown!menu!on!the!CLEER!Model!homepage.!!Further!details!on!the!mathematical!framework!of!the!CLEER!Model!can!be!found!in!the!online!technical!documentation.!
U.S. workers using email, productivity, and CRM software
We!defined!the!population!of!U.S.!workers!using!each!software!application!by!starting!with!employment!data! from! the!United! States! Census! Bureau.! Table! A1! summarizes! total! U.S.! employment! in! 2011! by!industry!and!type!of!occupation.36! !We!considered!occupation!the!best!proxy! for!computer!use,!given!that!the!nature!of!one’s!job!is!typically!more!indicative!of!daily!workplace!tasks!(including!computer!use)!than!one’s!industry!of!employment.!For!each!occupation,!we!multiplied!the!total!number!of!workers!by!the!percent!that!uses!computers!at!work.!!The!percent!of!workers!using!computers!for!each!occupation!was!estimated!based!on!2003!data!from!the!U.S.!Census!Bureau!on!the!computer!tasks!associated!with!each!occupation! (2003! is! the! latest! year! for!which! such!data! are! available).37! !We!extrapolated! these!2003!data! to! the!present!day!based!on! the!historical! growth! in! computer!use!among!all!U.S.!workers!(from!56%!of!workers! in! 2003! to! 62%!of!workers! in! 2010).38!Our! results! are! shown!at! the!bottom!of!Table!A1.!!We!estimated!that!there!are!86.8!million!computerWbased!workers!in!the!United!States!as!of!2011,!with!the!largest!numbers!in!management,!business,!science,!arts,!sales,!and!office!occupations.!!!
Next,!we!estimated!the!number!of!computerWbased!workers!by!firm!size!in!Table!A2.! !These!estimates!were!made!using!U.S.!Census!Bureau!data!on!employment!by!firm!size!for!each!industry!listed!in!Table!A1! along! with! the! percentages! of! workers! using! computers! by! occupation! for! each! industry.39!Classification!of!computerWbased!workers!by! firm!size! is! important!because!data!center!characteristics!can!vary!greatly!by!firm!size,!as!we!discuss!in!subsequent!sections.! !For!example,!small!firms!are!more!likely!to!host!business!applications!in!server!closets!and!server!rooms!while!large!firms!are!more!likely!to!host!business!applications!in!larger,!more!efficient!midWtier!and!enterpriseWclass!data!centers.40!
We! then! estimated! the! number! of! computerWbased! workers! who! use! email,! productivity,! and! CRM!software!by!firm!size.!Total!users!of!email!and!productivity!software!were!estimated!based!on!the!data!in!Table!A3,!which!were!derived!by!extrapolating!2003!data!on!the!computer!tasks!of!each!occupation!to!the! present! day! using! the! approach! described! above.41! ! We! further! assumed! that! all! present! day!computerWbased! workers! use! email.! ! No! publicly! available! data! could! be! found! on! the! extent! of!productivity! software! use! in! the!U.S.!workforce.! ! Therefore,!we! used! the! percent! of! computerWbased!workers! using!word! processing! software! as! a! proxy! for! the! percent! using! productivity! software.! !We!estimated!the!number!of!present!day!users!of!CRM!software!in!the!U.S.!workforce!at!roughly!8!million.!!!This! estimate!was! based! on! published! data! on! the! number! of! global! licenses! for! CRM! software! from!major! vendors! (Oracle,! Salesforce.com,! SAP,! Microsoft! Dynamics,! and! others)! and! the! reported! U.S.!share!of!the!global!CRM!software!market!(58%).42,43,44,45!We!assigned!all!CRM!software!use!to!the!“sales!and!office”!occupation!category.!
Page 21
!
18!!
Table! A4! summarizes! our! estimates! for! the! number! of! computerWbased! U.S.! workers! using! email,!productivity,!and!CRM!software!by!firm!size!based!on!the!data!in!Tables!A2!and!A3.!
Present day hosting of email, productivity, and CRM software
We!define!present!day!software!applications!as!either!server!based!or!nonWserver!based,!where!serverWbased!software! requires! internet!communications! for! full! functionality!and!nonWserver!based!software!does!not.!!Email!is!an!example!of!an!inherently!serverWbased!software!application.!!Productivity!and!CRM!can!be!either!serverWbased!or!nonWserver!based!applications,!depending!on!the!software!arrangement.!!For!example,!CRM!software!can!be!nonWserver!based!in!the!form!of!database!on!one’s!local!hard!drive!or!it!could!be!serverWbased!in!the!form!of!a!shared!corporate!database!hosted!on!an!enterprise!server.!!!!!
Table!A5! summarizes! our! estimates! of! the!percent! of! each! application! that! is! presently! comprised!of!serverWbased! software!by! firm! size.! !No!publiclyWavailable!data! could!be! found!on! the!penetrations!of!serverWbased!applications! for!email,!productivity! software,!and!CRM!software! in!U.S.! firms.!Therefore,!we!derived!the!estimates!in!Table!A5!from!data!published!for!Europe!in!Thomond!et!al.!(2011).46!!
ServerWbased!software!can!either!be!hosted! in!cloud!or!nonWcloud!data!centers.! !Table!A6!summarizes!our!estimates!of! the!percent!of! serverWbased!software! for!each!application! that! is!presently!hosted! in!cloud!data!centers,!which!were!also!based!on!estimates!published!for!Europe!in!Thomond!et!al.!(2011).!!Together,! Tables!A5!and!A6!define! the!present!day! share!of! cloudWbased! software!by! application!and!firm!size.!!For!example,!we!estimate!that!50%!of!firms!with!fewer!than!100!employees!use!serverWbased!CRM! software! and! that! 50%! of! this! serverWbased! CRM! software! is! presently! hosted! in! the! cloud.!!Consequently,! our! estimates! suggest! that! 25%! of! firms! with! fewer! than! 100! employees! already! use!cloudWbased! CRM! software.! ! Conversely,! the! remaining! 75%!of! these! firms! could! technically! still! shift!their!CRM!software!to!the!cloud.!
Page 22
!
19!! Table&A1:&&Com
puter1based&workers&by&occupation&in&the&U
nited&States&
!U.S.!em
ployment!by!occupation!(thousands)!
Industry!Total!
Managem
ent,!business,!science,!and!arts!!
Service!!Sales!and!office!!
Natural!
resources,!construction,!and!m
aintenance!!
Production,!transportation,!and!m
aterial!moving!!
Agriculture,!forestry,!fishing!and!hunting,!and!m
ining!2,720!
879!98!
163!1,317!
261!
Construction!8,564!
1,387!60!
540!6,183!
385!
Manufacturing!
14,666!4,224!
264!2,039!
953!7,186!
Wholesale!trade!
3,895!717!
55!2,049!
195!884!
Retail!trade!16,336!
1,764!735!
11,435!653!
1,732!
Transportation!and!warehousing,!and!utilities!
6,988!992!
182!1,761!
664!3,382!
Information!
2,951!1,537!
83!912!
301!118!
Finance!and!insurance,!real!estate!and!rental!and!leasing!9,234!
4,146!379!
4,368!203!
139!
Professional,!scientific,!managem
ent,!administrative!and!w
aste!managem
ent!services!15,080!
7,977!2,865!
2,956!407!
875!
Educational!services,!and!health!care!and!social!assistance!32,601!
20,180!7,433!
4,043!293!
652!
Arts,!
entertainment,!
recreation,!accom
modation!
and!food!
services!13,210!
2,246!8,666!
1,731!145!
410!
Other!services,!except!public!adm
inistration!7,057!
1,545!2,682!
1,002!1,094!
734!
Public!administration!
7,099!2,925!
2,229!1,455!
305!185!
Total&workers&&&&&&140,400&
50,520&25,729&
34,451&12,714&
16,942&
Percent!of!workers!using!com
puters!!!
88%!
31%!
75%!
29%!
29%!
Total&workers&using&com
puters&&&&&&86,775&44,311&
8,002&25,871&
3,714&4,878&
Note:!totals,!colum
n!sums,!and!row
!sums!m
ight!not!be!equal!due!to!rounding!
Page 23
!
20!!
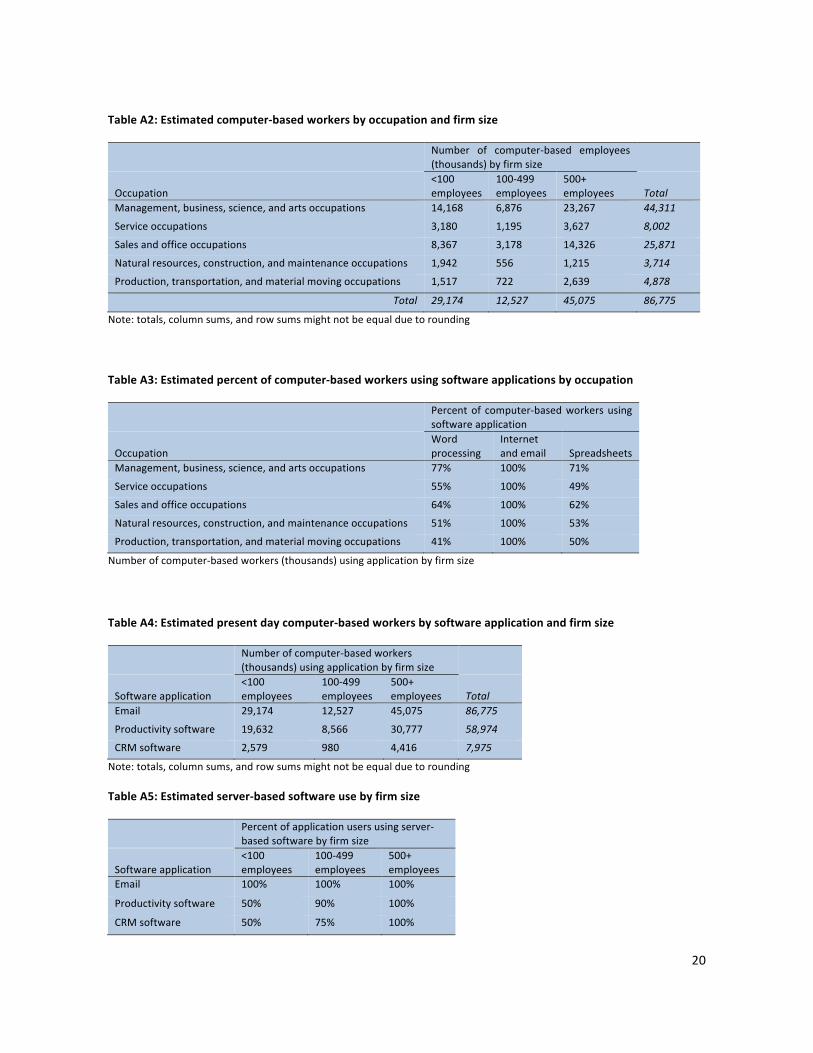
Table&A2:&Estimated&computer5based&workers&by&occupation&and&firm&size&
!Number! of! computer/based! employees!(thousands)!by!firm!size! !
Occupation!<100!employees!
100/499!employees!
500+!employees! Total!
Management,!business,!science,!and!arts!occupations! 14,168! 6,876! 23,267! 44,311!
Service!occupations! 3,180! 1,195! 3,627! 8,002!
Sales!and!office!occupations! 8,367! 3,178! 14,326! 25,871!
Natural!resources,!construction,!and!maintenance!occupations! 1,942! 556! 1,215! 3,714!
Production,!transportation,!and!material!moving!occupations! 1,517! 722! 2,639! 4,878!
Total! 29,174! 12,527! 45,075! 86,775!
Note:!totals,!column!sums,!and!row!sums!might!not!be!equal!due!to!rounding!
&
Table&A3:&Estimated&percent&of&computer5based&workers&using&software&applications&by&occupation&
!Percent!of! computer/based!workers!using!software!application!
Occupation!Word!processing!
Internet!and!email! Spreadsheets!
Management,!business,!science,!and!arts!occupations! 77%! 100%! 71%!
Service!occupations! 55%! 100%! 49%!
Sales!and!office!occupations! 64%! 100%! 62%!
Natural!resources,!construction,!and!maintenance!occupations! 51%! 100%! 53%!
Production,!transportation,!and!material!moving!occupations! 41%! 100%! 50%!
Number!of!computer/based!workers!(thousands)!using!application!by!firm!size!
!
Table&A4:&Estimated&present&day&computer5based&workers&by&software&application&and&firm&size&
!Number!of!computer/based!workers!(thousands)!using!application!by!firm!size! !
Software!application!<100!employees!
100/499!employees!
500+!employees! Total!
Email! 29,174! 12,527! 45,075! 86,775!
Productivity!software! 19,632! 8,566! 30,777! 58,974!
CRM!software! 2,579! 980! 4,416! 7,975!
Note:!totals,!column!sums,!and!row!sums!might!not!be!equal!due!to!rounding!
Table&A5:&Estimated&server5based&software&use&by&firm&size&
!Percent!of!application!users!using!server/based!software!by!firm!size!
Software!application!<100!employees!
100/499!employees!
500+!employees!
Email! 100%! 100%! 100%!
Productivity!software! 50%! 90%! 100%!
CRM!software! 50%! 75%! 100%!
Page 24
!
21!!
Table&A6:&Estimated&cloud5based&software&use&by&firm&size&
!Percent!of!server/based!software!use!that!is!presently!hosted!in!the!cloud!by!firm!size!
Software!application!<100!employees!
100/499!employees!
500+!employees!
Email! 50%! 33%! 10%!
Productivity!software! 50%! 20%! 10%!
CRM!software! 80%! 50%! 10%!
!
Present day data center characteristics
We!define!six!different!data!center!types!for!hosting!server/based!software:!(1)!server!closets;!(2)!server!rooms;! (3)! localized! data! centers;! (4)!mid/tier! data! centers;! (5)! enterprise/class! data! centers;! and! (6)!cloud! data! centers.! The! first! five! data! center! types! align! with! established! definitions! from! market!research! firm! International! Data! Corporation! (IDC),! which! are! based! on! data! center! floor! space! and!equipment!characteristics.!Further!details!on!these!space!type!definitions!can!be!found!in!Masanet!et!al.!(2011)! or! Brown! et! al.! (2007).47,48! ! We! define! the! cloud! data! center! type! as! large,! multi/customer!facilities!with!highly!virtualized!servers,!scalable!computing,!and!onsite!hosted!software.!
Clearly,!all!server/based!software!requires!servers.!Our!estimates!for!how!the!servers!presently!hosting!non/cloud!software!are!distributed!across!different!data!center!types!are!summarized!in!Table!A7.!!The!estimates! in!Table!A7!were!derived!based!on! information! in!Bailey!et!al.! (2006)!and!Hardcastle!(2012)!describing!the!distributions!of!servers!across!U.S.!data!center!types!and!the!data!center!types!used!by!different!sized!U.S.!firms.49,50!!!
Table&A7:&Estimated&distribution&of&non5cloud&servers&by&data¢er&type&and&firm&size&&&
! Percent! of! non/cloud! servers! located! in!each!data!center!type!by!firm!size!
Data!center!type!<100!employees!
100/499!employees!
500+!employees!
Server!closet! 35%! 4%! 2%!
Server!room! 45%! 9%! 4%!
Localized! 10%! 38%! 8%!
Mid/tier! ! 21%! 23%!
Enterprise/class! 10%! 27%! 63%!
!
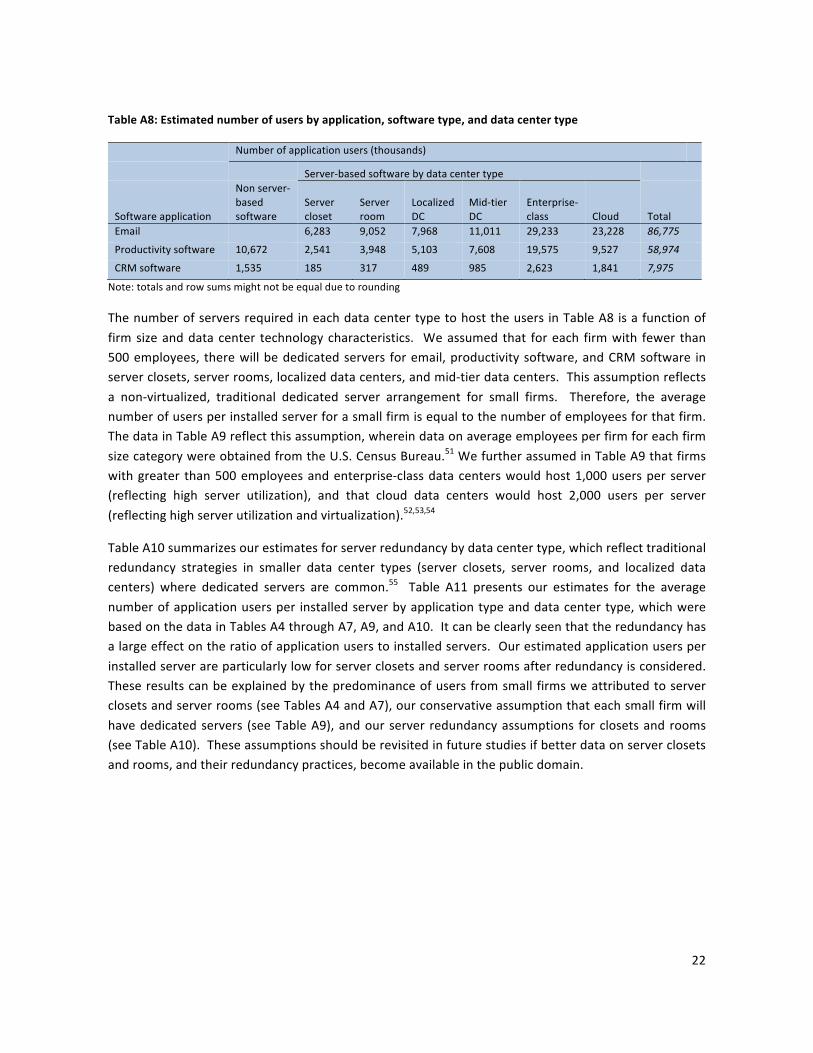
Based!on!the!data!in!Tables!A4!through!A7,!we!derived!the!estimates!presented!in!Table!A8.!!The!data!in!Table! A8! summarize! the! number! of! users! of! each! application! by! software! type! (non/server! based! or!server/based)! and! data! center! type! (for! server/based! software).! ! These! data! represent! our! best!estimates! of! how! server/based! email,! productivity,! and! CRM! software! is! presently! hosted! for! U.S.!computer/based!workers!using!publicly!available!information.!!
! &
Page 25
!
22!!
Table&A8:&Estimated&number&of&users&by&application,&software&type,&and&data¢er&type&
! Number!of!application!users!(thousands)!! !
! ! Server/based!software!by!data!center!type! !
Software!application!
Non!server/based!software!!
Server!closet!
Server!room!
Localized!DC!
Mid/tier!DC!
Enterprise/class! Cloud! Total!
Email! !!!!!!!!!!!!!!!!!!!!!!!!!!!6,283! 9,052! 7,968! 11,011! 29,233! 23,228! 86,775!
Productivity!software! 10,672! 2,541! 3,948! 5,103! 7,608! 19,575! 9,527! 58,974!
CRM!software! 1,535! 185! 317! 489! 985! 2,623! 1,841! 7,975!
Note:!totals!and!row!sums!might!not!be!equal!due!to!rounding!
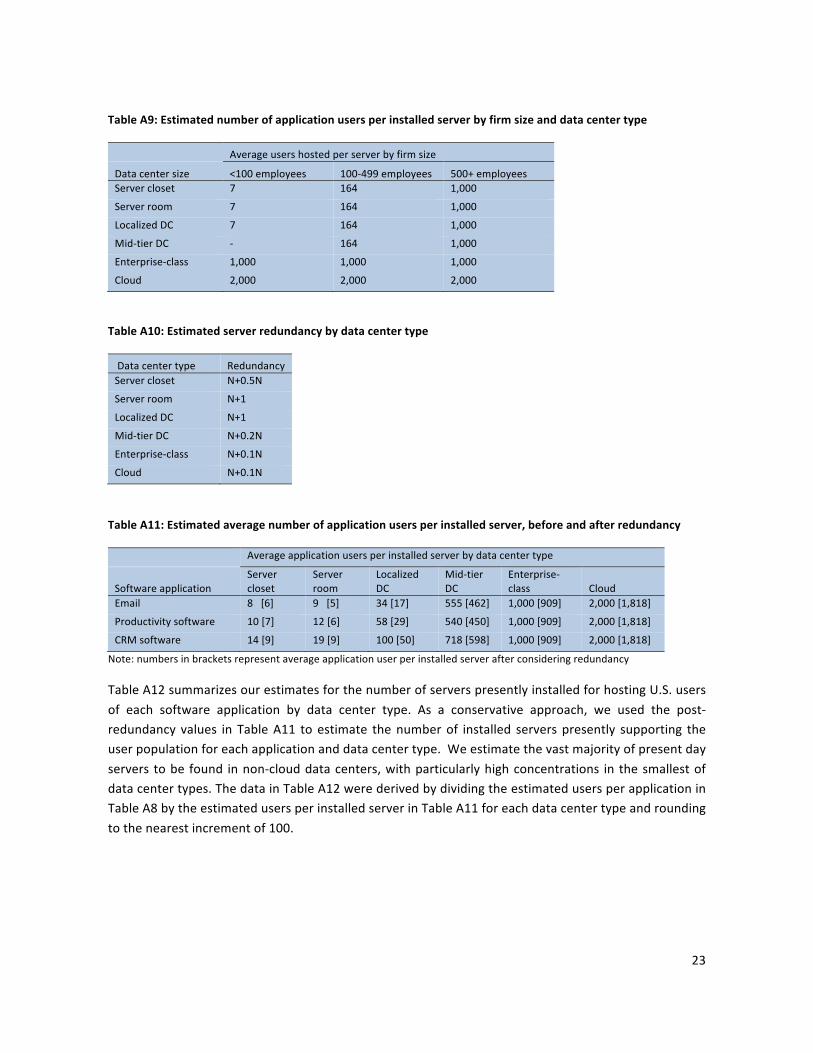
The!number!of!servers!required!in!each!data!center!type!to!host!the!users! in!Table!A8!is!a!function!of!firm!size!and!data!center! technology!characteristics.! !We!assumed! that! for!each! firm!with! fewer! than!500!employees,! there!will!be!dedicated!servers! for!email,!productivity!software,!and!CRM!software! in!server!closets,!server!rooms,!localized!data!centers,!and!mid/tier!data!centers.!!This!assumption!reflects!a! non/virtualized,! traditional! dedicated! server! arrangement! for! small! firms.! ! Therefore,! the! average!number!of!users!per!installed!server!for!a!small!firm!is!equal!to!the!number!of!employees!for!that!firm.!!The!data!in!Table!A9!reflect!this!assumption,!wherein!data!on!average!employees!per!firm!for!each!firm!size!category!were!obtained!from!the!U.S.!Census!Bureau.51!We!further!assumed!in!Table!A9!that!firms!with!greater! than!500!employees!and!enterprise/class!data!centers!would!host!1,000!users!per!server!(reflecting! high! server! utilization),! and! that! cloud! data! centers! would! host! 2,000! users! per! server!(reflecting!high!server!utilization!and!virtualization).52,53,54!!!
Table!A10!summarizes!our!estimates!for!server!redundancy!by!data!center!type,!which!reflect!traditional!redundancy! strategies! in! smaller! data! center! types! (server! closets,! server! rooms,! and! localized! data!centers)! where! dedicated! servers! are! common.55! ! Table! A11! presents! our! estimates! for! the! average!number!of!application!users!per! installed!server!by!application!type!and!data!center!type,!which!were!based!on!the!data!in!Tables!A4!through!A7,!A9,!and!A10.!!It!can!be!clearly!seen!that!the!redundancy!has!a!large!effect!on!the!ratio!of!application!users!to!installed!servers.!!Our!estimated!application!users!per!installed!server!are!particularly!low!for!server!closets!and!server!rooms!after!redundancy!is!considered.!!These!results!can!be!explained!by!the!predominance!of!users!from!small!firms!we!attributed!to!server!closets!and!server!rooms!(see!Tables!A4!and!A7),!our!conservative!assumption!that!each!small!firm!will!have!dedicated!servers! (see!Table!A9),!and!our!server! redundancy!assumptions! for!closets!and!rooms!(see!Table!A10).!!These!assumptions!should!be!revisited!in!future!studies!if!better!data!on!server!closets!and!rooms,!and!their!redundancy!practices,!become!available!in!the!public!domain.!
! &
Page 26
!
23!!
Table&A9:&Estimated&number&of&application&users&per&installed&server&by&firm&size&and&data¢er&type&
! Average!users!hosted!per!server!by!firm!size!
Data!center!size! <100!employees! 100/499!employees! 500+!employees!Server!closet! 7! 164!! 1,000!
Server!room! 7!! 164!! 1,000!
Localized!DC! 7!! 164!! 1,000!
Mid/tier!DC! /! 164!! 1,000!
Enterprise/class! 1,000! 1,000! 1,000!
Cloud! 2,000! 2,000! 2,000!
&
Table&A10:&Estimated&server&redundancy&by&data¢er&type&
!Data!center!type! Redundancy!Server!closet! N+0.5N!!
Server!room! N+1!
Localized!DC! N+1!
Mid/tier!DC! N+0.2N!
Enterprise/class! N+0.1N!
Cloud! N+0.1N!
!
Table&A11:&Estimated&average&number&of&application&users&per&installed&server,&before&and&after&redundancy&
! Average!application!users!per!installed!server!by!data!center!type!
Software!application!Server!closet!
Server!room!
Localized!DC!
Mid/tier!DC!
Enterprise/class! Cloud!
Email! 8!!![6]! 9!!![5]! 34![17]! 555![462]! 1,000![909]! 2,000![1,818]!
Productivity!software! 10![7]! 12![6]! 58![29]! 540![450]! 1,000![909]! 2,000![1,818]!
CRM!software! 14![9]! 19![9]! 100![50]! 718![598]! 1,000![909]! 2,000![1,818]!
Note:!numbers!in!brackets!represent!average!application!user!per!installed!server!after!considering!redundancy!
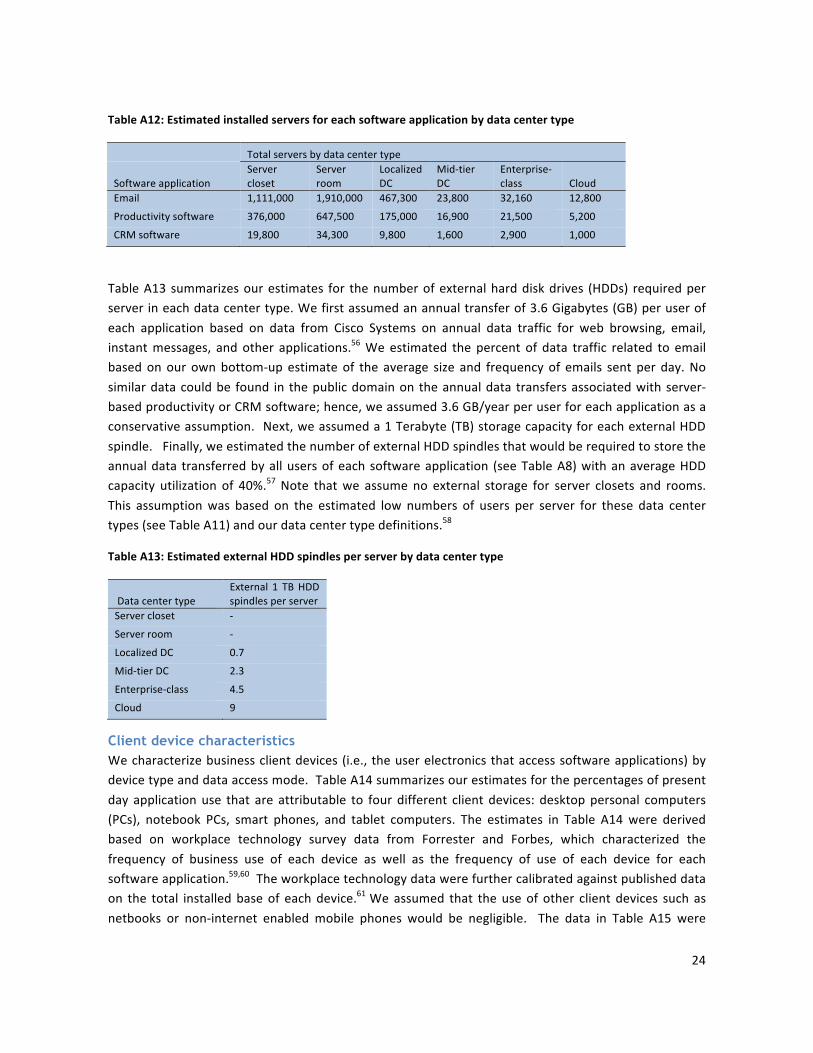
Table!A12!summarizes!our!estimates!for!the!number!of!servers!presently!installed!for!hosting!U.S.!users!of! each! software! application! by! data! center! type.! As! a! conservative! approach,! we! used! the! post/redundancy! values! in! Table!A11! to!estimate! the!number!of! installed! servers!presently! supporting! the!user!population!for!each!application!and!data!center!type.!!We!estimate!the!vast!majority!of!present!day!servers! to!be! found! in!non/cloud!data!centers,!with!particularly!high!concentrations! in! the!smallest!of!data!center!types.!The!data!in!Table!A12!were!derived!by!dividing!the!estimated!users!per!application!in!Table!A8!by!the!estimated!users!per!installed!server!in!Table!A11!for!each!data!center!type!and!rounding!to!the!nearest!increment!of!100.!
! &
Page 27
!
24!!
Table&A12:&Estimated&installed&servers&for&each&software&application&by&data¢er&type&&
! Total!servers!by!data!center!type!
Software!application!Server!closet!
Server!room!
Localized!DC!
Mid/tier!DC!
Enterprise/class! Cloud!
Email! 1,111,000! 1,910,000! 467,300! 23,800! 32,160! 12,800!
Productivity!software! 376,000! 647,500! 175,000! 16,900! 21,500! 5,200!
CRM!software! 19,800! 34,300! 9,800! 1,600! 2,900! 1,000!
!
Table!A13!summarizes!our!estimates! for! the!number!of!external!hard!disk!drives! (HDDs)! required!per!server!in!each!data!center!type.!We!first!assumed!an!annual!transfer!of!3.6!Gigabytes!(GB)!per!user!of!each! application! based! on! data! from! Cisco! Systems! on! annual! data! traffic! for! web! browsing,! email,!instant!messages,! and! other! applications.56!We!estimated! the! percent! of! data! traffic! related! to! email!based!on!our! own!bottom/up!estimate!of! the! average! size! and! frequency!of! emails! sent! per! day.!No!similar!data!could!be! found! in! the!public!domain!on!the!annual!data! transfers!associated!with! server/based!productivity!or!CRM!software;!hence,!we!assumed!3.6!GB/year!per!user!for!each!application!as!a!conservative!assumption.!!Next,!we!assumed!a!1!Terabyte!(TB)!storage!capacity!for!each!external!HDD!spindle.!!!Finally,!we!estimated!the!number!of!external!HDD!spindles!that!would!be!required!to!store!the!annual!data! transferred!by!all!users!of!each!software!application! (see!Table!A8)!with!an!average!HDD!capacity! utilization! of! 40%.57! Note! that!we! assume! no! external! storage! for! server! closets! and! rooms.!!This! assumption!was! based! on! the! estimated! low! numbers! of! users! per! server! for! these! data! center!types!(see!Table!A11)!and!our!data!center!type!definitions.58!!!
Table&A13:&Estimated&external&HDD&spindles&per&server&by&data¢er&type&
!Data!center!type!External! 1! TB!HDD!spindles!per!server!
Server!closet! /!
Server!room! /!
Localized!DC! 0.7!
Mid/tier!DC! 2.3!
Enterprise/class! 4.5!
Cloud! 9!
Client device characteristics
We!characterize!business!client!devices!(i.e.,! the!user!electronics!that!access!software!applications)!by!device!type!and!data!access!mode.!!Table!A14!summarizes!our!estimates!for!the!percentages!of!present!day! application!use! that! are! attributable! to! four! different! client! devices:! desktop!personal! computers!(PCs),! notebook! PCs,! smart! phones,! and! tablet! computers.! The! estimates! in! Table! A14!were! derived!based! on! workplace! technology! survey! data! from! Forrester! and! Forbes,! which! characterized! the!frequency! of! business! use! of! each! device! as! well! as! the! frequency! of! use! of! each! device! for! each!software!application.59,60!!The!workplace!technology!data!were!further!calibrated!against!published!data!on! the! total! installed!base!of! each!device.61!We!assumed! that! the!use!of! other! client!devices! such! as!netbooks! or! non/internet! enabled! mobile! phones! would! be! negligible.! ! The! data! in! Table! A15! were!
Page 28
!
25!!
derived!by! assuming!one!business! client! device! per! user! of! each! software! application! (see! Table!A8).!!This! assumption! neglects! the! possibility! of! multiple! client! devices! per! user! that! might! access! each!software! application! simultaneously;!we!make! the! simplifying! assumption! that! only! one! client! device!per!user!will!access!each!software!application!at!any!given!moment.!Hence,!the!device!numbers!in!Table!A15!should!provide!credible!but!conservative!estimates!of!the!total!client!device!energy!use!per!year!for!each! software! application.!We! assumed! that! all! desktop! PCs! would! be! accompanied! by! a! flat! panel!display.!
Table&A14:&Estimated&percent&of&software&application&use&by&business&client&devices&
! Percent!of!application!use!by!client!device!
Software!application! Desktop!PC! Notebook!PC! Smart!phone! Tablet!Email! 41%! 38%! 16%! 5%!
Productivity!software! 45%! 41%! 11%! 2%!
CRM!software! 31%! 29%! 31%! 9%!
!
Table&A15:&Estimated&number&of&business&client&devices&in&use&for&each&application&
! Number!of!client!devices!(thousands)!
Software!application! Desktop!PC! Notebook!PC! Flat!panel!display! Smart!phone! Tablet!Email! 35,714! 32,762! 35,714! 13,774! 4,526!
Productivity!software! 26,651! 24,449! 26,651! 6,608! 1,266!
CRM!software! 2,497! 2,290! 2,497! 2,467! 712!
!
Our! estimates! for! how! business! clients! presently! access! server/based! software! applications! are!summarized!in!Table!A16.!!We!made!the!simplifying!assumption!that!all!desktop!PCs!would!use!a!wired!internet! connection! (e.g.,! fiber! to! building).! ! We! assumed! that! 30%! of! server/based! software! data!accessed!by!notebook!PCs!would!be!via!Wi/Fi!connections,!based!on!survey!data!from!Forrester!on!the!mobile! work! habits! of! workers! in! information/related! occupations.62! Lastly,! we! assumed! that!mobile!devices!(smartphones!and!tablet!PCs)!would!rely!on!Wi/Fi!and!cellular!data!access!networks!for!33%!and!67%!of!all!server/based!software!use,!respectively,!based!on!a!recent!study!of!the!wireless!cloud!by!Bell!Labs!and!the!University!of!Melbourne.63!
Table&A16:&Estimated&data&access&modes&for&each&business&client&device&
! Percent!of!data!accessed!by!access!mode!
Client!device! Wired! Wi/Fi! Cellular!Desktop!PC! 100%! ! !
Notebook!PC! 70%! 30%! !
Smart!phone! ! 33%! 67%!
Tablet! !! 33%! 67%!
!
Page 29
!
26!!
Data center, network, and client device energy use
We!calculated!annual!data!center!energy!use!based!on!power!use!data!for!each!data!center! IT!device!and!values!of!power!utilization!effectiveness! (PUE)! for!each!data!center! type! from!published!research!reports!and!papers.64,65,66!!To!estimate!the!annual!energy!use!of!transmitting!software!application!data!over! network! systems! between! the! data! centers! and! business! client! devices,! we! used! conservative!values! derived! from! multiple! sources! in! the! literature! along! with! expert! elicitation.67,68,69,70,71,72! ! Our!estimated!values!for!data!center!device!power,!PUE,!and!network!system!energy!use!are!summarized!in!Tables! A17! and! A18.! The! network! energy! values! in! Table! A17! include! cumulative! terrestrial! and!submarine!transport,!core,!metro,!and!access!network!energy!use!(the!last!of!which!includes!customer!premises!equipment!and!base!stations).!!!
Table&A17:&Estimated&power/energy&use&of&data¢er&IT&devices&and&network&data&transmission&
! Data!center!IT!device!power!(watts)!
! Data!transmission!!(micro!Joules!per!bit)!
!
Volume!server!
Midrange!server!
External!HDD!
!Wired/Wi/Fi! ! Cellular!
Average!power/energy!use! 235! 450! 26! ! 100! ! 450!
!
Table&A18:&Estimated&PUE&by&data¢er&type&
!Data!center!type!Average!PUE!
Server!closet! 2.5!
Server!room! 2.1!
Localized!DC! 2!
Mid/tier!DC! 2!
Enterprise/class! 1.5!
Cloud! 1.1!
!
Table!A19!summarizes!our!estimates! for! the!power!use!and!operating!hours!associated!with!business!client! devices.! ! Power! use! data! for! desktop! PCs,! notebook! PCs,! and! flat! panel! displays! in! each!mode!were!obtained!from!the!U.S.!Department!of!Energy’s!2011!Building!Energy!Data!Book.73!Power!use!data!for!mobile! devices! were! derived! from! published! values! in! the! literature.74,75! Operating! hours! in! each!mode!for!desktop!PCs,!notebook!PCs,!and!flat!panel!displays!were!based!on!commercial!PC!use!data!in!Masanet!and!Horvath!(2006).76!Operating!hours!in!“on”!mode!for!mobile!devices!were!based!on!device!usage! data! in! Teehan! (2013).! ! No! publicly! available! data! could! be! found! on! the! time! spent! by! smart!phones! and! tablets! in! “sleep”! and! “off”!modes.! ! Thus,! the! data! in! Table! A19! for! represent! our! best!estimates!based!on!personal!observation.!
! &
Page 30
!
27!!
Table&A19:&Estimated&use&patterns&and&power&use&for&business&client&devices&
! Client!device!power!(watts)!
Mode!Desktop!PC!
Notebook!PC!
Flat! panel!display!
Smart!phone!
Tablet!computer!
ON! 75! 25! 42! 3! 5!
SLEEP/IDLE! 4! 2! 1! 3! 5!
OFF! 2! 2! 1! /! /!
! Annual!hours!of!use!(hours/yr)!
Mode!Desktop!PC!
Notebook!PC!
Flat! panel!display!
Smart!phone!
Tablet!computer!
ON! 988! 988! 988! 720! 540!
SLEEP/IDLE! 3,172! 3,172! 3,172! 4,020! /!
OFF! 4,600! 4,600! 4,600! 4,020! 8,220!
!
We! further! estimated! the! percentages! of! “on”! mode! time! that! are! dedicated! to! each! software!application! for! each! device,! which! are! summarized! in! Table! A20.! ! We! allocated! proportions! of!“sleep/idle”!and!“off”!mode!energy!use! to!each! software!application!and!device!based!on! these!“on”!mode!use!percentages.! !We!assumed!that!28%!of!“on”!time!is!dedicated!to!email!use!for!desktop!and!notebook!PCs!based!on!recent!workplace!survey!data!from!the!McKinsey!Global!Institute!and!that!10%!of!“on”!time!is!dedicated!to!email!use!for!smart!phones!and!tablet!PCs!based!on!market!research!data!in!Teehan!(2013).77,78!For!users!of!CRM!software,!we!estimated!20%!“on”!time!for!desktop!and!notebook!PCs!based!on!data!from!the!McKinsey!Global! Institute!that!suggest!39%!of!workplace!time!is!spent!on!“role! specific! tasks;”!we! attribute! half! that! time! (~20%)! to! productivity! and! CRM! software! use! in! the!absence! of! more! precise! data.! ! We! further! estimated! 20%! “on”! time! for! smart! phones! and! tablets!dedicated! to! CRM! software! based! on! data! from! Forrester,!which! suggest! that! users! of! that! software!might!be!equally!likely!to!use!mobile!devices.79!!Lastly,!we!estimated!10%!“on”!time!for!mobile!devices!using! productivity! software! based! on! the! same! Forrester! data,!which! suggest! that!workers! are!more!likely!to!use!traditional!desktop!and!notebook!PCs!than!mobile!devices!for!productivity!software.!
Table&A20:&Estimated&percent&of&client&device&“on”&time&dedicated&to&software&applications&
! Percent!of!device!“on”!time!dedicated!to!application!
Software!application! Desktop!PC! Notebook!PC! Flat!panel!display! Smart!phone! Tablet!Email! 28%! 28%! 28%! 10%! 10%!
Productivity!software! 20%! 20%! 20%! 10%! 10%!
CRM!software! 20%! 20%! 20%! 20%! 20%!
!
Page 31
!
28!!
Embodied energy and emissions
The!CLEER!Model!allows!for!consideration!of!the!embodied!energy!and!emissions!associated!with!data!center!building!materials,!data!center!IT!devices,!network!system!equipment,!client!devices,!and!other!physical!goods!that!might!comprise!a!societal!service!system!(e.g.,!DVD!manufacturing!for!consideration!of! physical! versus! streaming! video! provision).! ! Our! definition! of! embodied! energy! and! emissions!includes! the! energy! and! emissions! associated! with!material! or! device!manufacturing! and! end! of! life!treatment!(i.e.,!landfill!disposal!or!recycling).!!!
Tables!A21!and!A22!summarize!our!assumptions!for!the!embodied!energy!and!emissions!associated!with!data!center!building!materials.!!The!data!in!Table!A21!characterize!the!materials!intensity!(kilograms!of!material!per!square!meter!of!data!center!floor!space)!of!common!data!center!building!materials!based!on!a!Microsoft!data!center,! typical!values!of!embodied!energy!and!emissions! from!the! literature,!and!U.S.! average! recycling! rates.80,81,82,83! ! Table! A22! summarizes! our! factors! for! allocating! the! embodied!energy! use! and! emissions! of! data! center! building! materials! to! data! center! IT! devices! based! on! the!estimated!floor!space!occupied!by!each!device.!!!
Table&A21:&Estimated&embodied&energy&and&emissions&of&data¢er&building&materials&
Material!Materials! intensity!(kg/m2)!
Embodied! energy!(MJ/kg)!
Embodied! CO2!(kg!CO2e/kg)! %!recycled!
Structural!steel! 52! 24! 1.8! 85%!
Concrete! 730! 1! 0.13! 57%!
Extruded!polystyrene!insulation! 1! 86! 2.7! 57%!
Steel!electrical!conduit! 21! 24! 1.8! 85%!
Copper! 37! 48! 2.9! 85%!
Steel!cooling!pipes! 10! 24! 1.8! 85%!
!
Table&A22:&Estimated&floor&space&requirements&of&typical&data¢er&IT&devices&
Data!center!IT!device!Floor! space!!(m2/device)!
Volume!servers! 0.05!
Midrange!servers! 0.2!
External!HDD! 0.01!
Network!devices! 0.1!
!
Table!A23! summarizes!our! assumptions! for! the!embodied!energy! and!emissions! associated!with!data!center! IT!devices!and!business!client!devices.! !The!embodied!energy!and!emissions!values!were!based!on!best!available!data!from!the!literature.84,85,86,87! !We!assumed!a!high!recycling!rate!for!data!center!IT!devices!based!on!the!expectation!that!most!data!center!operators!would!have!established!recycling!and!stewardship! practices! in! place! for! end! of! life! equipment.! !We! assumed! lower! recycling! rates! for!U.S.!business! client! devices! based! on! recent! national! e/waste! recycling! data! for! personal! computer!equipment!from!the!United!States!Environmental!Protection!Agency.88!!!
Page 32
!
29!!
Table&A23:&Estimated&embodied&energy&and&emissions&of&IT&devices&
! Primary!energy!(MJ/device)! ! CO2!emissions!(kg!CO2e/device)! !
Device! Manufacturing!! Landfill! Recycling! ! Manufacturing!! Landfill! Recycling! %!recycled!
Volume!server! 9,350! 10! /440! ! 570! 1! /30! 90%!
Midrange!server! 37,390! 41! /1,760! ! 2,280! 4! /120! 90%!
External!HDD! 380! 0.1! /18! ! 23! 1! /2! 90%!
Desktop!PC! 2,260! 7.2! /191! ! 138! 0.6! /13! 40%!
Notebook!PC! 1,270! 2.3! /112! ! 81! 0.2! /8! 40%!
Flat!panel!display! 990! 4.1! /118! ! 55! 0.3! /8! 33%!
Smart!phone! 230! 0.2! /17! ! 28! 0.03! /2! 11%!
Tablet!computer! 1,880! 0.4! /167! ! 121! 0.01! 1! 11%!
!
Comprehensive! and! consistent! data! on! the! numbers! and! types! of! devices! that! comprise! the! data!transmission!infrastructure!could!not!be!found!in!the!public!domain.!!Thus,!we!expressed!our!embodied!energy!and!emissions!data!for!network!systems!as!ratios!of!embodied!energy!to!operational!energy!and!embodied!emissions!to!operational!energy,!respectively.!!These!simplifications!were!made!in!light!of!the!very!few!data!that!exist!in!the!public!domain!on!the!manufacturing!energy!use!and!emissions!of!network!devices,!and!the!fact!that!only!simple!ratios!could!be!extracted!from!the!existing!literature!sources.!!In!our! case! study,!we!assumed!2.4! joules!of! embodied!primary!energy!per! joule!of!network!operational!energy! and! 0.2! kg! of! embodied! carbon! dioxide! equivalents! per! joule! of! network! operational! energy,!where!network!operational!energy!was!calculated!using!the!data!in!Table!A17.89,90,91!!
Shifting from present day systems to the cloud
The!data!in!Tables!A1!through!A23!summarize!our!key!data!sources!and!assumptions!for!estimating!the!present! day! energy! use! and! CO2! emissions! associated! with! the! use! of! email,! productivity,! and! CRM!software! in! the! U.S! workforce.! ! To! estimate! how! present! day! energy! use! and! CO2! emissions! might!change!by!shifting!these!three!software!applications!to!the!cloud,!we!used!the!following!approach:!!
a) We!used!the!U.S.!national!average!grid!mix!to!convert!all!direct!electricity!use!results!to!primary!energy!(13.8!MJ/kWh)!and!CO2!emissions!(0.6!kg!CO2/kWh)!!
b) We!calculated!the!required!number!of!cloud!data!center!servers!for!hosting!all!uses!in!the!cloud!by! dividing! the! total! U.S.! users! of! each! software! application! (see! Table! A8)! by! the! post/redundancy!average!users!per!server!in!cloud!data!centers!(see!Table!A11)!
c) We!assumed!a!5%!increase!in!network!data!traffic!when!shifting!all!software!applications!to!the!cloud!to!account!for!the!possibility!increased!data!traffic!through!remote!software!access92!
d) We!assumed!all!cloud!data!centers!would!have!a!PUE!of!1.1!(see!Table!A18)!e) We!assumed!no!change!in!the!types!of!client!devices!or!their!usage!patterns!
Table!A24! summarizes!our! resulting! estimates! for! the! required!number!of! cloud! servers! and!external!HDDs! for! hosting! email,! productivity,! and! CRM! software! for! the! U.S.! workforce.! ! Compared! to! the!present!day,!the!server!count!for!cloud/hosted!software! is!substantially! lower!due!to!the!much!higher!user!per!server!capabilities!of!cloud/based!servers.! !However,! the!number!of!external!HDD!spindles! is!
Page 33
!
30!!
expected! to! decrease! less! drastically! with! a! shift! to! the! cloud! due! to! the! greater! external! storage!capacity!associated!with!cloud!data!centers.!
&Table&A24:&Number&of&data¢er&IT&devices:&present&day&compared&to&cloud5based&software&
! Number!of!data!center!IT!devices!
! Present!day!software! ! Cloud/based!software!
Software!application!Volume!server!
Midrange!servers!
External!HDDs! !
Midrange!servers!
External!HDDs!
Email! 3,543,000! 12,780! 641,000! ! 47,700! 429,500!Productivity!software! 1,237,000! 5,240! 306,000! ! 32,400! 291,900!
CRM!software! 68,500! 1,010! 32,800! ! 4,390! 39,500!!
Our! results! are! summarized! in! Table! A25.! ! More! detailed! results! can! be! viewed! by! preloading! and!running!the!cases!study!assumptions! for!email,!productivity!software,!and!CRM!software! in!the!CLEER!Model.!!!
It!is!critical!to!note!that!the!results!in!Table!A25!represent!our!estimated!technical!potential!for!energy!use!and!emissions!savings!associated!with!shifting!from!present!day!systems!to!cloud/based!systems!for!software! provision.! Estimates! of! technical! potential! provide! illustrative! upper! bounds! on! potential!savings!but!do!not!take!into!account!economic,!infrastructure,!temporal,!institutional,!or!policy!barriers!that!might!limit!the!savings!that!can!be!achieved!in!real/world!systems.93!!Thus,!the!results!in!Table!A25!should!be! interpreted!as! illustrative!of! the!energy!and!emissions! savings! that! could!be! realized!under!maximum!adoption!of!cloud/based!solutions!for!these!three!software!applications.!
Page 34
!
31!
! Table&A25:&Comparison&of&energy&use&and&em
issions,&present&day&versus&cloud<based&software&system
s&
!!!!
Prim
ary!energy!(T
J/yr)!
!!!!
CO
2 !emissions!(kt!C
O2 e/yr)!
!!
Email!
!!
Present!!!!!
day!
Maxim
um!
cloud!
adoptio
n!
%!!!!!
change!
!!
Present!!!!!
day!
Maxim
um!
cloud!
adoptio
n!
%!!!!!
change!
Client!IT
!device!operatio
n!
!!16,060!
16,060!
0%!
!!790!
790!
0%!
Client!IT
!devices!(e
mbodied)!
!!6,450!
6,450!
0%!
!!400!
400!
0%!
Data!transmission!system!operatio
n!
!!1,520!
1,600!
5%!
!!75!
80!
5%!
Data!transmission!system!devices!(e
mbodied)!
!!280!
300!
5%!
!!25!
30!
5%!
Data!center!operatio
n!
!!235,200!
3,900!
O98%!
!!11,540!
190!
O98%!
Data!center!IT!devices!(e
mbodied)!
!!8,150!
420!
O95%!
!!500!
30!
O95%!
Data!center!building!m
aterials!(e
mbodied)!
!!5!
1<!
O94%!
!!1<!
1<!
O94%!
Subtotal!
!!267,670!
28,770!
O89%!
!!13,320!
1,500!
O89%!
Productiv
ity!softw
are!
!!!!
!!!!
!!!!
!!!!
Client!IT
!device!operatio
n!
!!8,560!
8,560!
0%!
!!420!
420!
0%!
Client!IT
!devices!(e
mbodied)!
!!3,370!
3,379!
0%!
!!200!
200!
0%!
Data!transmission!system!operatio
n!
!!750!
790!
5%!
!!40!
40!
5%!
Data!transmission!system!devices!(e
mbodied)!
!!140!
150!
5%!
!!10!
10!
5%!
Data!center!operatio
n!
!!82,300!
2,680!
O97%!
!!4,050!
130!
O97%!
Data!center!IT!devices!(e
mbodied)!
!!2,860!
290!
O90%!
!!170!
20!
O90%!
Data!center!building!m
aterials!(e
mbodied)!
!!2!
1<!
O88%!
!!1<!
1<!
O88%!
Subtotal!
!!98,000!
15,820!
O84%!
!!4,900!
830!
O84%!
CRM!softw
are!
!!&&
&&&&
&&&&
&&!!
Client!IT
!device!operatio
n!
!!930!
930!
0%!
!!50!
50!
0%!
Client!IT
!devices!(e
mbodied)!
!!1,130!
1,130!
0%!
!!90!
90!
0%!
Data!transmission!system!operatio
n!
!!150!
160!
5%!
!!7!
8!
5%!
Data!transmission!system!devices!(e
mbodied)!
!!30!
30!
5%!
!!2!
3!
5%!
Data!center!operatio
n!
!!4,890!
360!
O93%!
!!240!
20!
O93%!
Data!center!IT!devices!(e
mbodied)!
!!170!
40!
O78%!
!!10!
2!
O78%!
Data!center!building!m
aterials!(e
mbodied)!
!!1<!
1<!
O73%!
!!1<!
1<!
O73%!
Subtotal!
!!7,300!
2,650!
O64%!
!!390!
160!
O64%!
Total!
!!372,970!
47,240!
O87%!
!!18,610!
2,490!
O87%!
Note:!to
tals!and!column!sums!m
ight!n
ot!b
e!equal!due!to
!rounding;!%
!change!m
ight!n
ot!b
e!equal!to
!changes!in!row!values!due!to
!rounding.!
Page 35
!
32!!
End Notes
!!!!!!!!!!!!!!!!!!!!!!!!!!!!!!!!!!!!!!!!!!!!!!!!!!!!!!!!!!!!!1!Brown,!R.,!Masanet,!E.,!Nordman,!B.,!Tschudi,!W.,!Shehabi,!A.,!Stanley,!J.,!Koomey,!J.,!Sartor,!D.,!Chan,!P.,!Loper,!J.,!Capana,!S.,!Hedman,!B.,!Duff,!R.,!Haines,!E.,!Sass,!D.,!and!A.!Fanara.! (2007).!Report'to'Congress'on'Server'and'Data'Center'Energy'Efficiency:'Public'Law'109@431.! !Lawrence!Berkeley!National!Laboratory,!Berkeley,!California.!LBNLP363E.!!2!Koomey,! J.G.! (2011).!Growth' in'Data'Center'Electricity'Use'2005' to'2010.! !Analytics!Press,!Oakland,!California.!http://www.analyticspress.com/datacenters.html!!3! Greenpeace! (2011).! How' dirty' is' your' data?' A' Look' at' the' Energy' Choices' That' Power' Cloud' Computing.!Greenpeace!International,!Amsterdam,!The!Netherlands.!!4!Glanz,!James!(2012).!"Power,!Pollution,!and!the!Internet."!New'York'Times.!!New!York,!NY.!!September!23.!p.!A1.!!5!Koomey,! J.G.! (2011).!Growth' in'Data'Center'Electricity'Use'2005' to'2010.! !Analytics!Press,!Oakland,!California.!http://www.analyticspress.com/datacenters.html!!6!United!States!Department!of!Energy!(2011).!Best'Practices'Guide'for'Energy@Efficient'Data'Center'Design,!Federal!Energy!Management!Program.!http://www1.eere.energy.gov/femp/pdfs/eedatacenterbestpractices.pdf!!7!Samson,!T.!(2010).!“The!green!IT!stars!of!2010:!InfoWorld's!2010!Green!15!Awards:!GreenPtech!projects!coupled!with! innovation! and! collaboration! yield! bountiful! rewards.”! InfoWorld.! April! 22.!http://www.infoworld.com/d/greenPit/thePgreenPitPstarsP2010P454?page=0,15!!!8! Lammers,! H.! (2011).! ! “At! NREL,! Even! the! Ones! and! Zeros! Are! Green.”! NREL! Newsroom,! National! Renewable!Energy!Laboratory.!July!6,!2011!http://www.nrel.gov/news/features/feature_detail.cfm/feature_id=1505!!9! Smalley,! G.! (2011).! “2011:! The! Year! Data! Centers! Turned! Green.”! Wired.! December! 30,! 2011.!!http://www.wired.com/wiredenterprise/2011/12/greenPdataPcentersPofP2011!!10! Gelber,! R.! (2012).! “Facebook! showcases! green! datacenter.”! HPCwire.! April! 26,! 2012.!http://www.hpcwire.com/hpcwire/2012P04P26/facebook_showcases_green_datacenter.html!!11! Google! (2013).! “Our! energyPsaving! data! centers.”! Accessed! June! 9,! 2013.!http://www.google.com/about/datacenters/efficiency/internal/index.html#measuringPefficiency!!12!Accenture!and!WSP!Environmental! (2010).!Cloud'Computing'and'Sustainability:'The'Environmental'Benefits'of'Moving'to'the'Cloud.!http://www.accenture.com/usPen/Pages/insightPenvironmentalPbenefitsPmovingPcloud.aspx!!!13!Salesforce.com!and!WSP!Environmental!(2010).!Salesforce.com'and'the'Environment:'Reducing'Carbon'Emissions'in'the'Cloud.!http://www.salesforce.com/assets/pdf/misc/WP_WSP_Salesforce_Environment.pdf!!!14! Google! (2011).! Google’s' Green' Computing:' Efficiency' at' Scale.! www.google.com/green/pdfs/googlePgreenPcomputing.pdf!!15! Thomond,! P.,! MacKenzie,! I.,! Gann,! D.,! and! A.! Velkov! (2011).! The' Enabling' Technologies' of' a' Low' Carbon'Economy:!From'Information'Technology'to'Enabling'Technology:'Can'Cloud'Computing'Enable'Carbon'Abatement.!!Imperial!College!London.!!Draft.!!November!9,!2011.!!http://www.enablingtechnology.eu/content/environment/resources/Can_Cloud_Computing_Enable_Carbon_Abatement_Nov_2011.pdf!'
Page 36
!
33!!
!!!!!!!!!!!!!!!!!!!!!!!!!!!!!!!!!!!!!!!!!!!!!!!!!!!!!!!!!!!!!!!!!!!!!!!!!!!!!!!!!!!!!!!!!!!!!!!!!!!!!!!!!!!!!!!!!!!!!!!!!!!!!!!!!!!!!!!!!!!!!!!!!!!!!!!!!!!!!!!!!!!!!!!!!!!!!!!!!!!!!!!!!!!!!!!!!!!!! !16!Weber,!C.!L.,!J.!G.!Koomey,!and!H.!S.!Matthews!(2010).!“The!energy!and!climate!change!implications!of!different!music!delivery!methods.”!Journal!of!Industrial!Ecology.!14,!Issue!5.!!17!Toffel,!M.!W.!and!A.!Horvath! (2004).!“Environmental! implications!of!wireless! technologies:!News!delivery!and!business!meetings.”!Environmental'Science'&'Technology!38(11):!2961–2970.!!18! National! Action! Plan! for! Energy! Efficiency! (2007).! Guide' for' Conducting' Energy' Efficiency' Potential' Studies.!Prepared!by!Philip!Mosenthal!and!Jeffrey!Loiter,!Optimal!Energy,!Inc.!http://www.epa.gov/eeactionplan!!!!!19! Thomond,! P.,! MacKenzie,! I.,! Gann,! D.,! and! A.! Velkov! (2011).! The' Enabling' Technologies' of' a' Low' Carbon'Economy:!From'Information'Technology'to'Enabling'Technology:'Can'Cloud'Computing'Enable'Carbon'Abatement.!!Imperial!College!London.!!Draft.!!November!9,!2011.!!http://www.enablingtechnology.eu/content/environment/resources/Can_Cloud_Computing_Enable_Carbon_Abatement_Nov_2011.pdf!'!20!Bailey,!M.,!M.!Eastwood,!T!Grieser,!L.!Borovick,!V.!Turner,!and!R.C.!Gray!(2007).!Special'Study:'Data'Center'of'the'Future.!International!Data!Corporation.!IDC!#06C4799.!April.!!21!Koomey,! J.G.! (2011).!Growth' in'Data'Center'Electricity'Use'2005'to'2010.! !Analytics!Press,!Oakland,!California.!http://www.analyticspress.com/datacenters.html!!22! Hardcastle,! J.! (2012).! Forecast' Analysis:' Data' Centers,' Worldwide,' 2010@2016,' 2Q12' Update.! Gartner.!G00236110.!!23!Bailey,!M.,!M.!Eastwood,!T!Grieser,!L.!Borovick,!V.!Turner,!and!R.C.!Gray!(2007).!Special'Study:'Data'Center'of'the'Future.!International!Data!Corporation.!IDC!#06C4799.!April.!!24!Centre!for!Energy!Efficient!Telecommunications!(2013).!The'Power'of'Wireless'Cloud:'An'analysis'of'the'energy'consumption'of'wireless'cloud.!Bell!Labs!and!the!University!of!Melbourne.!!http://www.ceet.unimelb.edu.au/pdfs/ceet_white_paper_wireless_cloud.pdf!!!25! Google! (2011).! Google’s' Green' Computing:' Efficiency' at' Scale.! www.google.com/green/pdfs/googlePgreenPcomputing.pdf!!26!Shehabi,!A.,!Masanet,!E.,!Price,!H.,!Traber,!K.,!Horvath,!A.,!and!W.W.!Nazaroff.!(2011).!“Data!Center!Design!and!Location:!Consequences!for!Electricity!Use!and!GreenhousePGas!Emissions.”!Building'and'Environment,!Volume!46,!Issue!5.!!27!Baliga,!J.,!R.!Ayre,!K.!Hinton,!W.V.!Sorin,!and!R.S.!Tucker!(2009).!“Energy!Consumption!in!Optical!IP!Networks.”!Journal'of'Lightwave'Technology,!Volume!7,!Number!13.!!28! Baliga,! J.,! R.! Ayre,! K.! Hinton,! and! R.S.! Tucker! (2011).! “Energy! Consumption! in! Wired! and! Wireless! Access!Networks.”!IEEE'Communications'Magazine.!June!2011.!!29!Lanzisera,!S.,!Nordman,!B.,!and!R.E.!Brown!(2012).!“Data!network!equipment!energy!use!and!savings!potential!in!buildings.”!Energy'Efficiency,!May!2012,!Volume!5,!Issue!2,!pp!149P162!!30!Coroama,!V.C,!Hilty,!L.M.,!Heiri,!E.,!and!F.M.!Horn!(2013).!“The!Direct!Energy!Demand!of!Internet!Data!Flows.!Journal'of'Industrial'Ecology.!In!press.!!
Page 37
!
34!!
!!!!!!!!!!!!!!!!!!!!!!!!!!!!!!!!!!!!!!!!!!!!!!!!!!!!!!!!!!!!!!!!!!!!!!!!!!!!!!!!!!!!!!!!!!!!!!!!!!!!!!!!!!!!!!!!!!!!!!!!!!!!!!!!!!!!!!!!!!!!!!!!!!!!!!!!!!!!!!!!!!!!!!!!!!!!!!!!!!!!!!!!!!!!!!!!!!!!31!Vereecken,!W.,!Van!Heddeghem,!W.,!Deruyck,!M.,!Puype,!B.,!Lannoo,!B.,!Joseph,!W.,!Colle,!D.,!Marten,!L.,!and!M.!Pickavet!(2010).!“Power!Consumption!in!Telecommunication!Networks:!Overview!and!Reduction!Strategies.”!IEEE'Communications'Magazine,!Volume!49,!Issue!6.!!32!Centre!for!Energy!Efficient!Telecommunications!(2013).!The'Power'of'Wireless'Cloud:'An'analysis'of'the'energy'consumption'of'wireless'cloud.!Bell!Labs!and!the!University!of!Melbourne.!!http://www.ceet.unimelb.edu.au/pdfs/ceet_white_paper_wireless_cloud.pdf!!33! United! States! Department! of! Energy! (2012).! Building' Energy' Data' Book.! Washington,! DC.!http://buildingsdatabook.eren.doe.gov/!!!34!Williams,!E.!(2011).!“Environmental!effects!of!information!and!communications!technologies.”!Nature!!!!!!!479,!354–358!(17!November!2011).!!35!Oracle!Crystal!Ball:!http://www.oracle.com/us/products/applications/crystalball/overview/index.html!!!!36!United!States!Census!Bureau!(2013).!2011'American'Community'Survey:'Table'S2405:'Industry'by'Occupation'for'the'Civilian'Employed'Population'16'Years'and'Over.!!Washington,!DC.!!37! United! States! Census! Bureau! (2005).! 2003' Current' Population' Survey:' Table' 7.' Use' of' a' Computer' and' the'Internet'at'Work'for'Employed'People'18'Years'and'Over,'by'Selected'Characteristics.!!Washington,!DC.!!38!United!States!Census!Bureau!(2012).!Survey'of'Income'and'Program'Participation,'2008'Panel:'Table'4.'Reported'Computer'and'Internet'Access,'by'Selected'Individual'Characteristics:'2010.!Washington,!DC.!!39! United! States! Census! Bureau! (2011).! 2010' County' Business' Patterns:' Number' of' Firms,' Number' of'Establishments,' Employment,' and' Annual' Payroll' by' Enterprise' Employment' Size' for' the' United' States,' All'Industries.!Washington,!DC.!!40!Bailey,!M.,!M.!Eastwood,!T!Grieser,!L.!Borovick,!V.!Turner,!and!R.C.!Gray!(2007).!Special'Study:'Data'Center'of'the'Future.!International!Data!Corporation.!IDC!#06C4799.!April.!!41! United! States! Census! Bureau! (2005).! 2003' Current' Population' Survey:' Table' 7.' Use' of' a' Computer' and' the'Internet'at'Work'for'Employed'People'18'Years'and'Over,'by'Selected'Characteristics.!!Washington,!DC!!42!CRM!Café!(2013).!Top'5'CRM'Software'Systems.!http://www.crmcafe.com/crmPsoftware.php!!43!Salesforce.com!(2013).!About'us.!http://www.salesforce.com/company/!!44!Kitt,!D.!(2012).!CRM'Market'Share'2012.!http://www.crmswitch.com/crm/crmPmarketPshareP2012/!!45!CRMsearch!(2013).!North'American'CRM'Software'Market.!http://www.crmsearch.com/northamerica.php!!46! Thomond,! P.,! MacKenzie,! I.,! Gann,! D.,! and! A.! Velkov! (2011).! The' Enabling' Technologies' of' a' Low' Carbon'Economy:!From'Information'Technology'to'Enabling'Technology:'Can'Cloud'Computing'Enable'Carbon'Abatement.!!Imperial!College!London.!!Draft.!!November!9,!2011.!!http://www.enablingtechnology.eu/content/environment/resources/Can_Cloud_Computing_Enable_Carbon_Abatement_Nov_2011.pdf!'!!
Page 38
!
35!!
!!!!!!!!!!!!!!!!!!!!!!!!!!!!!!!!!!!!!!!!!!!!!!!!!!!!!!!!!!!!!!!!!!!!!!!!!!!!!!!!!!!!!!!!!!!!!!!!!!!!!!!!!!!!!!!!!!!!!!!!!!!!!!!!!!!!!!!!!!!!!!!!!!!!!!!!!!!!!!!!!!!!!!!!!!!!!!!!!!!!!!!!!!!!!!!!!!!!47!Masanet,! E.,! Brown,!R.E.,! Shehabi,!A.,! Koomey,! J.G.,! and!B.!Nordman! (2011).! “Estimating! the!Energy!Use!and!Efficiency!Potential!of!U.S.!Data!Centers.!Proceedings'of'the'IEEE,!Volume!99,!Number!8.!!48!Brown,!R.,!Masanet,!E.,!Nordman,!B.,!Tschudi,!W.,!Shehabi,!A.,!Stanley,!J.,!Koomey,!J.,!Sartor,!D.,!Chan,!P.,!Loper,!J.,!Capana,!S.,!Hedman,!B.,!Duff,!R.,!Haines,!E.,!Sass,!D.,!and!A.!Fanara.! (2007).!Report'to'Congress'on'Server'and'Data'Center'Energy'Efficiency:'Public'Law'109@431.! !Lawrence!Berkeley!National!Laboratory,!Berkeley,!California.!LBNLP363E.!!49!Bailey,!M.,!M.!Eastwood,!T!Grieser,!L.!Borovick,!V.!Turner,!and!R.C.!Gray!(2007).!Special'Study:'Data'Center'of'the'Future.!International!Data!Corporation.!IDC!#06C4799.!April.!!50! Hardcastle,! J.! (2012).! Forecast' Analysis:' Data' Centers,' Worldwide,' 2010@2016,' 2Q12' Update.! Gartner.!G00236110.!!51! United! States! Census! Bureau! (2011).! 2010' County' Business' Patterns:' Number' of' Firms,' Number' of'Establishments,' Employment,' and' Annual' Payroll' by' Enterprise' Employment' Size' for' the' United' States,' All'Industries.!Washington,!DC.!!52!Personal!communication!with!Google!data!center!staff!(2013).!!53! Thomond,! P.,! MacKenzie,! I.,! Gann,! D.,! and! A.! Velkov! (2011).! The' Enabling' Technologies' of' a' Low' Carbon'Economy:!From'Information'Technology'to'Enabling'Technology:'Can'Cloud'Computing'Enable'Carbon'Abatement.!!Imperial!College!London.!!Draft.!!November!9,!2011.!!http://www.enablingtechnology.eu/content/environment/resources/Can_Cloud_Computing_Enable_Carbon_Abatement_Nov_2011.pdf!'!54! Google,! Inc.! (2012).! Google’s! Green! Computing:! Efficiency! at! Scale.!http://static.googleusercontent.com/external_content/untrusted_dlcp/www.google.com/en/us/green/pdfs/googlePgreenPcomputing.pdf!!55! Google,! Inc.! (2012).! Google’s! Green! Computing:! Efficiency! at! Scale.!http://static.googleusercontent.com/external_content/untrusted_dlcp/www.google.com/en/us/green/pdfs/googlePgreenPcomputing.pdf!!!56! Cisco! Systems! (2011).! Cisco' Global' Cloud' Index:' Forecast' and' Methodology,' 2010' –' 2015.! White! Paper.!http://www.cisco.com/en/US/solutions/collateral/ns341/ns525/ns537/ns705/ns1175/Cloud_Index_White_Paper.html!!!57!Masanet,! E.,! Brown,!R.E.,! Shehabi,!A.,! Koomey,! J.G.,! and!B.!Nordman! (2011).! “Estimating! the!Energy!Use!and!Efficiency!Potential!of!U.S.!Data!Centers.!Proceedings'of'the'IEEE,!Volume!99,!Number!8.!!58!Brown,!R.,!Masanet,!E.,!Nordman,!B.,!Tschudi,!W.,!Shehabi,!A.,!Stanley,!J.,!Koomey,!J.,!Sartor,!D.,!Chan,!P.,!Loper,!J.,!Capana,!S.,!Hedman,!B.,!Duff,!R.,!Haines,!E.,!Sass,!D.,!and!A.!Fanara.! (2007).!Report'to'Congress'on'Server'and'Data'Center'Energy'Efficiency:'Public'Law'109@431.! !Lawrence!Berkeley!National!Laboratory,!Berkeley,!California.!LBNLP363E.!!59!Schadler!(2013).!2013!Mobile!Workforce!Adoption!Trends.!Forrester!Research.!!https://www.vmware.com/files/pdf/Forrester_2013_Mobile_Workforce_Adoption_Trends_Feb2013.pdf!!!60!Forbes!(2010).!The!Untethered!Executive:!Business!Information!in!the!Age!of!Mobility.!!http://images.forbes.com/forbesinsights/StudyPDFs/The_Untethered_Executive.pdf!!
Page 39
!
36!!
!!!!!!!!!!!!!!!!!!!!!!!!!!!!!!!!!!!!!!!!!!!!!!!!!!!!!!!!!!!!!!!!!!!!!!!!!!!!!!!!!!!!!!!!!!!!!!!!!!!!!!!!!!!!!!!!!!!!!!!!!!!!!!!!!!!!!!!!!!!!!!!!!!!!!!!!!!!!!!!!!!!!!!!!!!!!!!!!!!!!!!!!!!!!!!!!!!!!!61!Meeker!(2012).!INTERNET!TRENDS!@!STANFORD!–!BASES.!Kleiner,!Perkins,!Caufield,!Byers.!December!3.!!http://www.kpcb.com/file/kpcbP2012PinternetPtrendsPupdate!!!!!!62!Schadler!(2013).!2013'Mobile'Workforce'Adoption'Trends.'Forrester!Research.!!https://www.vmware.com/files/pdf/Forrester_2013_Mobile_Workforce_Adoption_Trends_Feb2013.pdf!!63!Centre!for!Energy!Efficient!Telecommunications!(2013).!The'Power'of'Wireless'Cloud:'An'analysis'of'the'energy'consumption'of'wireless'cloud.!Bell!Labs!and!the!University!of!Melbourne.!!http://www.ceet.unimelb.edu.au/pdfs/ceet_white_paper_wireless_cloud.pdf!!64!Koomey,! J.G.! (2011).!Growth' in'Data'Center'Electricity'Use'2005'to'2010.! !Analytics!Press,!Oakland,!California.!http://www.analyticspress.com/datacenters.html!!65!Masanet,! E.,! Brown,!R.E.,! Shehabi,!A.,! Koomey,! J.G.,! and!B.!Nordman! (2011).! “Estimating! the!Energy!Use!and!Efficiency!Potential!of!U.S.!Data!Centers.!Proceedings'of'the'IEEE,!Volume!99,!Number!8.!!66!Masanet,!E.,!Shehabi,!A.,!and!J.G.!Koomey!(2013).!“Characteristics!of!LowPCarbon!Data!Centers.”!Nature'Climate'Change.!In!press.!!67!Baliga,!J.,!R.!Ayre,!K.!Hinton,!W.V.!Sorin,!and!R.S.!Tucker!(2009).!“Energy!Consumption!in!Optical!IP!Networks.”!Journal'of'Lightwave'Technology,!Volume!7,!Number!13.!!68! Baliga,! J.,! R.! Ayre,! K.! Hinton,! and! R.S.! Tucker! (2011).! “Energy! Consumption! in! Wired! and! Wireless! Access!Networks.”!IEEE'Communications'Magazine.!June!2011.!!69!Lanzisera,!S.,!Nordman,!B.,!and!R.E.!Brown!(2012).!“Data!network!equipment!energy!use!and!savings!potential!in!buildings.”!Energy'Efficiency,!May!2012,!Volume!5,!Issue!2,!pp!149P162!!70!Coroama,!V.C,!Hilty,!L.M.,!Heiri,!E.,!and!F.M.!Horn!(2013).!“The!Direct!Energy!Demand!of!Internet!Data!Flows.!Journal'of'Industrial'Ecology.!In!press.!!71!Vereecken,!W.,!Van!Heddeghem,!W.,!Deruyck,!M.,!Puype,!B.,!Lannoo,!B.,!Joseph,!W.,!Colle,!D.,!Marten,!L.,!and!M.!Pickavet!(2010).!“Power!Consumption!in!Telecommunication!Networks:!Overview!and!Reduction!Strategies.”!IEEE'Communications'Magazine,!Volume!49,!Issue!6.!!72!Centre!for!Energy!Efficient!Telecommunications!(2013).!The'Power'of'Wireless'Cloud:'An'analysis'of'the'energy'consumption'of'wireless'cloud.!Bell!Labs!and!the!University!of!Melbourne.!!http://www.ceet.unimelb.edu.au/pdfs/ceet_white_paper_wireless_cloud.pdf!!73! United! States! Census! Bureau! (2011).! 2010' County' Business' Patterns:' Number' of' Firms,' Number' of'Establishments,' Employment,' and' Annual' Payroll' by' Enterprise' Employment' Size' for' the' United' States,' All'Industries.!Washington,!DC.!!74!Teehan,!P.!(2013).!!"The!Need!for!ConsumptionPBased!Impact!Estimation!of!ICTPbased!Behaviors."!International'Symposium'on'Sustainable'Systems'&'Technologies.!!May!2013,!Cincinnati.!!75!Centre!for!Energy!Efficient!Telecommunications!(2013).!The'Power'of'Wireless'Cloud:'An'analysis'of'the'energy'consumption'of'wireless'cloud.!Bell!Labs!and!the!University!of!Melbourne.!!http://www.ceet.unimelb.edu.au/pdfs/ceet_white_paper_wireless_cloud.pdf!!
Page 40
!
37!!
!!!!!!!!!!!!!!!!!!!!!!!!!!!!!!!!!!!!!!!!!!!!!!!!!!!!!!!!!!!!!!!!!!!!!!!!!!!!!!!!!!!!!!!!!!!!!!!!!!!!!!!!!!!!!!!!!!!!!!!!!!!!!!!!!!!!!!!!!!!!!!!!!!!!!!!!!!!!!!!!!!!!!!!!!!!!!!!!!!!!!!!!!!!!!!!!!!!!76!Masanet,!E.,!and!A.!Horvath!(2006),!“Enterprise!Strategies!for!Reducing!the!Environmental!Impacts!of!Personal!Computers.”!Proceedings'of'the'2006'IEEE'International'Symposium'on'Electronics'&'Environment,!San!Francisco,!California,!IEEE.!!77! McKinsey! Global! Institute! (2012).! The' social' economy:' Unlocking' value' and' productivity' through' social'technologies.!http://www.mckinsey.com/insights/high_tech_telecoms_internet/the_social_economy!!!78!Teehan,!P.!(2013).!!"The!Need!for!ConsumptionPBased!Impact!Estimation!of!ICTPbased!Behaviors."!International'Symposium'on'Sustainable'Systems'&'Technologies.!!May!2013,!Cincinnati.!!79!Schadler!(2013).!2013'Mobile'Workforce'Adoption'Trends.'Forrester!Research.!!https://www.vmware.com/files/pdf/Forrester_2013_Mobile_Workforce_Adoption_Trends_Feb2013.pdf!!80! Pinto,! R.! (2013).! The! Potential! of! Cloud! Computing! to! Help! Decarbonize! the! Economy.! 2nd! Multinational!Knowledge!Brokerage!Event:!“Green!ICT!for!Sustainable!Consumption?”!Vienna,!Austria,!January!17P18.!!81!Hammond,!G.P.,!and!C.I.!Jones!(2008).!“Embodied!energy!and!carbon!in!construction!materials.”!Proc.'Instn'Civil.'Engrs:'Energy.!!82!Ochsendorf!et!al.!(2011).!Methods,'Impacts,'and'Opportunities'in'the'Concrete'Building'Life'Cycle.!Massachusetts!Institute!of!Technology.!!83!Franklin!and!Associates! (2008).!Characterization'of'Building@Related'Construction'and'Demolition'Debris' in' the'United'States.!!U.S.!Environmental!Protection!Agency,!Washington,!DC.!!!http://www.epa.gov/osw/hazard/generation/sqg/cdPrpt.pdf!!!84! IVF! Industrial! Research! and! Development! Corporation! (2007).! European' Commission' DG' TREN' Preparatory'studies' for' Eco@design' Requirements' of' EuPs:' Lot' 3' Personal' Computers' (desktops' and' laptops)' and' Computer'Monitors'Final'Report'(Task'1@8).!http://www.ecocomputer.org/!!85! Andrae! and! Anderson! (2010).! “Life! cycle! assessments! of! consumer! electronics! —! are! they! consistent?”!International'Journal'of'LCA.!(2010)!15:827–836.!!86!Apple!(2013).!Apple!iPad!2!Environmental!Report.!!http://images.apple.com/environment/reports/docs/iPad_2_Environmental_Report.pdf!!!87!Masanet,!E.,!and!A.!Horvath!(2006),!“Enterprise!Strategies!for!Reducing!the!Environmental!Impacts!of!Personal!Computers.”!Proceedings'of'the'2006'IEEE'International'Symposium'on'Electronics'&'Environment,!San!Francisco,!California,!IEEE.!!88!U.S.!EPA!(2011).!Electronics'Waste'Management'In'the'United'States'Through'2009.!Washington,!DC.!!http://www.epa.gov/osw/conserve/materials/summarybaselinereport2011.pdf!!!89!Mahadeven,!P.,!Shah,!A.,!and!Bash,!C.!(2010).!Reducing!Lifecycle!Energy!Use!of!Network!Switches.!Proceedings'of'the'2010'IEEE'International'Symposium'on'Sustainable'Systems'and'Technology,!Washington,!DC,!May.!!90! Humar,! I.,! Xiaohu! Ge,! Lin! Xiang,! Minho! Jo,! Min! Chen,! and! Jing! Zhang! (2011).! “Rethinking! energy! efficiency!models!of!cellular!networks!with!embodied!energy.”!IEEE'Network.!Volume!25,!Issue!2.!!91! Malmoden,! J.,! Lunden,! D.,! Nilsson,! M.,! and! G.! Andersson! (2012).! “LCA! of! data! transmission! and! IP! core!networks.”!Electronics'Goes'Green'2012+.!Berlin,!Germany.!! 9P12!Sept.!2012.!
Page 41
!
38!!
!!!!!!!!!!!!!!!!!!!!!!!!!!!!!!!!!!!!!!!!!!!!!!!!!!!!!!!!!!!!!!!!!!!!!!!!!!!!!!!!!!!!!!!!!!!!!!!!!!!!!!!!!!!!!!!!!!!!!!!!!!!!!!!!!!!!!!!!!!!!!!!!!!!!!!!!!!!!!!!!!!!!!!!!!!!!!!!!!!!!!!!!!!!!!!!!!!!!!92! Thomond,! P.,! MacKenzie,! I.,! Gann,! D.,! and! A.! Velkov! (2011).! The' Enabling' Technologies' of' a' Low' Carbon'Economy:!From'Information'Technology'to'Enabling'Technology:'Can'Cloud'Computing'Enable'Carbon'Abatement.!!Imperial!College!London.!!Draft.!!November!9,!2011.!!http://www.enablingtechnology.eu/content/environment/resources/Can_Cloud_Computing_Enable_Carbon_Abatement_Nov_2011.pdf!'!93! National! Action! Plan! for! Energy! Efficiency! (2007).! Guide' for' Conducting' Energy' Efficiency' Potential' Studies.!Prepared!by!Philip!Mosenthal!and!Jeffrey!Loiter,!Optimal!Energy,!Inc.!http://www.epa.gov/eeactionplan!