A Viable A Viable Implementation of a Implementation of a Comparison Algorithm Comparison Algorithm for Regions of for Regions of Interest Interest John P. Heminghous John P. Heminghous Computer Science Computer Science Clemson University Clemson University [email protected][email protected]
Transcript
A Viable Implementation A Viable Implementation of a Comparison of a Comparison
Algorithm for Regions of Algorithm for Regions of InterestInterest
John P. HeminghousJohn P. HeminghousComputer ScienceComputer ScienceClemson UniversityClemson [email protected]@acm.org
Previous work already addresses the Previous work already addresses the problemproblem
Ability to create a nearly automatic Ability to create a nearly automatic analysis toolanalysis tool
Previous workPrevious work
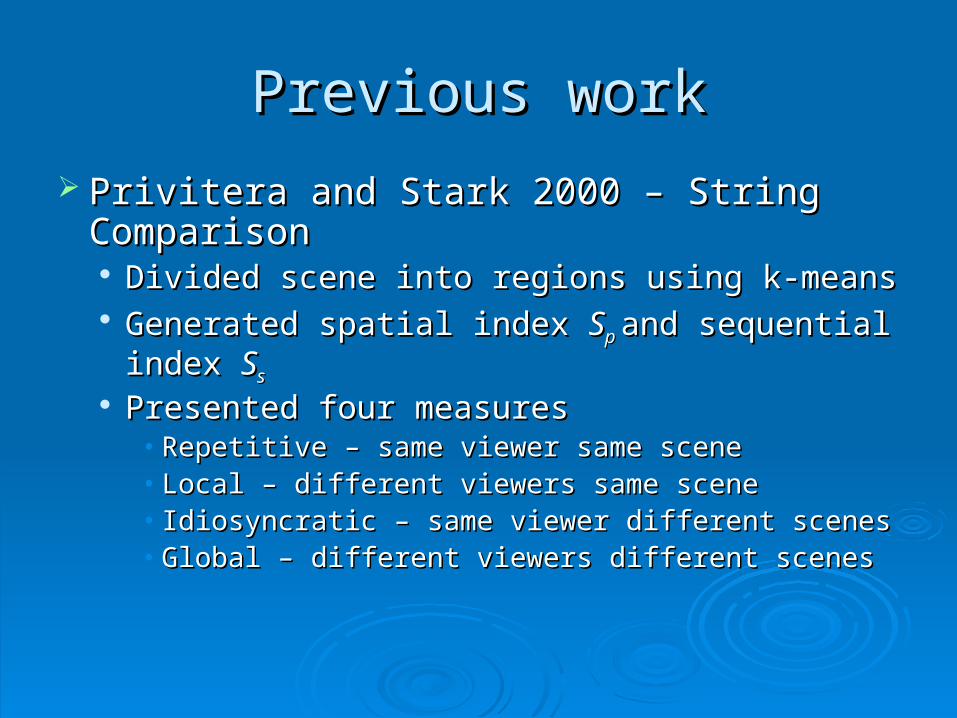
Privitera and Stark 2000 – String Privitera and Stark 2000 – String ComparisonComparison Divided scene into regions using k-meansDivided scene into regions using k-means Generated spatial index Generated spatial index SSp p and sequential and sequential
index index SSss
Presented four measuresPresented four measures• Repetitive – same viewer same sceneRepetitive – same viewer same scene• Local – different viewers same sceneLocal – different viewers same scene• Idiosyncratic – same viewer different scenesIdiosyncratic – same viewer different scenes• Global – different viewers different scenesGlobal – different viewers different scenes
Previous Work (cont.)Previous Work (cont.)
Problem – with k-means clustering user needs Problem – with k-means clustering user needs to predefine how many regions of interest to predefine how many regions of interest (ROI) should appear in a scene(ROI) should appear in a scene
Defeats the goal of being as automatic as Defeats the goal of being as automatic as possiblepossible
Previous Work (cont.)Previous Work (cont.)
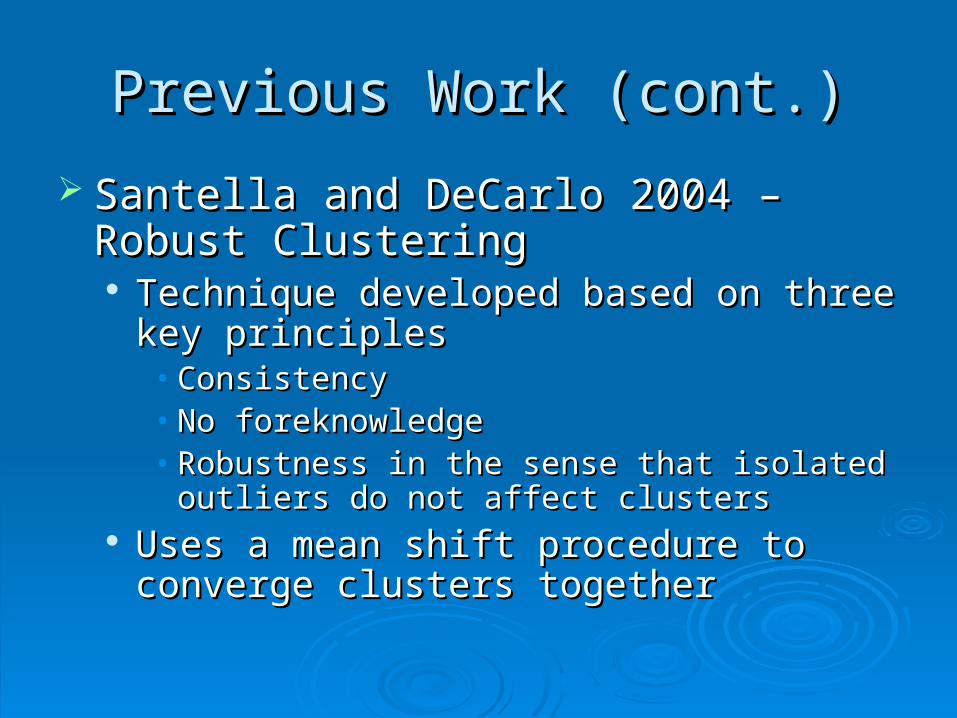
Santella and DeCarlo 2004 – Robust Santella and DeCarlo 2004 – Robust ClusteringClustering Technique developed based on three key Technique developed based on three key
principles principles • ConsistencyConsistency• No foreknowledgeNo foreknowledge• Robustness in the sense that isolated outliers do Robustness in the sense that isolated outliers do
not affect clusters not affect clusters Uses a mean shift procedure to converge Uses a mean shift procedure to converge
clusters togetherclusters together
MethodologyMethodology
Validate the implemented algorithmValidate the implemented algorithm Subjects instructed to view an intuitive Subjects instructed to view an intuitive
scene should produce high repetitive and scene should produce high repetitive and local measureslocal measures
Subjects viewing a complex scene with no Subjects viewing a complex scene with no instructions should display considerably instructions should display considerably lower measureslower measures
ApparatusApparatus
Tobii 1750Tobii 1750 Sever – AMD 64 Windows XPSever – AMD 64 Windows XP Client – AMD Opteron Fedora Core LinuxClient – AMD Opteron Fedora Core Linux Data Display & Collection – C++, OpenGLData Display & Collection – C++, OpenGL Data Analysis – C, OpenGLData Analysis – C, OpenGL
Experimental DesignExperimental Design
Six SubjectsSix Subjects All maleAll male Ages 21-42Ages 21-42
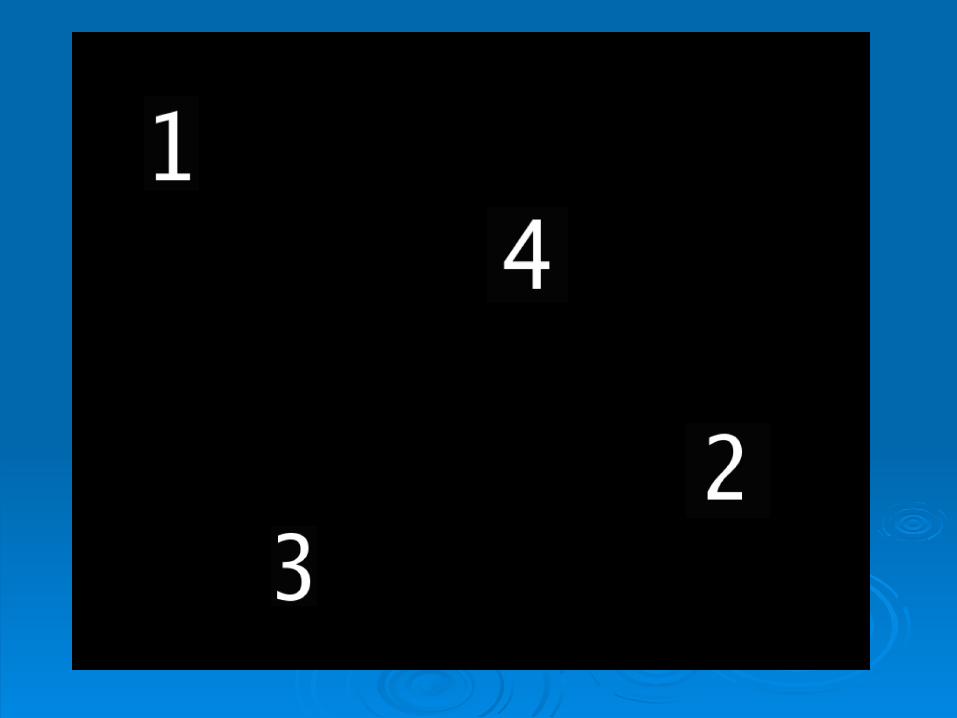
StimuliStimuli Three black screens with randomly placed Three black screens with randomly placed
digits 1-4digits 1-4 First screen repeated after thirdFirst screen repeated after third Computer generated (CG) imageComputer generated (CG) image
ProcedureProcedure
Subjects were calibrated before and after Subjects were calibrated before and after testing in order to account for slippagetesting in order to account for slippage
Subjects were instructed to look at each Subjects were instructed to look at each digitdigit
Subjects were informed that each digit Subjects were informed that each digit would appear for 500mswould appear for 500ms
Subjects were given no task for the CG Subjects were given no task for the CG imageimage
OperationOperation
Raw eye-gaze data (x, y, t) was recordedRaw eye-gaze data (x, y, t) was recorded Using simple velocity calculations Using simple velocity calculations
saccades were filtered out (v > 130saccades were filtered out (v > 130°/sec)°/sec)
dt
yyxxv tttt
21
21 )()(
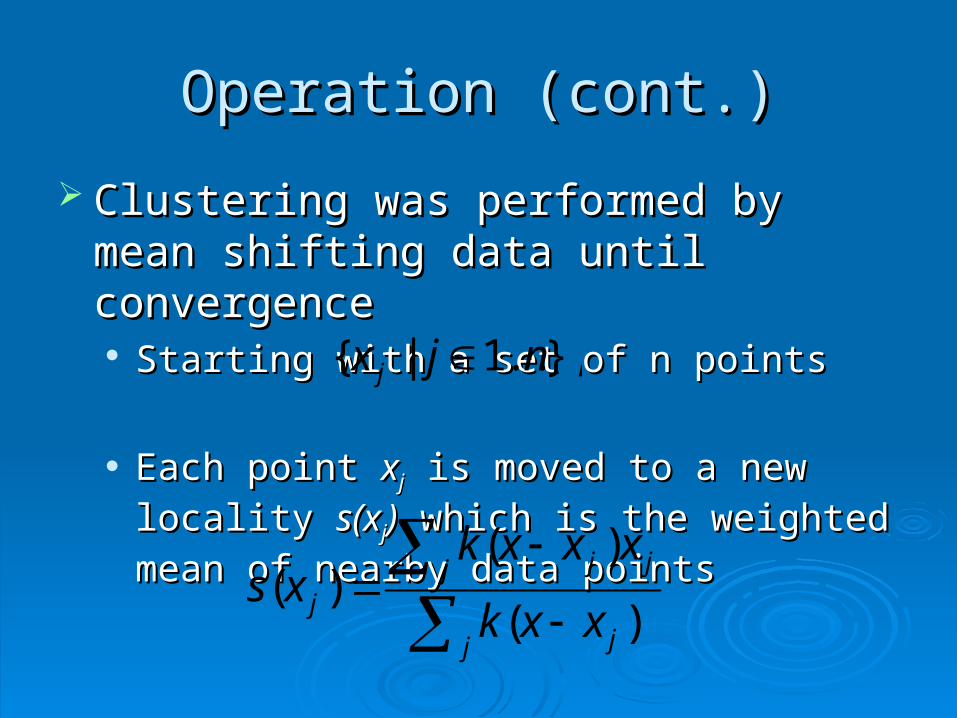
Operation (cont.)Operation (cont.)
Clustering was performed by mean shifting Clustering was performed by mean shifting data until convergencedata until convergence Starting with a set of n pointsStarting with a set of n points
Each point Each point xxjj is moved to a new locality is moved to a new locality s(xs(xjj))
which is the weighted mean of nearby data which is the weighted mean of nearby data points points
},..1|{ njx j
j j
j jj
j xxk
xxxkxs
)(
)()(
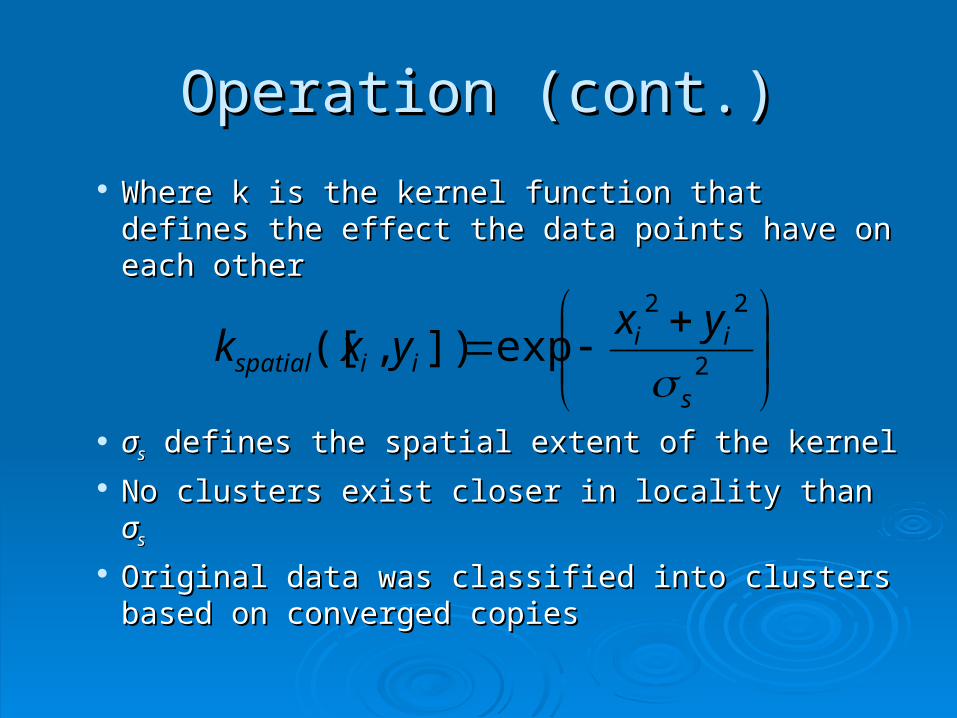
Operation (cont.)Operation (cont.)
Where k is the kernel function that defines the Where k is the kernel function that defines the effect the data points have on each othereffect the data points have on each other
σσss defines the spatial extent of the kernel defines the spatial extent of the kernel
No clusters exist closer in locality than No clusters exist closer in locality than σσss
Original data was classified into clusters Original data was classified into clusters based on converged copiesbased on converged copies
2
22
exp]),([s
iiiispatial
yxyxk
Mean ShiftMean Shift
Fixation Data
Outlier
Operation (cont.)Operation (cont.)
String based comparison was performedString based comparison was performed Each cluster was assigned a character (A-Z, 0-9, a-z)Each cluster was assigned a character (A-Z, 0-9, a-z) Viewers gaze data throughout clusters generated a stringViewers gaze data throughout clusters generated a string Considering string Considering string aa and and bb
• SSpp was computed by dividing the number of characters in both was computed by dividing the number of characters in both strings by the number of characters in strings by the number of characters in aa
• SSss was computed by dividing the number of characters in both was computed by dividing the number of characters in both strings by the Levenshtein distance between strings by the Levenshtein distance between a a and and bb and and subtracting from onesubtracting from one
• The Levenshtein distance between two strings strings is based on The Levenshtein distance between two strings strings is based on the cost of three operations: insertion, deletion, and substitution the cost of three operations: insertion, deletion, and substitution used two transform the second string (used two transform the second string (bb) into the first () into the first (aa) )
Only repetitive and local measures calculatedOnly repetitive and local measures calculated
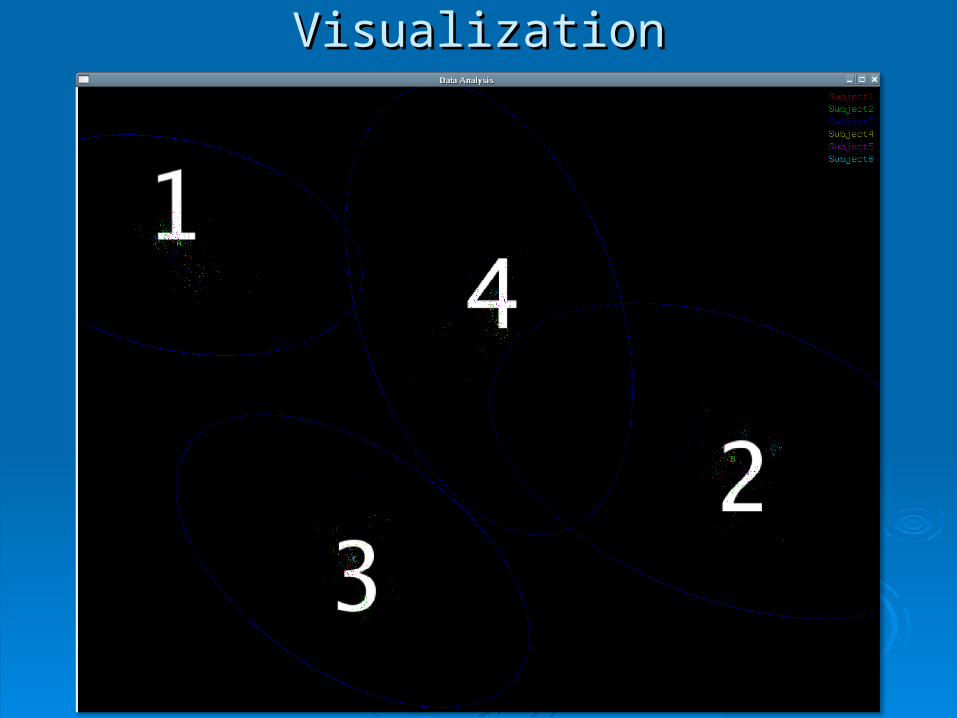
VisualizationVisualization
ResultsResults
Based on human’s parafoveal range (5Based on human’s parafoveal range (5°),°), σσss = 100 = 100
Sp Ss
numbers1 1.00 1.00
numbers2 1.00 0.88
numbers3 1.00 0.96
numbers1 (second run) 1.00 0.80
raytrace 0.83 0.43
Local results
Sp Ss
Subject1 1.00 0.75
Subject2 1.00 0.50
Subject3 1.00 0.50
Subject4 1.00 0.75
Subject5 1.00 0.25
Subject6 1.00 0.50
Repetitive results (numbers1)
Results (cont.)Results (cont.)
σσss = 70 and = 70 and σσss = 40 = 40
Sp Ss
numbers1 1.00 1.00
numbers2 1.00 0.68
numbers3 090 0.83
numbers1 (second run)
1.00 0.72
raytrace 0.82 0.32Local results
Sp Ss
numbers1 1.00 1.00
numbers2 0.90 0.57
numbers3 0.90 0.77
numbers1 (second run)
0.87 0.57
raytrace 0.53 0.24Local results
DiscussionDiscussion
Results verified hypothesisResults verified hypothesis Unchanged pattern with lower Unchanged pattern with lower σσss values values
Repetitive results did not reveal much Repetitive results did not reveal much because too little test databecause too little test data
Future WorkFuture Work
Port from C to C++Port from C to C++ Design a easy to use GUI interfaceDesign a easy to use GUI interface Add idiosyncratic measuresAdd idiosyncratic measures