24
A View on the Chemical and Chemical Distribution Market IMAP DB&S Corporate Finance August 2015
A View on the Chemical and Chemical Distribution Market
IMAP DB&S Corporate Finance August 2015


2 |
Introduction
The chemical industry is always in motion. Increasing consumption and innovation contribute to this, next to the fact that the industry is always searching for new products, materials and solutions due to scarcity of inputs.
This report reviews the trends and developments in the chemical and chemical distribution market. It should give a high-level insight in the global dynamics of the chemical and chemical distribution markets and its players.
The first chapter reviews the chemical landscape starting with an overview of global chemical production by region. Then we zoom in on the European market where we take a look at top chemical producing countries, market share, employment and types of chemicals that are produced. Finally, we take a closer look at the Dutch chemical market.
In the second chapter we focus on the chemical distribution market. Again, starting from a global perspective. The main topics are market size, growth drivers, trends and developments, the position of chemical distributors in the value chain and key industry players both internationally and in the Netherlands.
The chemical distribution market is highly fragmented where an estimated 10,000 distributors are serving end-users for their chemical needs. However, we see increasing levels of consolidation and record breaking levels of M&A activity in 2014. Chapter three is therefore devoted to global M&A activity in the chemical and chemical distribution market and why we observe increasing levels of M&A activity. Also, private equity firms are very active in acquiring and selling chemical distribution companies.
We believe the chemical (distribution) market in the Netherlands is a very attractive market since in the Netherlands the cooperation between chemical companies, universities and the government is very strong. Next to that, the geographical location of the Netherlands as a gateway into Europe, combined with the high levels of infrastructure and the attractive investment climate, will remain to attract investors.
IMAP DB&S
3 |
Table of Contents
1. Chemical market 4
• World
• Europe
• Netherlands
2. Chemical distribution market 8
• World
• Market leaders
• Netherlands
3. M&A activity 13
• Chemical companies
• Chemical distributors
• Private equity
4. IMAP DB&S 17
• Industry expertise
• About IMAP DB&S
• Contact information
4 |
1 Chemical market World
Europe
Netherlands
5 |
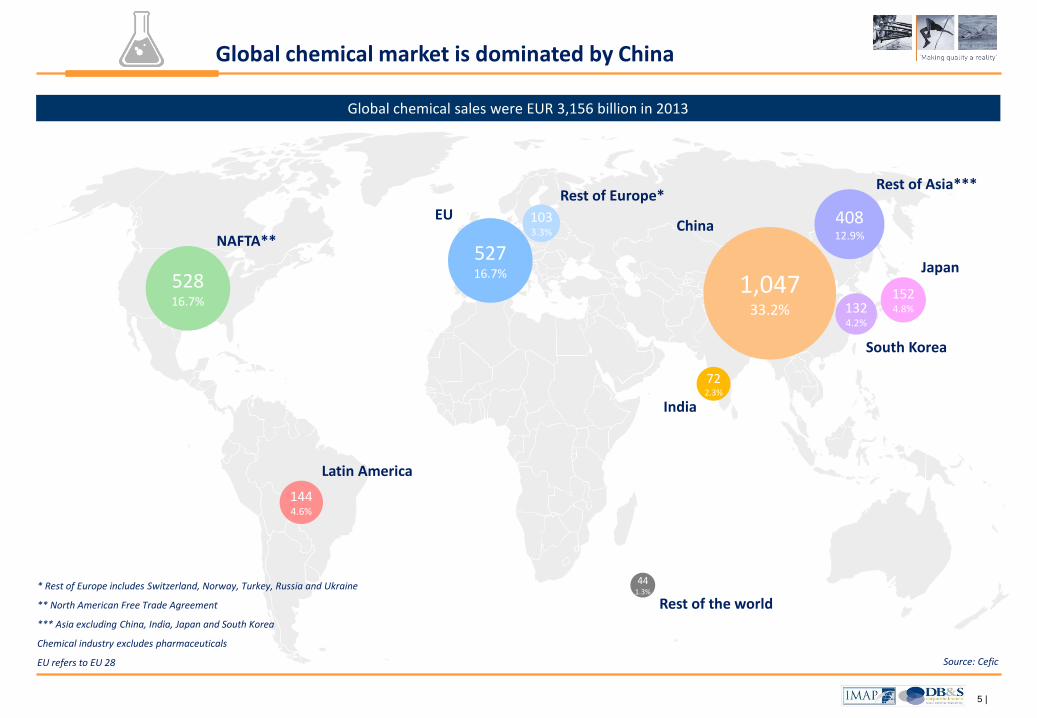
Global chemical market is dominated by China
Global chemical sales were EUR 3,156 billion in 2013
Source: Cefic
528 16.7%
527 16.7%
103 3.3%
144 4.6%
1,047 33.2%
408 12.9%
152 4.8% 132
4.2%
72 2.3%
44 1.3%
NAFTA**
Latin America
EU Rest of Europe*
Rest of the world
India
South Korea
Japan
China
Rest of Asia***
* Rest of Europe includes Switzerland, Norway, Turkey, Russia and Ukraine
** North American Free Trade Agreement
*** Asia excluding China, India, Japan and South Korea
Chemical industry excludes pharmaceuticals
EU refers to EU 28
6 |
-7.8%
0.6%
0.9%
1.3%
3.1%
-8% -4% 0% 4%
% change y-o-y
Polymers Consumer chemicals Specialties Basic inorganics Petrochemicals
27%
27%22%
14%
12%
0%
10%
20%
30%
40%
50%
60%
0
100
200
300
400
500
600
1993 1998 2003 2008 2013
EUR billion
EU chemical sales % of global chemical sales
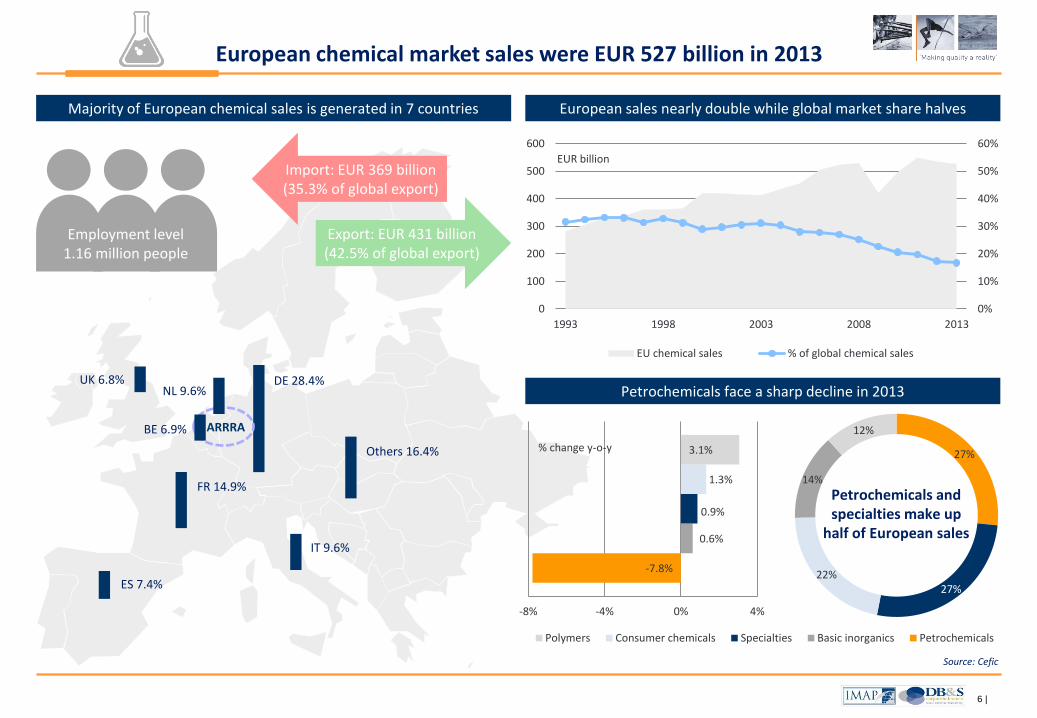
Others 16.4%
DE 28.4%
IT 9.6%
FR 14.9%
NL 9.6% UK 6.8%
ES 7.4%
BE 6.9%
European chemical market sales were EUR 527 billion in 2013
Majority of European chemical sales is generated in 7 countries European sales nearly double while global market share halves
Petrochemicals face a sharp decline in 2013
Export: EUR 431 billion (42.5% of global export)
Import: EUR 369 billion (35.3% of global export)
Employment level 1.16 million people
Source: Cefic
Petrochemicals and specialties make up
half of European sales
ARRRA
-7.8%
0.6%
0.9%
1.3%
3.1%
-8% -4% 0% 4%
% change y-o-y
Polymers Consumer chemicals Specialties Basic inorganics Petrochemicals
7 |
-60
-40
-20
0
20
40
60
80
2007 2008 2009 2010 2011 2012 2013 2014
EUR billion
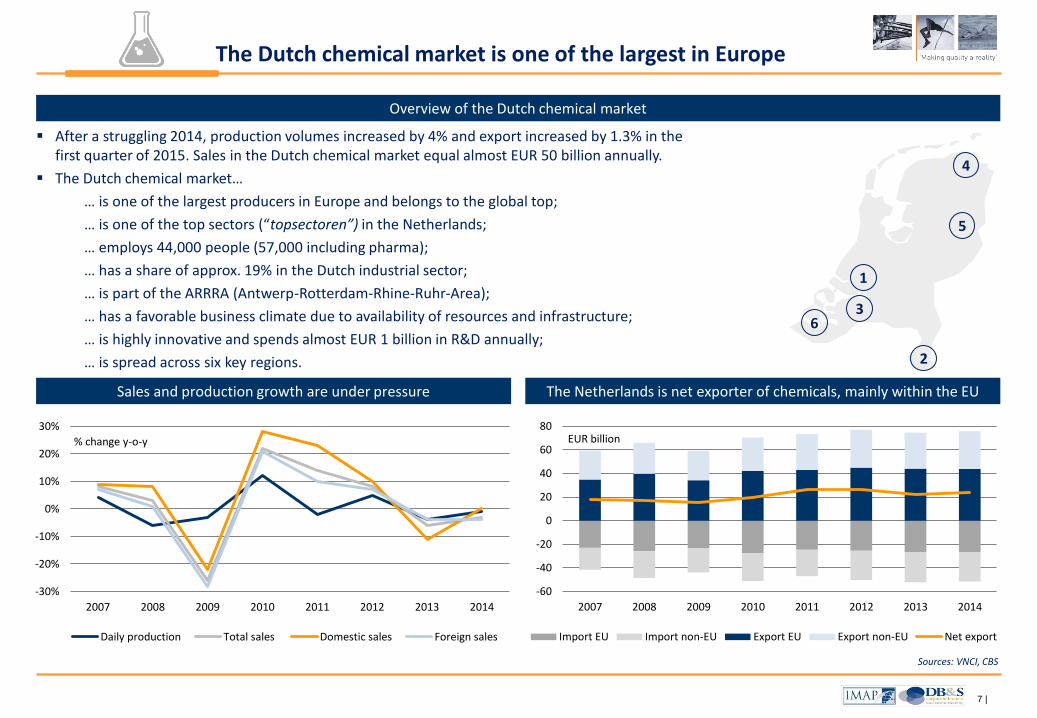
Import EU Import non-EU Export EU Export non-EU Net export
The Dutch chemical market is one of the largest in Europe
After a struggling 2014, production volumes increased by 4% and export increased by 1.3% in the first quarter of 2015. Sales in the Dutch chemical market equal almost EUR 50 billion annually.
The Dutch chemical market…
… is one of the largest producers in Europe and belongs to the global top;
… is one of the top sectors (“topsectoren”) in the Netherlands;
… employs 44,000 people (57,000 including pharma);
… has a share of approx. 19% in the Dutch industrial sector;
… is part of the ARRRA (Antwerp-Rotterdam-Rhine-Ruhr-Area);
… has a favorable business climate due to availability of resources and infrastructure;
… is highly innovative and spends almost EUR 1 billion in R&D annually;
… is spread across six key regions.
The Netherlands is net exporter of chemicals, mainly within the EU
Overview of the Dutch chemical market
1
2
3
5
4
Sources: VNCI, CBS
Sales and production growth are under pressure
-30%
-20%
-10%
0%
10%
20%
30%
2007 2008 2009 2010 2011 2012 2013 2014
% change y-o-y
Daily production Total sales Domestic sales Foreign sales
6
8 |
2 Chemical distribution market
World
Market leaders
Netherlands
9 |
0
50
100
150
200
250
2008 2009 2010 2011 2012 2013 2018
EUR billion
Currency effect*
Middle East and Africa
Central and Eastern Europe
Latin America
North America
Western Europe
Asia-Pacific
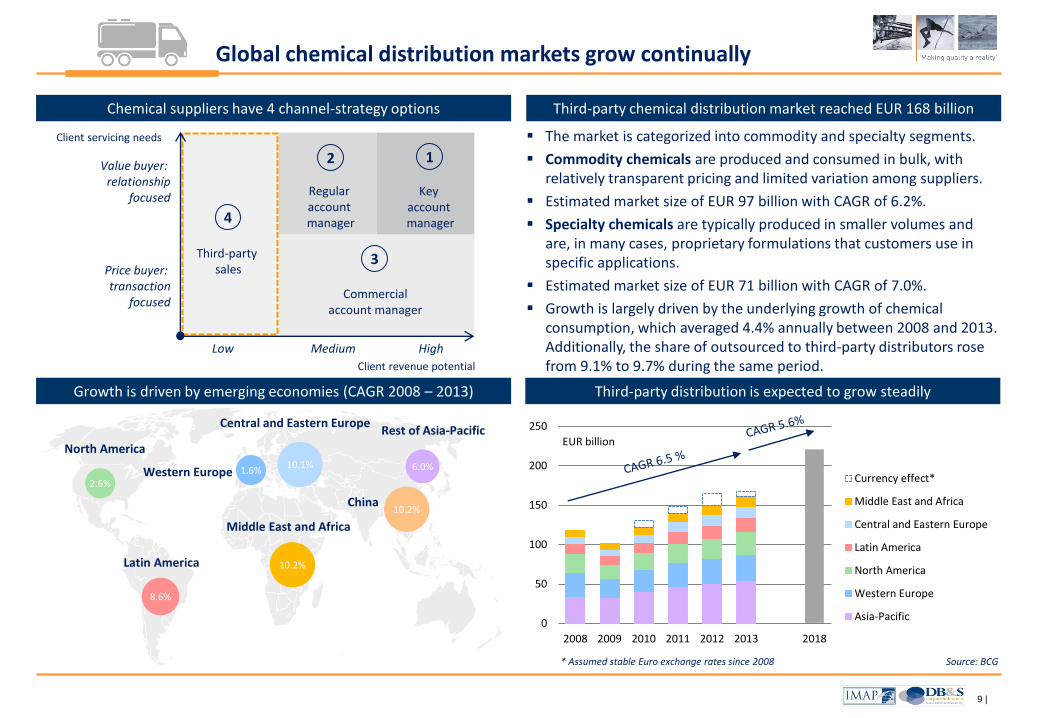
Global chemical distribution markets grow continually
The market is categorized into commodity and specialty segments.
Commodity chemicals are produced and consumed in bulk, with relatively transparent pricing and limited variation among suppliers.
Estimated market size of EUR 97 billion with CAGR of 6.2%.
Specialty chemicals are typically produced in smaller volumes and are, in many cases, proprietary formulations that customers use in specific applications.
Estimated market size of EUR 71 billion with CAGR of 7.0%.
Growth is largely driven by the underlying growth of chemical consumption, which averaged 4.4% annually between 2008 and 2013. Additionally, the share of outsourced to third-party distributors rose from 9.1% to 9.7% during the same period.
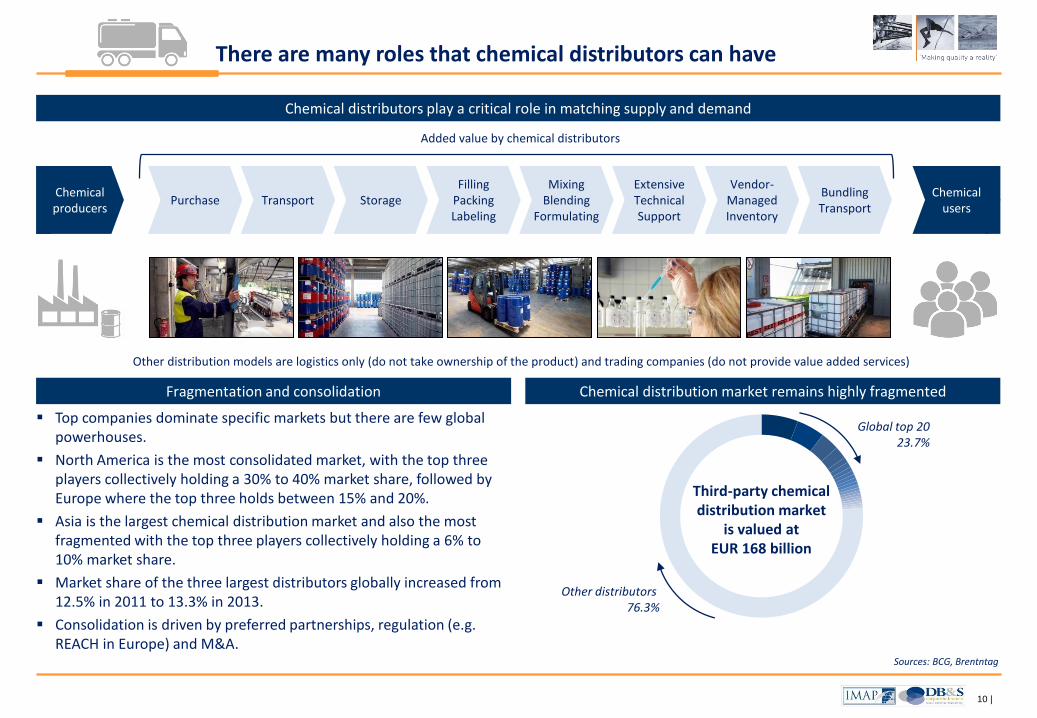
Third-party chemical distribution market reached EUR 168 billion
* Assumed stable Euro exchange rates since 2008 Source: BCG
2.6% 1.6%
10.1%
8.6%
10.2%
6.0%
10.2%
North America
Latin America
Western Europe
Central and Eastern Europe
Middle East and Africa
China
Rest of Asia-Pacific
Growth is driven by emerging economies (CAGR 2008 – 2013) Third-party distribution is expected to grow steadily
1 2
3
4
Third-party sales
Regular account manager
Key account manager
Commercial account manager
Low Medium High
Value buyer: relationship
focused
Price buyer: transaction
focused
Client revenue potential
Client servicing needs
Chemical suppliers have 4 channel-strategy options
10 |
There are many roles that chemical distributors can have
Top companies dominate specific markets but there are few global powerhouses.
North America is the most consolidated market, with the top three players collectively holding a 30% to 40% market share, followed by Europe where the top three holds between 15% and 20%.
Asia is the largest chemical distribution market and also the most fragmented with the top three players collectively holding a 6% to 10% market share.
Market share of the three largest distributors globally increased from 12.5% in 2011 to 13.3% in 2013.
Consolidation is driven by preferred partnerships, regulation (e.g. REACH in Europe) and M&A.
Chemical producers
Purchase Transport Storage Filling
Packing Labeling
Mixing Blending
Formulating
Extensive Technical Support
Vendor-Managed Inventory
Bundling Transport
Chemical users
Added value by chemical distributors
Chemical distributors play a critical role in matching supply and demand
Fragmentation and consolidation Chemical distribution market remains highly fragmented
Other distribution models are logistics only (do not take ownership of the product) and trading companies (do not provide value added services)
Sources: BCG, Brentntag
Third-party chemical distribution market
is valued at EUR 168 billion
Other distributors 76.3%
Global top 20 23.7%
11 |
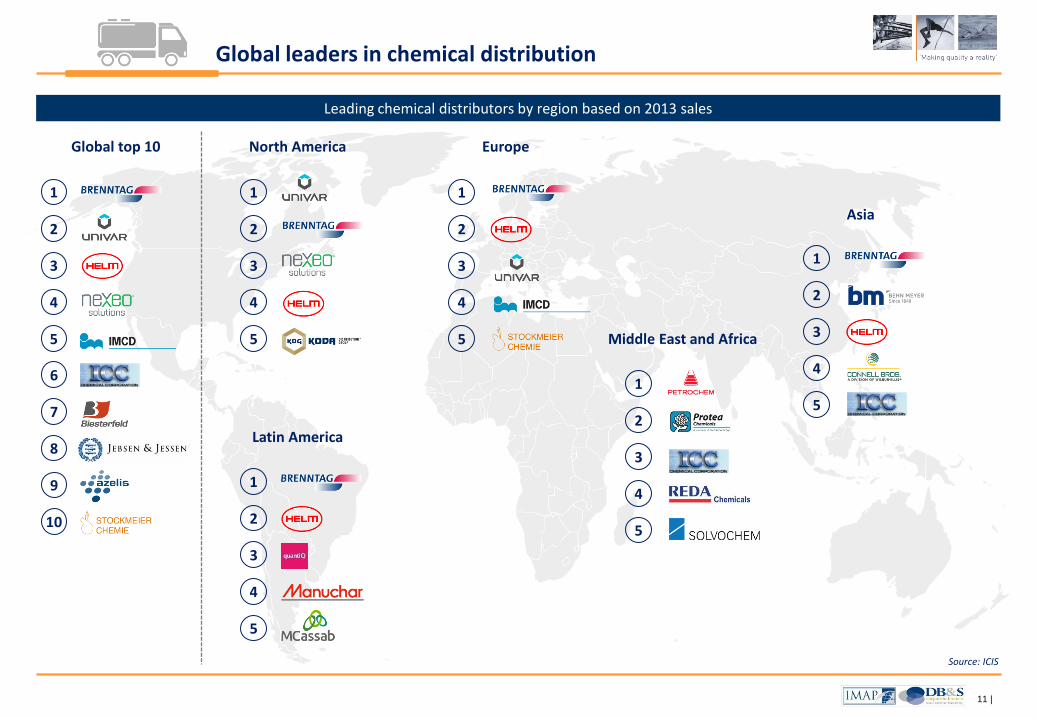
Leading chemical distributors by region based on 2013 sales
Global leaders in chemical distribution
1
2
3
5
4
Europe
1
2
3
5
4
North America
1
2
3
5
4
Asia
1
2
3
5
4
Middle East and Africa
1
2
3
5
4
Latin America
Source: ICIS
1
2
3
5
4
Global top 10
6
7
8
10
9
12 |
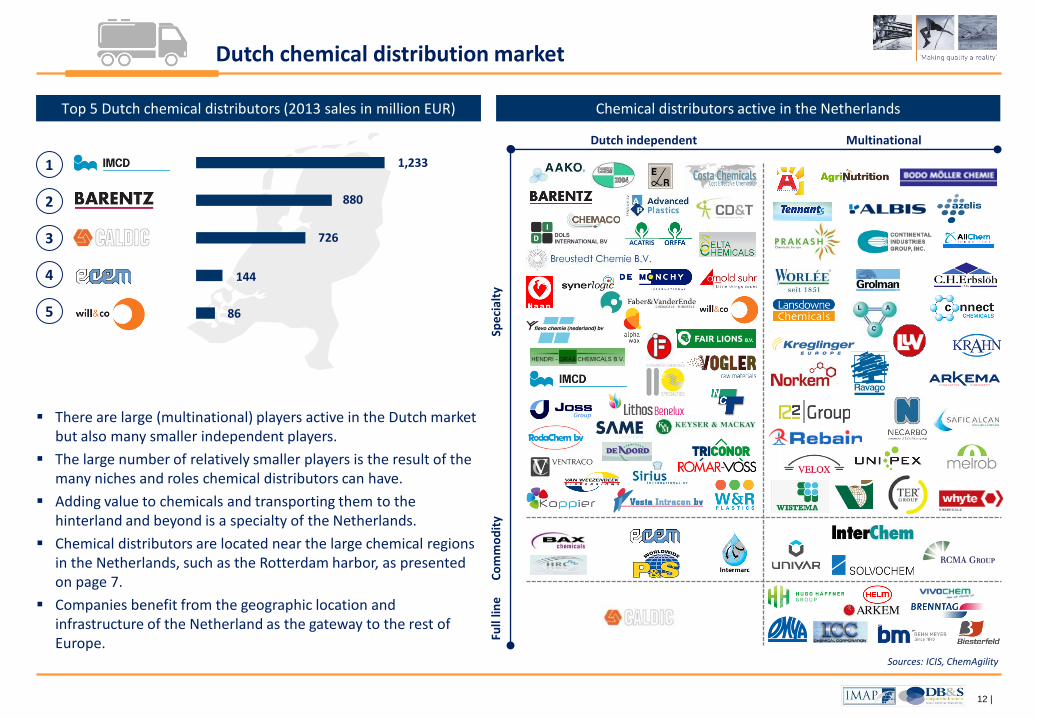
Dutch chemical distribution market
Sources: ICIS, ChemAgility
1
2
3
5
4
Dutch independent Multinational
Spe
cial
ty
Co
mm
od
ity
Full
line
1,233
880
726
144
86
Chemical distributors active in the Netherlands Top 5 Dutch chemical distributors (2013 sales in million EUR)
There are large (multinational) players active in the Dutch market but also many smaller independent players.
The large number of relatively smaller players is the result of the many niches and roles chemical distributors can have.
Adding value to chemicals and transporting them to the hinterland and beyond is a specialty of the Netherlands.
Chemical distributors are located near the large chemical regions in the Netherlands, such as the Rotterdam harbor, as presented on page 7.
Companies benefit from the geographic location and infrastructure of the Netherland as the gateway to the rest of Europe.

13 |
3 M&A activity
Chemical companies
Chemical distributors
Private equity
14 |
0
200
400
600
800
0
20
40
60
80
2009 2010 2011 2012 2013 2014
EUR billion
Deal value Number of transactions
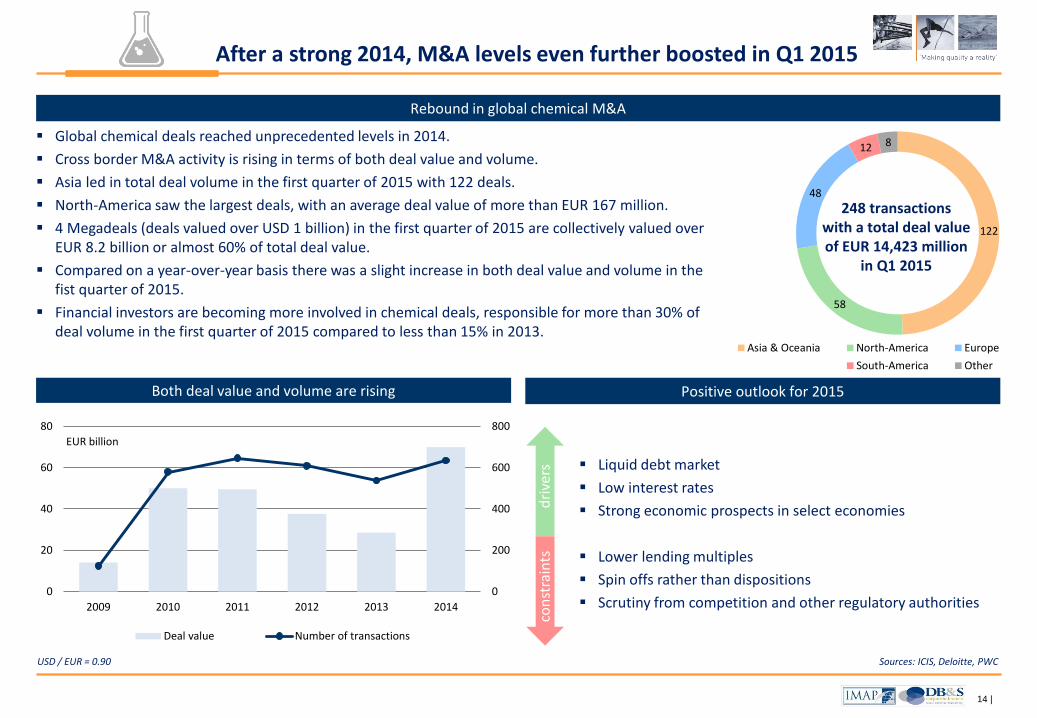
After a strong 2014, M&A levels even further boosted in Q1 2015
Positive outlook for 2015
Rebound in global chemical M&A
Sources: ICIS, Deloitte, PWC
Both deal value and volume are rising
Global chemical deals reached unprecedented levels in 2014.
Cross border M&A activity is rising in terms of both deal value and volume.
Asia led in total deal volume in the first quarter of 2015 with 122 deals.
North-America saw the largest deals, with an average deal value of more than EUR 167 million.
4 Megadeals (deals valued over USD 1 billion) in the first quarter of 2015 are collectively valued over EUR 8.2 billion or almost 60% of total deal value.
Compared on a year-over-year basis there was a slight increase in both deal value and volume in the fist quarter of 2015.
Financial investors are becoming more involved in chemical deals, responsible for more than 30% of deal volume in the first quarter of 2015 compared to less than 15% in 2013.
122
58
48
12 8
Asia & Oceania North-America Europe South-America Other
248 transactions with a total deal value of EUR 14,423 million
in Q1 2015
122
58
48
12 8
Asia & Oceania North-America Europe South-America Other
122
58
48
12 8
Asia & Oceania North-America Europe South-America Other
dri
vers
co
nst
rain
ts
Liquid debt market
Low interest rates
Strong economic prospects in select economies
Lower lending multiples
Spin offs rather than dispositions
Scrutiny from competition and other regulatory authorities
USD / EUR = 0.90

15 |
New geographies
40%
Consoli -dation (in existing
geography)23%
Additional applications
21%
Financial14%
Joint venture
2% <100M18%
101 - 250M9%
251 - 500M12%
501 -1,000M
20%
>1,000M41%
0
10
20
30
40
50
60
2009 2010 2011 2012 2013 2014
Number of transactions
The chemical distribution market shows a strong increase in M&A
Upwards trend of M&A activity
M&A will be a decisive part of chemical distributor’s growth ambitions
Sources: ICIS, Deloitte, PWC , FECC
Main reason for M&A is to enter new geographies
Despite ongoing consolidation, the chemical distribution market remains extraordinarily fragmented.
The market is characterized by a diverse set of players and a wide range of capabilities.
Consolidation is needed since companies need to enhance their value proposition to customers with products, capabilities and scale, leading to opportunities abound for companies with strategic and global expansion plans.
Nexeo’s M&A strategy is, for instance, aimed at a strong strategic fit the with target whereas Brenntag continues to make mid-sized acquisitions with high synergy potential globally.
China and the rest of Asia, as well as other emerging markets become more attractive as the distribution model is evolving from slightly transactional to value-added.
Companies like IMCD and Brenntag, for example, made 14 and 11 acquisitions respectively in emerging markets from 2008 to 2013.
“The industry needs to consolidate” David Bradley, CEO Nexeo Solutions
“We see ourselves as a consolidator” Steve Holland, CEO Brenntag
Reason for transaction (2013 – 2014) Deal size (2013 – 2014, EUR)
16 |
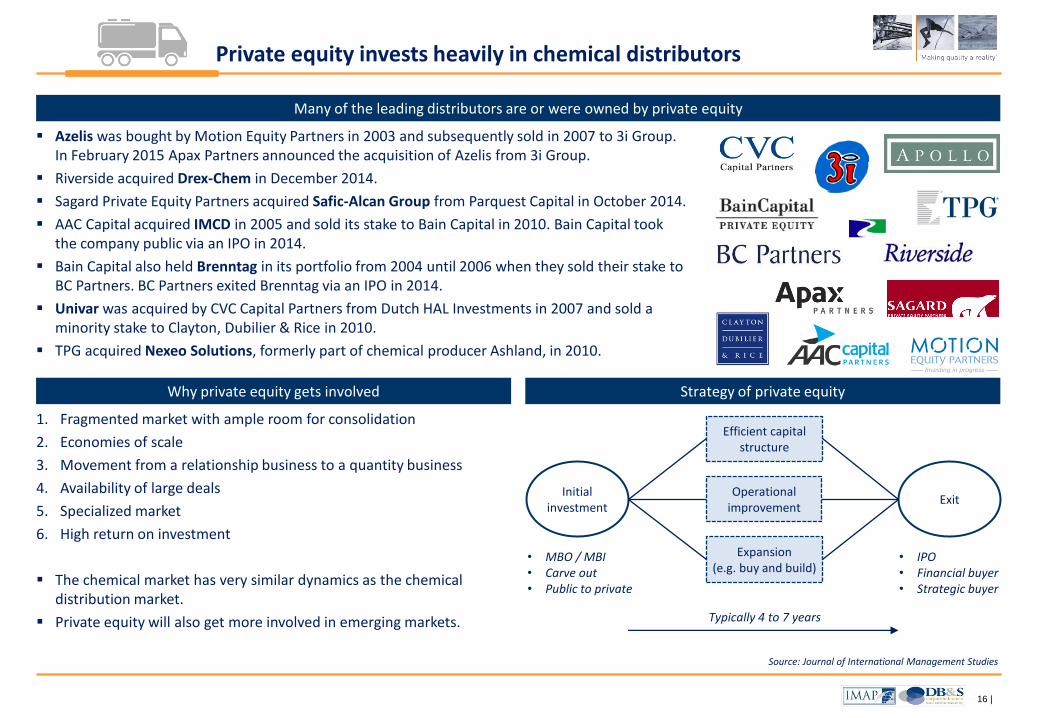
Private equity invests heavily in chemical distributors
Strategy of private equity
Many of the leading distributors are or were owned by private equity
Source: Journal of International Management Studies
Why private equity gets involved
Azelis was bought by Motion Equity Partners in 2003 and subsequently sold in 2007 to 3i Group. In February 2015 Apax Partners announced the acquisition of Azelis from 3i Group.
Riverside acquired Drex-Chem in December 2014.
Sagard Private Equity Partners acquired Safic-Alcan Group from Parquest Capital in October 2014.
AAC Capital acquired IMCD in 2005 and sold its stake to Bain Capital in 2010. Bain Capital took the company public via an IPO in 2014.
Bain Capital also held Brenntag in its portfolio from 2004 until 2006 when they sold their stake to BC Partners. BC Partners exited Brenntag via an IPO in 2014.
Univar was acquired by CVC Capital Partners from Dutch HAL Investments in 2007 and sold a minority stake to Clayton, Dubilier & Rice in 2010.
TPG acquired Nexeo Solutions, formerly part of chemical producer Ashland, in 2010.
1. Fragmented market with ample room for consolidation
2. Economies of scale
3. Movement from a relationship business to a quantity business
4. Availability of large deals
5. Specialized market
6. High return on investment
The chemical market has very similar dynamics as the chemical distribution market.
Private equity will also get more involved in emerging markets.
Initial investment
Exit
• IPO • Financial buyer • Strategic buyer
Typically 4 to 7 years
• MBO / MBI • Carve out • Public to private
Expansion (e.g. buy and build)
Operational improvement
Efficient capital structure
17 |
4 IMAP DB&S Industry expertise
About IMAP DB&S
Contact information
18 |
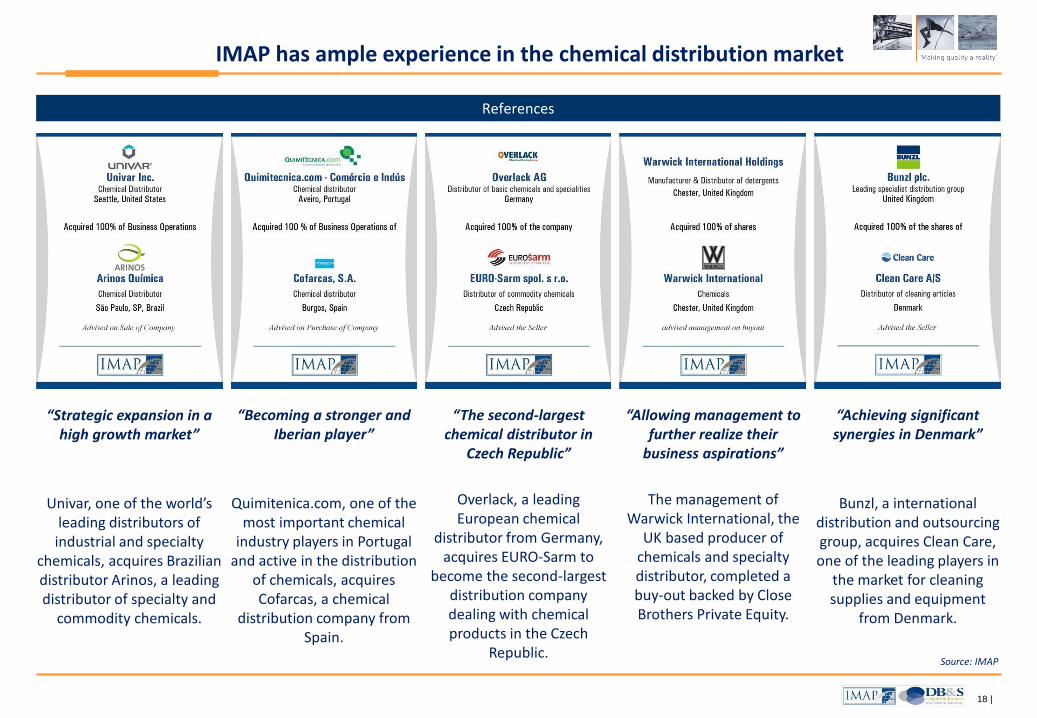
IMAP has ample experience in the chemical distribution market
References
“Strategic expansion in a high growth market”
Univar, one of the world’s leading distributors of industrial and specialty
chemicals, acquires Brazilian distributor Arinos, a leading distributor of specialty and
commodity chemicals.
“Becoming a stronger and Iberian player”
Quimitenica.com, one of the most important chemical
industry players in Portugal and active in the distribution
of chemicals, acquires Cofarcas, a chemical
distribution company from Spain.
“Allowing management to further realize their
business aspirations”
The management of Warwick International, the
UK based producer of chemicals and specialty distributor, completed a buy-out backed by Close Brothers Private Equity.
“The second-largest chemical distributor in
Czech Republic”
Overlack, a leading European chemical
distributor from Germany, acquires EURO-Sarm to
become the second-largest distribution company dealing with chemical products in the Czech
Republic.
“Achieving significant synergies in Denmark”
Bunzl, a international distribution and outsourcing group, acquires Clean Care, one of the leading players in
the market for cleaning supplies and equipment
from Denmark.
Source: IMAP
19 |
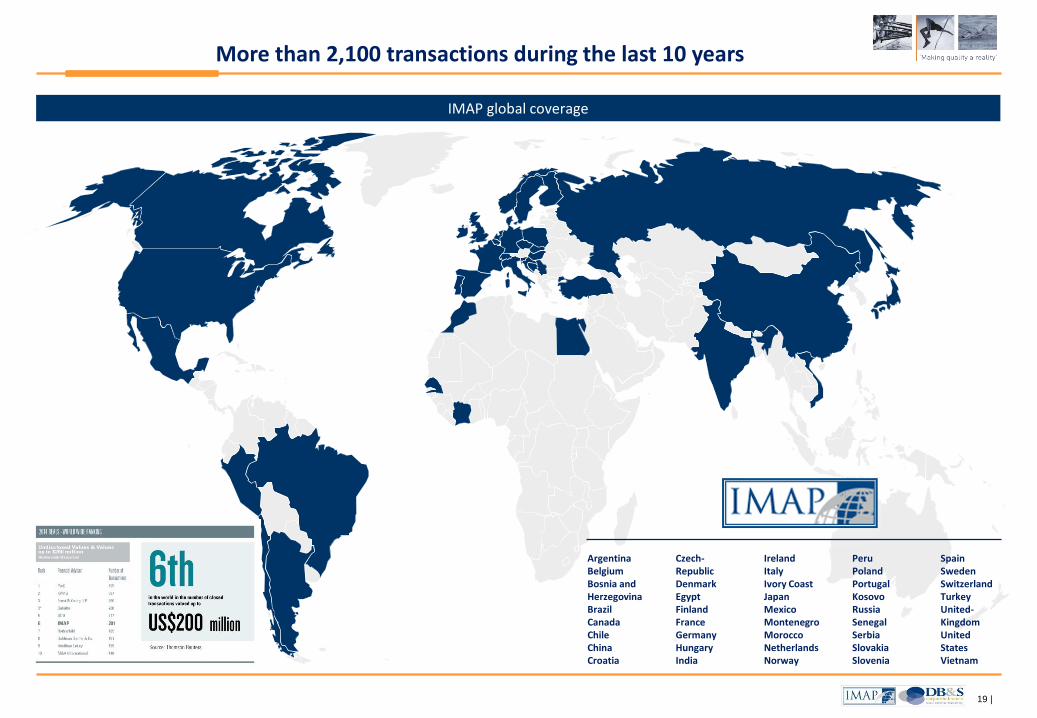
More than 2,100 transactions during the last 10 years
IMAP global coverage
Argentina Belgium Bosnia and Herzegovina Brazil Canada Chile China Croatia
Czech- Republic Denmark Egypt Finland France Germany Hungary India
Ireland Italy Ivory Coast Japan Mexico Montenegro Morocco Netherlands Norway
Peru Poland Portugal Kosovo Russia Senegal Serbia Slovakia Slovenia
Spain Sweden Switzerland Turkey United- Kingdom United States Vietnam
20 |
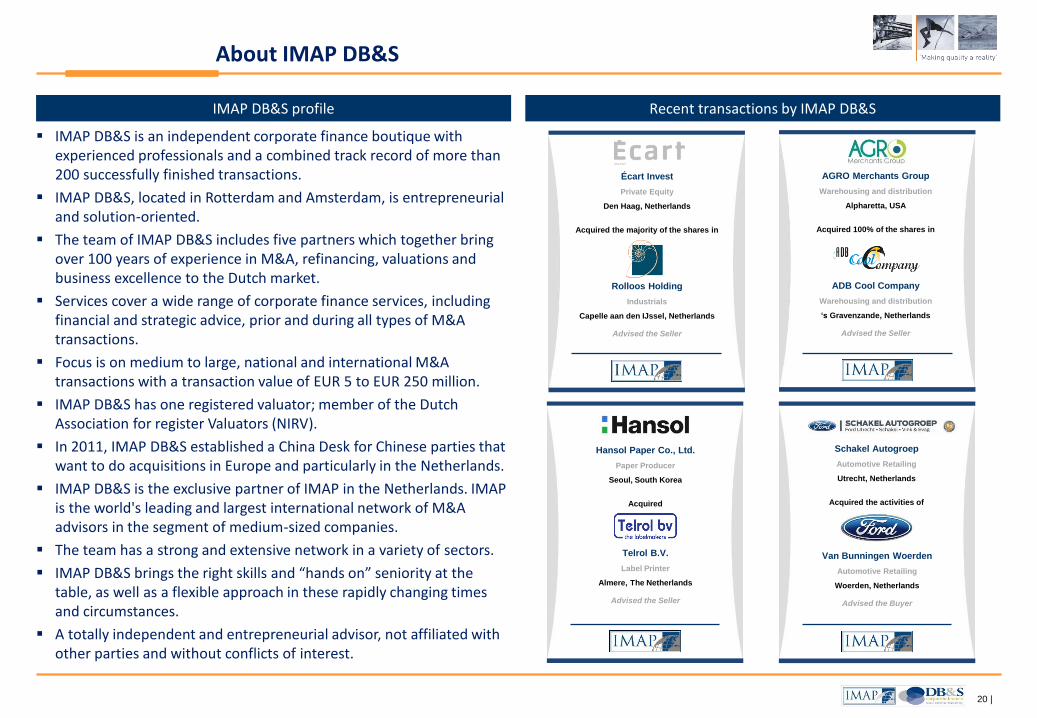
Recent transactions by IMAP DB&S IMAP DB&S profile
IMAP DB&S is an independent corporate finance boutique with experienced professionals and a combined track record of more than 200 successfully finished transactions.
IMAP DB&S, located in Rotterdam and Amsterdam, is entrepreneurial and solution-oriented.
The team of IMAP DB&S includes five partners which together bring over 100 years of experience in M&A, refinancing, valuations and business excellence to the Dutch market.
Services cover a wide range of corporate finance services, including financial and strategic advice, prior and during all types of M&A transactions.
Focus is on medium to large, national and international M&A transactions with a transaction value of EUR 5 to EUR 250 million.
IMAP DB&S has one registered valuator; member of the Dutch Association for register Valuators (NIRV).
In 2011, IMAP DB&S established a China Desk for Chinese parties that want to do acquisitions in Europe and particularly in the Netherlands.
IMAP DB&S is the exclusive partner of IMAP in the Netherlands. IMAP is the world's leading and largest international network of M&A advisors in the segment of medium-sized companies.
The team has a strong and extensive network in a variety of sectors.
IMAP DB&S brings the right skills and “hands on” seniority at the table, as well as a flexible approach in these rapidly changing times and circumstances.
A totally independent and entrepreneurial advisor, not affiliated with other parties and without conflicts of interest.
About IMAP DB&S
AGRO Merchants Group
Warehousing and distribution
Alpharetta, USA
Acquired 100% of the shares in
ADB Cool Company
Warehousing and distribution
‘s Gravenzande, Netherlands
Advised the Seller
Écart Invest
Private Equity
Den Haag, Netherlands
Acquired the majority of the shares in
Rolloos Holding
Industrials
Capelle aan den IJssel, Netherlands
Advised the Seller
Hansol Paper Co., Ltd.
Paper Producer
Seoul, South Korea
Acquired
Telrol B.V.
Label Printer
Almere, The Netherlands
Advised the Seller
Van Bunningen Woerden
Automotive Retailing
Woerden, Netherlands
Advised the Buyer
Schakel Autogroep
Automotive Retailing
Utrecht, Netherlands
Acquired the activities of
21 |
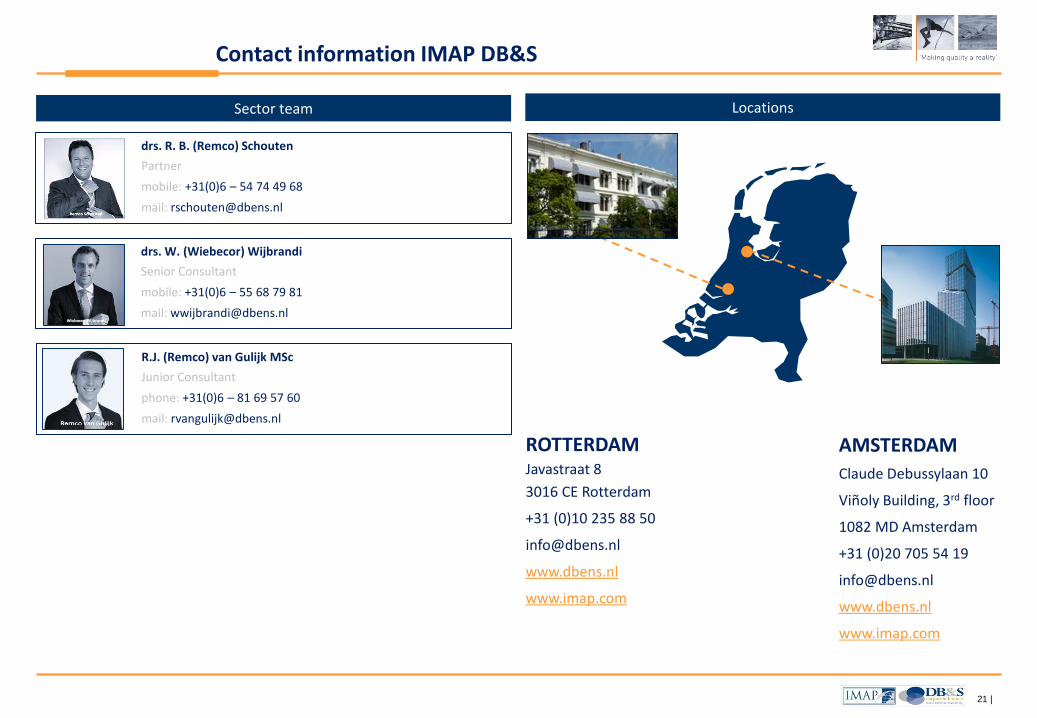
Locations Sector team
Contact information IMAP DB&S
ROTTERDAM Javastraat 8
3016 CE Rotterdam
+31 (0)10 235 88 50
www.dbens.nl
www.imap.com
AMSTERDAM
Claude Debussylaan 10
Viñoly Building, 3rd floor
1082 MD Amsterdam
+31 (0)20 705 54 19
www.dbens.nl
www.imap.com
drs. R. B. (Remco) Schouten
Partner
mobile: +31(0)6 – 54 74 49 68
mail: [email protected]
drs. W. (Wiebecor) Wijbrandi
Senior Consultant
mobile: +31(0)6 – 55 68 79 81
mail: [email protected]
R.J. (Remco) van Gulijk MSc
Junior Consultant
phone: +31(0)6 – 81 69 57 60
mail: [email protected]
Disclaimer
This report was prepared by DB & S B.V. (trading under IMAP DB&S, “IMAP”). This report is incomplete without reference to IMAP. The report is proprietary to IMAP and may not be disclosed to any third party or used for any other purpose without prior written consent of IMAP.
The information in this report reflects prevailing conditions and our views as of this date, which are accordingly subject to change. In preparing this report, we have relied upon and assumed, without independent verification, the accuracy and completeness of all the information available from public sources.


![Chemical Hazard Communication Program Templatera.nch.com/.../general/Chemical_Hazcom_Program_Temp… · Web view[Company] Chemical Hazard Communication Program. Template Chemical](https://static.documents.pub/doc/80x56/5aa259fe7f8b9aa0108d1ad2/chemical-hazard-communication-program-web-viewcompany-chemical-hazard-communication.jpg)


