107
Grid Vision 2040 A vision for Tasmania’s transmission network

Grid Vision 2040
A vision for Tasmania’s transmission network

Transend’s Grid Vision 2040 July 2011 A vision for Tasmania’s transmission network
Page 2
COMPANY INFORMATION
Transend Networks Pty Ltd
Registered office: 1–7 Maria Street, Lenah Valley, Tasmania 7008
Postal address: PO Box 606, Moonah, Tasmania 7009
Telephone: 1300 361 811
Email: [email protected]
Overseas callers: +61 3 6274 3849
Internet: www.transend.com.au
Facsimile: +61 3 6274 3872
CONTACT
This document is the responsibility of the Strategic Grid Planning department, Transend Networks
Pty Ltd, ABN 57 082 586 892
PUBLICATION DATE
July 2011
DOCUMENT CONTROL
Version 1
Version 2: Produced in June 2012 with Figures 24 and 47 changed for consistency to show the new
Waddamana-Lindisfarne 220 kV line commissioned in 2011 and Figures 25 and 60 changed to
show opportunities to maximise decommissioning of old 110 kV lines in the Southern region.
This document has been prepared for the purpose of providing a long-term view of potential
transmission network developments in Tasmania.
This document is not intended to be used as the basis for any investment decisions. Parties should
make their own assessments and enquiries as to the accuracy, reliability and suitability of the
information contained herein for their purpose. In addition to that, Transend recommends that any
party intending to make a decision based on information contained in this document or assumptions
drawn from it contact Transend in advance of making any such decision.
While care has been taken in the preparation of this document Transend, its advisors and
consultants make no warranty as to the accuracy, reliability or completeness of the material
contained herein and accept no liability (including as a result of negligence or negligent
misstatement) for any loss or damage that may be incurred by any person relying on the information
contained in this document or assumptions drawn from it, except to the extent that liability under
any applicable statute cannot be excluded.
© Transend Networks Pty Ltd 2011. No part of this document which is not already in the public
domain may be reproduced or transmitted in any form or by any means without the prior written
consent of Transend.

Transend’s Grid Vision 2040 July 2011 Table of contents
Page 3
Table of contents
Message from the Chief Executive Officer ................................................................................... 9
Executive summary ..................................................................................................................... 10
1 Introduction to Grid Vision 2040 ...................................................................................... 15
1.1 Background ............................................................................................................ 15
1.2 The need for change ............................................................................................... 15
1.3 The reasons for Grid Vision 2040 ........................................................................... 16
1.4 Next steps............................................................................................................... 17
2 Sustainability considerations ............................................................................................. 18
3 Strategic environment and scenario planning approach .................................................. 20
4 Creating the smart transmission grid of the future .......................................................... 21
4.1 Impact of electric vehicles ...................................................................................... 22
5 Future generation planning in Tasmania .......................................................................... 24
5.1 Introduction ............................................................................................................ 24
5.2 Existing electricity supply in Tasmania .................................................................. 24
5.3 Hydro generation .................................................................................................... 26
5.4 Gas generation........................................................................................................ 27
5.5 Wind generation ..................................................................................................... 27
5.6 Geothermal energy ................................................................................................. 32
5.6.1 Hydrothermal systems ............................................................................................ 32
5.6.2 Hot rock systems .................................................................................................... 32
5.7 Biomass energy ...................................................................................................... 34
5.7.1 Waste energy .......................................................................................................... 35
5.8 Wave power ........................................................................................................... 35
5.9 Ocean currents........................................................................................................ 36
5.10 Solar power ............................................................................................................ 37
5.11 Future electricity supply in Tasmania ..................................................................... 38
6 Future of main 220 and 110 kV corridors ......................................................................... 41
6.1 Introduction ............................................................................................................ 41
6.2 Utilising the existing 220 kV and 110 kV corridors ................................................ 41
6.3 Asset condition assessment of existing 220 kV and 110 kV lines ............................ 43

Transend’s Grid Vision 2040 July 2011 Table of contents
Page 4
6.4 Alternative conductors............................................................................................ 44
6.5 Market constraints in existing 220 kV corridors ...................................................... 45
6.6 Farrell–Burnie–Sheffield–Farrell 220 kV triangle ................................................... 46
6.7 Palmerston–Sheffield–George Town–Palmerston 220 kV triangle .......................... 47
6.8 Palmerston–Waddamana 220 kV corridor............................................................... 49
6.9 Future supply for the greater Hobart area ................................................................ 50
6.10 Project details ......................................................................................................... 52
6.10.1 Overall budgetary cost ............................................................................................ 52
7 Rationale for a second Bass Strait DC link ....................................................................... 54
7.1 Introduction ............................................................................................................ 54
7.2 The existing Basslink interconnector ...................................................................... 54
7.3 Main drivers for a second DC interconnector .......................................................... 54
7.4 Current source converter vs voltage source converter technologies ......................... 55
7.5 Development options for a second Bass Strait DC link ........................................... 56
7.6 Merchant or regulated link ...................................................................................... 59
8 North-west and west coast region ...................................................................................... 60
8.1 Introduction ............................................................................................................ 60
8.2 Existing transmission system arrangement .............................................................. 60
8.3 Main issues and drivers for development in north-west ........................................... 61
8.3.1 Security of supply and load growth management in Devonport ............................... 61
8.3.2 Security of supply and load growth management in Burnie..................................... 62
8.3.3 Voltage stability and voltage collapse management in the north-west ..................... 64
8.4 Existing transmission system arrangement on the west coast .................................. 64
8.5 Main issues and drivers for development on the west coast ..................................... 65
8.5.1 Security of supply to Rosebery and Queenstown .................................................... 66
8.5.2 Voltage stability and voltage collapse management ................................................ 68
8.6 Project details ......................................................................................................... 69
8.6.1 Overall budgetary cost ............................................................................................ 69
9 North and north-east region .............................................................................................. 70
9.1 Introduction ............................................................................................................ 70
9.2 The existing transmission system arrangement in the north and north-east .............. 70
9.3 Main issues and drivers for development ................................................................ 71
9.4 Load growth management in Launceston ................................................................ 71
9.5 Security of supply to the greater Launceston area ................................................... 71
Transend’s Grid Vision 2040 July 2011 Table of contents
Page 5
9.5.1 New 220/110 kV injection point into Launceston ................................................... 71
9.6 Security of supply to the north-east......................................................................... 72
9.6.1 Scottsdale–Derby and Avoca–St Marys supply arrangement................................... 72
9.7 Load growth in the Midlands area .......................................................................... 74
9.7.1 Proposed Tunbridge Substation .............................................................................. 74
9.8 Security of supply to George Town ........................................................................ 74
9.8.1 George Town area .................................................................................................. 74
9.9 Voltage stability and voltage collapse management in the north.............................. 76
9.9.1 Steady state and dynamic reactive support required ................................................ 76
9.10 Project details ......................................................................................................... 78
9.10.1 Overall budgetary cost ............................................................................................ 78
10 South and east coast region ............................................................................................... 80
10.1 Introduction ............................................................................................................ 80
10.2 The existing transmission system arrangement in the south and east coast .............. 80
10.3 Main issues and drivers for development ................................................................ 81
10.4 Voltage stability and voltage collapse management in the greater Hobart
area ........................................................................................................................ 82
10.4.1 Steady state and dynamic reactive support required ................................................ 82
10.5 Security of supply to Hobart ................................................................................... 84
10.5.1 Proposed 220 kV loop Lindisfarne–Risdon–Chapel Street ...................................... 84
10.6 Load growth management in Hobart ....................................................................... 85
10.6.1 Existing Hobart 110/33 kV injection points and 33 kV subtransmission
network .................................................................................................................. 85
10.6.2 Future new 110/33 kV injection points and 33 kV subtransmission
network .................................................................................................................. 86
10.7 Security of supply to the eastern shore and load growth management at
Sorell...................................................................................................................... 87
10.7.1 Proposed 110 kV link between Sorell and Mornington substations ......................... 87
10.7.2 Conversion of Richmond Substation to 110/22 kV or 33/11 kV .............................. 88
10.7.3 Dunalley, Triabunna and east coast supply ............................................................. 89
10.8 Security of supply and load growth management in Kingborough area ................... 89
10.9 Security of supply to the upper Derwent and load growth management at
Bridgewater ............................................................................................................ 91
10.9.1 New Norfolk–Bridgewater 110 kV link .................................................................. 91
10.9.2 Proposed 110/33 kV Bridgewater Substation .......................................................... 92
10.10 Proposed projects ................................................................................................... 92

Transend’s Grid Vision 2040 July 2011 Figures
Page 6
10.10.1 Overall budgetary cost ............................................................................................ 93
11 Future easement and site requirements ............................................................................ 94
12 Conclusion .......................................................................................................................... 95
13 References .......................................................................................................................... 96
Appendix 1: Project timeframes and estimated costs ................................................................ 98
Appendix 2: Future transmission lines and substations .......................................................... 103
Appendix 3: Abbreviations ....................................................................................................... 107
Figures
Figure 1 Transmission grid in 2010 ...................................................................................... 13
Figure 2 Possible future grid in 2040 .................................................................................... 14
Figure 3 Tasmania load forecasts from 2007, 2008 and 2010 ................................................ 16
Figure 4 People, the environment and technology (Woolnorth wind farm in
north-west Tasmania) ............................................................................................. 19
Figure 5 Electricity supply in Tasmania in 2008–09 ............................................................. 25
Figure 6 Electricity supply in Tasmania in 2009–10 ............................................................. 26
Figure 7 Mean wind speed at 80 m above ground level ......................................................... 28
Figure 8 Mean capacity factor at 80 m above the ground level .............................................. 29
Figure 9 Rotary energy storage system ................................................................................. 31
Figure 10 Typical 20 MW geothermal plant ........................................................................... 32
Figure 11 Hot rocks target zones in Tasmania ........................................................................ 34
Figure 12 Tracy Biomass 21.5 MW Plant, California ............................................................. 35
Figure 13 Ocean Power Technology PowerBuoy wave power device ..................................... 36
Figure 14 Tidal generator ....................................................................................................... 37
Figure 15 Supply outlook for Tasmania up to 2040 (for medium load growth
with and without additional wind generation projects) ............................................ 39
Figure 16 Utilisation of Sheffield–George Town No 1 220 kV line ........................................ 42
Figure 17 Swelling of steel reinforced aluminium conductor due to the
development of galvanic corrosion ......................................................................... 44
Figure 18 Alternative conductors for main core grid ............................................................... 45
Figure 19 Farrell–Burnie–Sheffield–Farrell 220 kV existing arrangement .............................. 46
Figure 20 Farrell–Burnie–Sheffield–Farrell 220 kV proposed arrangement ............................ 47
Figure 21 Palmerston–Sheffield–George Town–Palmerston 220 kV existing
arrangement ........................................................................................................... 48
Transend’s Grid Vision 2040 July 2011 Figures
Page 7
Figure 22 Existing arrangement between Palmerston–Waddamana–Liapootah ....................... 49
Figure 23 Proposed future arrangement between Palmerston and Waddamana ....................... 50
Figure 24 Supply arrangements for the greater Hobart area in 2011 ........................................ 51
Figure 25 220 kV loop and rationalisation of 110 kV supply in the greater
Hobart area ............................................................................................................. 52
Figure 26 XLPE cables for DC links ...................................................................................... 56
Figure 27 Potential routes for second Bass Strait DC link ....................................................... 57
Figure 28 Potential network upgrades required in Victoria ..................................................... 58
Figure 29 Potential transmission network upgrades required in Tasmania............................... 58
Figure 30 North-west region existing arrangement ................................................................. 60
Figure 31 Devonport current supply arrangement ................................................................... 61
Figure 32 Devonport future supply arrangement ..................................................................... 62
Figure 33 Burnie area existing supply arrangement ................................................................ 63
Figure 34 Burnie area future supply arrangement ................................................................... 64
Figure 35 Existing west coast supply arrangement .................................................................. 65
Figure 36 West coast future supply arrangement – 44 kV option ............................................ 67
Figure 37 West coast future supply arrangement – 66 kV supply option ................................. 68
Figure 38 North and north-east existing supply arrangement .................................................. 70
Figure 39 Proposed arrangement with second 220/110 kV bulk supply points ........................ 72
Figure 40 Existing Scottsdale and Avoca supply arrangement ................................................ 73
Figure 41 Proposed Scottsdale and Avoca supply arrangement ............................................... 74
Figure 42 Options for the future 220 kV arrangement in George Town area ........................... 75
Figure 43 George Town 220 kV voltage following a loss of Farrell–Sheffield
No. 2 circuit ........................................................................................................... 76
Figure 44 George Town 220 kV voltage following a circuit breaker failure at
Sheffield ................................................................................................................. 77
Figure 45 Synchronous condensers......................................................................................... 77
Figure 46 North and north-east proposed supply arrangement ................................................ 78
Figure 47 Southern network existing supply arrangement ....................................................... 81
Figure 48 New generation of synchronous condensers ............................................................ 83
Figure 49 Chapel Street 220 kV voltage following a CB failure at Chapel
Street ...................................................................................................................... 84
Figure 50 Supply arrangement with two 220 kV bulk supply points ....................................... 85
Figure 51 Proposed arrangement with 220 kV loop completed ............................................... 85
Figure 52 Existing Hobart 110/33 kV injection points and 33 kV
subtransmission network ........................................................................................ 86

Transend’s Grid Vision 2040 July 2011 Tables
Page 8
Figure 53 Future 110/33 kV supply points and 33 kV subtransmission
network .................................................................................................................. 87
Figure 54 Existing 110 kV supply arrangement from Lindisfarne ........................................... 88
Figure 55 Proposed 110 kV supply arrangement from Lindisfarne ......................................... 88
Figure 56 Existing 110 kV supply arrangement in the Kingborough area ................................ 90
Figure 57 Proposed 110 kV supply arrangement in the Kingborough area .............................. 90
Figure 58 Existing 110 kV supply arrangement to upper Derwent area ................................... 91
Figure 59 Proposed 110 kV supply arrangement to upper Derwent area ................................. 91
Figure 60 South and east coast proposed supply arrangement ................................................. 92
Tables
Table 1 Total cost of proposed projects based on regions and 5 year
revenue reset periods (in $2010, based estimate and plus 30%
contingency and allowances estimate included) ...................................................... 12
Table 2 Estimated wind energy potential ............................................................................. 30
Table 3 Capital cost comparison for different generation technologies ................................ 39
Table 4 220 kV corridor constraints in 2007, 2008 and 2009 ............................................... 45
Table 5 Anticipated future revenue reset expenditure in the north-west and
on the west coast (in $2010, base estimate and 30% contingency
plus allowances estimate included) ......................................................................... 69
Table 6 Anticipated future revenue reset expenditure in the north and north-
east (in 2010 $, base estimate and 30% contingency plus
allowances estimate included) ................................................................................ 79
Table 7 Anticipated future revenue reset expenditure in south and east coast
(in $2010, base estimate and 30% contingency plus allowances
estimate included) .................................................................................................. 93
Table 8 Proposed development projects in 220 and 110 kV core grid .................................. 98
Table 9 Proposed development projects in north-west and west coast .................................. 99
Table 10 Proposed network development projects in south and east coast ........................... 100
Table 11 Proposed network development projects in north and north-east ........................... 101
Table 12 Proposed new transmission lines .......................................................................... 103
Table 13 Proposed new substations ..................................................................................... 105

Transend’s Grid Vision 2040 July 2011 Introduction to Grid Vision 2040
Page 9
Message from the Chief Executive Officer
Grid Vision 2040 has been produced by Transend Networks as a road map for the long-term future
development of the transmission network in Tasmania. The need for a long-term vision for the
transmission network is more important now than ever before as we face the challenges of an
uncertain, ambiguous environment in the move towards a stable framework for climate change
management.
To deal with the complexities of this environment, we adopted a scenario-based planning approach.
Climate change and the decisions taken by governments to reduce greenhouse gas emissions are
recognised as key drivers in determining forward investment, in both the generation and demand-
side sectors. Tasmania is well positioned to contribute to the achievement of the nation’s climate
change objectives. As part of the evolution of our 30-year vision for the transmission network, a
wind atlas was developed to assess the wind energy potential in Tasmania. The atlas confirms that
Tasmania has excellent wind energy resources. However, the existing network is not capable to
accommodate significant amount of additional wind generation without considerable upgrade and
additional support in frequency and voltage control ancillary services.
With growing community concern about rising power prices, our plan for the future ensures we
continue to gain maximum benefit from our investment in the existing 220 kV transmission network
backbone. The majority of planning scenarios show that increased capacity of the main 220 kV
backbone can be achieved through the application of new technology and innovations without the
need to increase the core grid voltage. By upgrading sections of the original 220 kV backbone,
installed in 1957, we will remove many existing market constraints and create a more resilient
transmission network backbone.
We also acknowledge the importance of building on the success of more recent developments, such
as Basslink. Since commissioning in 2006, the Basslink interconnector has ensured the security of
supply in Tasmania. However, some operational issues with the interconnector, such as the time
required to change the direction of the power flow, indicate that the benefits of the first
interconnector have not been fully realised and may not be without the addition of a second
interconnector in the future. In preparing Grid Vision 2040, different concepts for a potential second
interconnector were investigated and are detailed in this report.
Grid Vision 2040 also focuses on regional development in Tasmania. The projects proposed for
each region would follow a well-established process of evaluation and justification along with
consultation with our customers.
We hope that Grid Vision 2040 will be an important source of information in guiding the energy
debate in Tasmania. We believe it provides a strong platform for undertaking the future work
needed to ensure that our transmission network continues to deliver essential services to our
customers safely, reliably and efficiently for many decades to come.
Peter Clark
Chief Executive Officer

Transend’s Grid Vision 2040 July 2011 Introduction to Grid Vision 2040
Page 10
Executive summary
The electricity transmission network in Tasmania plays a vital role in linking remote power stations
to population and load centres. This will continue in the future, particularly with the potential
increase in renewable generation connections to the grid.
The development of renewable generation is driven primarily by Australian Government policies
related to climate change and the reduction of greenhouse gas emissions. The expanded renewable
energy target is now in place and it is expected that an emissions trading scheme or carbon tax will
be introduced by 2013. International experience shows that stable government policy is
fundamental to the successful development of renewable generation. Tasmania is rich in renewable
energy resources and the transmission network is vital in realising this energy potential.
Improving demand management
In Australia, the focus is on encouraging demand management through smart grid development
supported by smart or intelligent meters, two-way communication networks, metering data
management systems, energy control and management systems, distribution network automation
and microgrid development. This will enable customers to participate in supply–demand
management. By acquiring knowledge about their own electricity demand patterns and real-time
information about the cost of electricity, customers will be better able to control their energy
consumption and reduce load growth in comparison with load forecasts of just two to three years
ago. Forecast medium energy sales in Tasmania from 2010 to 2024 show an average growth of
0.79 per cent a year, which is well below the 1.46 per cent forecast in 2006. Load forecasts made in
2007 and 2008 for the year 2020 show a drop of 205 MW in maximum demand. This reduced load
forecast was reconfirmed in the latest 2010 forecast report (Transend 2010c). The expectation that
electricity prices will rise further with the introduction of an emissions trading scheme or carbon tax
calls for a cautious approach in considering load growth as the main driver for transmission network
development in Tasmania.
Maximising use of the existing network
As a result, Transend’s Grid Vision 2040 concentrates on increasing utilisation of the existing
network by installing new 110 and 220 kV ties. In the majority of development scenarios there is no
need for an increase in voltage in the transmission network backbone in Tasmania. Instead,
proposed development projects aim to improve the condition of the original 1957 220 kV line and
to remove market constraints and reliability issues caused by this section of the system. An analysis
of the utilisation of the main 220 kV backbone shows that it is not under stress and that there is
available capacity to accommodate further increases in power transfer. If and when an increase in
capacity of the 220 kV backbone is required it can be achieved in other ways without increasing the
voltage level.
Responding to supply and load changes
An analysis of supply in the north-west and the west coast shows that these regions have
experienced reductions in total load due to the recent closure of some industrial customers. The
need to enhance and protect the security and reliability of supply to the population centres of
Devonport and Burnie will be the main driver for transmission network development in the future.
Projects designed to address these issues are relatively simple and easy to achieve. Mining load is

Transend’s Grid Vision 2040 July 2011 Introduction to Grid Vision 2040
Page 11
dominant on the west coast of Tasmania. As the mining industry is exposed to volatile commodity
prices on the international market, it is hard to predict the future requirements of this load for
transmission network development.
The existing transmission network connecting west coast hydro generation to the rest of the network
is already a bottleneck, preventing unconstrained access to the grid. A special network control and
system protection scheme is in place to enable west coast generation full access to the market. Any
further generation development on the west coast will require the reinforcement of the 220 kV
transmission network. For a potential network reinforcement to proceed, market benefits need to be
demonstrated or project funded by a proponent. The need for the network upgrade or
reconfiguration could also be triggered by the emergence of a potential large industrial customer in
the region.
The transmission network in the north supplies Launceston, the second largest population centre in
Tasmania, and George Town, the largest industrial load centre and also the connection point to the
national transmission network via the Basslink interconnector. Security of supply to Launceston
will be improved by the closure of the 110 kV loop around Launceston after the installation of the
Mowbray–St Leonards–Norwood circuit. The load on the 110/22 kV connection points for
distribution company Aurora Energy can be managed by the transfer of load to new connection
points at Ashley, Launceston CBD, Longford and Exeter. The security of supply to George Town
will be enhanced by the conversion of this substation to a breaker-and-half arrangement, but
preventing voltage collapse in the area remains the biggest challenge. To mitigate this problem, the
installation of dynamic reactive power devices is considered as one potential option to provide the
necessary voltage support as well as the additional inertia and fault contribution required for the
secure operation of the Basslink interconnector. Consideration has also been given to the
construction of a second 220/110 kV injection point into the Launceston area to remove the risk
associated with a potential loss of the 220/110 kV Hadspen Substation.
With the successful commissioning of the Waddamana–Lindisfarne 220 kV line and the Lindisfarne
220 kV Substation the southern region got a second 220 kV injection point, which enhances the
security of supply to the greater Hobart area. Again, voltage collapse in the area remains the main
challenge to be managed. To overcome this problem installation of dynamic reactive power devices
was considered. Dynamic reactive power devices will prevent system from voltage collapse
providing the necessary, fast voltage support in the area.
Aligning with business objectives
The proposed development projects align with Transend’s business objectives and the Tasmanian
Government’s Infrastructure Strategy (Tasmanian Government 2010). Additional factors that have
been taken into consideration in selecting development projects include:
the potential to connect renewable energy resources to the local and national grid;
energy efficiency measures;
smart grid, distributed generation and microgrid development; and
application of new technology.
Table 1 provides indicative costs for projects considered in this Grid Vision report. It reflects
different regions and 5 year revenue reset periods. The table shows that in following 30 years total
required expenditures would be less than $1.5 billion ($2.1 billion with 30% contingency and
allowances). The main amount (one third) would be on the core grid projects and the majority of the
rest is related to strengthening network that supplies major population centres in the north and
south.

Transend’s Grid Vision 2040 July 2011 Introduction to Grid Vision 2040
Page 12
Table 1 Total cost of proposed projects based on regions and 5 year revenue reset periods (in $2010, based estimate and plus 30% contingency and allowances estimate included)
Revenue reset
period
Region
TOTAL Core Grid
South and east coast
North and north–east
North–west and west coast
Base estimate 30%+all. ($M)
Base estimate 30%+all. ($M)
Base estimate 30% + all. ($M)
Base estimate 30% + all. ($M)
Base estimate 30% + all. ($M)
2014–2019 166.2
236.1
97.4
134.3
91.8
137.0
11.8
16.1
367.2
523.5
2019–2024 77.8
109.3
53.9
72.0
44.3
62.1
8.8
12.7
184.8
256.1
2024–2029 147.1
206.0
75.9
102.5
107.7
152.6
47.5
67.9
378.2
529.0
2029–2034 136.9
191.6
68.3
97.5
154.5
221.5
12.5
16.7
372.2
527.3
2034–2039 57.3
80.2
35.0
47.2
82.6
118.1
16.6
24.7
191.5
270.2
TOTAL 585.3
823.2
330.5
451.7
480.9
691.3
97.2
138.1
1493.9
2104.3
Appendix 1 provides details of individual projects for each region and the revenue reset period.
Figure 1 below shows the existing Tasmanian transmission grid and regions, as considered in
developing the Grid Vision. Figure 2 details the proposed transmission grid in 2040 with new
transmission lines, potential new generation sources and possible options for future interconnectors
with Victoria.

Transend’s Grid Vision 2040 July 2011 Introduction to Grid Vision 2040
Page 13
Figure 1 Transmission grid in 2010
NORTH WEST
WEST COAST
NORTH NORTH EAST
EAST COAST
CENTRAL
SOUTH

Transend’s Grid Vision 2040 July 2011 Introduction to Grid Vision 2040
Page 14
Figure 2 Possible future grid in 2040
Conclusion: striking the right balance
Transend’s Grid Vision 2040 strikes a balance between addressing reliability requirements, costs
and care for the environment. It focuses on maximising use of the existing network, as well as
embracing new technology and the latest innovations. It facilitates the likely increase in renewable
generation, ensures the system is maintained in a secure operating state and satisfies the required
supply reliability standards at an affordable cost.
It is our blueprint for the future.
Transend’s Grid Vision 2040 July 2011 Introduction to Grid Vision 2040
Page 15
1 Introduction to Grid Vision 2040
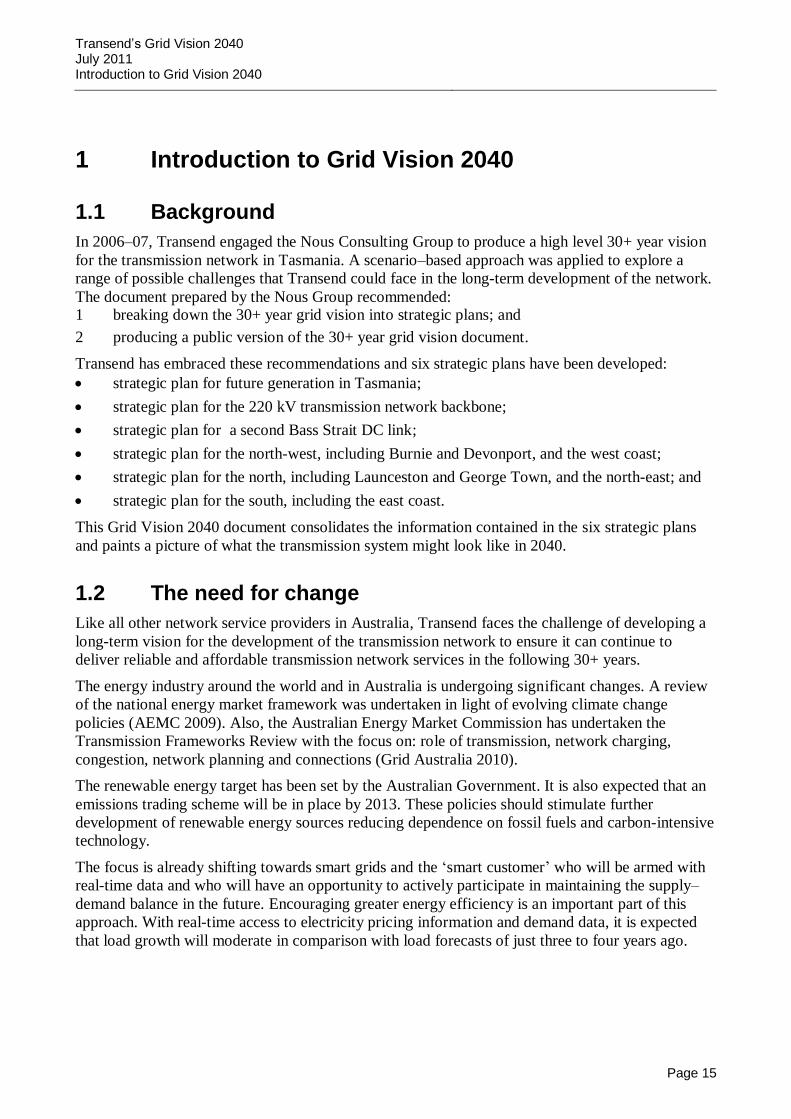
1.1 Background
In 2006–07, Transend engaged the Nous Consulting Group to produce a high level 30+ year vision
for the transmission network in Tasmania. A scenario–based approach was applied to explore a
range of possible challenges that Transend could face in the long-term development of the network.
The document prepared by the Nous Group recommended: 1 breaking down the 30+ year grid vision into strategic plans; and
2 producing a public version of the 30+ year grid vision document.
Transend has embraced these recommendations and six strategic plans have been developed:
strategic plan for future generation in Tasmania;
strategic plan for the 220 kV transmission network backbone;
strategic plan for a second Bass Strait DC link;
strategic plan for the north-west, including Burnie and Devonport, and the west coast;
strategic plan for the north, including Launceston and George Town, and the north-east; and
strategic plan for the south, including the east coast.
This Grid Vision 2040 document consolidates the information contained in the six strategic plans
and paints a picture of what the transmission system might look like in 2040.
1.2 The need for change
Like all other network service providers in Australia, Transend faces the challenge of developing a
long-term vision for the development of the transmission network to ensure it can continue to
deliver reliable and affordable transmission network services in the following 30+ years.
The energy industry around the world and in Australia is undergoing significant changes. A review
of the national energy market framework was undertaken in light of evolving climate change
policies (AEMC 2009). Also, the Australian Energy Market Commission has undertaken the
Transmission Frameworks Review with the focus on: role of transmission, network charging,
congestion, network planning and connections (Grid Australia 2010).
The renewable energy target has been set by the Australian Government. It is also expected that an
emissions trading scheme will be in place by 2013. These policies should stimulate further
development of renewable energy sources reducing dependence on fossil fuels and carbon-intensive
technology.
The focus is already shifting towards smart grids and the ‘smart customer’ who will be armed with
real-time data and who will have an opportunity to actively participate in maintaining the supply–
demand balance in the future. Encouraging greater energy efficiency is an important part of this
approach. With real-time access to electricity pricing information and demand data, it is expected
that load growth will moderate in comparison with load forecasts of just three to four years ago.

Transend’s Grid Vision 2040 July 2011 Introduction to Grid Vision 2040
Page 16
Figure 3 Tasmania load forecasts from 2007, 2008 and 2010
Figure 3 compares three maximum demand forecasts prepared by the National Institute for
Economic and Industry Research for Transend for 2007, 2008.The comparison shows a significant
decline of 205 MW in maximum demand in the year 2020. This drop in load growth was confirmed
in the 2010 load forecast. Consequently, Grid Vision 2040 focuses on increasing utilisation of the
existing assets by undertaking a balanced approach between meeting future capacity requirements
in the transmission network while minimising any impact on the environment through the
application of new technology and innovations.
Deeper penetration of renewable energy sources will not only push the boundaries of secure system
operation but also open up new business opportunities to all electricity market participants.
1.3 The reasons for Grid Vision 2040
Grid Vision 2040 provides details of how the transmission network should be developed to support
a long-term sustainable and reliable electricity supply in Tasmania. It is also a guide to the network
development needed to support long-term generation development and to meet customer
expectations. Grid Vision 2040 focuses on the synergy of market and reliability drivers to maximise
the economic benefits of a long-term planning approach. A piecemeal, short-term approach of
responding as needs arise could result in an ineffective transmission network and inefficient
investment in the grid. Transmission network developments based on a long-term view are more
economically viable and have less impact on the environment and the community.
Tasmania is rich in renewable energy resources. Making use of these resources for electricity
generation by connecting them to the grid could bring prosperity to Tasmania as well as significant
benefits to the national electricity market by helping to meet renewable energy targets and
greenhouse gas emission targets. Grid Vision 2040 explores and highlights these opportunities and
Transend’s Grid Vision 2040 July 2011 Introduction to Grid Vision 2040
Page 17
examines how these resources can be connected to the local and national grids in the most efficient
way.
This greater penetration of renewable generation, together with the increased role of the end-user in
demand management, and the greater use of distributed generation and microgrid development, will
push the envelope of the secure operation of power system. To manage this issue the Tasmanian
power system might require new forms of ancillary services to keep the system operating in a
secure state. Smart transmission networks can facilitate these changes in the generation sector and
in customer behaviour by the application of new technology and innovations. The objective of Grid
Vision 2040 is to develop a resilient transmission network that is flexible enough to adapt to these
changes.
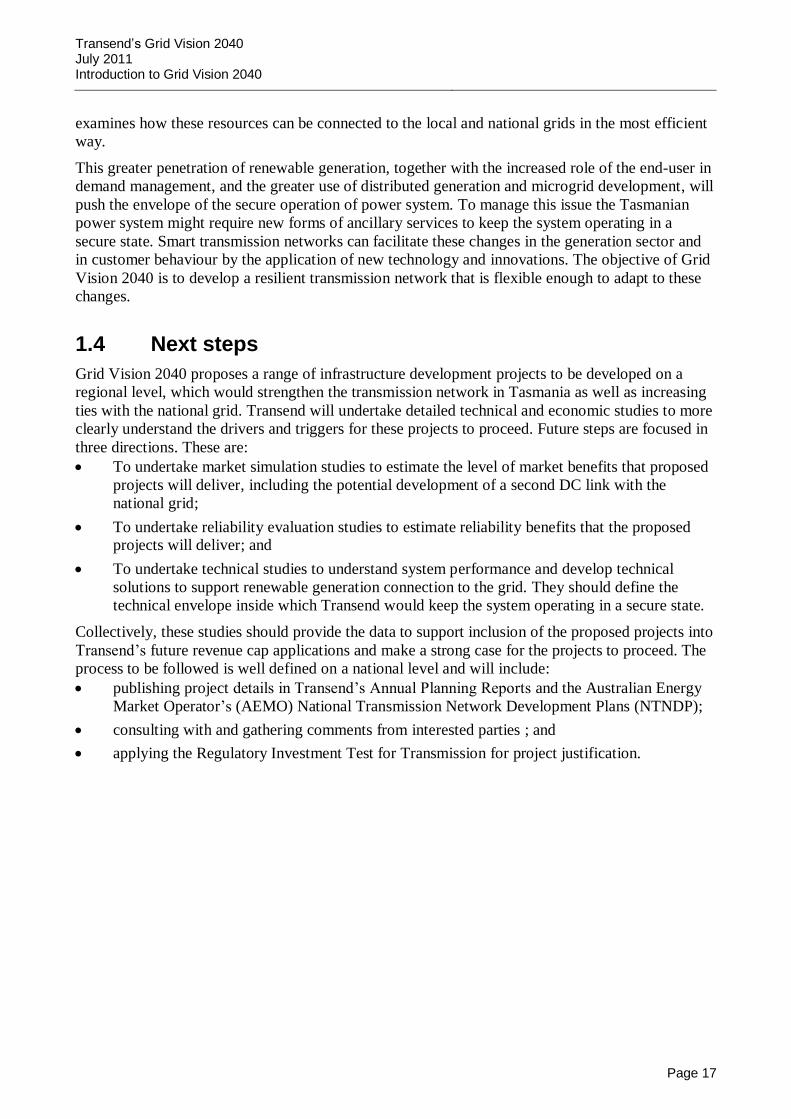
1.4 Next steps
Grid Vision 2040 proposes a range of infrastructure development projects to be developed on a
regional level, which would strengthen the transmission network in Tasmania as well as increasing
ties with the national grid. Transend will undertake detailed technical and economic studies to more
clearly understand the drivers and triggers for these projects to proceed. Future steps are focused in
three directions. These are:
To undertake market simulation studies to estimate the level of market benefits that proposed
projects will deliver, including the potential development of a second DC link with the
national grid;
To undertake reliability evaluation studies to estimate reliability benefits that the proposed projects will deliver; and
To undertake technical studies to understand system performance and develop technical
solutions to support renewable generation connection to the grid. They should define the
technical envelope inside which Transend would keep the system operating in a secure state.
Collectively, these studies should provide the data to support inclusion of the proposed projects into
Transend’s future revenue cap applications and make a strong case for the projects to proceed. The
process to be followed is well defined on a national level and will include:
publishing project details in Transend’s Annual Planning Reports and the Australian Energy
Market Operator’s (AEMO) National Transmission Network Development Plans (NTNDP);
consulting with and gathering comments from interested parties ; and
applying the Regulatory Investment Test for Transmission for project justification.

Transend’s Grid Vision 2040 July 2011 Sustainability considerations
Page 18
2 Sustainability considerations
A generally accepted meaning of sustainability is: ‘meeting the needs of the present without
compromising the ability of future generations to meet their own needs’ (The University of
Reading).
Sustainability requires the integration of economic, social and environmental considerations.
Transend’s commitment to sustainability is reflected through the company’s vision ‘to be a leader
in developing and maintaining sustainable networks’.
By taking a long-term approach to system development, Transend is playing an active role in
ensuring a sustainable future. Grid Vision 2040 is a response to challenges in the strategic
environment. It is designed to ensure the transmission network is flexible enough to cope with the
speed and impact of these changes on both electricity suppliers and consumers.
The recommendations and outcomes contained in this Grid Vision document and its strategic plans
represent the integration and balancing of the three key pillars of sustainability:
Economic Every effort has been made to try to identify the best economic approach
to satisfy system development for both load and generation customers.
Further detailed economic analysis will be required when system
conditions require the implementation of any of the development options.
Social Meeting the future needs of the community is one of the main drivers of
Grid Vision 2040 and its strategic plans. This will ensure Transend can
continue to provide a secure, reliable and safe electricity supply to all
customers, whether at the generation or load end of the line. This will
contribute to the future prosperity of the state as a whole.
Environmental Careful consideration has been given to minimising the environmental
impacts of our operations, including utilising existing easements with little
or no widening. Consolidation of existing transmission lines has also been
looked at, along with the need for expansion of existing or construction of
new substations. Decisions on the location of any new transmission lines
or substations will take account all environmental issues. Transend will
explore options, such as improving the rating of existing lines to minimise
the need for development of new lines.
New technology will enable Transend to increase use of the existing network and transmission
assets without compromising security and reliability of supply. The integration of new renewable
energy sources, distributed generation and active involvement of customers in achieving a supply–
demand balance will push the boundaries of the secure operation of the system. The approach
proposed in Grid Vision 2040 provides the necessary resilience in the transmission network and
transmission assets to cope with these challenges.

Transend’s Grid Vision 2040 July 2011 Sustainability considerations
Page 19
Figure 4 People, the environment and technology (Woolnorth wind farm in north-west Tasmania)
Transend’s Grid Vision 2040 considers the synergy of main drivers for development and shows the need for:
economic prosperity;
care for the environment; and
the application of new technology and innovations.
Courtesy of Chris Crerar-Photographer

Transend’s Grid Vision 2040 July 2011 Strategic environment and scenario planning approach
Page 20
3 Strategic environment and scenario planning approach
The current environment in which Transend operates is characterised by:
Volatility–a rapid pace of change requiring anticipation and flexibility;
Uncertainty–the impact of change may not always be immediately clear;
Complexity–the inter-relationship between events may not be fully understood; and
Ambiguity–the lack of clarity in input data may impact decision making.
In this VUCA environment, scenario planning is the preferred approach to create a long-term
strategy for the transmission network. The scenario planning approach captures a series of
influential factors that are likely to have an impact on the future of transmission network
development and, consequently, on Transend. Three factors were identified as critical to this
process:
demand growth—high, medium and low;
water inflows in hydro storages—existing and low; and
potential greenhouse gas emissions policy changes—introduction of a modest or high carbon tax.
By combining these factors in different ways 12 development scenarios were created:
Scenario 1 low load growth, existing water inflows and modest carbon tax;
Scenario 2 low load growth, existing water inflows and high carbon tax;
Scenario 3 low load growth, low water inflows and modest carbon tax;
Scenario 4 low load growth, low water inflows and high carbon tax;
Scenario 5 medium load growth, existing water inflows and modest carbon tax;
Scenario 6 medium load growth, existing water inflows and high carbon tax;
Scenario 7 medium load growth, low water inflows and modest carbon tax;
Scenario 8 medium load growth, low water inflows and high carbon tax;
Scenario 9 high load growth, existing water inflows and modest carbon tax;
Scenario 10 high load growth, existing water inflows and high carbon tax;
Scenario 11 high load growth, low water inflows and modest carbon tax; and
Scenario 12 high load growth, low water inflows and high carbon tax.
These scenarios were ranked according to their probability. The ranking shows that the scenario
featuring medium load growth, existing water inflows and a high carbon tax was the most likely
scenario. The Tasmanian transmission network was modelled and analysed against each of these
twelve scenarios for 2010, 2020, 2030 and 2040. Additional sensitivities were incorporated to take
account of Basslink import and export conditions, the availability of the Gordon Power Station and
the impact of a total shut down of this power station, particularly on the security of supply to the
greater Hobart area.

Transend’s Grid Vision 2040 July 2011 Creating the smart transmission grid of the future
Page 21
4 Creating the smart transmission grid of the future
The current electricity grid concept of transferring power from remote, large power stations to
centres of consumption is based on technology that was invented more than 100 years ago.
Although the electricity grid has been continuously updated since that time in response to changes
in the operating environment, it is generally agreed that a new approach is required in the future.
The smart grid concept has evolved from a recognition of the need for more flexible, more
intelligent, more open access to the network and the exchange of energy and information in both
directions, from generators to customers and vice versa. Key technology areas identified as critical
to the development of the grid of the future (Research Reports International 2009) include:
smart meters to enable consumption data to be available to both customers and utilities on a real-time basis;
two-way communication networks using broadband over power lines with smart meters in a meshed network configuration for transferring data;
metering data management systems to support demand response programs by providing consumption data;
energy management and control technology to respond to price signals and automatically control or shift demand during the day; and
distribution network and substation automation technology to reconfigure the distribution
network and provide supply from alternative substations during fault situations, resulting in
improved reliability of supply.
The smart electricity grid of the future will bring forward new capabilities and services that utilities can offer to customers, such us:
dynamic pricing;
real-time feedback about electricity consumption, prices, peak demand and greenhouse gases emitted;
demand response programs;
microgrids with distributed generation and storage devices in parallel operation with the grid; and
electric vehicles, including vehicle to the grid technology.
It is expected that these key technologies and new services will raise awareness of opportunities that
customers might explore to participate in real-time supply and demand management. Consequently,
Grid Vision 2040 is focused on making better use of transmission system assets by increasing levels
of use and strengthening the existing network. This could be achieved efficiently by installing
inter-ties and creating loops in the existing network. This would be reinforced by the creation of a
‘smart transmission grid’ deploying intelligent devices and technology to enhance the existing
transmission network capabilities. These include:
shunt and series compensation devices;
unified power flow controllers;
new generation dynamic reactive power devices;
fly wheel energy storage systems, batteries and active power control devices;
active filters for power conditioning;
new smooth body, high temperature conductors with composite materials;
superconductors and superconducting magnetic energy storages;

Transend’s Grid Vision 2040 July 2011 Creating the smart transmission grid of the future
Page 22
new direct current technology;
enhanced dynamic line rating system;
synchrophasor measurement technology, wide area measurements and energy management and control systems enhancements; and
new asset monitoring devices and risk assessment tools.
The application of new intelligent devices and the latest technology will increase utilisation of the
existing transmission network and assets, balancing risk and reliability requirements without the
need for a massive investment in the transmission network and assets.
4.1 Impact of electric vehicles
The transport sector is one of the three sectors with the greatest potential for reducing greenhouse
gas emissions to meet Tasmania’s legislated emission reduction target (MMA Consulting 2009).
One of the most important future transport technologies that can combat greenhouse gas emissions
is the battery-powered electric vehicle, or the plug-in electric vehicle. The range of these vehicles is
increasing, now up to 300 km, and their power rating range has grown from a few tens of kilowatts
for small cars to a few hundred kilowatts for high performance cars.
While electric vehicles can be an additional load on the network during charging, they become
generators when operating in regeneration mode. Concerns have been raised about the potential
impact of an increased number of new, distributed generation, and renewable energy resources as
well as the effect a large fleet of electric vehicles could have on fault levels in the network
associated with reverse power flow, protection system coordination, phase imbalance and power
quality issues.
As a part of the development of Grid Vision 2040, the impact of this technology on the transmission
network has been analysed in detail (Transend 2010h). The impact is expected in three main areas:
load profile and uncontrolled increase in peak demand;
variations in voltage profile; and
possible violations of the rules requirements and potential voltage imbalances caused by single-phase charging points.
This analysis evaluated the potential market and the likely penetration of electric vehicles in
Tasmania in the years 2013 and 2030. Penetration levels of three per cent, 10 per cent, 15 per cent,
20 per cent, 50 per cent and 75 per cent of total motor vehicle sales in the Tasmanian market were
considered. In the absence of a government incentive scheme and the current high price of electric
vehicles, it is likely that the uptake will be at the lower end of estimates in 2013. However, as the
technology advances, uptake should increase in the future.
The analysis showed that if all electric vehicles were put to charge at the same time (the worst case
scenario) the daily demand in Tasmania would vary from 7.7 MW to 193 MW in 2013 and from
9 MW to 229 MW in 2030. Energy requirements for electric vehicles were found to be very low,
ranging from 0.12 per cent to 3.07 per cent in 2013 and from 0.13 per cent to 3.63 per cent in 2030
of total energy consumption. The impact of electric vehicles on daily load profiles of substations or
distribution feeders would vary according to their location and on the electric vehicle charging
points within the network. To avoid creating new peak demand on distribution feeders and
substations, intelligent controls would be in place or incentives would be created to encourage
customers to distribute charging throughout the day. These measures would help to keep voltage
profiles within system standard requirements during maximum load and periods of charging and
discharging by electric vehicles. Interface devices should be designed to minimise, or even

Transend’s Grid Vision 2040 July 2011 Creating the smart transmission grid of the future
Page 23
eliminate, the effect of these vehicles on the network. When communication with energy control
centres is in place, electric vehicles could be designed to operate as a part of a ‘smart grid’ to
provide network support and frequency and voltage control ancillary services.

Transend’s Grid Vision 2040 July 2011 Future generation planning in Tasmania
Page 24
5 Future generation planning in Tasmania
5.1 Introduction
This section considers the electricity supply contribution in Tasmania for 2008–09 and 2009–10
and examines potential generation sources that could make a greater contribution to the future
energy supply, in particular wind generation. Due to the size of the Tasmanian power system,
additional generation penetration could cause technical challenges in maintaining the secure
operation of the system if this generation is not able to contribute to:
Frequency control ancillary service;
Voltage control ancillary service;
Fault right through capability;
Inertial support.
If new generation is not able to provide these services and demonstrate these capabilities it could be
required that additional equipment is installed or alternatively these services and support could be
contracted from the existing service providers to enable connection to the grid.
5.2 Existing electricity supply in Tasmania
With six major water catchments and 27 hydro power stations, Hydro Tasmania is the largest
generator in Tasmania. The diversity of supply is provided by commissioning of gas fired power
station by Aurora Energy and imports via Basslink interconnector. Hydro generation contribution to
electricity supply in Tasmania is falling down (Marshall 2008) due to declining inflows in water
storages. Hydro Tasmania’s expected annual average yield from its water storages as at 2009
was 8,700 GWh, which was well below the 10,000 GWh target average yield in the past (Hydro
Tasmania 2009). The remaining portion of the required supply came from wind and gas-fired
generation and imports via Basslink.

Transend’s Grid Vision 2040 July 2011 Future generation planning in Tasmania
Page 25
Figure 5 Electricity supply in Tasmania in 2008–09
Hydro power stations
Aurora Energy Tamar Valley gas power station
Basslink import
Woolnorth wind farm
The electricity supply–demand balance for 2008–09 (Figure 5) captures only a portion of the
Aurora Energy Tamar Valley gas generation (Transend 2010a).

Transend’s Grid Vision 2040 July 2011 Future generation planning in Tasmania
Page 26
The 2009–10 electricity balance, (Figure 6), shows the increased contribution of gas power
generation following commissioning of Aurora’s combined cycle gas power station in
September 2009. The 2009–10 year also was better from a hydrological point of view, with the
contribution of hydro power stations to the supply–demand balance increasing and imports via
Basslink decreasing (Transend 2010a).
Figure 6 Electricity supply in Tasmania in 2009–10
Hydro power stations
Aurora Energy Tamar Valley gas power station
Basslink import
Woolnorth wind farm
5.3 Hydro generation
Managing declining water storage levels is not the only challenge facing Hydro Tasmania.
Management of its 27 hydro power stations, most of which have passed mid-life, also is demanding.
Maintenance of these hydro power stations is capital intensive and a significant capital investment
is required to keep them running. Hydro Tasmania has put forward a strategic plan to
capture 1,000 GWh of production through refurbishment, efficiency improvements and mini hydro
scheme developments. A capital works program has been put in place to invest $180 million by
2014 to capture the first 425 GWh per year of energy production (Connarty 2009).This timeframe
and the overall 1000 GWh rebuild program, could require a longer period for delivery.
The inherent flexibility in the operation of hydro power stations, their capability for quick starts and
shut downs and further developments in variable renewable generation offers new commercial
opportunities for Hydro Tasmania in the provision of ancillary services, such as frequency control,

Transend’s Grid Vision 2040 July 2011 Future generation planning in Tasmania
Page 27
voltage support, inertia and fault ride through. This could support an increase in renewable
generation in the Tasmanian system in the future.
5.4 Gas generation
Aurora Energy’s Tamar Valley Power Station is the only gas-fired power station in Tasmania. A
plant of a similar size could be required in the south of the State in a high load growth development
scenario (Transend 2010b). However, the small physical size of the gas pipeline from Bell Bay to
Hobart, the drop in load forecast and focus on energy efficiency and demand side management, the
exposure to potential loss of a major point load and the future price of gas in the market create
uncertainties and less favourable market conditions for further large-scale gas generation
development in the south of Tasmania.
The Tasmanian gas network is under-utilised and there are opportunities to increase use of this
network through small-scale distributed generation, co-generation and other forms of energy usage
(Kirkpatrick 2009).
5.5 Wind generation
Wind power modelling and analysis of simulated data for six regions of Tasmania (3Tiers 2010)
focused on the large scale required to calculate bulk wind energy potential rather than on
identifying individual sites suitable for wind farm developments. The six regions—the west coast,
north-west, north-east, east coast, central and south—were sub-divided into 4.5 km x 4.5 km grid
cells. National parks, conservation areas, world heritage areas and protected areas were all excluded
from the analysis.
A Mesoscale Numerical Weather Prediction Model was configured and run over mainland
Tasmania for a 10-year period from January 2000 to December 2009 with 10 minute resolution to
establish long-term wind characteristics. The simulation confirmed that Tasmania has world class
wind resources. Figure 7 presents the plot of the long-term mean wind speed at 80 m above ground
level. The data is averaged over the entire 10-year period, from the start of 2000 to the end of 2009.
The 220 kV transmission network is also shown to illustrate the distance of good wind spots from
the main transmission network backbone. Several areas of the State have an average wind speed
above 8.0 m/s along with a wind capacity factor above 40 per cent.

Transend’s Grid Vision 2040 July 2011 Future generation planning in Tasmania
Page 28
Figure 7 Mean wind speed at 80 m above ground level
Figure 8 shows the long-term mean capacity factor at 80 m above the ground level. The data is
averaged over the entire 10-year period, from the start of 2000 to the end of 2009.

Transend’s Grid Vision 2040 July 2011 Future generation planning in Tasmania
Page 29
Figure 8 Mean capacity factor at 80 m above the ground level
Using the assumptions and methodology described on Page 27, the bulk energy potential in
Tasmania was estimated only for grid cells with a capacity factor greater than 40 per cent. The
results are shown in Table 2.

Transend’s Grid Vision 2040 July 2011 Future generation planning in Tasmania
Page 30
Table 2 Estimated wind energy potential
Region Grid points with capacity factor ≥ 40%
Potential installed capacity
[MW]
Potential mean gross energy production
[GWh/year]
West coast 32 1,920 7,143
North-west 79 4,740 17,812
North-east 13 780 2,818
East coast 19 1,140 4,177
Central 167 10,020 39,446
South 101 6,060 25,350
ALL REGIONS 411 24,660 96,746
The figures in Table 2 show that the wind resource is not the limiting factor for wind generation
developments in Tasmania. This calculation assumes that all sites with a capacity factor greater than
40 per cent are available for wind generation development.
But, issues such as:
planning and environmental approvals;
the agreement of land owners;
land availability;
technical issues associated with wind generation integration;
transmission network capacity and access; and
the financial viability of wind farms;
need to be taken into account and could reduce the number of viable sites and consequently the
level of potential wind generation development.
Even when connected to the system, the maximum level of wind generation penetration in real-time
operation would be determent by factors such as: total system load, amount of conventional
generation committed and level of import over Basslink. In addition, due to the small size of the
Tasmanian system and the domination of hydro generation, further wind generation development
will require support, particularly in maintaining system security. Management of system issues such
as rate of change of frequency, fault level, as well as active and reactive power and voltage control,
requires innovation and the possible design of new ancillary services in Tasmania. Hydro power
stations are able to offer these services.
Alternative solutions such as: fly wheels, wind generation technology, DC technology, dynamic
reactive power devices were also considered.
One alternative solution to address some of these issues is shown in Figure 9. A fly wheel system
can suppress frequency fluctuations by realising or absorbing energy from the system by changing
speed of rotation (Akagi 1999). There has also been significant progress in wind turbine generator
development, and new equipment is now available on the market that is capable of providing
system performances similar to conventional synchronous generation (Miller 2010). Further
research and development is required in this field to enable alternative solutions and non-
synchronous generators to achieve the level of performances of conventional synchronous
generators.

Transend’s Grid Vision 2040 July 2011 Future generation planning in Tasmania
Page 31
Figure 9 Rotary energy storage system
Courtesy of Toshiba

Transend’s Grid Vision 2040 July 2011 Future generation planning in Tasmania
Page 32
5.6 Geothermal energy
Geothermal energy is the energy stored beneath the surface of the earth. For every 100 metres
below the ground, the temperature of the rock increases about three degrees Celsius. The heat is
extracted using water by natural or artificial means. There are two main types of geothermal
systems that can be used to generate electricity.
Figure 10 illustrates the currently available technology for geothermal energy generation, in this
case a 20 MW system in the United States (Lewis 2009).
Figure 10 Typical 20 MW geothermal plant
5.6.1 Hydrothermal systems
Hydrothermal systems have fluids circulating through rock pores or fractures (as a liquid or vapour)
in areas where high heat flow is present. These systems are often found near active tectonic plate
boundaries where volcanic activity has occurred, such as in Iceland, New Zealand and the
Philippines. Hydrothermal systems can also form above areas of hot basement rocks and it is this
type of system that is found in Australia. High-temperature hydrothermal systems are often
exploited for electricity generation, while low-temperature hydrothermal systems are more suited to
direct-use applications. Countries such as Iceland, which are situated in areas with a high
concentration of volcanoes, are ideal locations for generating geothermal energy. Over 26 per cent
of Iceland’s electrical energy is generated from geothermal sources. In addition, geothermal heating
is used to heat 87 per cent of homes in Iceland. Geothermal energy currently supplies 11 per cent of
New Zealand’s electricity needs (KUTh Energy 2010).
5.6.2 Hot rock systems
Hot rock systems do not have fluids naturally circulating through the rock and in most cases the
rock needs to be fractured to achieve the fluid flow required for heat transfer. Hot rock systems are
normally associated with granites that contain high concentrations of the naturally radioactive
Courtesy of KUTh Energy

Transend’s Grid Vision 2040 July 2011 Future generation planning in Tasmania
Page 33
elements uranium (U), thorium (Th) and potassium (K). Although enriched with these elements
compared to other rocks, element concentrations are still relatively low (commonly ~0.002% U,
~0.01% Th and ~4% K). The radioactive decay of these elements over millions of years generates
heat, which is trapped when the granite is buried by insulating sediments. The thicker the insulating
layer, the hotter the temperatures. For example, granite at a three-km depth overlaid by insulating
sediments can be hotter than 200°C. Currently, a number of companies are exploring Tasmania's
geothermal resources. The geology in Tasmania is very favourable for ‘hot rocks’ geothermal
energy, which is supported by drilling done to date by companies like KUTh Energy and
Geothermal Energy Tasmania. KUTh Energy is undertaking exploration on the east coast as shown
in Figure 11 (Lewis 2009).

Transend’s Grid Vision 2040 July 2011 Future generation planning in Tasmania
Page 34
Figure 11 Hot rocks target zones in Tasmania
KUTh Energy heat flow drill hole
Tenement boundary
Other drill hole
At this stage it is not clear what energy potential is in the ‘hot rocks’ that can be used for electricity
generation in Tasmania.
5.7 Biomass energy
Biomass energy is derived from three distinct energy sources: wood, waste and alcohol fuels. Wood
energy is derived both from the direct use of harvested wood as a fuel and from wood waste
SEL 26/2005
SEL 57/2008
SEL 45/2007
Nicholas Fingal inferred resource
Charlton Lemont inferred resource
Courtesy of KUTh Energy

Transend’s Grid Vision 2040 July 2011 Future generation planning in Tasmania
Page 35
streams. The largest source of energy from wood is pulping liquor or ‘black liquor’, a waste product
from processes of the pulp, paper and paperboard industry. The most significant possible
development in Tasmania is the proposed Gunns Bell Bay pulp mill project. The project includes a
steam generator and turbine driven by burning forest biofuel to generate electricity. If it is assumed
that the pulp mill will use 100 per cent plantation eucalypts, the following capacity details of the
generators are (Poyry 2006):
total capacity 169 MW;
power consumption on site 107 MW; and
export power to the grid 62 MW
Figure 12 shows a 21.5 MW biomass plant in California that uses urban and agricultural wood
waste to generate power (US Energy Information Administration, 2009). Forestry Tasmania has
been considering two plants of a similar size, one in the south as a part of the integrated wood
processing yard near Huonville and a second in the north-west near Smithton.
International experience shows that stable and sustainable government policy is fundamental to the
successful development of renewable generation. Sweden has an optimistic renewable energy target
(50 per cent by 2020) in place. Also, its government is determined to make Sweden the world’s first
oil-free economy. With these policies in place, Sweden has been able to generate 32 per cent of its
overall energy from biomass (115,000 GWh) (the renewableenergyworld.com 2010).
Figure 12 Tracy Biomass 21.5 MW Plant, California
5.7.1 Waste energy
Waste energy is the second-largest source of biomass energy. The main contributors of waste
energy are municipal solid waste, manufacturing waste and landfill gas. Opportunities to exploit
waste as an energy source have been taken up by the landfill gas plants operating at Hobart and
Glenorchy council’s landfill sites. These two plants combined have a capacity of about 2.6 MW.
5.8 Wave power
The west coast of Tasmania is potentially a good source of wave power. Wave power devices
extract energy from the flux of the wave. A wave five metres in height has the energy flux of about
Courtesy of U.S Energy Information Administration Courtesy of U.S Energy Information Administration

Transend’s Grid Vision 2040 July 2011 Future generation planning in Tasmania
Page 36
150 kW/m. Waves on the west coast are only above five metres for 10 per cent of the time, during
winter. Most of the time they are between two and four metres with the energy flux between 30-
100 kW/m. Wave devices do not capture all energy potential of waves. If it is assumed that they
capture only 10 per cent of the wave energy potential (4 kW/m), it would be necessary to install
1000 devices in total with a length of 300 km along the west coast to supply 1200 MW of average
load in Tasmania (Griffin 2009).
Recent developments by Ocean Power Technologies of 150 kW (see Figure 13 below) wave
generator and plans to increase the size to 500 kW suitable for wave power station parks and
already contracts signed for installations in the US, Spain, Ireland, England, Japan and Australia
making wave power more and more competitive against other renewable technologies. The
advantages of wave power are (Ocean Power Technology, 2011):
Wave energy is the most concentrated form of renewable energy, predictable;
Capacity factor of 30-45% ;
Environmentally benign & non-polluting;
No exhaust gases, no noise, minimal visibility from shore, safe for sea life;
Scalable to high capacity power stations (100 MW+).
Recently the Federal Government of Australia awarded to partnership of Ocean Power
Technologies Australasia (OPTA) and Leighton Contractors Pty Ltd a contract in values of
$66.5 million to build in three phases a 19.0 MW wave power project at Portland in Victoria. This
project is an opportunity to closely monitor wave power performances and efficiency.
Figure 13 Ocean Power Technology PowerBuoy wave power device
5.9 Ocean currents
Ocean currents have been identified as another potential energy source for electricity generation. At
this stage, ocean current potential is well behind wave power as an alternative source of renewable
energy.
Banks Strait, between the north-east tip of Tasmania and Clarke Island, has been identified as a
potentially suitable location for tidal power generation. This form of renewable generation is still in
the early stages of development. While it is not financially competitive with wind generation,
Courtesy of Ocean Power Technologies Courtesy of Ocean Power Technologies

Transend’s Grid Vision 2040 July 2011 Future generation planning in Tasmania
Page 37
significant potential is available. At some stage in the future, when this technology becomes
financially viable and the issues of corrosion and maintenance are addressed, a sizable tidal
generating plant could be constructed in this area.
Figure 14 shows the first commercial tidal generator (1.2 MW) installed in Northern Ireland that
would be suitable for installation in Banks Strait (Griffin 2009). The possible hazard to shipping
and marine life from these structures will require careful management, but it is still a technology in
development and worthy of future consideration.
Figure 14 Tidal generator
5.10 Solar power
Some Australian Government initiatives, such as the Solar Homes and Community Plan, provide
cash rebates for the installation of solar panels on residential or community properties. Another
government initiative is a feed-in tariff that offers a premium rate to producers of renewable energy
via their solar power systems. At present there is no national feed-in tariff scheme and the rate paid
varies in each state and territory.
Energy Australia pays 60 ¢/kWh via a credit on its electricity bills to customers in New South
Wales, with the excess credit paid out on request after 12 months or upon termination of the
contract. In October 2010, the New South Wales Government announced that the 60 ¢/kWh feed-in
tariff would be reduced to just 20 ¢/kWh. A cap of 300 MW for solar generators connected under
the scheme was imposed as well (ESAA 2010).
Courtesy of Marine Current Turbines Limited
Transend’s Grid Vision 2040 July 2011 Future generation planning in Tasmania
Page 38
Similar happened in Western Australia where the government in less than 12 months after unveiling
the initiative, revealed in the budget that it was halving the feed-in tariff for households with
photovoltaic cells (from current ¢40/kwh to ¢20/kWh). It was acknowledged by the West Australia
government energy minister that the scheme was unaffordable and very expensive exercise blowing
the budget 500 per cent in the cost (The West Australian, 2011).
In Tasmania, Aurora Energy currently offers a voluntary ‘net metering buy-back’ scheme for
installations up to 3 kW, at a rate equivalent to the relevant retail tariff. This means that if the
power and light Tariff 31 is offset by solar panel generation, customers will be paid 22.648 ¢/kWh
(this is 01 December 2010-30 June 2011 Aurora’s Tariff 31 energy value) for power provided back
to the grid.
Large-scale solar generation development is not currently competitive financially with other forms
of renewables, particularly wind. The potential good sites are very remote from the existing
transmission network and connection cost could be very high. Large-scale solar generation
development would be hard to justify in Tasmania due to less favourable weather conditions and
consequently a low solar generation capacity factor.
5.11 Future electricity supply in Tasmania
The electricity supply outlook for Tasmania up to 2040 was analysed for all 12 development
scenarios described in the Section 3. The supply outlook for Scenario 5 (medium load growth,
business as usual for water inflows in Hydro water storages and the introduction of a modest carbon
tax) is shown in Figure 15 (Transend 2010a). As shown on pie charts in Section 5.2, Tasmania
imported 26% in 2008-09 and 15% in 2009-10 of the overall electricity supply needs.
This situation could change if further wind generation development happened in Tasmania. This
development could be driven by the expanded renewable energy target and a carbon tax imposed on
high polluters. In this case, Tasmania would be able to meet the local supply needs and be an
electricity exporter (Figure 15, teal line). If additional wind generation development does not go
ahead, Tasmania will become more and more dependent on the continuous import of electricity
from the mainland. The import will gradually increase and reach value of around 3000 GWh per
year in this particular Scenario (Figure 15, cherry line). It is equivalent to 300 MW Basslink
capacity continuously required for import purpose (Figure 15, blue line, secondary axis).

Transend’s Grid Vision 2040 July 2011 Future generation planning in Tasmania
Page 39
Figure 15 Supply outlook for Tasmania up to 2040 (for medium load growth with and without additional wind generation projects)
Renewable generation will become more and more competitive with technological progress. Still
financial viability of renewable generation is dependent on subsidies due to low capacity factor of
this technology. It is expected that introduction of the carbon tax and its possible slow rise in the
future will disadvantage high polluting technology in comparison with renewable technology. The
table below shows capital costs comparison for different generation technologies.
Table 3 Capital cost comparison for different generation technologies
Generation Capital costs in $ million/MW
Source
Supercritical Pulverized Black coal 2.676 ACIL Tasman report
Supercritical Pulverized Brown coal 3.571 ACIL Tasman report
OCGT without carbon capture and storage 0.985 ACIL Tasman report
CCGT without carbon capture and storage 1.368 ACIL Tasman report
CCGT with carbon capture and storage 2.359 ACIL Tasman report
Wind large scale (500 MW) 2.744 ACIL Tasman report
Wind medium scale (200 MW) 2.886 ACIL Tasman report
Wind small scale (50 MW) 3.178 ACIL Tasman report
Photovoltaic PV single axis tracking 5.100 ACIL Tasman report

Transend’s Grid Vision 2040 July 2011 Future generation planning in Tasmania
Page 40
Generation Capital costs in $ million/MW
Source
Solar Thermal - Parabolic Trough without Storage 5.109 ACIL Tasman report
Geothermal - Hot Sedimentary Aquifers 6.600 ACIL Tasman report
Biomass small plant 1.5-4.0 Green World Investor
Biomass large plant 2.0-3.0 Green World Investor
Biomass cogeneration or combined heat and power 0.250 Green World Investor
Wave power 3.9 Ocean Power Technologies
Ocean current 11.0 Marine Current Turbines
Nuclear power 5.283 ACIL Tasman report
The costs of biomass generation fall in a very wide range because of the wide variety of fuel it uses.
The costs of biomass energy also depend on the distance of the fuel, how it is procured, managed
and used up by a biomass plant. Urban waste and waste wood are some of the cheapest forms of
biomass available. Co-generation plants or combined heat and power biomass plants located close
to sawmills or paper plants virtually have free fuel while standalone biomass plants which can use a
variety of fuel are quite expensive in nature (Green World Investor).
The latest market modelling (IES, June 2011) recognised that wind generation was the only existing
mature large scale renewable energy technology that would be able to meet a large scale renewable
energy target. The federal government has established a Solar Flagships Program ($1.5 billion
committed to establish up to 1000 MW of solar power generation capacity) to assist the
development of large scale solar power. However, there is no such equivalent scheme for
geothermal or other forms of renewable generation. Other forms of renewable generation such us
geothermal, wave, ocean current and hot rocks are still in an early stage of development. Some pilot
projects are in place and testing is under way. However, these projects cannot be financially
justified for large-scale development at present. Therefore, wind generation is the most likely
energy source that would be further developed in Tasmania in near future.

Transend’s Grid Vision 2040 July 2011 Future of main 220 and 110 kV corridors
Page 41
6 Future of main 220 and 110 kV corridors
6.1 Introduction
The core grid of the transmission network in Tasmania was designed for, and operates at, 220 kV as
shown in Figure 1. The 220 kV network started operation in 1957 when the first 220 kV line was
built between Waddamana power station and Burnie. Since then, the 220 kV network has expanded
to accommodate the development of new hydro power schemes in the 1960s, 1970s and 1980s.
As a part of the Grid Vision 2040 project the utilisation of the existing 220 kV core grid was
analysed. It was found that the condition of some assets such as steel reinforced aluminium
conductor (ACSR), particularly one installed on 220 kV sections in 1957, required attention. New
conductors now available on the market offer potential for transmission line upgrades as part of
long-term plans for the 220 kV core grid.
Commissioning of the new Waddamana–Lindisfarne 220 kV line, scheduled for mid 2011, offers
opportunities to reduce a number of 110 kV lines from the upper Derwent power stations. Some of
the 110 kV transmission lines connecting these power stations were built in the 1930s and 1940s
and rationalisation is required.
6.2 Utilising the existing 220 kV and 110 kV corridors
An analysis of all 220 kV corridors was performed to understand how much the lines were utilised
during the year. This analysis also provided information on stress levels in the transmission
corridors to determine the need, if any, to upgrade to a higher voltage, such as 275 kV or even to
330 kV (Transend 2010b).
Loading of the main 220 kV corridors was analysed for one year before the commissioning of
Basslink in 2006 and for four years following Basslink commissioning. Figure 16 shows the loading
of Sheffield–George Town No 1 220 kV line before and after the commissioning of Basslink.

Transend’s Grid Vision 2040 July 2011 Future of main 220 and 110 kV corridors
Page 42
Figure 16 Utilisation of Sheffield–George Town No 1 220 kV line
In the four years following the Basslink commissioning, the average load of 220 kV lines in the
north of the state has been slightly reduced. This could be due to lower rainfall and the predominant
import of power from the mainland during 2007 and 2008. There was a visible increase, of short
duration, in trend of loading of these lines above the firm capacity (N–1 capacity). This could be
attributed to short-term opportunities for the export of power from Tasmania to the mainland during
favourable dispatching intervals for Hydro Tasmania. The years 2009 and 2010 showed increased
utilisation (indicated by the arrow in the Figure 16) due to improved rainfall levels. It is expected
that this trend will continue in the future until a significant amount of renewable generation is built
in Tasmania, which could then turn Basslink flow around.
The southern region of Tasmania currently has a close balance between available generation and
maximum demand. The power flow from north to south will slowly increase. This is due to the
increasing gap between available hydro generation and load growth in the region.
The analysis of utilisation of all 220 kV transmission lines indicates that there is spare capacity in
220 kV transmission lines to accommodate future load growth in Tasmania in a majority of the
scenarios. To use this capacity efficiently and load more and more 220 kV lines but manage risk
exposure, the enhancement of the existing tools and application of new technology is required. This
will be achieved by the:
further use of shunt reactive power compensation;
introduction of series compensation;
introduction of dynamic reactive power devices;
potential use of unified power flow controllers;
increased use of the dynamic line rating system;
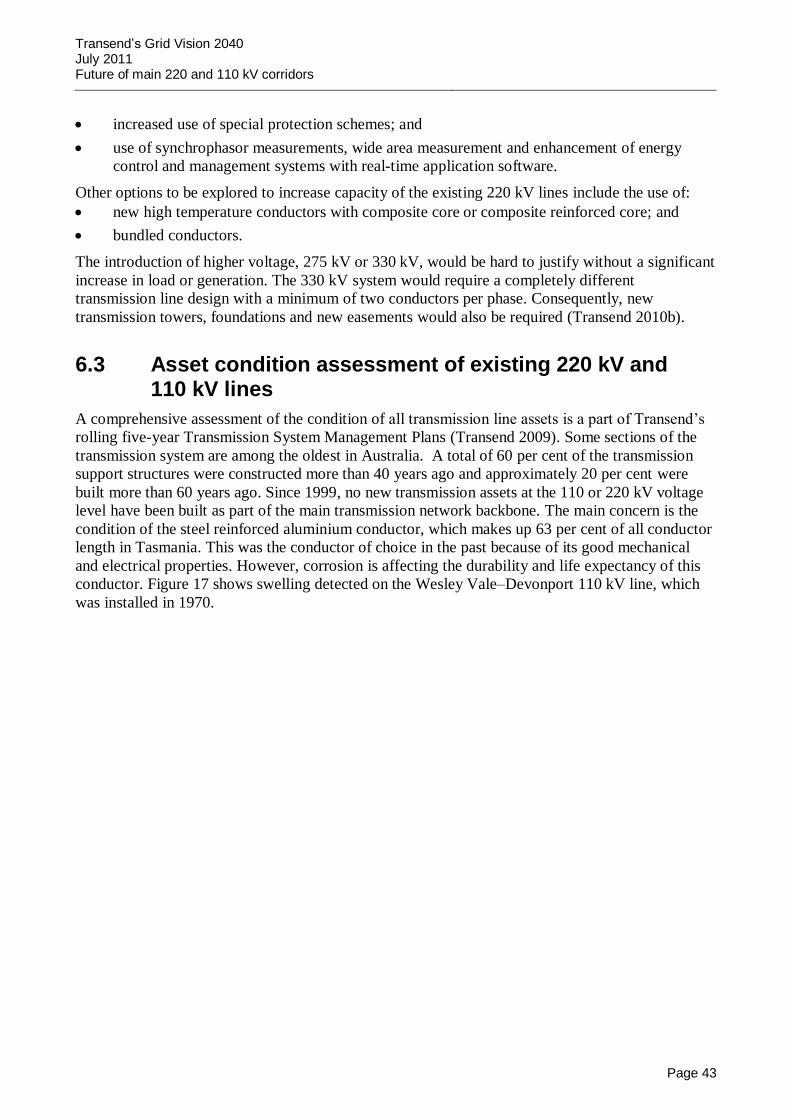
Transend’s Grid Vision 2040 July 2011 Future of main 220 and 110 kV corridors
Page 43
increased use of special protection schemes; and
use of synchrophasor measurements, wide area measurement and enhancement of energy
control and management systems with real-time application software.
Other options to be explored to increase capacity of the existing 220 kV lines include the use of:
new high temperature conductors with composite core or composite reinforced core; and
bundled conductors.
The introduction of higher voltage, 275 kV or 330 kV, would be hard to justify without a significant
increase in load or generation. The 330 kV system would require a completely different
transmission line design with a minimum of two conductors per phase. Consequently, new
transmission towers, foundations and new easements would also be required (Transend 2010b).
6.3 Asset condition assessment of existing 220 kV and 110 kV lines
A comprehensive assessment of the condition of all transmission line assets is a part of Transend’s
rolling five-year Transmission System Management Plans (Transend 2009). Some sections of the
transmission system are among the oldest in Australia. A total of 60 per cent of the transmission
support structures were constructed more than 40 years ago and approximately 20 per cent were
built more than 60 years ago. Since 1999, no new transmission assets at the 110 or 220 kV voltage
level have been built as part of the main transmission network backbone. The main concern is the
condition of the steel reinforced aluminium conductor, which makes up 63 per cent of all conductor
length in Tasmania. This was the conductor of choice in the past because of its good mechanical
and electrical properties. However, corrosion is affecting the durability and life expectancy of this
conductor. Figure 17 shows swelling detected on the Wesley Vale–Devonport 110 kV line, which
was installed in 1970.

Transend’s Grid Vision 2040 July 2011 Future of main 220 and 110 kV corridors
Page 44
Figure 17 Swelling of steel reinforced aluminium conductor due to the development of galvanic corrosion
Some lines in the main 220 kV transmission backbone were installed in 1957 and there is concern
that conductors will reach the end of their useful lives by 2020. Options for their replacement with
new higher temperature, low sag and smooth body composite conductors now available on the
market are being considered.
6.4 Alternative conductors
Since 1999 Transend has been using all aluminium alloy conductors (AAAC) as default conductors,
when economically justified, for new transmission lines as well as for upgrade work and to improve
line ratings.
Future overhead augmentation work to address age and thermal limitations may require the
retention of existing towers with little or no reinforcement work. This would require the use of the
new conductor technology now available on the market.
Some typical types of new technology conductors are featured in Figure 18, including:
aluminium conductors with composite core and trapezoidal wire shape (ACCC/TW);
aluminium conductors with aluminium fibre composite reinforced core (ACCR); and
super heat-resistant aluminium alloy conductors with galvanized INVAR core (ZTACIR).
These conductors have low drag, low sag high operating temperatures and lower weight
characteristics than comparable ACSR or AAAC conductors.

Transend’s Grid Vision 2040 July 2011 Future of main 220 and 110 kV corridors
Page 45
Figure 18 Alternative conductors for main core grid
General cable
Aluminium conductor with composite core
3M Aluminium
conductor composite
reinforced
Thermal resistant
aluminium INVAR
reinforced
6.5 Market constraints in existing 220 kV corridors
Transend’s Annual Planning Report (Transend 2010c) provides details about transmission network
performance, including data on market constraints. Constraints are reported as binding or violating
constraints. The table below summarises the constraints for 220 kV corridors over three years.
Table 4 220 kV corridor constraints in 2007, 2008 and 2009
Constraint Number of 5 min dispatching intervals
bound in 2007
Number of 5 min dispatching intervals
bound in 2008
Number of 5 min dispatching intervals
bound in 2009
Palmerston–Sheffield thermal constraint, no outage
30 988 5,790
Liapootah–Chapel Street thermal constraint, no outage
39 218 178
Liapootah–Chapel Street voltage stability constraint
121 201 156
Sheffield–Farrell thermal constraint, no outage
126 463 288
With the commissioning of the new Waddamana–Lindisfarne 220 kV transmission line in 2011, it
is expected that constraints on the Liapootah–Chapel Street 220 kV corridors will be resolved well
into the future. The Sheffield–Farrell 220 kV corridor limitation is related to the high west coast
generation scenario and is not a limiting factor during export when network control and the system
protection scheme is armed to allow higher then N–1 loading of the corridor. The main concern is
the limitation on the Palmerston–Sheffield 220 kV corridor.

Transend’s Grid Vision 2040 July 2011 Future of main 220 and 110 kV corridors
Page 46
6.6 Farrell–Burnie–Sheffield–Farrell 220 kV triangle
The Farrell Substation on the west coast of Tasmania is a connection point to more than 620 MW of
hydro generation with only 80 MW of load connected. Therefore 220 kV corridor between Farrell
and Sheffield substations mainly export power to the rest of the system. This corridor in 2010 was
constraint for (Transend 2010c):
288 dispatching intervals in normal system configuration;
326 dispatching intervals during an outage; and
17 dispatching intervals due to transient stability conditions.
The existing arrangement is shown in Figure 19. It is proposed to establish a 220 kV Farrell–
Burnie–Sheffield–Farrell triangle as shown in Figure 20. The advantages of this development are:
enhanced security of supply to the Burnie area with an alternative 220 kV supply;
concerns regarding the old ACSR conductor are addressed;
concerns regarding voltage and transient stability on the west coast are addressed;
removal of market constraints on Sheffield–Farrell 220 kV corridor, opening opportunities for
the connection of additional renewable generation on the west coast to the grid;
increased capacity in the 220 kV network for large-scale load development and connection to the grid;
increased opportunities provided for the connection of renewable generation to the grid in the north-west; and
increased opportunities provided for a second Bass Strait DC link connection in the north-west.
Figure 19 Farrell–Burnie–Sheffield–Farrell 220 kV existing arrangement

Transend’s Grid Vision 2040 July 2011 Future of main 220 and 110 kV corridors
Page 47
Figure 20 Farrell–Burnie–Sheffield–Farrell 220 kV proposed arrangement
6.7 Palmerston–Sheffield–George Town–Palmerston 220 kV triangle
The existing arrangement is shown in Figure 21. The Palmerston–Sheffield 220 kV transmission
line is a section of the first 220 kV line installed in Tasmania in 1957. It is a single circuit, flat
design structures 220 kV line with ACSR Goat conductor originally designed for 49 deg operation
but upgraded to 65 deg operation in 2002/03. This line loading is controlled by thermal and
transient stability constrained equations. In 2009 this line rating was bounding 988 dispatching
intervals and in 2010, 5,790 dispatching intervals as shown in the Table 3 above. Replacement of
this line with a new double circuit 220 kV line is proposed, as shown in Figure 22. The advantages
of this development are:
it addresses concerns regarding old ACSR conductor installed in 1957;
it provides an opportunity to convert the existing line to 110 kV operation which will
strengthen 110 kV network and enable establishment of a new connection point at Ashley, as requested by Aurora Energy;
concerns regarding system transient stability are addressed ;
the removal of market constraints on the Palmerston–Sheffield 220 kV corridor;
increased capacity in the 220 kV network for potential large-scale renewable generation development and connection to the grid;
it provides opportunities for a second Bass Strait DC link connection in the north-west;
enhanced security of supply to the greater Launceston area with the second 220/110 kV injection; and
space limitations and concerns for security of supply for the George Town Substation will be addressed with the establishment of George Town No 2 switchyard.
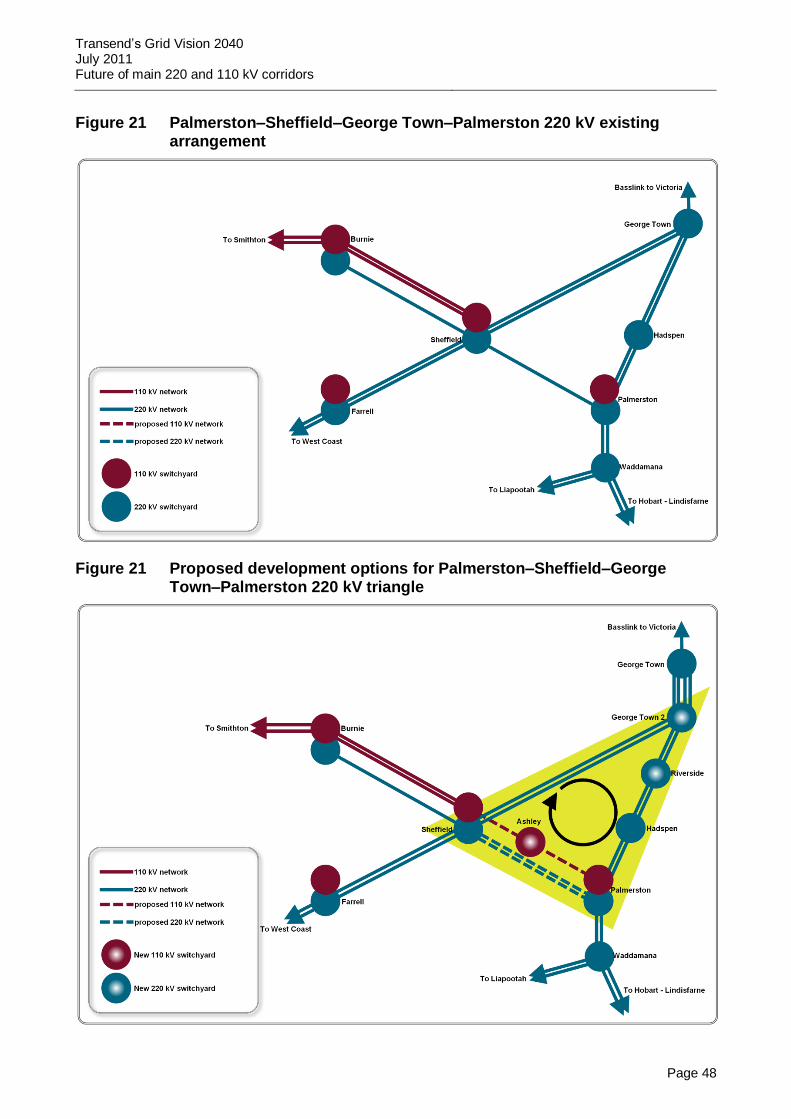
Transend’s Grid Vision 2040 July 2011 Future of main 220 and 110 kV corridors
Page 48
Figure 21 Palmerston–Sheffield–George Town–Palmerston 220 kV existing arrangement
Figure 21 Proposed development options for Palmerston–Sheffield–George Town–Palmerston 220 kV triangle

Transend’s Grid Vision 2040 July 2011 Future of main 220 and 110 kV corridors
Page 49
6.8 Palmerston–Waddamana 220 kV corridor
This corridor links the northern and southern 220 kV supply parts of the transmission network
backbone. The security of this corridor is of paramount importance to keep the Tasmanian
transmission network intact. A single asset failure in this corridor can split Tasmanian 220 kV
transmission network into two islands.
There are a number of old assets in this corridor that need decommissioning. The establishment of a
220 kV substation at Waddamana and a Waddamana–Lindisfarne 220 kV transmission corridor
provide an opportunity to ensure the layout at substations and this corridor arrangement meet our
long-term vision. Figure 22 shows when different assets were built in this area. Dotted lines show
assets that are not in service. Additional sections of 110 kV transmission lines 409 and 410, built in
1937 and 1939 respectively, are no longer in service and require decommissioning. This will create
the space required for a new double circuit 220 kV line in this corridor. The 1957 transmission line,
which operates partly as the 220 kV Liapootah to Waddamana section (TL 502) and partly as the
110 kV Waddamana to Palmerston line (TL 410), could then be used for potential renewable
generation connection.
Figure 22 Existing arrangement between Palmerston–Waddamana–Liapootah
The preferred configuration for this corridor is shown in Figure 23. The proposed new double
circuit 220 kV line should be the same design and capacity as the existing Liapootah–Palmerston
220 kV TL 527. This will strengthen the corridor and address issues of single asset failure and the
potential break-up of the Tasmanian system into north and south islands.

Transend’s Grid Vision 2040 July 2011 Future of main 220 and 110 kV corridors
Page 50
Figure 23 Proposed future arrangement between Palmerston and Waddamana
6.9 Future supply for the greater Hobart area
The greater Hobart area is a major population and load centre in Tasmania. The maximum winter
load approaching 800 MW which is currently equally balanced by Gordon and lower and upper
Derwent river hydro power stations. Chapel Street Substation used to be the only 220 kV injection
in the area and Liapootah–Chapel Street 220 kV corridor used to be the only 220 kV supply
corridor to the area. Commissioning of the Waddamana–Lindisfarne 220 kV double circuit line and
the Waddamana and Lindisfarne 220 kV substations is scheduled for mid 2011. This will provide a
second 220 kV source and second 220 kV supply corridor to the greater Hobart area and address
security of supply issues to the capital city, as shown in Figure 24.
Transend’s Grid Vision 2040 July 2011 Future of main 220 and 110 kV corridors
Page 51
Figure 24 Supply arrangements for the greater Hobart area in 2011
The 110 kV transmission lines connecting the upper Derwent River power station at Tarraleah, with
Tungatinah, Lake Echo and Derwent Bridge were built in the 1930s and 1950s. They have played a
vital role in ensuring security of supply to the area.
However, with the commissioning of the Waddamana–Lindisfarne 220 kV transmission line there
are opportunities to rationalise the 110 kV supply to the greater Hobart area and decommission
some or all of these old 110 kV lines.
One option could be to keep a mix of 110 kV and 220 kV supply. This mixed arrangement which
can be realised with establishment of 220/110 kV yard at Tarraleah is suitable to provide long-term
security of supply to the greater Hobart area. Another option is to maximise decommissioning of
old 110 kV lines by installation of one auto transformer 220/110 kV at Waddamana and
establishment of 220 kV yard and installation of one autotransformer at Tarraleah. This option will
increase utilisation of the new 220 kV asset installed at Waddamana and Lindisfarne. In the high
growth development scenario, additional 220 kV lines would be required with an option to build a
new Waddamana to Lindisfarne double circuit 220 kV line. These options must be assessed against
a potential gas-fired power station in the greater Hobart area, possibly located at Bridgewater or
Brighton. The proposed arrangement is shown in Figure 25.

Transend’s Grid Vision 2040 July 2011 Future of main 220 and 110 kV corridors
Page 52
Figure 25 220 kV loop and rationalisation of 110 kV supply in the greater Hobart area
In addition to voltage stability management in the area, conditions of Liapootah–Chapel Street 220
kV lines ACSR Goat conductor installed in 1961 will stay main concern for secure supply in the
future. Potential extension of the 220 kV network from Lindisfarne to Risdon and closing a 220 kV
loop with Chapel Street will easy access to these assets for maintenance or replacement purpose.
6.10 Project details
The proposed projects to address issues in the main 220 kV transmission network backbone are
listed in Appendix 1. A more detailed analysis would be required to assess the scale and need for
each project.
6.10.1 Overall budgetary cost
A total capital expenditure of $585.3 million (in 2010 dollars) is needed to strengthen the main 220
kV and 110 kV transmission networks over a period of 25 years. This would be invested over the
following revenue reset periods:

Transend’s Grid Vision 2040 July 2011 Future of main 220 and 110 kV corridors
Page 53
Table 4 Anticipated future revenue reset expenditure in 2010 dollars
Revenue reset
period
Anticipated capital expenditure: Base ($M)
Anticipated capital expenditure: With 30% contingency + allowances
($M)
2014–2019 166.2 236.1
2019–2024 77.8 109.3
2024–2029 147.1 206.0
2029–2034 136.9 191.6
2034–2039 57.3 80.2
TOTAL 585.3 823.2
Appendix 1 details the individual projects proposed for each revenue reset period.

Transend’s Grid Vision 2040 July 2011 Rationale for a second Bass Strait DC link
Page 54
7 Rationale for a second Bass Strait DC link
7.1 Introduction
This section examines the potential for the establishment of a second direct current (DC) link across
Bass Strait between Tasmania and Victoria. The performance of the existing DC interconnector
with Victoria is examined, followed by an explanation of the main drivers for a second
interconnector. A comparison between current and voltage source converter technologies is also
given.
Seven different options for a potential route across Bass Strait with a 220 kV or 500 kV connection
in Victoria were analysed. Some network upgrades in both Victoria and Tasmania would be
required to accommodate this link. This section finishes with a discussion about the best way to
develop the link, as a regulated or non-regulated (merchant) link. Market uncertainty, lack of stable
and sustainable policy and the risks facing a potential developer are not going to encourage private
sector to invest in a merchant link.
7.2 The existing Basslink interconnector
The existing Basslink interconnector between Tasmania and Victoria started commercial operation
on 29 April 2006. Since commissioning, the Basslink interconnector has been invaluable in
ensuring the security of supply in Tasmania. In the 2008–09 financial year, the import of electricity
through the Basslink interconnector contributed 26 per cent to the overall supply–demand balance
in Tasmania (Transend 2010d). The Basslink interconnector control scheme includes a frequency
control algorithm which, in addition to energy, enables the transfer of frequency control ancillary
services (FCAS) via Basslink. The energy and FCAS transfers are co–optimised as a part of the
AEMO dispatching engine algorithm. Due to a shortage of supply and particularly fast FCAS
services in Tasmania, Basslink’s operation can be constrained and occasionally Basslink can be
trapped on counter price flow. This does have an impact on the most effective use of this
interconnector, as the number of 5 minutes dispatching intervals on counter price flow is becoming
significant (2334 in 2008–09, Transend 2010d, 3587 in 2009–10, OTTER 2011).
7.3 Main drivers for a second DC interconnector
The main drivers for establishment of a second DC interconnector include the expanded renewable
energy target and introduction of an emissions trading scheme or carbon tax. It is expected that both
should encourage investments in renewable and gas fired generation. Tasmania with a reach wind
resources is a potential location for further wind generation development. This is confirmed by the
least-coast generation expansion planning done by AEMO as a part of the National Transmission
Network Development Plan 2010 (AEMO 2010). AEMO’s least-coast expansion tool models at
least 500 MW of wind generation in Tasmania under all scenarios, and a high of 2,050 MW under
the uncertain world scenario with low carbon price.
A second Bass Strait DC link would create opportunities for new entrants in generation and retail
sectors to trade across the link, addressing the current lack of competition in generation and retail sectors in Tasmania, and would enable additional transfer of FCAS services in the State.

Transend’s Grid Vision 2040 July 2011 Rationale for a second Bass Strait DC link
Page 55
The need for construction of a new gas power station in Victoria could be delayed or removed
entirely and potential future carbon credit payments in Tasmania would be reduced. Fuel diversity
in the NEM would be increased and further interconnection in the NEM would be achieved.
7.4 Current source converter vs voltage source converter technologies
The Basslink interconnector was designed and built using current source converter technology. Due
to the characteristics of this technology, Basslink has a ‘no-go’ zone from –50 MW to +50 MW
inside which all FCAS services must be sourced internally from Tasmania. This can cause
occasional spikes in FCAS prices in Tasmania due to a shortage of supply of these services in the
State. Extraordinarily high FCAS costs occurred in Tasmania during the first three weeks of April
2009 (Transend 2010d).
Other disadvantages of this technology include commutation failure due to a disturbance in the
main grid supply and minimum fault level requirements because the technology depends on an
adequate short circuit ratio (SCR) between the network’s short circuit level and its own MVA rating
for stable operation.
Current source converter technology also requires reactive power and harmonic filtering. Each
converter station is equipped with several capacitor banks, which are located in large outdoor
switchyards. Other issues include temporary over voltage (TOV), particularly when connected to
weak AC systems as can occur in Tasmania, and voltage polarity reversal to change power flow
direction, which is a particular issue for long DC cable applications. In order for the Basslink cable to execute a power reversal sequence, a two minute de-energisation timeframe is required.
There is now a viable alternative to the current source converter technology, especially for long DC
cable applications. This new technology is based on voltage source converter technology, which has
already been applied in Australia for the Murraylink and Directlink interconnectors. Voltage
sourced converter technology has a number of advantages when compared with the current source
converter technology used in Basslink (Transend 2010d).
The new technology provides full control, with no additional reactive support required, and only
minimal filters, if any, are needed. Consequently, there is no temporary over voltage issue to
manage as this technology can operate at any power factor. Power reversal with this technology can
be achieved by reversing the DC current direction and it has bi-directional linear DC current,
eliminating dead zones.
It allows for the use of lower cost XLPE cables (ABB and Prysmian submarine and land cables, as
shown in Figure 26) and there is good harmonic performance when properly controlled. Improved
AC fault performance with no commutation failures means there is no need for minimum fault level requirements.
The new technology also provides more stability with weak AC systems and easier implementation
of multi-terminal and black-start capabilities. Power can be transmitted even with severely
imbalanced AC supply voltages and a smaller footprint is required because there is no need for
capacitor banks or filters.
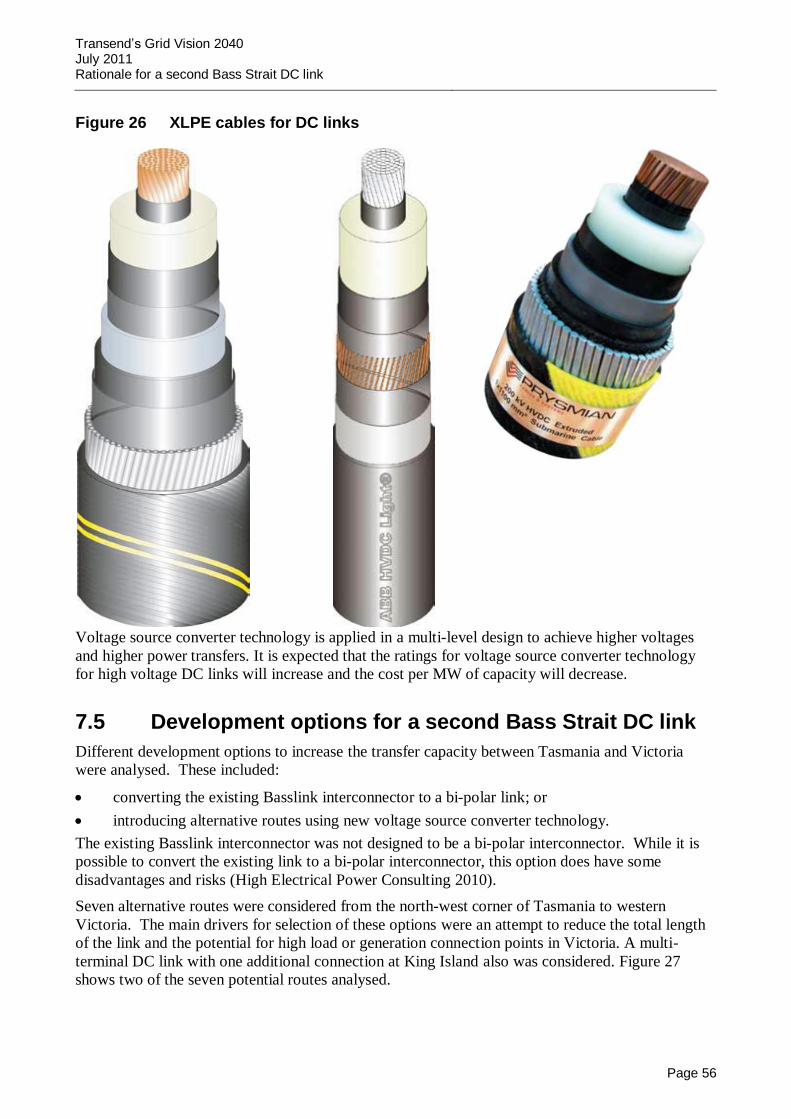
Transend’s Grid Vision 2040 July 2011 Rationale for a second Bass Strait DC link
Page 56
Figure 26 XLPE cables for DC links
Voltage source converter technology is applied in a multi-level design to achieve higher voltages
and higher power transfers. It is expected that the ratings for voltage source converter technology
for high voltage DC links will increase and the cost per MW of capacity will decrease.
7.5 Development options for a second Bass Strait DC link
Different development options to increase the transfer capacity between Tasmania and Victoria
were analysed. These included:
converting the existing Basslink interconnector to a bi-polar link; or
introducing alternative routes using new voltage source converter technology.
The existing Basslink interconnector was not designed to be a bi-polar interconnector. While it is
possible to convert the existing link to a bi-polar interconnector, this option does have some
disadvantages and risks (High Electrical Power Consulting 2010).
Seven alternative routes were considered from the north-west corner of Tasmania to western
Victoria. The main drivers for selection of these options were an attempt to reduce the total length
of the link and the potential for high load or generation connection points in Victoria. A multi-
terminal DC link with one additional connection at King Island also was considered. Figure 27
shows two of the seven potential routes analysed.

Transend’s Grid Vision 2040 July 2011 Rationale for a second Bass Strait DC link
Page 57
Figure 27 Potential routes for second Bass Strait DC link
Main connections in Victoria are to the existing 500 kV Moorabool–Haywood corridor, potentially
at the Mortlake gas-fired power station or Shaw River gas-fired power station yards. Additional
generation projects are proposed in this part of Victoria, such as at Mortlake, Macarthur, Ryans
Corner and Hawkesdale, and the Mt Gellibrand wind farm and Tarrone gas-fired power station.
These could potentially lead to the establishment of new 220 and 500 kV connection points in this
area. The potential upgrade of this 500 kV corridor and the 220 kV triangle Terang–Ballarat–
Moorabool could be required, see Figure 28.
Shaw River Mortlake
230 km
Apollo Bay
West Montagu Cape Grim
Warrnambool
Point Henry aluminium smelter
Portland aluminium smelter Existing Basslink
Interconnector 290 km

Transend’s Grid Vision 2040 July 2011 Rationale for a second Bass Strait DC link
Page 58
Figure 28 Potential network upgrades required in Victoria
A transmission network extension and deeper transmission network upgrades in Tasmania would be
required to realise full potential of this interconnector, as shown in Figure 29.
Figure 29 Potential transmission network upgrades required in Tasmania

Transend’s Grid Vision 2040 July 2011 Rationale for a second Bass Strait DC link
Page 59
These deeper transmission network upgrades could be done in stages and can follow the level of
renewable generation development. There are currently a lot of interconnectors in size of 500 MW
in development stages around the world and this size was just used as an example in the Grid Vision
2040 development and National Transmission Network Development Plan 2010.
AEMO, as a part of the National Transmission Network Development Plan 2010, designed a
conceptual project called NEMLink which is envisaged for large-scale power transfers between all
NEM regions. The second Bass Strait DC link was included as a part of the NEMLink concept. The
level of the benefits observed and uncertainties related to carbon tax do warrant further
investigation and modelling and different scenarios creation for potential staged development of the
NEMLink concept (AEMO 2010).
Therefore, more detailed market simulation studies for calculation of market benefits with the
second DC link plus required deeper network upgrades in Victoria and Tasmania would need to be
performed against alternative options to demonstrate financial viability of this link. Steady state and
dynamic system studies also would need to be performed to understand the impact of this link on
the performance of both the Tasmanian and Victorian systems and any potential impact on the
existing Basslink operation. Also, preliminary planning issues, such as land availability, impact on
flora, fauna and marine reserves, and heritage issues, would need to be analysed to assess the actual
viability of this project.
7.6 Merchant or regulated link
The existing Basslink interconnector is a market service provider and non-regulated or merchant
interconnector. Even though the Basslink interconnector is not a regulated interconnector, revenue
from the facility is guaranteed through the Basslink Service Agreement between Basslink Pty Ltd
and Hydro Tasmania. This financial arrangement which underpinned Basslink’s development,
transfer all market-based inter regional revenue payments to Hydro Tasmania in return for the
payment of monthly facility fees. The financial arrangement, physical, trading and other
implications of the commercial arrangement between Basslink Pty Ltd and Hydro Tasmania are
central matters for a Tasmanian Electricity Supply Industry Expert Panel review which is now
underway (Electricity Supply Industry Expert Panel, 2011). The Basslink role in delivering
competition outcomes in the wholesale sector in Tasmania would be closely examined.
There is a safe harbouring section in the rules (Clause 2.5.2 (c)) providing for the later conversion
of a non-regulated interconnector to a regulated interconnector, which distinguishes Australia from
the rest of the world. However, lessons learned from the conversion of the Murraylink and
Directlink interconnectors to regulated interconnectors (Transend 2010d) indicate that the
Regulatory Investment Test for Transmission would be applied up front to test the financial
viability of potential future interconnectors. Other mechanisms could be put in place to protect
developers from the financial risk associated with the volatility of the market. Greater uncertainty,
unstable and non sustainable government policies and risk exposure would not encourage private
investments in a non-regulated or merchant interconnector.

Transend’s Grid Vision 2040 July 2011 North-west and west coast region
Page 60
8 North-west and west coast region
8.1 Introduction
This section describes the existing transmission system arrangement in the north-west and west
coast region, the main issues and drivers for transmission system development and proposed options
to address these issues. It also includes a list of envisaged projects for the next 30 years.
Both areas recently experienced a drop in electricity demand due to the closure of some major
industries, such us paper production and vegetable processing (Transend 2010e). The low price of
commodities on the international market, particularly zinc, copper, tin, nickel and silica, also has
had an impact on existing mining operations on the west coast, with some mines discontinuing
operations and put on care and maintenance. In addition, some proposed mining ventures have not
progressed far enough in the development stages to be considered as committed projects. However,
both areas offer opportunities for load development due to the extent of their natural resources and
access to port facilities. They also have the potential for the development of renewable generation
due to very good wind resources.
8.2 Existing transmission system arrangement
The north-west region includes Devonport and Burnie, the third and fourth largest population
centres in Tasmania. In addition to residential and small commercial loads, the region has a well-
developed agricultural sector. It is supplied from a single 220 kV switchyard at Sheffield
Substation. There is no alternative 220 kV supply to the region. The 110 kV transmission link
between Burnie, Hampshire and Farrell is weak and is kept open at Hampshire in normal system
operation as shown in Figure 30.
Figure 30 North-west region existing arrangement

Transend’s Grid Vision 2040 July 2011 North-west and west coast region
Page 61
8.3 Main issues and drivers for development in north-west
Issues to be addressed to provide a more reliable and secure supply to the north-west include:
security of supply and load growth management in Devonport;
security of supply and load growth management in Burnie; and
voltage stability and voltage collapse management in the north-west.
In assessing the system, attention was also given to the requirements of the local Electricity Supply
Industry Regulation 2007, and in particular addressing a single asset failure event (resulting in
3000 MWh of unserved energy) which could affect several circuits in this area in the future.
Long-term forecasts for the north-west region indicate no significant load growth is likely in the
region in the next 30 years. The recent closure of Australian Paper factories at Wesley Vale (25
MVA load) and Emu Bay (15 MVA load) and the closure of the McCain vegetable processing plant
in Smithton were factored into the load forecast. However, these and other well-developed
industrial sites, including Port Latta, offer opportunities for alternative industrial load development.
8.3.1 Security of supply and load growth management in Devonport
Figure 31 shows current supply arrangements in the Devonport area. There is only one 110/22kV
injection point that supplies not only Devonport but a broad area around the city including the
Cradle Mountain tourist area to the south and Port Sorell to the east.
Figure 31 Devonport current supply arrangement
The load forecast shows no significant increase in winter load in Devonport in future years (0.6%
per year). Transend has recently upgraded all three transformers in Devonport (3x30 MVA), all
110 kV yards and switchgear and all 22 kV equipment, including a new switch house, and
protection and control gear. The main concern for the future is security of supply due to reliance on
a single injection point and only one 110 kV transmission line from Sheffield to Devonport. This
16.2 km double circuit line with Tern ACSR was built in 1969. To address these limitations, the
following options were considered:
the conversion of Wesley Vale Substation to 110/22 kV supply;
strengthening the 22 kV feeder ties between Devonport, Ulverstone and Railton substations; and

Transend’s Grid Vision 2040 July 2011 North-west and west coast region
Page 62
establishing a 110 kV network tie with Palmerston, Hadspen or George Town.
The future proposed supply arrangement for Devonport is shown in Figure 32. Transend is working
with Aurora Energy to establish the best timeframe for the different stages of the development. The
reinforcement of 22 kV ties between Devonport and adjacent substations will increase utilisation of
the distribution network, which will require changes in the design of the main 22 kV feeder trunks.
With full automation in place, the transfer of load to adjacent substations through the distribution
network in the case of catastrophic failure of transmission assets will lead to more intelligent use of
the existing distribution and transmission assets without the need for a massive investment in the
transmission network.
Figure 32 Devonport future supply arrangement
Establishment of the Ashley 110/22 kV connection point for Aurora Energy, planned for 2017, will
enable preparation and planning for an alternative 110 kV supply to be provided from Palmerston
Substation. This alternative 110 kV supply could also include Railton Substation and would
increase security of supply to Railton, Devonport and Wesley Vale substations.
8.3.2 Security of supply and load growth management in Burnie
The current electricity supply arrangement in the Burnie area is shown in Figure 33. The Burnie
CBD is supplied by 11 kV feeders from Emu Bay Substation. This substation also was used to
supply the nearby Australian Paper factory, which closed in 2010. The rest of the Burnie area is
supplied by 22 kV feeders from Burnie 110/22 kV substation. This extensive area includes small
townships such as Penguin and Wynyard. Forecasts for the Burnie Substation show that the load at
Burnie already exceeds the firm 60 MVA supply and is envisaged to grow further to 86 MVA by
2040.

Transend’s Grid Vision 2040 July 2011 North-west and west coast region
Page 63
Figure 33 Burnie area existing supply arrangement
Possible options to address this risk at the Burnie Substation include:
gradually phasing out the 11 kV network and converting Emu Bay Substation to 22 kV supply;
establishing a 110/22 kV connection point at Wynyard; and
establishing a 110/22 kV connection point at Penguin.
These three projects would meet load growth at Burnie Substation and keep the load below the firm
capacity, and reduce 22 kV feeder exposure by decreasing the number of customers connected to a
feeder, inherently improving reliability of supply.
The projects also would address the long-term future and security of supply to the Burnie CBD,
which would be converted to 22 kV and supplied from Emu Bay Substation with back-up available
from Burnie 22 kV feeders. Management of the capacity issue would be improved by sharing the
load between Port Latta, Burnie and Ulverstone areas, with new 22 kV injection points at Wynyard,
Emu Bay and Penguin.
Timing for these proposed developments will be coordinated with Aurora Energy.
Like Devonport, Burnie is supplied from the Sheffield 220 kV source. This means security of
supply from Sheffield will continue to be the main challenge in the future. Supply is available from
the Woolnorth wind farm in the north-west via the 110 kV network but it is not possible to operate
the Burnie area in an ‘island’ situation using this source. Alternative options for strengthening the
110 kV or 220 kV ties with other part of the network have been investigated, including reinforcing
the 110 kV supply from Farrell and creating a 220 kV triangle (Farrell–Burnie–Sheffield–Farrell).
The establishment of a 220 kV triangle with Farrell and Sheffield substations will remove current
market constraints on the Sheffield–Farrell 220 kV corridor and open opportunities for further

Transend’s Grid Vision 2040 July 2011 North-west and west coast region
Page 64
development of renewable generation on the west coast. The proposed future supply arrangement at
Burnie is illustrated in Figure 34.
Figure 34 Burnie area future supply arrangement
8.3.3 Voltage stability and voltage collapse management in the north-west
With a radial, single 220 kV supply from Sheffield, the north-west region can be exposed to voltage
stability and voltage collapse issues in the case of loss of the Sheffield–Burnie 220 kV line. A
110 kV capacitor bank has been installed at Burnie and 22 kV capacitor banks at Port Latta and
Ulverstone to provide steady state reactive support. If renewable generation increases in the region,
particularly with the development of wind farms at Robins Island and Jims Plain and on the west
coast, a dynamic reactive power device will need to be installed in the region.
In developing Grid Vision 2040, market simulation and system studies have been undertaken
including wind generation penetration and a second direct current interconnector with Victoria. The
analysis shows that the considered dynamic reactive support in Burnie will provide invaluable
inertia and fault level contributions in addition to the fast voltage control and support in the area.
8.4 Existing transmission system arrangement on the west coast
The west coast of Tasmania is well known for its rich mineral and ore deposits, stretching from
Queenstown to Rosebery and Savage River. The mining industry started in the early 1890s and over
the years has experienced frequent ups and downs, depending on the fortunes of the commodities
market. With a pattern of mines closing and then re-opening, there is a lot of uncertainty in demand
forecasting. That makes long-term load forecasting for the mining industry, and the region as a
whole, a particularly daunting task.

Transend’s Grid Vision 2040 July 2011 North-west and west coast region
Page 65
Exploration and investigations for new mineral deposits are continuing and it is likely that some
new supply points could be required while some existing ones could be closed.
Figure 35 shows the existing supply arrangement on the west coast. The region is supplied from the
Farrell 220/110 kV Substation. Farrell Substation is also a main connection point for more than 620
MW of Hydro Tasmania generation. The 110 kV network developed from this substation is a radial
network mainly supplying the mining industry at Queenstown, Rosebery, Que and Savage River.
There is only limited 110 kV supply from Burnie and this is not available in normal system
operation. There is an open point at Hampshire.
Figure 35 Existing west coast supply arrangement
8.5 Main issues and drivers for development on the west coast
To ensure the continuation of a reliable and secure supply to the west coast in the future, some
issues need to be addressed, including:
security of supply and potential load growth management in Rosebery;
security of supply and potential load growth management in Queenstown; and
voltage stability and voltage collapse management in the region.

Transend’s Grid Vision 2040 July 2011 North-west and west coast region
Page 66
In assessing the system, attention was given to the Electricity Supply Industry (Network
Performance Requirements) Regulations 2007, in particular to single asset failure event
requirements (resulting in a 3000 MWh unserved energy loss), which could affect several circuits in
this area in the future.
Long-term forecasts provide no evidence of significant load growth in the region in the next 30
years. But price volatility of commodities on the international market requires consideration of a
broad spectrum of development options, from a ‘do-minimum’ approach to the potential
development of a 66 kV ring along the west coast.
8.5.1 Security of supply to Rosebery and Queenstown
To provide a secure supply to Rosebery and Queenstown in the future, the following options were
considered:
8.5.1.1 Maintain the existing 44 kV supply arrangement
This option envisages minor changes at the Rosebery and Queenstown substations to increase
security of supply and keep 44 kV voltage for the mining industry and Aurora Energy’s distribution
network. The potential development of a 220 kV triangle between Farrell, Burnie and Sheffield
substations could be triggered by the further development of renewable generation on the west
coast. This proposed arrangement, which is shown in Figure 36, also:
enables decommissioning of the old Queenstown–Newton 110 kV transmission line 406 built in 1936; and
provides for the establishment of a supply ring Farrell–Rosebery–Queenstown–Farrell with the installation of one 220/110 kV autotransformer at Queenstown.
This proposed arrangement keeps the existing 44 kV distribution network for Aurora Energy and
the mining industry. However, any new potential development will require extensions to the 44 kV
or 22 kV distribution network. There would also be an opportunity to close a loop between Zeehan
and Strahan on the west coast, but with a limited 22 kV network capacity.

Transend’s Grid Vision 2040 July 2011 North-west and west coast region
Page 67
Figure 36 West coast future supply arrangement – 44 kV option
8.5.1.2 Introduce 66 kV voltage on the west coast
If the environment for mining developments on the west coast improves, more connection points
with load sizes not capable of being supplied by the 22 kV or 44 kV networks could be required. In
this case, one option would be to develop a 66 kV ring around the west coast with Aurora Energy
developing 66/22 kV zone substations to connect customers.
Upgrading supply voltage from 44 to 66 kV and establishing a 66 kV loop would require:
the establishment of 220/66 kV connection points at Farrell and Queenstown substations for Aurora Energy; and
the establishment of a 66 kV ring, with Aurora building 66/22 kV zone substations in Zeehan, Strahan, Renison, Rosebery and Mt Lindsay.
This option is shown in Figure 37.

Transend’s Grid Vision 2040 July 2011 North-west and west coast region
Page 68
Figure 37 West coast future supply arrangement – 66 kV supply option
This option has the advantage of increasing the capacity of the network and providing for the
connection of bigger load points or renewable generation to the 66 kV network. Reliability of
supply to Strahan has been an issue for Aurora for some time and the closure of the 66 kV loop
would assist by providing firm supply. The biggest disadvantage of this option is cost and the
uncertainty of future load growth in the area driven by volatility of commodity prices in the
international market.
8.5.2 Voltage stability and voltage collapse management
Farrell Substation is a main connection point for more than 620 MW of power produced by Hydro
Tasmania power stations on the west coast. Voltage issues management previously has not been a
problem in this area due to the availability of generation. But since joining the electricity market it
has been observed that on some occasions all west coast generation could be out of service and not
scheduled. In addition, on some occasions the adjacent Mersey–Forth hydro generators also were
not scheduled. These market events left the west coast exposed without one synchronous generator
providing reactive power for voltage support. To date, Transend has not installed any steady state or
dynamic reactive power devices in this region. However, as part of the Grid Vision 2040
development, installation of a 110 kV capacitor bank at Farrell Substation for steady state reactive

Transend’s Grid Vision 2040 July 2011 North-west and west coast region
Page 69
support was considered to cater for these events and at the same time reduce reliance on Hydro
Tasmania generators for the provision of this service.
8.6 Project details
The proposed projects to address issues in the north-west and on the west coast are listed in
Appendix 1. Further more detailed analysis would need to be performed to determine the exact
requirements and need for each project.
8.6.1 Overall budgetary cost
A total capital expenditure of $97.2 M is expected for proposed projects in the north-west and on
the west coast over a period of 25 years. This investment would be required over the following
revenue reset periods:
Table 5 Anticipated future revenue reset expenditure in the north-west and on the west coast (in $2010, base estimate and 30% contingency plus allowances estimate included)
Revenue reset period Anticipated capital expenditure:
Base ($M)
Anticipated capital expenditure:
With 30% contingency + allowances ($M)
2014–2019 11.8 16.1
2019–2024 8.8 12.7
2024–2029 47.5 67.9
2029–2034 12.5 16.7
2034–2039 16.6 24.7
TOTAL 97.2 138.1
Appendix 1 details the individual projects applicable to each revenue reset period.
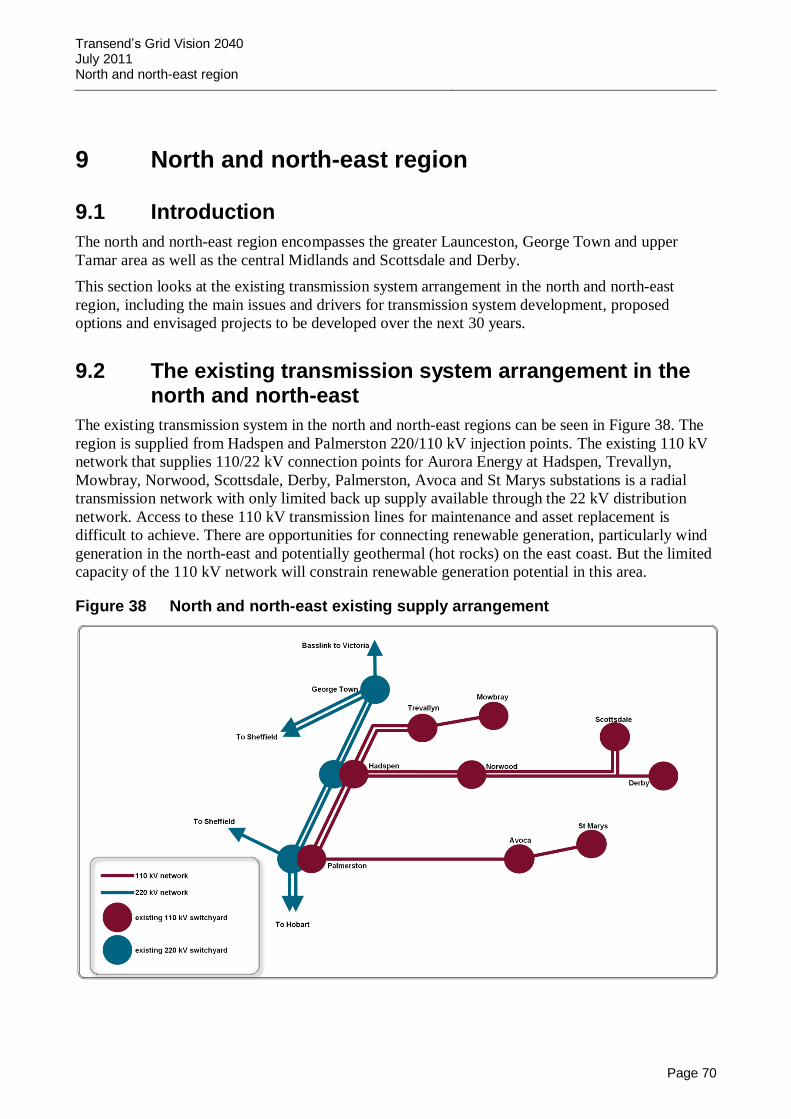
Transend’s Grid Vision 2040 July 2011 North and north-east region
Page 70
9 North and north-east region
9.1 Introduction
The north and north-east region encompasses the greater Launceston, George Town and upper
Tamar area as well as the central Midlands and Scottsdale and Derby.
This section looks at the existing transmission system arrangement in the north and north-east
region, including the main issues and drivers for transmission system development, proposed
options and envisaged projects to be developed over the next 30 years.
9.2 The existing transmission system arrangement in the north and north-east
The existing transmission system in the north and north-east regions can be seen in Figure 38. The
region is supplied from Hadspen and Palmerston 220/110 kV injection points. The existing 110 kV
network that supplies 110/22 kV connection points for Aurora Energy at Hadspen, Trevallyn,
Mowbray, Norwood, Scottsdale, Derby, Palmerston, Avoca and St Marys substations is a radial
transmission network with only limited back up supply available through the 22 kV distribution
network. Access to these 110 kV transmission lines for maintenance and asset replacement is
difficult to achieve. There are opportunities for connecting renewable generation, particularly wind
generation in the north-east and potentially geothermal (hot rocks) on the east coast. But the limited
capacity of the 110 kV network will constrain renewable generation potential in this area.
Figure 38 North and north-east existing supply arrangement

Transend’s Grid Vision 2040 July 2011 North and north-east region
Page 71
9.3 Main issues and drivers for development
A number of issues require attention in order to provide a reliable and secure supply in the north
and north-east, including:
meeting load growth in Launceston;
ensuring security of supply to the greater Launceston area;
ensuring security of supply to the north-east and accommodating connections for potential renewable generation;
meeting irrigation load growth in the Midlands area;
securing supply to George Town and providing for potential renewable generation connection; and
addressing voltage stability and voltage collapse management issues in the north.
During system studies, attention was given also to the requirements of the local Electricity Supply
Industry Regulation 2007 and in particular to single asset failure event requirements (resulting in a
3000 MWh unserved energy loss) which could affect several circuits in this area in the future.
9.4 Load growth management in Launceston
Forecast load growth in the Launceston CBD has been reduced in comparison with previous years,
but will still exceed the firm rating of some existing substations, particularly at Trevallyn,
Mowbray, Norwood and Hadspen. Transend and Aurora Energy have been managing the loading of
substations by balancing the load between them and using available transfer capabilities in the
22 kV distribution network. Transend and Aurora are developing one additional 110/22 kV
injection point at St Leonards and the creation of a 110 kV loop around the Launceston CBD. This
is scheduled for commissioning before the winter of 2012.
Additional connection points will be required to address load growth over the next 30 years.
Proposed new substations (Transend 2010f) include:
Ashley (Westbury) 110/22 kV;
Launceston CBD 110/22 kV;
Longford 110/22 kV; and
Exeter 110/22 kV.
These substations are shown in Figure 46 on page 76.
The proposed Ashley Substation will also facilitate the provision of an alternative 110 kV supply to
Wesley Vale and Devonport substations, which are at risk of losing supply due to a single asset
failure. The Ashley Substation could address the loading issue at Railton Substation as well
providing capacity for any potential new industrial developments. This strategy was discussed in
detail in the ‘Security of supply and load growth management in Devonport’ section on page 59.
9.5 Security of supply to the greater Launceston area
9.5.1 New 220/110 kV injection point into Launceston
Hadspen Substation is a main 220/110 kV bulk supply point into Launceston and to other parts of
the north-east. Supply from Palmerston 220/110 kV Substation is limited by the capacity of the
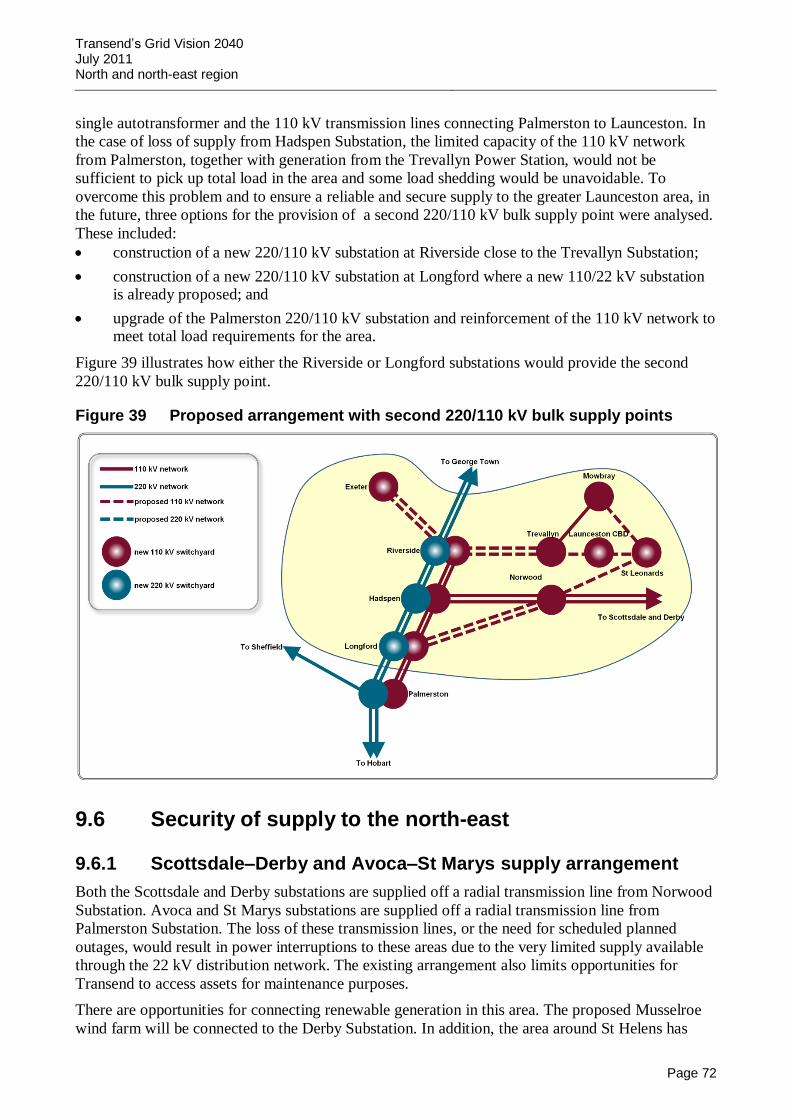
Transend’s Grid Vision 2040 July 2011 North and north-east region
Page 72
single autotransformer and the 110 kV transmission lines connecting Palmerston to Launceston. In
the case of loss of supply from Hadspen Substation, the limited capacity of the 110 kV network
from Palmerston, together with generation from the Trevallyn Power Station, would not be
sufficient to pick up total load in the area and some load shedding would be unavoidable. To
overcome this problem and to ensure a reliable and secure supply to the greater Launceston area, in
the future, three options for the provision of a second 220/110 kV bulk supply point were analysed.
These included:
construction of a new 220/110 kV substation at Riverside close to the Trevallyn Substation;
construction of a new 220/110 kV substation at Longford where a new 110/22 kV substation is already proposed; and
upgrade of the Palmerston 220/110 kV substation and reinforcement of the 110 kV network to meet total load requirements for the area.
Figure 39 illustrates how either the Riverside or Longford substations would provide the second
220/110 kV bulk supply point.
Figure 39 Proposed arrangement with second 220/110 kV bulk supply points
9.6 Security of supply to the north-east
9.6.1 Scottsdale–Derby and Avoca–St Marys supply arrangement
Both the Scottsdale and Derby substations are supplied off a radial transmission line from Norwood
Substation. Avoca and St Marys substations are supplied off a radial transmission line from
Palmerston Substation. The loss of these transmission lines, or the need for scheduled planned
outages, would result in power interruptions to these areas due to the very limited supply available
through the 22 kV distribution network. The existing arrangement also limits opportunities for
Transend to access assets for maintenance purposes.
There are opportunities for connecting renewable generation in this area. The proposed Musselroe
wind farm will be connected to the Derby Substation. In addition, the area around St Helens has
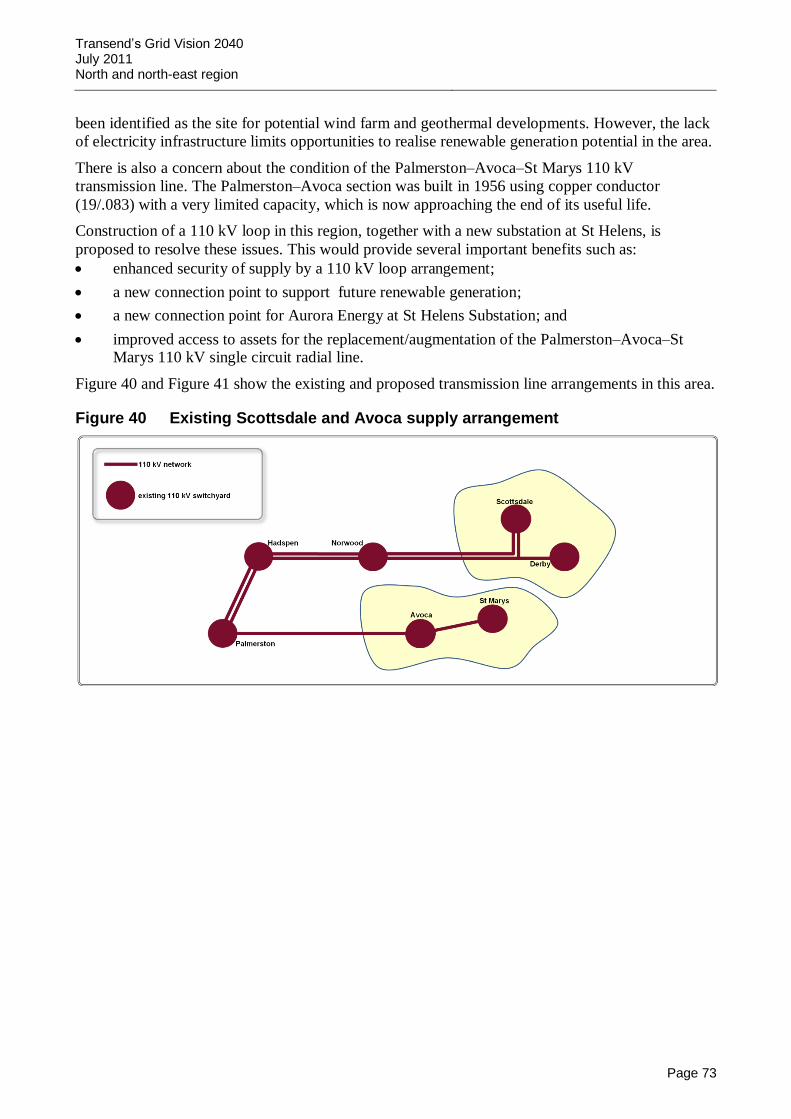
Transend’s Grid Vision 2040 July 2011 North and north-east region
Page 73
been identified as the site for potential wind farm and geothermal developments. However, the lack
of electricity infrastructure limits opportunities to realise renewable generation potential in the area.
There is also a concern about the condition of the Palmerston–Avoca–St Marys 110 kV
transmission line. The Palmerston–Avoca section was built in 1956 using copper conductor
(19/.083) with a very limited capacity, which is now approaching the end of its useful life.
Construction of a 110 kV loop in this region, together with a new substation at St Helens, is
proposed to resolve these issues. This would provide several important benefits such as:
enhanced security of supply by a 110 kV loop arrangement;
a new connection point to support future renewable generation;
a new connection point for Aurora Energy at St Helens Substation; and
improved access to assets for the replacement/augmentation of the Palmerston–Avoca–St Marys 110 kV single circuit radial line.
Figure 40 and Figure 41 show the existing and proposed transmission line arrangements in this area.
Figure 40 Existing Scottsdale and Avoca supply arrangement

Transend’s Grid Vision 2040 July 2011 North and north-east region
Page 74
Figure 41 Proposed Scottsdale and Avoca supply arrangement
9.7 Load growth in the Midlands area
9.7.1 Proposed Tunbridge Substation
The Midlands area, which extends from Campbell Town to Ross and Oatlands, has been identified
for reinforcement. This will:
improve reliability of the 22 kV distribution feeders in the area; and
meet requirements to supply new irrigation load.
The Tasmanian Government is promoting Tasmania as the food bowl of Australia (Tasmanian
Government 2010). Therefore, the Tasmanian Irrigation Development Board was established by the
Tasmanian Government in September 2008 to progress a number of regionally significant irrigation
schemes in many parts of Tasmania. One potential water development scheme is the Midlands
Water Scheme, where water pumps and other electrical load will require a secure and reliable
supply (Tasmanian Irrigation Development Board, 2010). There are also plans for the development
of mini hydro generation schemes in the area.
There is no 110/22 kV injection point in the Midlands area and load there is supplied via long
22 kV feeders from Avoca, Palmerston, Sorell and Meadowbank substations. It is proposed to
construct a new substation near Tunbridge to be supplied from the Palmerston– Avoca 110 kV
transmission line to address above requirements. Figure 41 provides details of this proposal.
9.8 Security of supply to George Town
9.8.1 George Town area
The existing George Town Substation is a connection point for:
the Basslink interconnector with Victoria;

Transend’s Grid Vision 2040 July 2011 North and north-east region
Page 75
Aurora Energy’s Tamar Valley open and combined cycle gas power stations;
major industrial loads including Rio Tinto’s aluminium smelter and Temco’s manganese
ferro-alloy plant; and
Aurora Energy’s retail load.
It is vital that security of supply to the George Town Substation is preserved at all times. The
substation has limited space for further expansion. The area is also very attractive as a site for major
industrial development (mining and wood processing) due to its port access.
This area also has good quality wind resources, low marginal costs and is close to electricity
infrastructure, making it suitable for the development of wind generation. In addition, Transend is
planning to install a dynamic reactive support device in the area.
Two options were considered for the establishment of a new 220 kV connection point in the George
Town area:
development of a new 220 kV switchyard at Long Reach; or
development of a 220 kV switchyard in Sidmouth.
Both locations are close to the existing Sheffield–George Town and Hadspen–George Town 220 kV
lines. The final decision regarding the preferred location will depend on the synergy of drivers for
development.
A new 110/22 kV substation is proposed at Exeter, which could help to manage retail load at the
George Town Substation by transferring and balancing load between these two injection points for
Aurora Energy. This new substation is shown in Figure 39 and Figure 46.
Figure 42 shows the proposed 220 kV arrangement including the potential Sidmouth and George
Town substations.
Figure 42 Options for the future 220 kV arrangement in George Town area
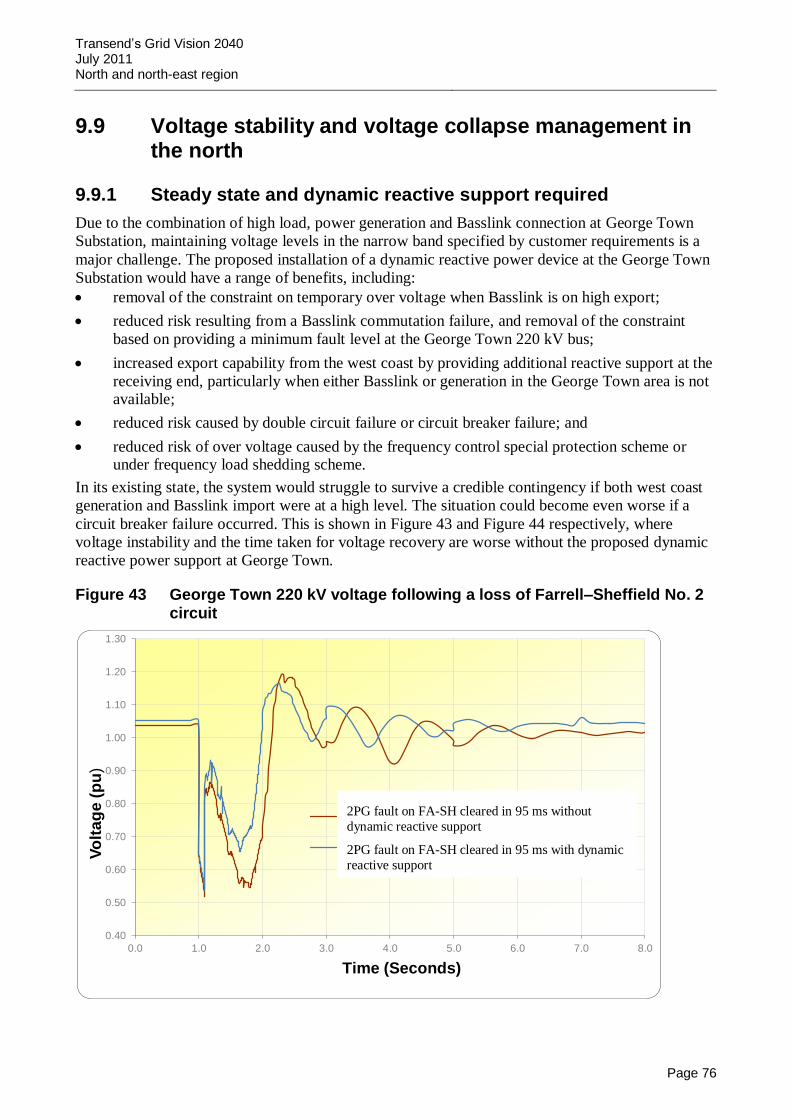
Transend’s Grid Vision 2040 July 2011 North and north-east region
Page 76
9.9 Voltage stability and voltage collapse management in the north
9.9.1 Steady state and dynamic reactive support required
Due to the combination of high load, power generation and Basslink connection at George Town
Substation, maintaining voltage levels in the narrow band specified by customer requirements is a
major challenge. The proposed installation of a dynamic reactive power device at the George Town
Substation would have a range of benefits, including:
removal of the constraint on temporary over voltage when Basslink is on high export;
reduced risk resulting from a Basslink commutation failure, and removal of the constraint
based on providing a minimum fault level at the George Town 220 kV bus;
increased export capability from the west coast by providing additional reactive support at the
receiving end, particularly when either Basslink or generation in the George Town area is not available;
reduced risk caused by double circuit failure or circuit breaker failure; and
reduced risk of over voltage caused by the frequency control special protection scheme or under frequency load shedding scheme.
In its existing state, the system would struggle to survive a credible contingency if both west coast
generation and Basslink import were at a high level. The situation could become even worse if a
circuit breaker failure occurred. This is shown in Figure 43 and Figure 44 respectively, where
voltage instability and the time taken for voltage recovery are worse without the proposed dynamic
reactive power support at George Town.
Figure 43 George Town 220 kV voltage following a loss of Farrell–Sheffield No. 2 circuit
0.40
0.50
0.60
0.70
0.80
0.90
1.00
1.10
1.20
1.30
0.0 1.0 2.0 3.0 4.0 5.0 6.0 7.0 8.0
Vo
lta
ge
(p
u)
Time (Seconds)
2pG @FASH cleared in 95 ms withoutSVC2pG @FASH cleared in 95 ms with SVC
2PG fault on FA-SH cleared in 95 ms without
dynamic reactive support
2PG fault on FA-SH cleared in 95 ms with dynamic
reactive support

Transend’s Grid Vision 2040 July 2011 North and north-east region
Page 77
Figure 44 George Town 220 kV voltage following a circuit breaker failure at Sheffield
One potential option to address these issues is the installation of a new generation of synchronous
condensers as shown in Figure 45 (Marken 2009). The additional benefits that they can offer, such
as inertia, fault contribution, no harmonics generation, overloading capabilities and no impact on
Basslink operation, should be considered in the selection of the future dynamic reactive device to be
installed at the George Town Substation.
Figure 45 Synchronous condensers
0.40
0.50
0.60
0.70
0.80
0.90
1.00
1.10
1.20
1.30
0.0 1.0 2.0 3.0 4.0 5.0 6.0 7.0 8.0
Vo
lta
ge
(p
u)
Time (Seconds)
1pG @FA-SH + CB fail without SVC
1pG @FA-SH + CB fail with SVC
Courtesy of General Electric
1PG fault on FA-SH + circuit breaker failure
without dynamic reactive support
1PG fault on FA-SH + circuit breaker failure with
dynamic reactive support

Transend’s Grid Vision 2040 July 2011 North and north-east region
Page 78
9.10 Project details
Appendix 1 contains details of proposed future projects in the north and north-east along with
indicative timings and project costs.
Figure 46 shows the proposed north and north-east arrangement to be in place by 2040.
Figure 46 North and north-east proposed supply arrangement
9.10.1 Overall budgetary cost
A total capital expenditure of $480.9 M is expected in the north and north-east areas over a period
of 25 years. This will be invested over the following revenue reset periods:

Transend’s Grid Vision 2040 July 2011 North and north-east region
Page 79
Table 6 Anticipated future revenue reset expenditure in the north and north-east (in 2010 $, base estimate and 30% contingency plus allowances estimate included)
Revenue reset period Anticipated capital expenditure: Base ($M)
Anticipated capital expenditure:
with 30% contingency+ allowances ($M)
2014–2019 91.8 137.0
2019–2024 44.3 62.1
2024–2029 107.7 152.6
2029–2034 154.5 221.5
2034–2039 82.6 118.1
TOTAL 480.9 691.3
Appendix 1 details the individual projects applicable to each revenue reset period.
Transend’s Grid Vision 2040 July 2011 South and east coast region
Page 80
10 South and east coast region
10.1 Introduction
The southern part of Tasmania encompasses greater Hobart, Kingborough, New Norfolk, the
Tasman Peninsula and the east coast. This section considers the existing transmission system
arrangement in the area, the main issues and drivers for transmission system development, and
proposed options to address these issues. A list of envisaged projects in the area over the next 30
years also is provided.
10.2 The existing transmission system arrangement in the south and east coast
The existing transmission system in the southern area is shown in Figure 47. This area is supplied
from only one 220/110 kV injection point at the Chapel Street Substation. A second 220/110 kV
injection point at Lindisfarne Substation is under construction and will be commissioned in early
2011 together with a new 220 kV double circuit from Waddamana to Lindisfarne as shown in
Figure 24 ‘Supply arrangements for the greater Hobart area in 2011’ in Section 6 on page 49.
Aurora Energy takes supply from 33 kV subtransmission voltage at Creek Road, Risdon and
Lindisfarne 110/33 kV substations. The new 110/33 kV Mornington Substation is in the
construction stage and is scheduled for completion in mid 2011(Transend 2010g).
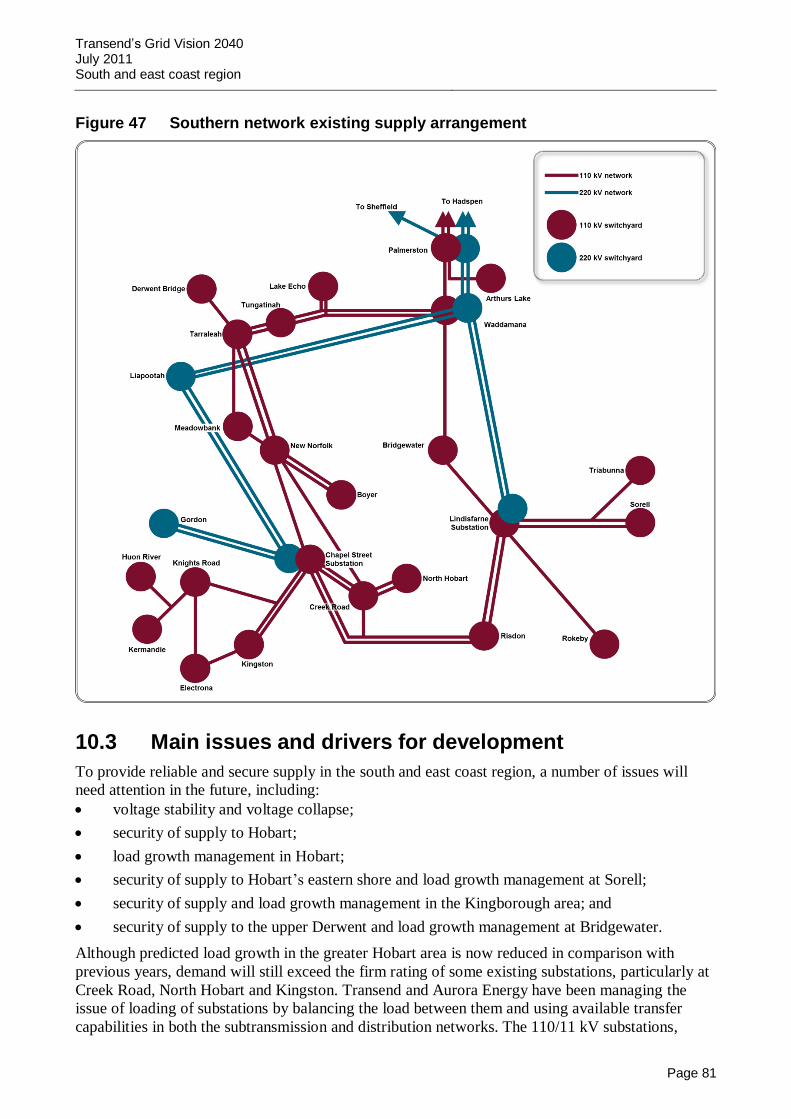
Transend’s Grid Vision 2040 July 2011 South and east coast region
Page 81
Figure 47 Southern network existing supply arrangement
10.3 Main issues and drivers for development
To provide reliable and secure supply in the south and east coast region, a number of issues will
need attention in the future, including:
voltage stability and voltage collapse;
security of supply to Hobart;
load growth management in Hobart;
security of supply to Hobart’s eastern shore and load growth management at Sorell;
security of supply and load growth management in the Kingborough area; and
security of supply to the upper Derwent and load growth management at Bridgewater.
Although predicted load growth in the greater Hobart area is now reduced in comparison with
previous years, demand will still exceed the firm rating of some existing substations, particularly at
Creek Road, North Hobart and Kingston. Transend and Aurora Energy have been managing the
issue of loading of substations by balancing the load between them and using available transfer
capabilities in both the subtransmission and distribution networks. The 110/11 kV substations,

Transend’s Grid Vision 2040 July 2011 South and east coast region
Page 82
including those at North Hobart, Chapel Street, Kingston, Bridgewater and Rokeby were built in the
1970s and 1980s and over the next 30 years will reach the end of their useful lives. The preferred
approach of both Transend and Aurora Energy is to continue to build up the 33 kV subtransmission
network in the area, reducing exposure of the 11 kV network.
Planning also takes account of the requirements of the local Electricity Supply Industry Regulation
2007, particularly in relation to single asset failure event requirements (resulting with 3000 MWh
unserved energy loss) which could affect several circuits in this area in the future.
10.4 Voltage stability and voltage collapse management in the greater Hobart area
10.4.1 Steady state and dynamic reactive support required
A comprehensive voltage stability study of the southern Tasmanian power system was undertaken
as a part of Transend’s 30+ year grid vision development (Hydro Tasmania Consulting 2009).
Without additional generation in the south and with the predicted ongoing load growth, voltage
stability management is a major challenge. Transend has been installing capacitor banks to ensure
the provision of steady state voltage support in the region for many years. The system relies heavily
on Hydro Tasmania generators for dynamic reactive support in the absence of any stand-alone
dynamic reactive support devices. The variability of generator dispatch in the Tasmanian power
system due to market behaviour, planned maintenance and water storage levels, suggests that the
reactive support expected in some areas may not always be available when it would be required in
emergencies to ensure voltage stability and avoid voltage collapse.
Gordon Power Station is the largest power station in the south. It also provides invaluable steady
state and dynamic reactive power support. However, recent prolonged planned outages and
unplanned shut downs of this power station exposed the region to the lack of valuable dynamic
voltage support.
The study recommended installing a first dynamic reactive support device for load levels during the
period between 2015 and 2020. The pros and cons of different types of dynamic reactive power
devices such as synchronous condensers, static VAR compensators (SVC) and static condensers
(STATCOM) were analysed.
One of the possible solutions is to install a new generation of synchronous condensers, as shown in
Figure 48 (Markel 2009). Synchronous condensers are characterised by the speed of their response
and their capacity to provide dynamic reactive power support and, consequently, voltage control to
reduce voltage fluctuations and prevent voltage collapse in the system. In addition, this unit
provides other valuable benefits such as fault contribution and contributes to the system inertia,
which are not provided by alternative power electronic devices such as SVCs or STATCOMs.

Transend’s Grid Vision 2040 July 2011 South and east coast region
Page 83
Figure 48 New generation of synchronous condensers
The installation of synchronous condensers could significantly improve voltage control in the area,
providing a range of benefits such as:
additional reactive power support for winter maximum load > 960 MW;
reduced reliance on southern generation, particularly the Gordon, when the area load is high;
support for future renewable generator connections due to inherent inertia support;
contributing to minimum fault levels, keeping voltage step changes due to reactive power device switching within standards;
reduced risk from double circuit failure or circuit breaker failure events;
reduced risk of over voltage around the area caused by load shedding, due to either frequency control (FCSPS) or under frequency load shedding (UFLSS) actions; and
increased stability transfer limits from north to south to realise possible market benefits that
would not otherwise be possible.
Courtesy of General Electric

Transend’s Grid Vision 2040 July 2011 South and east coast region
Page 84
Figure 49 shows voltage instability and the time for voltage recovery, with and without the
proposed dynamic reactive power support device at the Chapel Street Substation.
Figure 49 Chapel Street 220 kV voltage following a CB failure at Chapel Street
A single-phase-to-ground fault was simulated on the Liapootah–Cluny Tee–Chapel Street 220 kV
transmission line and a primary circuit breaker failure to open. The failure of the circuit breaker to
open resulted in a longer fault clearance time. Note that in this study the voltage did not return to
system minimum of 0.9 pu voltage without dynamic reactive support. With the use of a dynamic
reactive support device the voltage recovers to 0.8 pu within 800 msec.
Transend would continue to install capacitor banks for steady state reactive support depending on
the load growth in the area. Further engineering work is underway to gather more complete
information on design, location, costs and the benefits of implementing the first dynamic reactive
support device.
10.5 Security of supply to Hobart
10.5.1 Proposed 220 kV loop Lindisfarne–Risdon–Chapel Street
There is an opportunity in the future to close a 220 kV loop between Chapel Street and the
Lindisfarne Substation to further increase the security of supply to the Hobart CBD. Due to limited
space at Lindisfarne Substation, 220/110 kV transformers could be installed at Risdon Substation if
required in the future. The existing 110 kV crossing of the River Derwent between Risdon and
Lindisfarne substations was designed for 220 kV operation. The 220 kV section between Risdon
and Chapel Street substations could be entirely underground, or a combination of underground and
overhead line sections. The closure of this 220 kV loop would provide Transend with access to
Liapootah–Chapel Street 220 kV line for maintenance or conductor replacement work in the future.
The existing arrangement is shown on Figure 50 and the proposed arrangement in Figure 51.
1PG fault on LI-CLtee-CS + circuit breaker fail
without dynamic reactive support
1PG fault on LI-CLtee-CS + circuit breaker fail
with dynamic reactive support

Transend’s Grid Vision 2040 July 2011 South and east coast region
Page 85
Figure 50 Supply arrangement with two 220 kV bulk supply points
Figure 51 Proposed arrangement with 220 kV loop completed
10.6 Load growth management in Hobart
The Hobart CBD is supplied from Creek Road and Risdon 110/33 kV injection points and from the
110/11 kV North Hobart Substation. The eastern shore is supplied from the Lindisfarne 110/33 kV
injection point and the 110/11 kV Rokeby Substation.
10.6.1 Existing Hobart 110/33 kV injection points and 33 kV subtransmission network
The 33 kV subtransmission network was established on the eastern shore in 1964 with the 110/33
kV Lindisfarne Substation as the only supply point. From 2000–2005, the 22 kV subtransmission
network on Hobart’s western shore was converted to 33 kV supply, with new 110/33 kV supply
points at Risdon and Creek Road substations.The existing arrangement is shown in Figure 52.
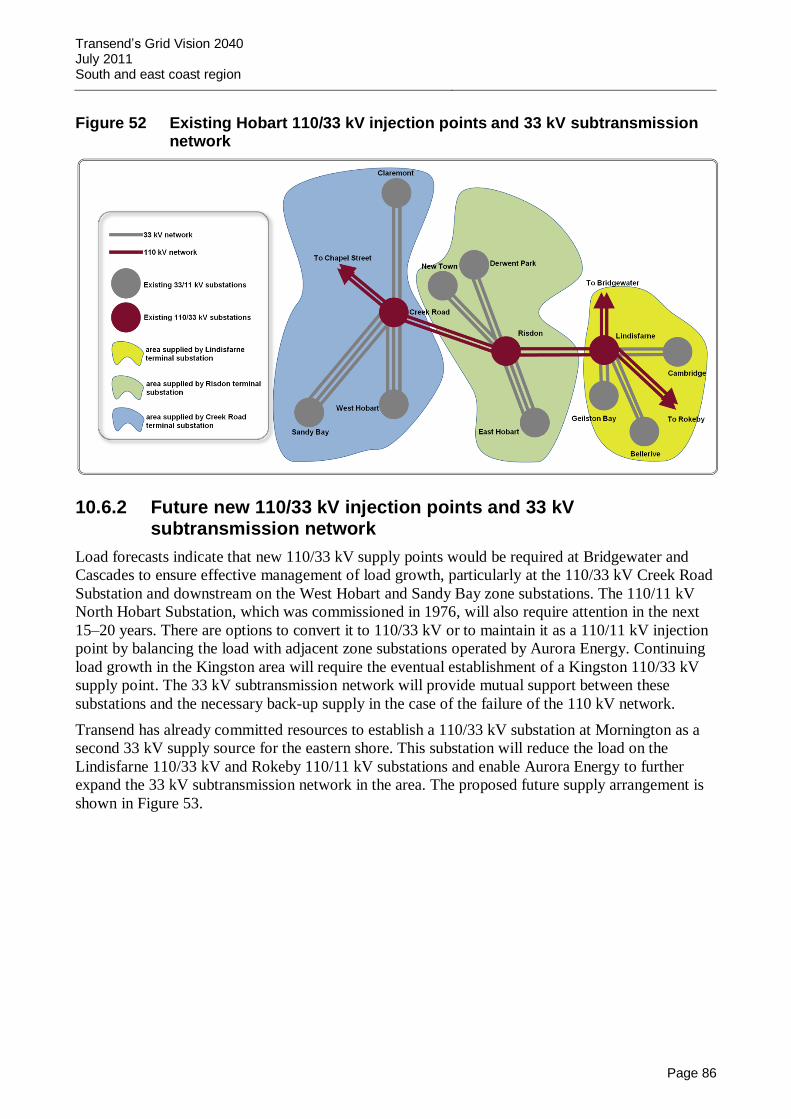
Transend’s Grid Vision 2040 July 2011 South and east coast region
Page 86
Figure 52 Existing Hobart 110/33 kV injection points and 33 kV subtransmission network
10.6.2 Future new 110/33 kV injection points and 33 kV subtransmission network
Load forecasts indicate that new 110/33 kV supply points would be required at Bridgewater and
Cascades to ensure effective management of load growth, particularly at the 110/33 kV Creek Road
Substation and downstream on the West Hobart and Sandy Bay zone substations. The 110/11 kV
North Hobart Substation, which was commissioned in 1976, will also require attention in the next
15–20 years. There are options to convert it to 110/33 kV or to maintain it as a 110/11 kV injection
point by balancing the load with adjacent zone substations operated by Aurora Energy. Continuing
load growth in the Kingston area will require the eventual establishment of a Kingston 110/33 kV
supply point. The 33 kV subtransmission network will provide mutual support between these
substations and the necessary back-up supply in the case of the failure of the 110 kV network.
Transend has already committed resources to establish a 110/33 kV substation at Mornington as a
second 33 kV supply source for the eastern shore. This substation will reduce the load on the
Lindisfarne 110/33 kV and Rokeby 110/11 kV substations and enable Aurora Energy to further
expand the 33 kV subtransmission network in the area. The proposed future supply arrangement is
shown in Figure 53.

Transend’s Grid Vision 2040 July 2011 South and east coast region
Page 87
Figure 53 Future 110/33 kV supply points and 33 kV subtransmission network
10.7 Security of supply to the eastern shore and load growth management at Sorell
10.7.1 Proposed 110 kV link between Sorell and Mornington substations
Both the new Mornington and Sorell substations are supplied off radial transmission lines
originating from the Lindisfarne Substation. With future load growth projections, the loss of these
transmission lines would result in no supply to these areas, which could exceed the local electricity
supply industry regulation requirements.

Transend’s Grid Vision 2040 July 2011 South and east coast region
Page 88
In order to provide a secure and reliable supply to these areas, it is proposed to construct a new
transmission line to connect the Sorell and Mornington substations, which would result in a 110 kV
loop supply arrangement.
Figure 54 and Figure 55 show the existing and proposed transmission line arrangements in this
south-east.
Figure 54 Existing 110 kV supply arrangement from Lindisfarne
Figure 55 Proposed 110 kV supply arrangement from Lindisfarne
10.7.2 Conversion of Richmond Substation to 110/22 kV or 33/11 kV
It is proposed to establish a new terminal substation at Richmond around 2025 to align with the
need for a third circuit to Sorell from Lindisfarne. The combined Sorell and Triabunna loads would
exceed the 3000 MWh limit for unserved energy due to a single asset failure. This new substation
will be supplied from Lindisfarne. The Triabunna Substation could also be supplied from this new
110 kV switchyard. The establishment of this substation will provide several benefits including:
improving security and reliability of supply to the local distribution network;

Transend’s Grid Vision 2040 July 2011 South and east coast region
Page 89
provision of a new connection point for the Triabunna transmission line, removing the risk of a fault on the existing Triabunna spur line affecting Sorell;
eliminating the need for a 22 kV sub-transmission line from Sorell to the Richmond zone substation;
removing the need to run a third 110 kV circuit to Sorell from Lindisfarne and the augmentation of the 110 kV bus at Sorell;
enabling the change from the existing 11 kV supply to the Colebrook area to 22 kV; and
supporting irrigation activities in the Coal River area, assisting the Tasmanian Government’s promotion of Tasmania as the food bowl of Australia.
An alternative option is to convert the existing Richmond 22/11 kV substation to a 33/11 kV
substation and to supply it from Lindisfarne Substation, with a potential 33 kV link to the
Cambridge 33/11 kV substation as shown in Figure 53.
10.7.3 Dunalley, Triabunna and east coast supply
The establishment of a substation at Dunalley will reduce load at the Sorell Substation as shown in
Figure 55. This will remove the need to augment Sorell Substation in 2032. Under this scenario, the
Dunalley Substation would be the supply point to the peninsula and southern beaches area and
would complement the existing Sorell Substation.
A substation at Dunalley, to be constructed around 2032, would also provide a connection point for
potential renewable generation on the Tasman Peninsula.
The load at Triabunna is less than 25 MW and so does not require a second transmission line to
satisfy firm rating requirements. However, there is a requirement to satisfy local electricity supply
industry regulation requirements for a potential of 300 MWh of unserved energy in the event of loss
of the existing radial Lindisfarne–Sorell–Triabunna single circuit. There are also asset issues with
the old ‘K’ towers on this circuit, which are approaching 100 years of age. Some of the ‘K’ towers
are second hand from the old Waddamana–Shannon transmission line, which was originally
constructed around 1916.
The establishment of a new substation at Swansea would provide a more reliable and secure supply
to the residents of the east coast. The proposed substation would be connected to both the Triabunna
and Avoca substations, providing a 110 kV loop supply up the east coast. This would provide an
alternative supply point for the Avoca Substation to be utilised when the Palmerston to Avoca line
is augmented to replace the ageing copper conductor and associated towers.
A substation at Swansea would also provide a connection point for any potential renewable
generation in the area.
10.8 Security of supply and load growth management in Kingborough area
There is concern that a single asset failure on the existing Chapel Street–Kingston transmission line
could exceed 3000 MWh of unserved energy. Work is under way to investigate the most cost-
effective method to remove this limitation. To provide a diverse transmission path to Kingston and
to overcome current problems in satisfying the 3000 MWh of unserved energy requirement due to a
single asset failure, it is planned to develop a new double circuit 110 kV transmission line between
Creek Road and Kingston using the old Creek Road–Electrona 88 kV easement path.

Transend’s Grid Vision 2040 July 2011 South and east coast region
Page 90
This transmission line will also provide supply to the proposed 110/33 kV Cascades Substation to
be located in South Hobart. The Cascades Substation is required by Aurora to satisfy the growing
demand for power in the Hobart area and to overcome the potential overloading of existing
110/33 kV bulk supply points at Creek Road and Risdon substations.
A second 110 kV Knights Road–Kermandie transmission line may be required by 2040. This
proposal would potentially provide for connection to new bio-mass generation and also replace
ageing assets. Figure 56 and Figure 57 show the existing and proposed supply arrangements in the
area.
Figure 56 Existing 110 kV supply arrangement in the Kingborough area
Figure 57 Proposed 110 kV supply arrangement in the Kingborough area

Transend’s Grid Vision 2040 July 2011 South and east coast region
Page 91
10.9 Security of supply to the upper Derwent and load growth management at Bridgewater
10.9.1 New Norfolk–Bridgewater 110 kV link
A new 110 kV transmission line between the New Norfolk and Bridgewater substations will be
required if transmission lines from Tarraleah–New Norfolk and /or Waddamana–Bridgewater are
decommissioned. This link between Bridgewater and New Norfolk substations will provide security
of supply in the event of the loss of a single asset and as a consequence exceeding 3000 MWh of
unserved energy at both New Norfolk and Bridgewater substations.
Installation of this 110 kV link from New Norfolk to Bridgewater would create a 110 kV ring
around the Greater Hobart area and provide increased security of supply.
Once the proposed New Norfolk–Bridgewater 110 kV transmission line is constructed the
Waddamana–Bridgewater circuit can be decommissioned. This will then allow for the re-
configuration of the Bridgewater to Lindisfarne line to provide a double circuit connection between
the two substations. Figure 58 and Figure 59 show the existing and proposed supply arrangements
in the area.
Figure 58 Existing 110 kV supply arrangement to upper Derwent area
Figure 59 Proposed 110 kV supply arrangement to upper Derwent area

Transend’s Grid Vision 2040 July 2011 South and east coast region
Page 92
10.9.2 Proposed 110/33 kV Bridgewater Substation
Load growth in Hobart’s northern suburbs and in the Bridgewater and Brighton areas will increase
loading of Aurora’s 11 kV feeders and the 110/11 kV Bridgewater Substation. One option to
address this issue and improve asset condition at the substation over the next 30 years is to convert
it to 110/33 kV. This would require an extension of the 33 kV subtransmission network to Hobart’s
northern suburbs. At the same time, this will help to address loading at the Creek Road Substation
by transferring the Claremont Substation from Creek Road to this potential new 110/33 kV
substation at Brighton. Figure 53 provides more details.
10.10 Proposed projects
Details of the proposed projects in the south and on the east coast are provided in Appendix 1.
Figure 60 shows the proposed supply arrangement for the south and east coast in 2040. Further
more detailed analysis will be needed to determine the exact requirements and timing for each
project.
Figure 60 South and east coast proposed supply arrangement

Transend’s Grid Vision 2040 July 2011 South and east coast region
Page 93
10.10.1 Overall budgetary cost
The estimated capital expenditure required to provide the south and east coast region with a more
secure and reliable supply is around $330.5 M ($451.7 M with a 30% contingency + estimation
allowance) for a period of 25 years.
This is expected to be invested over the following revenue reset periods:
Table 7 Anticipated future revenue reset expenditure in south and east coast (in $2010, base estimate and 30% contingency plus allowances estimate included)
Revenue reset period Anticipated capital expenditure:
Base ($M)
Anticipated capital expenditure:
With 30% contingency + allowances ($M)
2014–2019 97.4 134.3
2019–2024 53.9 72.0
2024–2029 75.9 102.5
2029–2034 68.3 95.7
2034–2039 35.0 47.2
TOTAL 330.5 451.7
Appendix 1 details the individual projects applicable to each revenue reset period.

Transend’s Grid Vision 2040 July 2011 Future easement and site requirements
Page 94
11 Future easement and site requirements
Based on an analysis of potential future development options, it is necessary also to consider what
additional transmission line easement and substation sites may be required. Obtaining extensions to
existing easement or substation site footprints or to new easements or sites in the future could be
both time consuming and expensive.
Several transmission line easements and substation site land procurements may be required to
accommodate future grid arrangements. These are listed in individual area strategic plans. They
include:
Transmission lines:
Sheffield to Palmerston 220 kV
Sheffield to Burnie 220 kV
Farrell to Burnie 220 kV
Longford to Norwood 110 kV
Derby to St Helens to St Marys 110 kV
Bridgewater to New Norfolk 110 kV
Triabunna to Swansea to Avoca 110 kV
Tunbridge 110 kV supplied off the existing Palmerston–Avoca line
Substation sites:
Longford 220/110/22 kV terminal substation
George Town 2 220 kV switching station
Exeter 110/22 kV terminal substation
Riverside 220/110 kV terminal substation
Ashley 110/22 kV terminal substation
St Helens 110/22 kV terminal substation
Launceston CBD 110/22 kV terminal substation
Richmond 110/22 kV terminal substation
Cascades 110/33 kV terminal substation
Additional land at George Town for proposed dynamic reactive power devices
Once circuit routes and substation locations are identified work can begin to formally record
easement details to avoid delays in the future.

Transend’s Grid Vision 2040 July 2011 Conclusion
Page 95
12 Conclusion
Transend’s Grid Vision 2040 consolidates the findings from all the detailed strategic plans
developed for the future, including generation mapping, the future of core transmission grid,
rationale for a second Bass Strait DC link, and the future of supply to the north-west and west coast,
north and north-east and southern regions.
Wind atlas and wind energy potential calculated for Tasmania confirmed that the State has
significant wind energy resources. Depending on sustainability and design details of national
government renewable energy policies, wind energy could play a significant role in meeting the
supply–demand balance in Tasmania in the future as well as contributing to the achievement of
State and national renewable energy targets. Deeper penetration of wind generation, encouraged by
national renewable energy policies, will make Tasmania an energy exporter and could open
opportunities for an additional DC interconnector between Tasmania and Victoria. Progress in DC
technology has reduced the cost of new interconnectors significantly in comparison to just a couple
of years ago.
Our work indicates that in a majority of scenarios there is no need for an increase in transmission
network voltage to provide for higher capacity in transmission network backbone. This increase, if
required, can be achieved through the application of modern conductors and new technology and
innovations. This planned approach is supported by current reductions in load growth and concerns
that, with the inevitable increase in electricity prices, load growth will continue to moderate in the
future. Our vision, which includes the further development of the smart grid concept, encourages
customers to participate more directly in demand side management and contribute to the supply–
demand balance.
Transend’s Grid Vision 2040 focuses on better utilisation of existing assets and further application
of new technology and innovation. The proposed projects will increase ties in the existing network
and make it more resilient and flexible enough to respond to customer needs and requirements.
The Grid Vision document will be reviewed and updated on a regular basis to take account of
potential changes in customer behaviour in response to State, national and international climate
change policies, as well as global events that will shape the electricity supply industry in the future.
Transend’s Grid Vision 2040 July 2011 References
Page 96
13 References
3Tier 2010, Wind Power Modelling and Analysis of Simulated Output for Regions in Tasmania,
report for Transend D10/34713.
ACIL Tasman, 2010, Preparation of energy market modelling data for the Energy White Paper.
AEMO 2009, National Transmission Statement for the National Electricity Market,
http://www.aemo.com.au.
AEMO 2010, National Transmission Network Development Plan 2010, http://www.aemo.com.au.
Akagi, H, Hikaru, S 1999, Power Compensation Effect of an Adjustable–Speed Rotary Condenser
with a flywheel for a Large Capacity Magnet Power Supply, Proceedings of the 1999 Particle
Accelerator Conference, New York.
AEMC 2009, Review of Energy Market Frameworks in light of Climate Change Policies, 2nd
Interim Report by, 30 June 2009.
Connarty, M 2009, Future Energy Options for Hydro Tasmania, Royal Society of Tasmania Winter
Series Lectures.
Electricity Supply Industry (Network Performance Requirements) Regulations 2007.
Electricity Supply Industry Expert Panel, 2011, The Evolution of Tasmania’s Energy Sector-
discussion paper, April 2011.
ESAA 2010, ESAA welcomes decision to reduce feed–in tariff, media statement, 27 October 2010.
Grid Australia 2010, Grid Australia Submission to Transmission Frameworks Review:
AEMC Directions Paper – 26 May 2011.
Griffin, D 2009, Ocean Power–Waves and Tides, Royal Society of Tasmania Winter Series
Lectures.
Green World Investor, 2011, Costs of Biomass Energy and Biomass Plant Invesment – Wide Range.
High Electrical Power Consulting 2010, The role of HVDC in Tasmania’s Future Electrical Power
Grid, report for Transend, May 2010.
Hydro Tasmania 2009, Electricity in Tasmania ‘A Hydro Tasmania Perspective’.
http://www.hydro.com.au.
Hydro Tasmania Consulting 2009, Southern Region Dynamic Voltage Collapse Analysis, December
2009.
IES, June 2011, Insider, Issue 012.
KUTh Energy 2010, What is geothermal energy? http://www.kuthenergy.com/geothermal_energy/
Lewis, R 2009 Geothermal Potential in Tasmania, Royal Society of Tasmania Winter Series
Lectures.
Marken, P et al 2009, Dynamic Performance of Next Generation Synchronous Condensers at
VELCO, IEEE 2009.
Transend’s Grid Vision 2040 July 2011 References
Page 97
Marshall, D 2008, Storage Management and Drought, Royal Society of Tasmania Winter Series
Lectures.
Miller, N, Markel, P 2010, Facts on Grid Friendly Wind Plant, presented at IEEE PES General
Meeting, Minneapolis.
MMA Consulting 2009, The Tasmanian Wedges project, November 2009.
Ocean Power Technology, 2011, Company presentation in New York, March 2011.
OTTER, 2011, Tasmanian Energy Supply Industry Performance Report 2009–10, January 2011.
Poyry, 2006, Gunns Bell Bay pulp mill - overview of pulp mill operation.
Research Reports International 2009, Creating the Electric Grid of the Future, July 2009.
Therenewableenergyworld.com 2010, Biomass Generates 32% of All Energy in Sweden, June 2010.
The West Australian, May 21, 2011, Feed-in tariff for solar power slashed.
Transend 2010a, 30+ year grid vision–Strategic Plan for Generation Mapping, D10/28345.
Transend 2010b, 30+ year grid vision–Strategic Plan for 220 and 110 kV corridors, D10/12524.
Transend 2010c, 2010 Annual Planning Report, http://www.transend.com.au.
Transend 2010d, 30+ year grid vision–Strategic Plan for the 2nd
Bass Strait DC link, D10/89410.
Transend 2010e, 30+ year grid vision–Strategic Plan for North-West and West Coast, D10/83287.
Transend 2010f, 30+ year grid vision–Strategic Plan for North and North-East, D10/87047.
Transend 2010g, 30+ year grid vision–Strategic Plan for South and East Coast, D10/39451.
Transend 2010h, Future Impact of Electrical Vehicles on Transmission Grid, D10/57949.
Transend 2009, Transmission System Management Plans 2009–2014, December 2009.
Tasmanian Government 2010, Tasmania’s Innovation Strategy, www.development.tas.gov.au ,
2010.
Tasmanian Irrigation Development Board, 2010, www.tidb.com.au
The University of Reading, Definitions of Sustainability, www.ecifm.rdg.ac.uk.
US Energy Information Administration, 2009
http://www.eia.doe.gov/cneaf/solar.renewables/page/biomass/biomass.html

Transend’s Grid Vision 2040 June 2011 Appendix 1: Project timeframes and estimated costs
Page 98
Appendix 1: Project timeframes and estimated costs
The following tables provide a summary of the most likely projects and the expected revenue reset
period in which they may be considered, together with estimated costs (in nominal $2010) for
individual projects. Not all potential projects are listed here. Alternative projects are listed and
discussed in more detail in individual strategic plans.
Table 8 Proposed development projects in 220 and 110 kV core grid
Strategic Project
No. Project title
Indicative timing (RCA)
Estimate level 1 ($M)
Base
+30% contingency plus allowances
6 Palmerston–Sheffield new DC 220 kV transmission line
2014–2019 88.3
124.0
7 Existing Palmerston–Sheffield TL 503 converted to 110 kV
2014–2019 3.5
5.1
9 Develop Waddamana 220 kV switchyard
2014–2019 5.8
8.3
10 Waddamana–Palmerston new DC 220 kV transmission line
2014–2019 68.6
98.7
1 Sheffield–Burnie new DC 220 kV transmission line
2019–2024 63.8
90.0
3 Farrell Substation double bus coupler arrangement
2019–2024 0.7
1.0
11 Restring second circuit on Liapootah–Waddamana TL 527
2019–2024 8.0
10.6
12 Decommission old TL 502 from Liapootah–Waddamana
2019–2024 5.3
7.7
2 Convert Palmerston 220 kV yard to triple busbar arrangement
2024–2029 4.6
6.5
13 Replace conductor on Liapootah–Chapel Street TL 500 with ACCC
2024–2029 43.5
60.9
14 Convert Chapel Street 220 kV yard to triple busbar arrangement
2024–2029 4.5
6.5
15 Convert Liapootah 220 kV yard to breaker and half
2024–2029 4.6
6.4
27 Farrell–Burnie new 220 kV DC transmission line
2024–2029 89.8
125.7
70 Establish 220/110kV yard at Tarraleah
2029–2034 43.4
60.9
71 Decommission 110 kV Tarraleah–New Norfolk TL 417
2029–2034 3.9
5.5

Transend’s Grid Vision 2040 June 2011 Appendix 1: Project timeframes and estimated costs
Page 99
Strategic Project
No. Project title
Indicative timing (RCA)
Estimate level 1 ($M)
Base
+30% contingency plus allowances
75 Decommission 110 kV Waddamana–Bridgewater TL 400
2029–2034 7.1
9.9
16 Replace conductor on Hadspen–George Town TL 509 with ACCC
2029–2034 25.3
35.4
17 Replace conductor on Palmerston–Hadspen TL 509 with ACCC
2029–2034 16.0
22.2
18 Replace conductor on Sheffield–George Town TL 510 with ACCC
2029–2034 41.2
57.7
74 Decommission 110 kV Lake Echo–Waddamana, both sections
2034–2039 1.8
2.5
19 Replace conductor on Sheffield–Farrell TL 518 with ACCC
2034–2039 52.5
73.5
20 Convert Hadspen 220 kV yard to breaker and half
2034–2039 3.0
4.2
Table 9 Proposed development projects in north-west and west coast
Strategic Project
No. Project title
Indicative timing (RCA)
Estimate level 1 ($M)
Base
+30% contingency plus allowances
109 Convert Wesley Vale Substation to 22kV supply for Aurora Energy
2014–2019 1.2
1.6
110 Convert Emu Bay Substation to 22kV supply for Aurora Energy
2014–2019 2.6
3.4
117 Redesign Newton 110 kV yard to H arrangement
2014–2019 6.1
8.5
119 110 kV capacitor Bank at Rosebery or at Farrell
2014–2019 1.9
2.6
116 Establish one 220/110 kV auto-transformer at Queenstown
2019–2024 6.8
10.2
118 Decommission old 110 kV TL 406 Queenstown–Newton
2019–2024 2.0
2.5
111 Wynyard 110/22 kV connection point for Aurora Energy
2024–2029 20.5
30.4

Transend’s Grid Vision 2040 June 2011 Appendix 1: Project timeframes and estimated costs
Page 100
Strategic Project
No. Project title
Indicative timing (RCA)
Estimate level 1 ($M)
Base
+30% contingency plus allowances
113 Install synchronous condensers at Burnie
2024–2029 27.0
37.5
114 Establish 220/66 kV yard at Farrell for Aurora Energy
2029–2034 8.0
11.1
115 Establish 110/66 kV yard at Queenstown for Aurora Energy
2029–2034 4.5
5.6
112 Penguin 110/22 kV connection point for Aurora Energy
2034–2039 16.6
24.7
Table 10 Proposed network development projects in south and east coast
Strategic Project
No. Project title
Indicative timing (RCA)
Estimate level 1 ($M)
Base
+30% contingency plus allowances
90 Creek Road to Kingston 110 kV DC TL
2014–2019 18.5
24.4
88 Sorell–Triabunna transline 110 kV
2014–2019 27.8
37.5
5 Synchronous condenser installation in the greater Hobart area
2014–2019, or
2019–2024
27.0
37.5
120 Restring second 110 kV circuit on Knights Rd–Kermandie TL No 436
2019–2024 13.9
18.1
83 Mornington–Sorell transline110 kV includes substation work
2019–2024 18.8
25.3
53 North Hobart 110/33 kV Substation
2024–2029 7.3
9.8
77 New Norfolk–Bridgewater transline110 kV includes substation work
2024–2029 21.2
28.6
40 Swansea Substation
110/22kV
2024–2029 19.6
26.5
39 Triabunna–Swansea transline110 kV includes substation work at Triabunna
2024–2029 29.4
39.7
93 Richmond Substation
110/22kv or 33/11 kV zone sub
2024–2029 19.6
26.5

Transend’s Grid Vision 2040 June 2011 Appendix 1: Project timeframes and estimated costs
Page 101
Strategic Project
No. Project title
Indicative timing (RCA)
Estimate level 1 ($M)
Base
+30% contingency plus allowances
79 Establish 220 kV underground link between Chapel Street and Risdon
2029–2034 47.1
66.0
72 Establish 220/110 kV yard at Risdon and convert existing Risdon–Lindisfarne 110 kV lines to 220 kV operation
2029–2034 21.2
29.7
89 Cascades Substation 110/33 kV includes transline cost
2029–2034 24.1
34.9
48 Dunalley Substation
110/22kv
2034–2039 16.4
22.1
47 Sorell–Dunalley transline110 kV includes substation work at Sorell
2034–2039 18.6
25.1
Table 11 Proposed network development projects in north and north-east
Strategic Project
No. Project title
Indicative timing(RCA)
Estimate level 1 ($M)
Base
+30% contingency plus allowances
8 New Ashley 110/22 kV Substation
2014–2019 17.0
30.0
96 New Tunbridge 110/22 kV Substation
2014–2019 17.4
25.3
97 Tunbridge transline off Palmerston–Avoca 110 kV DC
2014–2019 28.2
40.9
101 Avoca–St Marys new DC 110 kV line strung SC initially
2014–2019 26.0
36.5
69 Synchronous Condenser at George Town
2014–2019
or
2019–2024
29.2
40.8
94 New Longford sub 110/22 kV 2019–2024 18.2
25.5
31 George Town 2 new substation (220 kV Gunn’s Substation)
2019–2024 26.1
36.6
32 Derby–St Helens new 110 kV DC
2024–2029 34.8
50.4
33 St Helens–St Marys new 110 kV SC
2024–2029 25.2
36.5

Transend’s Grid Vision 2040 June 2011 Appendix 1: Project timeframes and estimated costs
Page 102
Strategic Project
No. Project title
Indicative timing(RCA)
Estimate level 1 ($M)
Base
+30% contingency plus allowances
34 St Helens new substation (110/22 kV)
2024–2029 15.3
21.4
95 Hadspen–Trevallyn string second side of 471
2024–2029 2.2
3.0
104 Derby 110 kV Substation expansion for DC to St Helens
2024–2029 9.4
13.2
106 St Marys Substation 110/22 kV to accommodate SC from St Helens
2024–2029 3.7
5.2
107 Avoca Substation 110/22 kV 2024–2029 17.1
22.9
38 Avoca–Swansea new 110kV SC 2029–2034 38.5
55.8
41 Palmerston–Avoca new 110 kV DC strung SC (for wind and replace old SC copper conductor)
2029–2034 Strung single cct.
37.9
53.1
98 Launceston CBD new 110/22 kV sub
2029–2034 15.9
22.2
100 Mowbray–Launceston CBD–St Leonards new 110 kV U/G SC
2029–2034 13.2
19.2
102 Ashley–Wesley Vale new 110 kV DC strung SC
2029–2034 31.6
45.9
103 Scottsdale Tee–Derby 110 kV. String second side of poles
2029–2034 3.4
4.9
44 Riverside–Trevallyn new 110 kV DC
2034–2039 5.5
8.0
52 Riverside new 220/110 kV sub 2034–2039 44.3
64.3
45 Riverside–Exeter new 110 kV DC
2034–2039 15.5
21.6
46 Exeter new sub (110/22 kV) 2034–2039 17.3
24.2

Transend’s Grid Vision 2040 June 2011 Appendix 2: Future transmission lines and substations
Page 103
Appendix 2: Future transmission lines and substations
The following tables detail proposed new transmission lines and substations required by the year
2040 to ensure Tasmania continues to have a secure and reliable transmission network. The
timeframe for each project differs and costs will be spread over the relevant revenue reset periods.
Table 12 Proposed new transmission lines
Voltage kV
Proposed Transmission lines Area
220 Burnie–West Montague–new double circuit (SENE–Scale Efficient Network Extension) (alt. path Hampshire 2 to West Montague)
north-west
220 Farrell–Burnie via Hampshire 2–new double circuit north-west
220 Hampshire 2–Sheffield– new double circuit (as an option to Sheffield to Burnie line)
north-west
220 Sheffield–Palmerston–new double circuit (alt. path Sheffield to Waddamana) north-west
220 Sheffield–Burnie–new double circuit, replace existing 220 kV line (TL No 504)
north-west
220/110 Sheffield–Palmerston 220 kV line (line No 503) convert the existing one to 110 kV operation; alternatively leave at 220 kV as third circuit
north-west
110 Ashley–Wesley Vale–new circuit (option to connect via Railton) north-west
220 Reece–Pieman–new double circuit (SENE–Scale Efficient Network Extension) west
220 George Town 2–Bridport–Musselroe–new double circuit ( SENE–Scale Efficient Network Extension )
north
220 Waddamana–Palmerston–new double circuit lines 3 & 4 north
220 Waddamana–Palmerston–decommission old T/L 502 north
110 Exeter–Hadspen–new double circuit utilising existing Trevallyn–Hadspen 413 (or new connection Exeter to Riverside)
north
110 St Leonards–Launceston CBD radial underground. (alt. break into 110 kV ring Mowbray–St Leonards or radial from Trevallyn)
north
220/110 Chapel St–Kingston–(initially run as third circuit link 110 kV) or Creek Rd– Kingston @ 110 kV third and fourth circuits.
south
220/110 Gordon–Chapel Street Tee–Kingston 220 kV or New Norfolk–Kingston 110 kV (SENE–Scale Efficient Network Extension)
south
220 Liapootah–Waddamana–restring No 1 on No 2 line towers from Liapootah up to Waddamana
south
220 Tarraleah–in and out of Liapootah–Waddamana T/L 502 south
220 Chapel St–Risdon–Lindisfarne Link (convert existing Risdon–Lindisfarne 110 kV lines to 220 kV operation) (option into Creek Rd)
south
110 Palmerston–Tunbridge–Avoca, (new connection at Tunbridge) south
110 Lake Echo–Waddamana–decommission portion of TL 425 and 426, No 1 and No 2
south
110 Tarraleah–Meadowbank–New Norfolk–decommission old TL No 418, and construct new DC 110 kV line
south

Transend’s Grid Vision 2040 June 2011 Appendix 2: Future transmission lines and substations
Page 104
Voltage kV
Proposed Transmission lines Area
110 Tarraleah–New Norfolk–decommission No 417 TL south
110 Waddamana–Bridgewater–decommission old 110 kV TL No 400. south
110 New Norfolk–Bridgewater–new 110 kV circuit south
110 Mornington–Sorell–new circuit south
110 Sorell–Dunalley–new circuit south
110 Triabunna–Swansea–new circuit east
110 Avoca–Swansea–new circuit east
110 Derby–St Helens– new circuit (include Pyengana (SENE–Scale Efficient Network Extension )
east
110 St Marys–St Helens–new circuit east
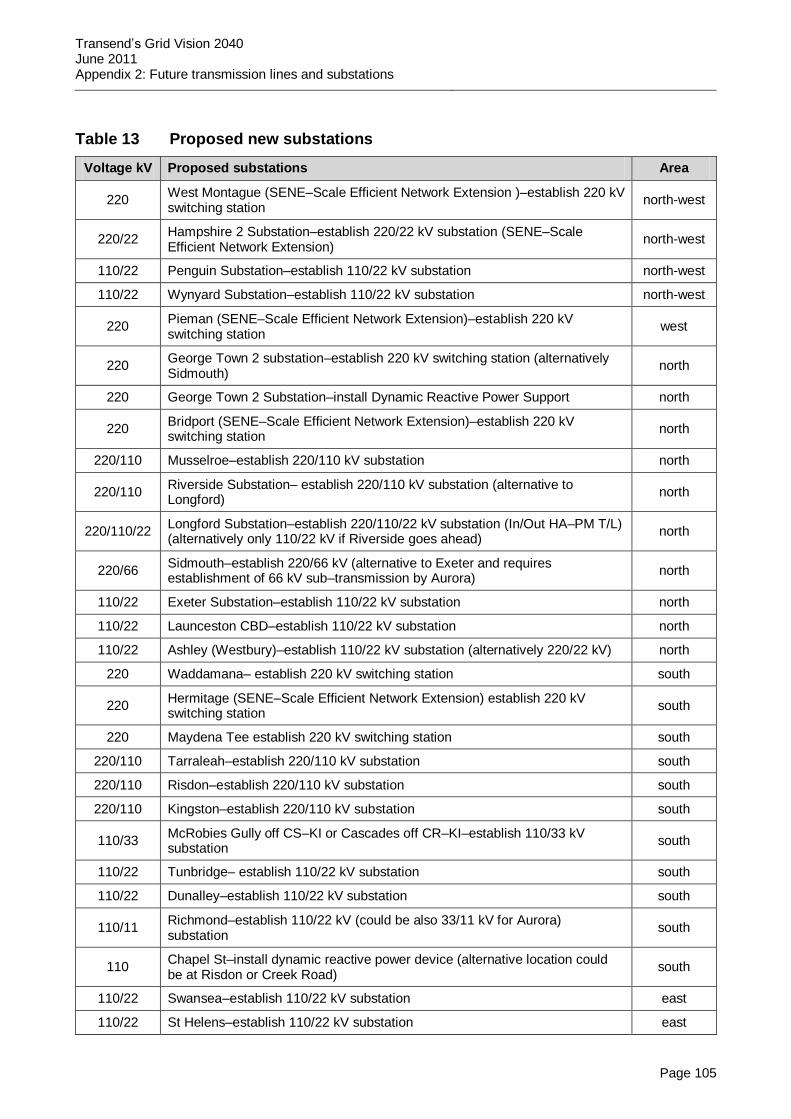
Transend’s Grid Vision 2040 June 2011 Appendix 2: Future transmission lines and substations
Page 105
Table 13 Proposed new substations
Voltage kV Proposed substations Area
220 West Montague (SENE–Scale Efficient Network Extension )–establish 220 kV switching station
north-west
220/22 Hampshire 2 Substation–establish 220/22 kV substation (SENE–Scale Efficient Network Extension)
north-west
110/22 Penguin Substation–establish 110/22 kV substation north-west
110/22 Wynyard Substation–establish 110/22 kV substation north-west
220 Pieman (SENE–Scale Efficient Network Extension)–establish 220 kV switching station
west
220 George Town 2 substation–establish 220 kV switching station (alternatively Sidmouth)
north
220 George Town 2 Substation–install Dynamic Reactive Power Support north
220 Bridport (SENE–Scale Efficient Network Extension)–establish 220 kV switching station
north
220/110 Musselroe–establish 220/110 kV substation north
220/110 Riverside Substation– establish 220/110 kV substation (alternative to Longford)
north
220/110/22 Longford Substation–establish 220/110/22 kV substation (In/Out HA–PM T/L) (alternatively only 110/22 kV if Riverside goes ahead)
north
220/66 Sidmouth–establish 220/66 kV (alternative to Exeter and requires establishment of 66 kV sub–transmission by Aurora)
north
110/22 Exeter Substation–establish 110/22 kV substation north
110/22 Launceston CBD–establish 110/22 kV substation north
110/22 Ashley (Westbury)–establish 110/22 kV substation (alternatively 220/22 kV) north
220 Waddamana– establish 220 kV switching station south
220 Hermitage (SENE–Scale Efficient Network Extension) establish 220 kV switching station
south
220 Maydena Tee establish 220 kV switching station south
220/110 Tarraleah–establish 220/110 kV substation south
220/110 Risdon–establish 220/110 kV substation south
220/110 Kingston–establish 220/110 kV substation south
110/33 McRobies Gully off CS–KI or Cascades off CR–KI–establish 110/33 kV substation
south
110/22 Tunbridge– establish 110/22 kV substation south
110/22 Dunalley–establish 110/22 kV substation south
110/11 Richmond–establish 110/22 kV (could be also 33/11 kV for Aurora) substation
south
110 Chapel St–install dynamic reactive power device (alternative location could be at Risdon or Creek Road)
south
110/22 Swansea–establish 110/22 kV substation east
110/22 St Helens–establish 110/22 kV substation east

Transend’s Grid Vision 2040 June 2011 Appendix 2: Future transmission lines and substations
Page 106
Voltage kV Proposed substations Area
110 Pyengana (SENE) establish 110 kV switching station east

Transend’s Grid Vision 2040 June 2011 Appendix 3: Abbreviations
Page 107
Appendix 3: Abbreviations
AEMO Australian Energy Market Operator
DC Direct Current
NTNDP National Transmission Network Development Plans
RITT Regulatory Investment Test for Transmission
VUCA Volatility, Uncertainty, Complexity, Ambiguity
NEM National Electricity Market
ACSR Aluminium Conductor Steel Reinforced
AAAC All Aluminium Alloy Conductors
ACCC/TW Aluminium conductors with composite core and trapezoidal wire shape
ACCR Aluminium conductors with aluminium fibre composite reinforced core
ZTACIR Super heat resistant aluminium alloy conductors with galvanized invar core
FCAS Frequency Control Ancillary Services
XLPE Cross-linked polyethylene
SVC Static VAr Compensator
STATCOM Static Synchronous Compensator
FCSPS Frequency Control Special Protection Scheme
UFLSS Under Frequency Load Shedding Scheme
CBD Central Business District
PU Per Unit


