6
A WEB-BASED INTENSITY-DURATION-FREQUENCY TOOL TO UPDATE AND ADAPT LOCAL EXTREME RAINFALL STATISTICS TO CLIMATE CHANGE SLOBODAN P. SIMONOVIC, WESTERN UNIVERSITY Published July 2015
A WEB-BASED INTENSITY-DURATION-FREQUENCY TOOL TO UPDATE AND ADAPT LOCAL EXTREME RAINFALL STATISTICS TO CLIMATE CHANGE
SLOBODAN P. SIMONOVIC, WESTERN UNIVERSITY Published July 2015

WHY DID WE DEVELOP THE INTENSITY-DURATION-FREQUENCY UNDER CLIMATE CHANGE TOOL?Rainfall intensity-duration-frequency (IDF) curves are used for a number of water management applications in Canada, including the planning, design, operation and maintenance of stormwater management systems, wastewater systems, stormwater detention ponds, culverts, bridges, dams, pumping stations, roads and master drainage planning.
IDF curves have traditionally been developed based on the assumption that analysis of historical rainfall records can be used to predict future rainfall conditions. This is commonly referred to as stationarity; the assumption that the environment will behave as it always has. According to this assumption, historical data collected at rainfall monitoring stations are analyzed and used to develop statistics that give an indication of the likelihood of future extreme rainfall events. For example, municipal stormwater management systems are typically designed to accommodate flows associated with 2 to 100 year return period events lasting 10 minutes to 24 hours. However, it is widely acknowledged that climate conditions of the past are no longer indicative of future climate, calling into question the reliability of this assumption.
Climate change will result in intensification of the global hydrologic cycle, causing increased intensity of wet and dry extremes and accompanying floods and droughts. One of the most significant expected impacts of climate change in Canada is an increase in the intensity and frequency of extreme weather events. Though the impacts of climate change vary throughout Canada, an example from southern Ontario suggests that what used to be considered a 1-in-100 year rainfall may become a 1-in-30 year rainfall in the next few decades.1 This means that infrastructure built to manage 1-in-100 year rainfall events based on existing IDF curves may only be able to manage 1-in-30 year events in the future. The result will be infrastructure that will not perform as intended, creating considerable economic implications for existing and planned water management infrastructure across Canada.
The process of updating and incorporating climate change impacts into local IDF curves is highly technical. The lack of locally relevant climate change impact information has been noted as a challenge that is difficult to overcome in many municipalities, including those with very high adaptive capacity. The intensity-duration-frequency under climate change tool (IDFCC Tool) was designed to allow water managers, municipal infrastructure professionals, provincial and federal government agencies, researchers, consultants and non-profit groups to quickly develop estimates related to the impact of climate change on IDF curves for almost any local rain monitoring station in Canada.
A WEB-BASED INTENSITY-DURATION-FREQUENCY TOOL TO UPDATE AND ADAPT LOCAL EXTREME RAINFALL STATISTICS TO CLIMATE CHANGE
SLOBODAN P. SIMONOVIC, WESTERN UNIVERSITY Published July 2015
IMPACTS OF EXTREME RAINFALL: URBAN FLOODING There are many implications of extreme rainfall events, including issues related to water quality, infrastructure management and public safety. Older subdivisions have not been designed to accommodate extreme rainfall events, and increasing urbanization is creating more impervious surfaces. Inadequate infrastructure investment and maintenance further increases exposure of urban communities to flooding.
Many municipalities across Canada, including Thunder Bay, Sault Ste. Marie, Peterborough, Hamilton, Mississauga, London, Calgary, Edmonton, Moncton, Fredericton and Winnipeg have recently been affected by extreme rainfall related flooding. Together, these events have caused billions of dollars of damages and losses for homeowners, insurers and municipalities.
The Canadian insurance industry has experienced a notable trend in disaster losses over the past thirty years. Three of the most expensive insurance industry disaster loss events from 1983 to 2014 were associated with flooding, including: $1.9 billion in southern Alberta (2013) and $1 billion (2013) and $732 million (2005) in the Greater Toronto Area.
Canadian Water Network 1
HOW DOES THE IDFCC TOOL WORK?ACCESS THE IDFCC TOOL AT: WWW.IDF-CC-UWO.CA
IDFCC TOOL COMPONENTSRepresentative Concentration Pathways (RCPs) are future greenhouse gas concentration scenarios.
Global Climate Models (GCMs) simulate climate variables in rain stations. Users can access data from Environment Canada rain stations or enter their own data.
Downscaling GCMs is a novel method for developing IDF curves on smaller spatial and temporal scales.
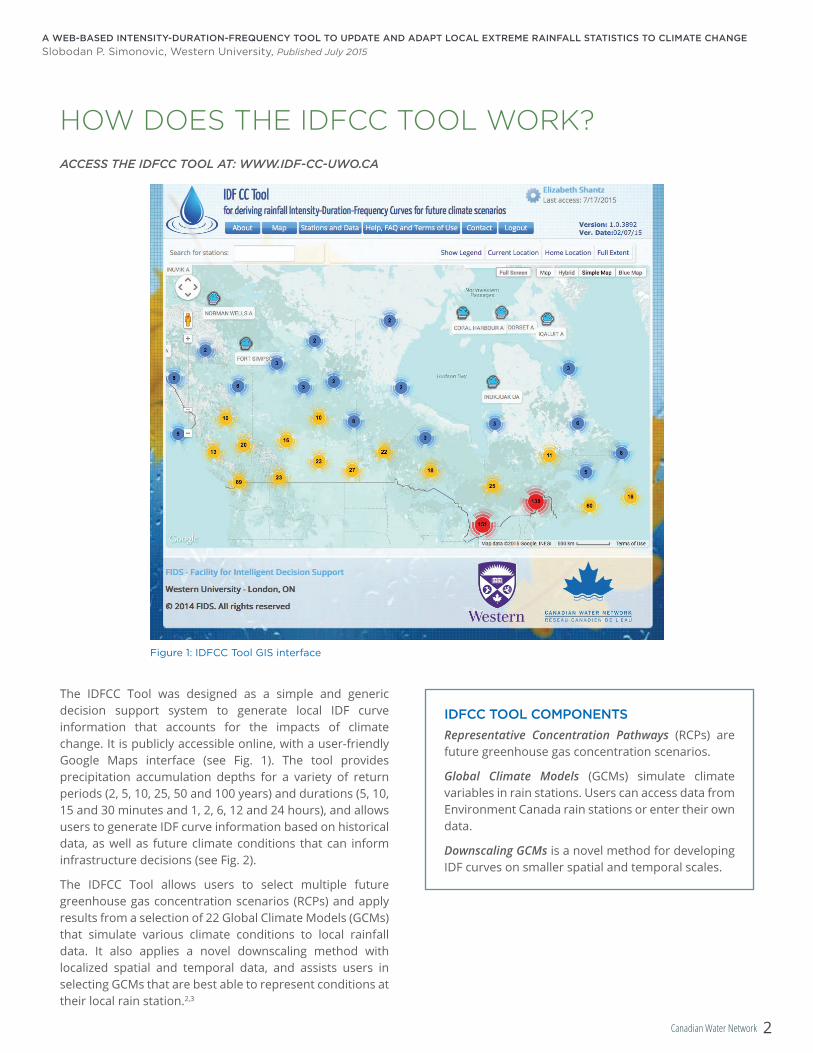
Figure 1: IDFCC Tool GIS interface
The IDFCC Tool was designed as a simple and generic decision support system to generate local IDF curve information that accounts for the impacts of climate change. It is publicly accessible online, with a user-friendly Google Maps interface (see Fig. 1). The tool provides precipitation accumulation depths for a variety of return periods (2, 5, 10, 25, 50 and 100 years) and durations (5, 10, 15 and 30 minutes and 1, 2, 6, 12 and 24 hours), and allows users to generate IDF curve information based on historical data, as well as future climate conditions that can inform infrastructure decisions (see Fig. 2).
The IDFCC Tool allows users to select multiple future greenhouse gas concentration scenarios (RCPs) and apply results from a selection of 22 Global Climate Models (GCMs) that simulate various climate conditions to local rainfall data. It also applies a novel downscaling method with localized spatial and temporal data, and assists users in selecting GCMs that are best able to represent conditions at their local rain station.2,3
A WEB-BASED INTENSITY-DURATION-FREQUENCY TOOL TO UPDATE AND ADAPT LOCAL EXTREME RAINFALL STATISTICS TO CLIMATE CHANGESlobodan P. Simonovic, Western University, Published July 2015
Canadian Water Network 2

USING THE IDFCC TOOLAfter selecting a rain station of interest, users can view information on that rain station, including the length of the data record. To create IDF curves for future climate change conditions, users can select a 20-year projection period for any time between 2006 to 2100, followed by one or multiple GCM or GCM ensemble options. After selecting these options, the tool will automatically downscale GCM results and apply GCM results to the local rain station data, providing future IDF curves in table or graphical format and allowing the user to compare the impacts of multiple RCP scenarios and rainfall return periods, and to compare historical IDF curves to these updated curves.
ACCESS THE IDFCC TOOL AT: WWW.IDF-CC-UWO.CA
GLOBAL CLIMATE MODELSThe IDFCC Tool allows users to apply data generated from one (or a combination) of 22 GCMs to adjust local IDF curves, based on GCMs developed by climate research centres around the world. The GCMs are designed to simulate climate variables on a coarse spatial scale – for example, 250 km by 250 km. To generate future conditions using GCMs, the key input is greenhouse gas emissions, but land-use, energy production, global and regional economies, and population growth also affect future climate scenarios and are incorporated into the GCMs.
REPRESENTATIVE CONCENTRATION PATHWAYSThe international climate modeling community has adopted four RCPs through the Intergovernmental Panel on Climate Change (see Figure 2). These scenarios represent a range of climate change impacts, from low to high severity. These scenarios are measured by radiative forcing (i.e., the net change in the radiation balance at the tropopause, or top of the atmosphere — due to climate change or other external drivers) and measured in watts per square metre, as well as carbon dioxide equivalent concentration, a measure of radiative forcing potential caused by a given type of greenhouse gas (as represented by the equivalent amount of carbon dioxide). The most severe impacts are predicted if no climate policy is adopted, while the lowest risks are associated with stringent requirements for climate policy that limit and reduce greenhouse gas emissions.4
RCPS DESCRIPTION CO2 CONCENTRATION EQUIVALENT (PPM)
PATHWAY SCENARIO SEVERITY
2.6 A peak in radiative forcing of approximately 3 watts per square metre (W/m2) before 2100, declining to 2.6 W/m2 by 2100
Also referred to as RCP3PD
Peak of ~490 and then decline by 2100
Peak and decline Lowest
4.5 Stabilization at 4.5 W/m2 by 2100 without overshoot
650 (stabilized after 2100) Stabilization without overshoot
Medium-low
6.0 Stabilization at 6 W/m2 by 2100 without overshoot
850 (stabilized after 2100) Stabilization without overshoot
Medium-high
8.5 Rising pathway resulting in 8.5 W/m2 by 2100. Radiative forcing continues to rise beyond 2100
>1,370 in 2100 Rising Highest
Figure 2: Description of Representative Concentration Pathways (RCPs)
DOWNSCALINGThe coarse spatial scale of the GCMs makes them unable to provide more localized output that is relevant for the development of IDF curves. To make GCM results usable for the update of IDF curves, they must be downscaled both spatially and temporally. A statistical downscaling method was applied to downscale GCM results for the creation of new IDF curves.3,5
RAIN STATION INFORMATION The IDFCC Tool stores data associated with 700 Environment Canada operated rain stations from across Canada. Roughly 500 of these stations have 10 years of data – the minimum time series used by Environment Canada to develop IDF curves for a specific location. Users can also create and share their own rain station information.
A WEB-BASED INTENSITY-DURATION-FREQUENCY TOOL TO UPDATE AND ADAPT LOCAL EXTREME RAINFALL STATISTICS TO CLIMATE CHANGESlobodan P. Simonovic, Western University, Published July 2015
Canadian Water Network 3

SKILL SCORESkill scores are generated for each GCM in the IDFCC Tool when the user selects a specific rain station, by comparing observed historical data with GCM outputs for the same period and identifying GCMs that can accurately generate results that match historical observations for each location (see Figure 3). GCMs with skill scores closer to the value of zero are considered to be better able to project climate conditions for the locality in question.3
Figure 3: Examples of Skill Score
a) Where a GCM would receive a good skill score. b) Where a GCM was unable to accurately generate results that matched historical observations for a specific location, leading to a
poor skill score.
Figure 4: Sample IDFCC Tool output – An IDF curve updated using the ensemble option and RCP 8.5. Users can compare historical IDF curves to curves that incorporate GCM outputs. Users can also click different tabs to compare outputs for different RCPs and rainfall return periods.
0.1
0.08
0.06
0.04
0.02
0
0.25
0.2
0.15
0.1
0.05
0
(b)(a)
Prob
abili
ty
Prob
abili
ty
5 10 15 20 25 30 35 40 45 50
Temperature (celsius)
observed
modeled
10 15 20 25 30 35 40 45 50
Temperature (celsius)
A WEB-BASED INTENSITY-DURATION-FREQUENCY TOOL TO UPDATE AND ADAPT LOCAL EXTREME RAINFALL STATISTICS TO CLIMATE CHANGESlobodan P. Simonovic, Western University, Published July 2015
Canadian Water Network 4

REPORT AUTHORED BY SLOBODAN P. SIMONOVIC, WESTERN UNIVERSITY
RESEARCH TEAM:
SLOBODAN P. SIMONOVIC, Western UniversityROSHAN SRIVASTAV, Western University
ANDRE SHARDONG, Western University DAN SANDINK, Institute for Catastrophic Loss Reduction
PARTNERS
WESTERN UNIVERSITY INSTITUTE FOR CATASTROPHIC LOSS REDUCTION INSURANCE BUREAU OF CANADA
REFERENCES1 PECK, A., PRODANOVIC, P., AND SIMONOVIC, S. (2012). Rainfall intensity duration frequency curves under climate change: City of London, Ontario, Canada. Canadian Water Resources Journal, 37, 177-189.2 SCHARDONG, A., R. K. SRIVASTAV AND S. P. SIMONOVIC (2014). Computerized Tool for the Development of Intensity-Duration-Frequency Curves under a Changing Climate: User’s Manual v.1 Water Resources Research Report no. 088, Facility for Intelligent Decision Support, Department of Civil and Environmental Engineering, London, Ontario, Canada, 68 pages. ISBN: (print) 978-0-7714-3085-5; (online) 978-0-7714-3086-2.
3 SRIVASTAV, R.K., A. SCHARDONG AND S. P. SIMONOVIC (2014). Computerized Tool for the Development of Intensity-Duration-Frequency Curves under a Changing Climate: Technical Manual v.1 Water Resources Research Report no. 089, Facility for Intelligent Decision Support, Department of Civil and Environmental Engineering, London, Ontario, Canada, 62 pages. ISBN: (print) 978-0-7714-3087-9; (online) 978-0-7714-3088-6.
4 VAN VUUREN, D., EDMONDS, J., KAINUMA, M., RIAHI, K., THOMSON, A., HIBBARD, K., HURTT, G., KRAM, T., KREY, V., LAMARQUE, J.F., MASUI, T., MEINHAUSEN, M., NAKICENOVIC, N., SMITH, S. AND ROSE, S.K. 2011. The representative concentration pathways: An overview. Climatic Change 109: 5-31.5 SRIVASTAV, R.K., A. SCHARDONG AND S.P. SIMONOVIC, (2014). “Equidistance Quantile Matching Method for Updating IDF Curves Under Climate Change”, Water Resources Management: An International Journal, 28(9): 2539-2562.
TO CONTACT THE RESEARCHER, EMAIL [email protected]. VISIT OUR REPORT LIBRARY AT WWW.CWN-RCE.CA
WHAT ARE THE IMPLICATIONS FOR DECISION MAKERS?Increasingly frequent extreme weather events due to a changing climate have profound implications for the planning, design and maintenance of stormwater management infrastructure across Canada. The IDFCC Tool allows municipalities to more accurately forecast future rainfall events and make informed planning decisions that ensure stormwater infrastructure can handle increased stresses associated with climate change scenarios. This stormwater management infrastructure will help to mitigate the risk of urban flooding events, leading to more resilient and sustainable cities and long-term cost savings. Improved planning using this tool will help protect people, property and ecosystems from the negative impacts of extreme storms caused by climate change.
A WEB-BASED INTENSITY-DURATION-FREQUENCY TOOL TO UPDATE AND ADAPT LOCAL EXTREME RAINFALL STATISTICS TO CLIMATE CHANGESlobodan P. Simonovic, Western University, Published July 2015
Canadian Water Network 5


![Development of Rainfall Intensity Duration …Reference [6] shows work done on revision of the rainfall-intensity duration frequency curves for the city of Kumasi-Ghana using annual](https://static.documents.pub/doc/80x56/5ea59752b6cbc0631d5a9da0/development-of-rainfall-intensity-duration-reference-6-shows-work-done-on-revision.jpg)


